Research Methodology - Dr. Krishan K. Pandey
Research Methodology - Dr. Krishan K. Pandey Research Methodology - Dr. Krishan K. Pandey
Analysis of Variance and Co-variance 261 (iii) Find out the square of all the item values one by one and then take its total. Subtract the correction factor from this total and the result is the sum of squares for total variance. Symbolically, we can write: 2 2 bg T Total SS =∑Xij − i = 1, 2, 3, … n j = 1, 2, 3, … (iv) Obtain the square of each sample total (T ) j 2 and divide such square value of each sample by the number of items in the concerning sample and take the total of the result thus obtained. Subtract the correction factor from this total and the result is the sum of squares for variance between the samples. Symbolically, we can write: 2 di bg Tj SS between = ∑ − n j T n 2 j = 1, 2, 3, … where subscript j represents different samples or categories. (v) The sum of squares within the samples can be found out by subtracting the result of (iv) step from the result of (iii) step stated above and can be written as under: R S| T| 2 ij SS within = ∑X− T 2 j =∑Xij −∑ n 2 T U R 2 bg Tj T V| −S| di bg ∑ − n n j n W| T| di j 2 After doing all this, the table of ANOVA can be set up in the same way as explained earlier. CODING METHOD Coding method is furtherance of the short-cut method. This is based on an important property of F-ratio that its value does not change if all the n item values are either multiplied or divided by a common figure or if a common figure is either added or subtracted from each of the given n item values. Through this method big figures are reduced in magnitude by division or subtraction and computation work is simplified without any disturbance on the F-ratio. This method should be used specially when given figures are big or otherwise inconvenient. Once the given figures are converted with the help of some common figure, then all the steps of the short-cut method stated above can be adopted for obtaining and interpreting F-ratio. Illustration 1 Set up an analysis of variance table for the following per acre production data for three varieties of wheat, each grown on 4 plots and state if the variety differences are significant. 2 U V| W|
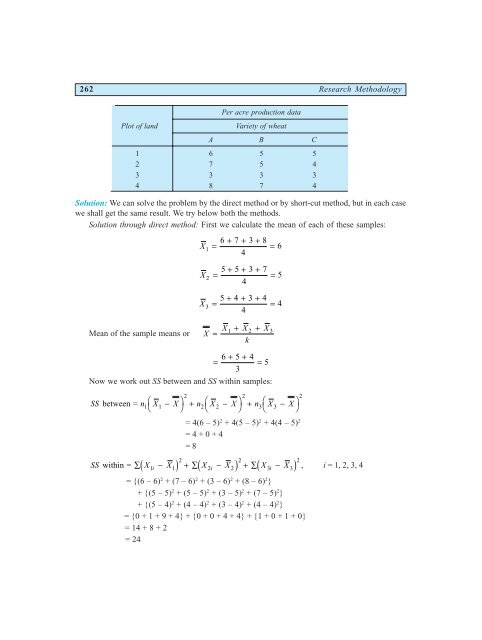
262 Research Methodology Per acre production data Plot of land Variety of wheat A B C 1 6 5 5 2 7 5 4 3 3 3 3 4 8 7 4 Solution: We can solve the problem by the direct method or by short-cut method, but in each case we shall get the same result. We try below both the methods. Solution through direct method: First we calculate the mean of each of these samples: X 1 X 2 X 3 Mean of the sample means or X 6 + 7 + 3 + 8 = = 6 4 5 + 5 + 3 + 7 = = 5 4 5 + 4 + 3 + 4 = = 4 4 X + X + X = k 1 2 3 6 + 5 + 4 = = 5 3 Now we work out SS between and SS within samples: F H I K 2 SS between = n1 X1 − X + n2 X 2 − X + n3 X 3 − X F H I K 2 F H I K = 4(6 – 5) 2 + 4(5 – 5) 2 + 4(4 – 5) 2 = 4 + 0 + 4 = 8 2 2 2 d 1i 1i d 2i 2i d 3i 3i , i = 1, 2, 3, 4 SS within = ∑ X − X + ∑ X − X + ∑ X − X = {(6 – 6) 2 + (7 – 6) 2 + (3 – 6) 2 + (8 – 6) 2 } + {(5 – 5) 2 + (5 – 5) 2 + (3 – 5) 2 + (7 – 5) 2 } + {(5 – 4) 2 + (4 – 4) 2 + (3 – 4) 2 + (4 – 4) 2 } = {0 + 1 + 9 + 4} + {0 + 0 + 4 + 4} + {1 + 0 + 1 + 0} = 14 + 8 + 2 = 24 2
- Page 228 and 229: Testing of Hypotheses I 211 (Since
- Page 230 and 231: Testing of Hypotheses I 213 Table 9
- Page 232 and 233: Testing of Hypotheses I 215 σ diff
- Page 234 and 235: Testing of Hypotheses I 217 Solutio
- Page 236 and 237: Testing of Hypotheses I 219 Hence t
- Page 238 and 239: Testing of Hypotheses I 221 of succ
- Page 240 and 241: Testing of Hypotheses I 223 Thus, q
- Page 242 and 243: Testing of Hypotheses I 225 the val
- Page 244 and 245: Testing of Hypotheses I 227 and 2 X
- Page 246 and 247: Testing of Hypotheses I 229 LIMITAT
- Page 248 and 249: Testing of Hypotheses I 231 20. Ten
- Page 250 and 251: Chi-square Test 233 10 Chi-Square T
- Page 252 and 253: Chi-square Test 235 S. No. 1 2 3 4
- Page 254 and 255: Chi-square Test 237 As a test of go
- Page 256 and 257: Chi-square Test 239 (i) First of al
- Page 258 and 259: Chi-square Test 241 The expected fr
- Page 260 and 261: Chi-square Test 243 Show that the s
- Page 262 and 263: Chi-square Test 245 Events or Expec
- Page 264 and 265: Chi-square Test 247 c h χ 2 N ⋅
- Page 266 and 267: Chi-square Test 249 from a number o
- Page 268 and 269: Chi-square Test 251 Questions 1. Wh
- Page 270 and 271: Chi-square Test 253 No. of boys 5 4
- Page 272 and 273: Chi-square Test 255 23. For the dat
- Page 274 and 275: Analysis of Variance and Co-varianc
- Page 276 and 277: Analysis of Variance and Co-varianc
- Page 280 and 281: Analysis of Variance and Co-varianc
- Page 282 and 283: Analysis of Variance and Co-varianc
- Page 284 and 285: Analysis of Variance and Co-varianc
- Page 286 and 287: Analysis of Variance and Co-varianc
- Page 288 and 289: Analysis of Variance and Co-varianc
- Page 290 and 291: Analysis of Variance and Co-varianc
- Page 292 and 293: Analysis of Variance and Co-varianc
- Page 294 and 295: Analysis of Variance and Co-varianc
- Page 296 and 297: Analysis of Variance and Co-varianc
- Page 298 and 299: Analysis of Variance and Co-varianc
- Page 300 and 301: Testing of Hypotheses-II 283 12 Tes
- Page 302 and 303: Testing of Hypotheses-II 285 Illust
- Page 304 and 305: Testing of Hypotheses-II 287 Table
- Page 306 and 307: Testing of Hypotheses-II 289 fact,
- Page 308 and 309: Testing of Hypotheses-II 291 The te
- Page 310 and 311: Testing of Hypotheses-II 293 Pair B
- Page 312 and 313: Testing of Hypotheses-II 295 Table
- Page 314 and 315: Testing of Hypotheses-II 297 Illust
- Page 316 and 317: Testing of Hypotheses-II 299 Soluti
- Page 318 and 319: Testing of Hypotheses-II 301 r = nu
- Page 320 and 321: Testing of Hypotheses-II 303 where
- Page 322 and 323: Testing of Hypotheses-II 305 Table
- Page 324 and 325: Testing of Hypotheses-II 307 We now
- Page 326 and 327: Testing of Hypotheses-II 309 (ii) I
262 <strong>Research</strong> <strong>Methodology</strong><br />
Per acre production data<br />
Plot of land Variety of wheat<br />
A B C<br />
1 6 5 5<br />
2 7 5 4<br />
3 3 3 3<br />
4 8 7 4<br />
Solution: We can solve the problem by the direct method or by short-cut method, but in each case<br />
we shall get the same result. We try below both the methods.<br />
Solution through direct method: First we calculate the mean of each of these samples:<br />
X 1<br />
X 2<br />
X 3<br />
Mean of the sample means or X<br />
6 + 7 + 3 + 8<br />
=<br />
= 6<br />
4<br />
5 + 5 + 3 + 7<br />
=<br />
= 5<br />
4<br />
5 + 4 + 3 + 4<br />
=<br />
= 4<br />
4<br />
X + X + X<br />
=<br />
k<br />
1 2 3<br />
6 + 5 + 4<br />
= = 5<br />
3<br />
Now we work out SS between and SS within samples:<br />
F<br />
H<br />
I<br />
K<br />
2<br />
SS between = n1 X1 − X + n2 X 2 − X + n3 X 3 − X<br />
F<br />
H<br />
I<br />
K<br />
2<br />
F<br />
H<br />
I<br />
K<br />
= 4(6 – 5) 2 + 4(5 – 5) 2 + 4(4 – 5) 2<br />
= 4 + 0 + 4<br />
= 8<br />
2<br />
2<br />
2<br />
d 1i 1i<br />
d 2i 2i<br />
d 3i 3i<br />
, i = 1, 2, 3, 4<br />
SS within = ∑ X − X + ∑ X − X + ∑ X − X<br />
= {(6 – 6) 2 + (7 – 6) 2 + (3 – 6) 2 + (8 – 6) 2 }<br />
+ {(5 – 5) 2 + (5 – 5) 2 + (3 – 5) 2 + (7 – 5) 2 }<br />
+ {(5 – 4) 2 + (4 – 4) 2 + (3 – 4) 2 + (4 – 4) 2 }<br />
= {0 + 1 + 9 + 4} + {0 + 0 + 4 + 4} + {1 + 0 + 1 + 0}<br />
= 14 + 8 + 2<br />
= 24<br />
2


