Differential Subcellular Distribution of Mitoxantrone in Relation to ...
Differential Subcellular Distribution of Mitoxantrone in Relation to ...
Differential Subcellular Distribution of Mitoxantrone in Relation to ...

Create successful ePaper yourself
Turn your PDF publications into a flip-book with our unique Google optimized e-Paper software.
0090-9556/07/3505-822–828$20.00<br />
DRUG METABOLISM AND DISPOSITION Vol. 35, No. 5<br />
Copyright © 2007 by The American Society for Pharmacology and Experimental Therapeutics 13474/3200116<br />
DMD 35:822–828, 2007 Pr<strong>in</strong>ted <strong>in</strong> U.S.A.<br />
<strong>Differential</strong> <strong>Subcellular</strong> <strong>Distribution</strong> <strong>of</strong> <strong>Mi<strong>to</strong>xantrone</strong> <strong>in</strong> <strong>Relation</strong> <strong>to</strong><br />
Chemosensitization <strong>in</strong> Two Human Breast Cancer Cell L<strong>in</strong>es<br />
Sophie Vibet, Kar<strong>in</strong>e Mahéo, Jacques Goré, Pierre Dubois, Philippe Bougnoux, and<br />
Igor Chourpa<br />
Institut National de la Santé et de la Recherche Médicale, E 0211, “Nutrition, Croissance et Cancer,” Tours, F-37000 France;<br />
Université François-Rabelais, Tours, F-37000 France; l’Institut Fédératif de Recherches 135 “Imagerie Fonctionnelle,” Tours,<br />
F-37000 France (S.V., K.M., J.G., P.B.); and Université François-Rabelais, Faculté de Pharmacie, “Focalisation magnétique<br />
d’agents anticancéreux,” Tours, F-37200 France; l’Institut Fédératif de Recherches 135 “Imagerie Fonctionnelle,” Tours,<br />
F-37200 France (P.D., I.C.)<br />
ABSTRACT:<br />
The present work <strong>in</strong>vestigates the relationship between cancer cell<br />
chemosensitivity and subcellular distribution, molecular <strong>in</strong>teraction,<br />
and metabolism <strong>of</strong> an anticancer drug. To get <strong>in</strong>sights <strong>in</strong><strong>to</strong><br />
this relationship, we <strong>to</strong>ok advantage <strong>of</strong> the differential sensitivity <strong>of</strong><br />
two breast cancer cell l<strong>in</strong>es, MDA-MB-231 and MCF-7, <strong>to</strong> anthracycl<strong>in</strong>es,<br />
along with the property <strong>of</strong> docosahexaenoic acid (DHA,<br />
22:6n-3), <strong>to</strong> differentially enhance their cy<strong>to</strong><strong>to</strong>xic activity. The fluorescent<br />
drug mi<strong>to</strong>xantrone (MTX) was used because <strong>of</strong> the possibility<br />
<strong>to</strong> study its subcellular accumulation by confocal spectral<br />
imag<strong>in</strong>g (CSI). The use <strong>of</strong> CSI allowed us <strong>to</strong> obta<strong>in</strong> semiquantitative<br />
maps <strong>of</strong> four <strong>in</strong>tracellular species: nuclear MTX bound <strong>to</strong> DNA,<br />
MTX oxidative metabolite <strong>in</strong> endoplasmic reticulum, cy<strong>to</strong>solic<br />
MTX, and f<strong>in</strong>ally, MTX <strong>in</strong> a low polarity environment characteristic<br />
<strong>of</strong> membranes. MDA-MB-231 cells were found <strong>to</strong> be more sensitive<br />
Experimental studies have shown that exogenous n-3 polyunsaturated<br />
fatty acids (PUFAs) may sensitize tumor cells <strong>to</strong> anticancer<br />
drugs, <strong>in</strong> cell culture or <strong>in</strong> animal tumors (Shao et al., 1995; Germa<strong>in</strong><br />
et al., 1999; Colas et al., 2004; Menendez et al., 2004, 2005). These<br />
effects <strong>of</strong> n-3 PUFAs have been found <strong>to</strong> be <strong>in</strong>hibited by the presence<br />
<strong>of</strong> antioxidants (Germa<strong>in</strong> et al., 1998; Colas et al., 2004, 2005;<br />
Menendez et al., 2005). Several mechanisms have been proposed <strong>to</strong><br />
account for the effect <strong>of</strong> PUFAs <strong>in</strong> <strong>in</strong>creas<strong>in</strong>g anticancer drug efficacy.<br />
These <strong>in</strong>clude an <strong>in</strong>crease <strong>in</strong> drug transport across the cell<br />
membrane (Burns and North, 1986; Spec<strong>to</strong>r and Burns, 1987), generation<br />
<strong>of</strong> free oxygen radicals, and lipid peroxidation (Das, 1999;<br />
This work was supported <strong>in</strong> part by grants from Ligue Nationale contre le<br />
Cancer (Comités d’Indre et Loire, Loir et Cher, Indre), by Institut National de la<br />
Santé et de la Recherche Médicale (Action Thématique Concertée “Nutrition”), by<br />
Conseil Régional (Région Centre), and by Cancéropôle Grand-Ouest. S.V. was the<br />
recipient <strong>of</strong> a fellowship from the M<strong>in</strong>istère de l’Enseignement Supérieur et de la<br />
Recherche.<br />
Article, publication date, and citation <strong>in</strong>formation can be found at<br />
http://dmd.aspetjournals.org.<br />
doi:10.1124/dmd.106.013474.<br />
Received Oc<strong>to</strong>ber 24, 2006; accepted February 9, 2007<br />
<strong>to</strong> MTX (IC 50 � 18 nM) than MCF-7 cells (IC 50 � 196 nM). Accord<strong>in</strong>g<br />
<strong>to</strong> fluorescence levels, the nuclear and cy<strong>to</strong>solic MTX content was<br />
higher <strong>in</strong> MCF-7 than <strong>in</strong> MDA-MB-231 cells, <strong>in</strong>dicat<strong>in</strong>g that mechanisms<br />
other than nuclear MTX accumulation account for chemosensitivity.<br />
In the cy<strong>to</strong>sol, the relative proportion <strong>of</strong> oxidized MTX<br />
was higher <strong>in</strong> MDA-MB-231 (60%) than <strong>in</strong> MCF-7 (7%) cells. DHA<br />
sensitized MDA-MB-231 (�4-fold) but not MCF-7 cells <strong>to</strong> MTX and<br />
<strong>in</strong>creased MTX accumulation by 1.5-fold <strong>in</strong> MDA-MB-231 cells<br />
only. The DHA-stimulated accumulation <strong>of</strong> MTX was attributed<br />
ma<strong>in</strong>ly <strong>to</strong> the oxidative metabolite. Antioxidant N-acetyl-L-cyste<strong>in</strong>e<br />
<strong>in</strong>hibited the DHA effect on both metabolite accumulation and cell<br />
sensitization <strong>to</strong> MTX. We conclude that drug metabolism and compartmentalization<br />
are associated with cell chemosensitization, and<br />
the related cy<strong>to</strong><strong>to</strong>xicity mechanisms may <strong>in</strong>volve oxidative stress.<br />
Rose and Connolly, 1999; S<strong>to</strong>ll, 2002). Among the PUFAs, docosahexaenoic<br />
acid (DHA, a long-cha<strong>in</strong> �-3 polyunsaturated fatty acid)<br />
was the most potent <strong>in</strong> enhanc<strong>in</strong>g the cy<strong>to</strong><strong>to</strong>xic effect <strong>of</strong> doxorubic<strong>in</strong><br />
<strong>in</strong> the MDA-MB-231 breast cancer cell l<strong>in</strong>e (Germa<strong>in</strong> et al., 1999).<br />
Recently, we found that the DHA-<strong>in</strong>duced <strong>in</strong>crease <strong>in</strong> doxorubic<strong>in</strong><br />
cy<strong>to</strong><strong>to</strong>xicity was cell l<strong>in</strong>e-dependent and was l<strong>in</strong>ked <strong>to</strong> oxidative stress<br />
(Mahéo et al., 2005).<br />
<strong>Mi<strong>to</strong>xantrone</strong> (MTX), an anthracenedione, has a spectrum <strong>of</strong> cl<strong>in</strong>ical<br />
activity similar <strong>to</strong> that <strong>of</strong> anthracycl<strong>in</strong>es. The ant<strong>in</strong>eoplastic activity<br />
<strong>of</strong> anthracycl<strong>in</strong>es and anthracenediones has been attributed<br />
ma<strong>in</strong>ly <strong>to</strong> <strong>to</strong>poisomerase II <strong>in</strong>hibition and <strong>to</strong> reactive oxygen species<br />
(ROS) production (Gewirtz, 1999). However, MTX has been shown<br />
<strong>to</strong> generate free radicals <strong>to</strong> a much lesser degree than doxorubic<strong>in</strong><br />
(Novak and Kharasch, 1985). Little is known about the effect <strong>of</strong> DHA<br />
on the chemosensitivity <strong>of</strong> breast cancer cell l<strong>in</strong>es <strong>to</strong> MTX. Supplementation<br />
<strong>of</strong> leukemia cells by DHA led <strong>to</strong> an <strong>in</strong>crease <strong>in</strong> MTX<br />
uptake (Burns et al., 1988a), but no change <strong>in</strong> the <strong>in</strong>tracellular distribution<br />
<strong>of</strong> the drug was detected <strong>in</strong> subcellular fractions obta<strong>in</strong>ed by<br />
differential centrifugation and sucrose gradient separation after cellular<br />
disruption (Burns et al., 1988b).<br />
ABBREVIATIONS: PUFA, polyunsaturated fatty acid; DHA, docosahexaenoic acid; MTX, mi<strong>to</strong>xantrone; ROS, reactive oxygen species; CSI,<br />
confocal spectral imag<strong>in</strong>g; DMEM, Dulbecco’s modified Eagle’s medium; NAC, N-acetyl-L-cyste<strong>in</strong>e; CM-H 2DCFDA, 5(and 6)-chloromethyl-2�,7�dichlorodihydr<strong>of</strong>luoresce<strong>in</strong><br />
diacetate; a.u., arbitrary units.<br />
822<br />
Downloaded from<br />
dmd.aspetjournals.org by guest on January 17, 2013
SUBCELLULAR DISTRIBUTION OF MTX AND CHEMOSENSITIZATION<br />
A direct way <strong>to</strong> study the <strong>in</strong>tracellular accumulation <strong>of</strong> fluorescent<br />
MTX (Bell, 1988) is use <strong>of</strong> flow cy<strong>to</strong>metry and fluorescence microscopy.<br />
High-resolution images <strong>of</strong> the <strong>in</strong>tracellular distribution <strong>of</strong> MTX<br />
<strong>in</strong> various cell l<strong>in</strong>es have been obta<strong>in</strong>ed with confocal fluorescence<br />
microscopy (Smith et al., 1992, 1997; Fox and Smith, 1995; Consoli<br />
et al., 1997; Kellner et al., 1997; Hazlehurst et al., 1999; Litman et al.,<br />
2000). Nevertheless, band-pass analysis <strong>of</strong> the fluorescence <strong>in</strong>tensity<br />
<strong>in</strong> confocal fluorescence microscopy limited the analysis <strong>to</strong> the overall<br />
drug detection and did not account for the fluorescence changes,<br />
depend<strong>in</strong>g on the drug environment/<strong>in</strong>teraction.<br />
An alternative <strong>to</strong> confocal fluorescence microscopy, the confocal<br />
spectral imag<strong>in</strong>g (CSI) technique is based on measurement, at different<br />
po<strong>in</strong>ts <strong>of</strong> a cell, <strong>of</strong> the fluorescence spectra, provid<strong>in</strong>g the ability<br />
<strong>to</strong> dist<strong>in</strong>guish different molecular states <strong>of</strong> <strong>in</strong>tracellular drugs (Sharonov<br />
et al., 1994). CSI has been recognized as a potent <strong>to</strong>ol for direct<br />
qualitative and quantitative study <strong>of</strong> MTX with<strong>in</strong> compartments <strong>of</strong><br />
liv<strong>in</strong>g K562 cells (Fe<strong>of</strong>anov et al., 1997a,b, 1999). The ma<strong>in</strong> limitation<br />
<strong>of</strong> these CSI studies was a low sensitivity related <strong>to</strong> the use <strong>of</strong> the<br />
green light (514.5 nm) for excitation <strong>of</strong> red-absorb<strong>in</strong>g MTX. As a<br />
consequence, the MTX concentrations used by Fe<strong>of</strong>anov et al. dur<strong>in</strong>g<br />
cell treatment had <strong>to</strong> be very high (5 <strong>to</strong> 10 �M).<br />
We have performed CSI scann<strong>in</strong>g <strong>of</strong> MTX-treated MCF-7 and<br />
MDA-MB-231 cells by us<strong>in</strong>g resonance excitation with a red laser<br />
l<strong>in</strong>e (632.8 nm). Compared with the CSI method published previously<br />
(Fe<strong>of</strong>anov et al., 1997a,b, 1999), <strong>in</strong>creased selectivity and sensitivity<br />
<strong>of</strong> <strong>in</strong>tracellular MTX detection were achieved. The present CSI study<br />
better respects cellular physiology, through a reduction <strong>of</strong> cell exposure<br />
<strong>to</strong> both drug concentration (0.5 �M) and laser radiation (30 �W<br />
and 0.02 s/spectrum). Four <strong>in</strong>tracellular species <strong>of</strong> MTX were thus<br />
identified and particular attention was paid <strong>to</strong> characterize the fluorescence<br />
<strong>of</strong> an oxidative metabolite <strong>of</strong> the drug.<br />
We compared the <strong>in</strong>tracellular distribution <strong>of</strong> the molecular species<br />
<strong>of</strong> MTX with<strong>in</strong> two breast cancer cell l<strong>in</strong>es, MCF-7 and MDA-MB-<br />
231, and exam<strong>in</strong>ed the <strong>in</strong>fluence <strong>of</strong> DHA supplementation on this<br />
distribution. Our aim was <strong>to</strong> take advantage <strong>of</strong> the differential sensitivity<br />
<strong>of</strong> these two breast cancer cell l<strong>in</strong>es <strong>to</strong> MTX and DHA <strong>to</strong> get<br />
<strong>in</strong>sights <strong>in</strong><strong>to</strong> the mechanisms responsible for chemosensitization.<br />
Materials and Methods<br />
Drugs and Chemicals. Unless otherwise stated, all chemicals were purchased<br />
from Sigma-Aldrich Chimie (Sa<strong>in</strong>t Quent<strong>in</strong>-Fallavier, France). Dilutions<br />
<strong>of</strong> mi<strong>to</strong>xantrone (Novantrone, 10 mg/5 ml; Sigma-Aldrich Chimie) were<br />
freshly prepared <strong>in</strong> Dulbecco’s modified Eagle’s medium (DMEM) conta<strong>in</strong><strong>in</strong>g<br />
5% heat-<strong>in</strong>activated fetal calf serum, 50 IU/ml penicill<strong>in</strong>, and 50 �g/ml<br />
strep<strong>to</strong>myc<strong>in</strong> (Cambrex, Gennevilliers, France). N-Acetyl-L-cyste<strong>in</strong>e (NAC)<br />
was used at 10 mM <strong>in</strong> DMEM medium. DHA (22:6n-3) methyl ester was used<br />
for this study. The fatty acid was dissolved <strong>in</strong> 99% ethanol and s<strong>to</strong>red as s<strong>to</strong>ck<br />
solution (150 mM) under nitrogen at �80°C. For all experiments, fatty acid<br />
was prepared freshly from s<strong>to</strong>ck solution and diluted with growth culture<br />
medium (f<strong>in</strong>al ethanol concentration: 0.02%). ER-Tracker Green, rhodam<strong>in</strong>e<br />
123, and 5(and 6)-chloromethyl-2�,7�-dichlorodihydr<strong>of</strong>luoresce<strong>in</strong> diacetate<br />
(CM-H2DCFDA) were purchased from Invitrogen (Cergy Pon<strong>to</strong>ise, France).<br />
Cell Culture. The human breast carc<strong>in</strong>oma cell l<strong>in</strong>es MDA-MB-231 and<br />
MCF-7 were obta<strong>in</strong>ed from American Type Culture Collection (LGC Promochem,<br />
Molsheim, France). Cell l<strong>in</strong>es were cultured <strong>in</strong> DMEM conta<strong>in</strong><strong>in</strong>g 5%<br />
heat-<strong>in</strong>activated fetal calf serum, 50 IU/ml penicill<strong>in</strong>, and 50 �g/ml strep<strong>to</strong>myc<strong>in</strong>.<br />
Cells were cultured at 37°C <strong>in</strong> a humidified <strong>in</strong>cuba<strong>to</strong>r with 5% CO2. The culture medium was changed each 24 h.<br />
Drug Cy<strong>to</strong><strong>to</strong>xicity. Cells were seeded <strong>in</strong> standard 96-well plates (7 � 10 3<br />
cells/well). One day after seed<strong>in</strong>g, the culture medium was changed and<br />
replaced by medium conta<strong>in</strong><strong>in</strong>g different concentration <strong>of</strong> MTX (10 �5 <strong>to</strong> 5<br />
�M) with or without DHA (30 �M) dur<strong>in</strong>g 7 days. Viability <strong>of</strong> cells were<br />
measured as a whole by the tetrazolium salt assay (Mosmann, 1983). Cells<br />
were <strong>in</strong>cubated at 37°C for 1 h with the tetrazolium salt (3-[4,5-dimethylthia-<br />
823<br />
zol-2-yl]-2,5-diphenyl tetrazolium bromide) and metabolically active cells<br />
reduced the dye <strong>to</strong> purple formazan. Formazan crystals were dissolved with<br />
dimethyl sulfoxide. Absorbance was measured at 570 nm us<strong>in</strong>g a multiwell<br />
plate reader (SpectraMax 190 model; Molecular Devices, Sunnyvale, CA).<br />
Dose-response curves were plotted as percentages <strong>of</strong> the control cell absorbance,<br />
which was obta<strong>in</strong>ed from control wells (without MTX treatment). These<br />
values were fitted <strong>to</strong> a sigmoidal dose-response model (GraphPad Prism;<br />
GraphPad S<strong>of</strong>tware Inc, San Diego, CA): Y � m<strong>in</strong> � (max � m<strong>in</strong>)/(1 �<br />
10 log IC50 � X ), where Y is viability (as a percentage), X is log(MTX concentration,<br />
micromolar), m<strong>in</strong> is m<strong>in</strong>imum viability, max is maximum viability, and<br />
IC 50 is the concentration <strong>of</strong> MTX produc<strong>in</strong>g a 50% decrease <strong>of</strong> viability.<br />
Instrumental Setup for CSI. Fluorescence measurements were carried out<br />
us<strong>in</strong>g a LabRam confocal microspectrometer (Horiba Job<strong>in</strong> Yvon, Villeneuve<br />
d’Ascq, France) equipped with a low dispersion grat<strong>in</strong>g (300 grooves/mm) and<br />
with an au<strong>to</strong>mated X-Y-Z scann<strong>in</strong>g stage. A color camera (Panasonic WV-<br />
CP454E) <strong>to</strong>gether with a VITEC video card provided a digitalized TV image<br />
<strong>of</strong> a sample illum<strong>in</strong>ated with a white light source (phase-contrast optical view).<br />
MTX fluorescence was excited with a 632.8 nm l<strong>in</strong>e <strong>of</strong> an <strong>in</strong>ternal,<br />
air-cooled, helium-neon laser. The power on the samples was �30 �W, the<br />
acquisition time was 0.02 or 0.05 s/spectrum. Particular attention was paid<br />
<strong>to</strong> normaliz<strong>in</strong>g the measured signal on acquisition time as well as on<br />
<strong>in</strong>strumental response, us<strong>in</strong>g a Si plate and a fluoresce<strong>in</strong> solution as the<br />
<strong>in</strong>tensity standard. Sample irradiation and collection <strong>of</strong> fluorescence were<br />
performed through a 100� microscope objective (numerical aperture 0.90;<br />
Olympus, Tokyo, Japan). The confocal hole aperture was adjusted <strong>to</strong> 100<br />
�m <strong>to</strong> obta<strong>in</strong> �0.8 �m lateral and �3.5 �m axial resolution. The spectral<br />
resolution was 1 nm.<br />
Perform<strong>in</strong>g CSI Mapp<strong>in</strong>g on Liv<strong>in</strong>g Cells. The breast cancer cells (treated<br />
with or without DHA dur<strong>in</strong>g 7 days) were <strong>in</strong>cubated with MTX (0.5 �M) for<br />
1 h at 37°C and 5% CO 2. When NAC (10 mM) was used, a pre<strong>in</strong>cubation (15<br />
m<strong>in</strong>) <strong>of</strong> the cells with NAC was performed before the <strong>in</strong>cubation with MTX.<br />
Before CSI analysis, the medium conta<strong>in</strong><strong>in</strong>g drug was removed, and the cells<br />
were resuspended <strong>in</strong> fresh medium after two r<strong>in</strong>ses with fresh medium (pH<br />
7.4). A drop <strong>of</strong> this preparation was put on a microscope glass slide and<br />
covered with a th<strong>in</strong> coverslide. Isolated cells, selected for their apparently<br />
<strong>in</strong>tact morphology, were analyzed <strong>in</strong>dividually.<br />
To study the subcellular repartition <strong>of</strong> MTX, we used the two-dimensional<br />
mapp<strong>in</strong>g <strong>of</strong> an optical section at half-thickness <strong>of</strong> the cell. Cells were scanned<br />
with<strong>in</strong> the x-y plane with a fixed step <strong>of</strong> 0.8 �m that provided maps conta<strong>in</strong><strong>in</strong>g<br />
typically �900 spectra (30 � 30 po<strong>in</strong>ts). The acquisition time was less than 2<br />
<strong>to</strong> 3 m<strong>in</strong> per entire cell map. Both acquisition and treatment <strong>of</strong> multispectral<br />
maps were performed with LabSpec s<strong>of</strong>tware.<br />
Generat<strong>in</strong>g Chemical Maps from Spectral Sets. <strong>Subcellular</strong> drug repartition<br />
was studied via analysis <strong>of</strong> both <strong>in</strong>tensity and shape <strong>of</strong> fluorescence<br />
spectra with<strong>in</strong> CSI maps, as described previously (Sharonov et al., 1994;<br />
Fe<strong>of</strong>anov et al., 1997b). Briefly, each experimental spectrum recorded <strong>in</strong> a<br />
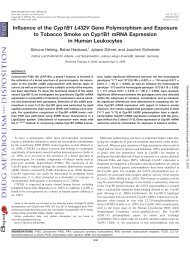
confocal mode from a cell was fitted <strong>to</strong> a sum <strong>of</strong> four reference spectra <strong>of</strong><br />
MTX taken with appropriate coefficients: F Total (�) � C DNAF DNA (�) �<br />
C cytF cyt (�) � C metF met (�) � C lpF lp (�), where F DNA,F cyt,F met, and F lp are the<br />
fluorescence spectra <strong>of</strong>, respectively, the MTX-DNA complex, the cy<strong>to</strong>solic<br />
complex <strong>of</strong> native MTX, the cy<strong>to</strong>solic complex <strong>of</strong> metabolized MTX, and<br />
MTX <strong>in</strong> a low polarity environment, referred <strong>to</strong> a unitary <strong>in</strong>tensity (Fig. 1).<br />
Each <strong>of</strong> these MTX species has a characteristic fluorescence spectral shape<br />
established by <strong>in</strong> vitro model<strong>in</strong>g. The values <strong>of</strong> C DNA, C cyt, C lp, and C met are<br />
spectral contribution fac<strong>to</strong>rs <strong>of</strong> the respective drug species. These fac<strong>to</strong>rs could<br />
be converted <strong>in</strong><strong>to</strong> concentrations, once the fluorescence yield <strong>of</strong> each <strong>of</strong> the<br />
above fluorophores will be known.<br />
The fitt<strong>in</strong>g results were optimized with the least-squares method. The fitt<strong>in</strong>g<br />
error was �5% (typically 2–3%). The cellular aut<strong>of</strong>luorescence was completely<br />
neglected, because <strong>of</strong> the absence <strong>of</strong> any significant fluorescence <strong>of</strong> the<br />
untreated cells under the conditions used.<br />
The spectral contribution fac<strong>to</strong>rs <strong>of</strong> each MTX species were used <strong>to</strong> generate<br />
the respective two-dimensional distribution map (thereafter referred <strong>to</strong> as<br />
a chemical map) over the cell. In this manner, four model-specific chemical<br />
maps were generated for each cell.<br />
In view <strong>of</strong> significant cell-<strong>to</strong>-cell variations <strong>of</strong> the fluorescence <strong>in</strong>tensity,<br />
each chemical map was brought <strong>to</strong> a relative <strong>in</strong>tensity scale by normaliz<strong>in</strong>g all<br />
the spectra on the <strong>in</strong>tensity <strong>of</strong> the most <strong>in</strong>tense spectrum (typically that from<br />
Downloaded from<br />
dmd.aspetjournals.org by guest on January 17, 2013
824 VIBET ET AL.<br />
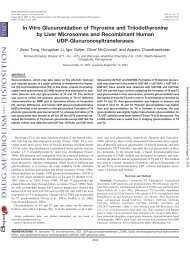
FIG. 1. Reference fluorescence spectra <strong>of</strong> <strong>in</strong>tracellular MTX (chemical formula <strong>in</strong><br />
the <strong>in</strong>set): a, MTX-DNA complex; b, cy<strong>to</strong>solic complex <strong>of</strong> native MTX; c, cy<strong>to</strong>solic<br />
complex <strong>of</strong> metabolized MTX; and d, MTX <strong>in</strong> a low polarity environment.<br />
nucleoli). Thus, the chemical maps reflected qualitatively the repartition <strong>of</strong> the<br />
drug with<strong>in</strong> subcellular compartments.<br />
Quantification <strong>of</strong> MTX Cellular Accumulation and <strong>Distribution</strong>. Two<br />
k<strong>in</strong>ds <strong>of</strong> quantitative <strong>in</strong>formation were extracted from analysis <strong>of</strong> each mapaverage<br />
spectrum: First, fluorescence <strong>in</strong>tensity (expressed <strong>in</strong> arbitrary units,<br />
thereafter called fluorescence level) <strong>in</strong> the spectral region between 645 and 935<br />
nm was considered <strong>to</strong> be representative <strong>of</strong> overall <strong>in</strong>tracellular MTX accumulation,<br />
and second, the average spectrum was fitted <strong>to</strong> a sum <strong>of</strong> four reference<br />
MTX spectra described above. The contribution fac<strong>to</strong>rs obta<strong>in</strong>ed were <strong>in</strong>terpreted<br />
as cell-average relative contents (fluorescence levels) <strong>of</strong> the specific<br />
drug species. The results were averaged over 16 <strong>to</strong> 23 cells for each k<strong>in</strong>d <strong>of</strong><br />
treatment.<br />
Colocalization <strong>of</strong> MTX Oxidative Metabolite with Cellular Organelles.<br />
We labeled endoplasmic reticulum and mi<strong>to</strong>chondria us<strong>in</strong>g two organellespecific<br />
fluorophores, ER-Tracker Green and rhodam<strong>in</strong>e 123, respectively.<br />
MDA-MB-231 cells, treated for 1 h with 0.5 �M MTX and washed <strong>in</strong><br />
phosphate-buffered sal<strong>in</strong>e, were <strong>in</strong>cubated for 20 m<strong>in</strong> with 0.5 �M ER-Tracker<br />
Green or 1 �M rhodam<strong>in</strong>e 123. Colocalization studies were performed us<strong>in</strong>g<br />
a 488 nm l<strong>in</strong>e <strong>of</strong> an Ar � laser. The estimated laser power at the sample was<br />
�20 �W. The fluorescence spectra were recorded with an acquisition time <strong>of</strong><br />
1 s/spectrum. The CSI spectral maps were generated as described above.<br />
Measurement <strong>of</strong> ROS. Cells were cultured <strong>in</strong> 9 cm 2 multiwell plates and<br />
treated with MTX at IC 50 dur<strong>in</strong>g 7 days. Cells were washed twice with<br />
Hanks-Hepes solution (pH 7.3, 37°C) and then <strong>in</strong>cubated dur<strong>in</strong>g 30 m<strong>in</strong> with<br />
10 �M CM-H 2DCFDA <strong>in</strong> the dark at 37°C. CM-H 2DCFDA is an <strong>in</strong>dica<strong>to</strong>r for<br />
reactive oxygen species (hydrogen peroxide and hydroxy and peroxyl radicals).<br />
Then, cells were washed twice with cold Hanks-Hepes (pH 7.3, 4°C)<br />
solution and sonicated <strong>in</strong> 1 ml <strong>of</strong> distilled water (4°C). Whole cells lysates<br />
were centrifuged (10,000g for 5 m<strong>in</strong> at 4°C) and fluorescence <strong>in</strong>tensities were<br />
measured on supernatants at 522 nm (excitation wavelength: 480 nm) with a<br />
Hitachi F-2500 spectr<strong>of</strong>luorimeter. For each supernatant, prote<strong>in</strong> concentration<br />
was measured with BCA kit (Uptima; Interchim, Montluçon, France), and the<br />
normalized fluorescence (arbitrary units <strong>of</strong> fluorescence per milligram <strong>of</strong><br />
prote<strong>in</strong>) was calculated.<br />
Statistics. Statistical analysis was carried out us<strong>in</strong>g Student’s unpaired t<br />
test, one-way analysis <strong>of</strong> variance, and Newman-Keuls multiple comparison<br />
tests (GraphPad Prism); p � 0.05 was regarded as significant.<br />
Results<br />
MTX Cy<strong>to</strong><strong>to</strong>xicity. Breast cancer cells were cultured for 7 days <strong>in</strong><br />
a medium supplemented with MTX at concentrations rang<strong>in</strong>g from<br />
10 �5 <strong>to</strong> 5 �M, without (control) or with 30 �M DHA. DHA at 30 �M<br />
was not <strong>to</strong>xic (trypan blue exclusion, data not shown).<br />
In control conditions (absence <strong>of</strong> DHA), IC50 concentrations <strong>of</strong><br />
MTX were different <strong>in</strong> the two cell l<strong>in</strong>es (18 � 6 nM for MDA-MB-<br />
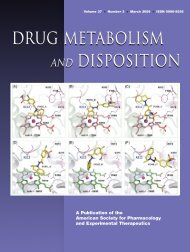
231 and 196 � 70 nM for MCF-7). Figure 2 shows the correspond<strong>in</strong>g<br />
dose-response curves. Supplementation <strong>of</strong> MCF-7 cells with DHA did<br />
FIG. 2. Dose-response curve <strong>of</strong> MTX <strong>in</strong> the absence (f) or <strong>in</strong> the presence (Œ) <strong>of</strong><br />
30 �M DHA. Breast cancer cell l<strong>in</strong>es (MDA-MB-231 and MCF-7) were grown for<br />
7 days with a specified concentration <strong>of</strong> MTX (<strong>in</strong> a micromolar concentration)<br />
without or with 30 �M DHA. Cell viability was measured by the 3-(4,5-dimethylthiazol-2-yl)-2,5-diphenyltetrazolium<br />
method (see Materials and Methods). Shown<br />
are fitted curves and means � S.E. from six separate experiments <strong>in</strong> which triplicate<br />
measurements were made. Absent error bars <strong>in</strong>dicate that errors fell with<strong>in</strong> symbol.<br />
not modify MTX cy<strong>to</strong><strong>to</strong>xicity significantly: IC 50 � 128 � 74 nM<br />
versus 196 � 70 nM <strong>in</strong> supplemented versus no supplemented cells,<br />
respectively (p � 0.05). In contrast, <strong>in</strong> MDA-MB-231 cells, DHA<br />
supplementation led <strong>to</strong> an <strong>in</strong>crease <strong>in</strong> MTX <strong>to</strong>xicity at concentrations<br />
between 10 �1 and 10 �3 �M: IC 50 shifted from 18 � 6<strong>to</strong>4� 1 nM.<br />
This 4.5-fold enhancement <strong>of</strong> MTX cy<strong>to</strong><strong>to</strong>xicity by DHA was statistically<br />
significant (p � 0.001). Cell viability experiments were also<br />
performed <strong>in</strong> the presence <strong>of</strong> the antioxidant NAC. Control or DHAsupplemented<br />
MDA-MB-231 cells were treated with MTX at several<br />
concentrations rang<strong>in</strong>g from 10 <strong>to</strong> 40 nM <strong>in</strong> the presence <strong>of</strong> NAC.<br />
Addition <strong>of</strong> NAC (10 �M for 7 days) suppressed the enhanc<strong>in</strong>g effect<br />
<strong>of</strong> DHA on cell sensitivity <strong>to</strong> MTX, as cell viability rema<strong>in</strong>ed unchanged<br />
between control and DHA-supplemented cells upon treatment<br />
with MTX.<br />
Overall Accumulation and Chemicals Maps <strong>of</strong> MTX <strong>Subcellular</strong><br />
<strong>Distribution</strong>. The results on overall drug accumulation <strong>in</strong> the two<br />
cell l<strong>in</strong>es are presented <strong>in</strong> Table 1. In control conditions, the overall<br />
drug fluorescence level <strong>in</strong> MDA-MB-231 cells was 2.5-fold lower<br />
than that <strong>in</strong> MCF-7 cells. DHA supplementation led <strong>to</strong> a 1.5-fold<br />
<strong>in</strong>crease <strong>in</strong> overall MTX accumulation (p � 0.001) <strong>in</strong> MDA-MB-231<br />
cells, whereas no significant change was observed <strong>in</strong> MCF-7 cells.<br />
At a s<strong>in</strong>gle-cell level, the most <strong>in</strong>tense fluorescence was found <strong>in</strong><br />
nucleoli (<strong>in</strong>tensity <strong>of</strong> 100%) and <strong>in</strong> nucleus (<strong>in</strong>tensity <strong>of</strong> 50–70%).<br />
Downloaded from<br />
dmd.aspetjournals.org by guest on January 17, 2013
TABLE 1<br />
Fluorescence levels <strong>of</strong> <strong>in</strong>tracellular MTX <strong>in</strong> the two breast cancer cell l<strong>in</strong>es<br />
Cells were treated or not with 30 �M DHA dur<strong>in</strong>g 7 days, then <strong>in</strong>cubated dur<strong>in</strong>g 1 h with<br />
MTX (0.5 �M). Data are means � S.D. <strong>of</strong> 16 <strong>to</strong> 23 values.<br />
MCF-7 MDA-MB-231<br />
a.u.<br />
Control 38,974 � 6276 15,827 � 1746<br />
DHA 38,833 � 4418* 23,567 � 3627**<br />
Unpaired t test (not significant: *P � 0.05; significant: **P � 0.001).<br />
SUBCELLULAR DISTRIBUTION OF MTX AND CHEMOSENSITIZATION<br />
The <strong>in</strong>tensity observed <strong>in</strong> cy<strong>to</strong>sol was between 20 and 40%. It was<br />
about 10% <strong>in</strong> the cell periphery (membrane).<br />
Because <strong>of</strong> the possibility <strong>of</strong> spectral analysis <strong>of</strong> <strong>in</strong>tracellular fluorescence<br />
<strong>in</strong>herent <strong>in</strong> the CSI approach, four specific maps characteristic<br />
<strong>of</strong> molecular environment/species <strong>of</strong> MTX were generated <strong>in</strong><br />
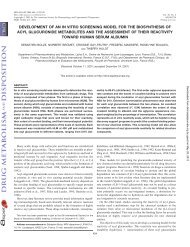
each cell (Fig. 3A). The maps <strong>of</strong> MTX-DNA fluorescence had nuclear<br />
localization. DHA treatment did not <strong>in</strong>duce any change <strong>in</strong> these maps.<br />
Fluorescence <strong>of</strong> the MTX metabolite typically had a strong per<strong>in</strong>uclear<br />
spot and a weaker diffusion with<strong>in</strong> the cy<strong>to</strong>sol. The metabolite<br />
maps were larger and more <strong>in</strong>tense <strong>in</strong> MDA-MB-231 than <strong>in</strong> MCF-7<br />
cells. DHA supplementation resulted <strong>in</strong> a strong <strong>in</strong>crease <strong>of</strong> the<br />
metabolite fluorescence <strong>in</strong> both cell l<strong>in</strong>es. In contrast, this <strong>in</strong>crease<br />
was <strong>in</strong>hibited <strong>in</strong> the cells treated with NAC antioxidant. The cy<strong>to</strong>solic<br />
complex <strong>of</strong> native MTX was distributed all over the cy<strong>to</strong>sol. This<br />
825<br />
sta<strong>in</strong><strong>in</strong>g was different <strong>in</strong> the two cell l<strong>in</strong>es: homogeneous <strong>in</strong> MCF-7<br />
cells and with multiple spot distribution <strong>in</strong> MDA-MB-231 cells.<br />
Supplementation with DHA led <strong>to</strong> a decrease <strong>in</strong> the level <strong>of</strong> the native<br />
MTX cy<strong>to</strong>solic complex, particularly <strong>in</strong> MDA-MB-231 cells. Maps <strong>of</strong><br />
MTX <strong>in</strong> a low polarity environment fitted cellular con<strong>to</strong>urs (plasmic<br />
membranes) as well as several per<strong>in</strong>uclear spots (<strong>in</strong>tracellular membranes).<br />
After DHA supplementation, this sta<strong>in</strong><strong>in</strong>g was reduced,<br />
ma<strong>in</strong>ly <strong>in</strong> <strong>in</strong>tracellular membranes.<br />
Colocalization <strong>of</strong> Specific Species <strong>of</strong> MTX. Deconvolutions <strong>of</strong><br />
spectra from nuclear region corresponded <strong>to</strong> a 100% contribution<br />
<strong>of</strong> characteristic fluorescence assigned <strong>to</strong> MTX-DNA complexes.<br />
In contrast <strong>to</strong> the nuclear fluorescence, the spectra from other<br />
cellular regions were decomposed <strong>in</strong><strong>to</strong> variable contributions <strong>of</strong><br />
two or three reference spectra, thus <strong>in</strong>dicat<strong>in</strong>g colocalization <strong>of</strong><br />
correspond<strong>in</strong>g molecular species <strong>of</strong> MTX (Fig. 3B). Spectra from<br />
the <strong>in</strong>tense per<strong>in</strong>uclear regions were particularly mixed, as they<br />
corresponded <strong>to</strong> the spectrum <strong>of</strong> the cy<strong>to</strong>solic complex <strong>of</strong> native<br />
MTX enriched with the fluorescence <strong>of</strong> the complex <strong>of</strong> the metabolized<br />
MTX and complemented the spectrum characteristic <strong>of</strong><br />
MTX <strong>in</strong> a low polarity environment (<strong>in</strong>tracellular membranes).<br />
This f<strong>in</strong>d<strong>in</strong>g is illustrated by the certa<strong>in</strong> similarity <strong>of</strong> the respective<br />
maps seen <strong>in</strong> Fig. 3A, with all hav<strong>in</strong>g bright spots <strong>in</strong> the per<strong>in</strong>uclear<br />
regions. The colocalization was confirmed after superposition<br />
<strong>of</strong> the respective maps encoded <strong>in</strong> pseudo-colors (Fig. 3B): the<br />
FIG. 3. Typical maps <strong>of</strong> relative subcellular<br />
distribution <strong>of</strong> MTX <strong>in</strong> MCF-7 (left panel)<br />
or MDA-MB-231 (right panel). Cells were<br />
supplemented or not with 30 �M DHA for<br />
7 days and then were <strong>in</strong>cubated with 0.5<br />
�M MTX for 1 h. A, subcellular distribution<br />
<strong>of</strong> MTX species. The relative <strong>in</strong>tensity<br />
scale <strong>of</strong> the maps (heat <strong>in</strong>tensity color code)<br />
was obta<strong>in</strong>ed by normaliz<strong>in</strong>g on the most<br />
<strong>in</strong>tense spectrum <strong>in</strong> each cell. B, superposition<br />
<strong>of</strong> the maps us<strong>in</strong>g an extended <strong>in</strong>tensity<br />
scale for colocalization and encoded with<br />
pseudo colors.<br />
Downloaded from<br />
dmd.aspetjournals.org by guest on January 17, 2013
826 VIBET ET AL.<br />
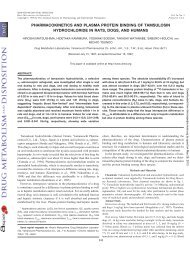
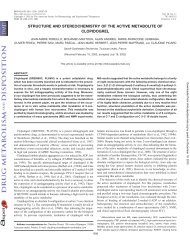
FIG. 4. Colocalization <strong>of</strong> the oxidative MTX metabolite with endoplasmic reticulum<br />
with<strong>in</strong> MDA-MB-231 cells (n � 10). A, the fluorescence spectrum from cy<strong>to</strong>sol (black<br />
curve) conta<strong>in</strong>s the green emission <strong>of</strong> ER-Tracker Green <strong>to</strong>gether with the red emission<br />
<strong>of</strong> the MTX metabolite. B <strong>to</strong> D, video capture <strong>of</strong> a cell (B) merged with fluorescence <strong>of</strong><br />
ER-Tracker Green (C) and <strong>of</strong> MTX oxidative metabolite (D).<br />
white per<strong>in</strong>uclear spots correspond <strong>to</strong> a mixture <strong>of</strong> three colors,<br />
i.e., <strong>of</strong> three species, <strong>in</strong>dicat<strong>in</strong>g that the cy<strong>to</strong>solic complex <strong>of</strong><br />
metabolized MTX is located <strong>in</strong> per<strong>in</strong>uclear regions enriched with<br />
membranes.<br />
To check a possible assignment <strong>of</strong> these regions <strong>to</strong> cellular organelles<br />
such as mi<strong>to</strong>chondria or endoplasmic reticulum, we sta<strong>in</strong>ed<br />
the MDA-MB-231 cells with rhodam<strong>in</strong>e 123 and ER-Tracker Green,<br />
respectively. The excitation wavelength <strong>of</strong> 488 nm was used, because<br />
it was optimal for ER-Tracker Green and rhodam<strong>in</strong>e 123 (emission<br />
maxima at 517 and 540 nm, respectively) and was still suitable <strong>to</strong><br />
detect the MTX metabolite. Accord<strong>in</strong>g <strong>to</strong> the CSI data, the metabolite<br />
fluorescence was colocalized with the fluorescence <strong>of</strong> ER-Tracker<br />
Green (Fig. 4) but not with the fluorescence <strong>of</strong> rhodam<strong>in</strong>e 123 (data<br />
not shown).<br />
Cell-Average Intracellular Content <strong>of</strong> the Specific Species <strong>of</strong><br />
MTX. Average fluorescence levels correspond<strong>in</strong>g <strong>to</strong> the four specific<br />
species <strong>of</strong> MTX are shown <strong>in</strong> Fig. 5. This figure provides quantitative<br />
evidence that the subcellular repartition <strong>of</strong> MTX is cell l<strong>in</strong>e-dependent.<br />
The relative fraction <strong>of</strong> MTX bound <strong>to</strong> DNA was similar <strong>in</strong> both<br />
cell l<strong>in</strong>es (�50% <strong>of</strong> the overall <strong>in</strong>tracellular drug fluorescence). Quantitatively,<br />
the maximum fluorescence level (MTX-DNA) was nearly<br />
2-fold higher <strong>in</strong> MCF-7 than <strong>in</strong> MDA-MB-231 cells. In both cell l<strong>in</strong>es,<br />
DHA supplementation did not significantly change the relative contribution<br />
<strong>of</strong> the MTX-DNA complex <strong>to</strong> the <strong>in</strong>tracellular drug fluorescence.<br />
The MTX level <strong>in</strong> cy<strong>to</strong>sol (native plus metabolized MTX) was<br />
higher <strong>in</strong> MCF-7 cells (18,890 � 889 a.u.) than <strong>in</strong> MDA-MB-231<br />
cells (4452 � 603 a.u.). In contrast, the proportion <strong>of</strong> the MTXmetabolite<br />
<strong>in</strong> cy<strong>to</strong>sol was much higher <strong>in</strong> MDA-MB-231 cells (60.4 �<br />
6.2%) than <strong>in</strong> MCF-7 cells (7.7 � 1.9%). After DHA supplementation,<br />
the cy<strong>to</strong>solic content <strong>of</strong> MTX <strong>in</strong>creased (<strong>to</strong> 10,157 � 768 a.u.)<br />
<strong>in</strong> MDA-MB-231 but not <strong>in</strong> MCF-7 cells. The proportion <strong>of</strong> the<br />
metabolite <strong>in</strong>creased up <strong>to</strong> 94.2 � 2.6% <strong>in</strong> MDA-MB-231 cells and <strong>to</strong><br />
FIG. 5. Average fluorescence levels <strong>in</strong> arbitrary units <strong>of</strong> the four species <strong>of</strong> MTX,<br />
<strong>in</strong> the two breast cancer cell l<strong>in</strong>es supplemented for 7 days without (�) or with 30<br />
�M DHA (u). o and p, MTX metabolite. Data are means � S.D. <strong>of</strong> 16 <strong>to</strong> 23 cells.<br />
31.6 � 2.3% <strong>in</strong> MCF-7 cells. When cells were pretreated for 15 m<strong>in</strong><br />
with the antioxidant NAC, the enhancement <strong>of</strong> the metabolized MTX<br />
fraction by DHA was no longer observed. This <strong>in</strong>dicates that the<br />
metabolite may be related <strong>to</strong> oxidative metabolism <strong>of</strong> the drug.<br />
The fluorescence level <strong>of</strong> MTX <strong>in</strong> a low polarity environment<br />
(membranes) was similar <strong>in</strong> both cell l<strong>in</strong>es (�2600 a.u.). DHA supplementation<br />
had no significant effect on the fluorescence levels<br />
observed <strong>in</strong> these compartments.<br />
ROS Levels. The ROS levels were similar <strong>in</strong> both cell l<strong>in</strong>es<br />
(1689 � 117 a.u./mg <strong>of</strong> prote<strong>in</strong> <strong>in</strong> MDA-MB-231 cells and 1663 �<br />
95 a.u./mg <strong>of</strong> prote<strong>in</strong> <strong>in</strong> MCF-7 cells). These levels were not modified<br />
either by DHA supplementation or MTX treatment. An 1.3-fold<br />
<strong>in</strong>crease (p � 0,001) <strong>in</strong> the ROS level was observed with MTX<br />
treatment <strong>in</strong> DHA-supplemented MDA-MB-231 but not <strong>in</strong> MCF-7<br />
cells.<br />
Discussion<br />
The above results demonstrate for the first time an association<br />
between the chemosensitization <strong>of</strong> a breast cancer cell l<strong>in</strong>e and the<br />
cellular distribution and metabolism <strong>of</strong> an anticancer agent. To<br />
achieve this conclusion, we used an experimental system <strong>in</strong>volv<strong>in</strong>g<br />
two human breast cancer cell l<strong>in</strong>es with a differential sensitivity <strong>to</strong><br />
several drugs (Mahéo et al., 2005). Cy<strong>to</strong><strong>to</strong>xicity data <strong>in</strong>dicated that,<br />
under control conditions, the IC50 was about 10-fold higher and the<br />
overall drug <strong>in</strong>tracellular concentration was 2.5-fold higher <strong>in</strong> MCF-7<br />
than <strong>in</strong> MDA-MB-231 cells, show<strong>in</strong>g that the MCF-7 cell l<strong>in</strong>e is less<br />
Downloaded from<br />
dmd.aspetjournals.org by guest on January 17, 2013
SUBCELLULAR DISTRIBUTION OF MTX AND CHEMOSENSITIZATION<br />
sensitive <strong>to</strong> MTX that the MDA-MB-231 cell l<strong>in</strong>e. We <strong>to</strong>ok advantage<br />
<strong>of</strong> the differential chemosensitivity <strong>of</strong> the two breast cancer cell l<strong>in</strong>es<br />
<strong>to</strong> exam<strong>in</strong>e the contribution <strong>of</strong> drug subcellular distribution <strong>to</strong> this<br />
phenomenon. Confocal spectral imag<strong>in</strong>g provided the opportunity <strong>to</strong><br />
address the subcellular distribution <strong>of</strong> the anticancer drug accord<strong>in</strong>g <strong>to</strong><br />
its molecular <strong>in</strong>teraction with<strong>in</strong> cellular compartments.<br />
In agreement with the ma<strong>in</strong> mechanism <strong>of</strong> action <strong>of</strong> MTX, i.e.,<br />
<strong>in</strong>hibition <strong>of</strong> the nuclear enzyme <strong>to</strong>poisomerase II, nuclear drug sta<strong>in</strong><strong>in</strong>g<br />
(MTX-DNA fraction) was dom<strong>in</strong>ant <strong>in</strong> both cell l<strong>in</strong>es. However,<br />
the higher level <strong>of</strong> MTX-DNA complexes <strong>in</strong> the less-sensitive MCF-7<br />
cell l<strong>in</strong>e suggests that cell sensitivity <strong>to</strong> MTX is not a direct consequence<br />
<strong>of</strong> the nuclear accumulation <strong>of</strong> the drug. Indeed, the repartition<br />
and metabolism <strong>of</strong> the drug <strong>in</strong> the cy<strong>to</strong>solic compartment were significantly<br />
different between the two cell l<strong>in</strong>es. The sta<strong>in</strong><strong>in</strong>g <strong>of</strong> the<br />
cy<strong>to</strong>solic complex <strong>of</strong> native MTX was less <strong>in</strong>tense and less homogenous<br />
<strong>in</strong> MDA-MB-231 than <strong>in</strong> MCF-7 cells. Special attention should<br />
be paid <strong>to</strong> the metabolite fluorescence, as it was particularly <strong>in</strong>tense <strong>in</strong><br />
MDA-MB-231 cells. As <strong>in</strong>dicated by the CSI maps, the metabolite<br />
was ma<strong>in</strong>ly concentrated <strong>in</strong> per<strong>in</strong>uclear areas rich <strong>in</strong> membranes.<br />
These areas were not assignable <strong>to</strong> mi<strong>to</strong>chondria, because they were<br />
not colocalized with sta<strong>in</strong><strong>in</strong>g <strong>of</strong> a mi<strong>to</strong>chondrial fluorescent marker,<br />
rhodam<strong>in</strong>e 123. The oxidative pathway <strong>of</strong> this metabolism was <strong>in</strong>dicated<br />
by its <strong>in</strong>hibition after pretreatment <strong>of</strong> the cells with NAC<br />
antioxidant. In view <strong>of</strong> this f<strong>in</strong>d<strong>in</strong>g, the most likely assignment <strong>of</strong> the<br />
organelles responsible for MTX metabolism is endoplasmic reticulum,<br />
rich <strong>in</strong> oxidation phase I enzymes. This hypothesis was supported<br />
by colocalization <strong>of</strong> this metabolite fluorescence with emission<br />
<strong>of</strong> ER-Tracker Green, an endoplasmic reticulum probe.<br />
The observation that MDA-MB-231 but not MCF-7 cells are chemosensitizable<br />
by DHA, a peroxidizable polyunsaturated fatty acid,<br />
provided the opportunity <strong>to</strong> exam<strong>in</strong>e the <strong>in</strong>volvement <strong>of</strong> MTX localization<br />
or metabolism <strong>in</strong> chemosensitivity. DHA enhanced the sensitivity<br />
<strong>of</strong> MDA-MB-231 cells <strong>to</strong> MTX, whereas it had no effect on<br />
MCF-7 cells. CSI data showed that DHA <strong>in</strong>creased MTX accumulation<br />
<strong>in</strong> MDA-MB-231 but not <strong>in</strong> MCF-7 cells. This accumulation<br />
occurred <strong>in</strong> cy<strong>to</strong>sol and was assigned <strong>to</strong> metabolized MTX, suggest<strong>in</strong>g<br />
a role for this metabolism <strong>in</strong> DHA-enhanced MTX activity.<br />
Reska et al. (1986) <strong>in</strong>dicated that MTX and related molecules are<br />
easily subject <strong>to</strong> oxidative enzymatic action., 1986). Enzymatic oxidation<br />
<strong>of</strong> MTX by peroxidase <strong>in</strong> the presence <strong>of</strong> hydrogen peroxide<br />
led <strong>to</strong> a cyclic metabolite (Kolodziejczyk et al., 1988; Bruck and<br />
Harvey, 2003). In our study, the observed metabolite had a fluorescence<br />
emission maximum at 654 nm, similarly <strong>to</strong> the one described by<br />
Fe<strong>of</strong>anov et al. (1997a) and supposed by these authors <strong>to</strong> be a cyclic<br />
metabolite. However, the fluorescence spectrum does not provide<br />
sufficient structural specificity <strong>to</strong> assign the emission <strong>to</strong> an exact<br />
chemical formula. Identification <strong>of</strong> the exact metabolite structure<br />
should be a subject <strong>of</strong> further studies us<strong>in</strong>g structurally specific<br />
analytical techniques such as vibrational spectroscopy, nuclear magnetic<br />
resonance, and mass spectrometry. Therefore, we conclude that<br />
the metabolite detected <strong>in</strong> the present study was a fluorescent molecule<br />
orig<strong>in</strong>at<strong>in</strong>g from MTX oxidation with<strong>in</strong> cancer cells. Isolation <strong>of</strong><br />
the metabolite and identification <strong>of</strong> its structure would allow evaluation<br />
<strong>of</strong> its direct cy<strong>to</strong><strong>to</strong>xicity.<br />
Brück and Harvey (2003) have reported that highly oxidized MTX<br />
metabolites form covalent complexes with DNA <strong>to</strong> <strong>in</strong>hibit DNA<br />
replication enzymes and may contribute <strong>to</strong> the cy<strong>to</strong><strong>to</strong>xic effects <strong>of</strong> the<br />
drug (Panousis et al., 1995, 1997). However, we can note that <strong>in</strong> our<br />
conditions, there was no detectable sta<strong>in</strong><strong>in</strong>g <strong>of</strong> the metabolite <strong>in</strong> the<br />
nucleus. As an alternative <strong>to</strong> direct nuclear action <strong>of</strong> the metabolite,<br />
we hypothesize that it could contribute <strong>to</strong> chemosensitivity by <strong>in</strong>fluenc<strong>in</strong>g<br />
the oxidative status <strong>of</strong> cells. Indeed, it was shown that the<br />
peroxidative conversion <strong>of</strong> MTX is accompanied by formation <strong>of</strong> free<br />
radical species (Kolodziejczyk et al., 1988). However, <strong>in</strong> the present<br />
study, MTX treatment <strong>of</strong> both cell l<strong>in</strong>es did not lead <strong>to</strong> an <strong>in</strong>crease <strong>in</strong><br />
ROS as measured with CM-H 2DCFDA. In contrast, ROS levels were<br />
<strong>in</strong>creased by MTX <strong>in</strong> DHA-supplemented MDA-MB-231 cells.<br />
The polyunsaturated fatty acid DHA, with its six double bonds, is<br />
very prone <strong>to</strong> oxidation and therefore provides abundant targets for<br />
ROS. We demonstrated previously that DHA supplementation leads<br />
<strong>to</strong> high lipid peroxidation <strong>in</strong> MDA-MB-231 cells and <strong>to</strong> moderate<br />
lipid peroxidation <strong>in</strong> MCF-7 cells (Mahéo et al., 2005). This is <strong>in</strong><br />
accordance with our current observation <strong>of</strong> a high concentration <strong>of</strong> an<br />
oxidized MTX metabolite <strong>in</strong> MDA-MB-231 cells and a low concentration<br />
<strong>of</strong> the metabolite <strong>in</strong> MCF-7 cells. Products <strong>of</strong> lipid peroxidation<br />
such as hydroperoxides and aldehydes have been implicated <strong>in</strong><br />
cy<strong>to</strong><strong>to</strong>xic process and <strong>in</strong>crease drug efficacy (Das, 2002; S<strong>to</strong>ll, 2002;<br />
Dianzani, 2003). This might expla<strong>in</strong> why NAC <strong>in</strong>hibited the DHA<strong>in</strong>duced<br />
enhancement <strong>of</strong> MTX <strong>to</strong>xicity <strong>in</strong> MDA-MB-231 cells. Thus,<br />
conditions favor<strong>in</strong>g <strong>in</strong>creased lipid peroxidation <strong>in</strong> response <strong>to</strong> MTX<br />
would lead <strong>to</strong> higher activity <strong>of</strong> the drug. Further studies <strong>of</strong> enzymes<br />
responsible for MTX metabolism should provide complementary<br />
knowledge on the different sensitivities <strong>of</strong> cancer cell l<strong>in</strong>es <strong>to</strong> antitumor<br />
agents, which are necessary for exploration <strong>of</strong> new therapeutic<br />
perspectives.<br />
References<br />
827<br />
Bell DH (1988) Characterization <strong>of</strong> the fluorescence <strong>of</strong> the antitumor agent, mi<strong>to</strong>xantrone.<br />
Biochim Biophys Acta 949:132–137.<br />
Bruck TB and Harvey PJ (2003) Oxidation <strong>of</strong> mi<strong>to</strong>xantrone by lac<strong>to</strong>peroxidase. Biochim Biophys<br />
Acta 1649:154–163.<br />
Burns CP, Haugstad BN, Mossman CJ, North JA, and Ingraham LM (1988a) Membrane lipid<br />
alteration: effect on cellular uptake <strong>of</strong> mi<strong>to</strong>xantrone. Lipids 23:393–397.<br />
Burns CP and North JA (1986) Adriamyc<strong>in</strong> transport and sensitivity <strong>in</strong> fatty acid-modified<br />
leukemia cells. Biochim Biophys Acta 888:10–17.<br />
Burns CP, North JA, Petersen ES, and Ingraham LM (1988b) <strong>Subcellular</strong> distribution <strong>of</strong><br />
doxorubic<strong>in</strong>: comparison <strong>of</strong> fatty acid-modified and unmodified cells. Proc Soc Exp Biol Med<br />
188:455–460.<br />
Colas S, Germa<strong>in</strong> E, Arab K, Mahéo K, Goupille C, and Bougnoux P (2005) �-Tocopherol<br />
suppresses mammary tumor sensitivity <strong>to</strong> anthracycl<strong>in</strong>es <strong>in</strong> fish oil-fed rats. Nutr Cancer<br />
51:178–183.<br />
Colas S, Paon L, Denis F, Prat M, Louisot P, Ho<strong>in</strong>ard C, Le Floch O, Ogilvie G, and Bougnoux<br />
P (2004) Enhanced radiosensitivity <strong>of</strong> rat au<strong>to</strong>chthonous mammary tumors by dietary docosahexaenoic<br />
acid. Int J Cancer 109:449–454.<br />
Consoli U, Van NT, Neamati N, Mahadevia R, Beran M, Zhao S, and Andreeff M (1997)<br />
Cellular pharmacology <strong>of</strong> mi<strong>to</strong>xantrone <strong>in</strong> P-glycoprote<strong>in</strong>-positive and -negative human myeloid<br />
leukemic cell l<strong>in</strong>es. Leukemia 11:2066–2074.<br />
Das U (2002) A radical approach <strong>to</strong> cancer. Med Sci Monit 8:RA79–92.<br />
Das UN (1999) Essential fatty acids, lipid peroxidation and apop<strong>to</strong>sis. Prostagland<strong>in</strong>s Leukotrienes<br />
Essent Fatty Acids 61:157–163.<br />
Dianzani MU (2003) 4-Hydroxynonenal from pathology <strong>to</strong> physiology. Mol Aspects Med<br />
24:263–272.<br />
Fe<strong>of</strong>anov A, Charonov S, Fleury F, Kudel<strong>in</strong>a I, Jardillier JC, and Nabiev I (1999) Confocal<br />
spectral imag<strong>in</strong>g analysis <strong>of</strong> <strong>in</strong>tracellular <strong>in</strong>teractions <strong>of</strong> mi<strong>to</strong>xantrone at different phases <strong>of</strong> the<br />
cell cycle. Anticancer Res 19:5341–5348.<br />
Fe<strong>of</strong>anov A, Sharonov S, Fleury F, Kudel<strong>in</strong>a I, and Nabiev I (1997a) Quantitative confocal<br />
spectral imag<strong>in</strong>g analysis <strong>of</strong> mi<strong>to</strong>xantrone with<strong>in</strong> liv<strong>in</strong>g K562 cells: <strong>in</strong>tracellular accumulation<br />
and distribution <strong>of</strong> monomers, aggregates, naphthoqu<strong>in</strong>oxal<strong>in</strong>e metabolite, and drug-target<br />
complexes. Biophys J 73:3328–3336.<br />
Fe<strong>of</strong>anov A, Sharonov S, Kudel<strong>in</strong>a I, Fleury F, and Nabiev I (1997b) Localization and molecular<br />
<strong>in</strong>teractions <strong>of</strong> mi<strong>to</strong>xantrone with<strong>in</strong> liv<strong>in</strong>g K562 cells as probed by confocal spectral imag<strong>in</strong>g<br />
analysis. Biophys J 73:3317–3327.<br />
Fox ME and Smith PJ (1995) <strong>Subcellular</strong> localisation <strong>of</strong> the antitumour drug mi<strong>to</strong>xantrone and<br />
the <strong>in</strong>duction <strong>of</strong> DNA damage <strong>in</strong> resistant and sensitive human colon carc<strong>in</strong>oma cells. Cancer<br />
Chemother Pharmacol 35:403–410.<br />
Germa<strong>in</strong> E, Chajes V, Cognault S, Lhuillery C, and Bougnoux P (1998) Enhancement <strong>of</strong><br />
doxorubic<strong>in</strong> cy<strong>to</strong><strong>to</strong>xicity by polyunsaturated fatty acids <strong>in</strong> the human breast tumor cell l<strong>in</strong>e<br />
MDA-MB-231: relationship <strong>to</strong> lipid peroxidation. Int J Cancer 75:578–583.<br />
Germa<strong>in</strong> E, Lavandier F, Chajes V, Schubnel V, Bonnet P, Lhuillery C, and Bougnoux P (1999)<br />
Dietary n-3 polyunsaturated fatty acids and oxidants <strong>in</strong>crease rat mammary tumor sensitivity<br />
<strong>to</strong> epirubic<strong>in</strong> without change <strong>in</strong> cardiac <strong>to</strong>xicity. Lipids 34 (Suppl):S203.<br />
Gewirtz DA (1999) A critical evaluation <strong>of</strong> the mechanisms <strong>of</strong> action proposed for the antitumor<br />
effects <strong>of</strong> the anthracycl<strong>in</strong>e antibiotics Adriamyc<strong>in</strong> and daunorubic<strong>in</strong>. Biochem Pharmacol<br />
57:727–741.<br />
Hazlehurst LA, Foley NE, Gleason-Guzman MC, Hacker MP, Cress AE, Greenberger LW, De<br />
Jong MC, and Dal<strong>to</strong>n WS (1999) Multiple mechanisms confer drug resistance <strong>to</strong> mi<strong>to</strong>xantrone<br />
<strong>in</strong> the human 8226 myeloma cell l<strong>in</strong>e. Cancer Res 59:1021–1028.<br />
Kellner U, Hutch<strong>in</strong>son L, Seidel A, Lage H, Danks MK, Dietel M, and Kaufmann SH (1997)<br />
Decreased drug accumulation <strong>in</strong> a mi<strong>to</strong>xantrone-resistant gastric carc<strong>in</strong>oma cell l<strong>in</strong>e <strong>in</strong> the<br />
absence <strong>of</strong> P-glycoprote<strong>in</strong>. Int J Cancer 71:817–824.<br />
Downloaded from<br />
dmd.aspetjournals.org by guest on January 17, 2013
828 VIBET ET AL.<br />
Kolodziejczyk P, Reszka K, and Lown JW (1988) Enzymatic oxidative activation and transformation<br />
<strong>of</strong> the antitumor agent mi<strong>to</strong>xantrone. Free Radic Biol Med 5:13–25.<br />
Litman T, Brangi M, Hudson E, Fetsch P, Abati A, Ross DD, Miyake K, Resau JH, and Bates<br />
SE (2000) The multidrug-resistant phenotype associated with overexpression <strong>of</strong> the new ABC<br />
half-transporter, MXR (ABCG2). J Cell Sci 113 (Pt 11):2011–2021.<br />
Mahéo K, Vibet S, Steghens JP, Dartigeas C, Lehman M, Bougnoux P, and Goré J (2005)<br />
<strong>Differential</strong> sensitization <strong>of</strong> cancer cells <strong>to</strong> doxorubic<strong>in</strong> by DHA: a role for lipoperoxidation.<br />
Free Radic Biol Med 39:742–751.<br />
Menendez JA, Lupu R, and Colomer R (2005) Exogenous supplementation with �-3 polyunsaturated<br />
fatty acid docosahexaenoic acid (DHA;22:6N-3) synergistically enhances taxane<br />
cy<strong>to</strong><strong>to</strong>xicity and downregulates Her-2/neu (c-erbB-2) oncogene expression <strong>in</strong> human breast<br />
cancer cells. Eur J Cancer Prev 14:263–270.<br />
Menendez JA, Ropero S, Lupu R, and Colomer R (2004) �-6 polyunsaturated fatty acid<br />
�-l<strong>in</strong>olenic acid (18:3n-6) enhances docetaxel (Taxotere) cy<strong>to</strong><strong>to</strong>xicity <strong>in</strong> human breast carc<strong>in</strong>oma<br />
cells: relationship <strong>to</strong> lipid peroxidation and HER-2/neu expression. Oncol Rep 11:1241–<br />
1252.<br />
Mosmann T (1983) Rapid colorimetric assay for cellular growth and survival: application <strong>to</strong><br />
proliferation and cy<strong>to</strong><strong>to</strong>xicity assays. J Immunol Methods 65:55–63.<br />
Novak RF and Kharasch ED (1985) <strong>Mi<strong>to</strong>xantrone</strong>: propensity for free radical formation and lipid<br />
peroxidation—implications for cardio<strong>to</strong>xicity. Invest New Drugs 3:95–99.<br />
Panousis C, Kettle AJ, and Phillips DR (1995) Myeloperoxidase oxidizes mi<strong>to</strong>xantrone<br />
<strong>to</strong> metabolites which b<strong>in</strong>d covalently <strong>to</strong> DNA and RNA. Anticancer Drug Des 10:593–<br />
605.<br />
Panousis C, Kettle AJ, and Phillips DR (1997) Neutrophil-mediated activation <strong>of</strong> mi<strong>to</strong>xantrone<br />
<strong>to</strong> metabolites which form adducts with DNA. Cancer Lett 113:173–178.<br />
Reszka K, Kolodziejczyk P, and Lown JW (1986) Horseradish peroxidase-catalyzed oxidation <strong>of</strong><br />
mi<strong>to</strong>xantrone: spectropho<strong>to</strong>metric and electron paramagnetic resonance studies. J Free Radic<br />
Biol Med 2:25–32.<br />
Rose DP and Connolly JM (1999) �-3 fatty acids as cancer chemopreventive agents. Pharmacol<br />
Ther 83:217–244.<br />
Shao Y, Pard<strong>in</strong>i L, and Pard<strong>in</strong>i RS (1995) Dietary menhaden oil enhances mi<strong>to</strong>myc<strong>in</strong> C antitumor<br />
activity <strong>to</strong>ward human mammary carc<strong>in</strong>oma MX-1. Lipids 30:1035–1045.<br />
Sharonov S, Chourpa I, Morjani H, Nabiev I, Manfait M, and Fe<strong>of</strong>anov A (1994) Confocal<br />
spectral imag<strong>in</strong>g analysis <strong>in</strong> studies <strong>of</strong> the spatial distribution <strong>of</strong> antitumour drugs with<strong>in</strong> liv<strong>in</strong>g<br />
cancer cells. Anal Chim Acta 290:40–47.<br />
Smith PJ, Desnoyers R, Blunt N, Giles Y, Patterson LH, and Watson JV (1997) Flow cy<strong>to</strong>metric<br />
analysis and confocal imag<strong>in</strong>g <strong>of</strong> anticancer alkylam<strong>in</strong>oanthraqu<strong>in</strong>ones and their N-oxides <strong>in</strong><br />
<strong>in</strong>tact human cells us<strong>in</strong>g 647-nm kryp<strong>to</strong>n laser excitation. Cy<strong>to</strong>metry 27:43–53.<br />
Smith PJ, Sykes HR, Fox ME, and Furlong IJ (1992) <strong>Subcellular</strong> distribution <strong>of</strong> the anticancer drug<br />
mi<strong>to</strong>xantrone <strong>in</strong> human and drug-resistant mur<strong>in</strong>e cells analyzed by flow cy<strong>to</strong>metry and confocal<br />
microscopy and its relationship <strong>to</strong> the <strong>in</strong>duction <strong>of</strong> DNA damage. Cancer Res 52:4000–4008.<br />
Spec<strong>to</strong>r AA and Burns CP (1987) Biological and therapeutic potential <strong>of</strong> membrane lipid<br />
modification <strong>in</strong> tumors. Cancer Res 47:4529–4537.<br />
S<strong>to</strong>ll BA (2002) N-3 fatty acids and lipid peroxidation <strong>in</strong> breast cancer <strong>in</strong>hibition. Br J Nutr<br />
87:193–198.<br />
Address correspondence <strong>to</strong>: Dr. Igor Chourpa, Faculté de Pharmacie, 31<br />
avenue Monge, 37100 Tours, France. E-mail: chourpa@univ-<strong>to</strong>urs.fr<br />
Downloaded from<br />
dmd.aspetjournals.org by guest on January 17, 2013