al - Adobe Acrobat Engineering
al - Adobe Acrobat Engineering
al - Adobe Acrobat Engineering

Create successful ePaper yourself
Turn your PDF publications into a flip-book with our unique Google optimized e-Paper software.
Proceedings of the<br />
IEEE Visu<strong>al</strong>ization '94 Conference
Copyright © 1994, Institute of Electric<strong>al</strong> and Electronics Engineers. All rights reserved.<br />
No part of this book may be reproduced in any form, nor may it be stored in a retriev<strong>al</strong><br />
system or transmitted in any form without written permission from the publisher.<br />
Person<strong>al</strong> use of this materi<strong>al</strong> is permitted. However, permission to reprint/republish this<br />
materi<strong>al</strong> for advertising or promotion<strong>al</strong> purposes or for creating new collective works for<br />
res<strong>al</strong>e or redistribution must be obtained from the IEEE. For information on obtaining<br />
permission, send a blank email message to info.pub.permission@ieee.org.<br />
By choosing to view this document, you agree to <strong>al</strong>l provisions of the copyright laws<br />
protecting it.
Contents<br />
Preface......................................................................................................................................x<br />
Reviewers................................................................................................................................xi<br />
Conference Committee...................................................................................................... xiii<br />
Program Committee ...........................................................................................................xiv<br />
Honorary Chair Address<br />
Interactive Visu<strong>al</strong>ization via 3D User Interfaces......................................................................2<br />
A. van Dam<br />
Keynote Panel<br />
Introduction: Visu<strong>al</strong>ization in the Information Highway .........................................................4<br />
N. Gershon<br />
Information Workspaces for Large Sc<strong>al</strong>e Cognition..................................................................5<br />
S.K. Card<br />
A Visu<strong>al</strong>ization System on Every Desk — Keeping it Simple...................................................6<br />
S.F. Roth<br />
The Future of Graphic User Interfaces.....................................................................................7<br />
B. Shneiderman<br />
Capstone Address<br />
The Cruci<strong>al</strong> Difference between Human and Machine Vision: Foc<strong>al</strong> Attention.....................10<br />
B. Julesz<br />
Volume Visu<strong>al</strong>ization Systems<br />
PAPERS<br />
Integrated Control of Distributed Volume Visu<strong>al</strong>ization Through<br />
the World-Wide-Web................................................................................................................13<br />
C.S. Ang, D.C. Martin, and M.D. Doyle<br />
A Distributed, Par<strong>al</strong>lel, Interactive Volume Rendering Package ...........................................21<br />
J.S. Rowlan, G.E. Lent, N. Gokh<strong>al</strong>e, and S. Bradshaw<br />
VolVis: A Diversified Volume Visu<strong>al</strong>ization System ...............................................................31<br />
R. Avila, T. He, L. Hong, A. Kaufman, H. Pfister,<br />
C. Silva, L. Sobierajski, and S. Wang<br />
Applications<br />
Implicit Modeling of Swept Surfaces and Volumes.................................................................40<br />
W.J. Schroeder, W.E. Lorensen, and S. Linthicum<br />
Visu<strong>al</strong>izing Polycryst<strong>al</strong>line Orientation Microstructures<br />
with Spheric<strong>al</strong> Color Maps ......................................................................................................46<br />
B. Yamrom, J.A. Sutliff, and A.P. Woodfield<br />
Introducing Alpha Shapes for the An<strong>al</strong>ysis of Path Integr<strong>al</strong> Monte Carlo Results................52<br />
P.J. Moran and M. Wagner<br />
v
Surfaces<br />
Piecewise-Linear Surface Approximation from Noisy Scattered Samples..............................61<br />
M. Marg<strong>al</strong>iot and C. Gotsman<br />
Triangulation and Display of Ration<strong>al</strong> Parametric Surfaces..................................................69<br />
C.L. Bajaj and A. Royappa<br />
Isosurface Generation by Using Extrema Graphs ..................................................................77<br />
T. Itoh and K. Koyamada<br />
Visu<strong>al</strong>ization Techniques<br />
Wavelet-Based Volume Morphing ...........................................................................................85<br />
T. He, S. Wang, and A. Kaufman<br />
Progressive Transmission of Scientific Data Using Biorthogon<strong>al</strong><br />
Wavelet Transform ..................................................................................................................93<br />
H. Tao and R.J. Moorhead<br />
An Ev<strong>al</strong>uation of Reconstruction Filters for Volume Rendering ..........................................100<br />
S.R. Marschner and R.J. Lobb<br />
Visu<strong>al</strong>izing Flow with Quaternion Frames ...........................................................................108<br />
A.J. Hanson and H. Ma<br />
Flow Features and Topology<br />
Feature Detection from Vector Quantities in a Numeric<strong>al</strong>ly Simulated<br />
Hypersonic Flow Field in Combination with Experiment<strong>al</strong> Flow Visu<strong>al</strong>ization ..................117<br />
H.-G. Pagendarm and B. W<strong>al</strong>ter<br />
3D Visu<strong>al</strong>ization of Unsteady 2D Airplane Wake Vortices ...................................................124<br />
K.-L. Ma and Z.C. Zheng<br />
Vortex Tubes in Turbulent Flows: Identification, Representation, Reconstruction.............132<br />
D.C. Banks and B.A. Singer<br />
The Topology of Second-Order Tensor Fields........................................................................140<br />
T. Delmarcelle and L. Hesselink<br />
Visu<strong>al</strong>izing Geometry and Algorithms<br />
GASP - A System for Visu<strong>al</strong>izing Geometric Algorithms......................................................149<br />
A. T<strong>al</strong> and D. Dobkin<br />
Virtu<strong>al</strong> Re<strong>al</strong>ity Performance for Virtu<strong>al</strong> Geometry...............................................................156<br />
R.A. Cross and A.J. Hanson<br />
A Library for Visu<strong>al</strong>izing Combinatori<strong>al</strong> Structures.............................................................164<br />
M.A. Najork and M.H. Brown<br />
Strata-Various: Multi-Layer Visu<strong>al</strong>ization of Dynamics in Software System Behavior ......172<br />
D. Kimelman, B. Rosenberg, and T. Roth<br />
Volume Visu<strong>al</strong>ization Techniques<br />
Differenti<strong>al</strong> Volume Rendering: A Fast Volume Visu<strong>al</strong>ization Technique<br />
for Flow Animation ................................................................................................................180<br />
H.-W. Shen and C. R. Johnson<br />
Fast Surface Rendering from Raster Data by Voxel Travers<strong>al</strong><br />
Using Chessboard Distance...................................................................................................188<br />
vi
M. Šrámek<br />
Par<strong>al</strong>lel Performance Measures for Volume Ray Casting.....................................................196<br />
C.T. Silva and A.E. Kaufman<br />
User Interfaces and Techniques<br />
Spiders: A New User Interface for Rotation and Visu<strong>al</strong>ization<br />
of N-Dimension<strong>al</strong> Point Sets..................................................................................................205<br />
K.L. Duffin and W.A. Barrett<br />
Restorer: A Visu<strong>al</strong>ization Technique for Handling Missing Data.........................................212<br />
R. Twiddy, J. Cav<strong>al</strong>lo, and S.M. Shiri<br />
User Modeling for Adaptive Visu<strong>al</strong>ization Systems..............................................................217<br />
G.O. Domik and B. Gutkauf<br />
Flow Visu<strong>al</strong>ization Techniques<br />
Streamb<strong>al</strong>l Techniques for Flow Vizu<strong>al</strong>ization .....................................................................225<br />
M. Brill, H. Hagen, H.-C. Rodrian, W. Djatschin, and S.V. Klimenko<br />
Volume Rendering Methods for Computation<strong>al</strong> Fluid Dynamics Visu<strong>al</strong>ization...................232<br />
D.S. Ebert, R. Yagel, J. Scott, and Y. Kurzion<br />
Visu<strong>al</strong>izing Flow over Curvilinear Grid Surfaces Using Line Integr<strong>al</strong> Convolution ...........240<br />
L.K. Forssell<br />
Visu<strong>al</strong>izing 3D Velocity Fields Near Contour Surfaces.........................................................248<br />
N. Max, R. Crawfis, and C. Grant<br />
Flow Visu<strong>al</strong>ization Systems<br />
UFAT — A Particle Tracer for Time-Dependent Flow Fields...............................................257<br />
D.A. Lane<br />
The Design and Implementation of the Cortex Visu<strong>al</strong>ization System..................................265<br />
D. Banerjee, C. Morley, and W. Smith<br />
An Annotation System for 3D Fluid Flow Visu<strong>al</strong>ization.......................................................273<br />
M.M. Loughlin and J.F. Hughes<br />
Surface Extraction<br />
Discretized Marching Cubes..................................................................................................281<br />
C. Montani, R. Scateni, and R. Scopigno<br />
Approximation of Isosurface in the Marching Cube: Ambiguity Problem ............................288<br />
S.V. Matveyev<br />
Nonpolygon<strong>al</strong> Isosurface Rendering for Large Volume Datasets .........................................293<br />
J.W. Durkin and J.F. Hughes<br />
Visu<strong>al</strong>ization Systems<br />
Mix&Match: A Construction Kit for Visu<strong>al</strong>ization................................................................302<br />
A. Pang and N. Alper<br />
A Lattice Model for Data Display..........................................................................................310<br />
W.L. Hibbard, C.R. Dyer, and B.E. Paul<br />
An Object Oriented Design for the Visu<strong>al</strong>ization of Multi-Variable Data Objects...............318<br />
vii
J.M. Favre and J. Hahn<br />
XmdvTool: Integrating Multiple Methods for Visu<strong>al</strong>izing Multivariate Data......................326<br />
M.O. Ward<br />
CASE STUDIES<br />
Magnetohydrodynamics and Mathematics<br />
Tokamak Plasma Turbulence Visu<strong>al</strong>ization..........................................................................337<br />
S.E. Parker and R. Samtaney<br />
Visu<strong>al</strong>izing Magnetohydrodynamic Turbulence and Vortex Streets ........................................*<br />
A. Roberts<br />
Visu<strong>al</strong>ization and Data An<strong>al</strong>ysis in Space and Atmospheric Science ...................................341<br />
A. Mankofsky, E.P. Szuszczewicz, P. Blanchard, C. Goodrich,<br />
D. McNabb, R. Kulkarni, and D. Kamins<br />
Visu<strong>al</strong>ization for Boundary V<strong>al</strong>ue Problems .........................................................................345<br />
G. Domokos and R. Paffenroth<br />
Environment<br />
Severe Rainf<strong>al</strong>l Events in Northwestern Peru: Visu<strong>al</strong>ization of<br />
Scattered Meteorologic<strong>al</strong> Data:..............................................................................................350<br />
L.A. Treinish<br />
Visu<strong>al</strong>ization of Mesosc<strong>al</strong>e Flow Features in Ocean Basins .................................................355<br />
A. Johannsen and R. Moorehead<br />
Integrating Spati<strong>al</strong> Data Display with Virtu<strong>al</strong> Reconstruction............................................359<br />
P. Peterson, B. Hayden, and F.D. Fracchia<br />
Medic<strong>al</strong> Applications<br />
Observing a Volume Rendered Fetus within a Pregnant Patient ........................................364<br />
A. State, D.T. Chen, C. Tector, A. Brandt, H. Chen,<br />
R. Ohbuchi, M. Bajura, and H. Fuchs<br />
Visu<strong>al</strong>ization of 3D Ultrasonic Data......................................................................................369<br />
G. Sakas, L.-A. Schreyer, and M. Grimm<br />
New Techniques in the Design of He<strong>al</strong>thcare Facilities .......................................................374<br />
T. Alameldin and M. Shepley<br />
Fire and Brimstone<br />
Visu<strong>al</strong>ization of an Electric Power Transmission System.....................................................379<br />
P.M. Mahadev and R.D. Christie<br />
Volume Rendering of Pool Fire Data.....................................................................................382<br />
H.E. Rushmeier, A. Hamins, and M.-Y. Choi<br />
_____________________________________________________<br />
* Paper not received in time for publication<br />
Visu<strong>al</strong>ization of Volcanic Ash Clouds ....................................................................................386<br />
M. Roth and R. Guritz<br />
viii
PANELS<br />
Ch<strong>al</strong>lenges and Opportunities in Visu<strong>al</strong>ization for NASA’s EOS Mission<br />
to Planet Earth ......................................................................................................................392<br />
Chair: M. Botts<br />
Panelists: J.D. Dykstra, L.S. Elson, S.J. Goodman, and M. Lee<br />
Visu<strong>al</strong>ization in Medicine: VIRTUAL Re<strong>al</strong>ity or ACTUAL Re<strong>al</strong>ity?.....................................396<br />
Co-Chairs: C. Roux and J.-L. Coatrieux<br />
Panelists: J.-L. Dillenseger, E.K. Fishman, M. Loew,<br />
H.-P. Meinzer, and J.D. Pearlman<br />
Visu<strong>al</strong>ization and Geographic Information Systems Integration: What Are the<br />
Needs and the Requirements, If Any ?? ................................................................................400<br />
Chair: T.M. Rhyne<br />
Panelists: W. Ivey, L. Knapp, P. Kochevar, and T. Mace<br />
Visu<strong>al</strong>ization of Multivariate (Multidimension<strong>al</strong>) Data and Relations.................................404<br />
Chair: A. Inselberg<br />
Panelists: H. Hinterberger, T. Mih<strong>al</strong>isin, and G. Grinstein<br />
Visu<strong>al</strong>izing Data: Is Virtu<strong>al</strong> Re<strong>al</strong>ity the Key?.......................................................................410<br />
Chair: L.M. Stone<br />
Panelists: T. Erickson, B.B. Bederson, P. Rothman, and R. Muzzy<br />
V<strong>al</strong>idation, Verification and Ev<strong>al</strong>uation................................................................................414<br />
Chair: S. Uselton<br />
Panelists: G. Dorn, C. Farhat, M. Vannier, K. Esbensen, and A. Globus<br />
Color Plates .......................................................................................................CP-1 to CP-46<br />
Author Index...................................................................................................................CP-47<br />
ix
Integrated Control of Distributed Volume Visu<strong>al</strong>ization<br />
Through the World-Wide-Web<br />
The World-Wide-Web (WWW) has created a new paradigm for<br />
online information retriev<strong>al</strong> by providing immediate and ubiquitous<br />
access to digit<strong>al</strong> information of any type from data repositories<br />
located throughout the world. The web’s development enables not<br />
only effective access for the generic user, but <strong>al</strong>so more efficient and<br />
timely information exchange among scientists and researchers. We<br />
have extended the capabilities of the web to include access to threedimension<strong>al</strong><br />
volume data sets with integrated control of a distributed<br />
client-server volume visu<strong>al</strong>ization system. This paper provides<br />
a brief background on the World-Wide-Web, an overview of<br />
the extensions necessary to support these new data types and a<br />
description of an implementation of this approach in a WWWcompliant<br />
distributed visu<strong>al</strong>ization system.<br />
1. Introduction<br />
Advanced scanning devices, such as magnetic resonance<br />
imaging (MRI) and computer tomography (CT), have been<br />
widely used in the fields of medicine, qu<strong>al</strong>ity assurance and<br />
meteorology [Pommert, Zandt, Hibbard]. The need to visu<strong>al</strong>ize<br />
resulting data has given rise to a wide variety of volume<br />
visu<strong>al</strong>ization techniques and computer graphics research groups<br />
have implemented a number of systems to provide volume<br />
visu<strong>al</strong>ization (e.g. AVS, ApE, Sunvision Voxel and 3D<br />
Viewnix)[Gerleg, Mercurio, VandeWettering]. Previously<br />
these systems have depended upon speci<strong>al</strong>ized graphics hardware<br />
for rendering and significant loc<strong>al</strong> secondary storage for<br />
the data. The expense of these requirements has limited the<br />
ability of researchers to exchange findings. To overcome the<br />
barrier of cost, and to provide addition<strong>al</strong> means for researchers<br />
to exchange and examine three-dimension<strong>al</strong> volume data, we<br />
have implemented a distributed volume visu<strong>al</strong>ization tool for<br />
gener<strong>al</strong> purpose hardware, we have further integrated that<br />
visu<strong>al</strong>ization service with the distributed hypermedia [Flanders,<br />
Broering, Kiong, Robison, Story] system provided by the<br />
World-Wide-Web [Nickerson].<br />
Our distributed volume visu<strong>al</strong>ization tool, VIS, utilizes a<br />
Cheong S. Ang, M.S.<br />
David C. Martin, M.S.<br />
Michael D. Doyle, Ph.D.<br />
University of C<strong>al</strong>ifornia, San Francisco<br />
Library and Center for Knowledge Management<br />
San Francisco, C<strong>al</strong>ifornia 94143-0840<br />
pool of gener<strong>al</strong> purpose workstations to generate three dimension<strong>al</strong><br />
representations of volume data. The VIS tool provides<br />
integrated load-b<strong>al</strong>ancing across any number of heterogeneous<br />
UNIX workstations (e.g. SGI, Sun, DEC, etc…) [Giertsen]<br />
taking advantage of the unused cycles that are gener<strong>al</strong>ly available<br />
in academic and research environments. In addition, VIS<br />
supports speci<strong>al</strong>ized graphics hardware (e.g. the Re<strong>al</strong>ityEngine<br />
from Silicon Graphics), when available, for re<strong>al</strong>-time visu<strong>al</strong>ization.<br />
Distributing information that includes volume data requires<br />
the integration of visu<strong>al</strong>ization with a document delivery<br />
mechanism. We have integrated VIS and volume data into<br />
the WWW, taking advantage of the client-server architecture<br />
of WWW and its ability to access hypertext documents stored<br />
anywhere on the Internet [Obraszka, Nickersen]. We have<br />
enhanced the capabilities of the most popular WWW client,<br />
Mosaic [Andreessen] from the Nation<strong>al</strong> Center for<br />
Supercomputer Applications (NCSA), to support volume data<br />
and have defined an inter-client protocol for communication<br />
between VIS and Mosaic for volume visu<strong>al</strong>ization. It should be<br />
noted that other types of interactive applications could be<br />
"embedded" within HTML documents as well. Our approach<br />
can be gener<strong>al</strong>ized to <strong>al</strong>low the implementation of object<br />
linking and embedding over the Internet, similar to the features<br />
the OLE 2.0 provides users of Microsoft Windows on an<br />
individu<strong>al</strong> machine.<br />
1.1 The World-Wide-Web<br />
The World-Wide-Web is a combination of a transfer<br />
protocol for hyper-text documents (HTTP) and a hyper-text<br />
mark-up language (HTML) [Nickersen]. The basic function<strong>al</strong>ity<br />
of HTTP <strong>al</strong>lows a client application to request a wide<br />
variety of data objects from a server. Objects are identified by<br />
a univers<strong>al</strong> resource locator (URL)[Obraczka] that contains<br />
information sufficient to both locate and query a remote server.<br />
HTML documents are defined by a document type definition
(DTD) of the Standard Gener<strong>al</strong>ized Mark-up Language<br />
(SGML). These documents are returned to WWW clients and<br />
are presented to the user. Users are able to interact with the<br />
document presentation, following hyper-links that lead to<br />
other HTML documents or data objects. The client application<br />
may <strong>al</strong>so directly support other Internet services, such as<br />
FTP, Gopher, and WAIS, [Andreessen] or may utilize gateways<br />
that convert HTTP protocol requests and return HTML<br />
documents. In <strong>al</strong>l interactions, however, the user is presented<br />
with a common resulting data format (HTML) and <strong>al</strong>l links are<br />
accessible via URL’s.<br />
1.2 Mosaic<br />
THE INTERNET<br />
SESSION<br />
MANAGER<br />
VISUALIZATION SERVERS DATA CENTER<br />
HIGH SPEED LOCAL NETWORK (1 GBPS)<br />
Figure 1: VIS client/server model.<br />
The Nation<strong>al</strong> Center for Supercomputer Applications<br />
(NCSA) has developed one of the most function<strong>al</strong> and popular<br />
World-Wide-Web clients: Mosaic. This client is available via<br />
public FTP for the most popular computer interfaces (Motif,<br />
Windows and Macintosh). Mosaic interprets a majority of the<br />
HTML DTD elements and presents the encoded information<br />
with page formatting, type-face specification, image display,<br />
fill-in forms, and graphic<strong>al</strong> widgets. In addition, Mosaic<br />
provides inherent access to FTP, Gopher, WAIS and other<br />
network services [Andreessen].<br />
1.3 VIS<br />
VIS is a simple but complete volume visu<strong>al</strong>izer. VIS<br />
provides arbitrary three-dimension<strong>al</strong> transformation (e.g. rotation<br />
and sc<strong>al</strong>ing), specification of six axi<strong>al</strong> clipping planes<br />
(n.b. a cuboid), one arbitrary clipping plane, and control of<br />
opacity and intensity. VIS interactively transforms the cuboid,<br />
and texture-maps the volume data onto the transformed geometry.<br />
It supports distributed volume rendering [Argrio, Drebin,<br />
Kaufman] with run-time selection of computation servers, and<br />
isosurface generation (marching cubes)[Lorenson, Levoy] with<br />
software Gouraud shading for surface-based model extraction<br />
and rendering. It reads NCSA Hierarchic<strong>al</strong> Data Format<br />
(HDF) volume data files, and has a graphic<strong>al</strong> interface utility<br />
to import volume data stored in other formats.<br />
2. VIS: A Distributed Volume Visu<strong>al</strong>ization Tool<br />
VIS is a highly modular distributed visu<strong>al</strong>ization tool,<br />
following the principles of client/server architecture (figure 1),<br />
and consisting of three cooperating processes: VIS, Panel, and<br />
VRServer(s). The VIS module handles the tasks of transformation,<br />
texture-mapping, isosurface extraction, Gouraud shading,<br />
and manages load distribution in volume rendering. VIS<br />
produces images that are drawn either to its own top-level<br />
window (when running stand-<strong>al</strong>one) or to a shared window<br />
system buffer (when running as a cooperative process). The<br />
Panel module provides a graphic<strong>al</strong> user-interface for <strong>al</strong>l VIS<br />
function<strong>al</strong>ity and communicates state changes to VIS. The<br />
VRServer processes execute on a heterogenous pool of gener<strong>al</strong><br />
purpose workstations and perform volume rendering at the<br />
request of the VIS process . The three modules are integrated<br />
as shown in figure 3 when cooperating with another process. A<br />
simple output window is displayed when no cooperating<br />
process is specified.<br />
2.1 Distributed Volume Rendering<br />
Volume rendering <strong>al</strong>gorithms require a significant amount<br />
of computation<strong>al</strong> resources. However, these <strong>al</strong>gorithms are<br />
excellent candidates for par<strong>al</strong>lelization. VIS distributes the<br />
volume rendering among workstations with a “greedy” <strong>al</strong>gorithm<br />
that <strong>al</strong>locates larger portions of the work to faster<br />
machines [Bloomer]. VIS segments the task of volume rendering<br />
based on scan-lines, with segments sized to b<strong>al</strong>ance computation<strong>al</strong><br />
effort versus network transmission time. Each of the
user-selected computation servers fetches a segment for rendering<br />
via remote procedure c<strong>al</strong>ls (RPC), returns results and fetch<br />
another segment. The servers effectively compete for segments,<br />
with faster servers processing more segments per unit<br />
time, ensuring relatively equ<strong>al</strong> load b<strong>al</strong>ancing across the pool.<br />
An<strong>al</strong>ysis of this distribution <strong>al</strong>gorithm [Giertsen, 93] shows<br />
that the performance improvement is a function of both the<br />
number of segments and the number of computation<strong>al</strong> servers,<br />
with the optim<strong>al</strong> number of sections increasing directly with<br />
the number of available servers. Test results indictate that<br />
performance improvement flattens out between 10 to 20<br />
segments distributed across an available pool of four servers.<br />
Although this <strong>al</strong>gorithm may not be perfect, it achieves acceptable<br />
results.<br />
2.2 Cooperative Visu<strong>al</strong>izaton<br />
The VIS client, together with its volume rendering servers,<br />
may be lauched by another application collectively as a<br />
visu<strong>al</strong>ization server. The two requirements of cooperation are<br />
a shared window system buffer for the rendered image and<br />
support for a limited number of inter-process messages. VIS<br />
and the initiating application communicate via the ToolT<strong>al</strong>k<br />
service, passing messages specifying the data object to visu<strong>al</strong>ize<br />
as well as options for visu<strong>al</strong>ization, and maintaining state<br />
regarding image display. The VIS Panel application appears as<br />
a new top-level window and <strong>al</strong>lows the user control of the<br />
visu<strong>al</strong>ization tool.<br />
3. Visu<strong>al</strong>ization with Mosaic<br />
We have enhanced the Mosaic WWW browser to support<br />
both a three-dimension<strong>al</strong> data object and communication with<br />
VIS as a coopezrating application (figure 2). HTTP servers<br />
respond to requests from clients, e.g. Mosaic, by transferring<br />
hypertext documents to the client. Those documents may<br />
contain text and images as intrinsic elements and may <strong>al</strong>so<br />
contain extern<strong>al</strong> links to any arbitrary data object (e.g. audio,<br />
video, etc…). Mosaic may <strong>al</strong>so communicate with other<br />
Internet servers, e.g FTP, either directly – translating request<br />
results into HTML on demand – or via a gateway that provides<br />
translation services. As a WWW client, Mosaic communicates<br />
with the server(s) of interest in response to user actions (e.g.<br />
selecting a hyperlink), initiating a connection and requesting<br />
the document specified by the URL. The server delivers the file<br />
specified in the URL, which may be a HTML document or a<br />
variety of multimedia data files (for example, images, audio<br />
files, and MPEG movies) and Mosaic uses the predefined<br />
SGML DTD for HTML to parse and present the information.<br />
Data types not directly supported by Mosaic are displayed via<br />
user-specifiable extern<strong>al</strong> applications and we have extended<br />
that paradigm to both include three-dimension<strong>al</strong> volume data,<br />
as well as to integrate the extern<strong>al</strong> applications more completely<br />
with Mosaic.<br />
3.1 Mosaic 3D image support<br />
We have extended the HTML DTD to support threedimension<strong>al</strong><br />
data via the introduction of a new SGML element:<br />
EMBED. This element provides information to the<br />
presentation system (i.e. Mosaic) about the content that is<br />
referenced in the document. The EMBED element is defined<br />
in the HTML DTD as shown in Example 1, which is translated<br />
as “SGML document instance element tag EMBED containing<br />
no content; four required attributes: TYPE, the type of the<br />
extern<strong>al</strong> application, in the MIME-type format; HREF, the<br />
location/URL of the datafile; WIDTH, the window width<br />
and, HEIGHT, the window height. The TYPE attribute give<br />
this specification the flexibility to accomodate different types<br />
of extern<strong>al</strong> applications. In a HTML document, a 3D image<br />
element would be represented as shown in Example 2, which<br />
may be interpreted as “create a drawing-area window of width<br />
400 pixels, height 400 pixels, and use the application associated<br />
to hdf/volume MIME content-type to visu<strong>al</strong>ize the data<br />
Embryo.hdf located at the HTTP server site<br />
www.library.ucsf.edu”.<br />
3.2 Interface with Mosaic<br />
The VIS/Mosaic software system consists of three elements:<br />
VIS, Mosaic, and Panel. Currently, the VIS application<br />
communicates with Mosaic via ToolT<strong>al</strong>k, but the<br />
system will work with any interclient communication protocol.<br />
When Mosaic interprets the HTML tag EMBED, it<br />
creates a drawing area widget in the document page presentation<br />
and requests a shared buffer or pixmap from the windowing<br />
system to receive visu<strong>al</strong>ization results. In addition, Mosaic<br />
launches the Panel process, specifying the location of the data<br />
object to render and identifying the shared image buffer. The<br />
Panel process begins execution by first verifying its operating<br />
parameters, then launching the VIS process. The Panel process<br />
<strong>al</strong>so presents the user with the control elements for data<br />
manipulation and manages the communication between the<br />
whole VIS application and Mosaic.<br />
The VIS process, on the other hand, serves as a rendering<br />
engine. It executes the visu<strong>al</strong>ization commands from the Panel<br />
process, integrates the image data segments from various<br />
VRServers, and presents the complete array of image data to<br />
the Panel.<br />
Thus the scenario following a user’s action on the Panel<br />
will be (1) Panel issues visu<strong>al</strong>ization commands to the VIS<br />
rendering engine, (2) VIS sends rendering requests to
Figure 2: VIS embeded within Mosaic for interactive visu<strong>al</strong>ization in a HTML document.<br />
VRServer(s), then gathers the resulting image segments, (3)<br />
Panel fetches the returned image data, then writes it to the<br />
pixmap, (4) Panel notifies Mosaic upon completion, and (5)<br />
Mosaic bit-blots the pixmap contents into its corresponding<br />
DrawingArea widget. The interprocess communication issue<br />
will be addressed in more details under section 3.3. The<br />
configuration of this software system is depicted in figure 3.<br />
3.3 Interclient communication<br />
We recognized the minimum set of communication protocols<br />
between Mosaic and a particular Panel process:<br />
(a) Messages from Mosaic to a Panel process include the<br />
following:<br />
(i) ExitNotify - requesting the Panel to terminate<br />
itself.when Mosaic exits.<br />
(ii) MapNotify - requesting the Panel to map itself to<br />
the screen when the HTML document containing the<br />
DrawingArea corresponding to the above panel is visible.<br />
(iii) UnmapNotify - requesting the Panel to unmap/<br />
iconify itself when the HTML page containing the DrawingArea<br />
corresponding to the above Panel is cached.<br />
(b) Messages from a Panel process to Mosaic may be one<br />
of the following:<br />
(i) RefreshNotify - informing Mosaic of an update in<br />
the shared pixmap, and requesting Mosaic to update the<br />
correspinding DrawingArea.<br />
(ii) PanelStartNotify - informing Mosaic the Panel is<br />
started successfully, and ready to receive messages.<br />
(iii) PanelExitNotify - informing Mosaic the Panel is<br />
exiting, and Mosaic should not send any more messages to the<br />
Panel.<br />
We have packaged the above protocols and <strong>al</strong>l the required<br />
messaging functions into a library. Modification of an existing<br />
extern<strong>al</strong> application merely involves registration of the extern<strong>al</strong><br />
application’s messaging window (the window to receive Mosaic’s<br />
messages), inst<strong>al</strong>lation of c<strong>al</strong>lback functions corresponding to
the messages from Mosaic, and addition of message-sending<br />
routine invocations. The protocol is summarized in Table 1.<br />
Messages Descriptions<br />
ExitNotify Mosaic exiting<br />
MapNotify DrawingArea visible<br />
UnmapNotify DrawingArea cache<br />
RefreshNotify DrawingArea update<br />
PanelStartNotify Panel starting<br />
PanelExitNotify Panel exiting<br />
Table 1: Mosaic/VIS IPC communication.<br />
4. Results<br />
The results of the above implementation are very encouraging.<br />
The Mosaic/VIS sucessfully <strong>al</strong>lows users to visu<strong>al</strong>ize<br />
HDF volume datasets from various HTTP server sites. Fig 2<br />
shows a snapshot of the WWW visu<strong>al</strong>izer. Distributing the<br />
volume rendering loads results in a remarkable speedup in<br />
image computations. Our performance ananlysis with a<br />
homogeneous pool of Sun SPARCstation 2’s on a relatively<br />
c<strong>al</strong>m network produced reasonable results (Figures 4a, 4b, and<br />
4c. Three tri<strong>al</strong>s per plot). The time-versus-number-ofworkstations<br />
curve decreases as more servers participate, and<br />
plateaus when the number of SPARCstations is 11 in the case<br />
of 256x256 image (9 for 192x192 image, and 7 for 128x128<br />
image). The speed increases at the plateaus are very significant:<br />
about 10 times for the 256x256 image, 8 times for the 192x192<br />
image, and 5 times for the 128x128 image. The outcomes<br />
suggest that performance improvement is a function of the<br />
number of volume rendering servers. Furthermore, the optim<strong>al</strong><br />
number of workstations and the speed increase are larger<br />
when the image size is bigger. This is in complete agreement<br />
with Giertsen’s an<strong>al</strong>ysis. We have <strong>al</strong>so successfully tested the<br />
software system in an environment consisting of heterogenous<br />
workstations: a SGI Indigo2 R4400/150MHz, two SGI Indy<br />
R4000PC/100MHz, a DEC Alpha 3000/500 with a 133MHz<br />
Alpha processor, two Sun SparcStations 10, and two Sun<br />
SparcStations 2, which were located arbitrarily on an Ethernet<br />
network. To our knowledge this is the first demonstration of<br />
the embedding of interactive control of a client/server visu<strong>al</strong>ization<br />
application within a multimedia document in a distributed<br />
hypermedia environment, such as the World Wide Web.<br />
5. Ongoing/Future work<br />
We have begun working on sever<strong>al</strong> extensions and improvements<br />
on the above software system:<br />
<br />
<br />
Example 1: SGML definition for EMBED element.<br />
<br />
TYPE=”hdf/volume”<br />
WIDTH=400<br />
HEIGHT=400><br />
Example 2: EMBED element usage.<br />
5.1 MPEG Data Compression<br />
The data transferred between the visu<strong>al</strong>ization servers and<br />
the clients consists of the exact byte streams computed by the<br />
servers, packaged in the XDR machine independent format.<br />
One way to reduce network transferring time would be to<br />
compress the data before delivery. We propose to use the<br />
MPEG compression technique, which will not only perform<br />
redundancy reduction, but <strong>al</strong>so a qu<strong>al</strong>ity-adjustable entropy<br />
reduction. Furthermore, the MPEG <strong>al</strong>gorithm performs<br />
MOSAIC<br />
INTER-CLIENT<br />
COMMUNICATION<br />
VISUALIZATION<br />
COMMANDS<br />
RENDERING<br />
REQUESTS<br />
PANEL<br />
IMAGE<br />
DATA<br />
VRSERVER(S)<br />
Figure 3: Communication among Mosaic, VIS<br />
and distributed rendering servers.<br />
VIS<br />
IMAGE<br />
SEGMENTS
interframe, beside intraframe, compression. Consequently,<br />
only the compressed difference between the current and the<br />
last frames is shipped to the client.<br />
5.2 Gener<strong>al</strong>ized Extern<strong>al</strong>-Application-to-Mosaic-Document-Page<br />
Display Interface<br />
The protocols specified in Table 1 are simple, and gener<strong>al</strong><br />
enough to <strong>al</strong>low most image-producing programs be modified<br />
to display in the Mosaic document page. We have successfully<br />
incorporated an in-house CAD model rendering program into<br />
Mosaic. Our next undertakings will be to extend the protein<br />
1<br />
2<br />
3<br />
4<br />
5<br />
Number of Servers<br />
128x128<br />
192x192<br />
256x256<br />
6<br />
7<br />
8<br />
9<br />
10<br />
11<br />
12<br />
database (PDB) displaying program, and the xv 2D image<br />
processing program, to create a Mosaic PDB visu<strong>al</strong>ization<br />
server, and a Mosaic 2D image processing server.<br />
5.3 Multiple Users<br />
With multiple users, the VIS/Mosaic distributed visu<strong>al</strong>ization<br />
system will need to manage the server resources, since<br />
multiple users utilizing the same computation<strong>al</strong> servers will<br />
slow the servers down significantly. The proposed solution is<br />
depicted in Fig 5. The server resource manager will <strong>al</strong>locate<br />
servers per VIS client request only if those servers are not<br />
Figure 4: Volume rendering performance for 128 2 , 192 2 , and 256 2 data sets .<br />
13<br />
14<br />
128x128<br />
192x192<br />
256x256<br />
12.00<br />
10.00<br />
8.00<br />
6.00<br />
4.00<br />
2.00<br />
0.00<br />
20.00<br />
18.00<br />
16.00<br />
14.00<br />
Volume Size<br />
Time (sec)
overloaded. Otherwise, negotiation between the resource<br />
manager and the VIS client will be necessary, and, perhaps the<br />
resource manager will <strong>al</strong>locate less busy <strong>al</strong>ternatives to the<br />
client.<br />
5.4 Load Distributing Algorithm<br />
Since the load distributing <strong>al</strong>gorithm in the current VIS<br />
implementation is not the most optim<strong>al</strong> load distribution<br />
solution, we expect to see some improvement in the future<br />
implementation, which will be using sender-initiated <strong>al</strong>gorithms,<br />
described in [Shivaratri].<br />
NETWORK<br />
BOUNDARY<br />
ENCODED<br />
IMAGE DATA<br />
NETWORK<br />
BOUNDARY<br />
6. Conclusions<br />
NETWORK<br />
BOUNDARY<br />
SERVER<br />
RESOURCE<br />
MANAGER<br />
REQUEST<br />
FOR SERVICE<br />
VISUALIZATION<br />
COMMANDS<br />
CLIENT<br />
VISUALIZATION<br />
PROCESSES<br />
VISUALIZATION<br />
SERVER<br />
PROCESS<br />
POOL<br />
Figure 5: Server Resource Management<br />
PROCESS<br />
ALLOCATION<br />
Our system takes the technology of networked multimedia<br />
system (especi<strong>al</strong>ly the World Wide Web) a step further by<br />
proving the possibility of adding new interactive data types to<br />
both the WWW servers and clients. The addition of the 3D<br />
volume data object in the form of an HDF file to the WWW<br />
has been welcomed by many medic<strong>al</strong> researchers, for it is now<br />
possible for them to view volume datasets without a high-cost<br />
workstation. Furthermore, these visu<strong>al</strong>izations can be accessed<br />
via the WWW, through hypertext and hypergraphics links<br />
within an HTML page. Future implementations of this<br />
approach using other types of embedded applications will<br />
<strong>al</strong>low the creation of a new paradigm for the online distribution<br />
of multimedia information via the Internet.<br />
7. References<br />
Argiro, V. “Seeing in Volume”, Pixel, July/August 1990, 35-<br />
39.<br />
Avila, R., Sobierajski, L. and Kaufman A., “Towards a Comprehensive<br />
Volume Visu<strong>al</strong>ization System”, Visu<strong>al</strong>ization<br />
’92 Proceedings, IEEE Computer<br />
Society Press, October 1992, 13-20.<br />
Andreessen, M., “NCSA Mosaic Technic<strong>al</strong> Summary”, from<br />
FTP site ftp.ncsa.uiuc.edu, 8 May 1993.<br />
Bloomer, J., “Power Programming with RPC”, O’Reilly &<br />
Associate, September 1992, 401-451.<br />
Brinkley, J.F., Eno, K., Sundsten, J.W., “Knowledge-based<br />
client-server approach to stuctur<strong>al</strong> information<br />
retriev<strong>al</strong>: the Digit<strong>al</strong> Anatomist Browser”, Computer<br />
methods and Programs in Biomedicine,<br />
Vol. 40, No. 2, June 1993, 131-145.<br />
Broering, N. C., “Georgetown University, The Virtu<strong>al</strong> Medic<strong>al</strong><br />
Library,” Computers in Libraries, Vol. 13,<br />
No. 2, February 1993, 13.<br />
Drebin, R. A., Carpenter, L. and Hanrahan, P., “Volume<br />
Rendering”, Computer Graphics, Vol. 22, No.<br />
4, August 1988, 64-75.<br />
Flanders, B., “Hypertext Multimedia Software: Bell Atlantic<br />
DocuSource”, Computers in Libraries, Vol 13,<br />
No. 1, January 1993, 35-39.<br />
Gelerg, L., “Volume Rendering in AVS5”, AVS Network<br />
news, Vol. 1, Issue 4, 11-14.<br />
Giertsen, C. and Petersen, J., “Par<strong>al</strong>lel Volume Rendering on<br />
a Network of Workstations”, IEEE Computer<br />
Graphics and Applications, November 1993,<br />
16-23.
Jäger, M., Osterfeld, U., Ackermann, H, and Hornung, C.,<br />
“Building a Multimedia ISDN PC”, IEEE Computer<br />
Graphics and Applications, September<br />
1993, 24-33.<br />
Kaufman, A., Cohen, D., and Yagel, R., “Volume Graphics”,<br />
Computer, July 1993, 51-64.<br />
Kiong B., and Tan, T., “A hypertext-like approach to navigating<br />
through the GCG sequence an<strong>al</strong>ysis package”,<br />
Computer Applications in the Biosciences,<br />
Vol. 9, No. 2, 1993, 211-214.<br />
Levoy, M., “Display of Surfaces from Volume Data”, IEEE<br />
Computer Graphics and Applications, Vol. 8,<br />
No. 5, May 1988, 29-37.<br />
Lorensen, W., Cline, H.E., “Marching Cubes: A High Resolution<br />
3D Surface Construction Algorithm”,<br />
Computer Graphics, Vol. 21, No. 4, July 1987,<br />
163-169.<br />
Mercurio, F., “Khoros”, Pixel, March/April 1992, 28-33.<br />
Narayan, S., Sensharrma D., Santori, E.M., Lee, A.A.,<br />
Sabherw<strong>al</strong>, A., Toga, A.W., “Animated visu<strong>al</strong>ization<br />
of a high resolution color three dimension<strong>al</strong><br />
digit<strong>al</strong> computer model of the whole<br />
human head”, Internation<strong>al</strong> Journ<strong>al</strong> of Bio-<br />
Medic<strong>al</strong> Computing, Vol 32, No. 1, January<br />
1993, 7-17.<br />
Nickerson, G., “WorldWideWeb Hypertext from CERN”,<br />
Computers in Libraries, Vol. 12, No. 11, December<br />
1992, 75-77.<br />
Obraczka, K., Danzig, P, and Li, S., “Internet Resource<br />
Discovery Services”, Computer, Vol. 26, No. 9,<br />
September 1993, 8-22.<br />
Pommert, A., Riemer, M., Schiemann, T., Schubert. R.,<br />
Tiede, U., Hoehne, K-H, “Methods and Applications<br />
of Medic<strong>al</strong> 3D-Imaging”, SIGGRAPH<br />
93 course notes for volume visulization, 68-97.<br />
Robison, D., “The Changing States of Current Cites: The<br />
Evolution of an Electronic Journ<strong>al</strong>”, Computers<br />
in Libraries, Vol. 13, No. 6, June 1993, 21-26.<br />
Shivaratri, N.G., Krueger, P., and Singh<strong>al</strong>, M., “Load Distributing<br />
for Loc<strong>al</strong>ly Distributed Systems”, Computer,<br />
December 1992, 33-44.<br />
Singh. J, Hennessy, J. and Gupta A., “Sc<strong>al</strong>ing Par<strong>al</strong>lel Programs<br />
for Multiprocessors: Methodology and<br />
Examples”, Computer, July 1993, 42-49.<br />
Story, G., O’Gorman, L., Fox. D, Schaper, L. and Jagadish,<br />
H.V., “The RightPages Image-Based Electronic<br />
Library for Alerting and Browsing”, Computer,<br />
September 1992, 17-26.<br />
VandeWettering, M., “apE 2.0”, Pixel, November/December<br />
1990, 30-35.<br />
Woodward, P., “Interactive Scientific Visu<strong>al</strong>ization of Fluid<br />
Flow”, Computer, Vol. 26, No. 10, June 1993,<br />
13-25.<br />
Zandt, W.V., “A New ‘Inlook’ On Life”, UNIX Review, Vol<br />
7, No. 3, March 1989, 52-57.
Please reference the following QuickTime movie located in the MOV<br />
directory:<br />
CHEONG.MOV<br />
Copyright © 1994 by Cheong S. Ang, M.S.<br />
QuickTime is a trademark of Apple Computer, Inc.
VolVis: A Diversified Volume Visu<strong>al</strong>ization System<br />
Ricardo Avila ‡ ,Taosong He * ,Lichan Hong * ,Arie Kaufman * ,<br />
Hanspeter Pfister * ,Claudio Silva * ,Lisa Sobierajski * ,Sidney Wang *<br />
‡<br />
Howard Hughes Medic<strong>al</strong> Institute<br />
*<br />
Department of Computer Science<br />
State University of New York at Stony Brook State University of New York at Stony Brook<br />
Stony Brook, NY 11794-5230 Stony Brook, NY 11794-4400<br />
Abstract<br />
VolVis is a diversified, easy to use, extensible, high<br />
performance, and portable volume visu<strong>al</strong>ization system for<br />
scientists and engineers as well as for visu<strong>al</strong>ization<br />
developers and researchers. VolVis accepts as input 3D<br />
sc<strong>al</strong>ar volumetric data as well as 3D volume-sampled and<br />
classic<strong>al</strong> geometric models. Interaction with the data is<br />
controlled by a variety of 3D input devices in an input<br />
device-independent environment. VolVis output includes<br />
navigation preview, static images, and animation<br />
sequences. A variety of volume rendering <strong>al</strong>gorithms are<br />
supported, ranging from fast rough approximations, to<br />
compression-domain rendering, toaccurate volumetric ray<br />
tracing and radiosity, and irregular grid rendering.<br />
1. Introduction<br />
The visu<strong>al</strong>ization of volumetric data has aided many<br />
scientific disciplines ranging from geophysics to the<br />
biomedic<strong>al</strong> sciences. The diversity of these fields coupled<br />
with a growing reliance on visu<strong>al</strong>ization has spawned the<br />
creation of a number of speci<strong>al</strong>ized visu<strong>al</strong>ization systems.<br />
These systems are usu<strong>al</strong>ly limited by machine and data<br />
dependencies and are typic<strong>al</strong>ly not flexible or extensible.<br />
Afew visu<strong>al</strong>ization systems have attempted to overcome<br />
these dependencies (e.g., AVS, SGI Explorer, Khoros) by<br />
taking a data-flow approach. However, the added<br />
computation<strong>al</strong> costs associated with data-flow systems<br />
results in poor performance. In addition, these systems<br />
require that the scientist or engineer invest a large amount<br />
of time understanding the capabilities of each of the<br />
computation<strong>al</strong> modules and how toeffectively link them<br />
together.<br />
VolVis is a volume visu<strong>al</strong>ization system that unites<br />
numerous visu<strong>al</strong>ization methods within a comprehensive<br />
visu<strong>al</strong>ization system, providing a flexible tool for the<br />
scientist and engineer as well as the visu<strong>al</strong>ization<br />
developer and researcher. The VolVis system has been<br />
designed to meet the following key objectives:<br />
Diversity: VolVis supplies a wide range of<br />
function<strong>al</strong>ity with numerous methods provided within each<br />
function<strong>al</strong> component. For example, VolVis provides<br />
various projection methods including ray casting, ray<br />
tracing, radiosity, Marching Cubes, and splatting.<br />
Ease of use: The VolVis user interface is organized<br />
into function<strong>al</strong> components, providing an easy to use<br />
visu<strong>al</strong>ization system. One advantage of this approach over<br />
data-flow systems is that the user does not have to learn<br />
how tolink numerous modules in order to perform a task.<br />
Extensibility: The structure of the VolVis system is<br />
designed to <strong>al</strong>low avisu<strong>al</strong>ization programmer to easily add<br />
new representations and <strong>al</strong>gorithms. For this purpose, an<br />
extensible and hierarchic<strong>al</strong> abstract model was developed<br />
[1] which contains definitions for <strong>al</strong>l objects in the system.<br />
Portability: The VolVis system, written in C, is<br />
highly portable, running on most Unix workstations<br />
supporting X/Motif. The system has been tested on Silicon<br />
Graphics, Sun, Hewlett-Packard, Digit<strong>al</strong> Equipment<br />
Corporation, and IBM workstations and PCs.<br />
Freely available: The high cost of most<br />
visu<strong>al</strong>ization systems and difficulties in obtaining their<br />
source code often lead researchers to write their own tools<br />
for specific visu<strong>al</strong>ization tasks. VolVis is freely available as<br />
source code.<br />
2. System Overview<br />
Figure 1 shows the VolVis pipeline, indicating some<br />
paths that input data could take through the VolVis system<br />
in order to produce visu<strong>al</strong>ization output. Two of the basic<br />
input data classes of VolVis are volumetric data and 3D<br />
geometric data. The input data is processed by the<br />
Modeling and Filtering components of the system to<br />
produce either a 3D volume model or a 3D geometric<br />
surface model of the data. For example, geometric data can<br />
be converted into a volume model by the Modeling<br />
component of the system, as described in Section 3, to<br />
<strong>al</strong>low for volumetric graphic operations. A geometric<br />
surface model can be created from a volume model by the<br />
process of surface extraction.
Key:<br />
3D Sc<strong>al</strong>ar Field<br />
Volumetric<br />
Model<br />
Input Data<br />
Intern<strong>al</strong> Data<br />
Output<br />
Visu<strong>al</strong>ization<br />
Action<br />
Modeling<br />
&<br />
Filtering<br />
Surface<br />
Extraction<br />
Measurement<br />
Manipulation<br />
Environment<br />
Rendering<br />
Image Animation<br />
Figure 1:The VolVis pipeline.<br />
3D Geometric<br />
Objects<br />
Geometric<br />
Surface Model<br />
Virtu<strong>al</strong> Input<br />
Device<br />
Input Device<br />
Abstraction<br />
Physic<strong>al</strong> Input<br />
Device<br />
Navigation<br />
Preview<br />
The Measurement component can be used to obtain<br />
quantitative information from the data models. Surface<br />
area, volume, histogram and distance information can be<br />
extracted from volumes using one of sever<strong>al</strong> methods.<br />
Isosurface volume and surface area measurements can be<br />
taken either on an entire volume or on a surface-tracked<br />
section. Addition<strong>al</strong>ly, surface areas and volumes can be<br />
computed using either a simple non-interpolated voxel<br />
counting method or a Marching Cubes [8] based<br />
measurement method. For geometric surface models,<br />
surface area, volume, and distance measurements can be<br />
performed.<br />
Most of the interaction in VolVis occurs within the<br />
Manipulation component of the system. This part of the<br />
system <strong>al</strong>lows the user to modify object parameters such as<br />
color, texture, and segmentation, and viewing parameters<br />
such as image size and field of view. Within the<br />
Navigation section of the Manipulation component, the<br />
user can interactively modify the position and orientation<br />
of the volumes, the light sources, and the view. This is<br />
closely connected to the Animation section of the<br />
Manipulation component, which <strong>al</strong>lows the user to specify<br />
animation sequences either interactively or with a set of<br />
transformations to be applied to objects in the scene. The<br />
Manipulation component is described in Section 4.<br />
The Rendering component encompasses sever<strong>al</strong><br />
different rendering <strong>al</strong>gorithms, including geometry-based<br />
techniques such as Marching Cubes, glob<strong>al</strong> illumination<br />
methods such as ray tracing and radiosity, and direct<br />
volume rendering <strong>al</strong>gorithms such as splatting. The<br />
Rendering component is described in Section 5.<br />
The Input Device component of the system maps<br />
physic<strong>al</strong> input device data into a device independent<br />
representation that is used by various <strong>al</strong>gorithms requiring<br />
user interaction. As a result, the VolVis system is input<br />
device independent, as described in Section 6.<br />
3. Modeling<br />
Aprimary responsibility of the Modeling component<br />
is the voxelization of geometric data into volumetric model<br />
representations. Voxelizing a continuous model into a<br />
volume raster of voxels requires a geometric<strong>al</strong> sampling<br />
process which determines the v<strong>al</strong>ues to be assigned to<br />
voxels of the volume raster. To reduce object space<br />
<strong>al</strong>iasing, we adopt a volume sampling technique [14] that<br />
estimates the density contribution of the geometric objects<br />
to the voxels. The density of a voxel is determined by a<br />
filter weight function which is proportion<strong>al</strong> to the distance<br />
between the center of the voxel and the geometric<br />
primitive. Inour implementation, precomputed tables of<br />
densities for a predefined set of geometric primitives are<br />
used to assign the density v<strong>al</strong>ue of each voxel. For each<br />
voxel visited by the voxelization <strong>al</strong>gorithm, the distance to<br />
the predefined primitive is used as an index into the tables.<br />
Figure 2:Avolumetric ray traced image of a volumesampled<br />
geometric wine bottle and glasses.
Since the voxelized geometric objects are<br />
represented as volume rasters of density v<strong>al</strong>ues, we can<br />
essenti<strong>al</strong>ly treat them as sampled or simulated volume data<br />
sets, such as 3D medic<strong>al</strong> imaging data sets, and employ<br />
one of many volume rendering techniques for image<br />
generation. One advantage of this approach is that volume<br />
rendering carries the smoothness of the volume-sampled<br />
objects from object space over into image space. Hence,<br />
the silhouette of the objects, reflections, and shadows are<br />
smooth. Furthermore, by not performing any geometric<br />
ray-object intersections or geometric surface norm<strong>al</strong><br />
c<strong>al</strong>culations, a large amount of rendering time is saved. In<br />
addition, CSG operations between two volume-sampled<br />
geometric models are accomplished at the voxel level<br />
during voxelization, thereby reducing the origin<strong>al</strong> problem<br />
of ev<strong>al</strong>uating a CSG tree of such operations down to a<br />
Boolean operation between pairs of voxels. Figure 2<br />
shows a ray traced image of a wine bottle and glasses that<br />
were modeled by CSG operations on volume-sampled<br />
geometric objects. The upper right window inFigure 3<br />
shows a ray traced image of a nut and bolt that were <strong>al</strong>so<br />
modeled by CSG operations.<br />
Figure 3:Anexample VolVis session. The nut and bolt<br />
are volume-sampled geometric models.<br />
4. Manipulation<br />
The Manipulation component of VolVis consists of<br />
three sections: the Object Control section, the Navigation<br />
section, and the Animation section. The Navigation and<br />
Animation sections are <strong>al</strong>so referred to as the Navigator<br />
and Animator, respectively. Both the Navigator and<br />
Animator produce output visu<strong>al</strong>ization, shown in Figure 1<br />
as Navigation Preview and Animation, respectively.<br />
The Object Control section of the system is<br />
extensive, <strong>al</strong>lowing the user to manipulate parameters of<br />
the objects in the scene. This includes modifications to the<br />
color, texture, and shading parameters of each volume, as<br />
well as more complex operations such as positioning of cut<br />
planes and data segmentation. The color and position of<br />
<strong>al</strong>l light sources can be interactively manipulated by the<br />
user. Also, viewing parameters, such as the fin<strong>al</strong> image<br />
size, and glob<strong>al</strong> parameters, such as ambient lighting and<br />
the background color, can be modified.<br />
The Navigator <strong>al</strong>lows the user to interactively<br />
manipulate objects within the system. The user can<br />
translate, sc<strong>al</strong>e and rotate <strong>al</strong>l volumes and light sources, as<br />
well as the view itself. The Navigator can <strong>al</strong>so be used to<br />
interactively manipulate the view inamanner similar to a<br />
flight simulator. Toprovide interactive navigation speed, a<br />
fast rendering <strong>al</strong>gorithm was developed which involves<br />
projecting reduced resolution representations of <strong>al</strong>l objects<br />
in the scene. This task is relatively simple for geometric<br />
objects, where c<strong>al</strong>culating, storing, and projecting a<br />
polygon<strong>al</strong> approximation requires little overhead.<br />
However, when considering a volumetric isosurface the<br />
cost of an addition<strong>al</strong> representation increases considerably.<br />
Asimple and memory efficient method available within<br />
the Navigator creates a reduced resolution representation<br />
of an isosurface by uniformly subdividing the volume into<br />
boxes and projecting the outer faces of <strong>al</strong>l the boxes that<br />
contain a portion of the isosurface. These subvolumes<br />
serve adu<strong>al</strong> purpose in that they are <strong>al</strong>so used by the<br />
PARC (Polygon Assisted Ray Casting) acceleration<br />
method [1] during ray casting and ray tracing.<br />
Although the PARC subvolume representation can<br />
be stored as a compact list of subvolume indices, the<br />
resulting images are boxy and uninformative for many data<br />
sets. To overcome this problem, another method is<br />
provided which utilizes a reduced resolution Marching<br />
Cubes representation of an isosurface. In order to reduce<br />
the amount of data required for this representation, edge<br />
intersections used to compute triangle vertices are<br />
restricted to one of four possible locations. This results in<br />
much smoother images which are typic<strong>al</strong>ly more<br />
informative than the uniform subdivision method. The<br />
Navigator <strong>al</strong>so supports the other VolVis rendering<br />
techniques that are described in Section 5, <strong>al</strong>though<br />
interactive projection rates with these methods can be<br />
achieved only on high-end workstations.<br />
The Animator <strong>al</strong>so <strong>al</strong>lows the user to specify<br />
transformations to be applied to objects within the scene,<br />
but asopposed to the Navigator which is used to apply a<br />
single transformation at a time, the Animator can be used<br />
to specify a sequence of transformations to produce an<br />
animation. The user can preview the animation using one<br />
of the fast rendering techniques within the Navigator. The<br />
user can then select a more accurate and time consuming<br />
rendering technique, such as volumetric ray tracing, to
create a high qu<strong>al</strong>ity animation. In addition to simple<br />
rotation, translation and sc<strong>al</strong>ing animations, the Navigator<br />
can be used to interactively specify a ‘‘flight path’’, which<br />
can then be passed to the Animator, and rendered to create<br />
an animation.<br />
An example session of the VolVis system is shown in<br />
Figure 3. The long window onthe left is the main VolVis<br />
interface window, with buttons for each of the major<br />
components of the system. The current scene is displayed<br />
in the Navigator window onthe left, and in the Rendering<br />
image window onthe right. A low resolution Marching<br />
Cubes technique was used in the Navigator, while a ray<br />
casting technique using the PARC acceleration method<br />
was employed during rendering.<br />
5. Rendering<br />
Rendering is one of the most important and<br />
extensive components of the VolVis system. For the user,<br />
speed and accuracy are both important, yet often<br />
conflicting aspects of the rendering process. For this<br />
reason, a variety of rendering techniques have been<br />
implemented within the VolVis system, ranging from the<br />
fast, rough approximation of the fin<strong>al</strong> image, to the<br />
comparatively slow, accurate rendering within a glob<strong>al</strong><br />
illumination model. Also, each rendering <strong>al</strong>gorithm itself<br />
supports sever<strong>al</strong> levels of accuracy, giving the user an even<br />
greater amount of control. In this section, a few ofthe<br />
rendering techniques developed for the VolVis system are<br />
discussed.<br />
Tw o of the VolVis rendering techniques, volumetric<br />
ray tracing, and volumetric radiosity, are built upon glob<strong>al</strong><br />
illumination models. Standard volume rendering<br />
techniques, which are <strong>al</strong>so supported by VolVis, typic<strong>al</strong>ly<br />
employ only a loc<strong>al</strong> illumination model for shading, and<br />
therefore produce images without glob<strong>al</strong> effects. Including<br />
aglob<strong>al</strong> illumination model within a visu<strong>al</strong>ization system<br />
has sever<strong>al</strong> advantages. First, glob<strong>al</strong> effects can often be<br />
desirable in scientific applications. For example, by<br />
placing mirrors in the scene, a single image can show<br />
sever<strong>al</strong> views of an object in a natur<strong>al</strong>, intuitive manner<br />
leading to a better understanding of the 3D nature of the<br />
scene. Also, complex surfaces are often easier to render<br />
when represented volumetric<strong>al</strong>ly than when represented by<br />
high-order functions or geometric primitives, as described<br />
in Section 3. Volumetric ray tracing is described in<br />
Section 5.1 and volumetric radiosity is discussed in<br />
Section 5.2.<br />
In order to reduce the large storage and transmission<br />
overhead as well as the volume rendering time for<br />
volumetric data sets, a data compression technique is<br />
incorporated into the VolVis system. This technique <strong>al</strong>lows<br />
volume rendering to be directly performed on the<br />
compressed data and is described in Section 5.3.<br />
Although many scanning devices create data sets<br />
that are inherently rectilinear, this restriction poses<br />
problems for fields in which an irregular data<br />
representation is necessary. These fields include<br />
computation<strong>al</strong> fluid dynamics, finite element an<strong>al</strong>ysis, and<br />
meteorology. Therefore, support was added for irregularly<br />
gridded data formats in the VolVis system, as discussed in<br />
Section 5.4.<br />
5.1. Volumetric Ray Tracing<br />
The volumetric ray tracer provided within the VolVis<br />
system is intended to produce accurate, informative images<br />
[11]. In classic<strong>al</strong> ray tracing, the rendering <strong>al</strong>gorithm is<br />
designed to generate images that are accurate according to<br />
the laws of optics. In VolVis, the ray tracer must handle<br />
classic<strong>al</strong> geometric objects as well as volumetric data, and<br />
strict adherence to the laws of optics is not <strong>al</strong>ways<br />
desirable. For example, a scientist may wish to view the<br />
maximum v<strong>al</strong>ue <strong>al</strong>ong the segment of a ray passing<br />
through a volume, instead of the optic<strong>al</strong>ly-correct<br />
composited v<strong>al</strong>ue. Figure 4 illustrates the importance of<br />
including glob<strong>al</strong> effects in a maximum-v<strong>al</strong>ue projection of<br />
a hippocamp<strong>al</strong> pyramid<strong>al</strong> neuron data set which was<br />
obtained using a laser-scanning confoc<strong>al</strong> microscope.<br />
Since maximum-v<strong>al</strong>ue projections do not give depth<br />
information, a floor is placed below the cell, and a light<br />
source above the cell. This results in a shadow ofthe cell<br />
on the floor, adding back the depth information lost by the<br />
maximum-v<strong>al</strong>ue projection.<br />
In order to incorporate both geometric and<br />
volumetric objects into one scene, the classic<strong>al</strong> ray tracing<br />
intensity equation, which is ev<strong>al</strong>uated only at surface<br />
locations, must be extended to include volumetric effects.<br />
The intensity of light, Iλ(x, →<br />
ω ), for a given wav elength λ,<br />
arriving at a position x, from the direction →<br />
ω , can be<br />
computed by:<br />
I λ(x, →<br />
ω ) = I vλ(x, x′) + τ λ(x, x′)I sλ(x′, →<br />
ω )<br />
where x′ is the first surface intersection point encountered<br />
<strong>al</strong>ong the ray →<br />
ω originating at x. Isλ(x′, →<br />
ω )isthe intensity<br />
of light at this surface location, and can be computed with<br />
a standard ray tracing illumination equation [15].<br />
Ivλ(x, x′) isthe volumetric contribution to the intensity<br />
<strong>al</strong>ong the ray from x to x′, and τ λ(x, x′) isthe attenuation<br />
of Isλ(x′, →<br />
ω )byany intervening volumes. These v<strong>al</strong>ues are<br />
determined using volume rendering techniques, based on a<br />
transport theory model of light propagation [7]. The basic<br />
idea is similar to classic<strong>al</strong> ray tracing, in that rays are cast<br />
from the eye into the scene, and surface shading is<br />
performed on the closest surface intersection point. The<br />
(1)
difference is that shading must be performed for <strong>al</strong>l<br />
volumetric data that are encountered <strong>al</strong>ong the ray while<br />
traveling to the closest surface intersection point.<br />
Figure 4:Avolumetric ray traced image of a cell using<br />
amaximum-v<strong>al</strong>ue projection.<br />
For photo-re<strong>al</strong>istic rendering, the user typic<strong>al</strong>ly<br />
wants to include <strong>al</strong>l of the shading effects that can be<br />
c<strong>al</strong>culated within a given time limit. However,<br />
visu<strong>al</strong>ization users may find it necessary to view<br />
volumetric data with no shading effects, such as when<br />
using a maximum-v<strong>al</strong>ue projection. In VolVis, the user has<br />
control over the illumination equations for both volumetric<br />
and geometric objects, and can specify, for each object in<br />
the scene, which shading effects should be computed. For<br />
example, in Figure 4 no shading effects were included for<br />
the maximum-v<strong>al</strong>ue projection of the cell, while <strong>al</strong>l parts<br />
of the illumination equation were considered when shading<br />
the geometric polygon. In another example, the user may<br />
place a mirror behind a volumetric object in a scene in<br />
order to capture two views in one image, but may not want<br />
the volumetric object to cast a shadow onthe mirror, as<br />
shown in Figure 5. The head was obtained using magnetic<br />
resonance imaging, with the brain segmented from the<br />
same data set. The mirror is a volume-sampled polygon<br />
that was created using the modeling technique described in<br />
Section 3.<br />
5.2. Volumetric Radiosity<br />
The ray tracing <strong>al</strong>gorithm described in the previous<br />
section can be used to capture specular interactions<br />
between objects in a scene. In re<strong>al</strong>ity, most scenes are<br />
dominated by diffuse interactions, which are not accounted<br />
for in the standard ray tracing illumination model. For this<br />
reason, VolVis <strong>al</strong>so contains a radiosity <strong>al</strong>gorithm for<br />
volumetric data. Volumetric radiosity includes the<br />
classic<strong>al</strong> surface ‘‘patch’’ element as well as a ‘‘voxel’’<br />
element. As opposed to previous methods that use<br />
participating media to augment geometric scenes [10], this<br />
method is intended to render scenes that may solely consist<br />
of volumetric data. Each patch or voxel element can emit,<br />
absorb, scatter, and transmit light. Both isotropic and<br />
diffuse emission and scattering of light are <strong>al</strong>lowed, where<br />
‘‘isotropic’’ implies direction<strong>al</strong> independence, and<br />
‘‘diffuse’’ implies Lambertian reflection (i.e., dependent on<br />
norm<strong>al</strong> or gradient). Light entering an element that is not<br />
absorbed or scattered by the element is transmitted<br />
unchanged.<br />
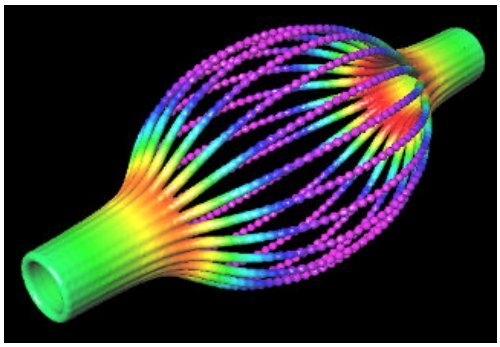
Figure 5:Avolumetric ray traced image of a human head.<br />
In order to cope with the high number of voxel<br />
interactions required, a hierarchic<strong>al</strong> technique similar to<br />
[5] is used. An iterative <strong>al</strong>gorithm [2] is then used to shoot<br />
voxel radiosities, where sever<strong>al</strong> factors govern the highest<br />
level inthe hierarchy atwhich two voxels can interact.<br />
These factors include the distance between the two voxels,<br />
the radiosity of the shooting voxel, and the reflectance and<br />
scattering coefficients of the voxel receiving the radiosity.<br />
This hierarchic<strong>al</strong> technique can reduce the number of<br />
interactions required to converge onasolution by more<br />
than four orders of magnitude.<br />
After the view-independent radiosities have been<br />
c<strong>al</strong>culated, a view-dependent image is generated using a<br />
ray casting technique, where the fin<strong>al</strong> pixel v<strong>al</strong>ue is<br />
determined by compositing radiosity v<strong>al</strong>ues <strong>al</strong>ong the ray.<br />
Figure 6 shows a scene containing a volumetric sphere,<br />
polygon, and light source. The light source isotropic<strong>al</strong>ly<br />
emits light, and both the sphere and the polygon diffusely<br />
reflect light. The light source is above the sphere and<br />
directly illuminates the top h<strong>al</strong>f of the sphere. The bottom<br />
h<strong>al</strong>f of the sphere is indirectly illuminated by light<br />
diffusely reflected from the red polygon.
5.3. Compression Domain Volume Rendering<br />
Another rendering method incorporated in VolVis is<br />
adata compression technique for volume rendering. Our<br />
volume compression technique is a 3D gener<strong>al</strong>ization of<br />
the JPEG still image compression <strong>al</strong>gorithm [13] , with<br />
one important exception: the transform is a discrete Fourier<br />
transform rather than a discrete cosine transform. The<br />
origin<strong>al</strong> 3D data is subdivided into M×M×M subcubes,<br />
where each subcube is Fourier transformed to the<br />
frequency domain through a 3D discrete Fourier transform.<br />
Each of the 3D Fourier coefficients in each subcube is then<br />
quantized, and the resulting 3D quantized frequency<br />
coefficients are organized as a linear sequence through a<br />
3D zig-zag order. The resulting sequence of Fourier<br />
transform coefficients is then fed into an entropy encoder<br />
that consists of run-length coding and Huffman coding.<br />
Figure 6: A volumetric radiosity projection of a<br />
voxelized sphere and polygon.<br />
To render in the compressed domain, we use a new<br />
class of volume rendering <strong>al</strong>gorithms [3, 9, 12] that are<br />
based on the Fourier projection slice theorem. It states that<br />
aprojection of the 3D data volume from a certain direction<br />
can be obtained by extracting a 2D slice perpendicular to<br />
the view direction out of the 3D Fourier spectrum and then<br />
applying an inverse Fourier transform. In our approach we<br />
apply the Fourier projection slice theorem to each subcube<br />
in the Fourier domain, which results in a set of 2D planes<br />
in the spati<strong>al</strong> domain c<strong>al</strong>led subimages that are composited<br />
using spati<strong>al</strong> compositing to get the fin<strong>al</strong> projection of the<br />
origin<strong>al</strong> 3D data set.<br />
Using our compression-domain rendering approach,<br />
we were able to achieve high compression ratios while<br />
maintaining image qu<strong>al</strong>ity. Figure 7 shows a CT scan of a<br />
lobster that was rendered in the compressed domain.<br />
We are currently investigating the adaptation of<br />
subcube sizes to various spati<strong>al</strong> or frequency domain<br />
criteria, such as subcube AC coefficient energy, which is a<br />
measure of subcube activity, sample density, and<br />
coefficient distribution.<br />
Figure 7: Compression domain volume rendering of a<br />
lobster.<br />
5.4. Irregular Grid Rendering<br />
An intuitive way to visu<strong>al</strong>ize irregularly gridded data<br />
sets is to resample the data into a regular grid format.<br />
Unfortunately, it is quite difficult to find a resampling<br />
method that preserves details yet does not require a large<br />
amount of memory. Consequently, wechose to extend the<br />
tradition<strong>al</strong> volume rendering <strong>al</strong>gorithms to process the<br />
irregularly gridded data directly. For example, we have<br />
extended the ray tracing <strong>al</strong>gorithms in VolVis to visu<strong>al</strong>ize<br />
data represented in a spheric<strong>al</strong> coordinate system, with<br />
grids that are unevenly spaced in r, evenly spaced in θ ,and<br />
unevenly spaced in φ. When rendering, we could cast rays<br />
into the scene, uniformly stepping and compositing <strong>al</strong>ong<br />
each ray. A problem with uniform stepping is that it<br />
inevitably misses detailed information. To avoid this<br />
problem, we traverse the ray cell by cell in the volume, in a<br />
method similar to Garrity [4].<br />
6. Input Devices<br />
The Input Device component of the VolVis system<br />
<strong>al</strong>lows the user to control a variety of input devices in an<br />
input device independent environment. For example, to<br />
control the Navigator, the user can utilize a variety of<br />
physic<strong>al</strong> input devices such as a keyboard, a mouse, a<br />
Spaceb<strong>al</strong>l, and a DataGlove. To achieve this, we have<br />
developed the device unified interface (DUI) [6], which is<br />
a gener<strong>al</strong>ized and easily expandable protocol for<br />
communication between applications and input devices.
The key idea of the DUI is to convert raw data<br />
received from different input sources into unified format<br />
parameters of a ‘‘virtu<strong>al</strong> input device’’. Depending on the<br />
requirements of the application, the parameters may<br />
include a number of 3D positions and orientations as well<br />
as abstract actions. The abstract actions include direct and<br />
simple actions like mouse or Spaceb<strong>al</strong>l button clicks , and<br />
complex dynamic actions like two hand gestures or ‘‘snapdragging’’.<br />
The conversion from the re<strong>al</strong> device operations<br />
to abstract actions is performed by the selected simulation<br />
methods which are incorporated into the DUI.<br />
The most important advantage of employing the<br />
virtu<strong>al</strong> input device paradigm is input device<br />
independence. In the DUI, each application is interactively<br />
assigned a virtu<strong>al</strong> input device, whose configuration is <strong>al</strong>so<br />
interactively decided. Modification of either the input<br />
device component or the application does not affect other<br />
parts of the system. The simulation methods used to<br />
convert different kinds of raw information into the unified<br />
format are often difficult to design. For example, the<br />
recognition of dynamic gestures of a DataGlove is fairly<br />
difficult. By using the DUI, new simulation methods can<br />
be easily incorporated and tested with no adverse effect on<br />
the application or the other parts of the Input Device<br />
component.<br />
However, in order to fully utilize the capability of<br />
different devices, a virtu<strong>al</strong> input device should not tot<strong>al</strong>ly<br />
hide the device dependent information since different<br />
devices are suitable for different applications. For<br />
example, it is harder to control the Navigator with the<br />
Spaceb<strong>al</strong>l than with the DataGlove, since the six degrees of<br />
freedom provided by the Spaceb<strong>al</strong>l are not entirely<br />
independent as they are in the DataGlove. Inthe DUI, a<br />
device information-base is associated with each virtu<strong>al</strong><br />
input device. All of the device dependent information<br />
related to a virtu<strong>al</strong> device is classified and stored in an<br />
abstract form, which is then queried by an application<br />
when necessary [6].<br />
We are currently working on the expansion of the<br />
DUI into a gener<strong>al</strong>-purpose interaction model. The model<br />
is created based on lightweight threads and is designed to<br />
handle simultaneous high bandwidth, multimod<strong>al</strong>, and<br />
complex input from multiple users, even through the<br />
network. A gener<strong>al</strong> abstract action and input device<br />
description language is <strong>al</strong>so being studied.<br />
7. Implementation<br />
Tw o major concerns during the implementation of<br />
VolVis have been to ensure that the system could be<br />
expanded to include new function<strong>al</strong>ity and techniques, and<br />
that the system would be relatively easy to port to new<br />
platforms. Therefore, the development of the VolVis<br />
system required the creation of a comprehensive, flexible,<br />
and extensible abstract model [1]. The model is organized<br />
hierarchic<strong>al</strong>ly, beginning with low-level building blocks<br />
which are then used to construct higher-level structures.<br />
For example, low-level objects such as vectors and points<br />
can be combined to create a coordinate system, while at<br />
the highest level the World structure contains the state of<br />
ev ery object in the system. The World structure includes<br />
Lights, Volumes, Views, glob<strong>al</strong> cut planes, and glob<strong>al</strong><br />
shading parameters. Each Volume structure includes color<br />
and texture information, loc<strong>al</strong> shading parameters, loc<strong>al</strong><br />
cut planes, and data which may be either geometric<br />
descriptions, or rectilinear or irregularly gridded data.<br />
The abstract model is flexible in that a structure can<br />
assume one of many representations. For instance, a<br />
segmentation structure can consist of either a threshold or<br />
opacity and color transfer functions. A natur<strong>al</strong><br />
consequence of flexibility is expandability. Since the<br />
objects in the abstract model <strong>al</strong>ready provide for numerous<br />
representations, the addition of a new segmentation type,<br />
shading type, or even data type is fairly simple.<br />
The VolVis system requires only Unix and X/Motif<br />
to run. Unfortunately, only simple two-dimension<strong>al</strong><br />
graphics operations are supported in X. Therefore, <strong>al</strong>l<br />
viewing transformations, shading, and hidden surface<br />
remov<strong>al</strong> must be done in software. This greatly reduces the<br />
rendering speed for the geometry-based projection routines<br />
used in the Navigation section, and therefore <strong>al</strong>so reduces<br />
the over<strong>al</strong>l interactivity of the system. Since many Unix<br />
workstations now include graphics hardware, interactivity<br />
can be maintained by utilizing the graphics language of the<br />
workstation. To avoid rewriting large sections of the code,<br />
we have dev eloped a library of basic graphics functions<br />
that are used throughout the VolVis code. This simplifies<br />
the process of porting the system to a new workstation that<br />
has a different graphics language, since only the graphics<br />
function library must be rewritten.<br />
8. Conclusions<br />
The VolVis system for volume visu<strong>al</strong>ization has been<br />
used for many tasks in diverse applications and situations.<br />
First, VolVis has been used to test new <strong>al</strong>gorithms for<br />
rendering, modeling, animation generation, and computerhuman<br />
interaction. Due to the flexible nature of the<br />
abstract model, testing new ideas within the system is<br />
much easier and less time consuming than writing a new<br />
application for each new <strong>al</strong>gorithm. VolVis has <strong>al</strong>so been<br />
used by scientists and researchers in many different areas.<br />
For example, neurobiologists have used VolVis to navigate<br />
through the complex dendritic paths of nerve cells, which
is extremely useful since the function of nerve cells is<br />
closely tied to their structure (see Figure 4).<br />
VolVis is a rapidly growing system, with new plans<br />
for future development continu<strong>al</strong>ly being considered.<br />
Since the system is currently being used by many research<br />
labs and visu<strong>al</strong>ization developers, feedback from these<br />
sources is used to make future versions of the system<br />
easier to use and extend. To increase portability, auserinterface<br />
library, similar to the graphics function library<br />
described in the previous section, is being developed to<br />
<strong>al</strong>low VolVis to be easily ported to new windowing<br />
systems.<br />
9. Acknowledgements<br />
VolVis development has been supported by the<br />
Nation<strong>al</strong> Science Foundation under grant CCR-9205047,<br />
Department of Energy under the PICS grant, Howard<br />
Hughes Medic<strong>al</strong> Institute, and the Center for<br />
Biotechnology. Data for Figure 4 is courtesy of Howard<br />
Hughes Medic<strong>al</strong> Institute, Stony Brook, NY. Data for<br />
Figure 5 is courtesy of Siemens, Princeton, NJ. Data for<br />
Figure 6 is courtesy of AVS, W<strong>al</strong>tham, MA.<br />
For information on how toobtain the VolVis system,<br />
send e-mail to volvis@cs.sunysb.edu.<br />
References<br />
1. R.S. Avila, L.M. Sobierajski, and A.E. Kaufman,<br />
“Tow ards a Comprehensive Volume Visu<strong>al</strong>ization<br />
System,” Visu<strong>al</strong>ization ’92 Proceedings, pp. 13-20<br />
(October 1992).<br />
2. M. F. Cohen, S. E. Chen, J. R. W<strong>al</strong>lace, and D. P.<br />
Greenberg, “A Progressive Refinement Approach to<br />
Fast Radiosity Image Generation,” Computer<br />
Graphics (Proc. SIGGRAPH) 22(4) pp. 75-84 (July<br />
1988).<br />
3. S. Dunne, S. Napel, and B. Rutt, “Fast Reprojection<br />
of Volume Data,” Proceedings of the 1st Conference<br />
on Visu<strong>al</strong>ization in Biomedic<strong>al</strong> Computing, pp.<br />
11-18 (1990).<br />
4. M. Garrity, “Raytracing Irregular Volume Data,” San<br />
Diego Workshop on Volume Visu<strong>al</strong>ization, Computer<br />
Graphics 24(5) pp. 35-40 (December 1990).<br />
5. P. Hanrahan, D. S<strong>al</strong>zman, and L. Aupperle, “A Rapid<br />
Hierarchic<strong>al</strong> Radiosity Algorithm,” Computer<br />
Graphics (Proc. SIGGRAPH) 25(4) pp. 197-206<br />
(July 1991).<br />
6. T. Heand A. Kaufman, “Virtu<strong>al</strong> Input Devices for<br />
3D Systems,” Visu<strong>al</strong>ization ’93 Proceedings, pp.<br />
142-148 IEEE Computer Society Press, (October<br />
1993).<br />
7. W. Krueger, “The Application of Transport Theory<br />
to Visu<strong>al</strong>ization of 3D Sc<strong>al</strong>ar Data Fields,”<br />
Computers in Physics, pp. 397-406 (July/August<br />
1991).<br />
8. W. E.Lorensen and H. E. Cline, “Marching Cubes:<br />
A High Resolution 3D Surface Construction<br />
Algorithm,” Computer Graphics (Proc. SIGGRAPH)<br />
21(4) pp. 163-169 (July 1987).<br />
9. T. M<strong>al</strong>zbender, “Fourier Volume Rendering,” ACM<br />
Tr ansactions on Graphics 12(3) pp. 233-250 (July<br />
1993).<br />
10. H. E. Rushmeier and K. E. Torrance, “The Zon<strong>al</strong><br />
Method For C<strong>al</strong>culating Light Intensities in the<br />
Presence of a Participating Medium,” Computer<br />
Graphics (Proc. SIGGRAPH) 21(4) pp. 293-306<br />
(July 1987).<br />
11. L.M. Sobierajski and A.E. Kaufman, “Volumetric<br />
Ray Tracing,” 1994 Symposium on Volume<br />
Visu<strong>al</strong>ization, ACM Press, (October 1994).<br />
12. T. Totsuka and M. Levo y, “Frequency Domain<br />
Volume Rendering,” Computer Graphics (Proc.<br />
SIGGRAPH), pp. 271-278 (1993).<br />
13. G. K. W<strong>al</strong>lace, “The JPEG Still Picture Compression<br />
Standard,” Communications of the ACM 34(4) pp.<br />
30-44 (April 1991).<br />
14. S.W. Wang and A.E. Kaufman, “Volume Sampled<br />
Voxelization of Geometric Primitives,” Visu<strong>al</strong>ization<br />
’93 Proceedings, pp. 78-84 IEEE Computer Society<br />
Press, (October 1993).<br />
15. T. Whitted, “An Improved Illumination Model for<br />
Shaded Display,” Communications of the ACM<br />
23(6) pp. 343-349 (June 1980).
Please reference the following QuickTime movies located in the MOV<br />
directory:<br />
MULTI_RO.MOV<br />
HEAD_CUT.MOV<br />
MAX_ROTA.MOV<br />
Copyright © 1994 by the Research Foundation of the State University of<br />
New York at Stony Brook<br />
QuickTime is a trademark of Apple Computer, Inc.
Abstract<br />
Swept surfaces and volumes are generated by moving<br />
a geometric model through space. Swept surfaces<br />
and volumes are important in many computer-aided<br />
design applications including geometric modeling,<br />
numeric<strong>al</strong> cutter path generation, and spati<strong>al</strong> path<br />
planning. In this paper we describe a numeric<strong>al</strong><br />
<strong>al</strong>gorithm to generate swept surfaces and volumes<br />
using implicit modeling techniques. The <strong>al</strong>gorithm is<br />
applicable to any geometric representation for which<br />
a distance function can be computed. The <strong>al</strong>gorithm<br />
<strong>al</strong>so treats degenerate trajectories such as self-intersection<br />
and surface singularity. We show applications<br />
of this <strong>al</strong>gorithm to maintainability design and<br />
robot path planning.<br />
Keywords: Computation<strong>al</strong> geometry, object modeling,<br />
geometric modeling, volume modeling, implicit<br />
modeling, sweeping.<br />
1.0 Introduction<br />
A swept volume is the space occupied by a geometric<br />
model as it travels <strong>al</strong>ong an arbitrary trajectory. A<br />
swept surface is the boundary of the volume. Swept<br />
surfaces and volumes play important roles in many<br />
computer-aided design applications including geometric<br />
modeling, numeric<strong>al</strong> control cutter path generation,<br />
and spati<strong>al</strong> path planning.<br />
In geometric modeling swept curves and surfaces<br />
are used to represent extrusion surfaces and surfaces<br />
of revolution [1][2]. More complex geometry can be<br />
generated by using higher order sweep trajectories<br />
and generating surfaces [3]. In robot motion planning,<br />
the swept volume can be used to ev<strong>al</strong>uate safe<br />
paths [4][5] or establish the footprint of a robot in a<br />
Implicit Modeling of<br />
Swept Surfaces and Volumes<br />
William J. Schroeder<br />
William E. Lorensen<br />
GE Corporate Research & Development<br />
Steve Linthicum<br />
GE Aircraft Engines<br />
workcell. Numeric<strong>al</strong> control path planning uses<br />
swept volumes to show the remov<strong>al</strong> of materi<strong>al</strong> by a<br />
tool [6].<br />
Swept surfaces and volumes can <strong>al</strong>so be applied to<br />
resolve maintainability issues that arise during the<br />
design of complex mechanic<strong>al</strong> systems. The<br />
designer needs to be able to create and visu<strong>al</strong>ize the<br />
accessibility and removability of individu<strong>al</strong> components<br />
of the system. Typic<strong>al</strong> questions related to<br />
maintainability include:<br />
• Can a mechanic remove the spark plugs?<br />
• Is there room for an improved power supply?<br />
• What is the impact on the maintenance of a system<br />
if new components are included?<br />
In maintenance design, the swept surface of the<br />
part to be removed is c<strong>al</strong>led the remov<strong>al</strong> envelope.<br />
The remov<strong>al</strong> envelope is the surface that a component<br />
generates as it moves <strong>al</strong>ong a safe and feasible<br />
remov<strong>al</strong> trajectory. A safe trajectory is one that a<br />
component can follow without touching other components<br />
of the system. A feasible trajectory is one<br />
that can be performed by a human. Lozano-Perez<br />
[7] c<strong>al</strong>ls the c<strong>al</strong>culation of safe trajectories the Findpath<br />
problem. Although this trajectory may be automatic<strong>al</strong>ly<br />
c<strong>al</strong>culated, restrictions on the trajectory’s<br />
degrees of freedom [8], or the geometry of the<br />
obstacles [9] prohibit practic<strong>al</strong> application to re<strong>al</strong>world<br />
mechanic<strong>al</strong> systems. The technique presented<br />
here assumes that a safe and feasible trajectory is<br />
<strong>al</strong>ready available. For our application, we rely on<br />
computer-assisted trajectory generation using commerci<strong>al</strong><br />
computer-aided design [10] or robot simulation<br />
software.<br />
In the next section we review related work on<br />
swept volumes and implicit modeling. Then we<br />
describe the <strong>al</strong>gorithm in detail <strong>al</strong>ong with a discus-
sion of error and time complexity. Examples from<br />
maintainability and robot motion simulation illustrate<br />
the effectiveness of the <strong>al</strong>gorithm in application.<br />
2.0 Background<br />
Literature from two fields: spati<strong>al</strong> path planning and<br />
implicit modeling contribute to swept volume generation.<br />
2.1 Path Planning<br />
Weld and Leu [11] present a topologic<strong>al</strong> treatment of<br />
swept volumes. They show that the representation of<br />
a swept volume in Rn generated from a n-dimension<strong>al</strong><br />
object is reduced to developing a geometric<br />
representation for the swept volume from its (n-1)boundary.<br />
However, they point out that the boundary<br />
and interior of the swept volume are not necessarily<br />
the union of the boundary and interior of the (n-1)boundary.<br />
That is, there may exist points on the<br />
boundary of the swept volume that are interior points<br />
of the (n-1)-boundary of the swept volume. Likewise,<br />
boundary points of the object may contribute to<br />
the interior of the swept volume. This unfortunate<br />
property of swept volumes limits convention<strong>al</strong> precise<br />
geometric modeling to restricted cases. Martin<br />
and Stephenson [12] recognize the importance of<br />
implicit surface models for envelope representation<br />
but seek to provide a closed solution. They present a<br />
theoretic<strong>al</strong> basis for computing swept volumes, but<br />
note that complicated sweeps may take an unre<strong>al</strong>istic<br />
amount of computer time.<br />
Wang and Wang [6] present a numeric<strong>al</strong> solution<br />
that uses a 3D z-buffer to compute a family of critic<strong>al</strong><br />
curves from a moving solid. They restrict the<br />
generating geometry to a convex set, an appropriate<br />
restriction for their numeric<strong>al</strong> control application.<br />
Other numeric<strong>al</strong> techniques include sweeping<br />
octrees[5]. Swept octrees produce very gener<strong>al</strong><br />
results at the cost of the <strong>al</strong>iasing effects due to octree<br />
modeling.<br />
2.2 Implicit Modeling<br />
An implicit model specifies a sc<strong>al</strong>ar field v<strong>al</strong>ue at<br />
each point in space. A variety of field functions are<br />
available depending on the application. Soft objects<br />
created for computer animation [13] use a field that<br />
is unity at a modeling point and drops to zero at a<br />
specified distance from the point. The variation of<br />
the fields is typic<strong>al</strong>ly a cubic polynomi<strong>al</strong>. Usu<strong>al</strong>ly<br />
these fields are represented on a regular sampling<br />
(i.e., volume) as described by Bloomenth<strong>al</strong> [15].<br />
Surface models are extracted using standard iso-surface<br />
techniques such as marching cubes [16]. If the<br />
field v<strong>al</strong>ues are distance functions to the closest point<br />
on the model, offset surfaces can be created by<br />
choosing a non-zero iso-surface v<strong>al</strong>ue [14].<br />
3.0 Algorithm<br />
The go<strong>al</strong> of the <strong>al</strong>gorithm can be described as follows.<br />
Given a geometric model and a trajectory<br />
defined by a sequence of continuous transformations,<br />
generate the swept volume, the volume occupied as<br />
the model travels <strong>al</strong>ong the trajectory, and the swept<br />
surface, the boundary of the swept volume.<br />
The swept surface <strong>al</strong>gorithm is implemented in<br />
three basic steps (Figure 1).<br />
1. Generate an implicit model from the origin<strong>al</strong> geometric<br />
model. We use implicit techniques that<br />
assign a distance v<strong>al</strong>ue from each voxel to the<br />
surface of the object. The geometric model may<br />
be of any representation<strong>al</strong> form as long as a distance<br />
function can be computed for any point.<br />
Common representations include polygon<strong>al</strong><br />
meshes, parametric surfaces, constructive solid<br />
models, or implicit functions.<br />
2. Sweep the implicit model through the workspace.<br />
The workspace is a volume constructed to strictly<br />
bound the model as it travels <strong>al</strong>ong the sweep trajectory.<br />
The sweeping is performed by repeatedly<br />
sampling the implicit model with the workspace<br />
volume as it is transformed <strong>al</strong>ong the sweep trajectory.<br />
The end result is a minimum distance<br />
v<strong>al</strong>ue at each voxel in the workspace volume.<br />
3. Generate the swept surface using the iso-surface<br />
extraction <strong>al</strong>gorithm marching cubes. The v<strong>al</strong>ue d<br />
of the iso-surface is a distance measure. If d = 0 ,<br />
the surface is the swept surface. For d ≠ 0 , a fam-<br />
ily of surfaces offset from the swept volume is<br />
created.<br />
A detailed examination of each of these steps follows.<br />
3.1 Generating the Implicit Model<br />
This step converts the geometric model into a sampled<br />
distance function in a 3D volume of dimension<br />
( n1, n2, n3) . We refer to this representation as the<br />
implicit model VI. Our approach is similar to Bloomenth<strong>al</strong> [15]. Any<br />
n-dimension<strong>al</strong> object in R (we assume here )<br />
can be described by an implicit function<br />
where the function f() defines the distance of point<br />
n<br />
n = 3<br />
f( p)<br />
=<br />
0
a) Generate implicit model<br />
b) Sweep implicit model through<br />
workspace volume<br />
c) Generate swept surface via<br />
iso-surface extraction<br />
Figure 1. Overview of swept surface<br />
generation.<br />
p R to the surface of the object. To develop the<br />
implicit model we compute the function f() in a 3D<br />
volume of dimension . For geometric<br />
models having a closed boundary (i.e., having an<br />
inside and an outside), f() can generate a signed distance;<br />
that is, negative distance v<strong>al</strong>ues are inside the<br />
model and positive v<strong>al</strong>ues are outside of the model.<br />
Geometric representations often consist of combinations<br />
of geometric primitives such as polygons or<br />
splines. In these cases f() must be computed as the<br />
minimum distance v<strong>al</strong>ue as follows. Given the n<br />
primitives defining the n distance<br />
v<strong>al</strong>ues at point p, choose the<br />
minimum v<strong>al</strong>ue.,<br />
3 ∈<br />
( n1, n2, n3) G = ( g1, g2, …, gn) ( d1, d2, …, dn) d = f( p)<br />
= Min ( d1 , d2 , …, dn )<br />
For an implicit model, the minimum is equiv<strong>al</strong>ent to<br />
the union of the sc<strong>al</strong>ar field [15].<br />
The implicit model can be generated for any geometric<br />
representation for which the distance function<br />
f() can be computed. One common representation is<br />
the polygon<strong>al</strong> mesh. Then f(p) is the minimum of the<br />
distances from p to each polygon (Figure 2). For<br />
more complex geometry whose distance function<br />
may be expensive or too complex to compute, the<br />
model can be sampled at many points, and then the<br />
points can be used to generate the distance function.<br />
Figures 6 and 7 illustrate the generation of an<br />
d = Min(d 1 ,d 2 )<br />
d 2<br />
d 1<br />
distance to plane<br />
distance to edge<br />
distance to vertex<br />
Figure 2. Computing distance function f() for<br />
polygon<strong>al</strong> mesh.<br />
implicit model from a polygon<strong>al</strong> mesh. Figure 6<br />
shows the origin<strong>al</strong> mesh consisting of 5,576 polygons.<br />
The implicit model is sampled on a volume V I<br />
at a resolution of 100 3 . An offset surface of the<br />
implicit model is generated using a surface v<strong>al</strong>ue d =<br />
0.25 in Figure 7. In this example a non-negative distance<br />
function has been used to compute the implicit<br />
model. As a result, both an outer and inner surface<br />
are generated. Any closed surface will necessarily<br />
generate two or more surfaces for some v<strong>al</strong>ues of d if<br />
f() is non-negative.<br />
3.2 Computing the Workspace Volume<br />
The workspace volume Vw is generated by sweeping<br />
the implicit model <strong>al</strong>ong the sweep trajectory, and<br />
sampling the transformed implicit model. Vw must<br />
be sized so that the object is strictly bounded<br />
throughout the entire sweep. One simple technique<br />
to size Vw is to sweep the bounding box of the geometric<br />
model <strong>al</strong>ong the sweep trajectory and then<br />
compute a glob<strong>al</strong> bounding box.<br />
The sweep trajectory ST is gener<strong>al</strong>ly specified as a<br />
series of transformations ST = { t1, t2, …, tm} . Arbitrary<br />
transformations are possible, but most applications<br />
define transformations consisting of rigid body<br />
translations and rotations. (The use of non-uniform<br />
sc<strong>al</strong>ing and shearing creates interesting effects.)<br />
The implicit model travels <strong>al</strong>ong the sweep trajectory<br />
in a series of steps, the size of the step dictated<br />
by the <strong>al</strong>lowable error (see Discussion). Since these<br />
transformations { t1, t2, …, tm} may be widely separated,<br />
interpolation is often required for an intermediate<br />
transformation t'.<br />
We recover positions and<br />
orientations from the provided transformations, and<br />
interpolate these recovered v<strong>al</strong>ues.<br />
The sampling of the implicit model is depicted in<br />
Figure 3. The v<strong>al</strong>ues in Vw are initi<strong>al</strong>ized to a large<br />
positive v<strong>al</strong>ue. Then for each sampling step, each<br />
point in Vw is inverse transformed into the coordi
ST<br />
a) Inverse transform V W<br />
nate system of V I. The location of the point within V I<br />
is found and then its distance v<strong>al</strong>ue is computed<br />
using tri-linear interpolation. As in the implicit<br />
model, the v<strong>al</strong>ue of the point in V w is assigned the<br />
minimum distance. The result is the minimum distance<br />
v<strong>al</strong>ue at each point in V w seen throughout the<br />
sweep trajectory.<br />
An <strong>al</strong>ternative workspace volume generation<br />
scheme c<strong>al</strong>culates the distance function f() directly<br />
from the transformed geometric model, eliminating<br />
the need for V I entirely. Although this can be efficient<br />
when f() is inexpensive to compute, we have<br />
found that in our applications the performance of the<br />
<strong>al</strong>gorithm is unsatisfactory. Sampling the implicit<br />
model into the transformed workspace volume<br />
improves the performance of the <strong>al</strong>gorithm significantly,<br />
since the sampling is independent of the number<br />
of geometric primitives in the origin<strong>al</strong> model,<br />
and the cost of tri-linear interpolation is typic<strong>al</strong>ly<br />
much sm<strong>al</strong>ler than the cost of ev<strong>al</strong>uating f().<br />
3.3 Extracting Swept Surfaces<br />
The last step in the <strong>al</strong>gorithm generates the swept<br />
surface from the workspace volume. Since Vw represents<br />
a 3D sampling of distance function, the iso-surface<br />
<strong>al</strong>gorithm marching cubes is used to extract the<br />
swept surface. Choosing d = 0 generates the surface<br />
of the swept volume, while d ≠ 0 generates offset<br />
surfaces. In many applications choosing d > 0 is<br />
desirable to generate surfaces offset from the swept<br />
volume by a certain tolerance.<br />
As with any iso-surface extraction <strong>al</strong>gorithm, the<br />
surfaces often consist of large numbers of triangles.<br />
Hence we often apply a decimation <strong>al</strong>gorithm [17] to<br />
reduce the number of triangles representing the surface.<br />
4.0 Discussion<br />
b) Sample V I<br />
Figure 3. Sampling the implicit volume.<br />
4.1 Degenerate Trajectories<br />
Degenerate trajectories, as described by Martin<br />
and Stephenson [12], are self-intersecting trajecto-<br />
Dimensions<br />
DxDxD<br />
L<br />
Figure 4. Sampling error in 3D volume.<br />
L<br />
L<br />
ries or trajectories that result in surface singularities.<br />
Self-intersection occurs when the generating geometry<br />
intersects itself as it travels <strong>al</strong>ong the sweep trajectory.<br />
Surface singularities occur when nonvolume<br />
filling geometry is created, for example<br />
when a plane travels perpendicular to its norm<strong>al</strong>.<br />
The <strong>al</strong>gorithm presented here correctly treats<br />
degenerate trajectories. Convention<strong>al</strong> an<strong>al</strong>ytic<strong>al</strong><br />
techniques require sophisticated mathematic<strong>al</strong> techniques<br />
that do not yet have gener<strong>al</strong> solutions. Our<br />
<strong>al</strong>gorithm uses simple set operations that are immune<br />
to both types of degeneracies.<br />
4.2 Error An<strong>al</strong>ysis<br />
Due to sampling errors and differences in representation,<br />
the generated swept surface is an approximation<br />
to the actu<strong>al</strong> surface. Sampling errors are introduced<br />
at three points: 1) when creating VI from the geometric<br />
model, 2) when sampling VI into the workspace<br />
volume Vw, and 3) when incrementing the transformation<br />
<strong>al</strong>ong the sweep trajectory ST. Representation<br />
errors are due to the fact that the swept surface is a<br />
polygon<strong>al</strong> mesh, while the origin<strong>al</strong> representation<br />
can be combinations higher-order surfaces or even<br />
implicit functions. Here we address sampling errors<br />
only, since representation<strong>al</strong> errors depend on the particular<br />
geometric representation, which is beyond the<br />
scope of this paper.<br />
The sampling error bounds of the distance function<br />
in a 3D volume is the distance from the corner of a<br />
cube formed from eight neighboring voxels to its<br />
center (Figure 4). Without loss of gener<strong>al</strong>ity we can<br />
assume that the volume size is length L, and that the<br />
volume dimensions are n1 ,n2 ,n3 = D. It follows that<br />
the cube length is then L/D. The maximum sampling<br />
error e at a voxel is then<br />
3<br />
e ------<br />
2<br />
The error introduced by stepping <strong>al</strong>ong ST depends<br />
upon the nature of the transformation. Translations<br />
give rise to uniform error terms, but rotation gener-<br />
L<br />
≤<br />
⎛<br />
⎝<br />
---<br />
⎞<br />
D ⎠<br />
e<br />
L/D
d i<br />
t i<br />
Transform<br />
Figure 5. Approximating stepping error.<br />
p<br />
ti + 1<br />
ates variable error depending upon distance from<br />
center of rotation.The stepping error can be estimated<br />
by linearizing the transformation and assuming<br />
that the maximum position<strong>al</strong> change of any point<br />
is Δx (Figure 5.). If the actu<strong>al</strong> distance v<strong>al</strong>ue to some<br />
point p in Vw is given as d , and the distance functions<br />
are di and di + 1 at the points ti and ti + 1 <strong>al</strong>ong<br />
ST, then the maximum error occurs at Δx ⁄ 2 and is<br />
given by e = di– d = di + 1 – d.<br />
Since<br />
2<br />
d d<br />
⎛Δx i -----<br />
⎞<br />
⎝ , the error is bounded by<br />
2 ⎠<br />
2<br />
= –<br />
The v<strong>al</strong>ue of Δx can be estimated by transforming<br />
the bounding box of the model and computing the<br />
displacement of the extreme points.<br />
These error terms can be combined to provide an<br />
estimate to the tot<strong>al</strong> error:<br />
The terms L I , L W , are the lengths and D I , D W are the<br />
dimensions of the implicit and working volumes,<br />
respectively. These terms arise when creating V I<br />
from the geometric model and when sampling V I<br />
into the workspace volume V w .<br />
4.3 Complexity An<strong>al</strong>ysis<br />
The bulk of computation occurs when sweeping the<br />
implicit model through the workspace volume. Generating<br />
the implicit model and the fin<strong>al</strong> iso-surface<br />
are one-time events at the beginning and end of the<br />
<strong>al</strong>gorithm.<br />
Assuming that f() can be computed in constant<br />
time for any point, the implicit model can be gener-<br />
3<br />
ated in time O〈 DI〉 . If the computation of f() is proportion<strong>al</strong><br />
to the number of geometric primitives np in<br />
3<br />
the model, the time complexity is O〈 npD 〉 . The<br />
3<br />
I<br />
complexity of sweeping is O〈 nsD 〉<br />
where ns is the<br />
W<br />
d<br />
Δx<br />
di + 1<br />
e di d<br />
⎛<br />
i ⎝<br />
-----<br />
⎞<br />
2 ⎠<br />
2 Δx<br />
= – – ≤<br />
⎛<br />
⎝<br />
-----<br />
⎞<br />
2 ⎠<br />
e tot<br />
≈<br />
2 Δx<br />
3<br />
------<br />
2<br />
L ⎛ I<br />
⎝<br />
----- + -------<br />
⎞ Δx<br />
⎠<br />
+ -----<br />
2<br />
D I<br />
L W<br />
D W<br />
number of steps in the sweep. The fin<strong>al</strong> step, iso-surface<br />
extraction, is a function of the size of the work-<br />
3<br />
ing volume O〈 DW〉 .<br />
4.4 Multiple Surface Generation<br />
More that one connected swept surface may be created<br />
for certain combinations of geometry and isosurface<br />
v<strong>al</strong>ue d. As described previously if f( p)<br />
≥ 0<br />
for <strong>al</strong>l p, both an inner an outer surface may be generated.<br />
If the geometric model is non-convex, then<br />
multiple inside and outside surfaces may be created.<br />
There will be at least one connected outer surface,<br />
however, that will bound <strong>al</strong>l other surfaces. In some<br />
applications such as spati<strong>al</strong> planning and maintainability<br />
design this result is acceptable. Other applications<br />
require a single surface.<br />
One remedy that works in many cases is to compute<br />
a signed distance function f() where v<strong>al</strong>ues less<br />
than zero occur inside the object. This approach will<br />
eliminate any inner surfaces when d> 0.<br />
Gener<strong>al</strong>ly<br />
this requires some form of inside/outside test which<br />
may be expensive for some geometric representations.<br />
Another approach to extract the single bounding<br />
surface is to use a modified form of ray casting in<br />
combination with a surface connectivity <strong>al</strong>gorithm.<br />
5.0 Results<br />
Our initi<strong>al</strong> application for swept surfaces was for<br />
maintainability design. In this application the swept<br />
surface is c<strong>al</strong>led a remov<strong>al</strong> envelope. The remov<strong>al</strong><br />
envelope graphic<strong>al</strong>ly describes to other designers the<br />
inviolable space required for part access and<br />
remov<strong>al</strong>. We have since used the swept surfaces to<br />
visu<strong>al</strong>ize robot motion. Three specific examples follow.<br />
The first two examples use a trajectory planned<br />
using the McDonnell Douglas Human Modeling<br />
System.<br />
5.1 Fuel/Oil Heat Exchanger<br />
The part shown in Figure 6 is a fuel/oil heat<br />
exchanger used in an aircraft engine. Maintenance<br />
requirements dictate that it must be able to be<br />
replaced within 30 minutes while the aircraft is at the<br />
gate. The implicit model of the heat exchanger is<br />
shown in Figure 7. Figure 8 shows the resulting<br />
swept surface. Both the implicit model and the workspace<br />
volume were generated at a resolution of 100 3 .<br />
The sweep trajectory contained 270 steps. The swept<br />
surface, generated with an offset of d=0.2 inch, consists<br />
of 15,108 triangles.<br />
Figure 9 shows the remov<strong>al</strong> envelope positioned<br />
within surrounding parts. Of particular interest is the
piping that has been rerouted around the remov<strong>al</strong><br />
envelope. The figure demonstrates the sm<strong>al</strong>l clearances<br />
typic<strong>al</strong> in complex mechanic<strong>al</strong> environments.<br />
Because of tolerances in these systems, we gener<strong>al</strong>ly<br />
choose to create offset swept surfaces. Currently we<br />
use no quantitative method to choose the offset v<strong>al</strong>ue<br />
and rely on design experience.<br />
5.2 Fuel Nozzle<br />
Figure 10 shows another application of swept surfaces<br />
to maintainability design. A proposed design<br />
change to the aircraft engine pre-cooler (shown in<br />
turquoise) impacted the remov<strong>al</strong> of the number 3<br />
fuel nozzle. The remov<strong>al</strong> path consists of many rotations<br />
and is self-intersecting at many points.<br />
The fuel nozzle was modeled using 6,100 polygons.<br />
The implicit model was generated at a volume<br />
resolution 50 3 and the workspace volume at 100 3 . A<br />
tot<strong>al</strong> of 600 steps was taken <strong>al</strong>ong the sweep trajectory.<br />
The offset swept surface of 16,572 triangles<br />
was generated with a v<strong>al</strong>ue d=0.2 inch.<br />
5.3 Robot Motion<br />
Swept surfaces are effective tools for visu<strong>al</strong>izing<br />
complex robot motion. In Figure 11 the swept surfaces<br />
of the end effector, hand, wrist, and arm of the<br />
robot are shown simultaneously. Each robot part was<br />
sampled at 50 3 . The workspace volume was sampled<br />
at 100 3 . The tot<strong>al</strong> number of triangles representing<br />
the four surfaces was 681,800 using a distance v<strong>al</strong>ue<br />
d=1 inch (over a workspace volume size LW = 140<br />
inches.)<br />
6.0 Conclusion<br />
We have demonstrated an <strong>al</strong>gorithm that generates<br />
swept surfaces and volumes from any geometric representation<br />
for which a distance function can be<br />
computed. This includes such common forms as<br />
parametric surfaces, polygon<strong>al</strong> meshes, implicit representations,<br />
and constructive solid models. The<br />
<strong>al</strong>gorithm treats complex trajectories including selfintersection<br />
and surface singularities. We have successfully<br />
applied the <strong>al</strong>gorithm to a variety of complex<br />
applications including maintainability design<br />
and robot spati<strong>al</strong> planning.<br />
Acknowledgments<br />
Steve Rice of McDonnell Douglas assisted in the<br />
extraction of remov<strong>al</strong> paths from the McDonnell<br />
Douglas Human Modeling System.<br />
References<br />
[1] D. F. Rogers and J. A. Adams. Mathematic<strong>al</strong> Elements<br />
for Computer Graphics. McGraw-Hill Publishing<br />
Co., New York. 1990.<br />
[2] M. E. Mortensen. Geometric Modeling. John Wiley<br />
& Sons, New York, 1985.<br />
[3] S. Coquillart. A control-point-based sweeping technique.<br />
IEEE Computer Graphics and Applications<br />
7(11):36-45, November 1987.<br />
[4] T. Lozano-Perez. Spati<strong>al</strong> Planning: A configuration<br />
space approach. IEEE Trans. on Computers C-<br />
32(2):108-120, February 1983.<br />
[5] M. Celenk and W. Sun. 3D visu<strong>al</strong> robot guidance in<br />
dynamic environment. Proceedings of IEEE Int’l<br />
Conference on Systems <strong>Engineering</strong>, pp 507-510,<br />
August 1990.<br />
[6] W. P. Wang and K. K. Wang. Geometric modeling<br />
for swept volume of moving solids. IEEE Computer<br />
Graphics and Applications 6(12):8-17, 1986.<br />
[7] T. Lozano-Perez and M. A. Wesley. An <strong>al</strong>gorithm for<br />
planning collision-free paths among polyhedr<strong>al</strong><br />
objects. Comm. of the ACM 22(10):560-570, October<br />
1979.<br />
[8] J. Lengyel, M. Reichert, B. R. Don<strong>al</strong>d, and D. P.<br />
Greenberg. Re<strong>al</strong>-time robot motion planning using<br />
rasterizing computer graphics hardware. Computer<br />
Graphics 24(4):327-335, August 1990.<br />
[9] R. A. Brooks. Solving the find-path problem by good<br />
representation of free space. IEEE Transactions on<br />
Systems, Man, and Cybernetics, SMC-132(3):190-<br />
197, March/April 1983.<br />
[10] McDonnell Douglas Human Modeling System Reference<br />
Manu<strong>al</strong>. Report MDC 93K0281. McDonnell<br />
Douglas Corporation, Human Factors Technology.<br />
Version 2.1, July 1993.<br />
[11] J. D. Weld and M. C. Leu. Geometric representation<br />
of swept volumes with application to polyhedr<strong>al</strong><br />
objects. Int’l J. of Robotics Research, 9(5):105-117,<br />
October 1990.<br />
[12] R. R. Martin and P. C. Stephenson. Sweeping of<br />
three-dimension<strong>al</strong> objects. Computer-Aided Design<br />
22(4):223-234, May 1990.<br />
[13] B Wyvill, C. McPheeters, G. Wyville. Animating<br />
soft objects. The Visu<strong>al</strong> Computer 2:235-242.<br />
[14] B. A. Payne and A. W. Toga. Distance field manipulation<br />
of surface models. IEEE Computer Graphics<br />
and Applications, 12(1):65-71, January 1993.<br />
[15] J. Bloomenth<strong>al</strong>. Polygonization of implicit surfaces.<br />
Computer Aided Geometric Design, 5(4):341-355,<br />
November 1988.<br />
[16] W. E. Lorensen and H. E. Cline. Marching cubes: a<br />
high resolution 3d surface construction <strong>al</strong>gorithm.<br />
Computer Graphics 21(4):163-169, July 1987.<br />
[17] W. J. Schroeder, J. A. Zarge, and W. E. Lorensen.<br />
Decimation of triangle meshes. Computer Graphics<br />
26(2):65-70, July 1992.
Figure 6. Origin<strong>al</strong> model of fuel/oil heat exchanger. Figure 7. Outer and inner offset surface generated<br />
from implicit model.<br />
Figure 8. Swept surface of heat exchanger.<br />
Figure 10. Fuel nozzle remov<strong>al</strong> envelope in context<br />
with other parts.<br />
Figure 9. Remov<strong>al</strong> envelope (wireframe) in context<br />
with other parts.<br />
Figure 11. Swept surfaces of robot end effector<br />
(brown), hand (blue), wrist (yellow), and<br />
arm (orange).
Visu<strong>al</strong>izing Polycryst<strong>al</strong>line Orientation Microstructures with Spheric<strong>al</strong> Color Maps<br />
Boris Yamrom * , John A. Sutliff * , Andrew P. Woodfield †<br />
* GE Corporate Research and Development, 1 River Road, Schenectady, New York, 12345<br />
† GE Aircraft Engine, One Neumann Way, Cincinnati, Ohio, 45215<br />
Abstract<br />
Spheric<strong>al</strong> color maps can be an effective tool in the<br />
microstructure visu<strong>al</strong>ization of polycryst<strong>al</strong>s. Electron<br />
backscatter diffraction pattern an<strong>al</strong>ysis provides large<br />
arrays of the orientation data that can be visu<strong>al</strong>ized easily<br />
using the technique described in this paper. A combination<br />
of this technique with the tradition<strong>al</strong> black and white<br />
scanning electron microscopy imaging will enable scientists<br />
to better understand the correlation between materi<strong>al</strong><br />
properties and their polycryst<strong>al</strong>line structure.<br />
I. Introduction<br />
Materi<strong>al</strong> scientists possess a large arsen<strong>al</strong> of tools for<br />
the exploration of physic<strong>al</strong> and chemic<strong>al</strong> properties of<br />
materi<strong>al</strong>s. Many of these tools directly address human<br />
abilities to process visu<strong>al</strong> information. Others generate<br />
data sets that can be an<strong>al</strong>yzed employing speci<strong>al</strong>-purpose<br />
computer programs designed to extract meaningful and<br />
useful information. Met<strong>al</strong>lurgists and geologists often<br />
study polycryst<strong>al</strong>line materi<strong>al</strong>s, that is materi<strong>al</strong>s composed<br />
of many sm<strong>al</strong>l grains of cryst<strong>al</strong>s. Physic<strong>al</strong> properties<br />
of these materi<strong>al</strong>s (strength, elasticity, etc.) may be<br />
strongly influenced by the orientation of these grains, <strong>al</strong>so<br />
c<strong>al</strong>led cryst<strong>al</strong>lographic textures. These textures are the<br />
subject of numerous investigations [9].<br />
Typic<strong>al</strong> scanning electron microscope images can<br />
show boundaries between cryst<strong>al</strong> grains and can reve<strong>al</strong><br />
composition<strong>al</strong> differences between grains of different<br />
components c<strong>al</strong>led phases. In most cases, however, they<br />
will not show particular orientation of individu<strong>al</strong> grains<br />
and, therefore, will not tell if sever<strong>al</strong> grains define a<br />
domain of similar orientation.<br />
To address the problem of imaging orientation-based<br />
features in microstructures, a relatively new method of<br />
electron backscatter diffraction pattern an<strong>al</strong>ysis(EBSP) is<br />
used [10]. The diffraction pattern an<strong>al</strong>ysis by itself is not<br />
new, but speci<strong>al</strong> enhancements (automation) in the diffraction<br />
pattern collection combined with the computeraided<br />
processing enables generation of up to 1800 sample<br />
orientations per hour [10](in 1988 it was possible to<br />
obtain only 120 measurements per hour, [2]).<br />
Orientation of the cryst<strong>al</strong>s in the sample is usu<strong>al</strong>ly<br />
defined with Euler angles α, β, and γ, that represent three<br />
consecutive rotations of the coordinate system associated<br />
with the cryst<strong>al</strong> to <strong>al</strong>ign it with the sample coordinate system<br />
[9]. The first rotation is about the cryst<strong>al</strong>’s z' axis (we<br />
denote the sample coordinate system axes with x, y, z, and<br />
the cryst<strong>al</strong> coordinate axes with x', y' , and z' ), the second<br />
rotation is about the cryst<strong>al</strong>’s x' axis, and the third rota-<br />
tion is again about the z' axis. All rotations are made<br />
counterclockwise. Euler angles α, β, and γ satisfy the following<br />
constraints:<br />
0 ≤ α < 2π,<br />
0 ≤ β < π, 0 ≤ γ < 2π .<br />
There are variations in the Euler angles definition:<br />
some authors use the y' axis instead of the x' axis for the<br />
second rotation, angles boundaries may be shifted too, but<br />
these are of no concern to us here. The data collected is<br />
represented by the file of records<br />
α β γ x y,<br />
where α, β, and γ are Euler angles, and x, y represent two<br />
Cartesian coordinates of a measured point relative to<br />
some sample reference point. In the case of materi<strong>al</strong>s containing<br />
multiple components the above record can be<br />
expanded to contain the type of phase at a particular sample<br />
location. Sample points coordinates x, y may belong<br />
to a regular grid or be random.<br />
A few visu<strong>al</strong>ization techniques exist for orientation<br />
data. The most popular technique is the pole figure. A particular<br />
direction is selected in a cryst<strong>al</strong> coordinate system<br />
( z' axis, for example) and for <strong>al</strong>l points ( x, y)<br />
in a sample,<br />
the selected direction is mapped to a unit sphere<br />
(where a ray of this direction from the origin intersects the
sphere) and then projected onto the xy plane with one of<br />
the two widely used projection techniques: stereographic<br />
or equ<strong>al</strong>-area projection [9]. Thus orientation distribution<br />
of a sample is represented as a set of points in the disk. We<br />
get more information about the materi<strong>al</strong> if we plot pole<br />
figures for <strong>al</strong>l cryst<strong>al</strong> major axes x', y' , and z' . Another<br />
way to visu<strong>al</strong>ize orientation distribution is to display a set<br />
of points representing Euler angle triplets in the Euler<br />
angle volume of 3D space.<br />
Though both techniques are widely used, their limitations<br />
are well recognized. One of the limitations relates to<br />
the fact that these are statistic<strong>al</strong> visu<strong>al</strong>izations, that is we<br />
plot points in the function v<strong>al</strong>ue domain (α, β, γ) and lose<br />
<strong>al</strong>l information about spati<strong>al</strong> distribution of orientations<br />
(in x, y domain). Other limitation relates to distortion<br />
introduced by the curved character of Euler angle space.<br />
Recently some authors addressed the limitation of<br />
Euler space mapping[6]. Other researchers recognize that<br />
orientation, being multivariate, can be represented by<br />
color or black and white texture [7]. However, <strong>al</strong>l attempts<br />
so far were not satisfactory. Either these mappings require<br />
stereo displays [6], or the mappings were non-consistent<br />
and not easy to use. Gener<strong>al</strong> dissatisfaction with the existing<br />
color maps for visu<strong>al</strong>izing orientations is expressed in<br />
the following quotation taken from [10]:<br />
“However, there are two problems which can<br />
arise from color visu<strong>al</strong>izations of microstructure.<br />
First, inherent to any color representation is the<br />
danger of physiologic<strong>al</strong> responses to particular<br />
colors, biasing the interpretation. Second, for<br />
most parametrizations of orientation space, it is<br />
difficult to find a color mapping which insures<br />
that grains of similar orientation are assigned<br />
similar colors.”<br />
We try to address both of these concerns in our paper.<br />
The first concern is addressed by using multiple color<br />
maps instead of one, thus avoiding bias caused by specific<br />
physiologic<strong>al</strong> responses to a particular color or group of<br />
colors. The second concern is the major stimulus to our<br />
investigation. We present a set of maps that is free of these<br />
problems and that can be successfully used for producing<br />
orientation images of polycryst<strong>al</strong>line microstructures. As<br />
was indicated in [1] no single color map of orientation<br />
space can be fully satisfactory, but their combination may<br />
be. We limit the scope of this investigation by an issue of<br />
color coding leaving out the geometry coding and other<br />
deciphering and interpreting techniques [8]. Our experiments<br />
show that those techniques may be very useful for<br />
sm<strong>al</strong>l arrays of data, but are substanti<strong>al</strong>ly outperformed by<br />
color coding in a case of very large data sets.<br />
First, we observe that in many practic<strong>al</strong> situations the<br />
scientist is interested in the x'y' plane orientation of the<br />
cryst<strong>al</strong> only and is not interested in the rotation of the<br />
cryst<strong>al</strong> about the axis norm<strong>al</strong> to its x'y' plane. This is typic<strong>al</strong><br />
when we are interested in the strength of materi<strong>al</strong> and<br />
we know that a cryst<strong>al</strong> can be more easily split <strong>al</strong>ong the<br />
x'y' plane than <strong>al</strong>ong any other plane. Other planes of<br />
interest can be an<strong>al</strong>yzed similarly simply by changing the<br />
initi<strong>al</strong> frame of reference. Orientation of the plane is<br />
uniquely specified by the direction of its norm<strong>al</strong> vector,<br />
i.e., z' axis for the x'y' plane. To simplify the exposition,<br />
we assume here that the cryst<strong>al</strong> axes are orthogon<strong>al</strong>, but<br />
fin<strong>al</strong> results still hold for arbitrary cryst<strong>al</strong>s.<br />
The direction of the norm<strong>al</strong> vector <strong>al</strong>ong the z' axis<br />
can be uniquely represented by a point on a unit sphere.<br />
Moreover, we should identify as equ<strong>al</strong> the opposite points<br />
on a sphere, since they correspond to the same orientation<br />
of the x'y' plane relative to the sample coordinate system.<br />
Therefore, the limited orientation space we are de<strong>al</strong>ing<br />
with is represented by a unit sphere in 3D space with<br />
opposite points being identic<strong>al</strong>. This is a so c<strong>al</strong>led two<br />
dimension<strong>al</strong> projective plane. The arbitrary orientation,<br />
however would require a unit sphere in 4D space (with the<br />
same property of identity of the opposite points), or projective<br />
space of three dimensions.<br />
Now we can formulate the problem to be solved in<br />
exact terms. We would like to create coloring of a sphere<br />
that satisfies the following conditions:<br />
(a) every point on a sphere is assigned a color;<br />
(b) opposite points get the same color;<br />
(c) different points get different colors;<br />
(d) similar (close) points get similar colors.<br />
Since we can represent color in RGB system with<br />
three parameters [5], color gamut is a 3D topologic<strong>al</strong><br />
region. If we treat conditions (a)-(d) liter<strong>al</strong>ly, we would<br />
need an imbedding of projective plane (topologic<strong>al</strong>ly<br />
equiv<strong>al</strong>ent to the Klein bottle) into 3D space that we know<br />
is impossible [3]. Luckily, we do not treat conditions (a)-<br />
(d) to the letter. In re<strong>al</strong>ity, even if we could create a map<br />
satisfying (a)-(d), it would not be very useful. If we <strong>al</strong>low<br />
for every point on a sphere to have a unique color and use<br />
this color map to color the orientation corresponding to<br />
each sample point x, y , we get a picture that will contain<br />
too much information to comprehend. The segmentation<br />
of the image that is easily done with pre-attentive vision in<br />
the case of limited number of colors becomes more difficult<br />
or impossible to do when the amount of colors grows<br />
dramatic<strong>al</strong>ly. Therefore, we change the condition (a) to be<br />
( a' ) the sphere is subdivided into a finite number of<br />
regions, possibly of similar area, each region is<br />
assigned a color;<br />
and we require that (b)-(d) is applied to these regions<br />
instead of points. We c<strong>al</strong>l these new conditions ( a' )-( d'<br />
).
In the next section we construct maps that satisfy<br />
these conditions. Then we discuss how the mapping of<br />
orientation data into color space is implemented. At the<br />
end we summarize and point out new directions of<br />
research.<br />
2. Spheric<strong>al</strong> Color Maps<br />
Since the ide<strong>al</strong> subdivision of a sphere into subregions<br />
should possess many symmetries, it is natur<strong>al</strong> that<br />
we turn our attention to the subdivision induced by regular<br />
polytopes inscribed into a sphere. Among <strong>al</strong>l regular polytopes<br />
the icosahedron has the maximum number of faces -<br />
20. Each face of an icosahedron is a regular triangle and<br />
<strong>al</strong>l points opposite to ones in a face represent one of the<br />
other faces of the icosahedron. We have the same property<br />
satisfied by cube, octahedron, and dodecahedron. Thus <strong>al</strong>l<br />
regular polytopes except tetrahedron can be used for orientation<br />
color maps (compare with[4]). We present here a<br />
detailed description of the design of color maps based on<br />
icosahedron and on octahedron geometries.<br />
Coloring a cube satisfying ( a' )-( d' ) is easy, one just<br />
has to assign primary colors red, green, and blue to pairs<br />
of opposite faces. With the icosahedron it is not so easy<br />
and the existence of appropriate coloring may be viewed<br />
as some kind of magic. Indeed, let us consider one triangle<br />
face of the icosahedron and look at its adjacent faces.<br />
.<br />
Figure 1. Three adjacent faces of an icosahedron<br />
Let the centr<strong>al</strong> triangle in Figure 1 be colored in red,<br />
then we choose adjacent faces colors to contain equ<strong>al</strong> red<br />
components but mixed with other primaries. One face will<br />
become yellow and another will get magenta. Since there<br />
is no fourth primary color, we mix red with white to color<br />
the third adjacent triangle. If we assign two other primary<br />
colors to other faces and repeat this construction, then,<br />
with the re<strong>al</strong>ization that each face color will be repeated<br />
twice in the icosahedron, we get two of each colors on the<br />
surface of icosahedron: red, green, blue, yellow, magenta,<br />
cyan, light red, light green, and light blue. All together<br />
there are 18 faces. Just add two whites and we color <strong>al</strong>l the<br />
faces of the icosahedron. Question: can this be done in a<br />
consistent way that is exemplified in Figure 1? Yes, this is<br />
indeed possible and demonstrated in Figure 2, where an<br />
icosahedron is shown from two opposite points of view so<br />
<strong>al</strong>l its faces can be observed unobstructed.<br />
Figure 2. Two opposite views of an icosahedron<br />
This coloring is characterized by other symmetries:<br />
every combined color, yellow for example, is surrounded<br />
by two primary colors it is combined with, red and green,<br />
and <strong>al</strong>so by a light blue. White color is surrounded by<br />
three light primaries. All colors specifications can vary<br />
slightly to accommodate for different display devices or<br />
color printer devices.<br />
The created color map satisfies ( a' )-( d' ) conditions<br />
and contains ten colors. This color map is just an example<br />
and a proof of existence by the demonstration. Other coloring<br />
schemes can be designed for an icosahedron that<br />
may be even more natur<strong>al</strong> than this one.<br />
If we want finer resolution of orientation in color<br />
space, we need to subdivide the sphere into more regions.<br />
We can build such subdivision by splitting each triangle<br />
face of an icosahedron into four equ<strong>al</strong> triangles, projecting<br />
three new vertices (edge centers) onto the sphere, and connecting<br />
them in a triangle mesh.<br />
Instead, we start with an octahedron and by a similar<br />
face subdivision we create color maps with 4, 16, 64 and<br />
256 colors. To demonstrate a different approach to color<br />
map design we use the HSV color system [5] and assign to<br />
each triangle facet of the polyhedron the color corresponding<br />
to its geometric center point. To find this color<br />
we first check the sign of z components of the point coordinate<br />
and, if it is negative, we negate <strong>al</strong>l components of<br />
the point. The resulting point in the northern hemisphere<br />
we project onto the xy plane using stereographic or equ<strong>al</strong>area<br />
projection [9]. Then we take the polar coordinate of<br />
the projection point r, ϕ, ( 0 ≤ r ≤ 1,<br />
– π ≤ ϕ < π)<br />
and c<strong>al</strong>culate<br />
h, s, and v by the formulas (C language notation is<br />
used here)
h = (ϕ > 0)? ϕ / π : (ϕ + π) / π,<br />
s = r,<br />
v = (ϕ > 0)? 1 : 0.7,<br />
where h is hue, s is saturation, and v is v<strong>al</strong>ue. The first<br />
expression makes standard hue of the color wheel to be<br />
repeated twice in one full turn around the origin. This is<br />
done to assign equ<strong>al</strong> hue to <strong>al</strong>l points on a meridian. The<br />
second formula makes color different for different points<br />
on a sphere based on their latitude coordinate. Points<br />
closer to the equator get more saturated colors and points<br />
closer to the north pole get color close to white. The last<br />
formula makes a distinction in coloring two symmetric<br />
points, the points with projected coordinates (r, ϕ) and (r,<br />
ϕ + π). These points will have the same hue and saturation<br />
but can be distinguished by the v<strong>al</strong>ue v (as previously,<br />
variations in formulas are possible). The image of 64 colors<br />
map equ<strong>al</strong>-area projection of northern hemisphere is<br />
presented in Figure 3.<br />
Figure 3. The equ<strong>al</strong>-area projection of 64 colors<br />
map of the northern hemisphere<br />
One unavoidable artifact of this color map is the contrast<br />
boundary (more pronounced in the printed image<br />
than on the color monitor) between the light and dark<br />
quarters of the sphere (discontinuity in v<strong>al</strong>ue <strong>al</strong>ong the<br />
equator and zero meridian). The more colors we get in the<br />
color map, the more difficult would be to avoid discontinuity<br />
in mapping a projective plane to the color space.<br />
With this comment in mind it immediately follows from<br />
our construction that the designed color map satisfies con-<br />
ditions ( a' )-( d' ). In cases when the sample orientation<br />
data is limited in its range a simple color map of Figure 4<br />
can be used. In this color map opposite points on the<br />
boundary do not coincide and may have a different color.<br />
Figure 4. A color map with 64 colors<br />
3. Implementation and Examples<br />
Figure 5 presents <strong>al</strong>gorithm of processing orientation<br />
data.<br />
1. Select one of the color maps and the associated polyhedron<br />
described in the previous section. Make the<br />
face indices of polyhedron faces be equ<strong>al</strong> to the color<br />
indices in the color lookup table.<br />
2. Create a rectangle subdivided into squares according<br />
to <strong>al</strong>l x,y sample points. (We assume that a regular<br />
grid is used for simplicity).<br />
3. For each sample point do the following:<br />
3.1 C<strong>al</strong>culate a 3 x 3 orientation matrix based on the<br />
Euler angles of the sample.<br />
3.2 Apply the transformation matrix from the previous<br />
step to the direction vector (0,0,1) (cryst<strong>al</strong>’s z' axes).<br />
3.3 Find the intersection (polyhedron face index)<br />
between the ray from the origin <strong>al</strong>ong the transformed<br />
z'<br />
axes and the polyhedron centered at the origin.<br />
3.4 Use the face index of the intersection point to<br />
color the corresponding square in the rectangle<br />
of step 2.<br />
Figure 5. The conceptu<strong>al</strong> scheme of the color<br />
mapping orientation data<br />
Figures 6-7 represent a sample of data taken with the<br />
step size 1 micron on a 100 x 100 grid. A detail of the<br />
image in Figure 6 is reproduced in Figures 8-9 using the<br />
color map of Figure 4.
Figure 6. 100 x 100 sample of the orientation<br />
data with the step size 1 micron colored with an<br />
icosahedron color map<br />
Figure 7. 100 x 100 sample of orientation data<br />
with the step size 1 micron colored with the 64<br />
colors map of Figure 3<br />
Color can be used <strong>al</strong>so to represent the misorientation<br />
between the adjacent regions (grains) of homogeneous<br />
orientations. This may be done semiautomatic<strong>al</strong>ly by<br />
selecting pairs of adjacent regions and by displaying the<br />
misorientation data and color, but <strong>al</strong>so can be automated<br />
to display the grains adjacency graph with the links colored<br />
according to a selected color map. Misorientation<br />
between the two grains is measured by the sm<strong>al</strong>lest rotation<br />
angle required to <strong>al</strong>ign one grain orientation with<br />
another. The detailed description of the adjacency graph<br />
and its coloring goes beyond the scope of this paper.<br />
4. Summary and Conclusions<br />
We have created a technique for visu<strong>al</strong>izing the orientation<br />
microstructure of polycryst<strong>al</strong>line materi<strong>al</strong>s. The<br />
technique is based on a few key ideas. First, the gener<strong>al</strong><br />
orientation of the cryst<strong>al</strong> grain is reduced to the orientation<br />
of a fixed plane associated with the cryst<strong>al</strong> coordinate<br />
system. Second, the orientation of the plane in 3D space is<br />
mapped to the projective plane re<strong>al</strong>ized in 3D space as a<br />
unit sphere with identified opposite points. Third, the unit<br />
sphere is triangulated in a way compatible with the topology<br />
of projective plane (icosahedron, octahedron and their<br />
subtriangulations suite well). Fourth, each triangle of the<br />
triangulation is assigned a unique color with conditions<br />
( a' )-( d' ). Thus each orientation of the cryst<strong>al</strong> plane gets<br />
its color code.<br />
The color map based on the sphere subdivision<br />
induced by the inscribed icosahedron contains 10 different<br />
colors. For color maps with 64 and 256 colors solid angles<br />
subtended by each region become much sm<strong>al</strong>ler. This<br />
leads to less variations in color transition from region to<br />
region. To satisfy the conditions of color separation and<br />
color similarity, we used <strong>al</strong>l three dimensions of the color<br />
gamut. More research is required to find psychologic<strong>al</strong>ly<br />
the best uniform subdivision of the color space satisfying<br />
conditions ( a' )-( d'<br />
).<br />
The sm<strong>al</strong>l discontinuity in the HSV v<strong>al</strong>ue parameter<br />
<strong>al</strong>ong the zero meridian and the equator psychologic<strong>al</strong>ly is<br />
more visible than the changes in saturation and hue. One<br />
way to preserve the separation of colors is to use colored<br />
texture in two quarters of the sphere instead of reducing<br />
the v<strong>al</strong>ue in the HSV model. In cases when <strong>al</strong>l orientations<br />
vary in some solid angle less than π/2 in diameter the discontinuity<br />
in the v<strong>al</strong>ue parameter can be moved away by<br />
changing the reference point in the northern hemisphere.<br />
By default it is the north pole, but any other point can be<br />
used.<br />
We tried to create isotropic maps and for this reason<br />
avoided a simplistic mapping of longitude and latitude<br />
coordinates on a sphere into hue and saturation. In our<br />
approach the proportion of a color in the image is defined<br />
by the proportion of the corresponding orientation in the<br />
raw data and is not distorted by the nonuniformity of color<br />
representation that would be caused by the longitude/latitude<br />
mapping. On the other hand, simple longitude/latitude<br />
mapping could be much more efficient from the
computation<strong>al</strong> point of view. For some applications anisotropic<br />
maps may suite even better than the ones we have<br />
created. Spheric<strong>al</strong> color maps may be viewed as visu<strong>al</strong> filters<br />
and the search for particular features in the data may<br />
pose specific requirements for the design of these filters.<br />
Figure 8. 32 x 32 detail of orientation data in<br />
Figure 6 colored with the 64 colors map of<br />
Figure 4<br />
Even without optimizations to find out ray-polyhedron<br />
intersection, the processing time of the 10,000 sample<br />
points on a SPARCstation 1+ was a matter of a few<br />
minutes, which is negligibly sm<strong>al</strong>l compared to the time<br />
required to collect the data. Nevertheless, the application<br />
of multiple color maps, the selection of subregions, and<br />
the reprocessing of those regions interactively would<br />
require some optimizations.<br />
We only briefly mentioned the misorientation imaging<br />
and presented some of the possible techniques but<br />
there is much more to be said about it and we hope to do<br />
so in a forthcoming publication. Fin<strong>al</strong>ly, the comparison<br />
of orientation patterns with the SEM images of the same<br />
sample, we believe, will provide many new insights into<br />
the structure of polycryst<strong>al</strong>line materi<strong>al</strong>s.<br />
Figure 9. The same data as in Figure 8, each<br />
square is oriented according to the z'<br />
direction<br />
References<br />
[1] Alpern, B., Carter, L., Grayson, M., Pelkie, C., Orientation<br />
Maps: Techniques for Visu<strong>al</strong>izing Rotations, Proceedings<br />
of Visu<strong>al</strong>ization 93, 1993<br />
[2] Dingley, D.J., On-line microstructure determination<br />
using backscatter Kikuchi diffraction in a scanning electron<br />
microscope, ICOTOM 8, The Met<strong>al</strong>lurgy Society,<br />
1988.<br />
[3] Encyclopaedia of Mathematics, vol. 5, p. 275, Kluwer<br />
Academic Publishers, 1990.<br />
[4] Fekete, G., Rendering and managing spheric<strong>al</strong> data with<br />
Sphere Quadtrees, Proceedings of Visu<strong>al</strong>ization 90, San<br />
Francisco, 1990.<br />
[5] Foley, D.F., van Dam, A., Feiner, S.K., Hughes, J.F.,<br />
Computer Graphics, Addison-Wesley, 1990.<br />
[6] Frank, F.C., Orientation Mapping, Met<strong>al</strong>lurgic<strong>al</strong> Transactions<br />
A, Vol. 19A, March 1988, 403-408.<br />
[7] Randle, V., Microtexture Determination and its Applications,<br />
The Institute of Materi<strong>al</strong>s, 1992.<br />
[8] Visu<strong>al</strong>ization of Multiparameter Images, Panel Session,<br />
Proceedings of Visu<strong>al</strong>ization 90, San Francisco, 1990.<br />
[9] Wenk, H.-R., ed., Preferred Orientation in Deformed<br />
Met<strong>al</strong>s and Rocks: An Introduction to Modern Texture<br />
An<strong>al</strong>ysis, Academic Press, 1985.<br />
[10] Wright, S.I., Adams, B.L., Kunze, K., Application of new<br />
automatic lattice orientation measurement technique to<br />
polycryst<strong>al</strong>line <strong>al</strong>uminum, Materi<strong>al</strong> Science and <strong>Engineering</strong>,<br />
A160 (1993) 229-240.
s��������� e���— ƒ�—��� ��� ��� e�—����� ��<br />
€—�� s�����—� w���� g—��� ‚������<br />
€—���� tF w��—�D h��—������ �� g������� ƒ����<br />
w—��� ‡—����D h��—������ �� €�����<br />
x—����—� g����� ��� ƒ������������ e����—�����<br />
…��������� �� s������� —� …�˜—�—Eg�—��—���D TIVHID …ƒe<br />
e˜���—�<br />
‡� ������� — ��� �������� ��� ��� ����—���—����<br />
—�� —�—����� �� ��� ������� ���� w���� g—��� �����—E<br />
����� ˜—��� �� E�������� —�� E��—���F „�� ���E<br />
� —����—���� �� ������� �� ���� —����� �� ��� —�—�E<br />
���� �� ��� ��—����E���—��—� ˜��—���� �� ��������<br />
�������� —�� ������ —���� �� — ����—� —� ���� ���<br />
������—�����F y�� �������� �� —� ����������� ����<br />
�������� ��������� �� ��� �������F p����D ��� —�E<br />
���—� —����� ��� �� ����—���� ��� ������ �� — �—����<br />
�—�� —� �—����� ������ �� ���—�� —�� �����—������ �����<br />
��� ����� �� ���—�� ��—� �� ���� —�������—��F ƒ����D<br />
����� E��—��� ��� —� �˜�—�� ��—����—���� ��—�����<br />
�� ��—��—� ���������� �� ��� ������D ��� —� ��� ˜����E<br />
—�� ������ —�� �������� —��— �� �������D ��—� ����� ˜�<br />
�� ��� �� �˜�—�� ���������F<br />
I s����������<br />
€—�� s�����—� w���� g—��� @€swgA ‘I“ �� —� ��—�<br />
�����—����—� ������ ˜—��� �� p����—�9� ‘U“ €—��<br />
s�����—� ����—���� ��� �������� �—��E˜��� ��—����<br />
���—��� —� ���� ������—�����F s� €swgD ��� ���E<br />
��—��� �—������ —�� ����� ���� ���˜—˜������� ������E<br />
��� �� ����� ��—���� ���—��—� �����—���� �—����<br />
�� ˜� ����� �� ����� ��� —�� ��� ���������D �F�F ˜�����<br />
—�� —���� — ����F e� ��� ������ �� �����—� �—���E<br />
��� �������D ���� �� �—����� ������—��� —�� �����—���<br />
���� ���� ������ —�� ����� �����—� ��—������� —��<br />
�������F y�� —� ��� ��� ������� ���� ��� ���E<br />
��—����� �� —������ ��������� ��� —� ’h��� — ������<br />
—����˜�� �� — ����� ����—� ����—� ��� ���� — �� —��<br />
–���9 @�—�A ��� ��˜���—��D �� ���� �� ���� �������� ��E<br />
���—�c4D ’s� ��� —����˜—�� ����� ��������D ���� ��—�<br />
�� ����� ���� ������˜�����c4 —�� ’h� ��� �������� ���E<br />
��—�� ���� — ������� �� ��������D �� �� ����� — ��—��<br />
���—�—���� ���� �—��� ��������� —����˜—�� �������<br />
—�� �—���� �� ��� ����—� —��—c4 „� —����� ���<br />
���������D ��� ����—��� ����—����� ��� €swg �������<br />
����� — ��� ��—��—�� ���������F p�� ��—����D p�����<br />
I �������—��� — ����—� ����—���—����F „���� —�� — �����<br />
�� �˜����—����� ��—� �� —� �—�� ������—���� —˜���<br />
��� ����F p����D �� ��� —�� �� �—������ �� ���—������<br />
—� ����—��D ���E���������—� ����—���—����� —�� �� E<br />
���� ���� ������ �� ��� �����—���� ��� �—������ —��<br />
�� QE�F ƒ����D ��� ����—���—���� ����� �� �—���� ���<br />
�—� ��—� ��� �����—����� —�� ����� ���� ����� �������<br />
˜����—�� ���������F e ����� ���� —� ��� ���� ����<br />
����—� ��—� ��� �—�— —�� �����—��� ���� �����D ����<br />
��� ������� �� ��� �—���� ˜�� ������������ ��� ���E<br />
�—����—� ���—��F …���� ����—���—����� ��� —� ��—� ��<br />
p����� ID ��� —� —����� ��� ��������� ����� —˜���D<br />
—� ��—�� ��—���—������F<br />
s� ���� —����� �� ������� — ��� �������� ��� —�E<br />
—������ €swg ������� ˜—��� �� E�������� —�� E<br />
��—���F e���— �������� —�� — �������� ��������<br />
��� �����˜��� ��—�� —�� ��—� ‘QD S“F q���� — �����<br />
��� ƒD ��� —� �� �� — �—���� �� ��—��� ��—� —�����<br />
��� ��������� ������ �� �� @ƒ —����A �� �—��� @���<br />
����� ���� �� ƒA ��—��F e���— ��—��� —�� ˜—��� ��<br />
��� h��—��—� ���—����—���� �� ��� ����� ���F „�� h�E<br />
�—��—� ���—����—���� �—� ˜� �—����—� �� ���� ��—����D<br />
˜�� ��� �� ������ �� ��� h��—��—� ���—����—���� —� —<br />
�������—� ������ �—� ˜� ���� �—����—�F ƒ������—�<br />
�������� —�� ��—��—�� ������ �� —���˜�—� �����E<br />
��� —�� —�� — �����—�D �—����—��—��� �������� �—� ��<br />
�����˜��� ������� �� ��—� �� ����� �� ������� ’˜����E<br />
��� ˜����4 ��� —� ����� —�� ���—�����F y�� —��—�E<br />
�—�� �� ���������� ��� �� ������� �� ����� �� �������—�<br />
�������� �� ��—� ��� �� ������� —� ˜� �����—����� ��<br />
������ ���������—� ��—�� ‘T“F<br />
„�� ����� �� E��—��� �� — ���� ��� �� ������ —��D<br />
�� ��� �—�— ���� ������� ����� ������� ˜����—��<br />
���������D ��� ������ �� ��� ������� ��� ��� �—�<br />
���������F s�����—���� —˜��� ��� �—�� �������� ˜�<br />
�—� �—����� @—� �����—��� ˜� ��� ����� �� p����� IA ��<br />
��� �—�� �� ��� �����F e�� ��� ������ �� ��� ����� ���<br />
—�� ���—��� ���—���F<br />
s� ��� ��������� ������D �� �� �� ��� �����������
p����� IX e ����—� ����—���—���� �������� ��� €—�� s�����—� w���� g—��� �—�—F<br />
—�� ������ ���� �� ���� —�����F s� ƒ����� Q ��<br />
������ ���� �� ��� ���������—���� ������F ƒ����� R<br />
�������� ������� ���� ��� ��—���� �—�— ����F p��—���D<br />
�� ƒ����� S �� ������� ���� �������� ��������F<br />
P h� �������<br />
‡� ������� ��� ˜—�� �� ������� ������ �� �����E<br />
��—�� E�������� —�� ��—��� �� ‚ P F ‚�������� ��<br />
���� ���—���� �������—����� �� ��� ������ ��—� ������<br />
—�� —��� �������F<br />
PFI q����—� €�������<br />
s� ��� ��������� �� ������� �� —����� ��—� �� Q<br />
������ —�� ������—� —�� �� R ������ —�� �����—�F „��<br />
�������� �� ����� �������—�� —��� �� ����� —� �����—�<br />
��������F h������—�� —��� �� ��� �� ��—���D —��<br />
��� ���������—���� —� �—���� ����D ˜�� ��� �� ��E<br />
����� —�� ��—��� �� �� �� ��� ���� ��� ����—� —���<br />
����F<br />
PFP ƒ������� —�� g��������<br />
s� ‚ P �� ������� — ������� �� ˜� ��� ����� ����<br />
�� ��� ˜� ID P �� Q ������F ƒ�� �������� —�� �����<br />
—� �������D ����� —�� ���—�����D �����������F e ��˜���<br />
�� ��� ��� �� ������ „ �� ���� — ������� ' �� ���<br />
—������ �������D — �—� �� 'F e ������� �� ��� ˜� —<br />
������ ��˜��� �� „ �� — ������ �—� �� 'F „��—����� �—��<br />
���� —�� ������ �—��D ����� �—�� ��� ������ �—��F<br />
‡� ������ ��� —�� �� —� ����� ��˜��� �� „ ��� �����<br />
�� �������F<br />
p����� PX e� E������ —�� —� E��—��F<br />
e �������—� ������ g �� — �������� �� ��������
�—�������� ��� ���������X<br />
IF s� ' �� �� gD ���� ����� �—� �� ' �� �� gF<br />
PF „�� ����������� �� 'IY 'P P g �� ������ ����� ��<br />
— �—� �� ˜��� 'I —�� 'PF<br />
s� g �� — �������—� ������D ���� g H g �� — ��˜������<br />
�� �� —��� �—��� �� ��� �������—� ������ ���������F<br />
„�� ��—�� �� — �������—� ������ g �� ��� ����� ��<br />
��� ��� �������� �� gF „�� ��—�� �� g �� ���������<br />
������� —� �g�F p����� P �������—��� — �������—� ������<br />
—�� ��� ��—��F x���� ��—� ��� �������—� ������ ��<br />
��� �����—���� �������D —�� �� �—� ���—�� �����<br />
������ �������F<br />
e ���—����—���� �� — ���� ����� ��� ƒ �� — �������—�<br />
������ g ��� ��—� �—� ������� �� g �� �� ��� ˜�<br />
������ �� ƒ —�� �g� a g���@ƒA �� ��� ����� ���� �� ƒF<br />
PFQ „�� h��—��—� „��—����—����<br />
p�� — ������� ' �� ��� ˜� ��� ����� ��� „ D ��� f '<br />
������ ��� ��—����� ���� ���� ����� ��� ������ �� „<br />
—�� �� ��� ���� ˜����—��D —�� ��� & ' ˜� ��� �—���� ��<br />
f 'F p�� — ������D �� ��� & ' a HF<br />
v�� —˜ ˜� —� ���� �� — ���—����—���� �� ‚ P —�� ���<br />
�—� �� ��� ���—����� —˜ —�� —˜�F i��� —˜ �� ��—���<br />
h��—��—� �� � �� ��� ������ f —˜ @�� �����—������D ��<br />
��� ������ f —˜�AF i���� �� ��� ˜����—�� �� — ���—�E<br />
���—���� —�� —��—�� ��������� �� ˜� ��—��� h��—��—�F<br />
„�� h��—��—� ���—����—���� �� — ���� ����� ��� �� ���<br />
���—����—���� ����� —�� ��� ����� —�� ��—��� h��—��—�F<br />
„�� h��—��—� ���—����—���� �—� �—�� ����������� —��<br />
������ ����������F €���—�—�— —�� ƒ�—��� ‘II“ �����˜�<br />
��� ���—����—���� —�� — ������ ���—��� ��������D ���<br />
†������ ��—��—�D �� ���—��F<br />
PFR e���— g�������� —�� ƒ�—���<br />
p�� — ���—����—���� �� — ���� ����� ��� ƒD �� �—�����<br />
�—� ���� —� ��� �� ��� �����F e� ���� ' �� —��—���<br />
�� f ' ’ ƒ Ta Y —�� ��—��—��� ���������F ‡��� �������<br />
—� ���� �� ��� h��—��—� ���—����—���� �� �� �� ����<br />
�� ������� ��� ������� �� ��� ��� ���—����� ���� —�<br />
���� —������F e� ���� —˜ ���� �� ��� �—� �� ���—�����<br />
—˜ —�� —˜� �� —��—��� �� f —˜ ’ �Y �� Ta YF †������<br />
—�� ���—����� —�� —��—�� ��������� �� ˜� ��—��—���F<br />
q���� ��� h��—��—� ���—����—���� h �� ��� ˜� — E<br />
���� ����� ��� ƒD —� E������ g h �� — ��˜������<br />
����� �—� ������� ' P g �� ������<br />
��—��—��� —�� & '<br />
��� �—� �� —������ ������� �� g<br />
e� E��—�� �� ��� ��—�� �� —� E������F<br />
p����� Q �������—��� —� ��—���� ����� ��� @ a HA<br />
—�� ����� —�������—� E��—���F s� ��� ��—��� —�� ��E<br />
������� �� ������� ����� ��—����� —� ��� ����� ����D<br />
���� ��� ��—��� —�� �� ����� �� ����—���� F<br />
PFS „�� …���� �� h����<br />
e� —�����—�� �������� ��� ����—������ — �—�� �����<br />
��� ƒ �� �� ��—� — ���� �� �—���� ������� —� �—�<br />
����� �� ƒF e� ���� E��—���D �� ����� ���� �� ��� ����<br />
�������� ��� ���� �� �����—� ��� �—�— ˜�� —��� �� �—��<br />
��—����—���� ��—�������F p�����—����D ����� �� — ����<br />
�������� ˜������ —� E�������� —�� ��� ����� �� —<br />
��� �� �����D i����˜������ ‘T“ �����˜�� ���� ��������<br />
�� ���—��D �������� ������—� ��� �������� ˜����—��<br />
������� —�� —��—F „�� ����� �—�� ���� �� p����� R<br />
�������� ���� ��������� �� ��� ��� E������ ������<br />
��� ���—��������� �� ��� �����F p�� ��—����D �����<br />
��—� �� ����� �� —� ���� ˜������ ��� �������D ���� ���<br />
������������ ����� ��������F v�������D �� — ���—����<br />
�� �—�� �� ��� E������ ���� ��� ����� ������������<br />
����� �—�� — ����� �����������F<br />
PFT f���� x��˜���<br />
f���� ���˜��� —�� — ����� ���� —���˜�—� �����E<br />
���F „�� ��� f���� ���˜��D �D �� ��� �—�� �� ��� ���<br />
�������� ����� �� — ��������—� ��—�F w������ ‘IH“<br />
����—��� �� ��� f���� ���˜��� —�� �—�� —����—���<br />
������ �� ���—��F s� ���� —����� �� —�� �—�����—���<br />
���������� �� H —�� IF H �������� — ���� �� ���<br />
���˜�� �� ������� ��������� �� — ��—��F s����E<br />
�—���D I �� — ���� �� ��� ���˜�� �� ����� �� — ��—��<br />
��˜����� �� ‚ P F s� —��� ����� ����� —�� �������<br />
˜����—�� ���������D —� ��� ��� ����� �� p����� TD ����<br />
��������� ���������—���� �� —����� ����� ˜�� ��� �����F<br />
‚—���� ��—� �������� —�� ��� ����—���� �����—�� ��<br />
���������� �� �� I �� �����—�� ��� ��—��� �� �����<br />
�� ‘IH“D ����� ��� ���� —����� �� ������� �� ��� ���<br />
����� ������ �� ’���� ����F4<br />
PFU ƒ���—�����<br />
e ����—���� ������� �� — ������� � X ‚ 3 ‚ ��—�<br />
�—�� — ��—� �—��� �� — �—��� �� �—��� ‚F ‡� ��� ���E<br />
�—���� �������� ��—� �—� �� ��—������� ��� —� ���<br />
�������� —��— —�� ˜����—�� ������ �� g F ‡� —� —���<br />
������ ����—����� ��—������ ��������—� ��—�������<br />
��� —� ��� ���˜�� �� ������� ���������F ƒ���<br />
�—�� ����—����� ���� �—��� ���� g �—����D �� ��<br />
��������� �� �� �� ����—����� ��—� �—� —� �������<br />
����� �� — �—��� ‚F p�� —� ������� �D ��� ‘�“ ���������<br />
��� ��� �IY PY X X X Y �� �� ������F e� ����� ���� ��� ���<br />
‘�“ �� —��� ����� —� — �—��F e ������� ����—���� ���E<br />
���� �� — ������� � X ‘�“ 3 ‚ ��—� �—�� �—� �����
p����� QX e ����� ��� ˜—��� �� ��� ��—�—� ������ �� ��� —��� ����� —� ���� �—����F<br />
� P ‘�“ �� — �—��� �@�A �� �—��� ‚F ‡� ���� ���� ���<br />
—������� ������� �� �� �� ��—� ���� ������F<br />
ƒ���—���� �������� ������� ������—���� —˜��� ���<br />
��� E��—�� �� E������ ������� —� �����F „���<br />
���� ���� —� ��—��� ���� ���—�� ���������� —�� —� ˜�<br />
���� �� ������� ����������� ��—���F<br />
Q s��������—����<br />
QFI q����—� €�������<br />
„�� —��������� �� �����—� �������� �� ��� �����E<br />
��� ������ —������ �� �� ������� ��� �� ������� �� —<br />
������� ����D ������� ��� ���� �� ���� �—�� ����—�<br />
—���F ‡� ����� ���� ��� ���������—���� �� —��� ˜�<br />
���� �� ��� ����—� —���D ˜��� ��� ˜����� ��—�—˜�����<br />
—�� ����—˜�����F „� —����� ���� ��—�D �� ��� ’ƒ����—E<br />
���� �� ƒ��������4 ‘R“D �� ƒ�ƒ ��� �����F ƒ�ƒ �� — ���E<br />
��� ��—� �������� ���������� �� —����� ������� ����� —<br />
�������—�� —�� �—� ���F s� ‚ P D ƒ�ƒ �������� ���<br />
����������F v��� ���� �—��� ����� ����� —��������<br />
—�� —������ ������� ��� ����� ����� �� �� ��� ���� ��<br />
����� �� — ���� ������� ��� ��� ���F s� ���� �—���<br />
���� ������ —� —�������� —�� —������ ������� ���<br />
������ ����� �� ������ — ���� �������˜��� ��� ���<br />
�����F „� ������� — �������—�D ƒ�ƒ �����—��� — ���˜E<br />
—��� ��������� �� �������—� ������˜—���� —�� �—���<br />
�������� ˜—��� �� ��� ���� �˜�—���� ���E�������—��<br />
�—�—F „�� �—� ��—� �������—�� —��� ��� �� ������<br />
���� ��� ���� �� ��� ���������—����F ‡� �����—��<br />
��� ��—��� �� ��� ‘R“ ��� ���—���F<br />
QFP ƒ������� ƒ�������<br />
q���� — �—��� ��� ˜� ��� ����D �� ����� ���E<br />
����� ���� ��� h��—��—� �������—� ������ �� ���<br />
��� E��˜������F „� —������� ����D �� ������<br />
— ��������� 7 ��� �—� ������� —� — ������������ ����F<br />
e ������� ' �� �—�� �� g �� ��� ��������� 7 F s� '<br />
�� ��—��—���D ���� �� �� �� 7 a & 'F y��������D �� '<br />
�� —� —��—��� ����D ����<br />
7 a w���& ( � ( P …�@'Y hA�<br />
����� …�@'Y hA ������� ��� ��� �� �������� ��—� ' ��<br />
��� �—� ��F s� ���� —�� …�@'Y hA ������� ��� ���—�����<br />
��—� ���� ' —������F x���� ��� �� ����� ˜������ & '
p����� RX „�� ����� �� �—���� ����� —�� ��� �—�� ���� ���� ��� E��—�� ������������F<br />
‘<br />
H<br />
@��� �� g A ������—� �����—� ��������<br />
—�� 7F p�� — ������� 'D & ' ���� �� ��� �—���� �� 'D<br />
���—������ �� ������� �� �� ��—��—��� �� —��—���F y�<br />
��� ����� �—��D 7 �� — ��������� ��������� ���� ' ���<br />
˜����� �—�� �� g F<br />
‡� ������� �—����� �—� ������ —�� ���� ' P g —�X<br />
������—� �� ' P f�@g A —�� ' �� ��� — ������ �—�<br />
�����—� �� ' P f�@g A —�� ' �� — ������ �—�<br />
�������� �� ' TP f�@g A<br />
����� f�@g A ������� ��� ��� �� �������� �� ���<br />
˜����—�� �� g F „���� ����� �—��� —����� ���������<br />
�� ����� @�����˜�� �����A ��˜������—�� �� ��� ������—�<br />
‘7Y IAD —�� �� —� �� �� ��� ���������� " —�� " ��<br />
������� ��� ��˜������—��F p����� S �������—��� ��� —<br />
������� �� �—��� �� ˜� 7D " —�� "F „� �—�� �� ����E<br />
���—�� �� ���—� ��� �������� �� ��� ˜����—�� �� h —�<br />
����—� —���D �� ������� �—� ˜����—�� ������� ��<br />
˜� ��� �—� �� — ���—���� ( ����� & ( a IF ‡��� ��—�<br />
��—�� ���� —����D �� �� �� " —�� " ��� �—� ������<br />
—�� ���� �� h �� ˜�X<br />
" a w���& ( � ( P …�@'Y hAY ( ��—��—����<br />
A‘<br />
7<br />
" a w—��& ( � ( P …�@'Y hA�<br />
e� —��—��� ���� H ���—��� �� ����D — ������� '<br />
˜����� �����—� ���� �� ��� ˜����� ��� ������ �—�<br />
A‘<br />
"<br />
p����� SX „�� ���� �� — ������� �� g ��� H ` IF<br />
A‘<br />
"<br />
A<br />
I<br />
�� —������ ������� �� g D —�� ' ˜����� �������� ����<br />
����� ������� ��—� �� �� ��� �—� �� �� h �� �—�� �� g F<br />
QFQ e��������� —�� g���������<br />
„���� —�� �—�� —��������� �� ����� ���� ��� ��E<br />
������ h��—��—� ���—����—�����D ��� ��� ��—���� ‘II“F<br />
y�� ���������—���� ���� ��� �—�������� ��������—�<br />
—�������� ��������� ˜� q��˜—�D u���� —�� ƒ�—��� ��<br />
‘V“F „��� —�������� �—� y@� Q A ����� —�� ���� ��� �<br />
������D ˜�� �������� �� y@� ��� �A ������� ����F ‡�<br />
����� ��� ��—��� �� ‘V“ ��� ���� ���—���F s� ��—���<br />
���������� ��� h��—��—� ���—����—���� �� ��� �������<br />
���� �� ����� �� ����F<br />
„�� ���˜�� �� �������� �� ��� h��—��—� ���—����—E<br />
���� h �� ‚ P —� ˜� ������� �—���� ˜—��� �� i����9�<br />
���—����F v�� p � ˜� ��� ���˜�� �� �E�������� �� hF<br />
s� pH a �D ���� pI Q� 0 T —�� pP P� 0 RF v��<br />
� a pH C pI C pP ��������� ��� ���˜�� �� ��������<br />
�� hD ���� � T� 0 IHF „�� �—����� ���˜�� ��<br />
E��—��� �� ��� ˜� — ����� ��� �� ���—� �� ��� ���˜��<br />
�� ������ �—��� ��� ��—��—��� ��������F „�� �—�E<br />
���� �—��� ��� ���� ���˜�� � ����� ��� �� —�� ���<br />
�������� ���� ��—��—��� —�� �—� ������ �—���D �����E<br />
���� � S� 0 WF g�������� 7D " —�� " ��� �—� ���E<br />
���� —� ˜� —��������� �� ���� ����������—�� �� ���
���˜�� �� ��������D ���� ��� ��������� —���—�����<br />
��� ��� �������� —� ˜� �������� �� ����—� ����F<br />
q���� —� E������ g ���� ��� ����� �—˜���� —�<br />
������—�D �����—� �� ��������D �������� ˜—�� ��—�����<br />
��� —� �������� —��— —�� ˜����—�� ������ �� ���—����E<br />
����—��F „�� —��— �� ��� ��� �� ��� —��— �� �—� ���E<br />
—���� �� g F „�� ˜����—�� ������ �� ��� ��� �� ���<br />
�����—� ���� ������� ���� ���� ��� ��� �� ��� ������—�<br />
���� �������F y�� ���� ������ — ����—���� ��� —�<br />
��� �������� —��— ����—���� ������ ˜� �������� ���<br />
—��— ��� �—� ������ �� ��� E��—�� �—����F h�� E<br />
�—�� —�� i����˜������ ‘P“ �����˜� — ���� � ����<br />
—����—� ��� �������� ��� —��—D ˜����—�� ������D<br />
H —�� I ����—����� ��� — ��—�� �—���� ˜—��� �� ��E<br />
������—� ���������F<br />
ƒ g—��@ƒA ���� @��A<br />
p����� P PSU P<br />
p����� T VHH V<br />
p����� Q VIWQ SV<br />
„—˜�� IX i�—���� �����—� �����—���� �����F<br />
QFR €������—��<br />
„�� �����—����� —����� ��� ˜� ��� ���������—E<br />
���� —� ˜� ��� ���� ��� —��������X ����� ��—� �—��<br />
��—� �����—��� —�� ����� ��—� ��� �—� ���� ��� ��E<br />
���� — ��� �—���F p�� ��� �—����� �—�— ��� �����˜��<br />
����D ��� ���� �� ������ —�� �����—� —� E��—��<br />
����� �� ���� ��—� ��� �����D �� �� ������—�� ��<br />
��������� — ��� ��—���� ����� ��� ��� �����—� ����E<br />
�—���� ����F „—˜�� I ����� ������� ˜—��� �� ���� �� ���<br />
�—�— ���� ���� ��� ��� �������—�����D ��� �����—�����<br />
���� ���� �� —� ƒqs s����� i�—� ������—����F „����<br />
������� �� �� —� ���������—���� ��—� �—� ��� ˜���<br />
����������� ���������F<br />
R ‚������<br />
‡� ������� ��� ��—����� �������—���� ��� ��� ��<br />
E��—��� ��� ����—���—����F s� ��� ��� ��—���� ��<br />
������� — ����� ��� ����� ��� �� ���—���� ��������<br />
— ������� ’���������4D �� ��� ����� �� ������� ���<br />
�—���� �—�� �� — ������ �—�����F<br />
RFI e ’ƒ��������4 i�—����<br />
y�� ��� ��—���� �� ���� — €swg �����—���� ��<br />
— �—��� ������—� �� ����� ������—� ��������D rPD<br />
���� — �—���—��� ���� ��� �—��� ‘IP“F „�� �����—����<br />
�� ��� �� �� — ���—����—� ˜�� ���� ������� ˜����—��<br />
���������F s� ���� �—�����—� �����—����D — ��—�����<br />
�� ���� �� ����� �� p����� TD „a HXSu —�� ��� �—�E<br />
��—��� ���� ��� �—��� �—� IaQ —� �—�� rP �������� —�<br />
— �—��� ���� ��� �—�� ����—� ����—� �������� �����<br />
�—��D ���� ������ ��� ˜���F s� ���� ������ —� �����E<br />
�—�� �������� ��—� —� ˜� —�������� ����� E��—��� ��<br />
������� �� ��� ��� �—���—��� ���� rP ��� �—��� ����—��<br />
��� ���� ��� ����—�D �� ������� �� ����� — ���� ��<br />
�������D ��� �—���� ��������� �� ������� �� �� ����� ��<br />
������F ‡� �˜����� ����—� ������� ���� — �—���—���<br />
���� ������ ��� �—��� ����—�� ��� ���� ��� ��˜���—��<br />
����—�D ���� —� ��� ���� �� ��� ������ ���—���<br />
��� �—����� —���� ˜� �����—���� —�������—� �������<br />
��������� ������ ���� ��� ����� ��� �—������9 ������<br />
������F „� ��—����� ���� —�� ������ ��� �������� ��<br />
—˜���� �� — ������� ��—������� �� ���� ��� ������E<br />
—� �—��� �� ��� ���� ������� �� — ������� ������ ˜� —<br />
�—���—��� ���� ����—� ��� �—���F x��� ��—� — ������<br />
����—� ���� �� ����—� —������ �� — ������� ���� �—�<br />
�� �—� ��� ����—� ��� ���� ��� ��˜���—��F<br />
s� �� ���� ����� ��—� ��� ����—� �� — ����� ��<br />
��� ��������� —� �� ��� ����� ��—� ��� —���� ��<br />
�������� —� ��� ����—� ���—��� �� ��� ����˜�� ���<br />
�—�� �����—� ����—����� —��—������� —� ���� ������<br />
��� ˜��� �—����—�F „�� �—������ �� ��� ����—� ���<br />
�—��� �—� ˜� —˜�� �� ����� ����� ���—� ���� ������ ˜� ��E<br />
—��—����� ����������D —�� ������ ��� �—����—� ������<br />
����� �—� ��� �—�� ˜��� ������ �—������ ��—�˜� ��<br />
��������� �� ��� ����—� ��� �—���D �� ��—� ����—��<br />
������F<br />
v�� x € ������ ��� ���˜�� �� �—������ �� ��� —<br />
�—���—��� ���� ����—� ��� �—���D —���� �� ��������F<br />
„�� ���� ������� �� — ������� �� — ����—� —� ����<br />
˜� ������� —�<br />
a x € @� € 0 � p A a v €<br />
����� � € —�� � p —�� ��� ˜������ �������� ��� �—���E<br />
�� �� ��� ˜��� ��˜���—�� �� — �—���—��� ���� —�� —<br />
��������� ���� ��� �—���D �����������D ˜��� ��—����<br />
�˜�—���� ���� €swgF „�� ���—� ��������� ������ v € D<br />
�������D ���� ��—����� ��� ��˜���� ����������<br />
�� —�� �������� �� ����—�� �� ��� �—���—� ��� �—���D ����<br />
˜� —���—��� ���� E��—��� ˜�—��� — ���������D ��E<br />
��—�—˜�� �—� �� �� �� ��� ���� �� —�� �������� �� ���<br />
����—� �� ������D —�� ��������� ���� ’˜� �—��4 �� ���<br />
����—˜��F<br />
p����������D ��� ������� �� �—������ ��� —��— e<br />
�� — ������� �� ����—� �� ������—�� ˜�—��� �� ��—�<br />
�—��� �� ��� ���� ��� ������������ ������� �� — ˜���<br />
�—���D ���� ����� ���� ˜� — �������� ���—��������<br />
��������� ˜������ ��� ˜��� �������� —�� ��� ����—�<br />
���� �—���� ����—� �������F ƒ����—� �� ��� —�� ��<br />
��� ���� �—���� �—���� ������� �� p����� QD p����� T
p����� TX „�� ����� ��� ������ ������� ˜����� ��� ��� ��� ��—����D —� E��—�� —�� ��� ���� �����F<br />
����—����� ��—� ������� x € ��� e —�� —��—�� �—�� ��<br />
�˜�—��F<br />
Norm<strong>al</strong>ized Signature<br />
1<br />
0.8<br />
0.6<br />
0.4<br />
0.2<br />
Shoreline Topologic<strong>al</strong> Signatures as Function of Rank<br />
Betti_0<br />
Betti_1<br />
Alpha<br />
0<br />
0 500 1000 1500 2000 2500 3000 3500<br />
Rank<br />
p����� UX „�������—� ����—����� ��� ��� ��—����F<br />
p������ U —�� V �������—�� ˜—�� ��������—� —�� ���E<br />
�� ����—����� ��� ��� ��������� ��—����F f���� H @ HA<br />
�� p����� U ���������� �� ��� ���˜�� �� �������<br />
��������� ��� �—� E��—��F f���� I @ IA ����E<br />
������ �� ��� ��� f���� ���˜�� ��� �—� E������F<br />
I �� ������� ��� ���˜�� �� ’�����4 �� �—� ������F<br />
„�� ��—�� �� p����� U —��� ������� — ���� �� ��� ����E<br />
��� ���—���� �� ��� ������—� —����—��� ���� �—�<br />
�—��F „��� �� ��� — ��������—� ����—����D ˜�� �� �� ��E<br />
����� �� �������—�� ��� ��� ������—�� —����—��� ����<br />
�—� �—�� —�� ������˜���� ���� ��� �—��� �� F „���E<br />
—��� ��� ������—�� —�� ��� ������ ������˜����D ���� —��<br />
�� ��� ��� �—�� �� ��� �—���F<br />
s� ���� —���D �—�����—��� ���� ��� ���� �� �����E<br />
����� �� ����� ����—�����D �� �� ���������� �� ����<br />
����—����� —� — ������� �� F p�� ��—����D p����� V<br />
Norm<strong>al</strong>ized Signature<br />
1<br />
0.8<br />
0.6<br />
0.4<br />
0.2<br />
Shoreline Metric Signatures as Function of Alpha<br />
Boundary<br />
Area<br />
0<br />
0 0.5 1 1.5 2 2.5 3 3.5 4 4.5<br />
Alpha<br />
p����� VX w���� ����—����� ��� ��� ��—����F<br />
����� ��� ˜����—�� ������ —�� —��— ����—����� ����E<br />
��� �� ���� �—����F x��� ��� ˜��� ����—����� —��<br />
���—������ —� ���� — ���� �—��� �� D ���������� ��—�<br />
��—��� �� ���� �—��� �—� ˜� �—���—� �� ��� ����� ���F<br />
s�����D ��� ��—��� ��������� �� ��� ��� ���������<br />
�� ���—���� ����� �� p����� TF<br />
RFP e ƒ����� €—����� ‚—���� ‡—��<br />
„�� �—���� �—�� �� — ���� �—����� �� �����—���� ��<br />
— ������ �—����� �� ����� �� — ���D �� �� —� —���<br />
����—���� �� — ����� ����—� —���� —���������F g��E<br />
����� ������ —���� ��� �—�� ��—�� ˜� ��� — �—����<br />
�—����D ����� �� ��� ����� ���� �� p����� QD ���� ��<br />
���� ����� �� ˜� — ��—�—� �˜���‘W“D �F�F ��� ��—�����<br />
����—�� �—��� —� — ���E������� ����� �� ��� ����—�<br />
������ �—��D —�� ��� �—�� ����� �����—� ���—������ ��<br />
��� �—��� —����F p�� — �������� �� �������� �� ��<br />
�� �������� ��� ’����—� ���4 ��� �� ����� �—����� ��D
�F�F ��� ��� —��— �� �—� ����� ����D ˜�� —��� ���<br />
����—�� ��—�� �� ��� ������� —��—D ˜�—��� ˜��� —����<br />
��������� ���—����� ��� ��������� �� ��—� ����—�D<br />
�� —�—��������D ��� � ����� �—�� �� ��� �� ����� �—�E<br />
����F „�� —��— ����� �� ˜� ����� ������—��� ˜�� ���<br />
��—�� �� ���� ��—���� ���������� ˜� �—� �� ����—���—E<br />
����F e���— ��—��� ������� — ������ �� ������ �� ���<br />
����—� —��— —���� ���� ��� ������—��� ��—� ����E<br />
�—���� �� ��� ��—���� ���� ����� ��������� ˜� �—��<br />
�� �����—�� ���� ��� ��� �� �—����� ������—��� �����<br />
�� ��� ����� ���� �� p����� QF<br />
S g��������<br />
‡� �—�� ��������� — ��� �������� ��� ��������<br />
˜��� ��� ��—���—���� —�� ��—����—���� �—���� �� ���<br />
��—�� �� ����� ���� �����—��� ˜� €—�� s�����—� w����<br />
g—���F ‡���� �� ������ �� — �—���� ���� —����E<br />
—���� �� ���� —�����D ��� �������� �—� ˜� —����—E<br />
˜�� �� �—�� ������ ����������D �� �—�����—� �����<br />
����� ����� �� — ���� �� ����—���� —�� ��—���� ���<br />
����� �—����� �� ��� ������ �� ��—��F<br />
e��������������<br />
‡� ����� ���� �� ��—�� €�������� h—��� g�������<br />
��� ��������� ���� �� ��� �����—� ������—���� ��� ����<br />
���� —�� ��� ��������� ��� �—�— ���� ���� �� �����<br />
ID PD Q —�� RF ‡� ����� —��� ���� �� ��—�� ��� E<br />
��—��� ����—�� ����� ��—��� ˜� €�������� r��˜���<br />
i����˜������ ��� —���� —�� �����—������F<br />
‚��������<br />
‘I“ hF wF g������� —�� iF vF €�����D €—��E������—�<br />
�����—���� ��������� ��� ����� ��� R r�F s�X ƒF<br />
g—�—���� —�� eF p—˜����� @���FAD €���������<br />
�� ��� i�˜— g�������� �� w���� g—��� w������<br />
�� „�������—� €�����D IWWHD i„ƒ i������D €��—D<br />
@IWWPAD QSEUIF<br />
‘P“ gF h�� �—�� —�� rF i����˜������F e� �������E<br />
�—� —�������� ��� ˜���� ���˜��� �� �������—� ��E<br />
������F egw W�� e���—� ƒ�������� �� g����E<br />
�—����—� q�������F @IWWQAD PQPEPQWF<br />
‘Q“ rF i����˜������D hF qF u����—���� —�� ‚F ƒ�����F<br />
y� ��� ��—�� �� — ��� �� ������ �� ��� ��—��F siii<br />
„�—��F s�����F „�����F s„EPWD @IWVQAD SSIESSWF<br />
‘R“ rF i����˜������ —�� iF w����F ƒ����—���� ��<br />
ƒ��������X — �������� �� ��� ���� �������E<br />
—�� —��� �� �������� —���������F egw „�—��F<br />
q�—���� WD @IWWHAD TTEIHRF<br />
‘S“ rF i����˜������ —�� iF w����F „����E�����E<br />
����—� —���— ��—���F egw „�—��F q�—���� IQD<br />
@IWWRAD RQEUPF<br />
‘T“ rF i����˜������F „�� ����� �� ˜—��� —�� ��� ��—�<br />
��—��F egw W�� e���—� ƒ�������� �� g����E<br />
�—����—� q�������F @IWWQAD PIVEPQIF<br />
‘U“ ‚F €F p����—�D ƒ�—�����—� w��—���D e������E<br />
‡�����D IWUPF<br />
‘V“ vF tF q��˜—�D hF iF u���� —�� wF ƒ�—���F ‚—�E<br />
������� ��������—� ���������� �� h��—��—�<br />
—�� †������ ��—��—��F €��F IU�� e��F s�����—E<br />
����—� g���F e����—�—D v—��FD €����F IWWHF v�E<br />
���� x���� �� g������� ƒ�FD ƒ�������E†���—�D<br />
RRQD RIRERQIF<br />
‘W“ fF w—����˜���D „�� p�—�—� q������� �� x—����D<br />
‡F rF p����—� —�� g���—��D x�� ‰���D IWUUF<br />
‘IH“ tF ‚F w������F i������� �� e���˜�—� „�������F<br />
e������E‡�����D ‚������ g���D g—�������—D IWVRF<br />
‘II“ pF €F €���—�—�— —�� wF sF ƒ�—���F g����E<br />
�—����—� q������� � —� s����������F ƒ�������E<br />
†���—�D x�� ‰���D IWVSF<br />
‘IP“ wF ‡—���� —�� hF wF g�������D €—�� ������—�<br />
����� —��� �����—����� �� rP ����—��F tF v��<br />
„���F €���F WRD @IWWRAD ITIEIVQF
Piecewise�Linear Surface Approximation From Noisy Scattered<br />
Samples<br />
Michael Marg<strong>al</strong>iot Craig Gotsman<br />
Dept. of Electric<strong>al</strong> <strong>Engineering</strong> Dept. of Computer Science<br />
Technion � Israel Institute of Technology Technion � Israel Institute of Technology<br />
Haifa 32000� Israel Haifa 32000� Israel<br />
Abstract<br />
We consider the problem of approximating a<br />
smooth surface f�x� y�� based on n scattered samples<br />
f�xi� yi� zi�n i�1g where the sample v<strong>al</strong>ues fzig are con�<br />
taminated with noise� zi � f�xi� yi� � �i. We present<br />
an <strong>al</strong>gorithm that generates a PLS �Piecewise Linear<br />
Surface� f 0� de�ned on a triangulation of the sam�<br />
ple locations V � f�xi� yi�n i�1g� approximating f well.<br />
Constructing the PLS involves specifying both the tri�<br />
angulation of V and the v<strong>al</strong>ues of f 0 at the points of<br />
V . We demonstrate that even when the sampling pro�<br />
cess is not noisy� a better approximation for f is ob�<br />
tained using our <strong>al</strong>gorithm� compared to existing meth�<br />
ods. This <strong>al</strong>gorithm is useful for DTM �Digit<strong>al</strong> Ter�<br />
rain Map� manipulation by polygon�based graphics en�<br />
gines for visu<strong>al</strong>ization applications.<br />
1 Introduction<br />
Let f�x� y� be a smooth surface. Assume we are<br />
given n noisy samples f�xi� yi� zi�n i�1g of f at scat�<br />
tered locations V � f�xi� yi� n i�1 g� such that zi �<br />
f�xi� yi���i� where �i are independent identic<strong>al</strong>ly dis�<br />
tributed zero�mean Gaussian random variables with<br />
known variance � 2 . We wish to construct a PLS<br />
�Piecewise Linear Surface�� sometimes c<strong>al</strong>led a TIN<br />
�Triangulated Iregular Network�� f 0 � de�ned on some<br />
triangulation of V . The PLS f 0 should approximate<br />
the origin<strong>al</strong> surface f�x� y� as closely as possible� i.e.<br />
the distance jjf � f 0 jj should be minim<strong>al</strong>� for some<br />
norm jj � jj.<br />
This problem arises in the reconstruction of terrain<br />
surfaces from random DTM�s �Digit<strong>al</strong> Terrain Mod�<br />
els� extracted by automatic methods� such as match�<br />
ing stereo image pairs �see the many articles on this<br />
subject in �1��. These modern methods obtain terrain<br />
elevation samples wherever possible� usu<strong>al</strong>ly at feature<br />
points� resulting in a data set consisting of points at<br />
essenti<strong>al</strong>ly random locations in the plane. This con�<br />
trasts with the tradition<strong>al</strong> manu<strong>al</strong> DTM extraction<br />
procedures� where elevation samples are obtained on<br />
a regular grid� or at signi�cantly correlated locations<br />
in the plane. Both manu<strong>al</strong> and automatic DTM ex�<br />
traction methods are inaccurate� so noise is inevitably<br />
introduced into the elevation samples.<br />
We choose to reconstruct the terrain as a PLS�<br />
namely� a collection of triangles� as these are stan�<br />
dard geometric primitives in modern graphics engine<br />
hardware. Terrain visu<strong>al</strong>ization with texture�mapped<br />
aeri<strong>al</strong> imagery are popular graphics applications in vi�<br />
su<strong>al</strong> simulation environments �2�. Two issues must be<br />
addressed�<br />
� The PLS f 0 is a collection of triangles in 3D space.<br />
The topology of the triangulation is identic<strong>al</strong> to<br />
the topology of the speci�c planar triangulation of<br />
V used. As there are an exponenti<strong>al</strong> �in n� num�<br />
ber of di�erent triangulations of V � each resulting<br />
in a di�erent PLS f 0 � it is not obvious which is<br />
the best for our solution.<br />
� The v<strong>al</strong>ues z 0 i � f0 �xi� yi� at the PLS vertices.<br />
Since the data is noisy anyway� they do not necce�<br />
sarily have to coincide with the sampled zi.<br />
Many researchers have de<strong>al</strong>t with variants of the op�<br />
tim<strong>al</strong> surface triangulation problem in the non�noisy<br />
case �� � 0�. In its most pure form� given an explicit<br />
function f�x� y�� and a tolerance d� approximate f by<br />
a PLS f 0 with a minim<strong>al</strong> number of triangles� such<br />
that the lp distance between f and f 0� de�ned as<br />
jjf � f 0 �Z 1 Z 1<br />
jjp �<br />
0 0 jf�x� y� � f0�x� y�j p �1�p<br />
dxdy<br />
�1�
is no larger than d. Nadler �9� studied the connection<br />
between the the second derivatives of f at a point<br />
and the optim<strong>al</strong> shape of a triangle in that vicinity<br />
with respect to the l2 distance. D�Azevedo �4� used<br />
coordinate transformations to generate optim<strong>al</strong> trian�<br />
gulations with respect to the l1 distance.<br />
In a similar vein� given a dense sample of f at m<br />
locations f�xi� yi� � i � 1� ��� mg� it is sometimes re�<br />
quired to dilute this sample to a sparse set V �some�<br />
times c<strong>al</strong>led decimation� of n points� and approximate<br />
f as a PLS f 0 on some triangulation of V . The lp dis�<br />
tance is now measured relative to the origin<strong>al</strong> sample<br />
set�<br />
jjf � f 0 � mX 1<br />
jjp � jf�xi� yi� � f<br />
m<br />
i�1<br />
0�xi� yi�j p<br />
�1�p<br />
�2�<br />
Schroeder at el. �15� present an <strong>al</strong>gorithm for decimat�<br />
ing a sample set and triangulating the result� while<br />
preserving important geometric features. Quak and<br />
Schumaker �12�� while not specifying how to decimate<br />
the sample set� triangulate the n points to a PLS f 0<br />
achieving a loc<strong>al</strong> minimum of the l2 distance jjf �f 0 jj2.<br />
In both cases mentioned above� the objective is<br />
clear� the PLS f 0 should approximate the explicitly<br />
given f or its dense sample as closely as possible. Our<br />
working point� for which the objective is not as clear�<br />
is to triangulate an <strong>al</strong>ready sparse sample set of lo�<br />
cations V � without removing or adding points. The<br />
problem is ill�posed since� theoretic<strong>al</strong>ly� we have no<br />
reason to prefer one triangulation over another. How�<br />
ever� we try to minimize some �smoothness� measure�<br />
with the hope that since the �true� �but unknown� f<br />
was probably smooth� a smoother PLS has a better<br />
chance of approximating it well. Rippa �14� showed<br />
that the standard Delaunay triangulation ��10�� Chap.<br />
5� of V� which has many nice mathematic<strong>al</strong> proper�<br />
ties� yields suboptim<strong>al</strong> results in many cases and that<br />
long thin triangles �which the Delaunay triangulation<br />
avoids� are sometimes good for linear interpolation�<br />
contrary to common belief. Dyn et <strong>al</strong>. �5� suggested<br />
a method for the iterative improvement of an initi<strong>al</strong><br />
triangulation� using an edge�swapping technique due<br />
to Lawson �7�� minimizing a cost function measuring<br />
the �roughness� of the PLS.<br />
All the works mentioned above �except �12�� de<strong>al</strong><br />
only with the case of accurate �non�noisy� samples.<br />
We extend the procedure of Dyn et. <strong>al</strong> to de<strong>al</strong> with<br />
noisy samples. Addition<strong>al</strong>ly� even for the case of accu�<br />
rate samples� we demonstrate that results superior to<br />
theirs may be achieved by using our <strong>al</strong>gorithm� not<br />
constraining f 0 �xi� yi� � f�xi� yi� enables the <strong>al</strong>go�<br />
rithm to reach a better loc<strong>al</strong> minimum of the cost<br />
function than the one obtained when constraining the<br />
PLS vertices. For a PLS f 0 � de�ne its �cost� C�f 0 � as<br />
C�f 0 � � I�f 0 � � �R�f 0 � �3�<br />
where I�f 0 � measures the inaccuracy of the �t of f 0 to<br />
the sampled data� R�f 0 � measures the �roughness� of<br />
f 0 � and � is a weighting factor. The best PLS is the f 0<br />
minimizing C. This approach is standard for smooth�<br />
ing splines �16�. For example� in the one�dimension<strong>al</strong><br />
case� g 2 C 2 �0� 1�� I is taken to be<br />
I�g� � 1<br />
n<br />
nX<br />
�g�xi� � yi�<br />
i�1<br />
2<br />
and R is Z 1<br />
R�g� �<br />
0 g00�x�2 dx<br />
which is an approximation for the average curvature<br />
of the surface. In the case of a PLS� which is two�<br />
dimension<strong>al</strong> and possesses noncontinuous derivatives�<br />
an expression similar to I is still applicable� but a<br />
discrete an<strong>al</strong>og to R must be found. Once the cost<br />
function is well de�ned� an e�cient procedure to de�<br />
termine the PLS minimizing it must be described.<br />
The rest of this paper is organized as follows� Sec�<br />
tion 2 elaborates on the cost function C� Section 3 de�<br />
scribes the optimization procedure minimizing C and<br />
Section 4 de<strong>al</strong>s with determining the sc<strong>al</strong>ar parameter<br />
� present in C. The results of numeric<strong>al</strong> experiments<br />
are reported in Section 5. In Section 6 we summarize<br />
and conclude.<br />
2 The Cost Function<br />
What type of PLS is considered �good� � In classic<br />
approximation theory� a common answer is� a good<br />
surface is one that passes close to the sampled data<br />
and is smooth �implicitly we assume that the origin<strong>al</strong><br />
sampled function was smooth�. Towards this end� we<br />
de�ne the following �cost� C�f 0 � of a PLS candidate<br />
f 0 . Given the sample set f�xi� yi� zi� n i�1 g<br />
where<br />
C�f 0 � � I�f 0 � � �R�f 0 �<br />
I�f 0 � �<br />
nX<br />
�zi � f<br />
i�1<br />
0�xi� yi��2 measures the in�delity of the PLS �t to the sam�<br />
pled data� and R�f 0 � is a measure of the PLS rough�<br />
ness� de�ned as follows� Let t1 � fp1� p2� p3g and
t2 � fp2� p3� p4g be two triangles of the PLS f 0 � with<br />
common edge p2p3 �see Fig. 1�. Let ni be the vector<br />
norm<strong>al</strong> to ti� i � 1� 2. �and ABN�e� of edge e � p2p3<br />
be the Angle Between the Norm<strong>al</strong>s n1 and n2. Then<br />
R�f 0 � �<br />
X<br />
e2fedges of f 0 g<br />
ABN�e� �4�<br />
ABN�e� may be thought of as an estimate of the dis�<br />
crete curvature of the surface f 0 at that edge. The<br />
relative importance of the two components of the cost<br />
function is controlled by the positive sc<strong>al</strong>ar parameter<br />
�. For � � 0� the in�delity of the PLS f 0 to the sam�<br />
pled data dominates� so any PLS with f 0 �xi� yi� � zi<br />
minimizes C. For very large �� the roughness of the<br />
surface dominates� so any constant�v<strong>al</strong>ued PLS mini�<br />
mizes C.<br />
p1<br />
n1<br />
p2<br />
Figure 1� Two triangles of a PLS and their norm<strong>al</strong>s.<br />
3 The Optimization Algorithm<br />
p3<br />
Our <strong>al</strong>gorithm generates an initi<strong>al</strong> PLS and itera�<br />
tively improves it. The PLS f2 is an improvement of<br />
PLS f1 if C�f2� � C�f1�. The input to the <strong>al</strong>gorithm<br />
is f�xi� yi� zi�n i�1g � the set of data samples� and � �<br />
the smoothing parameter. The output of the <strong>al</strong>go�<br />
rithm is T � a triangulation of V � f�xi� yi�n i�1g� and<br />
f�z 0 i�ni�1g � the v<strong>al</strong>ues of the PLS at the points of V .<br />
An outline of the <strong>al</strong>gorithm is �<br />
Generate an initi<strong>al</strong> PLS.<br />
Repeat<br />
�1� Improve the PLS v<strong>al</strong>ues at points of V<br />
�keeping the triangulation fixed�.<br />
�2� Improve the triangulation of V<br />
�keeping the PLS v<strong>al</strong>ues at V fixed�.<br />
Until �there is no change in the PLS�<br />
The initi<strong>al</strong> PLS f 0 is T � the Delaunay triangulation<br />
of V � and z 0 i � zi� i � 1� ��� n. To improve the PLS<br />
v<strong>al</strong>ues at the set of vertices V � we systematic<strong>al</strong>ly scan<br />
the vertices and set z 0 i to be the z minimizing<br />
h�z� � �zi � z� 2 � �<br />
n2<br />
X<br />
e2Ei<br />
p4<br />
ABN�e� �5�<br />
where Ei�fthe edges of f 0 incident on �xi� yi�g and<br />
f 0 �xi� yi� � zi. Note that the second term of h�z�<br />
implicitly depends on z. The z minimizing the one�<br />
dimension<strong>al</strong> function h�z� may be found by standard<br />
numeric<strong>al</strong> optimization procedures. We used the sim�<br />
ple golden section method ��11�� Chap. 10�. It is easy<br />
to see that assigning this v<strong>al</strong>ue to z 0 i improves the PLS.<br />
To improve the triangulation of V � we use the same<br />
LOP �Lawson Optimization Procedure� used in �5��<br />
for every edge e which is a diagon<strong>al</strong> of a convex quadri�<br />
later<strong>al</strong> of T� replace e by the other diagon<strong>al</strong> of the<br />
quadrilater<strong>al</strong> �replacing the two triangles by two oth�<br />
ers� if this improves the resulting PLS �see Fig. 2�.<br />
It is not obvious that this <strong>al</strong>gorithm converges.<br />
However� we have found in <strong>al</strong>l our experiments that<br />
this is indeed the case� requiring 6 iterations on the<br />
average. We do not know whether the minimum<br />
achieved is glob<strong>al</strong>.<br />
p1<br />
p2<br />
p3<br />
p4<br />
Figure 2� Swapping edges in a convex quadrilater<strong>al</strong>.<br />
4 Determining the �Optim<strong>al</strong>� �<br />
The output of our <strong>al</strong>gorithm obviously depends on<br />
the v<strong>al</strong>ue of � used. A large � causes the surface to be<br />
smooth� while a sm<strong>al</strong>l � forces the f 0 �xi� yi� to be close<br />
to zi� strongly constraining the solution. An impor�<br />
tant practic<strong>al</strong> question is how to determine the opti�<br />
m<strong>al</strong> v<strong>al</strong>ue of � so that the resulting PLS f 0 will indeed<br />
be a good approximation of the origin<strong>al</strong> �unknown�<br />
surface f�x� y�. De�ne<br />
e 2 ��� � 1<br />
n<br />
nX<br />
p1<br />
p2<br />
p3<br />
p4<br />
�zi � z<br />
i�1<br />
0 i����2 � �6�<br />
where z 0 i ��� are the v<strong>al</strong>ues of the PLS f0 �xi� yi� pro�<br />
duced by our <strong>al</strong>gorithm when applied with parameter<br />
�. If z 0 i were indeed the �true� v<strong>al</strong>ues f�xi� yi�� then<br />
e 2 ��� would be a good estimate of the sample error<br />
variance� which we know to be � 2 . The optim<strong>al</strong> �<br />
should then be<br />
�opt � arg min H���� H��� � je 2 ��� � � 2 j � �7�
An approach similar to this was proposed by Reinsch<br />
�13� in the context of C 2 smoothing splines. Finding<br />
this �opt requires a search procedure that applies the<br />
PLS construction <strong>al</strong>gorithm for di�erent v<strong>al</strong>ues of ��<br />
c<strong>al</strong>culates H��� and re�estimates � accordingly.<br />
5 Experiment<strong>al</strong> Results<br />
We tested our <strong>al</strong>gorithm on one set of re<strong>al</strong> DTM<br />
data and samples of two di�erent �synthetic� test<br />
functions f � �0� 1�2 � IR. For the DTM� we started<br />
with a set f�xi� yj� zi�j�g 100<br />
i�j�1<br />
of 100 � 100 data points<br />
on a regular grid in the Dead Sea area �Fig. 3�a��. We<br />
randomly selected 100 points from this set and added<br />
to them Gaussian noise with � � 15m. These 100<br />
samples� and a chosen �� served as input to our <strong>al</strong>go�<br />
rithm� producing a PLS f 0 as output. To estimate the<br />
PLS qu<strong>al</strong>ity we c<strong>al</strong>culated the l1 distance jjf � f 0jj1� as in �2�. The two test functions were taken from �5��<br />
who adopted them from �6� and �8��<br />
F1�x� � 3<br />
4 exp<br />
�<br />
�9x � 2�<br />
� 2 � �9y � 2�2� 4<br />
� 3<br />
4 exp<br />
�<br />
�9x � 1�<br />
� 2 �<br />
9y � 1<br />
�<br />
49 10<br />
� 1<br />
2 exp<br />
�<br />
�9x � 7�<br />
� 2 � �9y � 3�2� 4<br />
� 1<br />
5 exp���9x � 4�2 � �9y � 7�2� where�<br />
F8�x� � tanh��3g�x� y�� � 1<br />
g�x� y� � 0�595576�y � 3�79762� 2 � x � 10<br />
The function F1 is composed of two Gaussian peaks<br />
and a sharp Gaussian dip �Fig. 3�c��. The func�<br />
tion F8 simulates a sharp rise� whose contour lines<br />
are the parabolas g�x� y� � const �Fig. 3�b��. Each of<br />
the functions was sampled on 100 random points dis�<br />
tributed uniformly in �0� 1� 2 and contaminated with<br />
Gaussian noise of variance � 2 . These samples� and a<br />
chosen �� served as input to our <strong>al</strong>gorithm. Again� the<br />
performance of the <strong>al</strong>gorithm was measured by the l1<br />
distance �1�. In practice� this integr<strong>al</strong> was computed<br />
numeric<strong>al</strong>ly by Monte�Carlo integration. Note that<br />
this can be computed only for synthetic<strong>al</strong>ly generated<br />
samples� such as ours� where f is available. To ev<strong>al</strong>�<br />
uate our results� and contrast them with those of �5��<br />
for each input data set we constructed three PLS�s.<br />
The �rst obtained using z 0<br />
i � zi and T � the Delau�<br />
nay triangulation �refered to as the Delaunay PLS�.<br />
The second with z 0<br />
i � zi and T � the triangulation<br />
obtained by applying the LOP procedure on the De�<br />
launay triangulation as suggested in �5� �refered to as<br />
the LOP PLS�. The third is the �n<strong>al</strong> PLS obtained<br />
using our <strong>al</strong>gorithm �refered to as the Optim<strong>al</strong> PLS�.<br />
5.1 Accurate Data<br />
Although our <strong>al</strong>gorithm was designed primarily for<br />
noisy sample sets� we applied it <strong>al</strong>so on relatively ac�<br />
curate �very sm<strong>al</strong>l �� samples of F1 and F8. With this<br />
type of input� the LOP procedure on the Delaunay tri�<br />
angulation seems to <strong>al</strong>ways improve the PLS� so it is<br />
advantageous to swap the steps of our <strong>al</strong>gorithm� such<br />
that the �rst step improves the triangulation� and the<br />
second the PLS v<strong>al</strong>ues at the triangulation vertices.<br />
Fig. 5 demonstrates that when � � 0� <strong>al</strong>though the<br />
LOP PLS reduces the distance by 48� relative to the<br />
Delaunay PLS �as has been shown <strong>al</strong>ready in �5��� <strong>al</strong>�<br />
lowing the sample v<strong>al</strong>ues to move by applying our <strong>al</strong>�<br />
gorithm with a sm<strong>al</strong>l v<strong>al</strong>ue of �� results in a PLS with<br />
distance further improved by another 58� �relative to<br />
the LOP PLS�. This is especi<strong>al</strong>ly true for functions<br />
with a clear prefered direction� such as F8� as the ex�<br />
tra freedom <strong>al</strong>lows the triangulation to <strong>al</strong>ign itself in<br />
this prefered direction. For F1� as demonstrated by<br />
Fig. 7� there is no signi�cant improvement.<br />
5.2 Noisy Data<br />
The main bene�t of our <strong>al</strong>gorithm was in the case<br />
of relatively noisy data �approximately 10� error in<br />
the elevation v<strong>al</strong>ues�. Fig. 4 shows our results on the<br />
DTM data� and Figs. 8 and 6 show our results on F1<br />
and F8. These are for the optim<strong>al</strong> v<strong>al</strong>ues of �� found<br />
experiment<strong>al</strong>ly.<br />
The results of our procedure on the noisy DTM<br />
data were not as good as those obtained for the noisy<br />
synthetic data. This is probably due to the fact that<br />
the origin<strong>al</strong> terrain surface is not very smooth� and<br />
there are no signi�cant prefered directions.<br />
For F1 and F8� the LOP PLS is not an improvement<br />
over the Delaunay PLS �for F1 it is even worse�. In<br />
contrast� the optim<strong>al</strong> PLS produced by our <strong>al</strong>gorithm<br />
reduces the distance relative to the Delaunay PLS by<br />
15� and 23� respectively.<br />
In <strong>al</strong>l cases� the optim<strong>al</strong> v<strong>al</strong>ue of � seems to be a<br />
little sm<strong>al</strong>ler than that predicted by �7�� as was <strong>al</strong>so<br />
observed by Craven �3� in the case of C 2 smoothing<br />
splines.
6 Summary and Conclusions<br />
We have presented an <strong>al</strong>gorithm generating a good<br />
piecewise�linear approximation of a surface over some<br />
triangulation from noisy samples. The <strong>al</strong>gorithm pro�<br />
duces the best results in one of the following cases�<br />
1. The sampled function has a clear prefered direc�<br />
tion �like F8�� It seems that the �exibility in the<br />
PLS v<strong>al</strong>ues at the triangulation vertices enables<br />
the LOP to perform more edge swaps than when<br />
the heights are constrained to �xed v<strong>al</strong>ues. These<br />
addition<strong>al</strong> swaps improve the PLS. This is true<br />
even when there is no noise.<br />
2. The noise is signi�cant� The �rst LOP damages<br />
the PLS qu<strong>al</strong>ity because this procedure is very<br />
sensitive to the sample v<strong>al</strong>ues� which are very in�<br />
accurate. Using our <strong>al</strong>gorithm when �rst adjust�<br />
ing the PLS heights reduces some of the noise�<br />
enabling the LOP to perform better.<br />
There are a few possible variations on our <strong>al</strong>gorithm�<br />
including the type of metric used to measure the dis�<br />
tance� the travers<strong>al</strong> order of the PLS vertices during<br />
the �rst step of the <strong>al</strong>gorithm and the travers<strong>al</strong> order<br />
of PLS convex quadrilater<strong>al</strong>s during the second step of<br />
the <strong>al</strong>gorithm. The exact threshold of � before which<br />
the samples are considered relatively accurate� there�<br />
fore bene�ci<strong>al</strong> to reverse the order of the <strong>al</strong>gorithm<br />
steps� is not yet clear.<br />
Acknowledgments<br />
The second author wishes to thank Nira Dyn and<br />
David Levin for helpful discussions on the subject of<br />
the paper. The DTM data used in our experiments<br />
was produced and kindly made available by John H<strong>al</strong>l<br />
of the Israel Geologic<strong>al</strong> Survey.<br />
References<br />
�1� Speci<strong>al</strong> issue on softcopy photogrammetric work�<br />
stations. Photogrammetric <strong>Engineering</strong> and Re�<br />
mote Sensing� January 1992.<br />
�2� D. Cohen and C. Gotsman. Photore<strong>al</strong>istic terrain<br />
imaging and �ight simulation. IEEE Computer<br />
Graphics and Applications� 14�2��10�12� 1994.<br />
�3� P. Craven and G. Wahba. Smoothing noisy data<br />
with spline functions� Estimating the correct de�<br />
gree of smoothing by the method of gener<strong>al</strong>�<br />
ized cross v<strong>al</strong>idation. Numerische Mathematik�<br />
31�377�403� 1979.<br />
�4� E.F. D�Azevedo. Optim<strong>al</strong> triangular mesh gen�<br />
eration by coordinate transformation. SIAM J.<br />
Sci. Stat. Comput.� 12�4��755�786� 1991.<br />
�5� N. Dyn� D. Levin� and S. Rippa. Data dependent<br />
triangulations for piecewise linear interpolation.<br />
IMA Journ<strong>al</strong> of Numeric<strong>al</strong> An<strong>al</strong>ysis� 10�137�154�<br />
1990.<br />
�6� R. Franke. Scattered data interpolation� Tests<br />
of some methods. Mathematics of Computation�<br />
38�181�200� 1982.<br />
�7� C.L. Lawson. Transforming triangulations. Dis�<br />
crete Math.� 3�365�372� 1972.<br />
�8� T. Lyche and K. Morken. Knot remov<strong>al</strong> for para�<br />
metric B�spline curves and surfaces. Computer<br />
Aided Geometric Design� 4�217�230� 1987.<br />
�9� E. Nadler. Piecewise linear best l2 approximation<br />
on triangulations. In C.K. Chui� L.L. Schumaker�<br />
and J.D. Ward� editors� Approximation Theory<br />
V � pages 499�502. Academic Press� 1986.<br />
�10� F.P. Preparata and M.I. Shamos. Computation<strong>al</strong><br />
Geometry� An Introduction. Springer�Verlag�<br />
1985.<br />
�11� W.H. Press� S.A. Teukolsky� W.T. Vetterling� and<br />
B.P. Flannery. Numeric<strong>al</strong> Recipes in C �Second<br />
Edition�. Cambridge University Press� 1992.<br />
�12� E. Quak and Schumaker L.L. Least squares �t�<br />
ting by linear splines on data dependent triangu�<br />
lations. In P.J. Laurent� A. Le M�ehaut�e� and L.L.<br />
Schumaker� editors� Curves and Surfaces� pages<br />
387�390. Academic Press� 1991.<br />
�13� C. Reinsch. Smoothing by spline functions. Nu�<br />
merische Mathematik� 10�177�183� 1967.<br />
�14� S. Rippa. Long and thin triangles can be good<br />
for linear interpolation. SIAM J. Numer. An<strong>al</strong>.�<br />
29�1��257�270� 1992.<br />
�15� W.J. Schroeder� J.A. Zarge� and W.E. Lorensen.<br />
Decimation of triangle meshes. In Proceedings of<br />
SIGGRAPH�92� pages 65�70. ACM� 1992.<br />
�16� G. Wahba. Spline Models for Observation<strong>al</strong> Data.<br />
Society for Industri<strong>al</strong> and Applied Mathematics�<br />
1990.
y<br />
-400<br />
-450<br />
-500<br />
-550<br />
-600<br />
-650<br />
-700<br />
0<br />
1<br />
0.9<br />
0.8<br />
0.7<br />
0.6<br />
0.5<br />
0.4<br />
0.3<br />
0.2<br />
0.1<br />
0.2<br />
0.4<br />
0.6<br />
x<br />
0.8<br />
1<br />
0<br />
0.2<br />
0.4<br />
y<br />
0.6<br />
0.8<br />
1<br />
2<br />
1.5<br />
1<br />
0.5<br />
0<br />
0<br />
0.2<br />
0.4<br />
0.6<br />
0.8<br />
y<br />
1 1<br />
0.8<br />
0.6<br />
x<br />
0.4<br />
0.2<br />
0<br />
1.2<br />
1<br />
0.8<br />
0.6<br />
0.4<br />
0.2<br />
0<br />
0<br />
0.2<br />
0.4<br />
0.6<br />
0.8<br />
1<br />
�a� �b� �c�<br />
0<br />
0 0.1 0.2 0.3 0.4 0.5<br />
x<br />
0.6 0.7 0.8 0.9 1<br />
-400<br />
-450<br />
-500<br />
-550<br />
-600<br />
-650<br />
-700<br />
0<br />
0.2<br />
0.4<br />
0.6<br />
Figure 3� Test cases� �a� DTM. �b� F8. �c� F1.<br />
y<br />
1<br />
0.9<br />
0.8<br />
0.7<br />
0.6<br />
0.5<br />
0.4<br />
0.3<br />
0.2<br />
0.1<br />
0<br />
0 0.1 0.2 0.3 0.4 0.5<br />
x<br />
0.6 0.7 0.8 0.9 1<br />
y<br />
1<br />
0.9<br />
0.8<br />
0.7<br />
0.6<br />
0.5<br />
0.4<br />
0.3<br />
0.2<br />
0.1<br />
y<br />
1<br />
0.8<br />
x<br />
0.6<br />
0<br />
0 0.1 0.2 0.3 0.4 0.5<br />
x<br />
0.6 0.7 0.8 0.9 1<br />
�a� �c� �e�<br />
x<br />
0.8<br />
1<br />
0<br />
0.2<br />
0.4<br />
y<br />
0.6<br />
0.8<br />
1<br />
-400<br />
-450<br />
-500<br />
-550<br />
-600<br />
-650<br />
-700<br />
0<br />
0.2<br />
0.4<br />
0.6<br />
x<br />
�b� �d� �f�<br />
Figure 4� PLS�s on a 100�point sample of DTM data �Fig. 3�a�� with � � 15m� �a���b� Delaunay PLS �l1 distance<br />
� 13.3�. �c���d� LOP PLS �l1 distance � 14.0�. �e���f� Optim<strong>al</strong> PLS at � � 150 �l1 distance � 12.8�.<br />
0.8<br />
1<br />
0<br />
0.2<br />
0.4<br />
y<br />
0.6<br />
0.8<br />
1<br />
-400<br />
-450<br />
-500<br />
-550<br />
-600<br />
-650<br />
-700<br />
0<br />
0.2<br />
0.4<br />
0.6<br />
x<br />
0.8<br />
0.4<br />
1<br />
0<br />
0.2<br />
0.2<br />
0.4<br />
y<br />
0.6<br />
0<br />
0.8<br />
1
y<br />
2<br />
1.5<br />
1<br />
0.5<br />
0<br />
0.1<br />
0.2<br />
0.3<br />
0.4<br />
0.5<br />
0.6<br />
0.7<br />
0.8<br />
0.9<br />
1<br />
1<br />
0.9<br />
0.8<br />
0.7<br />
0<br />
0<br />
0.2<br />
0.4<br />
0.6<br />
0.8<br />
y<br />
0.6<br />
0.5<br />
x<br />
0.4<br />
0.3<br />
0.2<br />
0.1<br />
0<br />
y<br />
0<br />
0.1<br />
0.2<br />
0.3<br />
0.4<br />
0.5<br />
0.6<br />
0.7<br />
0.8<br />
0.9<br />
1<br />
1<br />
0.9<br />
0.8<br />
0.7<br />
0.6<br />
0.5<br />
x<br />
�a� �c� �e�<br />
1 1<br />
0.8<br />
0.6<br />
x<br />
0.4<br />
0.2<br />
0<br />
2<br />
1.5<br />
1<br />
0.5<br />
0<br />
0<br />
0.2<br />
0.4<br />
0.6<br />
0.8<br />
y<br />
1 1<br />
0.8<br />
0.4<br />
0.3<br />
0.6<br />
x<br />
0.2<br />
0.4<br />
0.1<br />
0.2<br />
0<br />
0<br />
y<br />
2<br />
1.5<br />
1<br />
0.5<br />
0<br />
0.1<br />
0.2<br />
0.3<br />
0.4<br />
0.5<br />
0.6<br />
0.7<br />
0.8<br />
0.9<br />
1<br />
1<br />
0.9<br />
0.8<br />
0.7<br />
0<br />
0<br />
0.2<br />
0.4<br />
0.6<br />
0.8<br />
�b� �d� �f�<br />
Figure 5� PLS�s on a 100�point sample of F8 with � � 0� �a���b� Delaunay PLS �l1 distance � .050�. �c���d� LOP<br />
PLS �l1 distance � .026�. �e���f� Optim<strong>al</strong> PLS at � � �005 �l1 distance � .011�.<br />
y<br />
2<br />
1.5<br />
1<br />
0.5<br />
0<br />
0.1<br />
0.2<br />
0.3<br />
0.4<br />
0.5<br />
0.6<br />
0.7<br />
0.8<br />
0.9<br />
1<br />
1<br />
0.9<br />
0.8<br />
0.7<br />
0<br />
0<br />
0.2<br />
0.4<br />
0.6<br />
0.8<br />
y<br />
0.6<br />
0.5<br />
x<br />
0.4<br />
0.3<br />
0.2<br />
0.1<br />
0<br />
y<br />
0<br />
0.1<br />
0.2<br />
0.3<br />
0.4<br />
0.5<br />
0.6<br />
0.7<br />
0.8<br />
0.9<br />
1<br />
1<br />
0.9<br />
0.8<br />
0.7<br />
0.6<br />
0.5<br />
x<br />
�a� �c� �e�<br />
1 1<br />
0.8<br />
0.6<br />
x<br />
0.4<br />
0.2<br />
0<br />
2<br />
1.5<br />
1<br />
0.5<br />
0<br />
0<br />
0.2<br />
0.4<br />
0.6<br />
0.8<br />
y<br />
1 1<br />
0.8<br />
0.4<br />
0.3<br />
0.6<br />
x<br />
0.2<br />
0.4<br />
0.1<br />
0.2<br />
0<br />
0<br />
y<br />
0<br />
0.1<br />
0.2<br />
0.3<br />
0.4<br />
0.5<br />
0.6<br />
0.7<br />
0.8<br />
0.9<br />
1<br />
1<br />
0.9<br />
0.8<br />
y<br />
0.7<br />
0<br />
0<br />
0.2<br />
0.4<br />
0.6<br />
0.8<br />
�b� �d� �f�<br />
Figure 6� PLS�s on a 100�point sample of F8 with � � �1� �a���b� Delaunay PLS �l1 distance � .098�. �c���d�<br />
LOP PLS �l1 distance � .097�. �e���f� Optim<strong>al</strong> PLS at � � �01 �l1 distance � .075�.<br />
2<br />
1.5<br />
1<br />
0.5<br />
y<br />
0.6<br />
1 1<br />
0.6<br />
1 1<br />
0.5<br />
x<br />
0.5<br />
x<br />
0.8<br />
0.8<br />
0.4<br />
0.4<br />
0.3<br />
0.6<br />
x<br />
0.3<br />
0.6<br />
x<br />
0.2<br />
0.4<br />
0.2<br />
0.4<br />
0.1<br />
0.2<br />
0.1<br />
0.2<br />
0<br />
0<br />
0<br />
0
y<br />
1.2<br />
1<br />
0.8<br />
0.6<br />
0.4<br />
0.2<br />
0<br />
0.1<br />
0.2<br />
0.3<br />
0.4<br />
0.5<br />
0.6<br />
0.7<br />
0.8<br />
0.9<br />
1<br />
1<br />
0.9<br />
0.8<br />
0<br />
0<br />
0.2<br />
0.4<br />
0.6<br />
0.8<br />
1<br />
y<br />
1<br />
0.7<br />
0.6<br />
0.8<br />
0.5<br />
x<br />
0.4<br />
0.3<br />
0.2<br />
0.1<br />
0<br />
y<br />
0<br />
0.1<br />
0.2<br />
0.3<br />
0.4<br />
0.5<br />
0.6<br />
0.7<br />
0.8<br />
0.9<br />
1<br />
1<br />
0.9<br />
0.8<br />
0.7<br />
0.6<br />
0.5<br />
x<br />
�a� �c� �e�<br />
x<br />
0.6<br />
0.4<br />
0.2<br />
0<br />
1.2<br />
1<br />
0.8<br />
0.6<br />
0.4<br />
0.2<br />
0<br />
0<br />
0.2<br />
0.4<br />
0.6<br />
0.8<br />
1<br />
y<br />
1<br />
0.8<br />
x<br />
0.6<br />
0.4<br />
0.3<br />
0.4<br />
0.2<br />
0.2<br />
0.1<br />
0<br />
0<br />
y<br />
0<br />
0.1<br />
0.2<br />
0.3<br />
0.4<br />
0.5<br />
0.6<br />
0.7<br />
0.8<br />
0.9<br />
1<br />
1<br />
0.9<br />
0.8<br />
0<br />
0<br />
0.2<br />
0.4<br />
0.6<br />
0.8<br />
1<br />
�b� �d� �f�<br />
Figure 7� PLS�s on a 100�point sample of F1 with � � 0� �a���b� Delaunay PLS �l1 distance � .019�. �c���d� LOP<br />
PLS �l1 distance � .017�. �e���f� Optim<strong>al</strong> PLS at � � �0001 �l1 distance � .017�.<br />
y<br />
1.2<br />
1<br />
0.8<br />
0.6<br />
0.4<br />
0.2<br />
0<br />
0.1<br />
0.2<br />
0.3<br />
0.4<br />
0.5<br />
0.6<br />
0.7<br />
0.8<br />
0.9<br />
1<br />
1<br />
0.9<br />
0.8<br />
0<br />
0<br />
0.2<br />
0.4<br />
0.6<br />
0.8<br />
1<br />
y<br />
1<br />
0.7<br />
0.6<br />
0.8<br />
0.5<br />
x<br />
0.4<br />
0.3<br />
0.2<br />
0.1<br />
0<br />
y<br />
0<br />
0.1<br />
0.2<br />
0.3<br />
0.4<br />
0.5<br />
0.6<br />
0.7<br />
0.8<br />
0.9<br />
1<br />
1<br />
0.9<br />
0.8<br />
0.7<br />
0.6<br />
0.5<br />
x<br />
�a� �c� �e�<br />
x<br />
0.6<br />
0.4<br />
0.2<br />
0<br />
1.2<br />
1<br />
0.8<br />
0.6<br />
0.4<br />
0.2<br />
0<br />
0<br />
0.2<br />
0.4<br />
0.6<br />
0.8<br />
1<br />
y<br />
1<br />
0.8<br />
x<br />
0.6<br />
0.4<br />
0.3<br />
0.4<br />
0.2<br />
0.2<br />
0.1<br />
0<br />
0<br />
1.2<br />
1<br />
0.8<br />
0.6<br />
0.4<br />
0.2<br />
y<br />
0<br />
0.1<br />
0.2<br />
0.3<br />
0.4<br />
0.5<br />
0.6<br />
0.7<br />
0.8<br />
0.9<br />
1<br />
1<br />
y<br />
0.9<br />
0.8<br />
0<br />
0<br />
0.2<br />
0.4<br />
0.6<br />
0.8<br />
1<br />
�b� �d� �f�<br />
Figure 8� PLS�s on a 100�point sample of F1 with � � �1� �a���b� Delaunay PLS �l1 distance � .065�. �c���d�<br />
LOP PLS �l1 distance � .071�. �e���f� Optim<strong>al</strong> PLS at � � �01 �l1 distance � .055�.<br />
1.2<br />
1<br />
0.8<br />
0.6<br />
0.4<br />
0.2<br />
y<br />
1<br />
1<br />
0.7<br />
0.7<br />
0.6<br />
0.8<br />
0.6<br />
0.8<br />
0.5<br />
x<br />
x<br />
0.5<br />
x<br />
x<br />
0.6<br />
0.6<br />
0.4<br />
0.4<br />
0.3<br />
0.4<br />
0.3<br />
0.4<br />
0.2<br />
0.2<br />
0.2<br />
0.2<br />
0.1<br />
0.1<br />
0<br />
0<br />
0<br />
0
Abstract<br />
This paper presents a technique for performing<br />
volume morphing between two volumetric datasets in the<br />
wavelet domain. The idea is to decompose the volumetric<br />
datasets into a set of frequency bands, apply smooth<br />
interpolation to each band, and reconstruct to form the<br />
morphed model. In addition, a technique for establishing a<br />
suitable correspondence among object voxels is presented.<br />
The combination of these two techniques results in a<br />
smooth transition between the two datasets and produces<br />
morphed volume with fewer high frequency distortions<br />
than those obtained from spati<strong>al</strong> domain volume morphing.<br />
1. Introduction and motivation<br />
Recently, 3D metamorphosis, the process of<br />
simulating the deformation of one 3D model to another,<br />
has gained popularity in animation and shape design.<br />
Previously published techniques [5, 6] de<strong>al</strong> mainly with<br />
the metamorphosis between two polygon<strong>al</strong>-based models.<br />
The gener<strong>al</strong> method of these <strong>al</strong>gorithms is to displace the<br />
vertices, edges, and faces of the first model over time to<br />
coincide in position with the corresponding vertices, edges,<br />
and faces of the second model. However, establishing the<br />
suitable correspondence among surface elements is<br />
complex. In addition, these <strong>al</strong>gorithms gener<strong>al</strong>ly impose<br />
topologic<strong>al</strong> restrictions on the models in order to maintain<br />
the face connectivity during morphing.<br />
Motivated in part by the difficulties presented in<br />
morphing surface-based 3D models and in part by the<br />
desire to morph sampled/simulated datasets directly, the<br />
volume graphics [4] approach represents the 3D models in<br />
voxel space and performs volume morphing between the<br />
two volumetric models. One of the main advantages of this<br />
approach is that the topology restriction on the datasets is<br />
eliminated, since there is no explict topology description of<br />
the volume and the voxel correspondence can be directly<br />
established between any two volumes. However, the<br />
problem of finding the appropriate correspondence among<br />
voxels still exists. One naive solution is simply to crossdissolve<br />
between the two volumes over time. In other<br />
words, to morph from model g(x, y, z) to f (x, y, z), a new<br />
model k t(x, y, z) = (1 − t)g(x, y, z) + tf(x, y, z) isformed.<br />
Wa velet-Based Volume Morphing<br />
Taosong He, Sidney Wang, and Arie Kaufman<br />
Department of Computer Science<br />
State University of New York at Stony Brook<br />
Stony Brook, NY 11794-4400<br />
Although simple, this method is often ineffective for<br />
creating the smooth transition from one model to another.<br />
For example, given two concentric spheres with identic<strong>al</strong><br />
iso-v<strong>al</strong>ues but with different radii, an ide<strong>al</strong> morphing from<br />
the larger sphere to the sm<strong>al</strong>ler one should be a sphere with<br />
constant iso-v<strong>al</strong>ue but a gradu<strong>al</strong>ly shrinking radius. But<br />
the naive technique described above would generate a<br />
sudden shrinkage from the large sphere to the sm<strong>al</strong>l one at<br />
a certain time T when a surface rendering method is<br />
employed. This is because when 0 ≤ t < T , the region<br />
between the two spheres has the density v<strong>al</strong>ue above the<br />
iso-v<strong>al</strong>ue, and at time t = T , the density v<strong>al</strong>ues of the<br />
region uniformly drop below the iso-v<strong>al</strong>ue.<br />
Another problem when performing volume<br />
morphing is that the direct interpolation of the highfrequency<br />
components in the models might cause<br />
distortion and unsatisfactory results. Hughes [3] de<strong>al</strong>s<br />
with this problem by performing volume morphing in the<br />
Fourier domain. Basic<strong>al</strong>ly, his approach takes the first<br />
volumetric model, gradu<strong>al</strong>ly removes the high frequencies,<br />
interpolates over to the low frequencies of the second<br />
model, and then smoothly adds in the high frequencies of<br />
the second model. Although effective in reducing high<br />
frequency distortion, the technique does not solve the<br />
problem of unsmooth transformation of iso-surfaces<br />
because the Fourier transform does not loc<strong>al</strong>ize in spati<strong>al</strong><br />
domain. In Hughes’ implementation, in order to have a<br />
smooth transition during morphing, the voxel v<strong>al</strong>ues of the<br />
entire volume are modified according to the distance to the<br />
nearest iso-surface. Hence, new datasets need to be created<br />
solely for the morphing application.<br />
In this paper, a technique for performing volume<br />
morphing in the wav elet domain is introduced. Since<br />
wavelet transform loc<strong>al</strong>izes in both frequency domain and<br />
spati<strong>al</strong> domain, the problems of high frequency distortion<br />
and unsmooth transformation can be <strong>al</strong>leviated<br />
simultaneously. The idea is to decompose the volumes<br />
into a set of frequency bands, apply smooth interpolation<br />
between the volumes to each band, and then reconstruct<br />
the morphed volume. Furthermore, the decomposition and<br />
reconstruction processes are accomplished in a<br />
multiresolution fashion so that high frequency distortion
can be adjusted to the desired level. By taking advantage<br />
of the spati<strong>al</strong> information within each frequency band, we<br />
can extract and correspond the object voxels of the first<br />
model to the object voxels of the second model<br />
intelligently. In the next section, the volume<br />
correspondence problem is presented. In Section 3<br />
wavelet theory is briefly introduced. Wav elet application to<br />
volume morphing in described in Section 4.<br />
2. The correspondence problem<br />
Unlike polygon<strong>al</strong>-based modeling, where every<br />
surface element of the mesh contributes to the modeling of<br />
apart of an object, voxel-based modeling captures not<br />
only the object itself but <strong>al</strong>so the space surrounding the<br />
object. Hence, in order to have a gradu<strong>al</strong> deformation<br />
from one object to another, itisessenti<strong>al</strong> to map only those<br />
voxels which belong to parts of an object. In our<br />
implementation, iso-v<strong>al</strong>ues are used to distinguish these<br />
voxels from empty space. The <strong>al</strong>gorithm for solving the<br />
correspondence problem is first described in 1D space,<br />
followed by the extension of the <strong>al</strong>gorithm into 3D space.<br />
Given anobject A in a 1D raster and an object B in another<br />
1D raster, the first step of the <strong>al</strong>gorithm is to classify these<br />
two rasters into segments of object and non-object.<br />
Without loss of gener<strong>al</strong>ity, let object A consist of m object<br />
segments, object B consist of n object segments, and<br />
m ≥ n (Figure 1). As in the case of surface-based<br />
morphing, the two important qu<strong>al</strong>ity criterion are<br />
maintaining the correct topology and minimizing the shape<br />
distortion during transformation. First, to satisfy the<br />
topology criterion, each object segment in A can be<br />
mapped to only one object segment in B. This restriction<br />
is needed to ensure that the number of object segments<br />
does not increase during morphing. Under the condition<br />
that the first criterion is satisfied, object segments of A<br />
should be distributed onto object segments of B as<br />
"evenly" as possible to minimize the shape distortion.<br />
.<br />
T = 0<br />
T = 0.5<br />
T = 1<br />
Object A’s segments<br />
Object B’s segments<br />
Figure 1:1DCorrespondence Problem<br />
Form<strong>al</strong>ly, the 1D correspondence problem is stated as<br />
follows. Given:<br />
determine:<br />
where<br />
subject to:<br />
and<br />
A = ⎧ ⎨a1a 1′, a2a2′,..., ama m′<br />
⎩<br />
⎫ ⎬, ⎭<br />
B = ⎧ ⎨b1b1′, b2b2′,..., bnb n′<br />
⎩<br />
⎫ ⎬, m ≥ n<br />
⎭<br />
P = {p 1, p 2,..., p n} and<br />
W = {w 1, w 2,...,w n}<br />
pi = ⎧ ⎫<br />
⎨x j,...,x k⎬,<br />
1 ≤ i ≤ n, 1 ≤ j ≤ k ≤ m,<br />
⎩ ⎭<br />
and x l ∈A for j ≤ l ≤ k<br />
wi = Σ (<strong>al</strong>′−<strong>al</strong>) j ≤ l ≤ k<br />
1. (x u ∈p i1 Λ x v ∈p i2 Λ i 1 < i 2) → (u < v)<br />
for <strong>al</strong>l u, v<br />
Σ<br />
2. min n<br />
i=1<br />
⎛<br />
⎜ wi ⎜<br />
⎜<br />
(bi′−bi) ⎝<br />
−<br />
m<br />
i=1<br />
Σ(ai′−ai) n<br />
i=1<br />
Σ(b<br />
⎞<br />
⎟<br />
⎟ .<br />
i′−bi) ⎟<br />
⎠<br />
In Equation 2, the set P represents the partition of A‘s<br />
object segments into n partitions, and the set W represents<br />
the corresponding weight for each member of P. As<br />
shown in Equation 4, the weight for each partition is the<br />
tot<strong>al</strong> length of object segments within each partition.<br />
Equation 5 guarantees that the partition is in consecutive<br />
order from left to right. Equation 6 insures that object<br />
segments of A are "evenly" distributed onto object<br />
segments of B by minimizing the variance.<br />
In our implementation, dynamic programming has<br />
been used to solve the 1D correspondence problem. Once<br />
the correspondences have been established for the object<br />
segments in A and B, each object segment in B needs to be<br />
partitioned to accommodate the corresponding object<br />
segments from A. For example, if<br />
2<br />
(1)<br />
(2)<br />
(3)<br />
(4)<br />
(5)<br />
(6)
.<br />
Correspond_3D ( A, B )<br />
Volume_Data *A, *B;<br />
{<br />
}<br />
Z1 = Object_Segments ( A, Z_AXIS );<br />
Z2 = Object_Segments ( B, Z_AXIS );<br />
Correspond_1D ( Z1, Z2 );<br />
for each non-empty scan plane u in A<br />
{<br />
}<br />
u’ = the corresponding scan plane in B;<br />
Y1 = Object_Segments ( u , Y_AXIS );<br />
Y2 = Object_Segments ( u’ , Y_AXIS );<br />
Correspond_1D ( Y1, Y2 );<br />
for each non-empty scan line v in u<br />
{<br />
}<br />
v’ = the corresponding scan line in u’ ;<br />
X1 = Object_Segments ( v , X_AXIS );<br />
X2 = Object_Segments ( v’ , X_AXIS );<br />
Correspond_1D ( X1, X2 );<br />
Figure 2:Pseudo-code for the 3D Correspondence<br />
pi = ⎧ ⎨a ja j′,..., ak ak′ ⎩<br />
⎫ ⎬<br />
⎭<br />
then segment b ib i′ of B needs to be partitioned into<br />
k − j + 1sub-segments of lengths<br />
where<br />
⎧<br />
⎨(a<br />
j′−a j) r,...,(ak′−ak) r<br />
⎩<br />
⎫ ⎬<br />
⎭<br />
r = (bi′−bi) k<br />
Σ(<strong>al</strong>′−<strong>al</strong>) l= j<br />
.<br />
The correspondence problem in 3D space is<br />
essenti<strong>al</strong>ly accomplished by applying the above 1D<br />
(7)<br />
(8)<br />
(9)<br />
correspondence <strong>al</strong>gorithm, which we c<strong>al</strong>l Correspond_1D,<br />
to each of the three princip<strong>al</strong> axes in an nested fashion.<br />
The 3D correspondence <strong>al</strong>gorithm, described in the<br />
pseudo-code presented in Figure 2, establishes a mapping<br />
from object scan-planes of A to object scan-planes of B,<br />
from object scan-lines of A to object scan-lines of B, and<br />
fin<strong>al</strong>ly from object voxels of A to object voxels of B. With<br />
these correspondence relations, volume morphing is<br />
achieved through the interpolations over time of the<br />
corresponding scan-planes, scan-lines, and voxels.<br />
3. Wav elet theory<br />
Gener<strong>al</strong>ly, the high frequency components in 3D<br />
functions represented by volumetric data tend to generate<br />
sm<strong>al</strong>l wiggles on the iso-surfaces of the models [3]. If the<br />
morphing <strong>al</strong>gorithm described above is directly performed<br />
in the spati<strong>al</strong> domain, these wiggles could cause distortions<br />
on the iso-surfaces of the intermediate functions (see<br />
Figure 3a). Recently, wav elet theory, which is rooted in<br />
time-frequency an<strong>al</strong>ysis, has been widely used in a variety<br />
of applications, such as shape description of volumetric<br />
objects [8] and radiosity [2]. Since a wav elet transform has<br />
loc<strong>al</strong> property in both spati<strong>al</strong> and frequency domain, it is<br />
an ide<strong>al</strong> solution to the problem of high frequency<br />
distortion during morphing. In this section wav elet theory<br />
is briefly introduced, then in Section 4 the wav elet-based<br />
morphing <strong>al</strong>gorithm is presented.<br />
Multiresolution sign<strong>al</strong> an<strong>al</strong>ysis decomposes a<br />
function into a smooth approximation of the origin<strong>al</strong><br />
function and a set of detailed information at different<br />
resolutions [7]. Form<strong>al</strong>ly, let L 2 (R) denote <strong>al</strong>l functions<br />
with finite energy; the smooth approximation of a function<br />
f ∈L 2 (R) atany resolution 2 i is a projection denoted as<br />
A 2 i: L 2 (R) → V 2 i, V 2 i ∈L 2 (R), and the detail of f at any<br />
higher resolution 2 j is a projection of f onto a subspace<br />
O 2 j of L 2 (R) denoted as P 2 j: L 2 (R) → O 2 j, j ≥ i.<br />
Consequently, the finest detailed information is contained<br />
in P 2 j with the highest resolution. By choosing the<br />
appropriate projection functions such that O 2 j are<br />
orthogon<strong>al</strong> to both each other and V 2 i,wehav e V 0 = L 2 (R)<br />
and L 2 (R) =+ 1 j = i O 2 j + V 2 i (when O 2 j is the orthogon<strong>al</strong><br />
complement of V 2 j, V 2 j+1 is written as V 2 j+1 = V 2 j + O 2 j ).<br />
For the discrete functions, it can be proven that there exist<br />
two families of functions:<br />
ψ j, n = 2 − j /2 ψ (2 j t − n) n ∈ Z<br />
φ j, n = 2 − j /2 φ(2 j t − n) n ∈ Z,<br />
(10)<br />
(11)<br />
which constitute the orthonorm<strong>al</strong> basis of V 2 j and O 2 j,<br />
respectively. ψ j,n are c<strong>al</strong>led wavelets and φ j,n are the<br />
corresponding sc<strong>al</strong>ing functions.
Using wav elets and sc<strong>al</strong>ing functions, the discrete<br />
detail sign<strong>al</strong> and discrete approximation at resolution 2 j<br />
are respectively defined as:<br />
(D 2 j f ) n = 2 − j /2 < f (u), ψ j ,n ><br />
(A d 2 j f ) n = 2 − j /2 < f (u), φ j,n ><br />
(12)<br />
(13)<br />
and the detailed information and smooth approximation<br />
are:<br />
P O2 j f =Σ∞ n =−∞ (D 2 j f ) n ψ (2 j t − n)<br />
A 2 j f =Σ ∞ n =−∞ (A d 2 j f ) n φ(2 j t − n).<br />
(14)<br />
(15)<br />
Instead of c<strong>al</strong>culating the inner products in Equations 12<br />
and 13, a pyramid<strong>al</strong> <strong>al</strong>gorithm [7] is applied for the<br />
decomposition of the function (Figure 4a), where<br />
H = H(−n) and G(n) = G(−n). The impulse response of<br />
the filters used is defined as:<br />
H(n) = <br />
G(n) = <br />
(16)<br />
(17)<br />
By repeating the <strong>al</strong>gorithm for −1 ≥ j ≥−M, both the<br />
discrete detail sign<strong>al</strong> and the discrete approximation at<br />
resolution 2 j can be computed. Using the same pair of<br />
filters, the origin<strong>al</strong> discrete samples can be computed by<br />
the reverse pyramid<strong>al</strong> <strong>al</strong>gorithm, as shown in Figure 4b.<br />
.<br />
2<br />
. 2<br />
2 j<br />
d<br />
A<br />
2 j<br />
d<br />
A<br />
D 2 j<br />
+1<br />
f<br />
f<br />
f<br />
2<br />
2<br />
G<br />
H<br />
: 1 sample out of 2<br />
: multiplication by 2<br />
(a)<br />
(b)<br />
H<br />
G<br />
X<br />
2<br />
2<br />
2<br />
D 2 j<br />
2 j<br />
d<br />
A<br />
f<br />
f<br />
. 2<br />
2 j<br />
d<br />
A<br />
+1<br />
: a 0 between 2 samples<br />
: convolve with filter X<br />
Figure 4:Wav elet Decomposition and Reconstruction<br />
f<br />
Wa velet theory can be easily expanded to any<br />
dimension by constructing high dimension orthonorm<strong>al</strong><br />
wavelets using the tensor product of sever<strong>al</strong> subspaces of<br />
L 2 (R) [7, 8]. To decompose or reconstruct a 3D function,<br />
the one dimension<strong>al</strong> pyramid<strong>al</strong> <strong>al</strong>gorithm described in<br />
Figure 4 is applied sequenti<strong>al</strong>ly <strong>al</strong>ong the princip<strong>al</strong> axes.<br />
Since the convolution <strong>al</strong>ong each axis is separable, for a<br />
volume of size n 3 ,the decomposition and reconstruction<br />
can be implemented in O(n 3 )time, which is asymptotic<strong>al</strong>ly<br />
optim<strong>al</strong>. Figure 5shows that the smooth approximation of<br />
a volume at resolution 2 j+1 decomposes into a smooth<br />
approximation at resolution 2 j and the discrete detail<br />
sign<strong>al</strong>s <strong>al</strong>ong seven orientations. Since the wav elets and<br />
sc<strong>al</strong>ing functions are orthogon<strong>al</strong>, the multiresolution<br />
representation<br />
(A d 2 −M f , (D i 2 j f ) −M ≤ j ≤−1, 1 ≤ i ≤ 7)<br />
(18)<br />
has the same tot<strong>al</strong> number of samples as the origin<strong>al</strong> sign<strong>al</strong><br />
A d 1 f .<br />
4. Wav elets for morphing<br />
Equation 10 and Equation 11 indicate that both the<br />
wavelets and sc<strong>al</strong>ing functions are the translation and<br />
dilation of a mother function ψ (t) or φ(t). It can thus be<br />
proven that the wav elet decomposition has the property of<br />
both spati<strong>al</strong> and frequency loc<strong>al</strong>ity. The <strong>al</strong>gorithm shown<br />
in Figure 4a can be interpreted as the separation of the<br />
detailed information, which corresponds to high pass<br />
filtering, and the generation of a smooth function, which<br />
corresponds to low pass filtering. In addition, a sign<strong>al</strong> that<br />
is nonzero only during a finite time span has a wav elet<br />
transform whose nonzero elements are concentrated<br />
around that time. For a 3D volume, this means that the<br />
spati<strong>al</strong> information, which is essenti<strong>al</strong> for volume<br />
morphing, is maintained in wav elet domain.<br />
.<br />
2 j<br />
d<br />
A<br />
+1<br />
f<br />
4 5<br />
6 7<br />
D j f D j f<br />
2 2<br />
D j f D j f<br />
2 2<br />
2 j<br />
d<br />
A<br />
1<br />
D j<br />
2<br />
Figure 5:Decomposition of a Volume Discrete Approximation<br />
by a 3D Wav elet Transform<br />
f<br />
f<br />
D<br />
3<br />
2 j<br />
f
The basic idea of wav elet-based morphing is to solve<br />
the correspondence problem between the gener<strong>al</strong> shape of<br />
the objects without the interference of high frequencies. To<br />
achieve this, the two volumes f and g are first decomposed<br />
into smooth approximation at resolution 2 −M and the<br />
detailed information:<br />
(A 2 −M f , (P O2 j f ) −M ≤ j ≤−1) and<br />
(A 2 −M g, (P O2 j g) −M ≤ j ≤−1).<br />
(19)<br />
Next, the direct morphing <strong>al</strong>gorithm, which is described in<br />
Section 2, is applied on the smooth approximation<br />
A 2 −M f and A 2 −M g to generate a smooth approximation<br />
A 2 −M k of an intermediate model. Then, the same<br />
correspondence relations found between A 2 −M f and A 2 −M g<br />
are employed for the interpolation between the detailed<br />
information of f and g to generate PO2 k. Fin<strong>al</strong>ly, the<br />
j<br />
morphed model k is reconstructed from the smooth<br />
approximation A 2 −M k and detailed information P O2 j k.<br />
To establish the correspondence between the smooth<br />
approximation A 2 −M f and A 2 −M g, anatur<strong>al</strong> approach is to<br />
first reconstruct the smooth approximation of the functions<br />
from the discrete approximations A d 2−M f and Ad 2−M g at<br />
resolution 2 −M back to the origin<strong>al</strong> resolution using the<br />
expansion of Equation 15 in 3D. Then, the correspondence<br />
problem can be solved at the origin<strong>al</strong> resolution. This<br />
approach can generate good results, but is computation<strong>al</strong>ly<br />
expensive because of the reconstruction process.<br />
Another approach is to directly establish the<br />
correspondence between the discrete approximation A d 2−M f<br />
and A d 2−M g (see Figure 6). The reason why this method is<br />
reasonable is that the filter H used in the decomposition<br />
can be seen as a low pass filter. Consequently, A d 2−M f and<br />
A d 2−M g can be interpreted as the representation of the<br />
origin<strong>al</strong> functions at a lower resolution, and the<br />
correspondence between A d 2−M f and Ad 2−M g presents the<br />
relation between the gener<strong>al</strong> shape of the two objects. In<br />
addition, given the correspondence, since the sc<strong>al</strong>ing<br />
.<br />
2 j<br />
d<br />
A<br />
2 j<br />
d<br />
A<br />
f<br />
g D 2 j<br />
D 2 j<br />
C<br />
f<br />
g<br />
I<br />
2 H<br />
. 2<br />
2 H . 2<br />
D j+1 f 2<br />
I 2 G<br />
I<br />
D j+1 g 2<br />
C : correspondence I<br />
2<br />
: interpolation<br />
Figure 6:Wav elet Morphing Algorithm<br />
functions ψ (2 j t − n) are <strong>al</strong>l the translations of a single<br />
function ψ (2 j t), interpolation before or after<br />
reconstruction using Equation 15 would generate the same<br />
intermediate model. Unlike the first approach, there is no<br />
need to reconstruct the smooth approximation at the<br />
origin<strong>al</strong> resolution. In addition, since the time of solving<br />
the correspondence problem depends on the size of<br />
volume, it is much cheaper to establish the correspondence<br />
at a lower resolution.<br />
As for the high frequency components, the discrete<br />
detail sign<strong>al</strong>s are interpolated at the same resolution and<br />
the same orientation using the same correspondence<br />
relation found between the smooth approximation. Again,<br />
the theoretic<strong>al</strong> base of this approach is the spati<strong>al</strong> and<br />
frequency loc<strong>al</strong>ity of the wav elet transform. To establish<br />
the correspondence between D i 2 j f and Di 2 j g when j > M,<br />
we treat the subvolumes with size of (2 j−M ) 3 as unit<br />
volume elements in D i 2 j f and Di 2 j g.<br />
Once we have the multiresolution representation,<br />
different interpolation schedules, similar to [3], are applied<br />
at different resolutions. The effect is the blending of the<br />
gener<strong>al</strong> shape of the two models, with the gradu<strong>al</strong> remov<strong>al</strong><br />
of the high frequencies of the first model and the gradu<strong>al</strong><br />
appearance of the high frequencies of the second model.<br />
This is demonstrated in Figure 3b and Figure 7b, where<br />
schedules are designed so that finer details of the first<br />
model disappear faster than the coarser details, while the<br />
coarser details are blended in before the finer details for<br />
the second model.<br />
An advantage of wav elet multiresolution<br />
representation is that the detailed information <strong>al</strong>ong seven<br />
different orientations is separately saved in<br />
D i 2 j f (1 ≤ i ≤ 7). Although not implemented yet, different<br />
schedules can be designed for the detail sign<strong>al</strong>s at the same<br />
resolution but with different orientations, since visu<strong>al</strong><br />
sensitivity depends not only on the frequency components<br />
but <strong>al</strong>so on the orientation of the stimulus [7]. In<br />
summary, bydesigning different schedules, high frequency<br />
G<br />
....
distortion can be adjusted to the desired level (ev en<br />
magnified, if desired) and different morphing effects can<br />
be achieved.<br />
Another flexibility of the wav elet-based morphing is<br />
the wide selection of wav elets that can be employed, since<br />
there is an infinite number of wav elets with different<br />
characteristics. In our implementation, the Battle-Lemarie<br />
wavelet is used for its symmetry and exponenti<strong>al</strong> decay.<br />
5. Results and conclusions<br />
We hav e presented a technique for performing<br />
volume morphing in the wav elet domain. The advantage<br />
of our method over aFourier volume morphing [3] is that<br />
our approach not only effectively reduces high frequency<br />
distortion, but <strong>al</strong>so establishes a suitable correspondence<br />
between the two volumetric datasets without the data<br />
modification process.<br />
The wav elet-based morphing technique presented<br />
can be applied to sampled, simulated and modeled<br />
geometric datasets. Tw o sequences of morphing from a<br />
CT scanned lobster to an MRI head are illustrated in<br />
Figures 3a and 3b. In Figure 3a, volume morphing is<br />
performed directly in the spati<strong>al</strong> domain, while in Figure<br />
3b our technique of wav elet-based volume morphing is<br />
applied to the datasets. The <strong>al</strong>leviation of high frequency<br />
distortion is most apparent during the middle stages of the<br />
animation in Figure 3b, where the morphing is performed<br />
mainly on the gener<strong>al</strong> shape of the models. Similarly, the<br />
comparison between spati<strong>al</strong> and wav elet-based morphing<br />
for geometric datasets is shown in Figures 7a and 7b,<br />
where in these two sequences a binary voxelized goblet is<br />
morphed into a binary voxelized torus. It is shown that in<br />
these two figures the correct topology is maintained during<br />
morphing. Furthermore, in Figure 7b our technique of<br />
wavelet-based morphing gradu<strong>al</strong>ly <strong>al</strong>leviates the high<br />
frequency distortion caused by the <strong>al</strong>iasing existed in the<br />
origin<strong>al</strong> binary voxelized models. Binary voxelized models<br />
were used here just to demonstrated the effectiveness of<br />
the wav elet-based volume morphing. In practice, volumesampled<br />
voxelized models [9] are used as origin<strong>al</strong> models,<br />
resulting in even smoother wav elet-based morphing.<br />
The multiresolution representation of the volume<br />
can be explored for an adaptive morphing. We are<br />
currently building a "previewer" so that the morphing can<br />
be interactively performed at low resolutions. This kind of<br />
"preview" tool is very useful for adjusting morphing<br />
parameters in the interpolation schedules. By taking<br />
advantage of the spati<strong>al</strong> loc<strong>al</strong>ity property of wav elet<br />
transform, subvolumes of the models can be selected for<br />
morphing. Thus, similar to 2D feature-based morphing [1],<br />
3D features of one volume can be extracted and mapped to<br />
the desired feature of another. Weare currently developing<br />
auser interface to accomplish this task. Other future work<br />
includes the investigation of the wav elet selection for the<br />
specific morphing effect, and the design of interpolation<br />
schedules for the information <strong>al</strong>ong different orientations.<br />
6. Acknowledgments<br />
This work has been supported in part by the Nation<strong>al</strong><br />
Science Foundation under grant number CCR-9205047<br />
and the Department of Energy under the PICS grant. The<br />
MRI head data for Figure 3 is courtesy of Siemens,<br />
Princeton, NJ, and the CT lobster data is courtesy of AVS,<br />
W<strong>al</strong>tham, MA. The authors would like to thank Steve<br />
Skiena for his suggestions on the correspondence problem.<br />
7. References<br />
1. Beier, T. and Neely, S., ‘‘Feature-based Image<br />
Metamorphosis’’, Computer Graphics, 26, 2 (July 1992),<br />
35-42.<br />
2. Gortler, S.J., Schroder, P., Cohen, M. F. and Hanrahan, P.,<br />
‘‘Wa velet Radiosity’’, SIGGRAPH 93, August 1993,<br />
221-230.<br />
3. Hughes, J. F., ‘‘Scheduled Fourier Volume Morphing’’,<br />
Computer Graphics, 26, 2(July 1992), 43-46.<br />
4. Kaufman, A., Cohen, D. and Yagel, R., ‘‘Volume<br />
Graphics’’, IEEE Computer, 26, 7(July 1993), 51-64.<br />
5. Kaul, A. and Rossignac, J., ‘‘Solid-Interpolating<br />
Deformations: Construction and Animations of PIPs’’,<br />
Proceeding of EUROGRAPHICS’91, September 1991,<br />
493-505.<br />
6. Kent, J., Parent, R. and Carlson, W., ‘‘Establishing<br />
Correspondence by Topologic<strong>al</strong> Merging: A New<br />
Approach to 3-D Shape Transformation’’, Proceedings of<br />
Graphics Interface’91, June 1991, 271-278.<br />
7. M<strong>al</strong>lat, S. G., ‘‘A Theory for Multiresolution Sign<strong>al</strong><br />
Decomposition: The Wav elet Representation’’, IEEE<br />
Tr ansaction on Patten An<strong>al</strong>ysis and Machine Intelligence,<br />
11, 7(July 1989), 674-693.<br />
8. Muraki, S., ‘‘Volume Data and Wav elet Transform’’, IEEE<br />
Computer Graphics and Applications, 13, 4(July 1993),<br />
50-56.<br />
9. Wang, S. W. and Kaufman, A. E., ‘‘Volume Sampled<br />
Voxelization of Geometric Primitives’’, Proceedings<br />
Visu<strong>al</strong>ization ’93, San Jose, CA, October 1993, 78-84.
Figure 3a: Spati<strong>al</strong> Domain Volume Morphing from a CT Lobster to an MRI Head.
Figure 3b: Wav elet Domain Volume Morphing from a CT Lobster to an MRI Head.
Figure 7a: Spati<strong>al</strong> Domain Volume Morphing from a Binary Voxelized Goblet to a Bi nary<br />
Voxelized Torus.
Figure 7b: Wav elet Domain Volume Morphing from a Binary Voxelized Goblet to a Bi nary<br />
Voxelized Torus.
Please reference the following QuickTime movies located in the MOV<br />
directory:<br />
HE.MOV<br />
HE_2.MOV<br />
Copyright © 1994 by the Research Foundation of the State University of<br />
New York at Stony Brook<br />
QuickTime is a trademark of Apple Computer, Inc.
Progressive Transmission of Scientific Data Using<br />
Biorthogon<strong>al</strong> Wavelet Transform<br />
��� ��� ��� ������ �� ��������<br />
������������������� �������������������<br />
NSF <strong>Engineering</strong> Research Center for Computation<strong>al</strong> Field Simulation<br />
P.O. Box 6176, Mississippi State University, Mississippi State, MS 39762<br />
Abstract<br />
An important issue in scientific visu<strong>al</strong>ization systems<br />
is the management of data sets. Most data sets in scientific<br />
visu<strong>al</strong>ization, whether created by measurement or simulation,<br />
are usu<strong>al</strong>ly voluminous. The go<strong>al</strong> of data management<br />
is to reduce the storage space and the access time of these<br />
data sets to speed up the visu<strong>al</strong>ization process. A new progressive<br />
transmission scheme using spline biorthogon<strong>al</strong><br />
wavelet bases is proposed in this paper. By exploiting the<br />
properties of this set of wavelet bases, a fast <strong>al</strong>gorithm involving<br />
only additions and subtractions is developed. Due<br />
to the multiresolution<strong>al</strong> nature of the wavelet transform,<br />
this scheme is compatible with hierarchic<strong>al</strong>–structured rendering<br />
<strong>al</strong>gorithms. The formula for reconstructing the function<strong>al</strong><br />
v<strong>al</strong>ues in a continuous volume space is given in a<br />
simple polynomi<strong>al</strong> form. Lossless compression is possible,<br />
even when using floating–point numbers. This <strong>al</strong>gorithm<br />
has been applied to data from a glob<strong>al</strong> ocean model. The<br />
lossless compression ratio is about 1.5:1. With a compression<br />
ratio of 50:1, the reconstructed data is still of good<br />
qu<strong>al</strong>ity. Sever<strong>al</strong> other wavelet bases are compared with the<br />
spline biorthogon<strong>al</strong> wavelet bases. Fin<strong>al</strong>ly, the reconstructed<br />
data is visu<strong>al</strong>ized using various <strong>al</strong>gorithms and the<br />
results are demonstrated.<br />
1. Introduction<br />
Progressive transmission is a good framework for data<br />
management in scientific visu<strong>al</strong>ization when a large volume<br />
of data is involved. The principle is to transmit the<br />
least amount of data necessary to generate a usable approximation<br />
of the origin<strong>al</strong> data. If the user requires further refinement,<br />
more data is fetched into the memory and a higher–resolution<br />
data set is reconstructed. See Fig. 1.<br />
Progressive transmission <strong>al</strong>gorithms based on the<br />
DCT, tree–structured pyramids, bit plane techniques, etc.,<br />
have been proposed [2]. Blandford [3] presented a scheme<br />
based on a 8–tap discrete wavelet transform (WT) and concluded<br />
it was very suitable for progressive transmission in<br />
the case of non–uniform resolution. Muraki [6] applied the<br />
truncated version of Battle–Lemarié wavelets to volume<br />
data and proposed a fast superposition <strong>al</strong>gorithm for reconstruction<br />
of function<strong>al</strong> v<strong>al</strong>ues in continuous space. However,<br />
there are still some unsolved problems. Most transform–<br />
based approaches slow down the system performance by<br />
introducing a time–consuming decoding procedure. This<br />
greatly limits their v<strong>al</strong>ue in applications with strict speed<br />
HH HL<br />
LH<br />
Origin<strong>al</strong><br />
Data<br />
WT<br />
HH HL<br />
LH LL<br />
Refinement Information<br />
Refine–<br />
ment<br />
Control<br />
super–<br />
position<br />
IWT<br />
Rendering<br />
<strong>al</strong>gorithms<br />
Reconstruct–<br />
ed Data<br />
Figure 1: Block diagram of progressive transmisson using<br />
the wavelet transform.<br />
requirements. In most visu<strong>al</strong>ization techniques such as isosurface<br />
rendering and fluid topology extraction, the function<strong>al</strong><br />
v<strong>al</strong>ues in the continuous space must be c<strong>al</strong>culated<br />
conveniently. By using an infinitely supported function as<br />
the superposition basis, a complex approximation <strong>al</strong>gorithm<br />
has to be utilized. Another drawback is that since<br />
most low bit–rate <strong>al</strong>gorithms use transforms such as the<br />
DCT or WT, lossless data compression is difficult because<br />
the denominators of the coefficients often are not in the<br />
form of 2 n .
In this paper, a scheme based on the biorthogon<strong>al</strong><br />
spline wavelet transform is proposed. The lengths of <strong>al</strong>l filters<br />
are less than 6. Experiment<strong>al</strong> results indicate that they<br />
perform better in most cases than a family of optimized<br />
6–tap wavelet bases where the same filter is used in both the<br />
decomposition and the reconstruction sides. Because <strong>al</strong>l the<br />
filter coefficients are dyadic ration<strong>al</strong>s, multiplication and<br />
division operations can be simplified to addition and subtraction<br />
for floating–point numbers or to shifting for integer<br />
numbers. This makes the transform much faster. This property<br />
<strong>al</strong>so makes lossless coding possible. In the case of the<br />
biorthogon<strong>al</strong> wavelet, symmetry is more easily achieved,<br />
resulting in a better handling of the data boundary. Because<br />
the transform basis functions are compactly supported and<br />
can be explicitly formulated in a polynomi<strong>al</strong> form, the reconstruction<br />
of function v<strong>al</strong>ues from wavelet transform coefficients<br />
is much easier.<br />
2. Method<br />
Basic<strong>al</strong>ly, the scheme illustrated in Fig. 1 contains four<br />
steps. The wavelet transform and entropy coding, the entropy<br />
decoding and inverse wavelet transform, the refinement<br />
strategy and the rendering <strong>al</strong>gorithm. Since sophisticated<br />
methods for entropy coding and refinement control exist<br />
[2][3][4], we will focused on the wavelet transform and the<br />
reconstruction of function<strong>al</strong> v<strong>al</strong>ues in continuous space.<br />
2.1 Biorthogon<strong>al</strong> Wavelet Transform<br />
Because of its multiresolution<strong>al</strong> nature, the wavelet<br />
transform is very suitable for hierarchic<strong>al</strong> manipulations<br />
such as progressive data transmission and tree–structured<br />
graphics rendering. A simple WT decomposition and reconstruction<br />
scheme [4] using quadrature mirror filters<br />
(QMF) is shown in Figure 2.<br />
Suppose that c j�1 is the origin<strong>al</strong> input at a given resolution<br />
level j � 1. In the decomposition stage, data are<br />
convoluted with a pair of filters h and g. h is often a low–<br />
pass filter while g is often a high–pass filter. As a result, the<br />
c j can be viewed as a coarser approximation of c j�1 . By<br />
downsampling the filtered data, the tot<strong>al</strong> number of samples<br />
in level j is the same as that of level j � 1. This procedure<br />
can be repeated sever<strong>al</strong> times. After reconstruction,<br />
the fin<strong>al</strong> result c ~ j�1 is identic<strong>al</strong> to c j�1 . g is given by:<br />
g n � (� 1) n h �n�1<br />
There are many families of wavelet bases with reasonable<br />
decay both in the time and the frequency domain. To<br />
guarantee perfect reconstruction (PR), the filter can not be<br />
truncated. This implies that the wavelet basis must be compactly<br />
supported. Also, to more easily de<strong>al</strong> with the data<br />
(1)<br />
boundary, symmetric bases are preferred. However, it is<br />
well known from wavelet theory that symmetry and perfect<br />
reconstruction are incompatible if we use the transform in<br />
Fig. 2. This difficulty can be overcome by using the biorthogon<strong>al</strong><br />
wavelet transform [1], which is diagrammed in<br />
Fig. 3.<br />
h<br />
2�<br />
2�<br />
c j<br />
c<br />
+<br />
j�1 ~ j�1<br />
c<br />
g<br />
d j<br />
put one zero between 2� keep one sample out<br />
each sample of two<br />
Figure 2: Block diagram of the basic wavelet decomposition<br />
and reconstruction scheme. Only one h is needed.<br />
c j�1<br />
2�<br />
2�<br />
h convolve with h(n) g convolve with g(n)<br />
h convolve with h(–n) g convolve with g(–n)<br />
2�<br />
h<br />
g<br />
2�<br />
2�<br />
c j<br />
d j<br />
Figure 3: Block diagram of the biorthogon<strong>al</strong> wavelet de–<br />
composition and reconstruction scheme. and h are<br />
different.<br />
~<br />
h<br />
2�<br />
2�<br />
h ~<br />
g ~<br />
h<br />
g<br />
+ c~ j�1<br />
In this implementation, h and h ~<br />
are different but are<br />
both symmetric . Also, g and g ~ satisfy:<br />
g ~<br />
n � (� 1)n h �n�1<br />
gn � (� 1) n h ~<br />
�n�1 (2)<br />
If H(�) and H ~<br />
(�) are the Fourier–transforms of h and h ~<br />
, according<br />
to [1], a sufficient condition on H and H ~<br />
to make<br />
them PR filters is:<br />
� �<br />
l�1<br />
�l � 1 � p<br />
p �· sin(��2)<br />
p�0<br />
2p � sin(��2) 2l H(�)H<br />
R(�)�<br />
~<br />
(�) � cos(��2) 2l ·<br />
where R(�) is an odd polynomi<strong>al</strong> in cos(�), and<br />
2l � k � k ~<br />
, which means the length of h and h ~<br />
(3)
should be both even or both odd. If R � 0 and if<br />
H ~<br />
(�) � cos(��2) k~<br />
e j ���2 , where � � 0 if k ~<br />
is even and<br />
� � 1 if k ~<br />
is odd, h and h ~<br />
are c<strong>al</strong>led spline filters since the<br />
related sc<strong>al</strong>ing function � ~<br />
is a B–spline function. Table I<br />
gives some example bases of this family. H ~<br />
(z) and H(z) are<br />
z–transforms of h and h ~<br />
. Notice that the denominators of<br />
the coefficients are <strong>al</strong>l in the form 2 n . This property makes<br />
them good candidates for our application. There is still<br />
some freedom left to choose bases from this family depending<br />
on implementation requirements. One basic principle<br />
is if a set of longer bases is used, the frequency separation<br />
property of h and g will be better , but at the expenses of<br />
more computation<strong>al</strong> complexity and a lower lossless compression<br />
ratio�<br />
k ~<br />
H ~<br />
TABLE I<br />
(z) k H(z)<br />
1 (1 � z) 1<br />
1<br />
(1 � z)<br />
2<br />
3 � z�2 z�1<br />
� �<br />
1<br />
�<br />
z z2 z3<br />
� �<br />
16 16 2 2 16 16<br />
2<br />
3<br />
1<br />
2 (z�1 � 2 � z) 2 � z�2<br />
4<br />
3z �4<br />
128<br />
8<br />
� 3z�3<br />
64<br />
� z�1<br />
4<br />
� z�2<br />
8<br />
� z2<br />
8<br />
1<br />
4 (z�1 � 3 � 1 � z�1<br />
4<br />
3z � z 2 )<br />
3<br />
3z �3<br />
64<br />
� 9z�2<br />
64<br />
� 7z2<br />
64<br />
� 3<br />
4<br />
� 19z�1<br />
64<br />
�<br />
z z2<br />
�<br />
4 8<br />
3z3 3z4<br />
� �<br />
64 128<br />
� 3<br />
4<br />
� 7z�1<br />
64<br />
�<br />
3z z2<br />
�<br />
4 4<br />
9z3 3z4<br />
� �<br />
64 64<br />
�<br />
45<br />
�<br />
19z<br />
64 64<br />
�<br />
45<br />
�<br />
45z<br />
64 64<br />
Our application involves rendering the data from eighteen<br />
75 MB data files simultaneously. For efficient visu<strong>al</strong>ization,<br />
the inverse wavelet transform must be very fast. A<br />
system using the wavelet bases in Table I with k ~<br />
� 2 and<br />
k � 2 has been implemented. Fig. 4 shows the sc<strong>al</strong>e function<br />
� ~<br />
(x) and the wavelet function � ~ (x).<br />
2.2 Fast Wavelet Transform<br />
The efficient wavelet transform method introduced by<br />
M<strong>al</strong>lat [4] borrowed the QMF scheme from subband coding<br />
theory (Fig. 2). In this <strong>al</strong>gorithm, the major computation<strong>al</strong><br />
burden is caused by the convolution operation which in-<br />
volves a lot of floating–point multiplication. Because h, h ~<br />
,<br />
g and g ~ are <strong>al</strong>l symmetric in our scheme, the number of<br />
multiplications can be reduced by approximately 50%. After<br />
investigating the IEEE standard–floating point data format<br />
(Fig. 5), it was found that for a floating–point number,<br />
multiplication by 2 n can be simplified to the addition of n<br />
to the exponent, while for an integer number only a shift<br />
1.0<br />
0.0<br />
–0.5<br />
2.0<br />
1.0<br />
0.0<br />
–1.0<br />
–1.0 0.0 1.0<br />
–1.0 0.0 1.0<br />
� ~<br />
(x)<br />
� ~ (x)<br />
Figure 4: Sc<strong>al</strong>e function and wavelet function of<br />
biorthogon<strong>al</strong> WT in Table I when k and .<br />
~<br />
�<br />
� 2<br />
~ � (x)<br />
~ (x)<br />
k � 2<br />
operation is needed. This fact was exploited to develop a<br />
multiplication–free WT <strong>al</strong>gorithm.<br />
8–BIT<br />
EXP.<br />
23–BIT<br />
FRACTION<br />
SIGN OF FRACTION<br />
2.0<br />
SINGLE REAL<br />
Figure 5: Single precision (32 bits) floating–point data for–<br />
mat defined by IEEE 754 standard.<br />
2.3 Superposition<br />
To combine a progressive transmission scheme with a<br />
visu<strong>al</strong>ization <strong>al</strong>gorithm such as isosurface generation or<br />
ray casting, the function<strong>al</strong> v<strong>al</strong>ues in the continuous volume<br />
must be approximated efficiently from the transform coef-<br />
ficients. In a gener<strong>al</strong> 1–D case, if the WT with k ~<br />
� 2 and<br />
k � 2 is used, the function v<strong>al</strong>ue at x can be reconstructed<br />
using the following formula:<br />
f ^ j��<br />
(x) � �<br />
j���<br />
� ~<br />
K, j<br />
i�K<br />
(x) � �<br />
j��<br />
i�1<br />
j���<br />
� ~<br />
i, j (x)<br />
where � ~<br />
K, j (x) � 2�K � � ~<br />
( 2�K � j )<br />
� ~<br />
i, j (x) � 2�i � � ~ ( 2�i � j )<br />
K � levels of the WT (4)<br />
When � ~<br />
(x) is a set of compactly supported piecewise B–
spline functions, f(x) can be written in a closed polynomi<strong>al</strong><br />
form with order k ~<br />
� 1. As shown in Fig. 4, the � ~<br />
(x) and<br />
� ~ (x) in our <strong>al</strong>gorithm are of order 1. The process of reconstructing<br />
the function v<strong>al</strong>ues in a continuous space from the<br />
WT coefficients is illustrated in Fig. 6. In each interv<strong>al</strong> [i,<br />
i+1) , the reconstructed functions are linear functions. Thus<br />
(4) can be simplified to:<br />
f ^ (x) � (1 � q ) · f ^ (l) � q · f ^ (l�1)<br />
where x � [l, l � 1)<br />
q � x�l<br />
This suggests that the exact function v<strong>al</strong>ue at any re<strong>al</strong> x can<br />
be computed through linear interpolation of the function<br />
v<strong>al</strong>ues at the two discrete neighbors which surround x. In<br />
this case, the resulted f ~<br />
(x) is C 0 continuous. When the order<br />
of � ~<br />
(x) and � ~ (x) is larger than 1, we can still write (4)<br />
in a closed polynomi<strong>al</strong> form with order of k ~<br />
(x) will<br />
� 1. f ~<br />
be C k~ �2 continuous. If we simply take the tensor product<br />
of the one–dimension bases as the bases for the multidimension<br />
WT, the same conclusion can be derived.<br />
2.4 Lossless Compression is Possible<br />
IEEE single–precision floating–point numbers have<br />
23+1 bits of precision. Multiplication by 2 n will require no<br />
extra bit to retain the same precision. However, addition<br />
may result in some extra bits. As an example, consider the<br />
WT in our scheme. For h, the convolution formula is:<br />
cn � � 1<br />
8 f n�2 � 1<br />
4 f n�1 � 3<br />
4 fn � 1<br />
4 f n�1 � 1<br />
8 f n�2<br />
Where f i is the discrete input function v<strong>al</strong>ue. Suppose the<br />
maximum and minimum exponents of <strong>al</strong>l five f i v<strong>al</strong>ues are<br />
Pmax and P min. Then the maximum number of extra bits we<br />
need to record the precise c n is:<br />
(5)<br />
(6)<br />
be � Pmax � P min � 3 (7)<br />
Similarly, for h ~<br />
, the maximum number of extra bits needed<br />
is no more than:<br />
b ~<br />
e � Pmax � P min � 2 (8)<br />
This is the worst case. Usu<strong>al</strong>ly b e and b ~<br />
e are less than the<br />
v<strong>al</strong>ue given here. To increase the lossless compression ratio,<br />
the fewest extra bits for each coefficient in the transform<br />
domain is desired. Recording the information about<br />
extra bits using an oct–tree has produced good results.<br />
...<br />
...<br />
–4<br />
–4<br />
. . . . . .<br />
–4<br />
C 1 �1 �~<br />
1,�1<br />
–2<br />
d 1 �2 �~<br />
1,�2<br />
–2<br />
–2<br />
d 1<br />
�1 �~<br />
1,�1<br />
C 1 0 �~<br />
1, 0<br />
C 1 1 �~<br />
1, 1<br />
0 2 4<br />
d 1 0 �~<br />
1, 0<br />
d 1 1 �~<br />
1, 1<br />
0 2 4<br />
f ^<br />
(x)<br />
0 2 4<br />
...<br />
+<br />
=<br />
...<br />
. . . . . .<br />
Figure 6: Reconstruction (superposition) of function v<strong>al</strong>ues<br />
in continuous space using WT coefficients in our<br />
scheme. Notice the f is linear function in the interv<strong>al</strong> of<br />
[i, i+1).<br />
^<br />
(x)<br />
3. Results<br />
We applied the scheme described in this paper to ocean<br />
model data [14]. The model output was available on a<br />
337 � 468 � 6 grid 120 times per year. Layer thickness<br />
and current data in floating–point format — variables from<br />
the model — were used in our experiments. Each of the<br />
six time–varying layers were considered separately, the top<br />
layer being of greatest interest.<br />
First, we compared the spline biorthogon<strong>al</strong> wavelet<br />
transform with a family of 6–tap WTs where <strong>al</strong>l hi are functions<br />
of two parameters — � and � — according to the formulae<br />
�� ���� Sever<strong>al</strong> 1–D sign<strong>al</strong> sequences with 120 samples<br />
were randomly chosen from the ocean model data set.<br />
For each test sign<strong>al</strong>, we searched exhaustively in the � � �<br />
x<br />
x<br />
x
h �2 � ��1 � cos � � sin �)· (1 � cos � � sin �) � 2 cos � sin �]�4<br />
h �1 � ��1 � cos � � sin �)· (1 � cos � � sin �) � 2 cos � sin �]�4<br />
h 0 � [1 � cos(� � �) � sin(� � �)]�2<br />
h 1 � [1 � cos(� � �) � sin(� � �)]�2<br />
h 2 � 1 � h �2 � h 0 h 3 � 1 � h �1 � h 1<br />
where � � � �,� � � (9)<br />
parameter space for the minimum MSE and compared it<br />
with the MSE generated by the spline biorthogon<strong>al</strong> wavelet<br />
compression <strong>al</strong>gorithm. Table II gives the results of some<br />
typic<strong>al</strong> sign<strong>al</strong>s in our application. From these data, we concluded<br />
that <strong>al</strong>though the lengths of the spline biorthogon<strong>al</strong><br />
WT filters are less than 6, they perform the same or better<br />
than the optimized 6–tap WTs in a scheme where both forward<br />
and inverse transforms use the same filters.<br />
TABLE II<br />
Test Sign<strong>al</strong> 6–Tap WT Biorth. Spline WT<br />
� �<br />
k MSE<br />
~<br />
120 samples Optim<strong>al</strong> Optim<strong>al</strong> MSE � 2, k � 2,<br />
A –1.0210 0.4712 0.0241 0.0143<br />
B 1.4137 0.8639 0.0805 0.0537<br />
C 1.4922 1.0210 0.0806 0.0513<br />
D –1.0210 0.3141 0.0099 0.0048<br />
E 1.0995 0.3141 0.1521 0.0912<br />
F –1.4137 –0.8639 0.2364 0.0831<br />
G 1.1780 0.4712 0.1947 0.0786<br />
To apply the biorthogon<strong>al</strong> WT to our data set, the<br />
boundary conditions had to be considered. In each frame<br />
(timestep) of ocean model data, v<strong>al</strong>id function v<strong>al</strong>ues were<br />
only available within the ocean area (Fig. 7a). This area was<br />
constant over time. A 2–D WT requires the ocean area be<br />
approximated using square blocks. The blocksize used was<br />
2 n � 2 n , where n was larger than the level of the WT in<br />
each data frame. The approximated ocean area had to cover<br />
the entire origin<strong>al</strong> ocean area (Fig. 7b). For grid points in<br />
the approximated ocean area but not in the origin<strong>al</strong> area, interpolation<br />
and extrapolation techniques were used to yield<br />
function v<strong>al</strong>ues. This introduced some discontinuity at the<br />
data boundary. In our implementation, second order Lagrange<br />
interpolation was used. Since <strong>al</strong>l our WT bases are<br />
symmetric, the function v<strong>al</strong>ues outside the boundary were<br />
achieved simply by reflection.<br />
As shown in Figure 8, after applying the transform<br />
twice in each spati<strong>al</strong> dimension in a frame and once in the<br />
tempor<strong>al</strong> dimension, only 1/32 of the transform coefficients<br />
were transmitted to the decoder. The reconstructed<br />
data had good qu<strong>al</strong>ity and met the requirements of further<br />
scientific visu<strong>al</strong>ization processes. By using the refinement<br />
control strategy proposed by Blandford [3], only a sm<strong>al</strong>l<br />
amount of data was needed for a better reconstruction.<br />
In Fig. 9, layer thickness, which is a sc<strong>al</strong>ar field, compressed<br />
by our <strong>al</strong>gorithm at the rate of 50:1 is shown. For<br />
y<br />
t<br />
x<br />
2, v dF c 2<br />
F<br />
1, v dF 2, d dF d 2,h<br />
F<br />
1, v dB 1, d dF 1, h dF 464<br />
1, d dB 1, h dB 120<br />
336<br />
Figure 8: Wavelet transform coefficients of 3–D data of<br />
ocean model.<br />
a 2–D vector field, the two components are encoded independently.<br />
Streamlines are generated both for the origin<strong>al</strong><br />
field and the field reconstructed using only 1/32 of WT coefficients,<br />
the results are shown in Fig. 10.<br />
Applying a topology extraction <strong>al</strong>gorithm [10] to this<br />
vector field, the glob<strong>al</strong> and the stable topology structures<br />
remained relatively unchanged, even at a 16:1 compression<br />
ratio. With progressive refinement, more and more loc<strong>al</strong><br />
and unstable features can be extracted (Fig. 11). This can<br />
be explained as the low–pass effects of the WT.<br />
The decoding speed, an important factor in interactive<br />
visu<strong>al</strong>ization system, is about 10 frames/sec on an SGI Indigo<br />
2 machine. This satisfies the need of fast volume rendering<br />
in our application.<br />
4. Conclusions and Future works<br />
A new scheme of progressive transmission using a<br />
spline biorthogon<strong>al</strong> wavelet transform is proposed in this<br />
paper. This family of wavelet base functions is symmetric,<br />
compactly supported, and the QMF coefficients are dyadic<br />
ration<strong>al</strong>s. These attractive features make this scheme advantageous<br />
in sever<strong>al</strong> aspects. The transform itself is fast<br />
and high compression ratios can be achieved. The reconstructed<br />
data is of good qu<strong>al</strong>ity and can be refined with a<br />
sm<strong>al</strong>l amount of addition<strong>al</strong> data. Data boundaries can be<br />
tackled gracefully, The reconstruction of function v<strong>al</strong>ues in<br />
continuous space from the WT coefficients is a simple<br />
polynomi<strong>al</strong>. This interesting property is especi<strong>al</strong>ly useful<br />
for scientific visu<strong>al</strong>ization applications.<br />
Future work includes more investigation of the WT’s<br />
effects on the topology of the flow field, combining this <strong>al</strong>gorithm<br />
with some other hierarchic<strong>al</strong> scientific visu<strong>al</strong>iza-
tion techniques, and constructing better wavelet bases.<br />
5. Acknowledgments<br />
We wish to thank Scott Nations for his many helpful<br />
comments on an early version of this paper. This work has<br />
been supported in part by ARPA and the Strategic Environment<strong>al</strong><br />
Research and Development Program (SERDP).<br />
6. References<br />
[1] I. Daubechies, Ten Lectures on Wavelets, CBMS–NSF Region<strong>al</strong><br />
Conference Series in Applied Mathematics, no. 61, Society for Industri<strong>al</strong><br />
and Applied Mathematics, Philadelphia, PA, 1992.<br />
[2] Kou–Hu Tzou, “Progressive Image Transmission: A Review<br />
and Comparison of Techniques,” Optic<strong>al</strong> <strong>Engineering</strong>, 26(7), pp.<br />
581–589, July 1987.<br />
[3] R. P. Blandford, “Wavelet Encoding and Variable Resolution<br />
Progressive Transmission,” NASA Space & Earth Science Data<br />
Compression Workshop Proceedings, pp. 25–34, April 1993.<br />
[4] S. G. M<strong>al</strong>lat, “A theory for multiresolution sign<strong>al</strong> decomposition:<br />
the wavelet representation,” IEEE Trans. Pattern An<strong>al</strong>. Machine<br />
Intell., vol. 11, no. 7, July 1989.<br />
[5] M. A. Cody, “The Fast Wavelet Transform,” Dr. Dobb’s Journ<strong>al</strong>,<br />
vol. 17, no. 4, April 1992.<br />
[6] S. Muraki, “Volume Data and Wavelet Transforms,” IEEE Computer<br />
Graphics & Applications, pp. 50–56, July 1993.<br />
[7] P. Ning and L. Hesselink, “Fast Volume Rendering of Compressed<br />
Date,” Visu<strong>al</strong>ization ’93 Proceedings, pp. 11–18, 1993.<br />
[8] M. Antonini, M. Barlaud, P. Mathieu and I. Daubechies, “Image<br />
Coding Using Wavelet Transform,” IEEE Trans. on Image Processing,<br />
vol. 1, no. 2, pp. 205–220, April 1992.<br />
[9] R. H. Abraham and C. D. Shaw, Dynamics: The Geometry of Behavior,<br />
part 1–4, Arie Press, Santa Cruz, CA, 1984.<br />
[10] J. L. Helman and L. Hesselink, “Representation and Display of<br />
Vector Field Topology in Fluid Flow Data Sets,” IEEE Computer,<br />
pp. 27–36, Aug. 1989.<br />
[11] O. Rioul and M. Vetterli, “Wavelets and Sign<strong>al</strong> Processing,”<br />
IEEE SP Magazine, pp 14–38, Oct. 1991.<br />
[12] A. H. Tewfik, D. Sinha and P. Jorgensen, “On the Optim<strong>al</strong><br />
Choice of a Wavelet for Sign<strong>al</strong> Representation,” IEEE Trans. on<br />
Info. Theory, vol. 38, no. 2, pp 747–765, March 1992.<br />
[13] J. N. Bradley and C. M. Brislawn, “Applications of Wavelet–<br />
Based Compression to Multidimension<strong>al</strong> Earth Science Data,”<br />
NASA Space & Earth Science Data Compression Workshop Proceedings,<br />
pp. 13–24, April 1993.<br />
[14] H. E. Hurlburt, A. J. W<strong>al</strong>lcraft, Z. Sirkes and E. J. Metzger,<br />
“Modeling of the Glob<strong>al</strong> and Pacific Oceans,” Oceanography, vol.<br />
5, no. 1, pp. 9–18, 1992.<br />
[15] M. Rabbani and P. Jones, Digit<strong>al</strong> Image Compression Techniques,<br />
SPIE, vol. TT7, 1991.<br />
Pacific Ocean<br />
(a)<br />
Approximated Ocean Area<br />
(b)<br />
North America<br />
Land<br />
Figure 7: Land and ocean areas in each data frame. (a)<br />
Ocean area in origin<strong>al</strong> data (white area). (b) Approximation<br />
of the ocean area using 8�8 blocks. This approximated<br />
version entirely covers the origin<strong>al</strong> ocean area.
Step 19<br />
Figure 9a. Layer thickness for the NE Pacific Ocean-<br />
Origin<strong>al</strong> thickness data.<br />
Figure 10a. Velocity data for the NE Pacific Ocean-<br />
Origin<strong>al</strong> data.<br />
Step 19<br />
Figure 9b. Layer thickness for the NE Pacific Ocean-<br />
Reconstructed data (compression ratio = 50:1).<br />
Figure 10b. Velocity data for the NE Pacific Ocean-<br />
Reconstructed data (compression ratio = 50:1).<br />
Figure 11. Vector field topology extraction on reconstructed data. (a) Using origin<strong>al</strong> data. (b) Data reconstructed<br />
using 1/4 WT coefficients. (c) Data reconstructed using 1/16 WT coefficients.
An Ev<strong>al</strong>uation of Reconstruction Filters for Volume Rendering<br />
Stephen R. Marschner and Richard J. Lobb †<br />
Program of Computer Graphics<br />
Cornell University, Ithaca NY 14853<br />
srm@graphics.cornell.edu richard@cs.auckland.ac.nz<br />
Abstract<br />
To render images from a three-dimension<strong>al</strong> array of<br />
sample v<strong>al</strong>ues, it is necessary to interpolate between the<br />
samples. This paper is concerned with interpolation methods<br />
that are equiv<strong>al</strong>ent to convolving the samples with a reconstruction<br />
filter; this covers <strong>al</strong>l commonly used schemes,<br />
including trilinear and cubic interpolation.<br />
We first outline the form<strong>al</strong> basis of interpolation in<br />
three-dimension<strong>al</strong> sign<strong>al</strong> processing theory. We then propose<br />
numeric<strong>al</strong> metrics that can be used to measure filter<br />
characteristics that are relevant to the appearance of images<br />
generated using that filter. We apply those metrics<br />
to sever<strong>al</strong> previously used filters and relate the results to<br />
isosurface images of the interpolations. We show that the<br />
choice of interpolation scheme can have a dramatic effect<br />
on image qu<strong>al</strong>ity, and we discuss the cost/benefit tradeoff<br />
inherent in choosing a filter.<br />
1 Introduction<br />
Volume data, such as that from a CT or MRI scanner, is<br />
gener<strong>al</strong>ly in the form of a large array of numbers. In order<br />
to render an image of a volume’s contents, we need to construct<br />
from the data a function that assigns a v<strong>al</strong>ue to every<br />
point in the volume, so that we can perform rendering operations<br />
such as simulating light propagation or extracting<br />
isosurfaces. This paper is concerned with the methods of<br />
constructingsuch a function. We restrict our attention to the<br />
case of regular sampling, in which samples are taken on a<br />
rectangular lattice. Furthermore, our an<strong>al</strong>ysis is in terms of<br />
uniform regular sampling, in which we have equ<strong>al</strong> spacing<br />
<strong>al</strong>ong <strong>al</strong>l axes, since the non-uniform case can be included<br />
by a simple sc<strong>al</strong>ing.<br />
Given a discrete set of samples, the process of obtaining<br />
a density function that is defined throughout the volume<br />
is c<strong>al</strong>led interpolation or reconstruction; we use these terms<br />
interchangeably. Trilinear interpolation is widely used, for<br />
example in the isosurface extraction <strong>al</strong>gorithms of Wyvill,<br />
et. <strong>al</strong>. [19], and Lorensen, et. <strong>al</strong>. [13, 4], and in many raytracing<br />
schemes (e.g., that of Levoy [12]). Cubic filters<br />
have <strong>al</strong>so received attention: Levoy uses cubic B-splines<br />
for volume resampling, and Wilhelms and Van Gelder mention<br />
Catmull-Rom splines for isosurface topology disam-<br />
† On leave from the Department of Computer Science, University of<br />
Auckland, Auckland, New Ze<strong>al</strong>and until August 1994.<br />
biguation [18]. The “splatting” methods of Westover [17]<br />
and Laur & Hanrahan [11] assume a truncated Gaussian filter<br />
for interpolation, <strong>al</strong>though the interpolation operation is<br />
actu<strong>al</strong>ly merged with illumination and projection into a single<br />
fast but approximate compositing process. Carlbom [3]<br />
discusses the design of discrete “optim<strong>al</strong>” filters based on<br />
weighted Chebyshev minimization. All of these schemes<br />
f<strong>al</strong>l within the standard sign<strong>al</strong> processing framework of reconstruction<br />
by convolution with a filter, which is the model<br />
we use to an<strong>al</strong>yze them.<br />
The process of interpolation is often seen as a minor<br />
aside to the main rendering problem, but we believe it<br />
is of fundament<strong>al</strong> importance and worthy of closer attention.<br />
One needs to be aware of the limitations of interpolation,<br />
and hence of the images produced, which are usu<strong>al</strong>ly<br />
claimed to represent the origin<strong>al</strong> density function prior to<br />
sampling. Sampling and interpolation are <strong>al</strong>so basic to volume<br />
resampling, and the cost of using more sophisticated<br />
interpolation schemes may well be outweighed by the potenti<strong>al</strong><br />
benefits of storing and using fewer samples.<br />
2 Reconstruction Theory<br />
2.1 Review of Fourier an<strong>al</strong>ysis<br />
We will review Fourier an<strong>al</strong>ysis and sampling theory<br />
in two dimensions to make diagrams feasible; the gener<strong>al</strong>ization<br />
to three dimensions is straightforward. Some initi<strong>al</strong><br />
familiarity is assumed; introductions to this subject can be<br />
found in [6] and [7].<br />
Fourier an<strong>al</strong>ysis <strong>al</strong>lows us to write a complex-v<strong>al</strong>ued<br />
function g : R 2 � C as a sum of “plane waves” of the form<br />
exp�i�ωxx � ωyy��. For a periodic function, this can actu<strong>al</strong>ly<br />
be done with a discrete sum (a Fourier series), but for<br />
arbitrary g we need an integr<strong>al</strong>:<br />
g�x�y� � 1<br />
Z<br />
2π R2 ˆg�ωx�ωy�e i�ωxx�ωyy�<br />
dωx dωy<br />
The formula to get ˆg from g is quite similar:<br />
ˆg�ωx�ωy� �<br />
Z<br />
R 2 g�x�y�e�i�ωxx�ωyy� dxdy<br />
One intuitive interpretation of these formulae is that<br />
ˆg�ωx�ωy� measures the correlation over <strong>al</strong>l �x�y� between<br />
g and a complex sinusoid of frequency �ωx�ωy�, and that
g k gk<br />
gˆ kˆ gˆ kˆ = gˆ k<br />
Figure 1: Two-dimension<strong>al</strong> sampling in the space domain (top) and the frequency domain (bottom).<br />
g�x�y� sums up the v<strong>al</strong>ues at �x�y� of sinusoids of <strong>al</strong>l possible<br />
frequencies �ωx�ωy�, weighted by ˆg. We c<strong>al</strong>l ˆg the<br />
Fourier transform of g, and j ˆgj the spectrum of g. Since<br />
the Fourier transform is invertible, g and ˆg are two representations<br />
of the same function; we refer to g as the space<br />
domain representation, or just the sign<strong>al</strong>, and ˆg as the frequency<br />
domain representation. Of particular importance is<br />
that the Fourier transform of a product of two functions is<br />
the convolution of their individu<strong>al</strong> Fourier transforms, and<br />
vice versa: c gh � ˆg � ˆh; d g � h � ˆgˆh.<br />
2.2 Basic sampling theory<br />
We represent a point sample as a sc<strong>al</strong>ed Dirac impulse<br />
function. With this definition, sampling a sign<strong>al</strong> is equiv<strong>al</strong>ent<br />
to multiplyingit by a grid of impulses, one at each sample<br />
point, as illustrated in the top h<strong>al</strong>f of Figure 1.<br />
The Fourier transform of a two-dimension<strong>al</strong> impulse<br />
grid with frequency fx in x and fy in y is itself a grid of impulses<br />
with period fx in x and fy in y. If we c<strong>al</strong>l the impulse<br />
grid k�x�y� and the sign<strong>al</strong> g�x�y�, then the Fourier transform<br />
of the sampled sign<strong>al</strong>, b gk, is ˆg� ˆk. Since ˆk is an impulse grid,<br />
convolving ˆg with ˆk amounts to duplicating ˆg at every point<br />
of ˆk, producing the spectrum shown at bottom right in Figure<br />
1. We c<strong>al</strong>l the copy of ˆg centered at zero the primary<br />
spectrum, and the other copies <strong>al</strong>ias spectra.<br />
If ˆg is zero outside a sm<strong>al</strong>l enough region that the <strong>al</strong>ias<br />
spectra do not overlap the primary spectrum, then we can<br />
recover ˆg by multiplying b gk by a function ˆh which is one<br />
inside that region and zero elsewhere. Such a multiplication<br />
is equiv<strong>al</strong>ent to convolving the sampled data gk with h,<br />
the inverse transform of ˆh. This convolution with h <strong>al</strong>lows<br />
us to reconstruct the origin<strong>al</strong> sign<strong>al</strong> g by removing, or filtering<br />
out, the <strong>al</strong>ias spectra, so we c<strong>al</strong>lh a reconstruction filter.<br />
The go<strong>al</strong> of reconstruction, then, is to extract, or pass, the<br />
primary spectrum, and to suppress, or stop, the <strong>al</strong>ias spectra.<br />
Since the primary spectrum comprises the low frequencies,<br />
the reconstruction filter is a low-pass filter.<br />
It is clear from Figure 1 that the simplest region to<br />
which we could limit ˆg is the region of frequencies that are<br />
less than h<strong>al</strong>f the sampling frequency <strong>al</strong>ong each axis. We<br />
c<strong>al</strong>l this limiting frequency the Nyquist frequency, denoted<br />
fN, and the region the Nyquist region, denoted RN. We define<br />
an ide<strong>al</strong> reconstruction filter to have a Fourier transform<br />
that has the v<strong>al</strong>ue one in the Nyquist region and zero<br />
outside it. 1<br />
2.3 Volume reconstruction<br />
Extending the above to handle the three-dimension<strong>al</strong><br />
sign<strong>al</strong>s encountered in volume rendering is straightforward:<br />
the sampling grid becomes a three-dimension<strong>al</strong> lattice, and<br />
the Nyquist region a cube. See [5] for a discussion of sign<strong>al</strong><br />
processing in arbitrary dimensions.<br />
Given this new Nyquist region, the ide<strong>al</strong> convolution<br />
filter is the inverse transform of a cube, which is the product<br />
of three sinc functions:<br />
hI�x�y�z� � �2 fN� 3 sinc�2 fNx� sinc�2 fNy� sinc�2 fNz��<br />
Thus, in principle, a volume sign<strong>al</strong> can be exactly reconstructed<br />
from its samples by convolving with hI, provided<br />
that the sign<strong>al</strong> was suitably band-limited 2 before it<br />
was sampled.<br />
In practice, we can not implement hI, since it has infinite<br />
extent in the space domain, and we are faced with<br />
choosing an imperfect filter. This will inevitably introduce<br />
some artifacts into the reconstructed function.<br />
3 Practic<strong>al</strong> reconstruction issues<br />
The image processing field, which makes extensive use<br />
of reconstruction filters for image resampling (e.g., [10,<br />
16, 15]), provides a good starting point for an<strong>al</strong>yzing volume<br />
reconstruction filters. In particularly, Mitchell and<br />
1 Other definitions of an ide<strong>al</strong> filter are possible—for example, a filter<br />
h such that ˆh is one inside a circle of radius fN.<br />
2 A sign<strong>al</strong> is band-limited if its spectrum is zero outside some bounded<br />
region in frequency space, usu<strong>al</strong>ly a cube centered on the origin.
Ide<strong>al</strong> reconstruction filter<br />
– fs<br />
Primary spectrum<br />
ˆg<br />
Reconstructed spectrum<br />
Aliasing<br />
0 N f<br />
– f<br />
freq.<br />
N<br />
f s<br />
Alias spectrum<br />
Netrav<strong>al</strong>i [15] identified post<strong>al</strong>iasing, blur, anisotropy, and<br />
ringing as defects arising from imperfect image reconstruction.<br />
3.1 Post<strong>al</strong>iasing<br />
Post<strong>al</strong>iasing arises when energy from the <strong>al</strong>ias spectra<br />
“leaks through” into the reconstruction, due to the reconstruction<br />
filter being significantly non-zero at frequencies<br />
above fN. The term post<strong>al</strong>iasing is used to distinguish the<br />
problem from pre<strong>al</strong>iasing, which occurs when the sign<strong>al</strong> is<br />
insufficiently band-limited before sampling, so that energy<br />
from the <strong>al</strong>ias spectra “spills over” into the region of the primary<br />
spectrum. In both cases, frequency components of the<br />
origin<strong>al</strong> sign<strong>al</strong> appear in the reconstructed sign<strong>al</strong> at different<br />
frequencies (c<strong>al</strong>led <strong>al</strong>iases). The important distinction<br />
between the two types of <strong>al</strong>iasing is illustrated in Figure 2.<br />
Sample frequency ripple is a form of post<strong>al</strong>iasing that<br />
arises when the filter’s spectrum is significantly non-zero at<br />
lattice points in the frequency domain. The zero-frequency,<br />
or “DC”, component of the <strong>al</strong>ias spectra, which is very<br />
strong even for sign<strong>al</strong>s with little density variation, then appears<br />
in the interpolated volume as an oscillationat the sample<br />
frequency. Near-sample-frequency ripple, which occurs<br />
when filters are non-zero in the immediate vicinity of frequency<br />
domain lattice points, can <strong>al</strong>so be significant.<br />
3.2 Smoothing (“blur”)<br />
This term refers to the remov<strong>al</strong> of rapid variations in a<br />
sign<strong>al</strong> by spati<strong>al</strong> averaging. Some degree of smoothing is<br />
norm<strong>al</strong> during reconstruction, since practic<strong>al</strong> filters usu<strong>al</strong>ly<br />
start to cut off well before fN. In image processing, excessive<br />
smoothing results in a blurred image. In volume rendering,<br />
it results in loss of fine density structure. Theoretic<strong>al</strong>ly,<br />
smoothing is a filter defect, but in practice noisy volume<br />
data may benefit from some smoothing, since most of<br />
its fine structure is spurious. Also, smoothing is often necessary<br />
to combat Gibbs phenomenon (see below).<br />
3.3 Ringing (overshoot)<br />
Low-pass filtering of step discontinuities results in oscillations,<br />
or ringing, just before and after the discontinuity;<br />
this is the Gibbs phenomenon (see for example [14]). Severe<br />
ringing is not necessary for band-limitedness: Figure 3<br />
shows two band-limited approximations to a square wave,<br />
Imperfect reconstruction filter<br />
– fs<br />
Primary spectrum<br />
Figure 2: Pre<strong>al</strong>iasing (left) and post<strong>al</strong>iasing (right).<br />
ˆg<br />
Reconstructed spectrum<br />
Aliasing<br />
0 N f s f<br />
– f<br />
freq.<br />
N<br />
Alias spectrum<br />
one generated with an ide<strong>al</strong> low pass filter and the other<br />
with a filter that cuts off more gradu<strong>al</strong>ly but with the same<br />
ultimate cut-off frequency. Perceptu<strong>al</strong>ly, the latter seems<br />
preferable. 3<br />
When a sign<strong>al</strong> is being sampled, we have seen that it<br />
must be band-limited if we are to reconstruct it correctly.<br />
Natur<strong>al</strong> sign<strong>al</strong>s are not gener<strong>al</strong>ly band-limited, and so must<br />
be low-pass filtered before they are sampled (or, equiv<strong>al</strong>ently,<br />
the sampling operation must include some form of<br />
loc<strong>al</strong> averaging). The usu<strong>al</strong> assumption is that an ide<strong>al</strong> lowpass<br />
filter, cutting off at the Nyquist frequency, is optim<strong>al</strong>.<br />
However, we have just seen that such a filter causes ringing<br />
around any discontinuities, regardless of any subsequent<br />
sampling and reconstruction. If we then reconstruct the<br />
sampled sign<strong>al</strong> with an ide<strong>al</strong> reconstruction filter, we will<br />
end up with exactly the filtered sign<strong>al</strong> we sampled, which<br />
has ringing at the discontinuities. To avoid such problems,<br />
either the sampling filter or the reconstruction filter should<br />
have a gradu<strong>al</strong> cutoff if the sign<strong>al</strong> to be sampled contains<br />
discontinuities.<br />
sharp cutoff gradu<strong>al</strong> cutoff<br />
Figure 3: Band-limited square waves.<br />
3.4 Anisotropy<br />
If the reconstruction filter is not spheric<strong>al</strong>ly symmetric,<br />
the amount of smoothing, post<strong>al</strong>iasing, and ringing will<br />
vary according to the orientation of features in the volume<br />
with respect to the filter. Anisotropy manifests itself as an<br />
asymmetry in smoothing or post<strong>al</strong>iasing artifacts; in the absence<br />
of those, anisotropy can not occur. We therefore regard<br />
anisotropy as a secondary effect, and do not measure<br />
it separately.<br />
3 But the former is the optim<strong>al</strong> band-limited approximation under the<br />
L 2 norm, which demonstrates the dangers of assuming that the L 2 norm is<br />
<strong>al</strong>ways appropriate.
3.5 Cost<br />
The remaining critic<strong>al</strong> issue in filter design is that of<br />
cost. Any practic<strong>al</strong> filter takes a weighted sum of only a limited<br />
number of samples to compute the reconstruction at a<br />
particular point; that is, it is zero outside some finite region,<br />
c<strong>al</strong>led the region of support. If a filter’s region of support<br />
is contained within a cube of side length 2r, we c<strong>al</strong>l r the<br />
radius of the filter. In this paper, we consider a range of filters<br />
of different radii. It is important to re<strong>al</strong>ize that larger<br />
filters are gener<strong>al</strong>ly much more expensive: a trilinear interpolation<br />
involves a weighted sum of eight samples, while a<br />
tricubic filter involves 64. In gener<strong>al</strong>, the number of samples<br />
involved increases as the cube of the filter radius.<br />
The effect of filter radius on the run time of a volume<br />
rendering program depends on the <strong>al</strong>gorithm. Run times for<br />
simple ray tracing <strong>al</strong>gorithms tend to increase with the cost<br />
of each density c<strong>al</strong>culation, i. e., as the cube of the filter radius.<br />
Run times for splatting<strong>al</strong>gorithms, which precompute<br />
the two-dimension<strong>al</strong> “footprint” of a filter, tend to increase<br />
as the square of the filter radius. Lastly, when resampling an<br />
image or volume on a new lattice that is par<strong>al</strong>lel to the old<br />
lattice, separable filters (see Section 4.1) <strong>al</strong>low linear time<br />
complexity with respect to filter radius, using a multi-pass<br />
<strong>al</strong>gorithm that filters once <strong>al</strong>ong each axis direction.<br />
4 Filters to be An<strong>al</strong>yzed<br />
The filters we wish to an<strong>al</strong>yze f<strong>al</strong>l into two categories,<br />
separable and spheric<strong>al</strong>ly symmetric. However, a subclass<br />
of separable filters, the pass-band optim<strong>al</strong> filters, is defined<br />
in a different way from <strong>al</strong>l other filters, and is discussed separately<br />
below.<br />
In the defining equations that follow, we use the notation<br />
�P� to be one if P is true and 0 otherwise. All but the first<br />
two of the filters below need to be norm<strong>al</strong>ized by a constant<br />
so that their integr<strong>al</strong> over R 3 is equ<strong>al</strong> to one.<br />
4.1 Separable filters<br />
Separable filters can be written<br />
Included in this category are:<br />
h�x�y�z� � hs�x� hs�y� hs�z��<br />
� The trilinear filter. Trilinear interpolationis equiv<strong>al</strong>ent to<br />
convolution by a separable filter:<br />
hs�x� � �jxj � 1� �1 � jxj�<br />
� A two-parameter family of cubic filters, with parameters<br />
B and C, studied in two dimensions in [15]:<br />
1<br />
6<br />
8<br />
������<br />
hs�B�C��x� �<br />
������<br />
�12 � 9B � 6C�jxj 3 �<br />
��18 � 12B � 6C�jxj2 � �6 � 2B�<br />
if jxj �1,<br />
��B � 6C�jxj3 � �6B � 30C�jxj2 �<br />
��12B � 48C�jxj � �8B � 24C�<br />
if 1 �jxj �2,<br />
0 otherwise.<br />
This family includes the well-known B-spline (B � 1,<br />
C � 0) and Catmull-Rom spline (B � 0, C � 0�5). We<br />
confine our attention to filters in the range �B�C� � �0�0�<br />
to �1�1�.<br />
� The (truncated) Gaussian filter, which is often used in<br />
splatting <strong>al</strong>gorithms for volume rendering:<br />
hs�xm�σ��x� � �jxj � xm�e �x2 �2σ 2<br />
� The cosine bell filter, which has been widely used as a<br />
window (see below) in one-dimension<strong>al</strong> sign<strong>al</strong> processing<br />
[1], but can <strong>al</strong>so be used as a reconstruction filter in<br />
its own right:<br />
hs�xm��x� � �jxj � xm� �1 � cos�πx�xm��<br />
� Windowed sinc filters. These filters approximate the<br />
ide<strong>al</strong> sinc filter by a filter with finite support. Simply<br />
truncating the sinc at some distance leads to problems<br />
with ringing and post<strong>al</strong>iasing. Instead, the sinc is multiplied<br />
by a window function that drops smoothly to zero.<br />
This family approximates a sinc filter arbitrarily closely<br />
as the radius of the window is increased. We consider<br />
only one window, namely a cosine bell that reaches zero<br />
after two cycles of the sinc function. The defining equation<br />
of the windowed sinc is:<br />
hs�xm��x� � �jxj � xm��1 � cos�πx�xm�� sinc�4x�xm�<br />
4.2 Spheric<strong>al</strong>ly symmetric filters<br />
The v<strong>al</strong>ue of a spheric<strong>al</strong>ly symmetric filter depends<br />
only on the distance from the origin. Such filters can be<br />
written<br />
p<br />
h�x�y�z� � hr� x2 � y2 � z2�� The two such filters we investigate are:<br />
� a rotated version of the cosine bell. This is simply a filter<br />
whose hr is the same as the separable version’shs above.<br />
� a spheric<strong>al</strong>ly symmetric equiv<strong>al</strong>ent of the separable windowed<br />
sinc, which we c<strong>al</strong>l a windowed3-sinc. The 3-sinc<br />
(which is not the same as the separable sinc defined earlier)<br />
is the inverse Fourier transform of a function that is<br />
one inside a unit sphere and zero outside. For this filter,<br />
hr�rm��r� � �α � 1��1 � cos�πα���sinα � αcosα��α 3<br />
where α � r�rm.<br />
4.3 Pass-band optim<strong>al</strong> discrete filters<br />
These filters, described by Hsu and Marzetta [8] and<br />
recommended for use in volume rendering by Carlbom [3],<br />
are separable. Hence, the following discussion relates to<br />
one-dimension<strong>al</strong> interpolation;the three-dimension<strong>al</strong>filters<br />
are the products of three one-dimension<strong>al</strong> filters.<br />
All previous filters are defined by continuous functions;<br />
for any given interpolation position, a filter is centered<br />
on the point of interest, and its v<strong>al</strong>ues at sample points
provide the weights to apply to the data points. That set<br />
of weights can be regarded as a discrete filter that resamples<br />
the input data at new sample points displaced by some<br />
fixed offset from the origin<strong>al</strong> sampling points. Carlbom defines<br />
an optim<strong>al</strong> interpolation filter as a set of such discrete<br />
filters, each individu<strong>al</strong>ly optimized to minimize smoothing.<br />
For each interpolation offset, a weighted Chebyshev<br />
minimization program [9] is used to obtain a discrete filter<br />
whose Fourier transform has (approximately) a minimum<br />
weighted departure from ide<strong>al</strong> up to some frequency<br />
fm � fN.<br />
By computing a sequence of these fixed-length optim<strong>al</strong><br />
discrete filters for offsets in the range 0 - 1, and interpolating<br />
between adjacent members, we can construct an underlying<br />
continuous filter. Figure 4 shows two such underlying<br />
filters. 4 The design method handles only odd-length discrete<br />
filters, and thus the underlying filters are asymmetric,<br />
unlike <strong>al</strong>l other filters we study.<br />
A problem with this approach to filter design is that<br />
post<strong>al</strong>iasing is ignored, giving filters that are (in a sense)<br />
optim<strong>al</strong> in the pass band at the expense of relatively poor<br />
performance in the stop band.<br />
5-point<br />
filter<br />
1<br />
-3 2<br />
9-point<br />
filter<br />
1<br />
-5 -3 2 4<br />
Figure 4: Two pass-band-optim<strong>al</strong> filters<br />
5 Metrics for filter qu<strong>al</strong>ity<br />
5.1 Definitions<br />
One of our go<strong>al</strong>s in this research was to obtain some<br />
quantitativemeasures of filter qu<strong>al</strong>ity. As <strong>al</strong>ready indicated,<br />
choosing a filter requires trading off benefits and defects according<br />
to the the nature of the sign<strong>al</strong>, how it was sampled,<br />
how much noise is present, how costly a filter we can tolerate,<br />
and what rendering <strong>al</strong>gorithm is being used. For this<br />
reason, a single number describing the qu<strong>al</strong>ity of a filter—<br />
for example, the L 2 norm of the difference between a particular<br />
filter and the ide<strong>al</strong> filter—is not an appropriate go<strong>al</strong>.<br />
Accordingly, we define separate metrics for the most important<br />
filter qu<strong>al</strong>ities: smoothing, post<strong>al</strong>iasing, and overshoot<br />
(ringing).<br />
Form<strong>al</strong>ly, we define our smoothing metric, S, of a filter<br />
h, to be<br />
S�h� � 1 � 1<br />
Z<br />
jˆhj<br />
jRNj RN 2 dV�<br />
where RN is the Nyquist region, jRNj is the frequency-space<br />
volume of RN, and dV is an infinitesim<strong>al</strong> volume element in<br />
4 The discrete filters were computed using the program [9], modified as<br />
described in [8] and [3], and with fm v<strong>al</strong>ues of 0.3 and 0.4 for the 5-point<br />
and 9-point filters respectively, as in [3].<br />
RN. We define our post<strong>al</strong>iasing metric, P, to be<br />
P �h� � 1<br />
Z<br />
jˆhj<br />
jRNj<br />
2 dV�<br />
where RN is the complement of RN.<br />
The smoothing and post<strong>al</strong>iasing metrics measure the<br />
difference between a particular filter and our ide<strong>al</strong> filter inside<br />
and outside the Nyquist region respectively; the difference<br />
is measured in terms of energy. (The filter energy in<br />
a region is the integr<strong>al</strong> of the square of the filter over that<br />
region.)<br />
Our overshoot metric, O�h�, measures how much overshoot<br />
occurs if a filter h is used to band-limit the unit step<br />
function, ρs. More form<strong>al</strong>ly, O�h� � max�ρs �h��1, where<br />
ρs is 1 if x � 0 and 0 otherwise.<br />
5.2 Computation<br />
The smoothing and post<strong>al</strong>iasing metrics are based on<br />
the three-dimension<strong>al</strong> Fourier transforms of the filters. All<br />
except the pass-band optim<strong>al</strong> filters are even functions, for<br />
which the transform simplifies to the cosine transform [14]:<br />
ˆh�ωx�ωy�ωz� �<br />
Z<br />
R 3 h�x�y�z�cos�ωxx�cos�ωyy�cos�ωzz� dxdydz�<br />
For the separable filters, the transform further simplifies to<br />
the product of three one-dimension<strong>al</strong> transforms.<br />
For spheric<strong>al</strong>ly symmetric filters, the three-<br />
dimension<strong>al</strong> integr<strong>al</strong> can be simplified [2] to<br />
ˆhr�ωr� � 4π<br />
ωr<br />
Z ∞<br />
0<br />
R N<br />
rhr�r�sin�ωrr� dr�<br />
The smoothing metric is obtained directly from its definition<br />
by numeric<strong>al</strong> integration. The post<strong>al</strong>iasing metric is<br />
computed from the smoothing metric and the tot<strong>al</strong> filter energy.<br />
We can compute the tot<strong>al</strong> energy in the space domain,<br />
where the filter has finite support, since Parsev<strong>al</strong>’s theorem<br />
[14] shows that the result is the same in both space and frequency<br />
domains.<br />
Metrics for the pass-band optim<strong>al</strong> filters were computed<br />
from the underlying continuous filters illustrated in<br />
Figure 4.<br />
6 Filter Testing<br />
6.1 The test volume<br />
Although numerous datasets are publicly available, we<br />
are unaware of any that are correctly sampled from some<br />
exactly known sign<strong>al</strong>. This makes it difficult to ev<strong>al</strong>uate reconstruction<br />
techniques, since the ultimate measure of the<br />
qu<strong>al</strong>ity of a reconstruction is how closely it approximates<br />
the origin<strong>al</strong> sign<strong>al</strong>. Accordingly, we use a test sign<strong>al</strong><br />
where<br />
ρ�x�y�z� �<br />
�1 � sin�πz�2� � α�1 � ρr�<br />
2�1 � α�<br />
ρr�r� � cos�2π fM cos� πr<br />
2 ���<br />
p<br />
x2 � y2�� �
We sampled this sign<strong>al</strong> on a 40 by 40 by 40 lattice in<br />
the range �1 � x�y�z � 1, with fM � 6 and α � 0�25. The<br />
function has a slow sinusoid<strong>al</strong> variation in the z direction<br />
and a perpendicular frequency-modulated radi<strong>al</strong> variation.<br />
With the given parameters, it can be shown that the onedimension<strong>al</strong><br />
radi<strong>al</strong> sign<strong>al</strong> has 99.8% of its energy below a<br />
frequency of 10, and our an<strong>al</strong>ysis suggests that the spectrum<br />
of the volume as a whole is similarly band-limited. This<br />
makes it acceptable to point sample the function over the<br />
range �1 � x�y�z � 1 at 20 samples per unit distance. Note,<br />
however, that a significant amount of the function’s energy<br />
lies near the Nyquist frequency, making this sign<strong>al</strong> a very<br />
demanding filter test—<strong>al</strong>l our filters show some perceptible<br />
post<strong>al</strong>iasing and smoothing.<br />
Figure 5 shows a ray-traced image of the test volume’s<br />
isosurface ρ�x�y�z� � 0�5.<br />
Figure 5: The unsampled test sign<strong>al</strong>.<br />
6.2 Test image rendering<br />
To demonstrate the behaviour of the various filters, we<br />
display isosurfaces of reconstructed test volumes. It is important<br />
that we show the exact shape of the isosurface, including<br />
sm<strong>al</strong>l irregularities that can be seen only with detailed<br />
shading. This means we need a gradient that corresponds<br />
exactly to the reconstructed density function. The<br />
usu<strong>al</strong> schemes for rendering isosurfaces (e. g., Lorensen and<br />
Cline [13]) approximate the gradients using centr<strong>al</strong> differences<br />
at sample points and then interpolate those gradients;<br />
the resulting estimate does not track sm<strong>al</strong>l-sc<strong>al</strong>e changes in<br />
the isosurface orientation.<br />
Since our reconstructed density function is the convolution<br />
of the samples with the reconstruction filter, the density<br />
gradient is the convolution of the samples with the gradient<br />
of the filter. For any differentiable filter h, we can thus<br />
obtain an exact formula for the gradient of the reconstructed<br />
function, which can be ev<strong>al</strong>uated at any point in the volume.<br />
For rendering, we use a ray tracer that displays isosurfaces<br />
of arbitrary functions by using a root-finding <strong>al</strong>gorithm<br />
to locate the first crossing of the isosurface level <strong>al</strong>ong<br />
each ray.<br />
Post<strong>al</strong>iasing<br />
0.1<br />
0.08<br />
0.06<br />
0.04<br />
0.02<br />
0<br />
pass-band<br />
optim<strong>al</strong><br />
filters<br />
9-pt<br />
windowed sincs<br />
r=3.79<br />
(0,0.5)<br />
= Catmull-Rom<br />
7-pt<br />
(0,1)<br />
��� ��� ��<br />
5-pt<br />
r=4.28<br />
r=4.78<br />
(0,0)<br />
Trilinear<br />
(1,0)<br />
= B-Spline<br />
0.2 0.4 0.6 0.8 1<br />
Smoothing<br />
Figure 6: Smoothing and post<strong>al</strong>iasing metrics.<br />
7 Results<br />
7.1 Smoothing and Post<strong>al</strong>iasing<br />
Figure 6 shows the smoothing and post<strong>al</strong>iasing metrics<br />
for the trilinear filter, the family of cubic filters, a range of<br />
windowed sincs, and three pass-band optim<strong>al</strong> filters. The<br />
metrics for our ide<strong>al</strong> filter would be (0,0), <strong>al</strong>though, as discussed<br />
in Section 3.3, some smoothing is usu<strong>al</strong>ly required,<br />
if only to combat overshoot.<br />
Cubic Filters. This family is shown in the figure as a<br />
10 by 10 mesh. The mapping from B-C space to smoothingpost<strong>al</strong>iasing<br />
space is not one-to-one: the �1�1� corner of<br />
the mesh is “folded” over. The B-spline smoothes the most<br />
heavily, but has low post<strong>al</strong>iasing, while the Catmull-Rom<br />
spline produces much less smoothing but has poor post<strong>al</strong>iasing<br />
properties. The images in Figures 9(a) and 9(b) support<br />
these measurements: the B-spline smoothes out the<br />
large variations in the sign<strong>al</strong>—the waves get sh<strong>al</strong>lower with<br />
increasing frequency—and the Catmull-Rom preserves the<br />
depth of the waves at the cost of <strong>al</strong>iasing, which shows up<br />
as sc<strong>al</strong>loped crests.<br />
According to our metrics, the filters <strong>al</strong>ong the fold<br />
should be best. However, Figure 9(c) shows the test volume<br />
reconstructed using one such filter (B � 0�5, C � 0�85). We<br />
can see that, while the over<strong>al</strong>l geometry is reproduced quite<br />
faithfully, the surface has a dimpled texture, due to nearsample-frequency<br />
ripple. The ripples, <strong>al</strong>though of low amplitude,<br />
are of high frequency, and so produce large loc<strong>al</strong><br />
variations in gradient, and therefore in shading. It is perhaps<br />
a limitation of our post<strong>al</strong>iasing metric that it weights<br />
leakage at <strong>al</strong>l frequencies equ<strong>al</strong>ly.<br />
Our experience corroborates the space-domain convergence<br />
an<strong>al</strong>ysis of Mitchell and Netrav<strong>al</strong>i [15], which suggests<br />
that filters <strong>al</strong>ong the line 2C � B � 1 (which includes<br />
Catmull-Rom and B-splines as extreme cases) are among<br />
the best: we find that these filters have negligible nearsample-frequency<br />
ripple. But we see no reason in gener<strong>al</strong><br />
to prefer any particular filter <strong>al</strong>ong that line a priori, since<br />
we must <strong>al</strong>ways settle for a tradeoff between smoothing and<br />
post<strong>al</strong>iasing.
Trilinear filter. The trilinear filter is plotted in Figure<br />
6. It can be seen that its metrics are the same as for<br />
a cubic of approximately B � 0�26, C � 0�1. Images for<br />
these two filters are shown in Figure 9(d) and 9(e). They<br />
look similar, except that the trilinear filter introduces gradient<br />
discontinuities, which our metrics do not measure.<br />
Windowed sinc filter. The metrics for our particular<br />
cosine-windowed sinc are shown in Figure 6 for a range of<br />
radii. It can be seen from the figure that these filters are<br />
in a sense superior to the entire family of cubics, since for<br />
any cubic filter there are windowed sincs with both better<br />
post<strong>al</strong>iasing and better smoothing. However, because of<br />
their size, they are much more expensive to use than the cubics.<br />
Also, because sample-frequency ripple is so offensive,<br />
only the labelled points are of interest, since they are the<br />
only ones for which the filter’s spectrum has zeroes at the<br />
nearest lattice points (see Section 3.1).<br />
The results for a radius of 4.78 are shown in Figure 9(f).<br />
The wave structure is free of both sc<strong>al</strong>loping and excessive<br />
smoothing. (As in <strong>al</strong>l the images, we must ignore the pronounced<br />
effects of filtering the discontinuous outer edge of<br />
the volume.) However, the filter’s anisotropy causes significant<br />
variations in the heights of the circular crests: the filter<br />
smoothes more in directions near the coordinate axes than<br />
<strong>al</strong>ong diagon<strong>al</strong>s.<br />
The results for a radius of 4.28 are similar, but with<br />
slightly more post<strong>al</strong>iasing. Both these filters are roughly<br />
two orders of magnitude more expensive (in an O�r 3 � <strong>al</strong>gorithm)<br />
than trilinear interpolation.<br />
Pass-band optim<strong>al</strong> filters The metrics for three different<br />
pass-band optim<strong>al</strong> filters are shown in Figure 6. As expected,<br />
their excellent pass band performance (low smoothing)<br />
is achieved at the expense of relatively poor post<strong>al</strong>iasing.<br />
The 5-point optim<strong>al</strong> filter is wider than the cubic filters<br />
(twice the cost, in an O�r 3 � <strong>al</strong>gorithm) and the 9-point filter<br />
is comparable in cost with the windowed sinc of radius<br />
4.78. Also, the pass-band optim<strong>al</strong> filters are more difficult<br />
to c<strong>al</strong>culate and manipulate gener<strong>al</strong>ly (e.g., to obtain gradients)<br />
than other filters, so we do not recommend them for<br />
gener<strong>al</strong>-purpose reconstruction. Their primary use is probably<br />
for image and volume resampling at a fixed offset when<br />
minim<strong>al</strong> smoothing is the go<strong>al</strong>.<br />
Other filters. Table 1 shows the smoothing and post<strong>al</strong>iasing<br />
metrics for some representative separable Gaussian<br />
and separable cosine bell filters. From the metrics, and from<br />
sever<strong>al</strong> test images, we conclude that the cubics gener<strong>al</strong>ly<br />
perform better for similar cost and are more flexible. One<br />
exception is the cosine bell of radius 1.5, which, as the metrics<br />
in Table 1 suggest, produces images similar to a Bspline,<br />
but at a lower cost. The filter does introduce slight<br />
loc<strong>al</strong> gradient variations, but in many rendering contexts<br />
these would not be apparent.<br />
We investigated a range of spheric<strong>al</strong>ly symmetric filters.<br />
However, since the zeroes of their spectra f<strong>al</strong>l on<br />
Filter Radius Smooth. Post<strong>al</strong>ias.<br />
Cosine bell 1.0 0.67 0.096<br />
Cosine bell 1.5 0.88 0.002<br />
Cosine bell 2.0 0.95 0.00008<br />
Gauss. σ � 0�50 2.5 0.81 0.014<br />
Gauss. σ � 0�60 2.0 0.90 0.002<br />
Gauss. σ � 0�75 2.5 0.95 0.0001<br />
Table 1: Miscellaneous separable filter metrics.<br />
spheric<strong>al</strong> surfaces, rather than axis-<strong>al</strong>igned planes, it proved<br />
impossible to adequately reject sample-frequency ripple<br />
with filters of any reasonable cost. For very high-qu<strong>al</strong>ity<br />
reconstruction, the isotropy of spheric<strong>al</strong>ly symmetric windowed<br />
sinc filters could be a significant advantage.<br />
overshoot %<br />
8<br />
0<br />
1<br />
B<br />
Figure 7: Overshoot metrics for cubic filters.<br />
7.2 Overshoot<br />
Our overshoot metrics for the cubic filters are graphed<br />
in Figure 7. As discussed in Section 3.3, overshoot is primarily<br />
of concern with volumes containing inadequately<br />
smoothed discontinuities;filters with high overshootshould<br />
be avoided in such cases. Figure 8 illustrates the effects of<br />
reconstructing a point-sampled cube with a B-spline, which<br />
has no overshoot, and with the cubic filter most prone to<br />
overshoot, B � 0, C � 1.<br />
8 Conclusions<br />
Interpolation underpins <strong>al</strong>l volume rendering <strong>al</strong>gorithms<br />
working from sampled sign<strong>al</strong>s. We have considered<br />
the family of interpolationschemes that can be expressed as<br />
convolution of a sample lattice with a filter.<br />
The artifacts resulting from imperfect reconstruction<br />
f<strong>al</strong>l into three main categories: smoothing, post<strong>al</strong>iasing,<br />
Figure 8: A point-sampled cube reconstructed with a<br />
B-spline (left) and with the cubic (0,1).<br />
0<br />
0<br />
C<br />
1
and overshoot. Since reconstruction is necessarily imperfect,<br />
choosing a filter must involve tradeoffs between these<br />
three artifacts.<br />
We have defined metrics to quantify the characteristics<br />
of a filter in terms of these artifacts. In gener<strong>al</strong>, the metrics<br />
correlate well with the observed behavior of the filters, <strong>al</strong>though<br />
the post<strong>al</strong>iasing metric does not adequately address<br />
the troublesome problem of ripple in the reconstructed sign<strong>al</strong><br />
at or near the sample frequency.<br />
Trilinear interpolation is certainly the cheapest option,<br />
and will likely remain the method of choice for time-critic<strong>al</strong><br />
applications. Where higher qu<strong>al</strong>ity reconstruction is required,<br />
especi<strong>al</strong>ly in the presence of rapidly varying sign<strong>al</strong>s,<br />
the family of cubics is recommended. Cubics offer<br />
considerable flexibility in the tradeoff between smoothing<br />
and post<strong>al</strong>iasing. For applications in which near-samplefrequency<br />
ripple could be a problem, we recommend cubics<br />
for which B � 1�2C; otherwise, filters <strong>al</strong>ong the “fold” line<br />
in Figure 6 are preferred.<br />
For the most demanding reconstruction problems, windowed<br />
sincs can provide arbitrarily good reconstruction.<br />
Their large radii make them extremely expensive in O�r 3 �<br />
<strong>al</strong>gorithms, such as ray-tracing, but they could certainly be<br />
used in an O�r� resampling <strong>al</strong>gorithm. The radius should be<br />
chosen so that the Fourier transform is zero at the sampling<br />
frequency, in order to eliminate sample-frequency ripple.<br />
Spheric<strong>al</strong>ly symmetric filters tend to produce samplefrequency<br />
ripple, and do not seem to offer any significant<br />
advantages over separable filters for most applications.<br />
8.1 Future work<br />
Although the metrics presented in this paper provide a<br />
useful guideline, we believe they can be improved. In particular,<br />
the post<strong>al</strong>iasing metric could be made more sensitive<br />
to the frequencies that produce the most objectionable<br />
artifacts.<br />
Given the better reconstruction techniques outlined in<br />
this paper, it should be possible to represent volume data<br />
with a sparser sampling lattice. Using a precise definition<br />
of the reconstructed sign<strong>al</strong> gives us a framework in which<br />
to ev<strong>al</strong>uate errors introduced by such subsampling or other<br />
forms of data compression.<br />
9 Acknowledgements<br />
This work was supported by the NSF/ARPA Science<br />
and Technology Center for Computer Graphics and Scientific<br />
Visu<strong>al</strong>ization(ASC-8920219). We gratefully acknowledge<br />
the generous equipment grants from Hewlett-Packard<br />
Corporation, on whose workstations the images in this paper<br />
were generated. We especi<strong>al</strong>ly wish to thank James<br />
Durkinfor providingsupport and motivationthroughoutthe<br />
research.<br />
References<br />
[1] K. G. Beauchamp. Sign<strong>al</strong> Processing. George & Allen Unwin<br />
Ltd., 1973.<br />
[2] S. Bochner and K. Chandrasekharan. Fourier Transforms.<br />
Princeton University Press, 1949.<br />
[3] Ingrid Carlbom. Optim<strong>al</strong> filter design for volume reconstruction<br />
and visu<strong>al</strong>ization. In Visu<strong>al</strong>ization ’93, pages 54–61,<br />
October 1993.<br />
[4] H. E. Cline, W. E. Lorensen, S. Ludke, C. R. Crawford, and<br />
B. C. Teeter. Two <strong>al</strong>gorithms for the three-dimension<strong>al</strong> reconstruction<br />
of tomograms. Medic<strong>al</strong> Physics, 15(3):320–<br />
327, May/June 1988.<br />
[5] Dan E. Dudgeon and Russel M. Mersereau. Multidimension<strong>al</strong><br />
Sign<strong>al</strong> Processing. Prentice-H<strong>al</strong>l, 1984.<br />
[6] J. D. Foley, A. van Dam, S. K. Feiner, and J. F. Hughes. Computer<br />
Graphics: Principles and Practices (2nd Edition). Addison<br />
Wesley, 1990.<br />
[7] Rafael C. Gonz<strong>al</strong>ez and Paul Wintz. Digit<strong>al</strong> Image Processing<br />
(2nd Ed.). Addison-Wesley, Reading, MA, 1987.<br />
[8] Kai Hsu and ThomasL. Marzetta. Velocity filtering of acoustic<br />
well logging waveforms. IEEE Transactions on Acoustics,<br />
Speech and Sign<strong>al</strong> Processing, 37(2):265–274, February<br />
1989.<br />
[9] J.H.McClellan, T.W.Parks, and L.R.Rabiner. FIR linear<br />
phase filter design program. In IEEE ASSP Society Digit<strong>al</strong><br />
Sign<strong>al</strong> Processing Committee, editor, Programs for Digit<strong>al</strong><br />
Sign<strong>al</strong> Processing, pages 5.1-1–5.1-13. IEEE Press, 1979.<br />
[10] Robert G. Keys. Cubic convolution interpolation for digit<strong>al</strong><br />
image processing. IEEE Trans. Acoustics, Speech, and Sign<strong>al</strong><br />
Processing, ASSP-29(6):1153–1160, December 1981.<br />
[11] David Laur and Pat Hanrahan. Hierarchic<strong>al</strong> splatting: A<br />
progressive refinement <strong>al</strong>gorithm for volume rendering. In<br />
Thomas W. Sederberg, editor, Computer Graphics (SIG-<br />
GRAPH ’91 Proceedings), volume 25, pages 285–288, July<br />
1991.<br />
[12] Marc Levoy. Display of surfaces from volume data. IEEE<br />
Computer Graphics and Applications, 8(3):29–37, May<br />
1988.<br />
[13] William E. Lorensen and Harvey E. Cline. Marching cubes:<br />
A high resolution 3D surface construction <strong>al</strong>gorithm. In<br />
Maureen C. Stone, editor, Computer Graphics (SIGGRAPH<br />
’87 Proceedings), volume 21, pages 163–169, July 1987.<br />
[14] Clare McGillem and George Cooper. Continuous and Discrete<br />
Sign<strong>al</strong> and System An<strong>al</strong>ysis. Holt, Rinehart and Winston,<br />
1984.<br />
[15] Don P. Mitchell and Arun N. Netrav<strong>al</strong>i. Reconstruction filters<br />
in computer graphics. In John Dill, editor, Computer<br />
Graphics (SIGGRAPH ’88 Proceedings), volume 22, pages<br />
221–228, August 1988.<br />
[16] Stephen K. Park and Robert A. Schowengerdt. Image reconstruction<br />
by parametric cubic convolution. Computer Vision,<br />
Graphics, and Image Processing, 23(3):258–272, September<br />
1983.<br />
[17] Lee Westover. Footprint ev<strong>al</strong>uation for volume rendering. In<br />
Forest Baskett, editor, Computer Graphics (SIGGRAPH ’90<br />
Proceedings), volume 24, pages 367–376, August 1990.<br />
[18] Jane Wilhelms and Allen Van Gelder. Topologic<strong>al</strong> consideration<br />
in isosurface generation. Technic<strong>al</strong> report, University<br />
of C<strong>al</strong>ifornia, Santa Cruz, April 1990.<br />
[19] Brian Wyvill, Craig McPheeters, and Geoff Wyvill. Data<br />
structure for soft objects. The Visu<strong>al</strong> Computer, 2(4):227–<br />
234, 1986.
(a) B-spline (b) Catmull-Rom<br />
(c) Cubic (B � 0�5, C � 0�85) (d) Trilinear<br />
(e) Cubic (B � 0�26, C � 0�1) (f) Windowed sinc (r � 4�8)<br />
Figure 9: Isosurface images of the test sign<strong>al</strong> reconstructed using various filters.
Please reference the following QuickTime movies located in the MOV<br />
directory:<br />
CIRCLE.MOV..(Macintosh only)<br />
LINE.MOV (Macintosh only)<br />
Copyright © 1994 Cornell University Program of Computer Graphics<br />
These two animations illustrate the effects of using a range of cubic filters to<br />
reconstruct the sampled test sign<strong>al</strong> described in the paper. They show images<br />
generated using filters <strong>al</strong>ong two paths through the (B, C) parameter space of<br />
the cubics. The “line” movie is a sequence of reconstructions using filters<br />
<strong>al</strong>ong the line segment joining (B, C) = (1, 0), the B-spline filter, with (B, C)<br />
= (0, 0.5), the Catmull-Rom filter. This movie makes the most sense played<br />
in a “loop back and forth” mode. The second movie, the “circle” movie, is a<br />
sequence moving around a circle inscribed in the square with corners at (0,<br />
0), (1, 0), (1, 1), and (0, 1). This one makes more sense played in a “loop<br />
from beginning to end” mode. The movies show that there is a continuous<br />
range of cubic filters, with varying properties, to choose from.<br />
QuickTime is a trademark of Apple Computer, Inc.
Visu<strong>al</strong>izing Flow with Quaternion Frames<br />
Abstract<br />
Flow �elds� geodesics� and deformed volumes are<br />
natur<strong>al</strong> sources of families of space curves that can<br />
be characterized by intrinsic geometric properties such<br />
as curvature� torsion� and Frenet frames. By express�<br />
ing a curve�s moving Frenet coordinate frame as an<br />
equiv<strong>al</strong>ent unit quaternion� we reduce the number of<br />
components that must be displayed from nine with six<br />
constraints to four with one constraint. We can then<br />
assign a color to each curve point by dotting its quater�<br />
nion frame with a 4D light vector� or we can plot<br />
the frame v<strong>al</strong>ues separately as a curve in the three�<br />
sphere. As examples� we examine twisted volumes used<br />
in topology to construct knots and tangles� a spheric<strong>al</strong><br />
volume deformation known as the Dirac string trick�<br />
and streamlines of 3D vector �ow �elds.<br />
1 Introduction<br />
We propose new tools for the visu<strong>al</strong>ization of a class<br />
of volume data that includes streamlines derived from<br />
3D vector �eld data as well as deformed volumes. The<br />
common feature of such data that we exploit is the<br />
existence of a family of static or time�varying space<br />
curves that do not intersect� but which may exhibit<br />
extremely complex geometry� typic<strong>al</strong>ly� portions of<br />
neighboring curves are similar in some regions of the<br />
volume� but become inhomogeneous when interesting<br />
phenomena are taking place. Our approach is based<br />
on the observation that families of curves in three�<br />
space possess sever<strong>al</strong> intrinsic but loc<strong>al</strong>ly computable<br />
geometric properties� these include the curvature� the<br />
torsion� and a loc<strong>al</strong> coordinate frame� the Frenet frame<br />
�<strong>al</strong>so c<strong>al</strong>led the Frenet�Serret frame�� de�ned by the<br />
tangent� norm<strong>al</strong> and binorm<strong>al</strong> at each point of each<br />
curve.<br />
While it is awkward to represent the Frenet frame<br />
itself visu<strong>al</strong>ly in high�density data because it consists<br />
of three 3D vectors� or nine components� it has only<br />
three independent degrees of freedom� it is well known<br />
that these three degrees of freedom can conveniently<br />
be represented by an equiv<strong>al</strong>ent unit quaternion that<br />
Andrew J. Hanson and Hui Ma<br />
Department of Computer Science<br />
Indiana University<br />
Bloomington� IN 47405<br />
corresponds� in turn� to a point in the three�sphere<br />
�see� e.g.� �15��. We exploit the quaternion representa�<br />
tion of rotations to reexpress the Frenet frame of a 3D<br />
space curve as an elegant unit four�vector �eld over<br />
the curve� the resulting quaternion Frenet frame can<br />
be represented as a curve by itself� or can be used to<br />
assign a color to each curve point using an interactive<br />
4D lighting model.<br />
2 Frenet Frames<br />
The Frenet frame is uniquely de�ned for �<strong>al</strong>most�<br />
every point on a 3D space curve �see� e.g.� �5� 6�� and<br />
<strong>al</strong>so �1� 8��. If �x�s� is any smooth space curve� its<br />
tangent� binorm<strong>al</strong>� and norm<strong>al</strong> vectors at a point on<br />
the curve are given by<br />
�T�s� �<br />
�B�s� �<br />
�x 0 �s�<br />
k�x 0�s�k �x 0�s� � �x 00�s� k�x 0�s� � �x 00�s�k �N�s� � �B�s� � �T�s� �<br />
�1�<br />
The Frenet frame obeys the following di�erenti<strong>al</strong> equa�<br />
tion in the parameter s�<br />
2<br />
4<br />
3<br />
�T 0�s� �N 0�s� �B 0 5 � v�s�<br />
�s�<br />
2<br />
4<br />
0 ��s� 0<br />
���s� 0 ��s�<br />
0 ���s� 0<br />
3 2<br />
5 4<br />
�T�s�<br />
�N�s�<br />
�B�s�<br />
�2�<br />
where v�s� � k�x 0 �s�k is the sc<strong>al</strong>ar magnitude of the<br />
curve derivative� ��s� is the curvature� and ��s� is the<br />
torsion. All these quantities can in principle be c<strong>al</strong>cu�<br />
lated in terms of the parameterized or numeric<strong>al</strong> loc<strong>al</strong><br />
v<strong>al</strong>ues of �x�s� and its �rst three derivatives as follows�<br />
��s� � k�x0 �s� � �x 00 �s�k<br />
k�x 0 �s��k 3<br />
��s� � ��x0 �s� � �x 00 �s�� � �x 000 �s�<br />
k�x 0 �s� � �x 00 �s�k 2<br />
�<br />
3<br />
5<br />
�3�<br />
If we are given a non�vanishing curvature and a torsion<br />
as smooth functions of s� we can theoretic<strong>al</strong>ly integrate
the system of equations to �nd the unique numeric<strong>al</strong><br />
v<strong>al</strong>ues of the corresponding space curve �up to a rigid<br />
motion�.<br />
3 Theory of Quaternion Frames<br />
A quaternion frame is a unit�length four�vector<br />
q � �q0� q1� q2� q3� � �q0� �q� that corresponds to ex�<br />
actly one 3D coordinate frame and is characterized by<br />
the following properties�<br />
� Unit Norm. The components of a unit quater�<br />
nion obey the constraint�<br />
�q0� 2 � �q1� 2 � �q2� 2 � �q3� 2 � 1 �4�<br />
and therefore lie on S 3 � the three�sphere.<br />
� Multiplication rule. The quaternion product<br />
of two quaternions q and p� which we write as<br />
q � p� takes the form<br />
2 3<br />
�q � p�0 6<br />
6<br />
�q � p� 7<br />
1 7<br />
4 �q � p� 5<br />
2<br />
�q � p�3 �<br />
2<br />
6<br />
6<br />
4<br />
q0p0 � q1p1 � q2p2 � q3p3<br />
q0p1 � p0q1 � q2p3 � q3p2<br />
q0p2 � p0q2 � q3p1 � q1p3<br />
q0p3 � p0q3 � q1p2 � q2p1<br />
3<br />
7<br />
7<br />
5 �<br />
This rule is isomorphic to multiplication in the<br />
group SU�2�� the double covering of the ordinary<br />
3D rotation group SO�3�.<br />
� Mapping to 3D rotations. Every possible 3D<br />
rotation R �a 3�3 orthogon<strong>al</strong> matrix� can be con�<br />
structed from either of two related quaternions�<br />
q � �q0� q1� q2� q3� or �q � ��q0� �q1� �q2� �q3��<br />
using the quadratic relationship�<br />
R �<br />
2<br />
4<br />
Q�� � �� D � �123� D � �312�<br />
D � �123� Q�� � �� D � �231�<br />
D � �312� D � �231� Q�� � ��<br />
3<br />
5 �<br />
�5�<br />
where Q����� � q 2 0 �q2 1 �q2 2 �q2 3 and D � �ijk� �<br />
2q iq j � 2q0q k.<br />
� Quaternion Frenet Frame. All 3D coordinate<br />
frames can be expressed in the form of quater�<br />
nions using Eq. �5�� if we assume the columns<br />
of Eq. �5� are the vectors � �T� �N� �B�� respectively�<br />
one can show �see �8�� that jq 0 �s�j takes the form<br />
2<br />
6<br />
6<br />
4<br />
q 0<br />
0<br />
q 0 1<br />
q 0 2<br />
q 0 3<br />
3<br />
7 v<br />
7 � 5 2<br />
2<br />
6<br />
6<br />
4<br />
0 �� 0 ��<br />
� 0 � 0<br />
0 �� 0 �<br />
� 0 �� 0<br />
3<br />
7<br />
7<br />
5 �<br />
2<br />
q0<br />
3<br />
6<br />
6<br />
4<br />
q1<br />
q2<br />
7<br />
7<br />
5 �<br />
q3<br />
�6�<br />
As a check� we verify that the matrices<br />
A �<br />
B �<br />
C �<br />
2<br />
4<br />
2<br />
4<br />
2<br />
4<br />
q0 q1 �q2 �q3<br />
q3 q2 q1 q0<br />
�q2 q3 �q0 q1<br />
�q3 q2 q1 �q0<br />
q0 �q1 q2 �q3<br />
q1 q0 q3 q2<br />
q2 q3 q0 q1<br />
�q1 �q0 q3 q2<br />
q0 �q1 �q2 q3<br />
give rise directly to the usu<strong>al</strong> quantities� jAj�jq 0 j �<br />
�T 0 � v� �N� jBj � jqj � �N 0 � �v� �T � v� �B� jCj �<br />
jdqj � �B 0 � �v� �N� where we have applied Eq. �6�<br />
to get the �n<strong>al</strong> terms.<br />
Just as the Frenet equations may be integrated ex�<br />
plicitly to generate a unique moving frame with its<br />
space curve for non�vanishing ��s� �6�� we could in<br />
principle integrate the quaternion equations� Eq. �6��<br />
to get the needed information� Equation �6�� having<br />
only four components and automatic<strong>al</strong>ly enforcing the<br />
constraint Eq. �4�� is much simpler for numeric<strong>al</strong> an<strong>al</strong>�<br />
ysis than Eq. �2�.<br />
4 Assigning Smooth Quaternion<br />
Frames<br />
The Frenet frame equations are pathologic<strong>al</strong>� for<br />
example� when the curve is perfectly straight for some<br />
distance or when the curvature vanishes momentarily.<br />
Thus� re<strong>al</strong> numeric<strong>al</strong> data for space curves will fre�<br />
quently exhibit behaviors that make the assignment<br />
of a smooth Frenet frame di�cult or impossible. In<br />
addition� since any given 3 � 3 orthogon<strong>al</strong> matrix cor�<br />
responds to two quaternions that di�er in sign� meth�<br />
ods of deriving a quaternion from a Frenet frame are<br />
intrinsic<strong>al</strong>ly ambiguous. Therefore� we prescribe the<br />
following procedure for assigning smooth quaternion<br />
Frenet frames to points on a space curve�<br />
� Assign an initi<strong>al</strong> orientation to the beginning of<br />
each curve. Appropriate choices may depend on<br />
context.<br />
� Given a sequence of points for a sampled space<br />
curve� compute the numeric<strong>al</strong> derivatives at a<br />
given point and use those to compute the Frenet<br />
frame according to Eq. �2�. If any critic<strong>al</strong> quanti�<br />
ties vanish� keep the frame of the previous point.<br />
� Check the dot product of the previous binorm<strong>al</strong><br />
�B�s� with the current v<strong>al</strong>ue� if it is much less than<br />
one� choose a correction procedure to handle this<br />
3<br />
5<br />
3<br />
5<br />
3<br />
5
singular point. Among the correction procedures<br />
we have considered are �1� simply jump discontin�<br />
uously to the next frame to indicate the presence<br />
of a point with very sm<strong>al</strong>l curvature� �2� create an<br />
interpolating set of points and perform a geodesic<br />
interpolation �15�� or �3� deform the curve slightly<br />
before and after the singular point to �ease in�<br />
with a gradu<strong>al</strong> rotation of the frame. Creating a<br />
jump in the frame assignment is the easiest� and<br />
is an intuitively reasonable choice� since the ge�<br />
ometry is changing dramatic<strong>al</strong>ly at such points.<br />
� Apply a suitable <strong>al</strong>gorithm such as that of Shoe�<br />
make �15� to compute a candidate for the quater�<br />
nion corresponding to the Frenet frame.<br />
� If the 3 � 3 Frenet frame is smoothly changing�<br />
make one last check on the 4D dot product of the<br />
quaternion frame with its own previous v<strong>al</strong>ue� if<br />
there is a sign change� choose the opposite sign to<br />
keep the quaternion smoothly changing �this will<br />
have no e�ect on the corresponding 3 � 3 Frenet<br />
frame�. If this dot product is near zero instead<br />
of �1� you have detected a radic<strong>al</strong> change in the<br />
Frenet frame which should have been noticed in<br />
the previous tests.<br />
� If the space curves of the data are too coarsely<br />
sampled to give the desired smoothness in the<br />
quaternion frames� but are still close enough<br />
to give consistent qu<strong>al</strong>itative behavior� one may<br />
choose to smooth out the intervening frames using<br />
the desired level of recursive slerping �15� to get<br />
smoothly splined intermediate quaternion frames.<br />
In Figure 1� we plot an example of a torus knot�<br />
a smooth space curve with everywhere nonzero cur�<br />
vature� together with its associated Frenet frames� its<br />
quaternion frame v<strong>al</strong>ues� and the path of its quater�<br />
nion frame �eld projected from four�space. Figure 2<br />
plots the same information� but this time for a curve<br />
with a discontinuous frame that �ips too quickly at a<br />
zero�curvature point. This space curve has two planar<br />
parts drawn as though on separate pages of a partly�<br />
open book and meeting smoothly on the �crack� be�<br />
tween pages. We see the obvious jump in the Frenet<br />
and quaternion frame graphs at the meeting point� if<br />
the two curves are joined by a long straight line� the<br />
Frenet frame is ambiguous and may option<strong>al</strong>ly be de�<br />
clared unde�ned in this segment.<br />
Alternative Frames. We have chosen to de<strong>al</strong> di�<br />
rectly with the more familiar properties and anoma�<br />
lies of the standard Frenet frame in the treatment pre�<br />
sented here� however� it is worth noting that <strong>al</strong>terna�<br />
tive methods such as the par<strong>al</strong>lel transport frame for�<br />
mulation proposed by Bishop �1� can be used to avoid<br />
frame discontinuities. The quaternion frame method<br />
extends <strong>al</strong>so to par<strong>al</strong>lel transport frames �8�.<br />
5 Visu<strong>al</strong>ization Methods<br />
Once we have c<strong>al</strong>culated the quaternion Frenet<br />
frame� the curvature� and the torsion for a point on the<br />
curve� we have a family of tensor and sc<strong>al</strong>ar quantities<br />
that we may exploit to expose the intrinsic proper�<br />
ties of a single curve. Furthermore� and probably of<br />
greater interest� we <strong>al</strong>so have the ability to make visu<strong>al</strong><br />
comparisons of the similarity and di�erences among<br />
families of neighboring space curves.<br />
The Frenet frame �eld of a set of streamlines is po�<br />
tenti<strong>al</strong>ly a rich source of detailed information about<br />
the data. However� the Frenet frame is unsuitable<br />
for direct superposition on dense data due to the<br />
high clutter resulting when its three orthogon<strong>al</strong> 3�<br />
vectors are displayed� direct use of the frame is only<br />
practic<strong>al</strong> at very sparse interv<strong>al</strong>s� which prevents the<br />
viewer from grasping important structur<strong>al</strong> details and<br />
changes at a glance. The 4�vector quaternion frame<br />
is potenti<strong>al</strong>ly a more straightforward and �exible ba�<br />
sis for frame visu<strong>al</strong>izations� below� we discuss sever<strong>al</strong><br />
<strong>al</strong>ternative approaches to the exploitation of quater�<br />
nion frames for data consisting of families of smooth<br />
curves.<br />
5.1 Direct Three�Sphere Plot of Quater�<br />
nion Frame Fields<br />
We now make a cruci<strong>al</strong> observation� For each 3D<br />
space curve� the quaternion frame de�nes a completely<br />
new 4D space curve lying on the unit three�sphere em�<br />
bedded in 4D Euclidean space.<br />
These curves can have entirely di�erent geometry<br />
from the origin<strong>al</strong> space curve� since distinct points on<br />
the curve correspond to distinct orientations. Families<br />
of space curves with exactly the same shape will map<br />
to the same quaternion curve� while curves that f<strong>al</strong>l<br />
away from their neighbors will stand out distinctly in<br />
the three�sphere plot. Regions of vanishing curvature<br />
will show up as discontinuous gaps in the otherwise<br />
continuous quaternion frame �eld curves.<br />
Figures 1d and 2d present elementary examples of<br />
the three�sphere plot. More complex examples are in�<br />
troduced in Section 7 and shown in Figures 3b� 4b�<br />
and 5b. The quaternion frame curves displayed in<br />
these plots are 2D projections of two overlaid 3D solid<br />
b<strong>al</strong>ls corresponding to the �front� and �back� hemi�<br />
spheres of S 3 . The 3�sphere is projected from 4D to<br />
3D <strong>al</strong>ong the 0�th axis� so the �front� b<strong>al</strong>l has points<br />
with 0 � q0 � �1� and the �back� b<strong>al</strong>l has points
�a� �b�<br />
�c� �d�<br />
Figure 1� �a� Projected image of a 3D �3�5� torus knot. �b� Selected Frenet frame components displayed <strong>al</strong>ong<br />
the knot. �c� The corresponding smooth quaternion frame components. �d� The path of the quaternion frame<br />
components in the three�sphere projected from four�space. Gray sc<strong>al</strong>es indicate the 0�th component of the curve�s<br />
four�vector frame �upper left graph in �c��.<br />
with �1 � q0 � 0. The q0 v<strong>al</strong>ues of the frame at each<br />
point are displayed as shades of gray in the curves of<br />
Figures 1 and 2.<br />
5.2 Probing Quaternion Frames with 4D<br />
Light<br />
As an <strong>al</strong>ternative display method� we now adapt<br />
techniques we have explored in other contexts for de<strong>al</strong>�<br />
ing directly with 4D objects �see �11�� �12�� and �10��.<br />
In our previous work on 4D geometry and lighting� the<br />
critic<strong>al</strong> element has <strong>al</strong>ways been the observation that<br />
4D light can be used as a probe of geometric struc�<br />
ture provided we can �nd a way �such as thickening<br />
curves or surfaces until they become true 3�manifolds�<br />
to de�ne a unique 4D norm<strong>al</strong> vector that has a well�<br />
de�ned sc<strong>al</strong>ar product with the 4D light� when that<br />
objective is achieved� we can interactively employ a<br />
moving 4D light and a gener<strong>al</strong>ization of the standard<br />
illumination equations to produce images that selec�<br />
tively expose new structur<strong>al</strong> details.<br />
Once we have generated our �possibly piecewise�<br />
smooth quaternion frames for each curve� we see that<br />
the quaternion frame q�s� is precisely what is required<br />
to apply 4D lighting and thus instantly identify those<br />
sections of the curves with similar orientation proper�<br />
ties by their matching re�ectances. The lighting equa�<br />
tion we adopt is simply<br />
I�s� � I a � I d�L � q�s�� � �7�<br />
where L is a 4D unit vector representing a 4D light<br />
direction� and we have included both an ambient and
�a� �b�<br />
�c� �d�<br />
Figure 2� �a� Projected image of a pathologic<strong>al</strong> curve segment. �b� Selected Frenet frame components� showing a<br />
sudden change of the norm<strong>al</strong>. �c� The quaternion frame components. �d� The discontinuous path of the quaternion<br />
frame components in the three�sphere. Gray sc<strong>al</strong>es indicate the 0�th component of the curve�s four�vector frame<br />
�upper left graph in �c��.<br />
a di�use term. The 4D dot product may be treated in<br />
sever<strong>al</strong> ways when it becomes negative� if the partic�<br />
ular application actu<strong>al</strong>ly has a reason to distinguish<br />
two equiv<strong>al</strong>ent quaternion frames because of their po�<br />
sition in a time sequence� one may distinguish positive<br />
and negative dot products by assigning di�erent color<br />
ranges �this method is used in Figures 3�5� or by set�<br />
ting the di�use v<strong>al</strong>ue to zero when the dot product is<br />
negative� if this distinction is not signi�cant� the ab�<br />
solute v<strong>al</strong>ue may be used. We have found it useful to<br />
use a variety of color maps in place of a strict gray<br />
sc<strong>al</strong>e of intensities. A moment�s re�ection reve<strong>al</strong>s that<br />
this amounts to assigning shells of color to the three�<br />
sphere and tagging the quaternion vector �eld lines in<br />
the three�sphere plot with the v<strong>al</strong>ues of the color shells<br />
through which they pass� rotating the light is equiv�<br />
<strong>al</strong>ent to rotating the 4D orientation of the color map<br />
distributed across the three�sphere. Yet another vari�<br />
ation would assign each point of the three�sphere to a<br />
unique color in the 3D hue�saturation�intensity space�<br />
making 4D rotation of the �light� irrelevant except for<br />
permuting the emphasized orientations. It is <strong>al</strong>so pos�<br />
sible to add a heuristic specular term to Eq. �7�� e.g.�<br />
by considering the projection direction of the three�<br />
sphere plot to be a 4D �view vector.�<br />
Figures 3a� 4a� and 5a show streamline data sets<br />
rendered by computing a pseudocolor index at each<br />
point from the 4D lighting formula Eq. �7�.<br />
5.3 Addition<strong>al</strong> Geometric Cues<br />
Gray �6� 3� has advocated the use of curvature and<br />
torsion�based color mapping to emphasize the geomet�<br />
ric properties of single curves such as the torus knot.
Since this information is trivi<strong>al</strong> to obtain simultane�<br />
ously with the Frenet frame� we <strong>al</strong>so o�er the <strong>al</strong>ter�<br />
native of encoding the curvature and torsion as sc<strong>al</strong>ar<br />
�elds on a volumetric space populated either sparsely<br />
or densely with streamlines� examples are shown in<br />
Figures 3c�d� 4c�d and 5c�d.<br />
Another extension one might adopt is based on the<br />
idea that� from Eq. �4�� the curvature ��s� is propor�<br />
tion<strong>al</strong> to the norm of a 3�vector� we can thus construct<br />
the four�component object<br />
�K�s� �<br />
�<br />
��s�� �x0 �s� � �x 00 �s�<br />
j�x 0 �s�j 3<br />
�<br />
�8�<br />
and then use the norm<strong>al</strong>ized �four�vector� �K�s� �<br />
�K�s��k �K�s�k as the quantity to be probed with 4D<br />
light. Since we norm<strong>al</strong>ly start the interactive system<br />
with the light shining directly in the direction of the<br />
component assigned to ��s� in Eq. �8�� we can begin<br />
with an image coded strictly by the strength of the<br />
curvature� and move the 4D light out into the other di�<br />
mensions to reve<strong>al</strong> the components of the vector whose<br />
magnitude is the curvature.<br />
Fin<strong>al</strong>ly� we remark that stream surfaces �14� can in<br />
principle <strong>al</strong>so be mapped to the three�sphere� e.g.� by<br />
choosing an interpolation of the quaternion frames of<br />
the streamline curves from which the stream surface<br />
is derived.<br />
6 Interactive Interfaces<br />
4D Light Orientation Control. Direct manipula�<br />
tion of 3D orientation using a 2D mouse is typic<strong>al</strong>ly<br />
handled using a rolling b<strong>al</strong>l �7� or virtu<strong>al</strong> sphere �2�<br />
method to give the user a feeling of physic<strong>al</strong> control.<br />
Here we brie�y outline the extension of this philosophy<br />
to 4D orientation control �see �4� 9��<br />
To control a single 3D lighting vector using a 2D<br />
mouse� we note that the unit vector in 3D has only<br />
two degrees of freedom� so that picking a point within<br />
a unit circle determines the direction uniquely up to<br />
the sign of its view�direction component. By choos�<br />
ing some convention for distinguishing vectors with<br />
positive or negative view�direction components �e.g.�<br />
solid or dashed line display�� we can make the direction<br />
unique. To control the light vector using the rolling<br />
b<strong>al</strong>l� begin with the vector pointing straight out of the<br />
screen� and move the mouse diagon<strong>al</strong>ly in the desired<br />
direction to tilt the vector to its new orientation� ro�<br />
tating past 90 degrees moves the vector so its view<br />
component is into the screen.<br />
The an<strong>al</strong>ogous control system for 4D lighting is<br />
based on a similar observation� since the 4D nor�<br />
m<strong>al</strong> vector has only 3 independent degrees of freedom�<br />
choosing an interior point in a solid sphere determines<br />
the vector uniquely up to the sign of its component<br />
in the unseen 4th dimension �the �4D view�direction<br />
component��. The rest of the control proceeds an<strong>al</strong>o�<br />
gously.<br />
Three�sphere projection control. A natur<strong>al</strong><br />
characteristic of the mapping of the quaternion frames<br />
to the three�sphere is that a particular projection must<br />
be chosen from 4D to 3D when actu<strong>al</strong>ly displaying<br />
the quaternion data. In order to expose <strong>al</strong>l possible<br />
relevant structures� the user interface must <strong>al</strong>low the<br />
viewer to freely manipulate the 4D projection parame�<br />
ters. This control is easily and inexpensively provided<br />
using the interface just described for controlling the<br />
4D light orientation. Our �MeshView� 4D viewing<br />
utility supports re<strong>al</strong>�time interaction with such struc�<br />
tures.<br />
7 Examples<br />
We present three di�erent examples of streamline or<br />
�ow data. Each data set is rendered four ways� �1� as<br />
a Euclidean space picture� pseudocolored by 4D light�<br />
�2� as a four�vector quaternion frame �eld plotted in<br />
the three�sphere� �3� in Euclidean space color�coded<br />
by curvature� �4� in Euclidean space color�coded by<br />
torsion.<br />
� Figure 3. An AVS�generated streamline data<br />
set� the �ow is obstructed somewhere in the cen�<br />
ter� causing sudden jumps of the streamlines in<br />
certain regions.<br />
� Figure 4. The �Dirac string trick� deformation<br />
�13� of a spheric<strong>al</strong> solid consisting of concentric<br />
spheres in Euclidean space.<br />
� Figure 5. A complicated set of streamlines de�<br />
rived from twisting a solid elastic Euclidean space<br />
as part of the process of tying a topologic<strong>al</strong> knot.<br />
In principle� any of the images for which we have<br />
shown only streamline curves can <strong>al</strong>so be displayed<br />
with stream surfaces or interpolated solid volume ren�<br />
dering� we have a module for solid rendering that dis�<br />
plays data such as that in Figure 5 as slices of the solid<br />
object.<br />
8 Conclusion<br />
In this paper� we introduced a visu<strong>al</strong>ization method<br />
for distinguishing critic<strong>al</strong> features of streamline�like<br />
volume data by assigning to each streamline a quater�<br />
nion frame �eld derived from its moving Frenet frame�<br />
curvature and torsion �elds may be incorporated as<br />
well. The quaternion frame is a four�vector �eld that
is a piecewise smoothly varying map from each orig�<br />
in<strong>al</strong> space curve to a new curve in the three�sphere<br />
embedded in four�dimension<strong>al</strong> Euclidean space. Fur�<br />
thermore� this four�vector can be interpreted as a four�<br />
dimension<strong>al</strong> norm<strong>al</strong> direction at each curve point� thus<br />
<strong>al</strong>lowing us to build on our previous work exploiting<br />
4D illumination� by assigning a shade to each curve<br />
point that depends on the sc<strong>al</strong>ar product of the quater�<br />
nion frame with a 4D light� we can explore a wide va�<br />
riety of loc<strong>al</strong> data features by interactively varying the<br />
light direction.<br />
Acknowledgments<br />
This work was supported in part by NSF grant IRI�<br />
91�06389. We thank Brian Kaplan for his assistance<br />
with the vector �eld data set� and John Hart� George<br />
Francis� and Lou Kau�man for the Dirac string trick<br />
data description. Bruce Solomon brought reference �1�<br />
to our attention.<br />
References<br />
�1� Bishop� R. L. There is more than one way<br />
to frame a curve. Amer. Math. Monthly 82� 3<br />
�March 1975�� 246�251.<br />
�2� Chen� M.� Mountford� S. J.� and Sellen�<br />
A. A study in interactive 3�d rotation using 2�<br />
d control devices. In Computer Graphics �1988��<br />
vol. 22� pp. 121�130. Proceedings of SIGGRAPH<br />
1988.<br />
�3� Cipra� B. Mathematicians gather to play the<br />
numbers game. Science 259 �1993�� 894�895. De�<br />
scription of Alfred Gray�s knots colored to repre�<br />
sent variation in curvature and torsion.<br />
�4� Cross� R. A.� and Hanson� A. J. Virtu<strong>al</strong> re<strong>al</strong>�<br />
ity performance for virtu<strong>al</strong> geometry. In Proceed�<br />
ings of Visu<strong>al</strong>ization �94 �1994�� IEEE Computer<br />
Society Press. In these Proceedings.<br />
�5� Eisenhart� L. P. A Treatise on the Di�erenti<strong>al</strong><br />
Geometry of Curves and Surfaces. Dover� New<br />
York� 1909 �1960�.<br />
�6� Gray� A. Modern Di�erenti<strong>al</strong> Geometry of<br />
Curves and Surfaces. CRC Press� Inc.� Boca Ra�<br />
ton� FL� 1993.<br />
�7� Hanson� A. J. The rolling b<strong>al</strong>l. In Graph�<br />
ics Gems III� D. Kirk� Ed. Academic Press� San<br />
Diego� CA� 1992� pp. 51�60.<br />
�8� Hanson� A. J. Quaternion frenet frames� Mak�<br />
ing optim<strong>al</strong> tubes and ribbons from curves. Tech.<br />
Rep. 407� Indiana University Computer Science<br />
Department� 1994.<br />
�9� Hanson� A. J. Rotations for n�dimension<strong>al</strong><br />
graphics. Tech. Rep. 406� Indiana University<br />
Computer Science Department� 1994.<br />
�10� Hanson� A. J.� and Cross� R. A. Interac�<br />
tive visu<strong>al</strong>ization methods for four dimensions.<br />
In Proceedings of Visu<strong>al</strong>ization �93 �1993�� IEEE<br />
Computer Society Press� pp. 196�203.<br />
�11� Hanson� A. J.� and Heng� P. A. Visu<strong>al</strong>izing<br />
the fourth dimension using geometry and light.<br />
In Proceedings of Visu<strong>al</strong>ization �91 �1991�� IEEE<br />
Computer Society Press� pp. 321�328.<br />
�12� Hanson� A. J.� and Heng� P. A. Illuminating<br />
the fourth dimension. Computer Graphics and<br />
Applications 12� 4 �July 1992�� 54�62.<br />
�13� Hart� J. C.� Francis� G. K.� and Kauffman�<br />
L. H. Visu<strong>al</strong>izing quaternion rotation. Preprint�<br />
1994.<br />
�14� Hultquist� J. Constructing stream surfaces in<br />
steady 3d vector �elds. In Proceedings of Vi�<br />
su<strong>al</strong>ization �92 �1992�� IEEE Computer Society<br />
Press� pp. 171�178.<br />
�15� Shoemake� K. Animating rotation with quater�<br />
nion curves. In Computer Graphics �1985��<br />
vol. 19� pp. 245�254. Proceedings of SIGGRAPH<br />
1985.
Figure 3: Vector field streamlines. (a) With 4D light. (b) Quaternion<br />
field path. (c) Curvature. (d) Torsion.<br />
Figure 4: Dirac Strings. (a) With 4D light. (b) Quaternion field path.<br />
(c) Curvature. (d) Torsion.<br />
Figure 5: Knot volume deformation. (a) With 4D light. (b) Quaternion<br />
field path. (c) Curvature. (d) Torsion.
Feature Detection from Vector Quantities in a Numeric<strong>al</strong>ly Simulated Hypersonic<br />
Flow Field in Combination with Experiment<strong>al</strong> Flow Visu<strong>al</strong>ization<br />
Abstract<br />
In computation<strong>al</strong> fluid dynamics visu<strong>al</strong>ization is a frequently<br />
used tool for data ev<strong>al</strong>uation, understanding of flow characteristics,<br />
and qu<strong>al</strong>itative comparison to flow visu<strong>al</strong>izations<br />
originating from experiments. Building on an existing visu<strong>al</strong>ization<br />
software system, that <strong>al</strong>lows for a careful selection<br />
of state-of-the-art visu<strong>al</strong>ization techniques and some extensions,<br />
it became possible to present various features of the<br />
data in a single image. The visu<strong>al</strong>izations show vortex position<br />
and rotation as well as skin-friction lines, experiment<strong>al</strong><br />
oil-flow traces, and shock-wave positions. By adding experiment<strong>al</strong><br />
flow visu<strong>al</strong>ization, a comparison between numeric<strong>al</strong><br />
simulation and wind-tunnel flow becomes possible up to a<br />
high level of detail. Since some of the underlying <strong>al</strong>gorithms<br />
are not yet described in detail in the visu<strong>al</strong>ization literature,<br />
some experiences gained from the implementation are illustrated.<br />
1 Introduction<br />
Numeric<strong>al</strong> flow simulation creates demanding data of high<br />
complexity, which requires a well selected combination of<br />
visu<strong>al</strong>ization techniques to visu<strong>al</strong>ize the dominant properties<br />
of the data and the significant structures needed to gain<br />
insight into the flow. By carefully reducing the number of<br />
visu<strong>al</strong> elements required for the representation of a given<br />
feature in the data, one may free space in the image for the<br />
visu<strong>al</strong>ization of other features present at the same time.<br />
Eventu<strong>al</strong>ly, even data from different sources, such as an<br />
image from an experiment and visu<strong>al</strong> elements from numeric<strong>al</strong>ly<br />
simulated flows, may be visu<strong>al</strong>ized in a single image.<br />
It turns out that interesting discoveries become possible only<br />
due to this combined visu<strong>al</strong>ization. Complex visu<strong>al</strong>ization<br />
that provides a collective presentation of different features<br />
offers better insight into the interaction of physic<strong>al</strong> phenomena.<br />
The major benefit for aerodynamicists, however, was<br />
only achieved due to the successful combination of vortex<br />
visu<strong>al</strong>ization, shock visu<strong>al</strong>ization, skin-friction lines, and<br />
oil-flow patterns.<br />
Hans-Georg Pagendarm<br />
Birgit W<strong>al</strong>ter<br />
DLR, German Aerospace Research Establishment<br />
D37073 Göttingen, Germany<br />
- 1 -<br />
2 The flow problem<br />
Fig. 1 Geometry of the flat plate, wedge, and fin<br />
configuration placed in a hypersonic flow field<br />
(schematic view)<br />
The visu<strong>al</strong>ization of phenomena in flows will be demonstrated<br />
using data kindly supplied by T. Gerhold [1],[2]. The<br />
flow simulation results from a Navier-Stokes solution for a<br />
blunt-fin / wedge configuration (see: Fig. 1) in a hypersonic<br />
flow at a Mach number of 5. The flow shows a horseshoe<br />
type of vortex. The simulation <strong>al</strong>so resolves a sm<strong>al</strong>ler secondary<br />
vortex that rotates in the opposite direction. These<br />
vortices produce characteristic traces on the w<strong>al</strong>l, which<br />
have been visu<strong>al</strong>ized in the numeric<strong>al</strong> data as well as in a<br />
wind-tunnel flow for direct comparison. A second significant<br />
phenomenon in this flow field is a pattern of shock<br />
waves. This flow is studied to learn more about the interaction<br />
of shock waves and complex three-dimension<strong>al</strong> boundary<br />
layers or viscous flows in gener<strong>al</strong>. Even though the<br />
geometry appears to be simple an extremely complex threedimension<strong>al</strong><br />
flow field is generated.
3 Visu<strong>al</strong>ization of w<strong>al</strong>l friction<br />
As in this case experiment<strong>al</strong> fluid mechanics of hypersonic<br />
flows is frequently done in blow-down wind tunnels. These<br />
facilities <strong>al</strong>low only a short-duration of constant-flow condition.<br />
Therefore the data collected within a single experiment<br />
are extremely limited. Sc<strong>al</strong>ar quantities such as pressure are<br />
often measured at a sm<strong>al</strong>l number of locations on the w<strong>al</strong>l.<br />
Usu<strong>al</strong>ly there are no measurements in the three-dimension<strong>al</strong><br />
flow field. The use of oil-flow visu<strong>al</strong>ization <strong>al</strong>lows glob<strong>al</strong><br />
acquisition of near-w<strong>al</strong>l-velocity direction<strong>al</strong> information.<br />
Thus oil-flow patterns are a powerful representation of flow<br />
behaviour.<br />
The technique employs a dye dispersed in a speci<strong>al</strong> oil.<br />
This oil is sprayed on the solid w<strong>al</strong>ls of the model in the<br />
wind tunnel. Due to viscous action of the flow velocity close<br />
to the w<strong>al</strong>l, the oil moves slowly in the loc<strong>al</strong> flow direction.<br />
When the oil evaporates it leaves behind a trace of dye,<br />
which marks the loc<strong>al</strong> flow direction.<br />
In order to compare numeric<strong>al</strong> flow simulations with<br />
such experiments, one has to visu<strong>al</strong>ize the near- w<strong>al</strong>l flow<br />
field. The direction of a flow velocity field is frequently visu<strong>al</strong>ized<br />
using streamlines. In simulations of viscous flows<br />
the velocity of the flow at a solid w<strong>al</strong>l is zero by definition.<br />
This prevents the c<strong>al</strong>culation of streamlines directly on the<br />
w<strong>al</strong>ls. One would like to find the limiting streamline at locations<br />
where the velocity goes to zero while the direction of<br />
the velocity vector is determined by the direction of the<br />
velocity near the w<strong>al</strong>l. Limiting streamlines on a simpler fin/<br />
flat-plate configuration were presented <strong>al</strong>ready by Hung and<br />
Buning [3]. Helman and Hesselink [4] point out some of the<br />
difficulties of such an approach using an example from [4].<br />
At that time those limiting streamlines were probably generated<br />
by performing a particle tracing in the flow regime<br />
close to the w<strong>al</strong>l (in the case of [4] and [5] by using addition<strong>al</strong><br />
constraints on the velocity component norm<strong>al</strong> to the<br />
w<strong>al</strong>l.. Today skinfriction lines are commonly used instead of<br />
near-w<strong>al</strong>l particle traces. Visu<strong>al</strong>ization of skin-friction lines<br />
has been used for a long time for comparison with oil-flow<br />
patterns. (e.g. see [6] and [7] ). Therefore, the main interest<br />
here is concerned with the particular implementation within<br />
a visu<strong>al</strong>ization system.<br />
All images in this paper where created using the visu<strong>al</strong>ization<br />
system HIGHEND [8]. This system is easily extendible<br />
and the data processing needed for visu<strong>al</strong>ization of skinfriction<br />
lines was quickly performed using existing tools<br />
after adding sm<strong>al</strong>l pieces of code.<br />
The expression “w<strong>al</strong>l-friction lines” results from using<br />
the w<strong>al</strong>l shear vector for visu<strong>al</strong>ization purposes. The w<strong>al</strong>l<br />
shear vector τw is the derivative norm<strong>al</strong> to the w<strong>al</strong>l of the<br />
velocity vector v . In gener<strong>al</strong> it is nonzero and points in<br />
the direction of the near-w<strong>al</strong>l velocity vectors when projected<br />
norm<strong>al</strong> to the w<strong>al</strong>l. The w<strong>al</strong>l shear τ w may be c<strong>al</strong>cu-<br />
- 2 -<br />
lated from the gradient of the velocity vector v after<br />
introducing a w<strong>al</strong>l coordinate system where<br />
dinate vector norm<strong>al</strong> to the w<strong>al</strong>l.<br />
n is the coor-<br />
τ w<br />
= ∇v – ( ∇v ⋅ n)<br />
The gradient ∇v<br />
may be c<strong>al</strong>culated using a Gaussian integr<strong>al</strong><br />
formulation<br />
∇v<br />
⎛ 1<br />
-- v dA⎞<br />
⎝ V∫<br />
⎠<br />
This <strong>al</strong>lows for an easy implementation[9],[10] that is insensitive<br />
to a pathologic<strong>al</strong> or degenerated grid cell in the<br />
numeric<strong>al</strong> data set. To c<strong>al</strong>culate the vorticity, a staggered<br />
grid is generated by creating new vertices in the centre of<br />
each grid cell (see Fig. 2). This is done by c<strong>al</strong>culating the<br />
coordinates of the centre vertex as the arithmetic<strong>al</strong> mean of<br />
the coordinates of the surrounding vertices.<br />
i-1,j-1,k+1<br />
=<br />
lim<br />
V → 0<br />
i-1,j+1,k+1 i+1,j+1,k+1<br />
i-1,j-1,k-1 i+1,j-1,k-1<br />
Fig. 2 A staggered grid around the grid point i,j,k is<br />
used. The integration is performed on the<br />
surface of the inner volume. For simplicity, this<br />
figure shows a cartesian grid where cells are<br />
cubes. However the approach may be<br />
gener<strong>al</strong>ized towards curvilinear or even<br />
unstructured grids.<br />
After the w<strong>al</strong>l shear τ w has been c<strong>al</strong>culated on <strong>al</strong>l solid<br />
boundaries represented in the data, a standard streamline<br />
integration <strong>al</strong>gorithm using a second-order Runge-Kutta<br />
scheme is used to integrate the friction lines from the shear<br />
vector field. The skin-friction lines provide glob<strong>al</strong> information<br />
about the near-w<strong>al</strong>l flow field (Fig. 3) Experienced aerodynamicists<br />
will be able to imagine even qu<strong>al</strong>itatively the<br />
A<br />
i+1,j+1,k-1
over<strong>al</strong>l three-dimension<strong>al</strong> flow pattern in the flow field from<br />
these w<strong>al</strong>l patterns.<br />
In particular, skin-friction lines show the location of separation<br />
and reattachment of the flow at the w<strong>al</strong>l. As mentioned,<br />
earlier experiments were performed in a wind tunnel to provide<br />
measurements and visu<strong>al</strong>ization to match the numeric<strong>al</strong><br />
flow simulation. Oil-flow patterns were captured as a photograph.<br />
Due to the limited access to the wind tunnel during<br />
the experiments, the photograph shows a perspective view<br />
of the fin taken from a side of the wind tunnel.<br />
Fig. 3 Skin-friction lines on w<strong>al</strong>ls of the the blunt fin<br />
and wedge.<br />
Unfortunately, some of the details of the positions and the<br />
equipment used when recording the experiments were not<br />
available anymore. Therefore, for direct comparison of significant<br />
lines and oil-flow pattern, the perspective had to be<br />
reconstructed from the edges of the model visible in the<br />
image.<br />
Fig. 4 Skin-friction lines projected perspectively on<br />
the oil-flow pattern<br />
- 3 -<br />
After careful interactive matching of the viewing conditions<br />
which was required in this case, the skin-friction lines could<br />
be projected into the image showing the oil-flow pattern in<br />
the wind tunnel experiment.<br />
The resulting combined image (Fig. 4) increases confidence<br />
in the over<strong>al</strong>l correct numeric<strong>al</strong> simulation. Some<br />
loc<strong>al</strong> discrepancies could be explained by a loc<strong>al</strong> lack of resolution<br />
in the numeric<strong>al</strong> simulation. However, the experiment<br />
clearly shows a second weak separation line in the<br />
lower side w<strong>al</strong>l of the fin, which does not show in the<br />
numeric<strong>al</strong>ly generated skin-friction lines (Fig. 5). The<br />
experiment suggests that there is a vortex at some distance<br />
from the w<strong>al</strong>l, which is the reason for this pattern.<br />
4 Vortex visu<strong>al</strong>ization<br />
s 1<br />
s2 ss22 Fig. 5 The oil-flow pattern shows a second weak<br />
separation trace s 2 , which is not visible in the<br />
numeric<strong>al</strong> data<br />
A vortex would be expected to be present in the numeric<strong>al</strong><br />
solution as well. However, due to a lack of resolution for<br />
very sm<strong>al</strong>l vortices it might be too weak to influence the<br />
skin-friction lines visibly.<br />
The visu<strong>al</strong>ization of vortices typic<strong>al</strong>ly relies on particle<br />
traces. C<strong>al</strong>culation of particle traces within a flow field is a<br />
well known visu<strong>al</strong>ization technique that similary to flow visu<strong>al</strong>ization<br />
by injection of dye into re<strong>al</strong> flows. The construction<br />
of trajectory lines is gener<strong>al</strong>ly applicable to <strong>al</strong>l kinds of<br />
vector data. Presumably it is because of the similarity to<br />
experiment<strong>al</strong> flow visu<strong>al</strong>ization techniques that the visu<strong>al</strong>ization<br />
of such lines is frequently mentioned in the literature<br />
of computation<strong>al</strong> fluid dynamics (see among others<br />
[11],[12],[13],[4]). Some authors study the accuracy problem<br />
in detail (see: [14],[15],[16]). Today, most visu<strong>al</strong>ization<br />
systems make use of a second-order Runge-Kutta integra-
tion scheme. However, some authors report <strong>al</strong>ternative<br />
methods [17], [18]. Volpe [13] suggested the display of<br />
stream ribbons for a more understandable visu<strong>al</strong>ization of<br />
flow fields. He demonstrated how to obtain the impression<br />
of a ribbon floating in the flow field by c<strong>al</strong>culating a large<br />
number of adjacent streamlines. Those lines must be placed<br />
very close to each other to keep the gaps invisible in the<br />
image. Another way of creating stream ribbons is by constructing<br />
polygons between two neighbouring lines. A simple<br />
method to create such polygons by the use of a marching<br />
triangulation <strong>al</strong>gorithm is illustrated in [19]. A similar<br />
approach is reported by [20]. Both approaches fail if the<br />
flow field is diverging because the two limiting streamlines<br />
depart from each other. Eventu<strong>al</strong>ly they will be far enough<br />
from each other that physic<strong>al</strong>ly unfeasible effects occur in<br />
the visu<strong>al</strong>ization. Such effects could be the crossing of<br />
stream ribbons or ribbons passing through solid flow boundaries.<br />
To produce v<strong>al</strong>id visu<strong>al</strong>izations in such circumstances,<br />
it is necessary to c<strong>al</strong>culate the stream ribbon from a single<br />
trajectory line. Again, this approach has been used in the<br />
past. In particular the famous NCSA video on a ‘Severe<br />
Thunderstorm’ shows swirling ribbons. Therefore, the following<br />
description concentrates on implementation issues.<br />
C<strong>al</strong>culating stream ribbons from more than one streamline<br />
often fails because the numeric<strong>al</strong> v<strong>al</strong>ues of two near by<br />
velocity vectors differ significantly. This <strong>al</strong>lows for a growing<br />
distance between two adjacent lines. A straightforward<br />
approach to avoid this considers one of the two lines as a<br />
primary line that marks the location of the ribbon and uses<br />
the second streamline c<strong>al</strong>culation only for obtaining the orientation<br />
of the line in space while keeping the two lines at a<br />
constant distance. Such an approach may be derived from an<br />
<strong>al</strong>gorithm suggested for tracking of surface particles by van<br />
Wijk [20]. However, in fluid dynamics information on vortic<strong>al</strong><br />
behaviour is commonly obtained by applying the rotation<br />
or curl operator of the velocity vector field v (e.g. see<br />
[21]).<br />
rot v<br />
=<br />
∂vz ∂vy ------- – -------<br />
∂y ∂z<br />
∂vx ∂vz ------- – -------<br />
∂z ∂x<br />
∂vy ∂vx ------- – -------<br />
∂x ∂y<br />
The resulting vector represents the axis of rotation as well as<br />
the amount of rotation at a given point in the vector field<br />
v .The angular velocity, or vorticity ω , is simply one h<strong>al</strong>f<br />
rot v .<br />
- 4 -<br />
ω ( x, y, z, t)<br />
1<br />
-- rot v<br />
2<br />
Since flow simulation data frequently are stored on curvilinear<br />
or even unstructured grids, it may require some effort to<br />
ev<strong>al</strong>uate the rotation or curl because the transformation of<br />
the coordinates has to be taken into account. However, one<br />
may again take advantage of replacing the rotation or curl<br />
by a Gaussian integr<strong>al</strong>:<br />
This approach <strong>al</strong>lows an implementation very similar to the<br />
one suggested earlier for the ev<strong>al</strong>uation of the gradient of a<br />
sc<strong>al</strong>ar field [9]. Once the vorticity ω is c<strong>al</strong>culated everywhere<br />
in the vector field, the vorticity vector may be projected<br />
onto the loc<strong>al</strong> flow direction to obtain the angular<br />
velocity of rotation in the loc<strong>al</strong> streamwise direction, which<br />
<strong>al</strong>lows the detrmination of the stream-ribbon swirl.<br />
Note that ωribbon is a sc<strong>al</strong>ar quantity, since the direction is<br />
defined by the loc<strong>al</strong> direction of the velocity vector or the<br />
streamline. This quantity is a measure of rigid body rotation<br />
in the flow field. It is not identic<strong>al</strong> to another sc<strong>al</strong>ar quantity<br />
often used to find vortic<strong>al</strong> motion in flow fields, the helicity,<br />
which is simply the cosine of the angle between the vorticity<br />
vector and the velocity vector.<br />
4.1 Construction of a stream ribbon<br />
First, a streamline or particle path is c<strong>al</strong>culated using an<br />
established particle tracing <strong>al</strong>gorithm. This program produces<br />
a line as a series of coordinates. The system was<br />
extended in such a way that for each point <strong>al</strong>ong the line the<br />
magnitudes of the loc<strong>al</strong> velocity vector v and the loc<strong>al</strong><br />
streamwise vorticity are stored as well. These<br />
v<strong>al</strong>ues are obtained within the grid cell by trilinear interpolation.<br />
Knowledge of the loc<strong>al</strong> velocity of the flow <strong>al</strong>ong a<br />
streamline <strong>al</strong>lows the c<strong>al</strong>culation of the elapsed time<br />
between two points on the line at a distance s.<br />
=<br />
rot v = ∇× v = – lim<br />
ω ribbon<br />
t ( s)<br />
V → 0<br />
⎛ 1<br />
-- v × dA⎞<br />
⎝ V∫<br />
⎠<br />
ω ⋅ V<br />
= ωstreamwise = -----------<br />
V<br />
ω streamwise<br />
=<br />
s<br />
∫<br />
s 0<br />
A<br />
v<br />
---------------------- ds<br />
s ( x, y, z)
At the starting point of a streamline, the initi<strong>al</strong> direction and<br />
the width of the stream ribbon is defined. Marching from<br />
point to point <strong>al</strong>ong the streamline the rotation α may be<br />
integrated by multiplying the known angular velocity of the<br />
flow around the streamline and the elapsed time<br />
.<br />
s<br />
∫<br />
α ( s)<br />
= ω ( s)<br />
dt<br />
s 0<br />
Simple Eulerian integration was found to be accurate<br />
enough for visu<strong>al</strong>ization purposes after comparing the<br />
results with an <strong>al</strong>ternative method [19] for a number of<br />
cases.<br />
The ribbon is constructed of a series of polygons.<br />
These follow the streamline and are oriented according to<br />
the loc<strong>al</strong> angle integrated from the angular velocity. In gener<strong>al</strong>,<br />
ribbons which extend symmetric<strong>al</strong>ly to both sides of<br />
the defining streamline are more suitable for visu<strong>al</strong>ization<br />
purposes.<br />
α(s)<br />
·<br />
·<br />
i+1<br />
·<br />
i<br />
·<br />
b<br />
i-1<br />
Fig. 6 Construction of a stream ribbon <strong>al</strong>ong the path<br />
of a streamline while rotating it around the line<br />
with the given angle α(s)<br />
The norm<strong>al</strong> of the edge i is rotated in a plane norm<strong>al</strong> to the<br />
streamline. The rotation angle relative to the edge i-1 is<br />
given by α(s). The width b of the ribbon is kept constant.<br />
This marching procedure constructs a stream ribbon of constant<br />
width (see Fig. 6). The initi<strong>al</strong> angle of the first polygon<br />
on a line may be chosen arbitrarily. Often, this angle will be<br />
identic<strong>al</strong> with a physic<strong>al</strong> coordinate axis. It is recommended<br />
to choose the same initi<strong>al</strong> angle for <strong>al</strong>l ribbons within one<br />
image.<br />
An<strong>al</strong>ogous to the method pointed out in [21], the orientation<br />
of the ribbon could be deducted using a Frenet frame<br />
with similar results. The Frenet frame needs speci<strong>al</strong> treatment<br />
to resolve ambiguities for straight streamlines. The<br />
method presented here is straight forward to implement and<br />
was found accurate enough in various test cases. Obviously,<br />
the ribbon will not change orientation in an irrotation<strong>al</strong> field.<br />
In a field of solid body rotation with axi<strong>al</strong> translation super-<br />
s<br />
- 5 -<br />
imposed, the ribbon shows the correct swirl whether it is<br />
placed on the vortex axis or away from it. The width of the<br />
ribbon may be chosen arbitrarily as well. Therefore, it is<br />
possible to adjust the width to the sc<strong>al</strong>e of the ribbon within<br />
the image. Sm<strong>al</strong>l vortic<strong>al</strong> structures may require a comparatively<br />
large ribbon to make the swirl visible. This is a major<br />
advantage compared to the technique of constructing a ribbon<br />
between two streamlines, because in that case both lines<br />
are restricted to stay close to the centre of the vortex else the<br />
method would fail. The technique presented here however is<br />
not restricted.<br />
4.2 Vortex pattern near the blunt fin<br />
The flow shows a horseshoe type of vortex. The simulation<br />
<strong>al</strong>so resolves a sm<strong>al</strong>ler secondary vortex that rotates in<br />
opposite direction (Fig. 7). In particular, in the vincinity of<br />
the stagnation region ahead of the fin the vortices are accelerated<br />
when they pass the fin. This is advantageous for the<br />
visu<strong>al</strong>ization since a streamline release in this region is<br />
sucked into the vortex and remains very close to the centr<strong>al</strong><br />
core for a long time.<br />
Fig. 7 Ribbons represent vortices in the flow field. The<br />
image <strong>al</strong>lows the examination of threedimension<strong>al</strong><br />
phenomena with respect to their<br />
traces on the solid w<strong>al</strong>ls<br />
Therefore, streamlines were carefully selected to hit the vortex<br />
close to the plane of symmetry then follow the centre of<br />
the vortex past the fin. The ribbons were c<strong>al</strong>culated for two<br />
streamlines, one for each of the vortices.<br />
To find streamlines that stay within the vortex core, the<br />
starting point for the streamline must be placed accurately in<br />
the centre of the vortex. This may be done interactively.<br />
While in the two-dimension<strong>al</strong> or surface-flow case significant<br />
starting points may be found by means of topology<br />
an<strong>al</strong>ysis [4], this is not necessarily sufficient in the threedimension<strong>al</strong><br />
case. However visu<strong>al</strong>ization of restricted
streamlines in a plane through the flow domain provide a<br />
good starting point for interactive refinement.The full path<br />
of the line consists of a part integrated forward through the<br />
converging vortex core while the part of the line that<br />
approaches the fin from the inflow boundary was integrated<br />
backwards to meet the vortex exactly. Careful selection of<br />
streamlines and c<strong>al</strong>culation of ribbons <strong>al</strong>lows representing<br />
the vortex pattern with effective and easy to perceive visu<strong>al</strong><br />
objects that do not clutter the image<br />
In the case discussed here, the horseshoe vortex passes<br />
the fin with increasing distance while the secondary vortex<br />
stays very close to the side w<strong>al</strong>l of the fin. When visu<strong>al</strong>ized<br />
in combination with the oil-flow pattern obtained in the win<br />
tunnel experiment, the position of this secondary vortex<br />
explains nicely the weak trace of a separating flow h<strong>al</strong>f way<br />
up the fin. Fig. 8 shows the vortex core close to the fin,<br />
slightly below the lower separation trace. The vortex must<br />
be below this trace to topologic<strong>al</strong>ly explain the pattern on<br />
the fin.<br />
Fig. 8 Three-dimension<strong>al</strong> vortex cores from the<br />
numeric<strong>al</strong> simulation visu<strong>al</strong>ized in combination<br />
with oil-flow traces from wind tunnel<br />
experiments<br />
As suspected earlier, this vortex may be represented a bit too<br />
weak, due to spati<strong>al</strong> resolution in the simulation. This could<br />
explain why the skin friction lines as they are shown in Fig.<br />
3 and Fig. 4 do not show this separation.<br />
5 Vortex and shock wave interaction<br />
The location of the vortices are typic<strong>al</strong>ly very much determined<br />
by their interaction with the shock waves present in<br />
this three-dimension<strong>al</strong> flow field. In the past, most visu<strong>al</strong>izations<br />
of shock phenomena relied on pseudo colours or isolines<br />
on cuts through the data space. These methods were<br />
- 6 -<br />
<strong>al</strong>ready used by Hung and Buning [3] to visu<strong>al</strong>ize shock<br />
locations in a comparable flow field. Their paper as well as<br />
the related work of Hung and Kordulla [23] provide visu<strong>al</strong>ization<br />
of sc<strong>al</strong>ar data such as Mach number or pressure in<br />
various two-dimension<strong>al</strong> slices of the flow field for presentaion<br />
of the complex flow field. In the plane of symmetry<br />
they provide an early example of a combined visu<strong>al</strong>ization<br />
showing “two-dimension<strong>al</strong> streamlines” together with isocontours.<br />
To visu<strong>al</strong>ize the three-dimension<strong>al</strong> shape of shock waves, a<br />
shock detection and visu<strong>al</strong>ization technique was implemented<br />
using the HIGHEND visu<strong>al</strong>ization system mentioned<br />
earlier [9].<br />
Fig. 9 Three-dimension<strong>al</strong> shock waves from the<br />
numeric<strong>al</strong> simulation visu<strong>al</strong>ized in combination<br />
with oil-flow traces from wind tunnel<br />
experiments<br />
This method constructs a surface that matches the maximum<br />
of the loc<strong>al</strong> density change everywhere in the flow field. The<br />
gradient of the sc<strong>al</strong>ar quantity density is projected onto the<br />
loc<strong>al</strong> flow direction vector to find the location of maxim<strong>al</strong><br />
compression in the streamwise direction. By connecting<br />
these locations, a surface is formed, which may be visu<strong>al</strong>ized<br />
as a transparent surface. In the case discussed here, various<br />
shock waves are present in the flow field.<br />
The blunt fin creates a dominant detached bow shock.<br />
The sharp kink in the bottom w<strong>al</strong>l formed by the wedge<br />
forms an oblique ascending shock wave, which starts at the<br />
location of the kink and is steeper than the wedge. Both<br />
shock waves intersect. As a result of the intersection of the<br />
fin with the bottom w<strong>al</strong>l and the horseshoe type vortex, there<br />
is a third part of the shock pattern that encloses the vortex.<br />
More details still await further an<strong>al</strong>ysis. However, these<br />
prominent phenomena <strong>al</strong>ready provide insight into the interaction<br />
of different flow properties.
Because of viscous action near the w<strong>al</strong>ls, shocks become<br />
weaker there and will not be traced. Their position and<br />
shape in the vicinity of the fin clearly indicate the interaction<br />
between the shock wave and the separation traces in the oilflow<br />
image (Fig. 9).<br />
The shapes of the shock waves are bent by interaction with<br />
vortices, as may be seen when visu<strong>al</strong>izing the vortex cores<br />
in combination with the shock waves (Fig. 10).<br />
Fig. 10 Three-dimension<strong>al</strong> shock waves from the<br />
numeric<strong>al</strong> simulation visu<strong>al</strong>ized in combination<br />
with vortex cores seen from the flow exit plane<br />
6 Conclusion<br />
Visu<strong>al</strong>ization has been technology driven for a long time,<br />
pseudocolour playing a dominant role. A large variety of<br />
visu<strong>al</strong>ization methods is known today. However, only the<br />
integrated application of carefully selected techniques provide<br />
better insight even into complex data with different<br />
phenomena being simultaneously present. Each technique<br />
applied in this example provides a compact, meaningful representation<br />
of a selected feature in the data without occupying<br />
too much space in the image. The combined<br />
visu<strong>al</strong>ization of different flow features provides insight into<br />
the interaction of phenomena. Further improvements were<br />
obtained by including the combined visu<strong>al</strong>ization of data<br />
from different sources such as numeric<strong>al</strong> simulations and<br />
wind tunnel experiments. Due to a perspective mapping and<br />
blending technique, comparison between data from different<br />
sources was not restricted to image-level comparison by<br />
placing images side by side. Presentation of both data within<br />
a single image <strong>al</strong>lows for quantitative ev<strong>al</strong>uation, for example<br />
of displacement of features.<br />
- 7 -<br />
7 References<br />
[1] T. Gerhold, P. Krogmann: “Investigation of the Hypersonic Turbulent<br />
Flow Past a Blunt Fin/Wedge Configuration”, AIAA-93-5026, 5th<br />
Intern. Aerospace Plane and Hypersonic Technology Conference,<br />
Munich, Germany, Nov. 30 - Dec. 3, 1993<br />
[2] T. Gerhold: “Numeric<strong>al</strong> Simulation of Blunt-Fin-Induced Flow Using a<br />
Two-Dimension<strong>al</strong> Turbulence Model”, Proc. of ICHMT Int. Symp. on<br />
Turbulence, Heat and Mass Transfer, Lisbon,, August 9-12, 1994<br />
[3] C.M. Hung, P.G. Buning: “Simulation of Blunt-fin-induced Shockwave<br />
and Turbulent Boundary Layer Interaction” JFM, Vol. 154, , 1985<br />
[4] J.L. Helman, L. Hesselink: “Visu<strong>al</strong>izing Vector Field Topology in Fluid<br />
Flows”, IEEE Comp. Graphics & Applications, May 1991<br />
[5] S.X. Ying, L.B. Schiff, J.L. Steger: “A Numeric<strong>al</strong> Study on 3D<br />
Separated Flow Past a Hemisphere Cylinder,”, Proc. AIAA 19th Fluid<br />
Dyn., Plasma Dyn. and Lasers Conf. paper 87-1207, June 1987<br />
[6] B. Müller, A. Rizzi: “Large-Sc<strong>al</strong>e Viscous Simulation of Laminar<br />
Vortex Flow Over a Delta Wing”, AGARD CP 437 Vol.2, Dec. 1988<br />
[7] W.J. Bannink, E.M.Houtman, S.P. Ottochian: “Investigation of Surface<br />
Flow on Conic<strong>al</strong> Bodies at High Subsonic and Supersonic Speeds”,<br />
AGARD CP 437 Vol.2, Dec. 1988<br />
[8] H.-G. Pagendarm: “HIGHEND, A Visu<strong>al</strong>ization System for 3d Data<br />
with Speci<strong>al</strong> Support for Postprocessing of Fluid Dynamics Data”, in:<br />
M. Grave, Y. LeLous, W.T.Hewitt (ed.) “Visu<strong>al</strong>ization in Scientific<br />
Computing”, Springer Verlag, Heidelberg, 1994<br />
[9] H.-G. Pagendarm, B. Seitz: “An <strong>al</strong>gorithm for Detection and<br />
Visu<strong>al</strong>ization of Discontinuities in Scientific Data Fields Applied to<br />
Flow Data with Shock Waves”, in P. P<strong>al</strong>amidese (ed.) : "Visu<strong>al</strong>ization<br />
in Scientific Computing", Ellis Horwood Workshop Series, 1993<br />
[10]H.-G. Pagendarm, B. Seitz, S.I. Choudhry: “Visu<strong>al</strong>ization of Shock<br />
Waves in CFD Solutions”, 19th Internation<strong>al</strong> Symposium on Shock<br />
Waves, Marseilles, July 26-30, 1993.<br />
[11] E. Murman, A. Rizzi, K. Powel: “High Resolution of The Euler<br />
Equation for Vortex Flows”, Progress and Supercomputing in<br />
Computation<strong>al</strong> Fluid Dynamics, Birkhauser-Boston, Boston, MA,<br />
1985. pp. 93-113<br />
[12]T. Lasinski, P. Buning, D. Choi, S. Rogers, G. Bancroft, F. Merrit:<br />
“Flow Visu<strong>al</strong>ization of CFD Using Graphics Workstations”, AIAA<br />
Paper 87-1180CP, June 1987<br />
[13]G. Volpe: “Streamlines and Streamribbons in Aerodynamics”, AIAA<br />
Paper 89-0140, 27th Aerospace Science Meeting, Jan 9-12, Reno<br />
Nevada, 1989<br />
[14]E. Murman, K. Powell: “Trajectory Integration in Vortic<strong>al</strong> Flow”,<br />
AIAA Journ<strong>al</strong>, Vol 27, No. 7, July 1989, pp. 982-984<br />
[15]P. Buning: “Sources of Error in the Graphic<strong>al</strong> An<strong>al</strong>ysis of CFD<br />
Results”, J. Sci. Comp. Vol.3, No. 2, 1988<br />
[16]P.K. Yeung, S.B. Pope: “An Algorithm for Tracking Fluid Particles in<br />
Numeric<strong>al</strong> Simulations of Homogeneous Turbulence”, J. Comp.<br />
Physics, Vol. 79, 1988, pp. 373<br />
[17]D.N. Kenwright, G.D. M<strong>al</strong>linson: “A 3-D Streamline Tracking<br />
Algorithm Using Du<strong>al</strong> Stream Functions” Proc. of Visu<strong>al</strong>ization ‘92,<br />
pp. 62-68, IEEE Computer Society Press, 1992<br />
[18]W.J. Schroeder, C.R. Volpe, W.E. Lorensen: “The Stream Polygon: A<br />
Technique for 3D Vector Visu<strong>al</strong>ization”, Proc. of Visu<strong>al</strong>ization ‘91, pp.<br />
126-132, IEEE Computer Society Press, 1991<br />
[19]H.-G. Pagendarm: “Flow Visu<strong>al</strong>ization Techniques in Computer<br />
Graphics” in: “Computer Graphics and Flow Visu<strong>al</strong>ization in<br />
Computation<strong>al</strong> Fluid Dynamics”, VKI lecture series monograph 1991-<br />
07, von Karman Institute for Fluid Dynamics, Rhode-St.-Genese,<br />
Belgium<br />
[20]J.P.M. Hultquist: “Interactive Numeric Flow Visu<strong>al</strong>ization Using<br />
Stream Surfaces”, Computing Systems in <strong>Engineering</strong>, 1 (2-4) 1990,<br />
[21]J.J. van Wijk: “Flow Visu<strong>al</strong>ization with Surface Particles”, IEEE<br />
Computer Graphics & Applications, July 1993<br />
[22]J.D.Anderson: "Fundament<strong>al</strong> Aerodynamics", McGraw-Hill,<br />
Singapore, 1985<br />
[23]C.M. Hung , W. Kordulla: “A Time-Split Finite-Volume Algorithm for<br />
Three-Dimension<strong>al</strong> Flowfield Simulation”, AIAA Journ<strong>al</strong>, Vol 22, No.<br />
11, Nov. 1984
3D Visu<strong>al</strong>ization of<br />
Unsteady 2D Airplane Wake Vortices<br />
Kwan�Liu Ma<br />
ICASE� Mail Stop 132C<br />
NASA Langley Research Center<br />
Hampton� Virginia<br />
Abstract<br />
Air �owing around the wing tips of an airplane forms<br />
horizont<strong>al</strong> tornado�like vortices that can be dangerous<br />
to following aircraft. The dynamics of such vortices�<br />
including ground and atmospheric e�ects� can be pre�<br />
dicted by numeric<strong>al</strong> simulation� <strong>al</strong>lowing the safety and<br />
capacity of airports to be improved. In this paper� we<br />
introduce three�dimension<strong>al</strong> techniques for visu<strong>al</strong>izing<br />
time�dependent� two�dimension<strong>al</strong> wake vortex compu�<br />
tations� and the hazard strength of such vortices near<br />
the ground. We describe a vortex core tracing <strong>al</strong>go�<br />
rithm and a loc<strong>al</strong> tiling method to visu<strong>al</strong>ize the vortex<br />
evolution. The tiling method converts time�dependent�<br />
two�dimension<strong>al</strong> vortex cores into three�dimension<strong>al</strong><br />
vortex tubes. Fin<strong>al</strong>ly� a novel approach is used toc<strong>al</strong>�<br />
culate the induced rolling moment on the following air�<br />
plane at each grid point within a region near the vortex<br />
tubes and thus <strong>al</strong>lows three�dimension<strong>al</strong> visu<strong>al</strong>ization of<br />
the hazard strength of the vortices.<br />
1 Introduction<br />
Aircraft wakes represent potenti<strong>al</strong> hazards near air�<br />
ports. This hazard is so severe that it can control<br />
the required separation between aircraft� thus limit air�<br />
port capacity. When multiple runways are used� cross�<br />
winds and density strati�cation can <strong>al</strong>ter the trajec�<br />
tories and lifetimes of these wake vortices� producing<br />
hazardous �ight conditions which can persist during<br />
subsequent �ight operations. Thus improved forecast�<br />
ing techniques could result in safer airport operation<br />
and higher passenger throughput.<br />
In laboratories� experiment<strong>al</strong> �ow visu<strong>al</strong>ization<br />
techniques have been used to <strong>al</strong>low better understand�<br />
ing of vortex interactions and of merging character�<br />
istics in multiple vortex wakes. For example� smoke<br />
and laser light sheet have been used to obtain both<br />
qu<strong>al</strong>itative and quantitative information on the evolu�<br />
tion of vortices. Up�to�date experiment<strong>al</strong> methods re�<br />
main the primary source of design information. On the<br />
Z. C. Zheng<br />
Department of Aerospace <strong>Engineering</strong><br />
Old Dominion University<br />
Norfolk� Virginia<br />
other hand� because of the advances in computation<strong>al</strong><br />
technology� numeric<strong>al</strong> predictions of wakevortices have<br />
become feasible and are beginning to produce results<br />
consistent with experiments and physic<strong>al</strong> observations.<br />
However� numeric<strong>al</strong> predictions of wake vortex trajec�<br />
tories near the ground are still di�cult. This is be�<br />
cause the �ow is unsteady and is characterized by at<br />
least one pair of moving viscous�trailing�line vortices�<br />
which respond to an essenti<strong>al</strong>ly inviscid background�<br />
but are coupled to an unsteady� viscous ground�plane�<br />
boundary�layer region. The boundary�layer region can<br />
include separated �ows during portions of the vortex<br />
wake history and thus create secondary vortices.<br />
During the development of more sophisticated nu�<br />
meric<strong>al</strong> models� appropriate visu<strong>al</strong>ization methods are<br />
needed to monitor and verify the results from numeri�<br />
c<strong>al</strong> simulations. Compared to the di�culties of experi�<br />
ment<strong>al</strong> �ow visu<strong>al</strong>ization� three�dimension<strong>al</strong> computer<br />
visu<strong>al</strong>ization is both �exible and repeatable. In this pa�<br />
per� we describe the visu<strong>al</strong>ization techniques that we<br />
have developed� <strong>al</strong>ong with development ofnumeric<strong>al</strong><br />
prediction models.<br />
Visu<strong>al</strong>ization of wake vortices can be divided into<br />
three steps� locating vortex cores� direct visu<strong>al</strong>ization<br />
of the vortices� and visu<strong>al</strong>ization of quantities asso�<br />
ciated with vortices� such asvelocity� rolling moment�<br />
etc. The identi�cation of a vortex core has been treated<br />
di�erently for di�erent types of �ows. A rigorous�<br />
widely�accepted de�nition of a vortex for unsteady� vis�<br />
cous �ows is needed �7�. Direct visu<strong>al</strong>ization of vortic�<br />
ity �elds is often misleading in recognizing the struc�<br />
ture of vortex cores.<br />
Singer and Banks used both the vorticity and pres�<br />
sure �eld to trace the skeleton line of vortices in three�<br />
dimension<strong>al</strong> transition<strong>al</strong> �ow �8�. Pressure �eld is used<br />
to correct the numeric<strong>al</strong> errors that might beintro�<br />
duced during the integration of a vorticity line. A<br />
skeleton line passes the center of vortices. Pressure<br />
�eld is <strong>al</strong>so used to determine the boundary of the vor�<br />
tex tube. Yates and Chapman examined both theo�<br />
retic<strong>al</strong>ly and computation<strong>al</strong>ly two de�nitions of vortex
cores for steady �ow� a minimum in the streamline<br />
curvature and a maximum in the norm<strong>al</strong>ized helicity<br />
�10�. However� the minimum streamline curvature does<br />
not give a viscous vortex core edge.<br />
A somewhat vague de�nition of a vortex core is a<br />
vorticity�concentrated area characterizing the viscous<br />
aspect of the vortex. We are interested in the details of<br />
the vortex core such as its size and shape that change<br />
in time. Furthermore� for our time�dependent two�<br />
dimension<strong>al</strong> data� at each time step� there is only one<br />
primary vortex and the center of vortex is well de�ned�<br />
where the maximum vorticity occurs. Our go<strong>al</strong> is to<br />
identify the boundary of the vortex core.<br />
We describe a tracing <strong>al</strong>gorithm for identifying the<br />
vortex core at each time step using both the vorticity<br />
and velocity �elds. Visu<strong>al</strong>ization of these vortex cores<br />
is done by tiling them into a tube�like surface� using<br />
a loc<strong>al</strong> surface construction <strong>al</strong>gorithm. The surface is<br />
composed of Gouraud shaded triangle strips and can<br />
be e�ciently displayed on a graphics workstation. It<br />
is colored by di�erent sc<strong>al</strong>ar �elds to examine di�erent<br />
aspects of the vortex history. Two�dimension<strong>al</strong> tech�<br />
niques such as slicing and superimposed xy�plots are<br />
<strong>al</strong>so used in conjunction with visu<strong>al</strong>ization of the vor�<br />
tex tube to present more information simultaneously.<br />
The techniques we have developed and the visu<strong>al</strong>iza�<br />
tion results we have obtained help verify and under�<br />
stand the predicted �ow �eld.<br />
An important quantity that may indicate vortex<br />
hazards is the induced rolling moment on the following<br />
airplane� which can be c<strong>al</strong>culated using the unsteady<br />
two�dimension<strong>al</strong> predicted �ow �elds� combined with<br />
lifting line theory �4�. A novel approach presented here<br />
is to c<strong>al</strong>culate the induced rolling moment on the fol�<br />
lowing airplane at each grid point within a region near<br />
the vortex tube. The resulting data <strong>al</strong>low us to com�<br />
prehend the hazard strength in three dimensions near<br />
the vortices with techniques such as direct volume ren�<br />
dering. Direct visu<strong>al</strong>ization of hazard zone in three<br />
dimensions can assist the design of aircrafts as well as<br />
the �ight control at an airport.<br />
2 Numeric<strong>al</strong> Model<br />
The di�culties related to numeric<strong>al</strong> prediction of wake<br />
vortices near the ground have been discussed by Zheng<br />
and Ash �12�. We show brie�y here the computation<strong>al</strong><br />
scheme for laminar cases. The coordinate system for<br />
this problem is shown in Figure 1. Because the problem<br />
is symmetric �without crosswind e�ects� in terms of<br />
the y�axis� only the �rst�quadrant of the �ow �eld is<br />
computed. Treating the problem as an unsteady� two�<br />
dimension<strong>al</strong> �ow� the velocity�vorticity formulation in<br />
Cartesian coordinates can be written as follows�<br />
��<br />
�t<br />
� ���U�<br />
�x<br />
���V �<br />
�<br />
�y � ���2 �<br />
�x2 � �2� � �1�<br />
�y2 x<br />
��������������������������������������<br />
��������������������������������������<br />
��������������������������������������<br />
��������������������������������������<br />
GROUND<br />
��������������������������������������<br />
Figure 1� Coordinate System.<br />
� �U<br />
�y<br />
where � � �V<br />
is the vorticity. The stream func�<br />
�x<br />
tion was governed by the Poisson equation�<br />
with<br />
U � ��<br />
�y<br />
y<br />
r 2 � � ��� �2�<br />
��<br />
and V � � � �3�<br />
�x<br />
The vorticity transport equation is integrated by using<br />
an <strong>al</strong>ternating direction implicit �ADI� scheme with<br />
upwind �ux�splitting. The Poisson equation governing<br />
the stream function is computed using Swarztrauber<br />
and Sweet�s fast Poisson solver �9�.<br />
Computations were started when the two vortices<br />
were located at X0 � 1�Y0 � 2 in non�dimension<strong>al</strong><br />
units� where one unit is one h<strong>al</strong>f�span of the initi<strong>al</strong> vor�<br />
tex pair. The initi<strong>al</strong> vortex cores were assumed to have<br />
radii of 0.2� and symmetry was employed to reduce<br />
the size of the computation<strong>al</strong> domain. A non�uniform<br />
grid� constructed by mapping a uniformly incremented<br />
exponenti<strong>al</strong> distribution into physic<strong>al</strong> space� was em�<br />
ployed� which was a 150�300 net. The grid points were<br />
packed in this manner to permit the vortex and bound�<br />
ary layer regions to be adequately resolved. A typic<strong>al</strong><br />
laminar case� used in the following discussion� requires<br />
four megaword memory and four�hour CPU time on a<br />
Cray YMP to march 180 non�dimension<strong>al</strong> time units<br />
with �t � 0.01.<br />
3 Vortex Cores<br />
The vortex core history is an important feature of wake<br />
vortex behavior. It is a way ofchecking the computa�<br />
tion<strong>al</strong> schemes used to c<strong>al</strong>culate vortex problems and<br />
to characterize the vortex decay rate. In single vor�<br />
tex cases� as shown in Figure 2� the vortex core radius<br />
is de�ned as the distance from the vortex center to<br />
the point of maximum tangenti<strong>al</strong> velocity. In the cur�<br />
rent problem� a pair of vortices interact� and at the
core boundary<br />
V tangenti<strong>al</strong><br />
0<br />
r core<br />
Figure 2� A Single Vortex Core.<br />
same time� interact with the ground boundary. The<br />
above de�nition of vortex core radius becomes vague<br />
and hard to apply in this case. The viscous interac�<br />
tion between the vortices and the ground causes de�<br />
formation of vortex cores� and thus they are no longer<br />
circular. In addition� the complicated motion of the<br />
vortex in both vertic<strong>al</strong> and later<strong>al</strong> directions� and the<br />
use of Cartesian coordinates� makes the determination<br />
of the tangenti<strong>al</strong> velocity very di�cult and somewhat<br />
misleading.<br />
We are investigating unsteady� two�dimension<strong>al</strong><br />
laminar�vortex �ows. The time dimension can be con�<br />
sidered as the vortex axi<strong>al</strong> dimension with constant<br />
speed motion in that direction. The unsteadiness� how�<br />
ever� makes visu<strong>al</strong>ization of three�dimension<strong>al</strong> vortex<br />
cores di�cult. First� the vorticity v<strong>al</strong>ues at the vortex<br />
core edge is di�erent at each time step �see Figure 3��<br />
so that isov<strong>al</strong>ue contours can not be used. Second�<br />
the same vorticity v<strong>al</strong>ues may be generated near the<br />
ground boundary and thus even within a single time<br />
frame� isov<strong>al</strong>ue contours may not reve<strong>al</strong> true vortex<br />
core shape. Fin<strong>al</strong>ly� since the vortex core changes size<br />
and shape� the number of points included in the core<br />
changes.<br />
While it is natur<strong>al</strong> to visu<strong>al</strong>ize the history of vortex<br />
cores by connecting them into a vortex tube� gener<strong>al</strong>�<br />
purpose visu<strong>al</strong>ization packages like FAST and Tecplot<br />
cannot correctly construct the desirable vortex tubes.<br />
Some preprocessing is needed to extract the tube� af�<br />
ter which we can perhaps make use of gener<strong>al</strong>�purpose<br />
visu<strong>al</strong>ization software. In the following sections� we<br />
describe a vortex core tracing <strong>al</strong>gorithm and a surface<br />
construction method� which together form such a pre�<br />
processing step.<br />
3.1 Vortex Core Tracing<br />
The vortex core tracing <strong>al</strong>gorithm developed here is<br />
based on the vorticity �eld� which is obtained di�<br />
r<br />
7.9362<br />
Vorticity<br />
6<br />
4<br />
2<br />
0<br />
�2<br />
�4<br />
�5.2167<br />
threshold v<strong>al</strong>ue<br />
6 30 90<br />
Time<br />
120 180<br />
Figure 3� Vorticity V<strong>al</strong>ues at the boundary of each<br />
Vortex Core.<br />
rectly with the vorticity�streamfunction formulation<br />
described in the previous section. The tangenti<strong>al</strong> ve�<br />
locity isnow used only at the <strong>al</strong>titude of the vortex<br />
center �de�ned as the maximum vorticity point in the<br />
region of the vortex� to determine vorticity levels at<br />
the outer edge of vortex core. The tangenti<strong>al</strong> veloc�<br />
ity at this <strong>al</strong>titude is simply the vertic<strong>al</strong> component of<br />
the velocity �eld� which can be c<strong>al</strong>culated using Equa�<br />
tion 3� once the streamfunctions have been obtained.<br />
The left and right vortex core edges have thus been de�<br />
�ned� where the maximum tangenti<strong>al</strong> velocity occurs.<br />
The average of the vorticity v<strong>al</strong>ues at these two edge<br />
points is then used to establish the upper and lower<br />
boundaries of the core around the vortex at each lat�<br />
er<strong>al</strong> positions between the two edge points� marching<br />
from left to right.<br />
Figure 3 shows typic<strong>al</strong> threshold v<strong>al</strong>ues derived from<br />
one of our test data set for locating the boundary of the<br />
vortex core at each time frame. While the maximum<br />
vorticity is 7.93 and the minimum vorticity is �5.21<br />
�near the ground�� the threshold v<strong>al</strong>ues vary between<br />
0.052 and 1.792. Therefore� the use of a single isov<strong>al</strong>ue<br />
would be inappropriate. This is <strong>al</strong>so why we cannot<br />
use gener<strong>al</strong>�purpose visu<strong>al</strong>ization software.<br />
The tracing <strong>al</strong>gorithm is c<strong>al</strong>led for each time frame<br />
�every 6 time units� saved for �ow visu<strong>al</strong>ization� and<br />
therefore a time history of the vortex core can be<br />
shown. Figure 4 summarizes the tracing <strong>al</strong>gorithm in<br />
C. Figure 5 shows a typic<strong>al</strong> contour from data obtained<br />
at time � 180 when the simulation ends. The points<br />
near the left and right edges are sparse due to the left�<br />
to�right travers<strong>al</strong> <strong>al</strong>ong the rectangular computation<strong>al</strong>�<br />
grid that we used. The �ner grid employed in y�<br />
direction is designed to resolve the ground boundary
for �t�0� t�nof�time�frames� t��� �<br />
FindCenterOfVortexCore��center�x� �center�y��<br />
FindLeftRightEdge��left�edge�x� �right�edge�x��<br />
�� find the boundary of the vortex core ��<br />
threshold��vorticity�left�edge�x� center�y��<br />
vorticity�right�edge�x�center�y���2�<br />
for �i�left�edge�x�1� i�right�edge�x� i��� �<br />
�� find the upper boundary point ��<br />
for �j�center�y� j�ydim� j���<br />
if �vorticity�i�j���threshold�<br />
� AddUpperPoints�i�j�� break� �<br />
�� find the lower boundary point ��<br />
for �j�center�y� j�0� j���<br />
if �vorticity�i�j���threshold�<br />
� AddLowerPoints�i�j�� break� �<br />
�<br />
�<br />
Figure 4� Vortex Core Tracing Algorithm.<br />
layer beneath the vortex. Redistributing points by us�<br />
ing� for example� a cubic spline� would produce a bet�<br />
ter point set for the subsequent tiling task� probably<br />
resulting in a smoother surface. Nevertheless� this ex�<br />
tra e�ort does not provide the computation<strong>al</strong> scientist<br />
with addition<strong>al</strong> information. Figure 5 <strong>al</strong>so shows that<br />
at time � 180� the vortex core has grown in size and<br />
has been deformed� from a circle to an ellipse.<br />
3.2 From Vortex Cores to a Vortex Tube<br />
After the vortex core at each time frame is located� the<br />
next task is to tile consecutive vortex cores into a vor�<br />
tex tube. We can treat these consecutive vortex cores<br />
as a set of planar contours similar to those generated in<br />
medic<strong>al</strong> imaging techniques such as computer tomog�<br />
raphy. The tiling problem for successive contours has<br />
been studied thoroughly and a summary of previous<br />
work can be found in the survey paper by Meyers et<br />
<strong>al</strong>. �6� on the subject of surfaces from contours.<br />
The e�ciency of the surface construction process<br />
and the qu<strong>al</strong>ity of surfaces generated is related to the<br />
properties of the contours. Our contours �vortex cores�<br />
have the following features�<br />
1. Contours are par<strong>al</strong>lel.<br />
2. Contours are usu<strong>al</strong>ly well <strong>al</strong>igned.<br />
3. Contours are well shaped � no severe concavity.<br />
4. Contours have no holes.<br />
5. Each contour has a well de�ned center.<br />
6. The spacing between consecutive contours need<br />
not be exact.<br />
7. Each contour may have a di�erent number of<br />
points.<br />
Figure 5� Points Forming a Vortex Core.<br />
Feature 2 indicates that the contour �vortex core�<br />
changes its shape and position gradu<strong>al</strong>ly in time. As to<br />
Feature 6� unlike� for example� in medic<strong>al</strong> applications<br />
where the distance between consecutive contours needs<br />
to be precise to make correct interpretation� the spac�<br />
ing can be less restricted. Depending on the speed of<br />
the airplane� the actu<strong>al</strong> spacing can be very large with<br />
respect to the x and y dimensions. The tot<strong>al</strong> time units<br />
taken in the simulation may be equ<strong>al</strong> to miles in the<br />
spati<strong>al</strong> dimension. So the spacing is usu<strong>al</strong>ly selected<br />
for the ease of displaying and viewing with respect to<br />
the x and y dimensions.<br />
Although Features 1�6 greatly simplify the tiling<br />
problem� Feature 7 introduces some di�culties. How�<br />
ever� two existing metrics are reported in the literature<br />
for connecting consecutive contours. The �rst was in�<br />
troduced by Cook et <strong>al</strong>. �2�� and is based on match�<br />
ing directions of points from each contour�s center of<br />
mass. The second metric was introduced by Chris�<br />
tiansen and Sederberg �1� and is based on minimiz�<br />
ing the length of diagon<strong>al</strong> between consecutive con�<br />
tours. Both of these metrics are linear�time heuristic<br />
�greedy� methods that make the best choice loc<strong>al</strong>ly�<br />
with no guarantee of �nding a glob<strong>al</strong>ly optim<strong>al</strong> result.<br />
In contrast� Fuchs et <strong>al</strong>. �3� proposes a glob<strong>al</strong>ly opti�<br />
m<strong>al</strong> solution� which is computation<strong>al</strong>ly more expensive.<br />
In practice� linear�time heuristic methods are usu<strong>al</strong>ly<br />
�good enough� and a lot faster when the contours have<br />
a lot of points.<br />
We havechosen the method proposed by Cooket<strong>al</strong>.<br />
and the result has been satisfactory. Figure 6 shows a<br />
typic<strong>al</strong> mesh generated. The sparsity of points near the<br />
left and right edges of the vortex tube results in less
Figure 6� Mesh of a Vortex Tube.<br />
desirable triangle combinations. However� this does<br />
not distract from the visu<strong>al</strong>ization of the history of the<br />
vortices.<br />
3.3 Visu<strong>al</strong>ization Results<br />
We applied the above techniques to two�dimension<strong>al</strong><br />
simulation results containing 180 time units. The vi�<br />
su<strong>al</strong>ization domain was a 140�280 non�uniform grid.<br />
The vortex tube generated was displayed on a Silicon<br />
Graphics Indigo 2. The three�dimension<strong>al</strong> graphics was<br />
implemented in GL and the user�interface was imple�<br />
mented in Motif.<br />
Plate 1 displays two color�contour slices through the<br />
vortex tube. The right�most slice shows the vorticity<br />
�eld at the �rst time frame� which touches the head<br />
of the tube. Color is mapped to vorticity and the<br />
colormap used is shown underneath. The most nega�<br />
tive vorticity v<strong>al</strong>ue is mapped to blue� zero vorticity is<br />
mapped to white� and the most positive vorticity v<strong>al</strong>ue<br />
is mapped to purple. Colors in between are linearly<br />
blended. In both Plate 1 and 2� the color of the vortex<br />
tube is mapped to vorticity v<strong>al</strong>ues� �. Consequently�<br />
the head of the tube� in the right side of the image�<br />
is more red and purple indicating high vorticity v<strong>al</strong>�<br />
ues. The xy�plot superimposed on each color�contour<br />
slice shows the vertic<strong>al</strong> velocity v<strong>al</strong>ues <strong>al</strong>ong the later<strong>al</strong><br />
line passing through the center of the vortex core. The<br />
slice taken at a later time frame in Plate 1 shows that<br />
secondary negative vorticity has been induced by the<br />
primary vortex� after which separation occurs near the<br />
ground.<br />
In Plate 2� for the contour slice at the head of the<br />
vortex tube� the colors are mapped to kinetic energy<br />
and the colormap used is shown underneath. Low ki�<br />
netic energy v<strong>al</strong>ues are mapped to white�blue and high<br />
to red�purple. V<strong>al</strong>ues in between are linearly mapped.<br />
Again� the xy�plot shows the vertic<strong>al</strong> velocity. Asyou<br />
can see� the maximum kinetic energy region does not<br />
coincide with the vortex core �unlike in the single vor�<br />
tex case�. The tube becomes bigger as vorticity de�<br />
creases with increasing time.<br />
In Plate 3� a volume rendered image of the vorticity<br />
�eld is shown. Volume rendering o�ers direct visu�<br />
<strong>al</strong>ization of complex structures and three�dimension<strong>al</strong><br />
relationships. The image was generated by treating the<br />
stack of contours as a volume� and mapping vorticity<br />
v<strong>al</strong>ues to color and opacity. By carefully selecting the<br />
color and opacity mapping� the volume rendered image<br />
<strong>al</strong>so captures a vortex tube of similar shape. Unfortu�<br />
nately� this tube is less precise and is not identic<strong>al</strong> to<br />
the one shown in Plate 1. The problem� which has<br />
been described in the previous section� is that a single<br />
mapping cannot capture the actu<strong>al</strong> vortex tube. The<br />
true edge of the tube� where the maximum tangen�<br />
ti<strong>al</strong> velocity occurs� cannot be determined with direct<br />
volume visu<strong>al</strong>ization. The tangenti<strong>al</strong> velocity plot in<br />
Plate 1 shows that edge.<br />
In Plate 4� we compare the vortex tube extracted<br />
previously by using the <strong>al</strong>gorithm described in Sec�<br />
tion 3.1 with tubes extracted by using only an isov<strong>al</strong>ue<br />
of vorticity. The image shows as meshes the vortex<br />
tube superimposed with an isosurface of vorticity. An<br />
isov<strong>al</strong>ue of 0.1 was used. As expected� the isov<strong>al</strong>ue<br />
tubes do not coincide with the vortex core tube.<br />
Further� compare the slice taken at a later time<br />
frame in Plate 1 with the volume rendered image.<br />
The color contours display the vorticity �eld around<br />
the vortex core as well as near the ground plane. As<br />
mentioned before� the vorticity �eld generated on the<br />
ground may smear the displayed vortex core in the<br />
three�dimension<strong>al</strong> image. This phenomenon is shown<br />
in the volume rendered image too. The red vortex tube<br />
�positive vorticity v<strong>al</strong>ues� is covered by a blue sheet<br />
�negative vorticity v<strong>al</strong>ues� from the bottom.<br />
The vortex tube in Plate 1 gives an intuitive� three�<br />
dimension<strong>al</strong> display of the decay ofvortex. This cer�<br />
tainly resembles results obtained from experiment<strong>al</strong><br />
�ow visu<strong>al</strong>ization and �eld observation �vapor trails�.<br />
Addition<strong>al</strong>ly� computer visu<strong>al</strong>ization may <strong>al</strong>low re�<br />
searchers to consider various atmosphere conditions<br />
such as turbulence� strati�cation and cross wind. The<br />
three�dimension<strong>al</strong> vortex tube would give a vivid pic�<br />
ture of the behavior of the vortex under those di�erent<br />
conditions.<br />
4 Vortex Hazard � Rolling Moment<br />
In order to assess the vortex hazard� some measure<br />
of hazard strength is required. Since the computa�<br />
tion<strong>al</strong> domain is an unbounded quadrant� over<strong>al</strong>l or
glob<strong>al</strong> measures of circulation or velocity levels are of<br />
little v<strong>al</strong>ue. The approach zone method used in �11�<br />
by Zheng and Ash could be meaningful in some sense�<br />
which c<strong>al</strong>culated the circulation and kinetic energy in a<br />
bounded zone. However� the approach zone was de�ned<br />
somewhat arbitrarily� and the circulation and kinetic<br />
energy were not a direct measure of the vortex haz�<br />
ard. Therefore� a more systematic method has been<br />
developed by Zheng� Ash and Greene �13�. The rolling<br />
moment induced on following aircraft by the wake vor�<br />
tex �ow �eld generated from leading aircraft is used as<br />
a measure of the hazard.<br />
In the rolling moment method� the down�wash ve�<br />
locity �eld� derived from Equation 3� is the computa�<br />
tion<strong>al</strong> result obtained from the numeric<strong>al</strong> scheme in<br />
Section 2. Following aircraft are modeled as rectangu�<br />
lar wings. In the current model� the in�uence of the fol�<br />
lowing aircraft on the upstream �ow �eld is neglected�<br />
as is the thickness of their wings. Then� employing<br />
Prandtl�s lifting line theory �4�� the induced rolling<br />
moment coe�cient can be obtained using Fourier se�<br />
ries expansions. The rolling moment data used in the<br />
following discussion required 1�200 CPU seconds on a<br />
Cray YMP.<br />
4.1 Visu<strong>al</strong>ization Results<br />
The example shown here is a case with the follow�<br />
ing airplane having the same wing span as that of the<br />
generating airplane. Since the �ow �eld is symmetric<br />
�without crosswind e�ects�� only h<strong>al</strong>f of the domain is<br />
displayed� as in the previous section. In the past� we<br />
c<strong>al</strong>culated and displayed� with xy�plot� the history of<br />
rolling moment point by point. In order to visu<strong>al</strong>ize<br />
vortex hazard of the whole �ow �eld� we use direct<br />
volume rendering of rolling moment coe�cients� as de�<br />
picted in Plate 5. Only the region near the vortex<br />
tube is rendered. The colormap used is the same as<br />
the one shown in Plate 1. The rolling moment coef�<br />
�cients visu<strong>al</strong>ized here� ranging from �0.189 to 0.054�<br />
are mapped to color and opacity. Negative v<strong>al</strong>ues are<br />
mapped to green�blue� white represents no rolling mo�<br />
ment� and positive v<strong>al</strong>ues are mapped to yellow�red�<br />
purple. Higher absolute v<strong>al</strong>ues are mapped to higher<br />
opacity. As a result� regions of lower rolling moment<br />
are more transparent and thus the region of hazard<br />
stands out.<br />
The right image in Plate 5 shows a view from the<br />
top �positive y�. Further exploration of the data can<br />
be made by using the interactive volume visu<strong>al</strong>ization<br />
techniques described in �5�. It is seen that there are<br />
regions of positive rolling moment at both the left and<br />
right sides of the region of negative rolling moment.<br />
However� the left side is very sm<strong>al</strong>l because it was an�<br />
nulled by the negative moment from the other side of<br />
the plane.<br />
It should be noted that the v<strong>al</strong>ue at each point rep�<br />
resents the rolling moment coe�cient a following air�<br />
plane experiences when the center of the wing span<br />
reaches that point in space. The following airplane<br />
is assumed to have the same size as the leading air�<br />
plane. From our results� it is found that when the<br />
following airplane is near the region of the vortex core�<br />
the rolling moment is large �negative sign�� and there�<br />
fore the hazard is more signi�cant. In fact� the loca�<br />
tion with largest negative rolling moment is the center<br />
of vortex. When it moves later<strong>al</strong>ly away from the cen�<br />
ter� the rolling moment becomes sm<strong>al</strong>ler. If it moves<br />
later<strong>al</strong>ly further to a position where only one side of<br />
the wing is in�uenced by the vortex� the rolling mo�<br />
ment sign is changed� which isphysic<strong>al</strong>ly correct. Fig�<br />
ure 7 shows such sign�change graphic<strong>al</strong>ly. When the<br />
following airplane is in di�erent positions relative to<br />
the center of the vortex� it experiences di�erent di�<br />
rection of rolling motion. In Region 2� the following<br />
airplane moves into the region around the vortex core<br />
and counterclockwise rolling motion is induced on it.<br />
In Region 1� the port side of the following airplane ex�<br />
periences the rolling motion caused by the up�wash ve�<br />
locity of the vortex� and thus has a clockwise roll� while<br />
in Region 3 a clockwise rolling motion caused by the<br />
down�wash velocity exerts on the following airplane.<br />
It is observed that the maximum positive v<strong>al</strong>ue is<br />
much sm<strong>al</strong>ler than the largest negative v<strong>al</strong>ue� so one<br />
can conclude that the most hazardous region is the<br />
region around the vortex core. On the other hand�<br />
the kinetic energy contours in Plate 2 has lower v<strong>al</strong>ues<br />
around the vortex center and higher v<strong>al</strong>ues at both<br />
the left and right sides of the vortex core. Therefore�<br />
kinetic energy cannot be used to judge the hazardous<br />
regions.<br />
Plate 6 displays two isosurfaces �blue and green�<br />
of rolling moment superimposed with the vortex tube<br />
�red� extracted previously. The isov<strong>al</strong>ues chosen are<br />
0.01 �green� and �0.01 �blue�. As an example� the v<strong>al</strong>ue<br />
of rolling moment coe�cient �0.01 can be considered as<br />
ahypothetic<strong>al</strong> hazard threshold for the following air�<br />
plane. That is� the region inside the blue tube can be<br />
treated as where the induced rolling moment on the<br />
follower is beyond its controllable capacity and there�<br />
fore the follower should avoid �ying into this region. In<br />
addition� by superimposing tubes� the resulting visu�<br />
<strong>al</strong>ization <strong>al</strong>lows us to discern the relationship between<br />
the size of the vortex core and the hazard. It is easily<br />
seen that when the core size increases� the hazardous<br />
region decreases� which explains the importance of pre�<br />
dicting correct core sizes in numeric<strong>al</strong> simulations.<br />
5 Conclusions<br />
The study of the evolution of vortices behind a wing<br />
and its potenti<strong>al</strong> hazards is of considerable interest in<br />
aeronautic design and termin<strong>al</strong> control. In addition to<br />
experiment<strong>al</strong> studies� numeric<strong>al</strong> models have <strong>al</strong>so been<br />
designed which might be used in practice for �ight<br />
control at an airport. In this research� visu<strong>al</strong>ization
y<br />
region 1<br />
region 3 region 2<br />
x<br />
region 1<br />
region 2 region 3<br />
Figure 7� Rolling Moment.<br />
techniques have been developed which <strong>al</strong>low the na�<br />
ture of numeric<strong>al</strong>ly predicted wake vortices to be seen<br />
and an<strong>al</strong>yzed. A vortex core tracing <strong>al</strong>gorithm and<br />
a tiling method have been implemented which enable<br />
researchers to interactively examine the structure of<br />
vortex cores. Rolling moment� a quantity that may be<br />
used to measure the degree of hazard� is c<strong>al</strong>culated<br />
throughout the domain of interest and visu<strong>al</strong>ized in<br />
three�dimensions using direct volume rendering.<br />
The comprehensive images generated by using these<br />
techniques suggest more intuitive ways of visu<strong>al</strong>izing<br />
wake vortices and their corresponding hazard strength.<br />
These techniques� implemented with an interactive<br />
user interface� can be used not only for researchers to<br />
tune their numeric<strong>al</strong> models� but <strong>al</strong>so for �ight control<br />
at airports. Consequently� our future work will include<br />
developing interactive visu<strong>al</strong>ization of vortex hazards<br />
and integrating the visu<strong>al</strong>ization techniques into the<br />
numeric<strong>al</strong> simulation for re<strong>al</strong>�time monitoring.<br />
Acknowledgements<br />
This work was supported by the Nation<strong>al</strong> Aeronautics<br />
and Space Administration under contract NAS1�19480<br />
and research grant NAG1�1437. The authors would<br />
like to thank Robert Ash� George Greene� Bart Singer<br />
and John Van Rosend<strong>al</strong>e for their helpful comments.<br />
References<br />
�1� Christiansen� H.� and Sederberg� T. Con�<br />
version of Complex Contour Line De�nitions into<br />
Polygon<strong>al</strong> Element Mosaics. Computer Graphics<br />
12� 2 �August 1978�� 187�192.<br />
�2� Cook� L.� Dwyer III� S. J.� Batnitzky� S.�<br />
and Lee� K. R. A Three�Dimension<strong>al</strong> Dis�<br />
play System for Diagonostic Imaging Applica�<br />
tions. IEEE Computer Graphics and Applications<br />
3� 5 �August 1983�� 13�20.<br />
�3� Fuchs� H.� Kedem� Z.� and Uselton� S. Op�<br />
tim<strong>al</strong> Surface REconstruction from Planar Con�<br />
tours. Communications of the ACM 20� 10 �Oc�<br />
torber 1977�� 693�702.<br />
�4� Karamcheti� K. Principles of Ide<strong>al</strong>�Fluid Aero�<br />
dynamics. Robert E. Krieger Publisher Co.� 1964.<br />
�5� Ma� K.�L.� Cohen� M.� and Painter� J. Vol�<br />
ume Seeds� A Volume Exploration Technique.<br />
The Journ<strong>al</strong> of Visu<strong>al</strong>ization and Computer Ani�<br />
mation 2� 4 �1991�� 135�140.<br />
�6� Meyers� D.� and Skinner� S. Surfaces from<br />
Contours. ACM Transactions on Graphics 11� 2<br />
�July 1992�� 228�258.<br />
�7� Robinson� S. K. A Review of Vortex Structures<br />
and Associated Coherent Motions in Turbulent<br />
Boundary Layers. In Proceedings of Second IU�<br />
TAM Symposium on Structure ofTurbulence and<br />
Drag Reduction �July 1989�� pp. 23�50.<br />
�8� Singer� B. A.� and Banks� D. C. A Predictor�<br />
Corrector Scheme for Vortex Identi�cation. Tech.<br />
rep.� Institute for Computer Applications in Sci�<br />
ence and <strong>Engineering</strong>� 1994. ICASE Report 94�11.<br />
�9� Swarztrauber� P.� and Sweet� R. A. E��<br />
cient FORTRAN subprograms for the solution of<br />
Separable Elliptic Parti<strong>al</strong> Di�erenti<strong>al</strong> Equations.<br />
ACM Trans. on Math. 5 �1979�� 352�364.<br />
�10� Yates� L.� and Chapman� G. Streamlines� Vor�<br />
ticity Lines� and Vortices. In 29th Aerospace Sci�<br />
ences Meeting �January 1991�� American Institute<br />
of Aeronautics and Astronautics. AIAA Paper 91�<br />
0731.<br />
�11� Zheng� Z. C.� and Ash� R. L. Viscous Ef�<br />
fects on a Vortex Wake in Ground E�ect. In<br />
Proceedings of the Aircraft Wake Vortices Con�<br />
ference �Octorber 1991�� pp. 31.1�31.30. Wash�<br />
ington� D.C.<br />
�12� Zheng� Z. C.� and Ash� R. L. Prediction of<br />
Turbulent Wake Vortex Motion. In Proceedings of<br />
the Fluids <strong>Engineering</strong> Conference �1993�� L. Kr<strong>al</strong><br />
and T. Zang� Eds.� American Society of Mechani�<br />
c<strong>al</strong> Engineers� pp. 195�207. Transition<strong>al</strong> and Tur�<br />
bulent Compressible Flows� FED�Vol. 151.<br />
�13� Zheng� Z. C.� Ash� R. L.� and Greene� G. C.<br />
A Study of the In�uence of Cross Flow on the Be�<br />
havior of Aircraft WakeVortices Near the Ground.<br />
In the 19th Congress of the Internation<strong>al</strong> Council<br />
of the Aeronautic<strong>al</strong> Sciences� Anaheim� C<strong>al</strong>ifornia.
Plate 1: Vortex tube and vorticity cut planes.<br />
Plate 3: Direct volume rendering of vorticity field.<br />
Plate 5: Direct volume rendering of rolling moment.<br />
Plate 2:Vortex tube and kinetic energy cut plane.<br />
Plate 4: Vorticity (blue).<br />
Plate 6: Rolling moment (blue, green).
Abstract<br />
A new <strong>al</strong>gorithm for identifying vortices in complex flows<br />
is presented. The scheme uses both the vorticity and pressure<br />
fields. A skeleton line <strong>al</strong>ong the center of a vortex is<br />
produced by a two-step predictor-corrector scheme. The<br />
technique uses the vector field to move in the direction of<br />
the skeleton line and the sc<strong>al</strong>ar field to correct the location<br />
in the plane perpendicular to the skeleton line. With<br />
an economic<strong>al</strong> description of the vortex tube’s cross-section,<br />
the skeleton compresses the representation of the<br />
flow by a factor of 4000 or more. We show how the reconstructed<br />
geometry of vortex tubes can be enhanced to<br />
help visu<strong>al</strong>ize helic<strong>al</strong> motion.<br />
1 Introduction<br />
Vortex Tubes in Turbulent Flows:<br />
Identification, Representation, Reconstruction<br />
Vortices are considered the most important structures<br />
that control the dynamics of flow fields. Large-sc<strong>al</strong>e vortices<br />
are responsible for hurricanes and tornadoes.<br />
Medium-sc<strong>al</strong>e vortices affect the handling characteristics<br />
of an airplane. Sm<strong>al</strong>l-sc<strong>al</strong>e vortices are the fundament<strong>al</strong><br />
building blocks of the structure of turbulent flow. One<br />
would like, therefore, to visu<strong>al</strong>ize a flow by locating <strong>al</strong>l of<br />
its vortices and displaying them.<br />
This paper presents a novel predictor-corrector technique<br />
for locating vortex structures in three-dimension<strong>al</strong><br />
flow data. The technique is effective at locating vortices<br />
even in turbulent flow data. As an addition<strong>al</strong> benefit, the<br />
technique provides a terse, one-dimension<strong>al</strong> representation<br />
of vortex tubes which offers significant compression<br />
of the flow data. Such compression is important if one<br />
wishes to visu<strong>al</strong>ize unsteady (i.e., time-varying) flows<br />
interactively.<br />
*Institute for Computer Applications in Science and <strong>Engineering</strong>, MS<br />
132C, NASA Langley Research Center, Hampton, VA 23681<br />
(banks@icase.edu). Work supported under contract NAS1-19480.<br />
**High Technology Corporation, MS 156, NASA Langley Research<br />
Center, Hampton, VA 23681 (b.a.singer@larc.nasa.gov). Work supported<br />
by the Theoretic<strong>al</strong> Flow Physics Branch at NASA Langley<br />
Research Center under contract NAS1-20059.<br />
David C. Banks* and Bart A. Singer**<br />
Section 2 presents a survey of the efforts by various<br />
other researchers to define mathematic<strong>al</strong> characteristics<br />
satisfied by vortices. Section 3 presents our predictor-corrector<br />
scheme for identifying vortices and discusses some<br />
of the programming considerations that are necessary to<br />
make the scheme efficient. Section 4 describes how we<br />
c<strong>al</strong>culate the cross-sections of the vortex tube and how<br />
we represent them. In section 5 we show how the vortex<br />
skeletons, together with an efficient representation of the<br />
cross-sections, offer a substanti<strong>al</strong> amount of data compression<br />
to represent features of a flow. We then describe<br />
the process of reconstructing the vortex tubes from the<br />
compressed format and show an enhanced reconstruction<br />
that helps visu<strong>al</strong>ize the motion of the fluid <strong>al</strong>ong the vortex<br />
tube.<br />
2 Survey of Identification Schemes<br />
The term “vortex” connotes a similar concept in the<br />
minds of most fluid dynamicists: a helic<strong>al</strong> pattern of flow<br />
in a loc<strong>al</strong>ized region. There are mathematic<strong>al</strong> definitions<br />
for “vorticity” and “helicity,” but vortic<strong>al</strong> flow is not<br />
completely characterized by them. For example, a shear<br />
flow exhibits vorticity at every point even though there is<br />
no vortic<strong>al</strong> motion. A precise definition for a vortex is<br />
difficult to obtain — a fact supported by the variety of<br />
efforts outlined below.<br />
Spir<strong>al</strong> Moving With the Core<br />
Robinson [1] suggests the following working definition<br />
for a vortex.<br />
A vortex exists when instantaneous streamlines mapped<br />
onto a plane norm<strong>al</strong> to the vortex core exhibit a roughly<br />
circular or spir<strong>al</strong> pattern, when viewed from a reference<br />
frame moving with the center of the vortex core.<br />
Robinson [2] and Robinson, Kline, and Sp<strong>al</strong>art [3] use the<br />
above rigorous definition to confirm that a particular<br />
structure is, in fact, a vortex. Unfortunately, this definition<br />
requires a knowledge of the vortex core before one<br />
can determine whether something is a vortex.<br />
Low Pressure<br />
Robinson and his colleagues find that elongated lowpressure<br />
regions in incompressible turbulent flows <strong>al</strong>most
<strong>al</strong>ways indicate vortex cores. Isosurfaces of low pressure<br />
are usu<strong>al</strong>ly effective at capturing the shape of an individu<strong>al</strong><br />
vortex (Figure 1a). Pressure surfaces become indistinct<br />
where vortices merge, however, and a high-qu<strong>al</strong>ity<br />
image can easily require thousands of triangles to create<br />
the surface. The need to compress the representation<br />
becomes acute when visu<strong>al</strong>izing time-varying data.<br />
Vorticity Lines<br />
Vorticity is a vector quantity that is proportion<strong>al</strong> to<br />
the angular velocity of a fluid particle. It is defined as<br />
ω = ∇ × u<br />
where u is the velocity at a given point. Vorticity lines are<br />
integr<strong>al</strong> curves of vorticity (Figure 3). Moin and Kim [4]<br />
[5] use vorticity lines to visu<strong>al</strong>ize vortic<strong>al</strong> structures in<br />
turbulent channel flow. The resulting curves are<br />
extremely sensitive to the choice of initi<strong>al</strong> location x 0 for<br />
the integration. As Moin and Kim point out [4],<br />
If we choose x 0 arbitrarily, the resulting vortex line is<br />
likely to wander over the whole flow field like a badly<br />
tangled fishing line, and it would be very difficult to<br />
identify the organized structures (if any) through which<br />
the line may have passed.<br />
They illustrate the potenti<strong>al</strong> tangle in Figure 2 of [5].<br />
To avoid such a confusing jumble, they carefully select<br />
the initi<strong>al</strong> points. However, Robinson [2] shows that even<br />
experienced researchers can be surprisingly misled by<br />
ordinary vorticity lines.<br />
Cylinder With Maximum Vorticity<br />
Villasenor and Vincent [6] present an <strong>al</strong>gorithm for<br />
locating elongated vortices in three-dimension<strong>al</strong> timedependent<br />
flow fields. They start from a seed point and<br />
compute the average length of <strong>al</strong>l vorticity vectors contained<br />
in a sm<strong>al</strong>l-radius cylinder. They repeat this step for<br />
a large number of cylinders that emanate from the seed<br />
point. The cylinder with the maximum average becomes<br />
a segment of the vortex tube. They use only the magnitudes<br />
(not the directions) of vorticity; as a consequence<br />
the <strong>al</strong>gorithm can inadvertently capture structures that are<br />
not vortices.<br />
Vorticity and Vortex Stretching<br />
Zabusky et <strong>al</strong>. [7] use vorticity |ω| and vortex<br />
stretching |ω ⋅ ∇u| /|ω| in an effort to understand the<br />
dynamics of a vortex reconnection process. They fit ellipsoids<br />
to the regions of high vorticity. Vector field lines of<br />
vorticity and of vortex stretching emanate from the ellipsoids.<br />
In flows with solid boundaries or a mean straining<br />
field, the regions with large vorticity magnitudes do not<br />
necessarily correspond to vortices (Figure 1b); hence, the<br />
ellipsoids do not <strong>al</strong>ways provide useful information.<br />
(a)<br />
(b)<br />
(c)<br />
(d)<br />
(e)<br />
Figure 1. Different schemes used to identify a vortex. From top:<br />
(a) isosurface of constant pressure; (b) isosurfaces of constant<br />
vorticity; (c) isosurfaces of complex-v<strong>al</strong>ued eigenv<strong>al</strong>ues of the<br />
velocity-gradient matrix; (d) isosurface of constant helicity; (e)<br />
spir<strong>al</strong>-saddles (dark lines) compared with isopressure vortex<br />
tube (p<strong>al</strong>e surface). A reconstruction based on our method is<br />
shown in Figure 8. Each image visu<strong>al</strong>izes the same flow.<br />
Velocity Gradient Tensor<br />
Chong, Perry, and Cantwell [8] define a vortex core<br />
as a region where the velocity-gradient tensor has complex<br />
eigenv<strong>al</strong>ues. In such a region, the rotation tensor<br />
dominates over the rate-of-strain tensor. Soria and<br />
Cantwell [9] use this approach to study vortic<strong>al</strong> structures<br />
in free-shear flows. At points of large vorticity, the eigen-
v<strong>al</strong>ues of the velocity-gradient matrix are determined: a<br />
complex eigenv<strong>al</strong>ue suggests the presence of a vortex.<br />
This method correctly identifies the large vortic<strong>al</strong><br />
structures in the flow. However, the method <strong>al</strong>so captures<br />
many sm<strong>al</strong>ler structures without providing a way to link<br />
the sm<strong>al</strong>ler vortic<strong>al</strong> volumes with the larger coherent vortices<br />
of which they might be a part (Figure 1c).<br />
Curvature and Helicity<br />
Yates and Chapman [10] carefully explore two definitions<br />
of vortex cores. Unfortunately, the an<strong>al</strong>yses and<br />
conclusions for both definitions are appropriate only for<br />
steady flows.<br />
By one definition, the vortex core is the line defined<br />
by the loc<strong>al</strong> maxima of norm<strong>al</strong>ized helicity (the dot product<br />
of the norm<strong>al</strong>ized velocity and vorticity). Figure 1d<br />
shows an isosurface of constant helicity. Notice that the<br />
surface fails to capture the “head” on the upper-right side<br />
of the hairpin vortex. This shows that the loc<strong>al</strong> maxima<br />
fail to follow the core.<br />
In the other definition, a vortex core is an integr<strong>al</strong><br />
curve that has minimum curvature. If there is a critic<strong>al</strong><br />
point on a vortex core, then that point must be a spir<strong>al</strong>saddle.<br />
The eigenvector belonging to the only re<strong>al</strong> eigenv<strong>al</strong>ue<br />
of the spir<strong>al</strong>-saddle corresponds, loc<strong>al</strong>ly, to an integr<strong>al</strong><br />
curve entering or leaving the critic<strong>al</strong> point. By<br />
integrating this curve, the entire vortex core may be visu<strong>al</strong>ized<br />
[11]. Figure 1e, however, shows that these curves<br />
can miss the vortex completely. (The red spot is a critic<strong>al</strong><br />
point; the horizont<strong>al</strong> integr<strong>al</strong> curves are colored blue).<br />
User-guided Search<br />
Bernard, Thomas, and Handler [12] use a semi-automated<br />
procedure to identify quasi-streamwise vortices.<br />
Their method finds loc<strong>al</strong> centers of rotation in user-specified<br />
regions in planes perpendicular to the streamwise<br />
direction of a turbulent channel flow. Experienced users<br />
can correctly find the critic<strong>al</strong> vortices responsible for the<br />
maintenance of the Reynolds stress. Their method captures<br />
the vortices that are <strong>al</strong>igned with the streamwise<br />
direction, but in free-shear layers and transition<strong>al</strong> boundary<br />
layers, the significant spanwise vortices go undetected.<br />
Because it depends heavily on user intervention, the<br />
process is tedious and is dependent upon the individu<strong>al</strong><br />
skill of the user.<br />
3 The Predictor-corrector Method<br />
The methods listed above <strong>al</strong>l experience success in<br />
finding vortices under certain flow conditions. But <strong>al</strong>l of<br />
them have problems capturing vortices in unsteady shear<br />
flow, which is of interest to us because of its importance<br />
in understanding the transition from laminar to turbulent<br />
flow. We were led, therefore, to develop another tech-<br />
nique which could tolerate the complexity of such a transition<strong>al</strong><br />
flow.<br />
Our predictor-corrector method produces an ordered<br />
set of points that approximates a vortex skeleton. Associated<br />
with each point are quantities that describe the loc<strong>al</strong><br />
characteristics of the vortex. These quantities may<br />
include the vorticity, the pressure, the shape of the crosssection,<br />
or other quantities of interest. This method produces<br />
lines that are similar to vorticity lines, but with an<br />
important difference. Whereas vorticity is a mathematic<strong>al</strong><br />
function of the instantaneous velocity field, a vortex is a<br />
physic<strong>al</strong> structure with coherence over a region of space.<br />
In contrast to vorticity lines (which may wander away<br />
from the vortex cores), our method is self-correcting: line<br />
trajectories that diverge from the vortex core reconverge<br />
to the center.<br />
In this section we discuss the procedure used to find<br />
an initi<strong>al</strong> seed point on the vortex skeleton. We then<br />
explain the predictor-corrector method used for growing<br />
the vortex skeleton from the seed point. Fin<strong>al</strong>ly, we<br />
address how to terminate the vortex skeleton.<br />
3.1 Finding a Seed Point<br />
Vorticity lines begin and end only at domain boundaries,<br />
but actu<strong>al</strong> vortices have no such restriction. Therefore<br />
we must examine the entire flow volume in order to<br />
find seed points from which to initiate vortex skeletons.<br />
We consider low pressure and a large magnitude of vorticity<br />
to indicate that a vortex is present. Low pressure in<br />
a vortex core provides a pressure gradient that offsets the<br />
centripet<strong>al</strong> acceleration of a particle rotating about the<br />
core. Large vorticity indicates that such rotation is probably<br />
present.<br />
In our implementation, the flow field (a three-dimension<strong>al</strong><br />
rectilinear grid) is scanned in planes perpendicular<br />
to the streamwise direction. The scanning direction<br />
affects the order in which vortices are located, but not the<br />
over<strong>al</strong>l features of the vortices. In each plane, the v<strong>al</strong>ues<br />
of the pressure and the vorticity magnitude are checked<br />
against threshold v<strong>al</strong>ues of these quantities. (Threshold<br />
v<strong>al</strong>ues can be chosen a priori, or they can be a predetermined<br />
fraction of the extrema.) A seed point is a grid<br />
point that satisfies the two threshold v<strong>al</strong>ues.<br />
We next refine the position of the seed point so that it<br />
is not constrained to lie on the grid. The seed point moves<br />
in the plane perpendicular to the vorticity vector until it<br />
reaches the location of the loc<strong>al</strong> pressure minimum. From<br />
this seed point we develop the vortex skeleton in two<br />
parts: forward and backward.<br />
3.2 Growing the Skeleton<br />
Once a seed point has been selected, the skeleton of<br />
the vortex core can be grown from the seed. This is where
(1) (2)<br />
p i<br />
ω i<br />
Compute the vorticity at a<br />
point on the vortex core.<br />
(3) ωi+1 (4)<br />
Compute the vorticity at the<br />
predicted point.<br />
p i+1<br />
Figure 2. Four steps of the predictor-corrector <strong>al</strong>gorithm.<br />
p i+1<br />
Step in the vorticity direction<br />
to predict the next point.<br />
we apply the two-stage predictor-corrector method. With<br />
this technique, the next position of the vortex skeleton is<br />
predicted by integrating <strong>al</strong>ong the vorticity vector. This<br />
candidate location is corrected by adjusting the position<br />
to the pressure minimum in the plane that is perpendicular<br />
to the vorticity vector. The ration<strong>al</strong>e is that rotation<br />
about the vorticity vector is supported by low pressure at<br />
its center: the vortex tube’s cross-section has its lowest<br />
pressure at the center of the tube. Integr<strong>al</strong> curves of vorticity<br />
or of the pressure gradient are both unreliable at<br />
capturing vortex skeletons. Remarkably, the combination<br />
of the two provides a robust method of following the vortex<br />
core. The continuous modification of the skeleton<br />
point lessens the sensitivity to both the initi<strong>al</strong> conditions<br />
and the integration details.<br />
The predictor-corrector <strong>al</strong>gorithm is illustrated in the<br />
schematic diagrams of Figure 2. The details for continuing<br />
the c<strong>al</strong>culation from one point to the next are indicated<br />
by the captions. Steps 1-2 represent the predictor<br />
stage of the <strong>al</strong>gorithm. The corrector stage is summarized<br />
by steps 3-4.<br />
The effectiveness of the predictor-corrector scheme<br />
is illustrated in Figure 3, in which data from the direct<br />
numeric<strong>al</strong> simulations of Singer and Joslin [13] are an<strong>al</strong>yzed.<br />
The transparent vortex tube (a portion of a hairpin<br />
vortex) is constructed with data from the full predictorcorrector<br />
method. Its core is indicated by the darker skeleton.<br />
The lighter skeleton follows the uncorrected integr<strong>al</strong><br />
curve of the vorticity. It is obtained by disabling the<br />
corrector phase of the scheme. The vorticity line deviates<br />
from the core, exits the vortex tube entirely, and wanders<br />
within the flow field.<br />
P<br />
Correct to the pressure min in<br />
the perpendicular plane.<br />
Figure 3. Vorticity line (light) compared to predictor-corrector line<br />
(dark). Note that the vorticity line exits from the vortex tube while<br />
the predictor-corrector skeleton line follows the core<br />
3.3 Terminating the Vortex Skeleton<br />
Vorticity lines extend until they intersect a domain<br />
boundary, but re<strong>al</strong> vortices typic<strong>al</strong>ly begin and end inside<br />
the domain. Therefore, the <strong>al</strong>gorithm must <strong>al</strong>ways be prepared<br />
to terminate a given vortex skeleton. A simple and<br />
successful condition for termination occurs when the vortex<br />
cross-section (discussed in section 4) has zero area.<br />
As Figures 3 and 7 show, the reconstructed vortex tubes<br />
taper down to their endpoints (where the cross-section<br />
vanishes).<br />
3.4 Implementation Details<br />
Although the gener<strong>al</strong> behavior of the predictor-corrector<br />
<strong>al</strong>gorithm is reliable and robust, optim<strong>al</strong> performance<br />
of the technique requires careful attention to<br />
implementation details. This section addresses issues that<br />
are important to the successful use of this method. It is by<br />
no means exhaustive; addition<strong>al</strong> details are provided by<br />
Singer and Banks [15].<br />
Eliminating Redundant Seeds and Skeletons<br />
Sampling every grid point produces an overabundance<br />
of seed points, and hence a multitude of nearlycoincident<br />
vortex skeletons (Figure 4). Each of these<br />
skeletons lies at the core of the very same vortex tube;<br />
one representative skeleton suffices. The redundancies<br />
are eliminated when points inside a tube are excluded<br />
from the pool of future seed points. We accomplish this<br />
by flagging any cell (in the computation<strong>al</strong> 3D grid) that is<br />
found to lie in a vortex tube. Future seed points must not<br />
be flagged.
Figure 4. Multiple re<strong>al</strong>izations of the same vortex tube from different<br />
seed points. Each seed point generates a slightly different<br />
skeleton line, <strong>al</strong>though <strong>al</strong>l the skeletons remain close to the vortex<br />
core.<br />
Eliminating Spurious Feeders<br />
A seed near the surface of the vortex tube can produce<br />
a “feeder” vortex skeleton that spir<strong>al</strong>s toward the<br />
vortex center. Intuitively, most of these are seeds that<br />
should have been flagged, but were missed because they<br />
lie near the boundary of a vortex tube. Examples of these<br />
feeders are illustrated in Figure 5. We eliminate feeders<br />
by taking advantage of the fact that the predictor-corrector<br />
method is convergent to the vortex core. A feeder<br />
skeleton, begun on the surface of the tube, grows toward<br />
the core; by contrast, a skeleton growing <strong>al</strong>ong the core<br />
does not exit through the surface of the tube. To v<strong>al</strong>idate<br />
a candidate seed p 0 , we integrate forward n steps to the<br />
point p n and then backward again by n steps. If we return<br />
very close to p 0 then it is a “true” seed point.<br />
Numeric<strong>al</strong> Considerations for Interpolation<br />
Neither the predictor nor the corrector step is likely<br />
to land precisely on a grid point; hence, we must interpolate<br />
the pressure and vorticity at arbitrary locations in the<br />
flow field. To reduce any bias from the interpolation, a<br />
four-point Lagrange interpolation is used in each of the<br />
three coordinate directions. The interpolation scheme<br />
works quite well, <strong>al</strong>though it is the most expensive step in<br />
our implementation.<br />
The interpolation scheme makes the predictor-corrector<br />
method at least first-order accurate: skeleton points<br />
are located to within the sm<strong>al</strong>lest grid dimension. This<br />
ensures that, on data sets with well-resolved vorticity and<br />
pressure, the method successfully locates vortex cores.<br />
Figure 5. Feeders merge with a large-sc<strong>al</strong>e hairpin vortex. Three<br />
points that satisfy the threshold criteria lie on the edge of vortex<br />
tube. Their trajectories curve inward toward the core and then follow<br />
the main skeleton line.<br />
Corrector Step<br />
The pressure-minimum correction scheme uses the<br />
method of steepest descent to find the loc<strong>al</strong> pressure minimum<br />
in the plane perpendicular to the vorticity vector.<br />
The sm<strong>al</strong>lest grid-cell dimension is used as a loc<strong>al</strong> length<br />
sc<strong>al</strong>e to march <strong>al</strong>ong the gradient direction.<br />
The corrector phase can be iterated in order to converge<br />
to the skeleton, but that convergence is not guaranteed.<br />
We therefore limit the angle that the vorticity can<br />
change during a repeated iteration of the corrector phase.<br />
In the case of overshooting the limit, we simply quit the<br />
corrector phase. We could choose a sm<strong>al</strong>ler step-size and<br />
retry, but we have not found this to be necessary.<br />
4 Finding the Cross-section<br />
Since it is unclear how to precisely define what<br />
points lie in a vortex, it is <strong>al</strong>so unclear how to determine<br />
the exact shape of a vortex tube’s cross-section. Determining<br />
an appropriate measure of the vortex cross-section<br />
has been one of the more difficult practic<strong>al</strong> aspects of<br />
this work.<br />
A point on the vortex skeleton serves as a convenient<br />
center for a polar coordinate system in the plane perpendicular<br />
to the skeleton line. We have chosen therefore to<br />
characterize the cross-section by a radius function. Note<br />
that this scheme correctly captures star-shaped cross-sections.<br />
Cross-sections with more elaborate shapes are truncated<br />
to star shapes (with discontinuities in the radius<br />
function). In practice this choice does not seem to be very<br />
restrictive, as section 4.2 indicates.
In examining the cross-section plane there are two<br />
important questions to address. First, what determines<br />
whether a point in the plane belongs to the vortex tube?<br />
Second, how should the shape of the tube’s cross-section<br />
be represented? This section summarizes the strategies<br />
that we found to be successful.<br />
4.1 Criteria for Determining Membership<br />
For isolated vortices, a threshold of pressure provides<br />
an effective criterion to determine whether a point<br />
belongs to a vortex. When two or more vortices interact,<br />
their low-pressure regions merge and distort the radius<br />
estimate of any single vortex. This difficulty is resolved if<br />
the angle between the vorticity vector on the skeleton line<br />
and the vorticity vector at any radi<strong>al</strong> position is restricted.<br />
Any angle greater than 90 degrees indicates that the fluid<br />
at the radi<strong>al</strong> position is rotating in the direction opposite<br />
to that in the core. We have found that the 90-degree<br />
restriction works well in combination with a low-pressure<br />
criterion for the vortex edge.<br />
For the actu<strong>al</strong> computation of the radi<strong>al</strong> distance, the<br />
pressure and the vorticity are sampled <strong>al</strong>ong radi<strong>al</strong> lines,<br />
emanating from the skeleton, lying in the perpendicular<br />
plane. We step <strong>al</strong>ong each radi<strong>al</strong> line until a point is<br />
reached that violates the vorticity or the pressure-threshold<br />
criterion.<br />
4.2 Representation of the Cross-section<br />
If the radius of the cross-section were sampled at 1degree<br />
increments, then 360 radi<strong>al</strong> distances (and a reference<br />
vector to define the 0-degree direction) would be<br />
associated with each skeleton point. That is a great de<strong>al</strong><br />
of data to save for each point of a time-varying set of vortex<br />
skeletons. We have found that average radius is sufficient<br />
to describe the cross-section of an isolated vortex<br />
tube.<br />
When vortices begin to interact, the cross-section is<br />
non-circular and so the average radius does not provide a<br />
good description of it. A truncated Fourier series of the<br />
radi<strong>al</strong> distance provides a convenient compromise<br />
between the average radius and a full set of <strong>al</strong>l radi<strong>al</strong><br />
locations. The series is easy to compute, easy to interpret,<br />
and <strong>al</strong>lows a large range of cross-section<strong>al</strong> shapes. In our<br />
work, we keep the constant term, the first and second sine<br />
and cosine coefficients, and a reference vector. Most of<br />
the cases that we have checked have a factor-of-10 drop<br />
in the magnitude of the first and second coefficients, indicating<br />
that the neglected terms are not significant. That<br />
observation <strong>al</strong>so v<strong>al</strong>idates our assumption that the crosssection<br />
is well-represented by a continuous polar function.<br />
Figure 6 illustrates a single cross section of a vortex<br />
educed from direct numeric<strong>al</strong> simulation data. The<br />
Figure 6. Comparison of different ways to represent the crosssection<br />
of a vortex tube. The shaded region is the finely-sampled<br />
radius function. The thin line is an approximating circle. The thick<br />
line is a 5-term Fourier representation.<br />
shaded region is the interior of the vortex tube, sampled<br />
at 1-degree interv<strong>al</strong>s. The thin line is a circle, centered at<br />
the skeleton, using the averaged radius of the vortex tube.<br />
The thick line is the truncated Fourier series representation<br />
of the vortex cross-section, providing a better<br />
approximation than the circle.<br />
5 Data Compression & Reconstruction<br />
Our particular interest is to visu<strong>al</strong>ize the transition to<br />
turbulence in a shear flow. We have performed a lengthy<br />
simulation using Cray computers over the course of two<br />
c<strong>al</strong>endar years, using about 2000 Cray2 hours of processing<br />
time. The numeric<strong>al</strong> grid grows with the size of the<br />
evolving flow structures, but a grid size of 461×161×275<br />
in streamwise, w<strong>al</strong>l-norm<strong>al</strong>, and spanwise directions is<br />
representative. Each grid point holds sever<strong>al</strong> numeric<strong>al</strong><br />
quantities, including pressure and vorticity. Thus the storage<br />
exceeds 650 MB (megabytes) of data per time step.<br />
By using vortex skeletons we are able to compress<br />
the data significantly and then reconstruct the vortex<br />
tubes loc<strong>al</strong>ly on a workstation.<br />
5.1 Compression<br />
An animation of the vortices, based on the origin<strong>al</strong><br />
computation<strong>al</strong> volumetric data, would consume over<br />
650 GB of data for 1000 time steps. At present this is a<br />
prohibitive requirement of an interactive 3D animation<br />
on a workstation. Storing <strong>al</strong>l the individu<strong>al</strong> polygons<br />
offers some compression, but not enough to bring an animation<br />
within reach.<br />
In gener<strong>al</strong>, a vortex skeleton is adequately represented<br />
by 30 to 200 samples. The complex scene in Figure<br />
7 is represented by about 2000 skeleton points, each
Figure 7. Interacting vortices (from a numeric<strong>al</strong> simulation)<br />
within a complex flow are identified with the predictor-corrector<br />
<strong>al</strong>gorithm. The b<strong>al</strong>l to the upper left represents the light source.<br />
endowed with 72 bytes of data (representing position,<br />
tangent, norm<strong>al</strong>, binorm<strong>al</strong>, cross-section, and velocity<br />
magnitude). Thus a reduction from 650 MB to 144 KB is<br />
achieved, representing more than a 4000-fold factor of<br />
compression. This amount of compression offers the<br />
promise of workstation-based interactive animations,<br />
even for a 1000-frame simulation.<br />
5.2 Reconstruction<br />
The significant data-compression that vortex skeletons<br />
provide does not come without cost. There is still the<br />
matter of reconstructing polygon<strong>al</strong> tubes from the skeletons.<br />
If the tubes have circular cross-sections, they are<br />
gener<strong>al</strong>ized cylinders. Bloomenth<strong>al</strong> gives a clear exposition<br />
of how to reconstruct a gener<strong>al</strong>ized cylinder from a<br />
curve through its center [14]. The coordinate system of<br />
the cross-section rotates from one skeleton point to the<br />
next. The key issue is how to keep the rate of rotation<br />
(about the skeleton’s tangent vector) sm<strong>al</strong>l. Excessive<br />
twist is visible in the polygons that comprise the tube:<br />
they become long and thin and their interiors approach<br />
the center of the tube.<br />
In our implementation, we project the coordinate<br />
bases from one cross-section onto the next cross-section.<br />
This produces a new coordinate system that has not<br />
twisted very much. This norm<strong>al</strong> vector might be different<br />
from the reference vector (which indicates the 0-degree<br />
direction) for the Fourier representation of the cross-section.<br />
To reconstruct the cross-section, we phase-shift the<br />
angle in the Fourier series by the angular difference<br />
between the norm<strong>al</strong> and the reference vector. In gener<strong>al</strong>,<br />
30 to 80 samples suffice to reconstruct a cross-section of<br />
good qu<strong>al</strong>ity.<br />
Sometimes there is good reason for a “reconstruction”<br />
that is not faithful to the origin<strong>al</strong> shape of the vortex<br />
tube. A static image does not convey the spir<strong>al</strong>ing motion<br />
Figure 8. Enhanced reconstruction of a hairpin vortex tube. The<br />
grooves follow integr<strong>al</strong> curves of velocity, constrained to follow<br />
the surface of the tube.<br />
<strong>al</strong>ong the surface of the vortex tube. We experimented<br />
with different methods of visu<strong>al</strong>izing the velocities on the<br />
tube itself. One helpful technique is to create a texture on<br />
the surface, drawing curves to indicate the helic<strong>al</strong> flow.<br />
This visu<strong>al</strong>ization is enhanced dramatic<strong>al</strong>ly when the<br />
curves are displaced inward to produce grooves. Figure 8<br />
demonstrates this technique on a single hairpin vortex.<br />
The grooves follow integr<strong>al</strong> curves of the surface-constrained<br />
velocity vectors. In an inform<strong>al</strong> survey of about a<br />
dozen colleagues, we found that none could estimate the<br />
amount of helic<strong>al</strong> motion in a faithful reconstruction (as<br />
in Figures 3 and 7) of a vortex tube. On the other hand,<br />
the same subjects instantly identified the direction and<br />
amount of rotation in the enhanced image of Figure 8.<br />
There are two important issues in reconstruction that<br />
we have not yet addressed in our implementation; both<br />
relate to the representation and compression of the vortices<br />
as well. First, we would like to minimize the number<br />
of samples carried by a vortex skeleton. Where the vortex<br />
skeleton has high curvature or where the cross-section<br />
changes shape quickly, many samples are required to permit<br />
an accurate reconstruction. But most vortex tubes<br />
have long, straight portions with nearly-circular crosssections<br />
of nearly-constant radius. This characteristic<br />
should permit us to represent the vortex tube with fewer<br />
samples <strong>al</strong>ong its skeleton.<br />
The second issue concerns interpolation. In reviewing<br />
the development of a vortic<strong>al</strong> flow, a scientist may be<br />
especi<strong>al</strong>ly interested in narrowing the interv<strong>al</strong> of animation<br />
to only a few of the origin<strong>al</strong> time steps. It would be<br />
helpful to generate in-between frames from the given<br />
data. We could interpolate the origin<strong>al</strong> volumetric grids to<br />
extract interpolated vortex skeletons, but that would<br />
require a great de<strong>al</strong> of data communication. Interpolating<br />
between the skelet<strong>al</strong> representations, on the other hand,<br />
could be done in memory. Unfortunately, it is difficult to
interpolate between irregular branching structures like<br />
the time-varying vortex skeletons. It would be helpful to<br />
reconstruct the topology of the vortex tubes as they<br />
appear, branch, merge, and disappear over time. These<br />
issues remain as future work.<br />
Conclusions<br />
The innovative use of a two-step predictor-corrector<br />
<strong>al</strong>gorithm has been introduced to identify vortices in<br />
flow-field data. Unlike other approaches, our method is<br />
able to self-correct toward the vortex core. The principle<br />
of using a vector field to predict the location of the next<br />
point and a sc<strong>al</strong>ar field to correct this position distinguishes<br />
this method from others. The theoretic<strong>al</strong> justification<br />
for the technique is that vortices are gener<strong>al</strong>ly<br />
characterized by large magnitudes of vorticity and low<br />
pressures in their core. The presence of these two characteristics<br />
in a cross-section defines the shape of the vortex<br />
interior.<br />
This paper discusses a number of novel approaches<br />
that we have developed to de<strong>al</strong> with matters such as eliminating<br />
redundant vortices, eliminating feeders, and representing<br />
the cross-section of a vortex tube. Sample<br />
extractions of vortices from various flow fields illustrate<br />
the different aspects of the technique.<br />
The vortex skeletons are an economic<strong>al</strong> way to represent<br />
flow data, offering a 4000-fold compression factor<br />
even in a complex flow. This offers the possibility of storing<br />
a multi-frame flow animation in a workstation’s<br />
memory. The vortex tubes can be enhanced during reconstruction<br />
in order to help visu<strong>al</strong>ize the dynamics of vortic<strong>al</strong><br />
flow.<br />
Acknowledgments<br />
The images in Figure 1 were rendered on a Silicon<br />
Graphics Indigo workstation using the FAST visu<strong>al</strong>ization<br />
system. The images in Figures 3, 4, and 5 were rendered<br />
on a Silicon Graphics Indigo 2 using the Explorer<br />
visu<strong>al</strong>ization system. Figure 7 was produced using a visu<strong>al</strong>ization<br />
system written by Michael Kelley. The image in<br />
Figure 8 was rendered on an Intel Paragon using PGL<br />
(Par<strong>al</strong>lel Graphics Library), which was developed at<br />
ICASE by Tom Crockett and Toby Orloff.<br />
We thank Gordon Erlebacher for his helpful insights<br />
regarding vortex identification schemes. We thank Greg<br />
Turk and the reviewers for their suggested improvements<br />
to this paper.<br />
References<br />
[1] S. K. Robinson, “Coherent motions in the turbulent<br />
boundary layer,” Annu. Rev. Fluid Mech. 23, 601<br />
(1991).<br />
[2] S. K. Robinson, “A review of vortex structures and<br />
associated coherent motions in turbulent boundary layers,”<br />
in Proceedings of Second IUTAM Symposium on<br />
Structure of Turbulence and Drag Reduction, Feder<strong>al</strong><br />
Institute of Technology, Zurich, Switzerland, July 25-28<br />
(1989).<br />
[3] S. K. Robinson, S. J. Kline, and P. R. Sp<strong>al</strong>art, “A review<br />
of quasi-coherent structures in a numeric<strong>al</strong>ly simulated<br />
boundary layer,” NASA TM-102191 (1989).<br />
[4] P. Moin and J. Kim, “The structure of the vorticity field<br />
in turbulent channel flow. Part 1. An<strong>al</strong>ysis of instantaneous<br />
fields and statistic<strong>al</strong> correlations,” J. Fluid Mech.<br />
155, 441 (1985).<br />
[5] J. Kim, and P. Moin, “The structure of the vorticity field<br />
in turbulent channel flow. Part 2. Study of ensembleaveraged<br />
fields,” J. Fluid Mech. 162, 339 (1986).<br />
[6] J. Villasenor and A. Vincent, “An <strong>al</strong>gorithm for space<br />
recognition and time tracking of vorticity tubes in turbulence,”<br />
CVGIP: Image Understanding 55:1, 27 (1992).<br />
[7] N. J. Zabusky, O. N. Boratav, R. B. Pelz, M. Gao, D. Silver,<br />
and S. P. Cooper, “Emergence of coherent patterns<br />
of vortex stretching during reconnection: A scattering<br />
paradigm,” Phys. Rev. Let. 67:18, 2469 (1991).<br />
[8] M. S. Chong, A. E. Perry, and B. J. Cantwell, “A gener<strong>al</strong><br />
classification of three-dimension<strong>al</strong> flow fields,” Phys. of<br />
Fluids A 2:5, 765 (1990).<br />
[9] J. Soria, and B. J. Cantwell, “Identification and classification<br />
of topologic<strong>al</strong> structures in free shear flows,”<br />
Proceedings of IUTAM Eddy Structure Identification in<br />
Free Turbulent Shear Flows (1992).<br />
[10] L. A. Yates, and G. T. Chapman, “Streamlines, Vorticity<br />
Lines, and Vortices,” AIAA Paper 91-0731 (1991).<br />
[11] A. Globus, C. Levit, and T. Lasinski, “A Tool for Visu<strong>al</strong>izing<br />
the Topology of Three-Dimension<strong>al</strong> Vector<br />
Fields,” NASA Report RNR-91-017, (1991).<br />
[12] P. S. Bernard, J. M. Thomas, and R. A. Handler, “Vortex<br />
dynamics and the production of Reynolds stress,” J.<br />
Fluid Mech. 253, 385 (1993).<br />
[13] B. A. Singer and R. D. Joslin, “Metamorphosis of hairpin<br />
vortex into a young turbulent spot,” submitted to<br />
Phys. Fluids A (1993).<br />
[14] Jules Bloomenth<strong>al</strong>, “C<strong>al</strong>culation of Reference Frames<br />
Along a Space Curve,” Graphics Gems I, (Andrew<br />
Glassner, ed.), Academic Press, INC. (1990).<br />
[15] B. A. Singer and D. C. Banks, “A Predictor-Corrector<br />
Scheme for Vortex Identification,” ICASE Report No.<br />
94-11; NASA CR-194882 (1994).
The Topology of Symmetric� Second�Order Tensor Fields<br />
Thierry Delmarcelle Lambertus Hesselink<br />
Department of Applied Physics Department of Electric<strong>al</strong> <strong>Engineering</strong><br />
Stanford University Stanford University<br />
Stanford� CA 94305�4090 Stanford� CA 94305�4035<br />
Abstract<br />
We study the topology of symmetric� second�order tensor<br />
�elds. The go<strong>al</strong> is to represent their complex structure by<br />
a simple set of carefully chosen points and lines an<strong>al</strong>ogous<br />
to vector �eld topology. We extract topologic<strong>al</strong> skeletons<br />
of the eigenvector �elds� and we track their evolution over<br />
time. We study tensor topologic<strong>al</strong> transitions and correlate<br />
tensor and vector data.<br />
The basic constituents of tensor topology are the degen�<br />
erate points� or points where eigenv<strong>al</strong>ues are equ<strong>al</strong> to each<br />
other. Degenerate points play a similar role as critic<strong>al</strong> points<br />
in vector �elds. We identify two kinds of elementary degen�<br />
erate points� which we c<strong>al</strong>l wedges and trisectors. They can<br />
combine to form more familiar singularities�such as sad�<br />
dles� nodes� centers� or foci. However� these are gener<strong>al</strong>ly<br />
unstable structures in tensor �elds.<br />
Fin<strong>al</strong>ly� we show a topologic<strong>al</strong> rule that puts a constraint<br />
on the topology of tensor �elds de�ned across surfaces� ex�<br />
tending to tensor �elds the Poincar�e�Hopf theorem for vector<br />
�elds.<br />
1 Introduction<br />
Many physic<strong>al</strong> phenomena are described in terms<br />
of continuous vector and tensor data. In �uid �ows�<br />
for example� velocity� vorticity� and temperature gradi�<br />
ents are vector �elds. Stresses� viscous stresses� rate�<br />
of�strain� and momentum �ux density are symmetric<br />
tensor �elds.<br />
Both vector and tensor �elds are multivariate� they<br />
involve more than one piece of information at every<br />
point of space. In fact� vector and symmetric tensor<br />
�elds in N dimension<strong>al</strong> space embody as much infor�<br />
mation as N and 1 2N�N � 1� independent sc<strong>al</strong>ar �elds�<br />
respectively� Visu<strong>al</strong>izing such data is a di�cult ch<strong>al</strong>�<br />
lenge� mainly because of the necessity of rendering the<br />
underlying continuity while avoiding problems of visu<strong>al</strong><br />
clutter. �See for example Reference �1� for a uni�ed<br />
expos�e of vector and tensor visu<strong>al</strong>ization techniques.�<br />
Representing vector �elds by their topology is pow�<br />
erful at ful�lling this requirement. The topology is ob�<br />
tained by locating critic<strong>al</strong> points�i.e.� points where the<br />
magnitude of the vector �eld vanishes�and by display�<br />
ing the set of their connecting streamlines �2� 3�. From<br />
this simple and austere depiction� an observer can infer<br />
the structure of the whole vector �eld.<br />
In this article we discuss topologic<strong>al</strong> representations<br />
of 2�D symmetric� second�order tensor �elds �referred to<br />
here simply as �tensor �elds��. That is� we investigate<br />
data of the type<br />
� �<br />
T11�x� y� T12�x� y�<br />
T�x� �<br />
�1�<br />
T12�x� y� T22�x� y�<br />
T�x� is fully equiv<strong>al</strong>ent to two orthogon<strong>al</strong> eigenvectors<br />
v i�x� � � i�x�e i�x� �2�<br />
where i � 1� 2 �Figure 1�. � i�x� are the eigenv<strong>al</strong>ues of<br />
T�x� and e i�x� the unit eigenvectors. �The reader un�<br />
acquainted with these concepts will �nd Reference �4�<br />
especi<strong>al</strong>ly useful.� The eigenvectors v i�x� represent <strong>al</strong>l<br />
λ 2<br />
Figure 1� The two orthogon<strong>al</strong> eigenvectors v i repre�<br />
sented as bidirection<strong>al</strong> arrows.<br />
the amplitude information �� i�x�� and <strong>al</strong>l the direction<strong>al</strong><br />
information �e i�x�� represented in matrix notation by<br />
the components T ij�x�. In a stress�tensor �eld� for ex�<br />
ample� the vectors v i�x� describe the magnitude and<br />
direction of the princip<strong>al</strong> stresses. We represent v1 and<br />
v2 in Figure 1 as bidirection<strong>al</strong> arrows because their sign<br />
is not determined.<br />
To obtain continuous representations of tensor �elds�<br />
we integrate a series of curves <strong>al</strong>ong one of the eigenvec�<br />
tors v1�x� or v2�x�. We refer to these curves as �tensor<br />
v 2<br />
λ 1<br />
v 1
�eld lines� �5� or as �hyperstreamline trajectories� for<br />
consistency with our earlier work �6�.<br />
The topology of a tensor �eld T�x� is the topology<br />
of its eigenvector �elds v i�x�. As with regular vector<br />
�elds� we seek topologic<strong>al</strong> skeletons that provide sim�<br />
ple depictions of the structure of the eigenvector �elds.<br />
We obtain these skeletons by locating degenerate points<br />
�Section 2� and integrating the set of their connecting<br />
hyperstreamline trajectories �Section 3�. Due to their<br />
sign indeterminacy� eigenvectors have a di�erent struc�<br />
ture from regular� signed vector �elds. For example� we<br />
show a tensor topologic<strong>al</strong> rule constraining the struc�<br />
ture of tensor �elds de�ned across surfaces �Section 4�.<br />
Fin<strong>al</strong>ly� we discuss succinct extensions of our theory to<br />
3�D and to unsymmetric tensor data �Section 5�.<br />
2 Degenerate Points<br />
We build a topologic<strong>al</strong> an<strong>al</strong>ysis of tensor �elds from<br />
the concept of degenerate points� which play the role of<br />
critic<strong>al</strong> points in vector �elds.<br />
Streamlines in vector �elds never cross each other<br />
except at critic<strong>al</strong> points and� as we show below� hy�<br />
perstreamlines in tensor �elds meet each other only at<br />
degenerate points. Similar to critic<strong>al</strong> points� degenerate<br />
points are the basic singularities underlying the topol�<br />
ogy of tensor �elds. We de�ne them mathematic<strong>al</strong>ly as<br />
follows.<br />
De�nition 1 �Degenerate point� A point x0 is a<br />
degenerate point of the tensor �eld T�x� i� the two<br />
eigenv<strong>al</strong>ues of T�x� are equ<strong>al</strong> to each other at x0�i.e.�<br />
i� �1�x0� � �2�x0�.<br />
Let us denote by � the common eigenv<strong>al</strong>ue at the degen�<br />
erate point x0. At x0� the tensor �eld is proportion<strong>al</strong><br />
to the identity matrix�<br />
� �<br />
� 0<br />
T�x0� �<br />
0 �<br />
which implies that T�x0�e � �e for every vector e. At<br />
most points� there is only one eigenvector associated<br />
with each eigenv<strong>al</strong>ue but� at degenerate points� there<br />
are an in�nity of such eigenvectors. So hyperstreamlines<br />
cross each other at degenerate points.<br />
Degenerate points satisfy the following conditions�1 �<br />
T11�xo� � T22�xo� � 0<br />
�3�<br />
T12�xo� � 0<br />
which we use to locate them. When the data are de�ned<br />
on a discrete grid� we use bilinear interpolation of the<br />
tensor components between vertices.<br />
1 V<strong>al</strong>id in any coordinate system.<br />
2.1 Index� sectors� and separatrices<br />
In vector �elds there are various types of criti�<br />
c<strong>al</strong> points�such as nodes� foci� centers� and saddle<br />
points�that correspond to di�erent loc<strong>al</strong> patterns of<br />
the neighboring streamlines. These patterns are char�<br />
acterized by the vector gradients at the positions of the<br />
critic<strong>al</strong> points �2�.<br />
Likewise in tensor �elds� di�erent types of degenerate<br />
points occur that correspond to di�erent loc<strong>al</strong> patterns<br />
of the neighboring hyperstreamlines. These patterns<br />
are determined by the tensor gradients at the positions<br />
of the degenerate points.<br />
Consider the parti<strong>al</strong> derivatives<br />
a � 1 2 ��T11�T22�<br />
�x<br />
c � �T12<br />
�x<br />
b � 1 2 ��T11�T22�<br />
�y<br />
d � �T12<br />
�y<br />
�4�<br />
ev<strong>al</strong>uated at the degenerate point x0. In the vicinity of<br />
x0� we can expand tensor components to �rst�order as<br />
� T11�T22<br />
2 � a�x � b�y<br />
T12 � c�x � d�y<br />
�5�<br />
where ��x� �y� are sm<strong>al</strong>l displacements from x0. An<br />
important quantity for the characterization of degener�<br />
ate points is<br />
� � ad � bc �6�<br />
The appe<strong>al</strong> of � arises from its being invariant under<br />
rotation. That is� if you rotate the coordinate sys�<br />
tem� both tensor components T ij and parti<strong>al</strong> derivatives<br />
fa� b� c� dg change� but � remains constant �7�.<br />
To proceed further we de�ne the concept of an index<br />
at a degenerate point. This extends from vector �elds to<br />
tensor �elds the classic<strong>al</strong> notion of an index at a critic<strong>al</strong><br />
point �8�.<br />
De�nition 2 �Tensor index� The index at the de�<br />
generate point x0 of a tensor �eld is the number of<br />
counter�clockwise revolutions made by the eigenvectors<br />
when traveling once in a counter�clockwise direction<br />
<strong>al</strong>ong a closed path encompassing x0. The path is cho�<br />
sen close enough to x0 so that it does not encompass<br />
any other degenerate points.<br />
While indices at critic<strong>al</strong> points of continuous vector<br />
�elds must be integer quantities �1 for a node� �1 for<br />
a saddle� etc.�� indices at degenerate points of continu�<br />
ous tensor �elds are h<strong>al</strong>f�integers. This arises from the<br />
sign ambiguity of the eigenvectors. In fact� we show in<br />
Reference �7� that� if � 6� 0� the index I at x0 is given<br />
by<br />
I � 1<br />
sign��� � �1<br />
�7�<br />
2 2
S 3<br />
β 1<br />
S 2<br />
α 2<br />
S 4<br />
θ 2<br />
β 2<br />
α 1<br />
Figure 2� Hyperbolic �� i� and parabolic �� j� sectors at<br />
a degenerate point.<br />
The index at the degenerate point x0 characterizes<br />
the pattern of neighboring hyperstreamlines. When<br />
traveling <strong>al</strong>ong a closed path encompassing x0� we en�<br />
counter two types of angular sectors �Figure 2��<br />
S 5<br />
α 3<br />
S 1<br />
1 hyperbolic sectors � i� where trajectories sweep<br />
past the degenerate point� and<br />
2 parabolic sectors � j� where trajectories lead<br />
away or towards the degenerate point. 2<br />
For example� the singularity in Figure 2 has three hy�<br />
perbolic and three parabolic sectors. By an<strong>al</strong>ogy with<br />
vector �elds� we c<strong>al</strong>l �separatrices� the dividing hyper�<br />
streamlines that separate one sector from the next� such<br />
as s1 to s6 in Figure 2. Let � k be the angle between the<br />
separatrix s k and the x�axis. We show in Reference �7�<br />
that x k � tan � k must be a root of the cubic equation<br />
dx 3 � �c � 2b�x 2 � �2a � d�x � c � 0 �8�<br />
Thus� there are at maximum three separatrices �re<strong>al</strong><br />
roots xk� and degenerate points have no more than three<br />
sectors.<br />
Consider a hypothetic<strong>al</strong> singularity with np parabolic<br />
and nh hyperbolic sectors �np � nh � 3�. The parabolic<br />
sectors span angles �j �j � 1� � � � � np� and the hyper�<br />
bolic sectors span angles �i �i � 1� � � � � nh�. The eigen�<br />
vectors rotate an angle �j within a parabolic sector and<br />
�i � � within a hyperbolic sector �Figure 2�. Thus�<br />
during one counter�clockwise revolution around the de�<br />
Pgenerate point� the eigenvectors rotate an angle 2�I �<br />
np<br />
j�1 �j� Pnh i�1��i���. Since Pnp j�1 �j� Pnh i�1 �i � 2��<br />
2 The reader familiar with sectors at critic<strong>al</strong> points in vector<br />
�elds may remember the existence of another type of sector c<strong>al</strong>led<br />
�elliptic� �8�. In the case of unsigned eigenvector �elds� elliptic<br />
and parabolic sectors are indistinguishable and we group them in<br />
a unique parabolic class.<br />
θ 1<br />
β 3<br />
S 6<br />
S 1<br />
S2 δ < 0<br />
I = −1/2<br />
S3<br />
S 2<br />
δ > 0<br />
I = 1/2<br />
Figure 3� Trisector �� � 0� and wedge �� � 0� points.<br />
� � ad � bc and I � index.<br />
the index at the degenerate point is given by<br />
I � 1 � n h<br />
2<br />
It follows from Equation 7 that the number of hyper�<br />
bolic sectors at a degenerate point is<br />
n h � 2 � sign���<br />
2.2 Trisector and wedge points<br />
When � � 0� nh � 3� the degenerate point has three<br />
hyperbolic sectors and� since np � nh � 3� there is no<br />
parabolic sector. The pattern of hyperstreamlines cor�<br />
responds to the trisector point shown by the texture3 in<br />
Figure 6. See Figure 3 for a schematic depiction. We<br />
show in Reference �7� that each hyperbolic sector at a<br />
trisector point is less than 180o wide.<br />
When � � 0� nh � 1� the degenerate point has one<br />
hyperbolic sector. The loc<strong>al</strong> pattern corresponds to the<br />
wedge point represented in Figures 6 and 3. We show in<br />
Reference �7� that the hyperbolic sector at a wedge point<br />
is <strong>al</strong>ways wider than 180o . There are np � 2 parabolic<br />
sectors. When np � 2� the two parabolic sectors are<br />
contiguous and we combine them into a unique sector.<br />
Hence the pattern in Figure 3 where np � 1. �If np � 0�<br />
separatrices s1 and s2 are identic<strong>al</strong>� the parabolic sector<br />
reduces to a single line.�<br />
To summarize� the most elementary singularities in<br />
tensor �elds are trisector and wedge points. The invari�<br />
ant � at the location of a degenerate point characterizes<br />
the nature of this point. � � 0 corresponds to a trisector<br />
point �I � �1 2� and � � 0 corresponds to a wedge point<br />
�I � 1 2�. The crossing of the boundary � � 0 denotes a<br />
topologic<strong>al</strong> transition which we study in the next sec�<br />
tion. We defer until Section 3 a discussion of the glob<strong>al</strong><br />
implications of the patterns delineated in Figure 3.<br />
3 We create the textures in this article and in the accompanying<br />
video by a technique discussed in References �7� 9�.<br />
S 1
Saddle<br />
+ δ = =+<br />
0<br />
=<br />
I = −1<br />
+ =<br />
Node<br />
Center<br />
δ = 0<br />
I = 1<br />
= +<br />
+<br />
=<br />
Focus<br />
δ = 0<br />
I = 1<br />
= +<br />
Figure 4� Merging degenerate points. � � invariant given by Equation 6� I � index.<br />
2.3 Merging degenerate points<br />
Wedges and trisectors are stable structures in con�<br />
tinuous tensor �elds� they can not be broken into more<br />
elementary singularities with sm<strong>al</strong>ler index. In time�<br />
dependent �ows� however� they move and can merge<br />
with each other� creating combined singularities of<br />
higher index.<br />
A combination of degenerate points looks in the far<br />
�eld as a singularity whose index is the sum of the in�<br />
dices of its constituent parts. The following pattern�<br />
for example� is made up of 4 wedges and 2 trisec�<br />
tors. Its tot<strong>al</strong> index is 4 � 1 2 � 2 � 1 2 � 1 and the<br />
structure looks indeed like a center �I � 1� in the far<br />
�eld. Figure 4 shows how merging trisectors create<br />
saddle points �I � �1 2 � 1 2 � �1� and how merging<br />
wedges create nodes� centers� or foci �I � 1 2 � 1 2 � 1�.<br />
Trisectors and wedges cancel each other by merging<br />
�I � �1 2 � 1 2 � 0��i.e.� the singularity vanishes. Con�<br />
versely� wedge�trisector pairs can be created from reg�<br />
ular points. Pair creation is topologic<strong>al</strong>ly consistent<br />
since it conserves the loc<strong>al</strong> index. �We show examples<br />
in Section 3.�<br />
The merging of wedges and trisectors corresponds to<br />
� � 0. A more quantitative study of the patterns in<br />
Figure 4 is di�cult since it requires developing tensor<br />
components at least to second order in Equations 5.<br />
As opposed to critic<strong>al</strong> points in vector �elds� degen�<br />
erate points with integr<strong>al</strong> indices are usu<strong>al</strong>ly unstable.<br />
They split into elementary wedges or trisectors soon af�<br />
ter their creation by merging. They are nevertheless<br />
important for the study of instantaneous topologies.<br />
3 Tensor Field Topology<br />
We build on the theory of degenerate points to ex�<br />
tract the topology of tensor �elds and to study topo�<br />
logic<strong>al</strong> transitions.<br />
The technique is similar to vector �eld topology with<br />
degenerate points playing the role of critic<strong>al</strong> points. We<br />
represent each eigenvector �eld by a topologic<strong>al</strong> skeleton<br />
obtained by locating degenerate points and integrating<br />
the set of their connecting separatrices. We illustrate<br />
these concepts by visu<strong>al</strong>izing the topology of the stress<br />
tensor in a 2�D periodic �ow past a cylinder.<br />
Fluid elements undergo compressive stresses while<br />
moving with the �ow. Stresses are described mathe�<br />
matic<strong>al</strong>ly by the stress tensor� which combines isotropic<br />
pressure and anisotropic viscous stresses. Both eigen�<br />
v<strong>al</strong>ues of the stress tensor are negative� and the two<br />
orthogon<strong>al</strong> eigenvectors� v1 and v2 �Equation 2�� are<br />
<strong>al</strong>ong the least and the most compressive directions� re�<br />
spectively. At a degenerate point� the viscous stresses<br />
vanish and both eigenv<strong>al</strong>ues are equ<strong>al</strong> to the pressure�<br />
degenerate points are points of pure pressure.<br />
The texture in Figure 7 shows the �ow �velocity �eld�<br />
at one representative time step. The �ow consists in the<br />
periodic detachment of a separation bubble. Overlaid<br />
are the degenerate points of the stress tensor.<br />
2 Video Clip 1 � The moving texture shows the �ow<br />
evolving over time. Color encodes velocity magnitude from<br />
fast �red� to slow �blue�.<br />
3.1 Tracking degenerate points<br />
The instantaneous representation in Figure 7 con�<br />
tains v<strong>al</strong>uable information but we can learn more about<br />
the spatiotempor<strong>al</strong> structure of the tensor �eld by<br />
tracking the motion of degenerate points over time.<br />
Figure 8 shows the trajectories followed by degener�<br />
ate points in 3�D space. The third dimension is time�
increasing from front to back. The �gure represents one<br />
period of the evolution of the �ow. Red dots are wedge<br />
points and green dots are trisectors. C�events are cre�<br />
ations of wedge�trisector pairs from regular �ow� and<br />
M�events correspond to pair cancellation by merging.<br />
In some instances� pair creations a�ect only the lo�<br />
c<strong>al</strong> �ow� the two newly created points move together<br />
and eventu<strong>al</strong>ly disappear by merging. Two C�events�<br />
however� are di�erent� the newly created points move<br />
far away from each other� inducing a topologic<strong>al</strong> tran�<br />
sition in the tensor �eld. These new wedge�trisector<br />
pairs are created periodic<strong>al</strong>ly in a location <strong>al</strong>ternatively<br />
above then below the cylinder symmetry axis. New<br />
wedge points are quickly dragged into the wake about<br />
the cylinder axis while new trisectors move downstream<br />
away from the axis.<br />
2 Video Clips 2 and 3 � We visu<strong>al</strong>ize the motion of<br />
degenerate points of the stress�tensor �eld. The colored<br />
background encodes the magnitude �2 of the most compres�<br />
sive force� from very compressive �red� to mildly compres�<br />
sive �orange� yellow� green� to little compressive �blue�. We<br />
show wedge points as black dots and trisectors as white dots.<br />
Video Clip 2 represents the over<strong>al</strong>l structure of the motion<br />
and Video Clip 3 focuses on the region closer to the body.<br />
The pair�creation events are clearly tight to each region of<br />
low compressive stresses �blue color�.<br />
3.2 Correlating vector and tensor data<br />
Tensor data are highly multivariate and rich in in�<br />
formation content but they are complex and poorly un�<br />
derstood. Vector data are simpler and more familiar to<br />
scientists. It is useful to correlate visu<strong>al</strong>ly tensor and<br />
vector �elds� not only for our basic understanding of<br />
tensor data but <strong>al</strong>so for gleaning new physic<strong>al</strong> insights<br />
into vector �elds.<br />
2 Video Clip 4 � The moving texture encodes the di�<br />
rection of the velocity �eld. Color encodes the magnitude<br />
of the most compressive eigenv<strong>al</strong>ue �2. Overlaid are the de�<br />
generate points of the stress tensor.<br />
Figure 7 represents one frame from this clip. Tex�<br />
ture and color indicate clearly that detachment bubbles<br />
�saddle�center pairs of the velocity �eld� are regions of<br />
low compressive stresses. Red and white dots are wedge<br />
and trisector points of the stress tensor� respectively.<br />
The motion of the degenerate points is interesting. The<br />
wedge point A� which originated by pair creation� fol�<br />
lows the detachment bubble in its motion downstream.<br />
In fact� a new pair is created with each new bubble.<br />
The oscillating pair B is closely associated to the recir�<br />
culation regions close to the body surface. The wedge<br />
C follows a stable orbit shaped as an 8. It rolls back<br />
and forth between two consecutive bubbles without ever<br />
venturing inside.<br />
3.3 Topologic<strong>al</strong> skeletons<br />
We obtain topologic<strong>al</strong> skeletons by detecting degen�<br />
erate points and integrating the set of their connecting<br />
separatrices.<br />
Trisector points in tensor �elds play the topologi�<br />
c<strong>al</strong> role of saddle points in vector �elds. As shown in<br />
Figures 3 and 6� they de�ect adjacent trajectories in<br />
any one of their three hyperbolic sectors toward topo�<br />
logic<strong>al</strong>ly distinct regions of the domain. Wedge points<br />
possess both a hyperbolic and a parabolic sector. They<br />
de�ect trajectories adjacent in their hyperbolic sector<br />
and terminate trajectories impinging on their parabolic<br />
sector.<br />
Here follows an <strong>al</strong>gorithm to extract the topology of a<br />
tensor �eld. This simpli�ed version assumes that there<br />
are no merged degenerate points with integr<strong>al</strong> index�<br />
1 locate degenerate points by searching in every grid<br />
cell for solutions to Equations 3�<br />
2 classify each degenerate point as a trisector �� � 0�<br />
or a wedge �� � 0� by ev<strong>al</strong>uating a� b� c� d using<br />
Equations 4 and computing � as in Equation 6�<br />
3 select an eigenvector �eld�<br />
4 use Equation 8 to �nd the three separatrices<br />
fs1� s2� s3g at each trisector point and the two sep�<br />
aratrices fs1� s2g at each wedge point �Figure 3��<br />
integrate hyperstreamlines <strong>al</strong>ong the separatrices�<br />
terminate the trajectories wherever they leave the<br />
domain or impinge on the parabolic sector of a<br />
wedge point.<br />
Figure 9 shows an example. The texture represents the<br />
most compressive eigenvector of the stress tensor �v2�.<br />
Color encodes as before the magnitude of the compres�<br />
sive force ��2�� from most compressive �red� to least<br />
compressive �blue�. We emphasize the structure of the<br />
tensor �eld by superimposing the topologic<strong>al</strong> skeleton of<br />
v2. The structure of these time�dependent data is very<br />
complex and we simplify the topology �in Figure 9 as in<br />
the remaining of this article� by computing only those<br />
separatrices that originate from trisector points� leav�<br />
ing on the side separatrices that emanate from wedge<br />
points.<br />
We can ment<strong>al</strong>ly infer the orientation of the eigen�<br />
vector at any point in the plane from the topologic<strong>al</strong><br />
skeleton. Hyperstreamline trajectories curve so as to<br />
follow the shape of the separatrices� bending around<br />
wedge points.<br />
With time� the repeated creation of new wedge�<br />
trisector pairs induces periodic topologic<strong>al</strong> transitions�
W 2<br />
W 3<br />
W 1<br />
T 1<br />
T 2<br />
W 4<br />
W 5<br />
W 2<br />
W 3<br />
T 3 W6<br />
Figure 5� Two consecutive frames showing a topologic<strong>al</strong> transition of the stress�tensor �eld.<br />
M ��M�<br />
sphere 2<br />
torus 0<br />
2�holed torus �2<br />
n�holed torus 2 � 2 n<br />
Table 1� Euler characteristic of generic surfaces.<br />
which we illustrate in Figure 5. The newly created pair<br />
fT3� W6g changes the topologic<strong>al</strong> structure of the tensor<br />
�eld.<br />
As with vector �eld topology� the power of the rep�<br />
resentation comes from its simplicity� a few points and<br />
lines su�ce to reve<strong>al</strong> the direction<strong>al</strong> information other�<br />
wise buried within abundant multivariate data.<br />
2 Video Clips 5 and 6 � The two clips show the evolu�<br />
tion with time of the topologic<strong>al</strong> skeleton in Figure 9� with<br />
and without the textured background. Black dots represent<br />
wedge points and white dots are trisectors.<br />
3.4 Trivariate data visu<strong>al</strong>ization<br />
By using textures or topologic<strong>al</strong> skeletons� we render<br />
tensor information only parti<strong>al</strong>ly. Indeed� we see from<br />
Equation 1 that 2D tensor data are truly trivariate. If<br />
the go<strong>al</strong> is to correlate full tensor information within<br />
a single display� one must visu<strong>al</strong>ize simultaneously two<br />
eigenv<strong>al</strong>ues and the orientation of the eigenvectors.<br />
In Figure 10� we use texture� color� and elevation as<br />
channels to encode eigenvector direction� longitudin<strong>al</strong><br />
eigenv<strong>al</strong>ue� and transverse eigenv<strong>al</strong>ue� respectively. 4 In<br />
4 The vertic<strong>al</strong> stretching creates an unwanted distortion of the<br />
texture which can be compensated for by techniques such as those<br />
described in Reference �10�.<br />
W 1<br />
T 1<br />
T 2<br />
W 4<br />
W 5<br />
addition to topologic<strong>al</strong> information the display reve<strong>al</strong>s a<br />
strong correlation between the two eigenv<strong>al</strong>ues�a fact<br />
that was previously overlooked in representations such<br />
as Figures 5 and 9.<br />
4 Tensor Topologic<strong>al</strong> Rule<br />
When a tensor �eld is de�ned across a surface M�<br />
the topology of M puts a constraint on the number and<br />
nature of degenerate points� limiting considerably the<br />
variety of possible tensor patterns. We investigate this<br />
constraint in this section.<br />
The topology of any surface M is unambiguously<br />
characterized by a single number ��M� c<strong>al</strong>led the sur�<br />
face�s Euler characteristic �8�. All orientable 5 home�<br />
omorphic surfaces�i.e.� the set of orientable surfaces<br />
that can be distorted to look identic<strong>al</strong> by continuous<br />
bending� stretching� or squashing� but without tear�<br />
ing or gluing�have the same v<strong>al</strong>ue of ��M�. For ex�<br />
ample� a sphere and a cube are homeomorphic with<br />
��M� � 2. A torus and a co�ee mug are homeomor�<br />
phic with ��M� � 0. Table 1 lists ��M� for a few<br />
generic surfaces.<br />
A classic<strong>al</strong> theorem of surface topology� known as the<br />
Poincar�e�Hopf theorem �11�� stipulates that the sum of<br />
the indices at the critic<strong>al</strong> points of a vector �eld de�ned<br />
across a surface M is equ<strong>al</strong> to ��M�. Thus� if such<br />
a vector �eld has N nodes� C centers� F foci� and S<br />
saddles� the tot<strong>al</strong> index is N �C �F �S � ��M�. This<br />
important result shows how the topology of the surface<br />
M�i.e.� ��M��a�ects the structure of any vector �eld<br />
5 See Reference �8� for a precise de�nition of surface orientabil�<br />
ity. Most of the surfaces in every day life are orientable. Notable<br />
exceptions include M�obius bands and Klein bottles.
de�ned across M�i.e.� N � C � F � S.<br />
In order to extend the Poincar�e�Hopf theorem from<br />
vector �elds to tensor �elds� we make the assumption<br />
that the sum of the indices at the degenerate points of a<br />
tensor �eld T�x� de�ned across the surface M depends<br />
only on the topology of M and not on the particular ten�<br />
sor �eld T�x�. The following topologic<strong>al</strong> rule results�<br />
Tensor topologic<strong>al</strong> rule � Let T�x� be a tensor<br />
�eld de�ned across an orientable surface M having Eu�<br />
ler characteristic ��M�. If T�x� has only isolated de�<br />
generate points consisting exclusively of W wedges� T<br />
trisectors� N nodes� C centers� F foci� and S saddles�<br />
then the sum of the indices at the degenerate points of<br />
T�x� is equ<strong>al</strong> to ��M�. Hence the topologic<strong>al</strong> rule�<br />
1<br />
�W � T � � N � C � F � S � ��M� �9�<br />
2<br />
We refer the reader to Reference �7� for a proof. As with<br />
vector �elds� this rule establishes a connection between<br />
the topology of the surface M�i.e.� ��M��and the<br />
structure of any tensor �eld de�ned across M�i.e.� the<br />
sum of indices.<br />
Equation 9 restricts considerably the number of pos�<br />
sible surface tensor patterns. For example� Figure 11<br />
shows two complex tensor �elds�one de�ned across a<br />
torus and another one across a sphere. A topologic<strong>al</strong><br />
an<strong>al</strong>ysis reve<strong>al</strong>s N � C � F � S � 0� W � T � 18<br />
for the torus� and N � C � 1� F � 0� W � T � 3 for<br />
the sphere. Both sets of v<strong>al</strong>ues satisfy Equation 9 with<br />
��torus� � 0 and ��sphere� � 2� respectively.<br />
5 Extensions and Conclusions<br />
We can extend the theory of degenerate points to 3�D<br />
symmetric tensor �elds� which have three re<strong>al</strong> eigenv<strong>al</strong>�<br />
ues and three orthogon<strong>al</strong> eigenvectors. At a degener�<br />
ate point where two eigenv<strong>al</strong>ues are identic<strong>al</strong>� loc<strong>al</strong>ly<br />
two�dimension<strong>al</strong> patterns such as wedges and trisec�<br />
tors �Figure 3� occur in the plane orthogon<strong>al</strong> to the<br />
third eigenvector. However� it remains to characterize<br />
the fully three�dimension<strong>al</strong> patterns that exist in the<br />
vicinity of degenerate points where three eigenv<strong>al</strong>ues<br />
are identic<strong>al</strong>.<br />
The results presented above are <strong>al</strong>so useful for un�<br />
symmetric tensor �elds. We show in Reference �6� that<br />
it is <strong>al</strong>ways possible to extract a symmetric tensor com�<br />
ponent from unsymmetric data. We can then apply<br />
the topologic<strong>al</strong> an<strong>al</strong>ysis to the symmetric component<br />
for unveiling� at least parti<strong>al</strong>ly� the structure of the ten�<br />
sor �eld.<br />
In conclusion� visu<strong>al</strong>ization <strong>al</strong>lowed us to elucidate<br />
the structure of symmetric tensor �elds� demonstrating<br />
the tremendous potenti<strong>al</strong> of the �eld for building new<br />
knowledge beyond the usu<strong>al</strong> go<strong>al</strong> of inspecting results<br />
from experiments and computations.<br />
Acknowledgements<br />
We are most indebted to Dan Asimov from NASA Ames<br />
for a useful discussion on topology� and to Mark Peercy<br />
from Stanford University for his critic<strong>al</strong> comments and some<br />
of his software. The authors are supported by NASA un�<br />
der contract NAG 2�911 which includes support from the<br />
NASA Ames Numeric<strong>al</strong> Aerodynamics Simulation Program<br />
and the NASA Ames Fluid Dynamics Division� and <strong>al</strong>so by<br />
NSF under grant ECS9215145.<br />
References<br />
�1� T. Delmarcelle and L. Hesselink� �A uni�ed frame�<br />
work for �ow visu<strong>al</strong>ization�� in Computer Visu<strong>al</strong>ization<br />
�R. G<strong>al</strong>lagher� ed.�� ch. 5� CRC Press� 1994.<br />
�2� J. L. Helman and L. Hesselink� �Visu<strong>al</strong>ization of vector<br />
�eld topology in �uid �ows�� IEEE Computer Graphics<br />
and Applications� vol. 11� no. 3� pp. 36�46� 1991.<br />
�3� A. Globus� C. Levit� and T. Lasinski� �A tool for visu�<br />
<strong>al</strong>izing the topology of three�dimension<strong>al</strong> vector �elds��<br />
in Proc. IEEE Visu<strong>al</strong>ization �91� pp. 33�40� 1991.<br />
�4� A. I. Borisenko and I. E. Tarapov� Vector and Tensor<br />
An<strong>al</strong>ysis with Applications. Dover Publications� New<br />
York� 1979.<br />
�5� R. R. Dickinson� �A uni�ed approach to the design<br />
of visu<strong>al</strong>ization software for the an<strong>al</strong>ysis of �eld prob�<br />
lems�� in Proc. SPIE� vol. 1083� pp. 173�180� SPIE�<br />
Bellingham� WA.� 1989.<br />
�6� T. Delmarcelle and L. Hesselink� �Visu<strong>al</strong>izing second�<br />
order tensor �elds with hyperstreamlines�� IEEE Com�<br />
puter Graphics and Applications� vol. 13� no. 4� pp. 25�<br />
33� 1993.<br />
�7� T. Delmarcelle� The Visu<strong>al</strong>ization of Second�Order<br />
Tensor Fields. PhD thesis� Stanford University� 1994.<br />
To be published.<br />
�8� P. A. Firby and C. F. Gardiner� Surface Topology. Ellis<br />
Horwood series in Mathematics and its Applications�<br />
John Willey � Sons� New York� 1982.<br />
�9� B. Cabr<strong>al</strong> and L. C. Leedom� �Imaging vector �elds<br />
using line integr<strong>al</strong> convolution�� Computer Graphics<br />
�SIGGRAPH�93 Proc.�� pp. 263�272� 1993.<br />
�10� J. Maillot� H. Yahia� and A. Verroust� �Interactive tex�<br />
ture mapping�� Computer Graphics �SIGGRAPH�93<br />
Proceedings�� vol. 27� pp. 27�34� 1993.<br />
�11� J. W. Milnor� Topology from the Di�erentiable View�<br />
point. The University Press of Virginia� Charlottesville�<br />
1965.
Figure 6� Textures representing the two eigenvector �elds in the vicinity of a trisector point �top� and a wedge<br />
point �bottom�. Color encodes the di�erence between the two eigenv<strong>al</strong>ues.
Figure 7� A frame of Video Clip 4 showing the correlation between the velocity �eld �moving texture� and the<br />
degenerate points of the stress tensor. Color encodes the most compressive stress. Red dots � wedges� white dots<br />
� trisectors. �See the video tape accompanying the Visu<strong>al</strong>ization �94 proceedings.�
Figure 8� Spatiotempor<strong>al</strong> trajectories of degenerate points in the stress�tensor �eld. Time increases from front to<br />
back. Red spheres � wedges� green spheres � trisectors. M and C indicate merging and creation of wedge�trisector<br />
pairs� respectively. �See the video tape accompanying the Visu<strong>al</strong>ization �94 proceedings.�
Figure 9� A frame of Video Clip 5 showing the instantaneous topology of the most compressive eigenvector<br />
v2. Color encodes �2. W � wedge� T � trisector. �See the video tape accompanying the Visu<strong>al</strong>ization �94<br />
proceedings.�
Figure 10� Trivariate data visu<strong>al</strong>ization to fully represent the stress�tensor �eld.
Figure 11� Illustration of the tensor topologic<strong>al</strong> rule for a torus and a sphere.
qeƒ€ � e ƒ����� ��� †���—������ q������� e��������� 3<br />
e˜���—�<br />
This paper describes a system, GASP, that facilitates<br />
the visu<strong>al</strong>ization of geometric <strong>al</strong>gorithms. The user need<br />
not have any knowledge of computer graphics in order to<br />
quickly generate a visu<strong>al</strong>ization. The system is <strong>al</strong>so intended<br />
to facilitate the task of implementing and debugging<br />
geometric <strong>al</strong>gorithms. The viewer is provided with<br />
a comfortable user interface enhancing the exploration of<br />
an <strong>al</strong>gorithm’s function<strong>al</strong>ity. We describe the underlying<br />
concepts of the system as well as a variety of examples<br />
which illustrate its use.<br />
I s����������<br />
The visu<strong>al</strong>ization of mathematic<strong>al</strong> concepts goes back<br />
to the early days of graphics hardware [19], [2], and continues<br />
to the present [16], [14, 13], [17]. These videos use<br />
graphics and motion to explain geometric ideas in three<br />
dimensions and higher. They have been widely accepted<br />
as the necessary companions to the tradition<strong>al</strong> medium of<br />
journ<strong>al</strong> publication [27], [28]. Similar gains in exposition<br />
are found in the <strong>al</strong>gorithm animation work that has become<br />
popular in recent years [1], [7], [4, 5], [23, 24], [6],<br />
[21], [20]. The limiting force has been the difficulty of<br />
generating the graphics for such animations.<br />
We have chosen a restricted domain, that of computation<strong>al</strong><br />
geometry, to build a system that greatly facilitates<br />
the visu<strong>al</strong>ization of <strong>al</strong>gorithms regardless of their complexity.<br />
The visu<strong>al</strong> nature of geometry makes it one of<br />
the areas of computer science that can benefit greatly from<br />
visu<strong>al</strong>ization. Even the simple task of imagining in the<br />
mind a three-dimension<strong>al</strong> geometric construction can be<br />
hard. In many cases the dynamics of the <strong>al</strong>gorithm must<br />
be understood to grasp the <strong>al</strong>gorithm, and even a simple<br />
animation can assist the geometer.<br />
The main principle guiding our work is that <strong>al</strong>gorithm<br />
designers want to visu<strong>al</strong>ize their <strong>al</strong>gorithms but are limited<br />
by current tools. In particular, visu<strong>al</strong>izations would<br />
be less rare if the effort to create them was little. In<br />
the past, visu<strong>al</strong>izations have been produced by developing<br />
sophisticated software for a particular situation but<br />
there has been little movement towards more widely usable<br />
systems. By limiting our domain, we are able to<br />
create such a system that enables others to easily use it.<br />
3 „��� ���� ��������� �� �—�� ˜� ��� x—����—� ƒ���� p���E<br />
�—���� ����� q�—�� x��˜�� gg‚WQEHIPSR —�� ˜� „�� q���E<br />
���� g�����D …��������� �� w�������—D —� ƒ„g ������ ˜� xƒpD<br />
hyiD —�� w�������— „��������D s�F<br />
e������ „—� —�� h—��� h�˜���<br />
h��—������ �� g������� ƒ����<br />
€������� …���������<br />
€�������D xt HVSRR<br />
Indeed, two colleagues have <strong>al</strong>ready published visu<strong>al</strong>izations<br />
built with our system [3], [9].<br />
We describe in this paper our system, GASP, (Geometric<br />
Animation System, Princeton). We present the basic<br />
ideas that underlie the development and implementation<br />
of our system, and we demonstrate its utility in the accompanying<br />
video. Our system differs from its predecessors<br />
(e.g., B<strong>al</strong>sa [7], B<strong>al</strong>sa-II [4, 5], Tango [23, 24] and Zeus<br />
[6]) in sever<strong>al</strong> ways. In particular, the development of<br />
GASP was driven by three major go<strong>al</strong>s, which we feel<br />
represent a radic<strong>al</strong> departure from previous work.<br />
GASP <strong>al</strong>lows the very quick creation of three dimension<strong>al</strong><br />
<strong>al</strong>gorithm visu<strong>al</strong>izations. A typic<strong>al</strong> animation<br />
can be produced in a matter of days or even hours.<br />
In particular, GASP <strong>al</strong>lows the fast prototyping of<br />
<strong>al</strong>gorithm animations.<br />
Even highly complex geometric <strong>al</strong>gorithms can be<br />
animated with ease. This is an important point, because<br />
it is our view that complicated <strong>al</strong>gorithms are<br />
those that gain the most from visu<strong>al</strong>ization. To create<br />
an animation, it is sufficient to write a few dozen<br />
lines of code.<br />
Providing a visu<strong>al</strong> debugging facility for geometric<br />
computing is one of the major go<strong>al</strong>s of the GASP<br />
project. Geometric <strong>al</strong>gorithms can be very complex<br />
and hard to implement. Typic<strong>al</strong> geometric code is often<br />
heavily pointer-based and thus standard debuggers<br />
are notoriously inadequate for it. In addition,<br />
running geometric code is plagued by problems of<br />
robustness and degeneracies.<br />
There are many ways in which the system can be used.<br />
First, it can be used simply as an illustration tool for geometric<br />
constructions. Second, stand-<strong>al</strong>one videotapes to<br />
accompany t<strong>al</strong>ks and classes can be created by GASP.<br />
Third, GASP can ease the task of debugging. Fourth,<br />
GASP can significantly enhance the study of <strong>al</strong>gorithms<br />
by <strong>al</strong>lowing students to interact and experiment with the<br />
animations. Fifth, GASP enables users to create animations<br />
to attach to their documents.<br />
Computation<strong>al</strong> geometers describe configurations of<br />
geometric objects either through ASCII text as generated<br />
by symbolic computing tools (e.g., Mathematica [29]) or<br />
through hand drawn figures created with a graphics editor.<br />
Our system offers an <strong>al</strong>ternative to this by <strong>al</strong>lowing<br />
the geometer to feed ASCII data into a simple program<br />
and get a three-dimension<strong>al</strong> dynamic (as well as static)<br />
visu<strong>al</strong>ization of objects.
Often, the dynamics of the <strong>al</strong>gorithm must be understood.<br />
Animations can assist the geometer and be a powerful<br />
adjunct to a technic<strong>al</strong> paper. With GASP, generating<br />
an animation requires no knowledge of computer graphics.<br />
The interaction with the system is tuned to the user’s<br />
area of expertise, i.e., geometry.<br />
Until recently, most researchers have been reluctant to<br />
implement, let <strong>al</strong>one visu<strong>al</strong>ize, their <strong>al</strong>gorithms. In large<br />
part, this has been due to the difficulty in using graphics<br />
systems combined with that of implementing geometric<br />
<strong>al</strong>gorithms. This combination made it a major effort to<br />
animate even the simplest geometric <strong>al</strong>gorithm. Our system<br />
can ease some of the unique hardships of coding and<br />
debugging geometric <strong>al</strong>gorithms. The inherent difficulty<br />
in checking a geometric object (e.g., listing vertices, edges<br />
and faces of a polyhedron) in a debugger, can be eliminated<br />
once it becomes possible to view the object. In<br />
practice, a simple feature such as being able to visu<strong>al</strong>ize<br />
a geometric object right before a bug causes the program<br />
to crash has been an inv<strong>al</strong>uable debugging tool.<br />
Visu<strong>al</strong>ization can have a great impact in education.<br />
Watching and interacting with an <strong>al</strong>gorithm can enhance<br />
the understanding, give insight into geometry and explain<br />
the intuition behind the <strong>al</strong>gorithm. The environment in<br />
which the animation runs is designed to be simple and<br />
effective. The viewer is able to observe, interact and experiment<br />
with the animation.<br />
An important consideration in the design of GASP is<br />
the support of enclosures of animations in online documents.<br />
GASP movies can be converted into MPEG<br />
movies which can be included in a Mosaic document.<br />
A user is able to include animations in document. The<br />
reader of the document is presented with an icon in the<br />
document and clicking on the icon causes the animation<br />
to play. This way, researchers are able to pass around<br />
documents with animations replacing figures.<br />
In the next section we describe the specification of the<br />
system. We focus on the ways the system meets the needs<br />
of both the geometer and the viewer. In Section 3 we describe,<br />
through examples, how our system has been used<br />
in various scenarios. This section is accompanied with<br />
a videotape that demonstrates the various cases. Section<br />
4 discusses some implementation issues. We conclude in<br />
Section 5.<br />
P „�� ƒ�����<br />
The scenes of interest to us are built out of geometric<br />
objects and displays of data structures. Typic<strong>al</strong> geometric<br />
objects are lines, points, polygons, spheres, cylinders and<br />
polyhedra. Typic<strong>al</strong> data structures include lists and trees<br />
of various forms. The operations applied to these objects<br />
depend upon their types. A standard animation in the<br />
domain of computation<strong>al</strong> geometry is built out of these<br />
building blocks.<br />
A geometer creating an animation cares about the structure<br />
of the animation (which building blocks are included),<br />
and the structure of each scene. The geometer is less<br />
concerned, however, about how each building block animates,<br />
about colors, about the speed of the animation etc.<br />
To draw an an<strong>al</strong>ogy to L—T E X [15], the creator of the document<br />
is concerned more with the text the paper includes<br />
and less with the margins, spacings and fonts. Our system<br />
<strong>al</strong>lows the user to generate an animation with minim<strong>al</strong> effort<br />
by specifying only the aspects of the animation about<br />
which the user cares. There are times, however, when the<br />
creator of the animation does want to change the viewing<br />
aspects (e.g., colors) of the animation, just like the writer<br />
of a document would like to change fonts. Our system<br />
<strong>al</strong>lows this <strong>al</strong>so.<br />
The end-user (the viewer) need not know how the animation<br />
was produced. By an<strong>al</strong>ogy, the reader of a document<br />
does not care how it was created. The viewer would<br />
like to be able to play the animation at low or high speed,<br />
to pause and <strong>al</strong>ter the objects being considered and to run<br />
the animation on an input of the user’s choosing among<br />
other things. Our system provides an environment that<br />
enables this.<br />
In this section we discuss the design of the system<br />
which comes to answer the above needs. We consider<br />
two interfaces: the programmer interface and the viewer<br />
interface. For the first of these, making the animation creation<br />
a quick and easy task is the aim of our system. The<br />
viewer interface is designed to be simple and effective,<br />
and to <strong>al</strong>low the user to experiment with the animation.<br />
Programmer Interface: To generate an animation, the<br />
programmer needs to write C code which includes c<strong>al</strong>ls to<br />
GASP’s functions. Making the snippets of C code which<br />
generate the animation short and powerful is our go<strong>al</strong>.<br />
To do this, we follow two principles: First, the programmer<br />
does not need to have any knowledge of computer<br />
graphics. Second, we distinguish between what is being<br />
animated and how it is animated. The application specifies<br />
what happens and need not be concerned with how to<br />
make it happen on the screen. For example, the creation<br />
of a polyhedron (The What) is different from the way it<br />
is made to appear through the animation (The How). It<br />
can be created by fading into the scene, by traveling into<br />
its location etc. The code includes only manipulations of<br />
objects and modifications of data structures. Style files<br />
can be used by the programmer to change from default<br />
aspects of the animation to other options. In other words,<br />
the interface we provide <strong>al</strong>lows the programmer to write<br />
brief snippets of C code to define the structure of an animation<br />
and ASCII style files to control any single viewing<br />
of the animation.<br />
The programmer interface contains three classes of<br />
operations - geometric operations, operations on datastructures<br />
and motion.<br />
Geometric objects, such as polyhedra, spheres, cylinders,<br />
lines and points, can be created, removed and modified.<br />
The way each such operation is visu<strong>al</strong>ized depends<br />
on the type of object. For instance, by default,<br />
Create polyhedron fades in the given polyhedron and<br />
Create point causes a point to blink. Remov<strong>al</strong> of an<br />
object is executed in a reverse fashion. Modification of<br />
an object is constrained by its type. We can add faces to<br />
a polyhedron by c<strong>al</strong>ling Add faces, but natur<strong>al</strong>ly there is<br />
no equiv<strong>al</strong>ent operation for atomic objects such as spheres.<br />
A second class of operations de<strong>al</strong>s with data structures.<br />
GASP has a knowledge of combinatori<strong>al</strong> objects<br />
such as trees, and <strong>al</strong>lows the user to visu<strong>al</strong>ize their manipulation.<br />
For example, Create tree fades in a tree in<br />
three dimensions level by level, starting from the root (as
shown in the accompanying videotape). Add subtree is<br />
visu<strong>al</strong>ized similarly. Remove subtree fades out the appropriate<br />
subtree, level by level, starting from the leaves.<br />
A third class of operations involves the motion of objects<br />
and the scene. GASP can rotate, translate, sc<strong>al</strong>e,<br />
float (i.e., on a Bézier curve) and linearly-float an object,<br />
a group of objects, or the whole scene. Typic<strong>al</strong><br />
functions are Rotate object, Translate world,<br />
Float object, and Linear float world. For the latter<br />
two, GASP is given a number of positions, rotations<br />
and sc<strong>al</strong>es and it moves the object smoothly (similarly,<br />
linearly) through these specifications.<br />
In addition, GASP supports an Undo function which<br />
plays the animation backwards. Every primitive has a<br />
way to reverse itself visu<strong>al</strong>ly.<br />
The snippets of C code containing these operations are<br />
grouped into logic<strong>al</strong> phases, c<strong>al</strong>led atomic units. Atomic<br />
units <strong>al</strong>low the programmer to isolate phases of the <strong>al</strong>gorithm.<br />
The user encloses the operations which belong<br />
to the same unit within an atomic unit phrase and GASP<br />
executes their animation as a single unit. For example, if<br />
adding a new face to a polyhedron, creating a new plane<br />
and rotating a third object constitute one logic<strong>al</strong> unit, these<br />
operations are animated concurrently. The code to do it<br />
is:<br />
Begin_atomic("Example");<br />
Add_faces(‘‘Poly’’, face_no, faces);<br />
Create_plane(‘‘Plane’’, point1, point2,<br />
point3, point4);<br />
Rotate_object(‘‘ThirdObj’’);<br />
End_atomic();<br />
The parameter data for the various functions is part of<br />
the <strong>al</strong>gorithm being animated.<br />
The programmer need not specify how the animation<br />
appears. The user does not state in the code how each of<br />
the above operations is visu<strong>al</strong>ized, what colors to assign<br />
to objects in the scene, how long each atomic unit should<br />
take, what line width to choose, what fonts to use for<br />
the titles etc. Instead, GASP automatic<strong>al</strong>ly generates the<br />
animation, trying to create a visu<strong>al</strong>ly pleasing one.<br />
Each operation generates a piece of animation which<br />
demonstrates the specific operation in a suitable way.<br />
For instance, the operation Split Polyhedron which<br />
removes vertices from the given polyhedron, is animated<br />
by creating new polyhedra - a cone for every removed<br />
vertex. The new cones travel away from the initi<strong>al</strong> polyhedron,<br />
creating black holes in it. Each cone travels in<br />
the direction of the vector which is the difference between<br />
the vertex (which created the cone) and the center of the<br />
split polyhedron.<br />
To get a uniform appearance for the over<strong>al</strong>l animation,<br />
objects of similar types are created in the same way, and<br />
removed in the reverse way. An object which is created<br />
by, say, fading in is removed by fading out.<br />
Speci<strong>al</strong> attention is given to the issue of colors. “Color<br />
is the most sophisticated and complex of the visible language<br />
components” [18]. Most users, especi<strong>al</strong>ly inexperienced<br />
ones, do not know how to select colors. Choosing<br />
colors becomes harder when a video of a computer animation<br />
needs to be produced because colors come out<br />
very different from the way they appear on the screen.<br />
Therefore, pre-selected colors are useful. GASP maintains<br />
p<strong>al</strong>ettes of pre-selected colors, and picks colors which are<br />
appropriate for the device they are presented on.<br />
Colors are assigned to objects (or other features such<br />
as faces of a polyhedron) on the basis of their creation<br />
time. All the objects created during a single logic<strong>al</strong> phase<br />
of the <strong>al</strong>gorithm get the same color, which was not used<br />
before. This way we group related elements and make it<br />
clear to the observer what happened at which phase of the<br />
<strong>al</strong>gorithm.<br />
If a programmer wants freedom to accommodate person<strong>al</strong><br />
taste, the parameters of the animation can be modified<br />
by editing a “Style File”. The animation is still generated<br />
automatic<strong>al</strong>ly by the system but a different animation<br />
will be generated if the style file is modified. The style<br />
file affects the animation, not the implementation. This<br />
<strong>al</strong>lows the programmer to experiment with various animations<br />
of an <strong>al</strong>gorithm without ever modifying or compiling<br />
the code.<br />
Many parameters can be changed in the style file. They<br />
include, among others, the way each primitive is visu<strong>al</strong>ized,<br />
the color of the objects, the speed of each atomic<br />
unit and the number of frames it takes, the kind of colors<br />
for the animation (for videotapes or for the screen), the<br />
width of lines, the radius of points, the font of text etc.<br />
For instance, Remove object when the object is a tree,<br />
fades out the tree level after level by default. However,<br />
a parameter can be set in the style file, to fade out the<br />
whole tree at once.<br />
For example, the following is part of the style file for<br />
an animation which will be discussed in the next section.<br />
The style file determines the following aspects of the animation.<br />
The background color is light gray. The colors to<br />
be chosen by GASP are colors which fit the creation of a<br />
video (rather than the screen). Each atomic unit spans 30<br />
frames, that is, the operations within an atomic unit are<br />
divided into 30 increments of change. If the scene needs<br />
to be sc<strong>al</strong>ed, the objects will become 0.82 of their origin<strong>al</strong><br />
size. Rotation of the world is done 20 degrees around<br />
the Y axis. The atomic unit pluck is executed over 100<br />
frames, instead of over 30. The colors of the faces to be<br />
added in the atomic unit add faces are green.<br />
begin_glob<strong>al</strong>_style<br />
background = light_gray;<br />
color = VIDEO;<br />
frames = 30;<br />
sc<strong>al</strong>e_world = 0.82 0.82 0.82;<br />
rotation_world = Y 20.0;<br />
end_glob<strong>al</strong>_style<br />
begin_unit_style pluck<br />
frames = 100;<br />
end_unit_style<br />
begin_unit_style add_faces<br />
color = green;<br />
end_unit_style<br />
Note that the syntax of the style file is eminently simple.<br />
Viewer Interface: The GASP environment, illustrated<br />
in Plate 1, consists of a Control Panel through which the<br />
student controls the execution of the animation, sever<strong>al</strong><br />
windows where the <strong>al</strong>gorithm runs, c<strong>al</strong>led the Algorithm
Windows, <strong>al</strong>ong with a Text Window which explains the<br />
<strong>al</strong>gorithm.<br />
The Control Panel, which uses the VCR metaphor,<br />
helps viewers to explore the animation at their own pace.<br />
A viewer (typic<strong>al</strong>ly a student or a programmer who debugs<br />
the code) might want to stop the animation at various<br />
points of its execution. Sometimes it is desirable to fastforward<br />
through the easy parts and single-step through the<br />
hard ones to facilitate understanding. The viewer may<br />
want to “rewind” the <strong>al</strong>gorithm in order to observe the<br />
confusing parts of the <strong>al</strong>gorithm multiple times. GASP’s<br />
environment <strong>al</strong>lows this. The panel <strong>al</strong>lows running the <strong>al</strong>gorithm<br />
at varying speeds: fast(bb), slow(b), or unit by<br />
unit (b �). The an<strong>al</strong>ogous `, ``, and � ` push buttons<br />
run the <strong>al</strong>gorithm “backwards”. The viewer can PAUSE<br />
at any time to suspend the execution of the <strong>al</strong>gorithm or<br />
can EJECT the movie.<br />
The viewer observes the <strong>al</strong>gorithm in the Algorithm<br />
Windows. Algorithm windows use Inventor’s Examiner<br />
Viewer [25] and thus are decorated with thumbwheels and<br />
push buttons. With the thumbwheels, the viewer can rotate<br />
or sc<strong>al</strong>e the scene. The push buttons <strong>al</strong>low the user<br />
to reset the camera to a ”home” position, or reposition it.<br />
This <strong>al</strong>lows the user to perceive a more complete structure<br />
of the scene, to observe the objects “behind”, to view the<br />
object of interest from a different angle, or to check the<br />
relations of objects.<br />
In addition, the user can get information by pressing<br />
the push buttons in the Algorithm Window. It is possible<br />
to list the atomic units, to list the objects in the<br />
scene, print description of a chosen object (for example,<br />
when a polyhedron is picked, its vertices and faces are<br />
printed out), print the current transformation, and create<br />
a postscript file of the screen.<br />
A Text Window, supported by GASP, adds the ability<br />
to accompany the animation running on the screen<br />
with verb<strong>al</strong> explanations. Text can elucidate the events<br />
and direct the student’s attention to specific details. Every<br />
atomic unit is associated with a piece of text which<br />
explains the events occurring during this unit. When<br />
the current atomic unit changes, the text in the window<br />
changes accordingly. Voice is <strong>al</strong>so supported by GASP.<br />
The viewer can listen to the explanations that appear in<br />
the Text Window.<br />
Q qeƒ€ �� e����<br />
In this section we describe different scenarios for which<br />
we produced animations to accompany geometric papers.<br />
Excerpts from the animations are given in the accompanying<br />
video. For each case we present the problem of study,<br />
the go<strong>al</strong> in creating the animation and the animation itself.<br />
Building and Using Polyhedr<strong>al</strong> Hierarchies: This <strong>al</strong>gorithm,<br />
which is based on [10, 11], builds an advanced<br />
data structure for a polyhedron and uses it for intersecting<br />
a polyhedron and a plane. The main component of the<br />
<strong>al</strong>gorithm is a preprocessing method for convex polyhedra<br />
in 3D which creates a linear-size data structure for the<br />
polyhedron c<strong>al</strong>led its Hierarchic<strong>al</strong> Representation. Using<br />
hierarchic<strong>al</strong> representations, polyhedra can be searched<br />
(i.e., tested for intersection with planes) and merged (i.e.,<br />
tested for pairwise intersection) in logarithmic fashion.<br />
The basic geometric primitive used in constructing the<br />
hierarchic<strong>al</strong> representation is c<strong>al</strong>led the Pluck: Given a<br />
polyhedron, €H, we build a polyhedron €I by removing<br />
vertices in † (€H) 0 † (€I). The cones of faces attached<br />
to the vertices are <strong>al</strong>so removed. This leaves holes in the<br />
polyhedron €H. These holes are retriangulated in a convex<br />
fashion. Repetition of plucking on the polyhedron €I<br />
creates a new polyhedron €P. The sequence €H €I €P ...<br />
€� forms the hierarchic<strong>al</strong> representation.<br />
There were two go<strong>al</strong>s for creating the animation. First,<br />
we wanted to create a video that explains the data structure<br />
and the <strong>al</strong>gorithm for education<strong>al</strong> reasons. Second,<br />
since the <strong>al</strong>gorithm for detecting plane-polyhedr<strong>al</strong> intersection<br />
had not been implemented before, we wanted the<br />
animation as an aid in debugging the implementation.<br />
The animation explains how the hierarchy is constructed<br />
and then how it is used. In the accompanying<br />
video, however, we show only the construction process.<br />
For the first of these we explain a single pluck and then<br />
show how the hierarchy progresses from level to level.<br />
First, we show a single pluck. The animation begins<br />
by rotating the polyhedron to identify it to the user. Next<br />
we highlight a vertex and lift its cone of faces by moving<br />
them away from the polyhedron (Plate 2). Then, we add<br />
the new triangulation to the hole created (Plate 3). Fin<strong>al</strong>ly,<br />
we remove the triangulation and reattach the cone. This<br />
is done in our system by the following piece of C code,<br />
which is up to the creator of the animation to write.<br />
explain_pluck(int poly_vert_no,<br />
float (*poly_vertices)[3],<br />
int poly_face_no, long *poly_faces,<br />
char *poly_names[],<br />
int vert_no, int *vertices,<br />
int face_no, long *faces)<br />
{<br />
/* create and rotate the polyhedron */<br />
Begin_atomic("poly");<br />
Create_polyhedron("P0", poly_vert_no,<br />
poly_face_no, poly_vertices,<br />
poly_faces);<br />
Rotate_world();<br />
End_atomic();<br />
}<br />
/* remove vertices and cones */<br />
Begin_atomic("pluck");<br />
Split_polyhedron(poly_names, ‘‘P0’’,<br />
vert_no, vertices);<br />
End_atomic();<br />
/* add new faces */<br />
Begin_atomic("add_faces");<br />
Add_faces(poly_names[0], face_no, faces);<br />
End_atomic();<br />
/* undo plucking */<br />
Undo(2);<br />
Each of the operations described above is a single<br />
GASP primitive. Create polyhedron fades in the<br />
given polyhedron. Rotate world makes the scene spin.<br />
Split polyhedron highlights the vertex and splits the<br />
polyhedron as described above. Add faces fades in the
new faces. Undo removes the triangulation and brings the<br />
cone back to the polyhedron.<br />
Notice that the code does not include the graphics:<br />
Coloring, fading, traveling, speed etc. are not mentioned<br />
in the code. In the related style file, these operations are<br />
controlled. This <strong>al</strong>lows the user to experiment with the<br />
animation without modifying and recompiling the code.<br />
After explaining a single pluck, the next step is to<br />
show the pluck of an independent set of vertices. This is<br />
no more difficult than a single pluck and is achieved by<br />
the following code.<br />
animate_one_level_hierarchy(<br />
char *atomic1_name, char *atomic2_name,<br />
char *atomic3_name, char *poly_name,<br />
int vert_no, int *vertices,<br />
int face_no, long *faces,<br />
char *new_polys_names[])<br />
{<br />
Begin_atomic(atomic1_name);<br />
Split_polyhedron(new_polys_names,<br />
poly_name, vert_no, vertices);<br />
End_atomic();<br />
}<br />
Begin_atomic(atomic2_name);<br />
Add_faces( new_polys_names[0], face_no,<br />
faces);<br />
Finish_early(0.5);<br />
for (i = 1; i
<strong>al</strong>ong the sweepline is maintained in a lazy fashion, meaning<br />
that the nodes of the tree representing the cross section<br />
might correspond to segments stranded past the sweepline.<br />
In the first pass of the animation, red line segments<br />
fade into the scene. While they fade out, a green visibility<br />
map fades in on top of them, to illustrate the correlation<br />
between the segments and the map. Yellow points, representing<br />
the “interesting” events of the <strong>al</strong>gorithm, then<br />
blink. At that point, the scene is cleared and the second<br />
pass through the <strong>al</strong>gorithm begins. The viewer can watch<br />
as the sweep-line advances by rolling to its new position<br />
(the gray line in Plate 6). The animation <strong>al</strong>so demonstrates<br />
how the map is built - new subsegments fade in<br />
in blue, and then change their color to green to become<br />
a part of the <strong>al</strong>ready-built visibility map. The third pass<br />
adds more information about the process of constructing<br />
the map by showing how the the red-black tree which is<br />
maintained by the <strong>al</strong>gorithm changes. The animation <strong>al</strong>so<br />
presents the “w<strong>al</strong>ks” on the map (marked in yellow in<br />
Plate 6).<br />
There are only eleven GASP’s c<strong>al</strong>ls necessary for the<br />
creation of this animation and they are:<br />
Begin atomic, End atomic, Rotate world,<br />
Sc<strong>al</strong>e world, Create point, Create line,<br />
Create Sweepline, Modify Sweepline,<br />
Create tree, Add node to tree,<br />
Remove object.<br />
R s��������—����<br />
GASP is written in C and runs under UNIX on a Silicon<br />
Graphics Iris. It is built on top of Inventor [25] and<br />
Motif/Xt [12].<br />
GASP consists of two processes which communicate<br />
with each other through messages, as shown in Figure<br />
1. Process 1 includes the collection of procedures which<br />
make up the programmer interface. Process 2 is responsible<br />
for executing the animation and handling the viewer’s<br />
input.<br />
message<br />
user’s process process<br />
code 1<br />
2<br />
type<br />
u<br />
n<br />
i<br />
o<br />
n<br />
ID<br />
Figure 1: GASP’s Architecture<br />
x<br />
y<br />
z<br />
Inventor<br />
The user’s code initiates c<strong>al</strong>ls to procedures which belong<br />
to Process 1. Process 1 prepares one or more messages<br />
containing the type of the operation required and<br />
the relevant information for that operation and sends it<br />
to Process 2. Upon receiving the message, Process 2<br />
updates its intern<strong>al</strong> data structure or executes the animation,<br />
and sends an acknowledgement to Process 1. The<br />
acknowledgement includes intern<strong>al</strong> IDs of the objects (if<br />
necessary). Process 1, which is waiting for that message,<br />
updates the hash table of objects and returns to the user’s<br />
code.<br />
This hand-shaking approach has a few advantages.<br />
First, it enables the user to visu<strong>al</strong>ize the scene at the time<br />
when the c<strong>al</strong>ls to the system’s functions occur and thus<br />
facilitates debugging. Since rendering is done within an<br />
event mainloop, it is otherwise difficult to return to the<br />
application after each c<strong>al</strong>l. Second, compilation becomes<br />
very quick since the ’heavy’ code is in the process the application<br />
does not link to. Fin<strong>al</strong>ly, the user’s code cannot<br />
corrupt GASP’s code. This is an important point, because<br />
one of the major go<strong>al</strong>s of GASP is to ease debugging.<br />
During debugging, it is <strong>al</strong>ways a problem to figure out<br />
whose bug is it - the application’s or the system’s.<br />
Process 2, which is responsible for the graphics, works<br />
in an event mainloop. We use Inventor’s Timer-Sensor to<br />
update the graphics. This sensor goes off at regular interv<strong>al</strong>s.<br />
Every time it goes off, Process 2 checks which<br />
direction the animation is running. If it is running backwards,<br />
it updates the animation according to the phase it<br />
is in. If it is running forwards, it checks whether there is<br />
still work to do updating the animation (if yes, it does it)<br />
or it is at the point when further instructions from Process<br />
1 are needed. In the latter case, it checks to see<br />
whether there is a message sent by Process 1. It keeps<br />
accepting messages, updating its intern<strong>al</strong> data structure,<br />
and confirming the acceptance of messages until it gets<br />
an END ATOMIC message. At that point, Process 2 starts<br />
executing <strong>al</strong>l the commands specified for the atomic unit.<br />
It informs the first process upon termination.<br />
S g��������<br />
This paper has described a system GASP for automatic<strong>al</strong>ly<br />
generating visu<strong>al</strong>izations for geometric <strong>al</strong>gorithms.<br />
The main benefits of the GASP are:<br />
We have defined a hierarchy of users. The programmer<br />
need not have any knowledge of computer<br />
graphics. The code includes only manipulations of<br />
objects and modifications of data structures. GASP<br />
makes heuristic guesses for the way the animation<br />
should appear. The advanced programmer experiments<br />
with the animation by editing an ASCII style<br />
file, without ever modifying or compiling the code.<br />
The end-user explores the <strong>al</strong>gorithm and controls the<br />
execution of the <strong>al</strong>gorithm in an easy way. The<br />
GASP environment is very useful for education and<br />
debugging.<br />
Ease of use has been a main consideration in developing<br />
GASP. A typic<strong>al</strong> animation can be generated<br />
in a very short time. This is true even for highly<br />
complex geometric <strong>al</strong>gorithms.<br />
We have shown sever<strong>al</strong> animations of geometric <strong>al</strong>gorithms.<br />
The system is now at the stage where other<br />
people are starting to use it. Three [3] [9] [26] out of<br />
the eight segments of animations which appeared in the
Third Annu<strong>al</strong> Video Review of Computation<strong>al</strong> Geometry<br />
were created by GASP. Two of them were created by the<br />
geometers who wrote the papers. They took less than a<br />
week to produce.<br />
In the future, we intend to extend GASP to support<br />
four-dimension<strong>al</strong> space. This can be an inv<strong>al</strong>uable tool<br />
for research and education. We would like to experiment<br />
with GASP in an actu<strong>al</strong> classroom. We believe<br />
that animations can be used as a centr<strong>al</strong> part of teaching<br />
computation<strong>al</strong> geometry, both for demonstrating <strong>al</strong>gorithms,<br />
and for accompanying programming assignments.<br />
Fin<strong>al</strong>ly, many intriguing possibilities exist in making an<br />
electronic book out of GASP. A user will then be able to<br />
sit on the network, capture an animation, and experiment<br />
with the <strong>al</strong>gorithm.<br />
e��������������<br />
We would like to thank Bernard Chazelle for many<br />
useful comments.<br />
‚��������<br />
[1] R.M. Baecker. Sorting out sorting (video). In Siggraph<br />
Video Review 7, 1981.<br />
[2] T. Banchoff and C. Strauss. Complex Function<br />
Graphs, Dupin Cylinders, Gauss Map, and Veronese<br />
Surface. Computer Geometry Films. Brown University,<br />
1977.<br />
[3] H. Bronnimann. Almost optim<strong>al</strong> polyhedr<strong>al</strong> separators<br />
(video). In Third Annu<strong>al</strong> Video Review of Computation<strong>al</strong><br />
Geometry, June 1994.<br />
[4] M.H. Brown. Algorithm Animation. MIT Press,<br />
1988.<br />
[5] M.H. Brown. Exploring <strong>al</strong>gorithms using B<strong>al</strong>sa-II.<br />
Computer, 21(5):14–36, May 1988.<br />
[6] M.H. Brown. Zeus: A system for <strong>al</strong>gorithm animation<br />
and multi-view editing. Computer Graphics,<br />
18(3):177–186, May 1992.<br />
[7] M.H. Brown and R. Sedgewick. Techniques for <strong>al</strong>gorithm<br />
animation. IEEE Software, 2(1):28–39, January<br />
1985.<br />
[8] B. Chazelle and H. Edelsbrunner. An optim<strong>al</strong> <strong>al</strong>gorithm<br />
for intersecting line segments in the plane.<br />
Journ<strong>al</strong> of the ACM, 39(1):1–54, 1992.<br />
[9] D. Dobkin and D. Gunopulos. Computing the rectangle<br />
discrepancy (video). In Third Annu<strong>al</strong> Video<br />
Review of Computation<strong>al</strong> Geometry, June 1994.<br />
[10] D. Dobkin and D. Kirkpatrick. Fast detection of<br />
polyhedr<strong>al</strong> intersections. Journ<strong>al</strong> of Algorithms,<br />
6:381–392, 1985.<br />
[11] D. Dobkin and D. Kirkpatrick. Determining the separation<br />
of preprocessed polyhedra – a unified approach.<br />
ICALP, pages 400–413, 1990.<br />
[12] Open Software Foundation. OSF/Motif - Programmer’s<br />
Reference. Prentice H<strong>al</strong>l, Inc.<br />
[13] C. Gunn. Discrete groups and visu<strong>al</strong>ization of<br />
three-dimension<strong>al</strong> manifolds. In Computer Graphics,<br />
pages 255–262, August 1993.<br />
[14] C. Gunn and D. Maxell. Not Knot (video). Jones<br />
and Bartlett, 1991.<br />
[15] L. Lamport. A Document Preparation System L—T E X<br />
User’s Guide and Reference Manu<strong>al</strong>. Addison Wesley,<br />
1986.<br />
[16] D. Lerner and D. Asimov. The sudanese mobius<br />
band (video). In SIGGRAPH Video Review, 1984.<br />
[17] S. Levy, D. Maxell, and T. Munzner. Outside in<br />
(video). In SIGGRAPH Video Review, 1994.<br />
[18] A. Marcus. Graphics Design for Electronic Documents<br />
and user Interfaces. ACM Press.<br />
[19] N. Max. Turning a Sphere Inside Out (video). Internation<strong>al</strong><br />
Film Bureau, 1977.<br />
[20] B.A. Price, R.M. Baecker, and I.S. Sm<strong>al</strong>l. A principles<br />
taxonomy of software visu<strong>al</strong>ization. Journ<strong>al</strong> of<br />
Visu<strong>al</strong> Languages and Computing, 4:211–266, 1993.<br />
[21] P. Schorn. Robust Algorithms in a Program Library<br />
for Geometric Computation. PhD thesis, Informatikdissertationen<br />
eth zurich, 1992.<br />
[22] J. Snoeyink and J. Stolfi. Objects that cannot be<br />
taken apart with two hands. In The Ninth Annu<strong>al</strong><br />
ACM Symposium on Computation<strong>al</strong> Geometry, pages<br />
247–256, May 1993.<br />
[23] J. Stasko. The path-transition paradigm: a practic<strong>al</strong><br />
methodology for adding animation to program interface.<br />
Journ<strong>al</strong> of Visu<strong>al</strong> Languages and Computing,<br />
pages 213–236, 1990.<br />
[24] J. Stasko. Tango: A framework and system for <strong>al</strong>gorithm<br />
animation. IEEE Computer, September 1990.<br />
[25] P.S. Strauss and R. Carey. An object-oriented 3D<br />
graphics toolkit. In Computer Graphics, pages 341–<br />
349, July 1992.<br />
[26] A. T<strong>al</strong> and D. Dobkin. Gasp – a system to facilitate<br />
animating geometric <strong>al</strong>gorithms (video). In Third<br />
Annu<strong>al</strong> Video Review of Computation<strong>al</strong> Geometry,<br />
June 1994.<br />
[27] J.E. Taylor. Computing Optim<strong>al</strong> Geometries. Selected<br />
Lectures in Mathematics, American Mathematic<strong>al</strong><br />
Society, 1991.<br />
[28] J.E. Taylor. Computation<strong>al</strong> Cryst<strong>al</strong> Growers Workshop.<br />
Selected Lectures in Mathematics, American<br />
Mathematic<strong>al</strong> Society, 1992.<br />
[29] S. Wolfram. Mathematica - A System for Doing<br />
Mathematics by Computer. Addison-Wesley Publishing<br />
Company, 1988.
Plate 1: GASP’s Environment<br />
Plate 2: Removing the Cone of Faces<br />
Plate 3: Retriangulating the Polyhedron<br />
Plate 4: Objects that cannot be Taken Apart wi th<br />
Two Hands Using Translation<br />
Plate 4: Objects that cannot be Taken Apart wi th<br />
Two Hands Using Translation<br />
Plate 6: Building the Visibility Map
Virtu<strong>al</strong> Re<strong>al</strong>ity Performance for Virtu<strong>al</strong> Geometry<br />
Abstract<br />
We describe the theoretic<strong>al</strong> and practic<strong>al</strong> visu<strong>al</strong>iza�<br />
tion issues solved in the implementation of an interac�<br />
tive re<strong>al</strong>�time four�dimension<strong>al</strong> geometry interface for<br />
the CAVE� an immersive virtu<strong>al</strong> re<strong>al</strong>ity environment.<br />
While our speci�c task is to produce a �virtu<strong>al</strong> geom�<br />
etry� experience by approximating physic<strong>al</strong>ly correct<br />
rendering of manifolds embedded in four dimensions�<br />
the gener<strong>al</strong> principles exploited by our approach re�<br />
�ect requirements common to many immersive virtu<strong>al</strong><br />
re<strong>al</strong>ity applications� especi<strong>al</strong>ly those involving volume<br />
rendering. Among the issues we address are the clas�<br />
si�cation of rendering tasks� the speci<strong>al</strong>ized hardware<br />
support required to attain interactivity� speci�c tech�<br />
niques required to render 4D objects� and interactive<br />
methods appropriate for our 4D virtu<strong>al</strong> world applica�<br />
tion.<br />
1 Introduction<br />
In this paper we describe how we have combined<br />
gener<strong>al</strong> requirements for a broad class of virtu<strong>al</strong> re<strong>al</strong>ity<br />
applications with the capabilities of speci<strong>al</strong>�purpose<br />
graphics hardware to support an immersive virtu<strong>al</strong><br />
re<strong>al</strong>ity application for viewing and manipulating four�<br />
dimension<strong>al</strong> objects. We present gener<strong>al</strong> issues con�<br />
cerning the application of virtu<strong>al</strong> re<strong>al</strong>ity methods<br />
to scienti�c visu<strong>al</strong>ization� discuss how the resulting<br />
requirements are re�ected in fundament<strong>al</strong> rendering<br />
tasks� and point out where hardware features have cru�<br />
ci<strong>al</strong> roles to play. The proving ground for our gener<strong>al</strong><br />
observations is the design and implementation of an<br />
application for visu<strong>al</strong>izing a 4D mathematic<strong>al</strong> world<br />
through interaction with 3D volume images. We intro�<br />
duce a task independent rendering paradigm through<br />
which� with proper hardware support� we can produce<br />
complex re<strong>al</strong>istic images at interactive speeds.<br />
4D Visu<strong>al</strong>ization. There have been a variety of<br />
systems devoted to the gener<strong>al</strong> problem of 4D visu�<br />
<strong>al</strong>ization� ranging from the classic work of Bancho�<br />
�2� 1� to geometry viewers such as Geomview �17�� our<br />
loc<strong>al</strong> �MeshView� 4D surface viewer� and speci<strong>al</strong>ized<br />
high�performance interactive systems such as that of<br />
Banks �3�. Our virtu<strong>al</strong>�re<strong>al</strong>ity�oriented work builds on<br />
these previous e�orts and adds new features of 4D ren�<br />
dering �see� e.g.� �20� 4� 14�� that have only recently be�<br />
come technic<strong>al</strong>ly feasible to exploit interactively �11�.<br />
Such systems are v<strong>al</strong>uable tools for mathematic<strong>al</strong> re�<br />
search �16� as well as for volume and �ow��eld visu�<br />
<strong>al</strong>ization applications �13� 15�. One of our go<strong>al</strong>s is to<br />
Robert A. Cross and Andrew J. Hanson<br />
Department of Computer Science<br />
Indiana University<br />
Bloomington� IN 47405<br />
develop techniques applicable to a re<strong>al</strong>�time demon�<br />
stration of 4D and volume�based 3D rendering applica�<br />
tions in the CAVE �6�. In its present con�guration� the<br />
CAVE is a Silicon Graphics Onyx�4 Re<strong>al</strong>ityEngine 2<br />
with multiple graphics channels driving projectors for<br />
two w<strong>al</strong>l displays and the �oor� with simulator support<br />
for workstation code development.<br />
2 Virtu<strong>al</strong> Re<strong>al</strong>ity and Visu<strong>al</strong>ization of<br />
Geometry<br />
In this paper we emphasize the visu<strong>al</strong>ization of ch<strong>al</strong>�<br />
lenging classes of mathematic<strong>al</strong> objects through 3D<br />
volumetric rendering. This section outlines our view�<br />
points on the gener<strong>al</strong> issues involved in creating a vir�<br />
tu<strong>al</strong> re<strong>al</strong>ity for such domains.<br />
Ment<strong>al</strong> models. Philosophers have long wrestled<br />
with the question of the nature of re<strong>al</strong>ity� we consider<br />
re<strong>al</strong>ity to be embodied in our person<strong>al</strong> ment<strong>al</strong> models<br />
that derive from experience with natur<strong>al</strong> phenomena<br />
and <strong>al</strong>low us to cope with the qu<strong>al</strong>itative physics of<br />
everyday life. Virtu<strong>al</strong> re<strong>al</strong>ity� then� is achievable in<br />
one of two ways� we may create simulated experiences<br />
that involve the subject by exploiting existing ment<strong>al</strong><br />
models and perceptu<strong>al</strong> expectations� or we may at�<br />
tempt� by simulating phenomena with no re<strong>al</strong>�world<br />
correspondence� to create new classes of ment<strong>al</strong> mod�<br />
els� thereby extending the human experience.<br />
Necessary features. The basic features of the vir�<br />
tu<strong>al</strong> re<strong>al</strong>ity systems that concern us here are�<br />
1. Immersion. The system must physic<strong>al</strong>ly involve<br />
the user by responding to viewer motions and ac�<br />
tions� e.g.� using a head�tracker� �ying mouse�<br />
wand� etc. Regardless of whether the display<br />
medium is a simple through�the�window view or<br />
a CAVE� this intensi�es the intuition�building ex�<br />
perience.<br />
2. Interaction. The virtu<strong>al</strong> environment must re�<br />
spond to the participant�s actions at a high frame<br />
rate and provide smooth and accurate tracking<br />
of the input devices to support re<strong>al</strong>istic feedback<br />
to the viewer. The user must be able to make<br />
changes and observe immediate results in order<br />
to draw intuitive conclusions about the structure<br />
and behavior of the simulated environment.<br />
3. Visu<strong>al</strong> re<strong>al</strong>ism. Redundant re<strong>al</strong>istic visu<strong>al</strong> cues<br />
are needed to involve the participant� so we
should strive to include e�ects such as perspec�<br />
tive� attenuation with distance� specular and dif�<br />
fuse shading� shadows� motion par<strong>al</strong>lax� and oc�<br />
clusion. Providing such cues creates a more sat�<br />
isfying visu<strong>al</strong> experience� in addition to provid�<br />
ing qu<strong>al</strong>itative intuitive information at a pre�<br />
conscious level �7�.<br />
Anticipating the future. One task of the vir�<br />
tu<strong>al</strong> re<strong>al</strong>ity developer is to avoid the pitf<strong>al</strong>ls of short�<br />
sightedness. In this respect� our philosophy is to ex�<br />
tend our attention <strong>al</strong>so to approaches that are not<br />
feasible in terms of current performance� but could be<br />
drastic<strong>al</strong>ly accelerated in future hardware generations.<br />
Indeed� the development of appropriate <strong>al</strong>gorithms to<br />
keep up with the rapid evolution of the hardware may<br />
be viewed as one of the most serious ch<strong>al</strong>lenges we<br />
face� we may become imagination�limited long before<br />
the limits of the hardware technology are reached.<br />
3 Interactive Re<strong>al</strong>ism<br />
The go<strong>al</strong>s of interactivity and re<strong>al</strong>ism are contra�<br />
dictory� we must apparently compromise between the<br />
speed of scan�conversion approximations and physi�<br />
c<strong>al</strong>ly accurate but time�consuming ray�tracing meth�<br />
ods. Here we present the fundament<strong>al</strong>s of a rendering<br />
semantics that has the potenti<strong>al</strong> to support an accept�<br />
able compromise.<br />
3.1 The Toolbox<br />
The following image�level abstractions form a set<br />
of fundament<strong>al</strong> tools in terms of which we can express<br />
a remarkable number of complex geometric rendering<br />
e�ects�<br />
z�bu�er. The z�bu�er tests and option<strong>al</strong>ly replaces<br />
a geometric v<strong>al</strong>ue norm<strong>al</strong>ly representing an object�s<br />
distance seen through the pixel� complex e�ects can<br />
be achieved by selecting appropriate tests and replace�<br />
ment rules.<br />
Frame bu�er and accumulation bu�er mathe�<br />
matics. Frame bu�ers support operations that act<br />
selectively on images and include addition� multiplica�<br />
tion� logic<strong>al</strong> operations� convolution� and histograms.<br />
The accumulation bu�er� which is separate from the<br />
frame bu�er� is dedicated to image addition and sc<strong>al</strong>�<br />
ing and usu<strong>al</strong>ly has more bits per color component<br />
than the frame bu�er. Typic<strong>al</strong> applications involve<br />
averaging a number of images� as in Monte�Carlo in�<br />
tegration.<br />
Static and dynamic textures. A static texture<br />
is a common surface or volume texture map� while a<br />
dynamic texture is one that may vary between frames.<br />
For instance� we might simulate a window as a plane<br />
with the current outside view mapped onto it� as the<br />
scene outside changes� so does the texture map. In<br />
addition to storing surface color� texture maps may<br />
<strong>al</strong>so serve as lookup tables for re�ectance or shading<br />
functions.<br />
Automatic texture vertex generation. Given a<br />
texture map containing a lookup table for a function�<br />
we may not know in advance what portion of the tex�<br />
ture map is required. Texture vertices can be gen�<br />
erated automatic<strong>al</strong>ly by supplying a �possibly projec�<br />
tive� transformation function from the geometry to<br />
the texture space. For example� given a volumetric<br />
woodgrain texture� the system automatic<strong>al</strong>ly chooses<br />
the correct woodgrain to map onto a slice through the<br />
virtu<strong>al</strong> block. For a more complete discussion of tex�<br />
ture mapping operations� see �8�.<br />
3.2 First�order E�ects<br />
We consider a �rst�order e�ect to be one that re�<br />
quires a �xed� environment�independent number of<br />
primitive operations per scene element. In this sec�<br />
tion� we describe a set of useful �rst�order techniques<br />
that can be used to approximate rendering e�ects.<br />
Planar re�ection. The re�ections from a �at sur�<br />
face can be de�ned by rendering the environment from<br />
a virtu<strong>al</strong> viewpoint placed on the opposite side of the<br />
re�ecting surface� this image is then mapped onto the<br />
surface� giving the impression of a mirror.<br />
Non�planar re�ection. An environment map is<br />
de�ned as the image of a perfectly re�ecting sphere lo�<br />
cated in the environment when the viewer is in�nitely<br />
far from the sphere. Given the view direction and<br />
norm<strong>al</strong> at each vertex of a polygon� we can use au�<br />
tomatic texture vertex generation to choose texture<br />
coordinates� this gives an approximation of in�nite fo�<br />
c<strong>al</strong> length re�ection �8�.<br />
Shading maps. Texture maps can <strong>al</strong>so be used<br />
as repositories for pre�computed re�ectance functions<br />
�e.g.� di�use� Phong� Cook�Torrance� etc.�. This<br />
method produces much better behavior than hardware<br />
lighting �i.e.� Gouraud shading�� which de�nes colors<br />
only at the vertices� and so cannot place specularities<br />
inside a large polygon.<br />
Physic<strong>al</strong>ly based luminaires. A di�use emitter<br />
can be approximated by placing a projection point be�<br />
hind the planar emitter and using projective textures<br />
to shine a pre�computed cosine distribution texture<br />
map into the environment. The di�use light thus emit�<br />
ted is multiplied by each surface�s di�use light color<br />
coe�cient. Other distributions can be approximated<br />
by projecting di�erent lookup tables. If we use shad�<br />
ing maps to approximate the cosine term and distance<br />
attenuation at target polygons� we can approximate<br />
physic<strong>al</strong> luminaires.<br />
Shadows. Areas lit by a particular light can be de�<br />
�ned as areas that that light �sees�� i.e.� for sharp�<br />
edged shadows� we test whether a particular point can<br />
describe an unobstructed path to the luminaire. Us�<br />
ing the z�bu�er� we can de�ne a depth texture map<br />
from the light�s point of view. By projecting this tex�<br />
ture map into the environment and z�bu�ering from<br />
the eye�s point of view� we can compare the distance�<br />
to�the�light v<strong>al</strong>ues of visible surfaces to the projected<br />
nearest�to�the�light v<strong>al</strong>ue. If the eye sees a surface<br />
whose distance to the light is larger than the indicated<br />
minimum� it must be in shadow� if not� it is lit. If this<br />
function is applied over <strong>al</strong>l pixels to de�ne a binary<br />
black�white image� this can be multiplied by an image
containing a shadowless lit image to construct a �n<strong>al</strong><br />
image including appropriate shadows �18� 19�<br />
3.3 Second�order E�ects<br />
Second�order e�ects provide more sophisticated im�<br />
age features� and involve iteration or multiple samples<br />
to generate a single image. These methods are su��<br />
ciently expensive� at present� to preclude their use in<br />
most interactive applications. However� these meth�<br />
ods greatly increase visu<strong>al</strong> satisfaction and hardware<br />
improvements will make them increasingly practic<strong>al</strong>.<br />
Multiple samples. The accumulation bu�er <strong>al</strong>lows<br />
an elegant implementation of Monte�Carlo methods<br />
over entire images. Thus� dynamic images such as<br />
shadow maps or re�ection images can be de�ned by<br />
probabilistic sampling� producing smooth shadows or<br />
blurred re�ections. Psychologic<strong>al</strong> research indicates<br />
that smooth shadows� in particular� are important for<br />
visu<strong>al</strong> re<strong>al</strong>ism �7�.<br />
Iterated di�use and specular re�ection. If we<br />
approximate di�use emission from a single polygon<br />
and produce an image of the incident light at another�<br />
we can then emit some of this light back into the en�<br />
vironment. When this process is iterated� it becomes<br />
an approximation to radiosity and glob<strong>al</strong> illumination.<br />
This method has the advantage of being much faster<br />
than similar precomputations and has lower <strong>al</strong>gorith�<br />
mic complexity while maintaining important visu<strong>al</strong><br />
features.<br />
Participating media. Approximate volume images<br />
may be produced by cutting multiple additive slices<br />
through the viewed space. By projecting lighting dis�<br />
tributions and shadows onto these slices� we can ap�<br />
proximate the scattering of light as it passes through a<br />
foggy environment� producing visible beams and sim�<br />
ilar volume�rendering e�ects.<br />
3.4 Hardware Support<br />
At present� only the simplest of the above tech�<br />
niques are viable in a software�only interactive system<br />
with a complex environment. As our needs for re<strong>al</strong>�<br />
ism increase� so do our needs for graphics hardware<br />
support. For example� if we require Phong shading�<br />
but must implement it in software� the complexity<br />
of environments with which we can interact will be<br />
severely limited. However� given hardware texture�<br />
mapping support� we can precompute a lookup table<br />
to support an implementation of specular re�ectance<br />
functions� the hardware can wrap this texture around<br />
the objects� interpolating between computed points to<br />
produce correct images of specular objects.<br />
Our virtu<strong>al</strong> geometry applications are designed to<br />
take full advantage of the hardware support of the Sil�<br />
icon Graphics Onyx Re<strong>al</strong>ityEngine 2 . Its support for<br />
high�speed texture mapping� in particular� enables us<br />
to map large portions of our graphics computations<br />
directly onto hardware�supported primitives. For ex�<br />
ample� dynamic texture mapping and automatic tex�<br />
ture vertex generation <strong>al</strong>low us to interactively simu�<br />
late bizarre physic<strong>al</strong> illumination models such as 4D<br />
light. E�ectively� we have transformed the mathemat�<br />
ic<strong>al</strong> rendering model into a form expressible in terms<br />
of our hardware�supported high�speed toolbox. The<br />
exploitation of such transformations can greatly en�<br />
hance user comprehension through improved feedback<br />
and perceived visu<strong>al</strong> re<strong>al</strong>ism.<br />
4 Visu<strong>al</strong>ization E�ects Design<br />
The particular system that we have implemented<br />
to explore virtu<strong>al</strong> re<strong>al</strong>ity paradigms focuses on math�<br />
ematic<strong>al</strong> visu<strong>al</strong>ization in higher dimensions �11�. We<br />
create the illusion that the participant is immersed in<br />
the 3D� volumetric retina of a 4D cyclops interacting<br />
with objects in a 4D world. Among the issues we must<br />
address to achieve this are the following�<br />
4D Depth. Perceiving 4D depth requires binocular<br />
fusion of a pair of distinct 3D volume images� a 3D<br />
human would e�ectively need 2 pairs of 3D eyes to<br />
see these images at the same time �and could not fuse<br />
them anyway�. Thus we need to obtain 4D depth cues<br />
from other sources such as motion� occlusion� or depth<br />
color codes. For example� occlusions of surfaces by<br />
surfaces can be emphasized for visibility by painting or<br />
cutting away the more distant of two surfaces around<br />
an illusory intersection in a particular projection.<br />
4D Motion Cues. Motion is an important factor<br />
in our ability to perceive 3D structure monocularly�<br />
either constant�angular�velocity rigid 3D rotation or<br />
periodic rocking is an adequate substitute for a stereo<br />
display. We use rigid 4D rotations to generate mo�<br />
tion cues for our 4D monocular world that resemble<br />
familiar 3D motion cues.<br />
3D Depth. Typic<strong>al</strong> objects that we project out of<br />
4D produce volume images� though our rendered im�<br />
ages of thickened surfaces are simpli�ed since we use a<br />
thin�surface approximation to achieve acceptable ren�<br />
dering performance. Thus seeing the 3D opaque ex�<br />
terior of our objects is not enough � we want to see<br />
inside the projected shape. This causes a problem� if<br />
we make a surface transparent but featureless� like a<br />
highly in�ated b<strong>al</strong>loon� there are not enough distinct<br />
features in the image to activate 3D stereo percep�<br />
tion except <strong>al</strong>ong the outer edges of the object. Sim�<br />
ilarly� for volumetric objects whose interior is made<br />
of smooth intern<strong>al</strong> �jellylike� solids� it is di�cult to<br />
produce a strong impression of what may be a very<br />
complex intern<strong>al</strong> 3D structure.<br />
Texture. For human binocular vision to perceive<br />
a full 3D structure in one glance� smooth rendering<br />
methods are often de�cient� they do not generate the<br />
image gradients necessary for the edge matching pro�<br />
cess used in stereo depth reconstruction. One tech�<br />
nique to circumvent this problem is to spice up the<br />
featureless jelly with surface or volumetric textures.<br />
Such textures� which can be as simple as a set of grid<br />
lines or a regular or random lattice of points� provide a<br />
richer collection of image gradients to drive the stere�<br />
ographic matching process.<br />
No Slices. A common approach to representing 4D<br />
objects is to slice them up and consider them as a<br />
sequence of 3D objects� often presented as a time�<br />
sequenced animation. We insist on holistic images for<br />
our imaginary 4D retina� humans are not adept at per�<br />
ceiving 3D objects from a time sequence of 2D slices�<br />
so we do not expect that 3D slices of 4D objects will<br />
be any easier.
Lighting. In everyday life� we are able to perceive<br />
3D shapes in static photographs and drawings. We<br />
make certain assumptions about the nature of the ob�<br />
jects and lighting conditions� and apparently infer the<br />
3D structure using what is known in computer vision<br />
as a �shape from shading� <strong>al</strong>gorithm. We see objects<br />
whose structure is reve<strong>al</strong>ed by the intensity gradations<br />
re�ected from the object and by its cast shadows. Dif�<br />
fuse and specular highlights reve<strong>al</strong> addition<strong>al</strong> informa�<br />
tion about the directions of surface or volume patches<br />
that is more speci�c than� for example� gradient or<br />
isosurface information. 4D lighting permits a similar<br />
holistic depiction of a 4D object� and the structure of<br />
the lighting in the 3D projection contains many sub�<br />
tle clues about the 4D structure and its orientation<br />
relative to the 4D lights and camera.<br />
Shadows. To enhance the scene perception experi�<br />
ence� we can provide auxiliary cues such as 3D shad�<br />
ows to supplement 3D stereo perception. One can <strong>al</strong>so<br />
generate 4D shadow volumes to help reve<strong>al</strong> hidden 4D<br />
structure �12�.<br />
Occlusion. We exploit occlusion information to in�<br />
fer structure in 2D drawings representing the 3D<br />
world� a typic<strong>al</strong> mathematic<strong>al</strong> application would be<br />
the �crossing diagram� showing the unique 3D struc�<br />
ture of a knotted loop of string using over�under cross�<br />
ing markings on a 2D diagram <strong>al</strong>one. Similar phenom�<br />
ena occur in 4D� non�intersecting surfaces in 4D may<br />
appear to intersect in a curve when projected to 3D�<br />
just as 3D lines may appear f<strong>al</strong>sely to intersect when<br />
projected to 2D� pieces of 4D volumes may completely<br />
block out other 4D volumes in the 3D projection� just<br />
as 3D surfaces block �occlude� one another in 2D imag�<br />
ing. Single convex 3D and 4D objects have no occlu�<br />
sions� and so can be easily rendered using back�face<br />
culling. For 4D multiple�object scenes and non�convex<br />
objects� we can provide occlusion handling� crossing<br />
markings or depth�cued colors to emphasize the oc�<br />
currence of 4D occlusion. This is not <strong>al</strong>ways possi�<br />
ble to achieve interactively� since processing occlusions<br />
may be a memory�intensive or combinatori<strong>al</strong>ly explo�<br />
sive process.<br />
Depth Coding. A number of techniques have been<br />
proposed to provide a sense of depth in 4D graph�<br />
ics �see� e.g.� �2��� these include pseudocolor coding of<br />
depth� application of depth�dependent static or mov�<br />
ing textures� and 4D�depth dependent opacity or blur�<br />
ring.<br />
Redundancy. Typic<strong>al</strong> 3D terrain maps and graphs<br />
have redundant coding of properties such as elevation.<br />
Pseudocolor� isolevel contours� ruled surface markings�<br />
and oblique views exhibiting occlusion� illumination<br />
e�ects� and shadows may <strong>al</strong>l be combined in a single<br />
representation. 4D data representations <strong>al</strong>so pro�t<br />
from such redundancy� so we add multiple 4D cues<br />
when possible.<br />
In summary� the family of visu<strong>al</strong> e�ects that we<br />
wish to achieve involves a wide variety of issues and<br />
representation technologies. The common thread is<br />
this� we examine holistic perceptu<strong>al</strong> processes such as<br />
lighting and motion that serve us well in de<strong>al</strong>ing with<br />
our 3D world� and exploit the 4D an<strong>al</strong>ogs of those<br />
processes to encode relevant information in the 3D<br />
volume image perceived by our hypothetic<strong>al</strong> 4D being.<br />
5 Interactive Interface Design<br />
Our philosophy of 4D interaction is based on sev�<br />
er<strong>al</strong> fundament<strong>al</strong> assumptions about how human be�<br />
ings learn about the 3D world. We are <strong>al</strong>l familiar with<br />
the fact that if we are driven around a strange town�<br />
we are much less able to �nd our way later than if we<br />
do the driving ourselves. Thus we seek 4D interaction<br />
modes that emphasize the involvement of the user and<br />
promote the feeling of direct manipulation� as though<br />
4D objects were responding in some physic<strong>al</strong> way to<br />
the motions of our input devices. Successful strate�<br />
gies should therefore signi�cantly reduce the required<br />
user training time by exploiting an<strong>al</strong>ogs of familiar 3D<br />
direct manipulation.<br />
Restricting ourselves for now to single compact ob�<br />
jects lying in the center of our perceived CAVE space�<br />
we need sever<strong>al</strong> basic types of control� �1� the user<br />
moving around the 3D projected object itself� �2� rigid<br />
3D motions of the object� �3� rigid 4D rotations �and<br />
perhaps translations� of the object� �4� 4D control of<br />
the orientation of the light ray �or rays� used in the<br />
shading and shadowing processes. The �rst two capa�<br />
bilities are standard for <strong>al</strong>most <strong>al</strong>l CAVE applications.<br />
The two 4D rotation tasks� however� require the<br />
following application�speci�c design considerations�<br />
4D Orientation Control. Direct manipulation of<br />
3D orientation using a 2D mouse is typic<strong>al</strong>ly handled<br />
using a rolling b<strong>al</strong>l �9� or virtu<strong>al</strong> sphere �5� method to<br />
give the user a feeling of physic<strong>al</strong> control. Figure 1a<br />
shows the e�ect of horizont<strong>al</strong> and vertic<strong>al</strong> 3D rolling<br />
b<strong>al</strong>l motions on a cube� supposing that the cube ini�<br />
ti<strong>al</strong>ly shows only one face perpendicular to the viewer�s<br />
line of sight� moving the mouse in the positive x di�<br />
rection exposes an oblique sliver of the left�hand face�<br />
while motion in the y direction exposes the bottom<br />
face� reversing directions exposes the opposite faces.<br />
Long or repeated motions in the same direction bring<br />
cycles of 4 faces towards the viewer in turn. In the<br />
rolling b<strong>al</strong>l method� circular mouse motions counter�<br />
rotate the cube about the viewing axis� in the virtu<strong>al</strong><br />
sphere method� the mouse acts as if glued to a glass<br />
sphere� so that at a certain radius <strong>al</strong>ong the x�axis<br />
from the center� a vertic<strong>al</strong> mouse motion causes spin�<br />
ning about the viewing axis.<br />
The extension of this approach to 4D is outlined in<br />
the appendix and described in more detail in �10�. Fig�<br />
ure 1b is the 4D an<strong>al</strong>og of Figure 1a� beginning with<br />
a fully visible transparent �volume�rendered� cube�<br />
which represents a single hyperface of a hypercube per�<br />
pendicular to the 4D viewing vector� we move the 3D<br />
mouse <strong>al</strong>ong the x�axis to expose a volumetric sliver<br />
on the left� this is the oblique view of the left hyper�<br />
face. Moving the 3D mouse <strong>al</strong>ong the y�axis exposes a<br />
volumetric sliver on the bottom� moving the 3D mouse<br />
<strong>al</strong>ong the z�axis exposes a volumetric sliver on the back<br />
of the origin<strong>al</strong> volumetric cube. Reversing directions<br />
brings up the opposite hyperfaces� long motions reve<strong>al</strong><br />
cycles of 4 hyperfaces� but now there are three cycles�<br />
one each in the x� y� and z directions. How do we<br />
get ordinary rotations� say in the x�y plane� Moving
y<br />
�a�<br />
x<br />
Figure 1� Schematic diagram comparing �a� 2D mouse control of a 3D object� and �b� 3D �ying mouse control of<br />
a 4D object.<br />
the 3D mouse in sm<strong>al</strong>l circles in any plane produces<br />
counter�rotations of that plane� thus giving 3 more<br />
degrees of freedom� exhausting the 6 degrees of orien�<br />
tation<strong>al</strong> freedom in 4D. The 4D virtu<strong>al</strong> sphere action<br />
follows by exact an<strong>al</strong>ogy to the 3D case.<br />
4D Light Control. Figure 2a shows a schematic<br />
diagram of a method for controlling the 3D lighting<br />
vector using a 2D mouse� the unit vector in 3D has<br />
only two degrees of freedom� so that picking a point<br />
within a unit circle determines the direction uniquely<br />
�up to the sign of its view�direction component�. With<br />
a convention for distinguishing vectors with positive<br />
or negative view�direction components �e.g.� solid or<br />
gray�� we can uniquely choose and represent the 3D<br />
direction. Control of the vector is straightforward us�<br />
ing the rolling b<strong>al</strong>l� the lighting vector initi<strong>al</strong>ly points<br />
straight out of the screen �up in the oblique view of<br />
Figure 2b�� and moving the mouse in the desired di�<br />
rection tilts the vector to its new orientation� whose<br />
projection to the plane of Figure 2a is shown in the<br />
gray ellipse in Figure 2b. Rotating past 90 degrees<br />
moves the vector so its view�direction component is<br />
into the screen.<br />
The an<strong>al</strong>ogous control system for 4D lighting�<br />
shown in Figure 2c� is based on a similar observation�<br />
since the 4D norm<strong>al</strong> vector has only 3 independent<br />
degrees of freedom� choosing an interior point inside<br />
a solid sphere determines the vector uniquely up to<br />
the sign of its component in the unseen 4th dimension<br />
�the �4D view�direction component��. The rest of the<br />
control proceeds an<strong>al</strong>ogously. Since we cannot easily<br />
interpret 4D oblique views� we do not attempt to draw<br />
the 4D an<strong>al</strong>og of Figure 2b.<br />
z<br />
y<br />
�b�<br />
6 Examples<br />
A classic example of a non�trivi<strong>al</strong> surface embed�<br />
ded in 4D is a knotted sphere� and this is the centr<strong>al</strong><br />
demonstration we have implemented for the CAVE�<br />
Figure 3 shows the spun trefoil� the 4D knotted sphere<br />
closest in spirit to an ordinary 3D trefoil knot� while<br />
Figure 4 shows the twist�spun trefoil� which� astonish�<br />
ingly� can be shown to be unknotted in 4D.<br />
The re<strong>al</strong>�time display of these images is made possi�<br />
ble by replacing the techniques of �14�� which required<br />
up to h<strong>al</strong>f an hour per frame to render� with a dy�<br />
namic texture map implementation of �11�� resulting in<br />
update rates of up to 30 frames�second. The texture<br />
mapping support of the Re<strong>al</strong>ityEngine permitted us to<br />
represent the 4D lighting distributions on the surface<br />
using a dynamic texture map� the resulting transpar�<br />
ent volumetric image was rendered using frame bu�er<br />
addition with multiplicative opacity.<br />
Occlusion computations remain too expensive for<br />
re<strong>al</strong> time� and so we precompute the occlusions for<br />
one particular viewpoint and �x them to the object�<br />
this has the curious advantage that� when the object<br />
is rotated in 4D� one can see the explicit separation of<br />
the apparent self�intersections� and convince oneself<br />
that the �side view� shows that no self�intersections<br />
exist.<br />
In Figure 5 we show a closeup of the 4D control<br />
feedback display� which reads out the current 4D light<br />
position and 4D orientation of the centr<strong>al</strong> knotted<br />
sphere. Figure 6 is a true volume�rendered object� the<br />
hypersphere� projected from 4D to show a 3D view of<br />
its �northern hemisphere�� grid lines and a volumetric<br />
speckle texture are added within the featureless vol�<br />
ume of this object to give a clear stereographic image�<br />
as noted in Section 4.<br />
Fin<strong>al</strong>ly� in Figure 7� we step back to show how<br />
x
�a� �b� �c�<br />
Figure 2� Schematic diagram comparing �a� selecting 2D point in disk to specify 3D light direction� shown<br />
obliquely in �b�� and �c� 3D �ying mouse control of a 4D light direction by picking 3D point inside solid sphere.<br />
our mathematic<strong>al</strong> world appears in a rich virtu<strong>al</strong><br />
workspace. To illustrate some of our other capabil�<br />
ities for gener<strong>al</strong> virtu<strong>al</strong> geometry� we show in Figure 8<br />
how the knotted sphere appears in a room illuminated<br />
by a light shining through foggy air. Note the satisfy�<br />
ing e�ect of the 3D shadows cast in the room by the<br />
mathematic<strong>al</strong> objects.<br />
7 Conclusions and Future Work<br />
We have described a wide spectrum of issues in�<br />
volved in the development of an ambitious virtu<strong>al</strong> re�<br />
<strong>al</strong>ity system that attempts to immerse the viewer in a<br />
technic<strong>al</strong>ly correct four�dimension<strong>al</strong> world. The tech�<br />
niques required for this system include the optimiza�<br />
tion of rendering approximations through the use of<br />
hardware graphics operations� as well as task�speci�c<br />
approaches to enhancing user interaction. The opti�<br />
mizations used in this system apply <strong>al</strong>so to gener<strong>al</strong><br />
virtu<strong>al</strong> re<strong>al</strong>ity performance problems.<br />
While adapting our software to the CAVE� we faced<br />
par<strong>al</strong>lelization issues that did not arise on a single<br />
screen. In addition to par<strong>al</strong>lelizing the mathematics<br />
�e.g.� multi�threading the projection of four dimen�<br />
sions to three�� we de<strong>al</strong>t with other problems involving<br />
shared memory and resources. For example� one must<br />
avoid collisions on the graphics hardware� particularly<br />
during geometry transformations.<br />
In its present form� this project is approaching the<br />
limits of the target graphics hardware. We now face<br />
the standard bottleneck of textured polygon �ll rate�<br />
for instance. Extending the features of the system<br />
will require computations for which the Re<strong>al</strong>ityEngine<br />
hardware has no particular advantage� for example�<br />
the 4D occlusion c<strong>al</strong>culation is still too computation�<br />
<strong>al</strong>ly expensive for adequate interactive performance�<br />
as is depth�ordered transparency. However� the addi�<br />
tion of resources such as hardware support for large<br />
dynamic 3D textures would enable us to attack even<br />
more ch<strong>al</strong>lenging problems in virtu<strong>al</strong> geometry.<br />
Acknowledgments<br />
This work was supported in part by NSF grant IRI�<br />
91�06389. We thank George Francis� Chris Hartman�<br />
and the NCSA CAVE personnel� as well as the mem�<br />
bers of the Electronic Visu<strong>al</strong>ization Laboratory at the<br />
University of Illinois�Chicago for their support.<br />
References<br />
�1� Banchoff� T. F. Visu<strong>al</strong>izing two�dimension<strong>al</strong><br />
phenomena in four�dimension<strong>al</strong> space� A com�<br />
puter graphics approach. In Statistic<strong>al</strong> Image<br />
Processing and Computer Graphics� E. Wegman<br />
and D. Priest� Eds. Marcel Dekker� Inc.� New<br />
York� 1986� pp. 187�202.<br />
�2� Banchoff� T. F. Beyond the third dimension�<br />
Geometry� computer graphics� and higher dimen�<br />
sions. Scienti�c American Library �1990�.<br />
�3� Banks� D. Interactive manipulation and display<br />
of two�dimension<strong>al</strong> surfaces in four�dimension<strong>al</strong><br />
space. In Computer Graphics �1992 Sympo�<br />
sium on Interactive 3D Graphics� �March 1992��<br />
D. Zeltzer� Ed.� vol. 25� pp. 197�207.<br />
�4� Carey� S. A.� Burton� R. P.� and Camp�<br />
bell� D. M. Shades of a higher dimension. Com�<br />
puter Graphics World �October 1987�� 93�94.<br />
�5� Chen� M.� Mountford� S. J.� and Sellen�<br />
A. A study in interactive 3�d rotation using 2�<br />
d control devices. In Computer Graphics �1988��<br />
vol. 22� pp. 121�130. Proceedings of SIGGRAPH<br />
1988.<br />
�6� Cruz�Neira� C.� Sandin� D. J.� and De�<br />
Fanti� T. A. Surround�screen projection�based<br />
virtu<strong>al</strong> re<strong>al</strong>ity� The design and implementation of<br />
the CAVE. In Computer Graphics �SIGGRAPH<br />
�93 Proceedings� �Aug. 1993�� J. T. Kajiya� Ed.�<br />
vol. 27� pp. 135�142.<br />
�7� Goldstein� E. B. Sensation and Perception.<br />
Wadsworth Publishing Company� 1980.<br />
�8� Haeberli� P.� and Seg<strong>al</strong>� M. Texture map�<br />
ping as a fundament<strong>al</strong> drawing primitive. In
Fourth EUROGRAPHICS Workshop on Render�<br />
ing �June 1993�� M. Cohen� C. Puech� and F. Sil�<br />
lion� Eds.� pp. 259�266.<br />
�9� Hanson� A. J. The rolling b<strong>al</strong>l. In Graph�<br />
ics Gems III� D. Kirk� Ed. Academic Press� San<br />
Diego� CA� 1992� pp. 51�60.<br />
�10� Hanson� A. J. Rotations for n�dimension<strong>al</strong><br />
graphics. Tech. Rep. 406� Indiana University<br />
Computer Science Department� 1994.<br />
�11� Hanson� A. J.� and Cross� R. A. Interac�<br />
tive visu<strong>al</strong>ization methods for four dimensions.<br />
In Proceedings of Visu<strong>al</strong>ization �93 �1993�� IEEE<br />
Computer Society Press� pp. 196�203.<br />
�12� Hanson� A. J.� and Heng� P. A. Visu<strong>al</strong>izing<br />
the fourth dimension using geometry and light.<br />
In Proceedings of Visu<strong>al</strong>ization �91 �1991�� IEEE<br />
Computer Society Press� pp. 321�328.<br />
�13� Hanson� A. J.� and Heng� P. A. Four�<br />
dimension<strong>al</strong> views of 3d sc<strong>al</strong>ar �elds. In Proceed�<br />
ings of Visu<strong>al</strong>ization �92 �1992�� IEEE Computer<br />
Society Press� pp. 84�91.<br />
�14� Hanson� A. J.� and Heng� P. A. Illuminating<br />
the fourth dimension. Computer Graphics and<br />
Applications 12� 4 �July 1992�� 54�62.<br />
�15� Hanson� A. J.� and Ma� H. Visu<strong>al</strong>ization �ow<br />
with quaternion frames. In Proceedings of Vi�<br />
su<strong>al</strong>ization �94 �1994�� IEEE Computer Society<br />
Press. In these Proceedings.<br />
�16� Hanson� A. J.� Munzner� T.� and Francis�<br />
G. K. Interactive methods for visu<strong>al</strong>izable geom�<br />
etry. IEEE Computer 27� 7 �July 1994�� 73�83.<br />
�17� Phillips� M.� Levy� S.� and Munzner� T. Ge�<br />
omview� An interactive geometry viewer. No�<br />
tices of the Amer. Math. Society 40� 8 �Octo�<br />
ber 1993�� 985�988. Available by anonymous ftp<br />
from geom.umn.edu� The Geometry Center� Min�<br />
neapolis MN.<br />
�18� Reeves� W. T.� S<strong>al</strong>esin� D. H.� and Cook�<br />
R. L. Rendering anti<strong>al</strong>iased shadows with depth<br />
maps. In Computer Graphics �SIGGRAPH �87<br />
Proceedings� �July 1987�� M. C. Stone� Ed.�<br />
vol. 21� pp. 283�291.<br />
�19� Seg<strong>al</strong>� M.� Korobkin� C.� van Widenfelt�<br />
R.� Foran� J.� and Haeberli� P. E. Fast shad�<br />
ows and lighting e�ects using texture mapping.<br />
In Computer Graphics �SIGGRAPH �92 Proceed�<br />
ings� �July 1992�� E. E. Catmull� Ed.� vol. 26�<br />
pp. 249�252.<br />
�20� Steiner� K. V.� and Burton� R. P. Hidden<br />
volumes� The 4th dimension. Computer Graphics<br />
World �February 1987�� 71�74.<br />
A 4D Rolling B<strong>al</strong>l Formula<br />
For completeness� we list the 4D rolling b<strong>al</strong>l for�<br />
mula derived in �10� that is the basis for most of our<br />
4D controls� this natur<strong>al</strong> <strong>al</strong>gorithm for 4D orienta�<br />
tion control requires exactly three control parameters�<br />
thus making it ide<strong>al</strong>ly suited to the ��ying mouse� or<br />
CAVE �wand� 3�degree�of�freedom user interface de�<br />
vices. Let � X � �X� Y� Z� be a displacement obtained<br />
from the 3�degree�of�freedom input device� and de�ne<br />
r 2 � X 2�Y 2�Z 2 . Take a constant R with units 10 or<br />
20 times larger than the average v<strong>al</strong>ue of r� compute<br />
D 2 � R 2 � r 2� compute the fundament<strong>al</strong> rotation co�<br />
e�cients c � cos � � R�D� s � sin � � r�D� and then<br />
take x � X�r� y � Y �r� z � Z�r� so x 2 � y 2 � z 2 � 1.<br />
Fin<strong>al</strong>ly� rotate each 4�vector by the following matrix<br />
before reprojecting to the 3D volume image�<br />
2<br />
6<br />
4<br />
1 � x 2 �1 � c� ��1 � c�xy ��1 � c�xz sx<br />
��1 � c�xy 1 � y 2 �1 � c� ��1 � c�yz sy<br />
��1 � c�xz ��1 � c�yz 1 � z 2 �1 � c� sz<br />
�sx �sy �sz c<br />
3<br />
7<br />
5
Figure 3� Closeup of spun trefoil knot in the CAVE<br />
simulator.<br />
Figure 5� 4D control feedback display� single line<br />
shows light direction� wire�frame shows 4D orien�<br />
tation referred to a hypercube.<br />
Figure 7� User view of knotted sphere and controls<br />
inside a rich virtu<strong>al</strong> room.<br />
Figure 4� Closeup of twist�spun trefoil apparent<br />
knot in the CAVE simulator.<br />
Figure 6� The �solid textured beach�b<strong>al</strong>l� view of<br />
the hypersphere.<br />
Figure 8� Adding 3D light and fog to the virtu<strong>al</strong><br />
workspace.
Figure 3: Closeup of spun trefoil knot in the<br />
CAVE simulator.<br />
Figure 5: 4D control feedback display; single line<br />
shows light direction, wire−frame shows 4D orien−<br />
tation referred to a hypercube.<br />
Figure 7: User view of knotted sphere and controls<br />
inside a rich virtu<strong>al</strong> room.<br />
Figure 4: Closeup of twist−spun trefoil apparent<br />
knot in the CAVE simulator.<br />
Figure 6: The "solid textured beach−b<strong>al</strong>l" view of<br />
the hypersphere.<br />
Figure 8: Adding 3D light and fog to the virtu<strong>al</strong><br />
workspace.
A Library for Visu<strong>al</strong>izing Combinatori<strong>al</strong> Structures<br />
Abstract<br />
This paper describes ANIM3D, a 3D animation library<br />
targeted at visu<strong>al</strong>izing combinatori<strong>al</strong>structures. In particular,<br />
we are interested in <strong>al</strong>gorithm animation. Constructing a<br />
new view for an <strong>al</strong>gorithm typic<strong>al</strong>ly takes dozens of design<br />
iterations, and can be very time-consuming. Our library eases<br />
the programmer’s burden by providing high-level constructs<br />
for performing animations, and by offering an interpretive<br />
environment that eliminates the need for recompilations. This<br />
paper <strong>al</strong>so illustrates ANIM3D’s expressiveness by developing<br />
a 3D animation of Dijkstra’s shortest-path <strong>al</strong>gorithm in just<br />
70 lines of code.<br />
1 Background<br />
Algorithm animation is concerned with visu<strong>al</strong>izing the<br />
intern<strong>al</strong> operations of a running program in such a way that<br />
the user gains some understanding of the workings of the <strong>al</strong>gorithm.<br />
Due to lack of adequate hardware, early <strong>al</strong>gorithm animation<br />
systems were restricted to black-and-white animations<br />
at low frame rates [6]. As hardware has improved, smooth<br />
motion [11, 15], color [1], and sound [4] have been used to<br />
increase the level of expressiveness of the visu<strong>al</strong>izations.<br />
Constructing an enlightening visu<strong>al</strong>ization of an <strong>al</strong>gorithm<br />
in action is a tricky proposition, involving both artistic<br />
and pedagogic<strong>al</strong> skills of the animator. Most successful<br />
views undergo dozens of design iterations. Based on our experiences<br />
in the 1992 and 1993 SRC Algorithm Animation<br />
Festiv<strong>al</strong>s [2, 3] (20 SRC researchers participated each year),<br />
we found that a high-level animation library, coupled with<br />
an interpreted language, was instrument<strong>al</strong> in developing highqu<strong>al</strong>ity<br />
views [12].<br />
A high-level animation library <strong>al</strong>lows users to focus on<br />
what they want to animate, without having to spend too much<br />
time on the how. An interpreted language significantly shortens<br />
the time needed for each iteration in the design cycle<br />
because users do not need to recompile the view after mod-<br />
Marc A. Najork Marc H. Brown<br />
DEC Systems Research Center<br />
130 Lytton Ave.<br />
P<strong>al</strong>o Alto, CA 94301<br />
fnajork,mhbg@src.dec.com<br />
ifying its code. In fact, in our <strong>al</strong>gorithm animation system,<br />
users just need to hit the “run” button in the control panel to<br />
see their changes in action.<br />
In 1992, we began to explore how 3D graphics could<br />
be used to further increase the expressiveness of visu<strong>al</strong>izations<br />
[5]. We identified three fundament<strong>al</strong> uses of 3D for<br />
<strong>al</strong>gorithm visu<strong>al</strong>ization: Expressing fundament<strong>al</strong> information<br />
about structures that are inherently two-dimension<strong>al</strong>; uniting<br />
multiple views of the underlying structures; and capturing a<br />
history of a two-dimension<strong>al</strong> view. Fig. 1 shows snapshots of<br />
some of the 3D animations we developed.<br />
We found that building enlightening 3D views is even<br />
harder than building good 2D views. One obvious reason is<br />
that we (and most people) are much less used to designing in<br />
3D than in 2D. But a more pragmatic problem was that our<br />
3D software infrastructure was quite impoverished: We used<br />
a sm<strong>al</strong>l, object-oriented graphics library for displaying static<br />
3D scenes. This library (like the rest of our <strong>al</strong>gorithm animation<br />
system) was written in Modula-3 and used PEXlib as<br />
its underlying graphics system. This architecture was limiting<br />
both in terms of turnaround time and in terms of animation<br />
support. Therefore, drawing on our prior experience in 2D<br />
<strong>al</strong>gorithm animation, we built ANIM3D, a 3D object-oriented<br />
animation library.<br />
ANIM3D supports sever<strong>al</strong> window systems (X and Trestle<br />
[13]) and sever<strong>al</strong> graphics systems (PEX and OpenGL).<br />
The base library is implemented in Modula-3; clients can<br />
either directly c<strong>al</strong>l into this base library, or access it through<br />
Obliq [7], an interpreted embedded language. Using ANIM3D,<br />
the size of a prototypic<strong>al</strong> 3D animation (Dijkstra’s shortestpath<br />
<strong>al</strong>gorithm) decreased from about 2000 lines of Modula-3<br />
to 70 lines of Obliq, and the part of the design cycle time<br />
devoted to compiling, linking, and restarting the application<br />
from about 7 minutes to about 10 seconds of reloading by the<br />
Obliq interpreter (on a DECstation 5000/200).<br />
Although ANIM3D was designed with <strong>al</strong>gorithm animation<br />
in mind, it is a gener<strong>al</strong>-purpose animation system. We<br />
believe it to be particularly well-suited for visu<strong>al</strong>izing and<br />
animating combinatori<strong>al</strong> structures.
Figure 1: These snapshots are examples of the type of views for which A NIM3D is very well-suited. Each view requires from 50 to 200 lines of code to produce.<br />
The first snapshot shows a divide-and-conquer <strong>al</strong>gorithm for finding the closest pair of a set of points in the plane. The third dimension is used here to show the<br />
recursive structure of the <strong>al</strong>gorithm. The second snapshot shows a view of Heapsort. Each element of the array is displayed as a stick whose length and color is<br />
proportion<strong>al</strong> to its v<strong>al</strong>ue. With clever placement, the tree structure of the heap is visible from the front and the the array implementation of the tree is reve<strong>al</strong>ed<br />
from the side. The third snapshot shows a k-d tree, for k � 2. When viewed from the top, the w<strong>al</strong>ls reve<strong>al</strong> how the plane has been partitioned by the tree; when<br />
viewed from the front or side, we see the tree. The last snapshot shows a view of Shakersort. The vertic<strong>al</strong> sticks show the current v<strong>al</strong>ues of elements in the array,<br />
and the plane of “paint chips” underneath provides a history of the execution. The sticks stamp their color onto the chips plane, which is pulled forward as the<br />
execution progresses.<br />
The remainder of this paper is structured as follows. After<br />
presenting an overview of ANIM3D, we show how to use<br />
the library to construct a simple animation. The animation<br />
is of a trivi<strong>al</strong> solar system. We then build a 3D visu<strong>al</strong>ization<br />
of Dijkstra’s <strong>al</strong>gorithm for finding the shortest path in a<br />
graph. This animation can <strong>al</strong>so serve as an introduction to our<br />
methodology for animating <strong>al</strong>gorithms. Fin<strong>al</strong>ly, we discuss<br />
how ANIM3D compares with other gener<strong>al</strong>-purpose animation<br />
systems and with other <strong>al</strong>gorithm animation systems.<br />
2 An Overview of Anim3D<br />
ANIM3D is built upon three basic concepts: graphic<strong>al</strong><br />
objects, properties, and c<strong>al</strong>lbacks.<br />
A graphic<strong>al</strong> object, or “GO”, can be a geometric primitive<br />
such as a line, polygon, sphere, or cone, a light source, a<br />
camera, or a group of other GOs. Graphic<strong>al</strong> objects form a<br />
directed acyclic graph; typic<strong>al</strong>ly, the roots of the DAG are the<br />
top-level windows, the intern<strong>al</strong> nodes are groups of other GOs,<br />
and the leaves are geometric primitives, lights, or cameras.<br />
The GO class hierarchy is as follows:<br />
GO<br />
GroupGO<br />
CameraGO<br />
LightGO<br />
NonSurfaceGO<br />
SurfaceGO<br />
RootGO<br />
OrthoCameraGO<br />
PerspCameraGO<br />
AmbientLightGO<br />
VectorLightGO<br />
PointLightGO<br />
SpotLightGO<br />
LineGO<br />
MarkerGO<br />
PolygonGO<br />
BoxGO<br />
SphereGO<br />
ConeGO<br />
CylinderGO<br />
DiskGO<br />
TorusGO<br />
A property consists of two parts, a name and a v<strong>al</strong>ue.<br />
Property names are constants, such as “Surface Color” or<br />
“Sphere Radius.” Property v<strong>al</strong>ues are objects (in an objectoriented<br />
programming sense) representing colors, 3D points,<br />
re<strong>al</strong>s, etc. Because property v<strong>al</strong>ues are objects, they are both<br />
mutable and can be shared by sever<strong>al</strong> GOs. In addition, property<br />
v<strong>al</strong>ues are time-variant: the actu<strong>al</strong> v<strong>al</strong>ue encapsulated by<br />
the property v<strong>al</strong>ue depends on the current animation time, a<br />
system-wide resource.<br />
Associated with each graphic<strong>al</strong> object o is a property<br />
mapping, a parti<strong>al</strong> function from property names to property<br />
v<strong>al</strong>ues. A property associated with o not only affects the appearance<br />
of o, but <strong>al</strong>so the appearance of <strong>al</strong>l those descendants<br />
of o that do not explicitly override the property.<br />
Although it is leg<strong>al</strong> to associate any property with any<br />
graphic<strong>al</strong> object, the property does not necessarily affect the<br />
object. For example, associating a “Sphere Radius” property<br />
with an ambient light source does not affect the appearance or<br />
behavior of the light. However, associating this property with<br />
a group g potenti<strong>al</strong>ly affects <strong>al</strong>l spheres contained in g.<br />
Graphic<strong>al</strong> objects are reactive, that is, they can respond to<br />
events. We distinguish three different kinds of events: mouse<br />
events are triggered by pressing or releasing mouse buttons,<br />
position events are triggered by moving the mouse, and key<br />
events are triggered by pressing keyboard keys.<br />
Events are handled by c<strong>al</strong>lbacks. There are three types<br />
of c<strong>al</strong>lbacks, corresponding to the three kinds of events. Associated<br />
with each graphic<strong>al</strong> object are three c<strong>al</strong>lback stacks.<br />
The client can define or redefine the reactive behavior of a<br />
graphic<strong>al</strong> object by pushing a new c<strong>al</strong>lback onto the appropriate<br />
stack. The previous behavior of the graphic<strong>al</strong> object can<br />
easily be reestablished by popping the stack.<br />
Consider a mouse event e that occurs within the extent of<br />
a top-level window w. Associated with w is a RootGO r. The
top c<strong>al</strong>lback on r’s mouse c<strong>al</strong>lback stack will be invoked (if<br />
the c<strong>al</strong>lback stack is empty, the event will simply be dropped).<br />
The c<strong>al</strong>lback might perform an action, such as starting to spin<br />
the scene, or it might delegate the event to one of r’s children.<br />
3 Using Anim3D<br />
Both Modula-3 and Obliq support the concepts of modules<br />
and classes. (Obliq is based on prototypes and delegation,<br />
not classes and inheritance; however, it is expressive enough<br />
to simulate them.) For each kind of graphic<strong>al</strong> object, there is a<br />
Modula-3 module in ANIM3D. This module contains the class<br />
of the graphic<strong>al</strong> object, and a set of its associated functions and<br />
variables. For each Modula-3 module, there is a “wrapper”<br />
that makes it accessible as a module from Obliq.<br />
The module GO contains the class of <strong>al</strong>l graphic<strong>al</strong> objects.<br />
There are various methods associated with them: methods for<br />
defining, undefining, and accessing properties in the property<br />
mapping of a graphic<strong>al</strong> object, and methods for pushing and<br />
popping the three c<strong>al</strong>lback stacks of the graphic<strong>al</strong> object as<br />
well as for dispatching events to their top c<strong>al</strong>lback objects.<br />
In addition, there is one property named GO_Transform,<br />
which names the spati<strong>al</strong> transformation property and is meaningful<br />
for <strong>al</strong>l graphic<strong>al</strong> objects. Unlike other properties, a<br />
transformation property does not “override” other transformations<br />
that are closer to the root, but is rather composed with<br />
them.<br />
The module GroupGO contains the class of <strong>al</strong>l graphic<strong>al</strong><br />
object groups, i.e. graphic<strong>al</strong> objects which are used to group<br />
other graphic<strong>al</strong> objects together. The GroupGO class has<br />
methods for adding elements to a group and removing them<br />
again. The module <strong>al</strong>so contains a functionNew, which creates<br />
a new group and returns it.<br />
A 3D window is regarded as a speci<strong>al</strong> form of group,<br />
which contains <strong>al</strong>l the objects in a scene (we therefore c<strong>al</strong>l it<br />
the “root” of the scene), and has some addition<strong>al</strong> properties,<br />
such as the color of the background, whether depth cueing is<br />
in effect, etc. Also associated with each window is the camera<br />
that is currently active, and a “graphics base,” an abstraction<br />
of the underlying windows and graphics system. Fin<strong>al</strong>ly, the<br />
Figure 2: The ANIM3D Solar System<br />
RootGO module contains functions New and NewStd. The<br />
latter creates a new scene root object with reasonable default<br />
elements, c<strong>al</strong>lbacks, and properties (a perspective camera, two<br />
white light sources, top-level reactive behavior that <strong>al</strong>lows<br />
the user to rotate and move the scene, and various surface<br />
properties).<br />
Both PEX and OpenGL distinguish between lines and<br />
surfaces: surfaces are affected by light sources, lines are not.<br />
There are a variety of properties common to <strong>al</strong>l surfaces: their<br />
color, transparency, reflectivity, shading model, and so on. Although<br />
it is leg<strong>al</strong> to attach these properties to non-surfaces, it<br />
will not affect them. In order to emphasize that these properties<br />
are meaningful only for surfaces, we provide a module<br />
SurfaceGO, which contains the superclass of <strong>al</strong>l graphic<strong>al</strong><br />
objects composed of surfaces, <strong>al</strong>ong with their related properties.<br />
We are provide a NonSurfaceGO module for lines and<br />
markers.<br />
The module SphereGO contains the class of spheres,<br />
which is a subclass of the SurfaceGO class, as spheres are<br />
composed of triangles, i.e. surfaces. Apart from the definition<br />
of the sphere class, it contains a function New for creating new<br />
sphere objects, and property names Center and Radius,<br />
which are used to identify the properties determining the center<br />
and the radius of the sphere.<br />
Here is a complete Obliq program to display a planet and<br />
its moon. The user can control the camera using the mouse.<br />
This scene is displayed in the left snapshot of Fig. 2.<br />
let root = RootGO_NewStd();<br />
let planet = SphereGO_New([0,0,0],1);<br />
SurfaceGO_SetColor(planet,"lightblue");<br />
root.add(planet);<br />
let moon = SphereGO_New([3,0,0],0.5);<br />
SurfaceGO_SetColor(moon,"offwhite");<br />
root.add(moon);<br />
Property v<strong>al</strong>ues can be time-variant; that is, their v<strong>al</strong>ue depends<br />
on the time of the animation clock. Time-variant property<br />
v<strong>al</strong>ues can either be unsynchronized or synchronized.<br />
An unsynchronized time-variant property v<strong>al</strong>ue starts to<br />
change at the moment it is created, and animates the graphic<strong>al</strong><br />
object o as long as it is attached to o. The animation does not
need to be triggered by any speci<strong>al</strong> command. For instance,<br />
unsynchronized property v<strong>al</strong>ues can be used to rotate the scene<br />
or some part of it for an indefinite period of time.<br />
Synchronized property v<strong>al</strong>ues, on the other hand, are used<br />
to animate sever<strong>al</strong> aspects of a scene in a coordinated fashion.<br />
Each synchronized property v<strong>al</strong>ue is “tied” to an animation<br />
handle, and many v<strong>al</strong>ues can be tied to the same handle. A synchronized<br />
property v<strong>al</strong>ue object accepts animation requests,<br />
messages that ask it to change its current v<strong>al</strong>ue, beginning at<br />
some starting time and lasting for a certain duration. When<br />
a client sends an animation request to a property v<strong>al</strong>ue, the<br />
request is not immediately satisfied, but instead stored in a request<br />
queue loc<strong>al</strong> to the property v<strong>al</strong>ue. Sending the message<br />
animate to an animation handle causes <strong>al</strong>l property v<strong>al</strong>ues<br />
controlled by this handle to be animated in synchrony. The<br />
c<strong>al</strong>l to animate returns when <strong>al</strong>l animations are completed.<br />
When added to the above program, the following few<br />
lines create a 25-second animation. The planet rotates six<br />
times about its axis, while the moon revolves once around the<br />
planet. In order to better show the rotation, we add a red torus<br />
around the planet, <strong>al</strong>igned to the axis of rotation. See Fig. 2,<br />
the three frames at the right.<br />
let torus = TorusGO_New([0,0,0],[1,0,0],1,0.1);<br />
root.add(torus);<br />
SurfaceGO_SetColor(torus,"red");<br />
let ah = AnimHandle_New();<br />
let planettransform = TransformProp_NewSync(ah);<br />
planet.setProp(GO_Transform,planettransform);<br />
torus.setProp(GO_Transform,planettransform);<br />
let moontransform = TransformProp_NewSync(ah);<br />
moon.setProp(GO_Transform,moontransform);<br />
moontransform.getBeh().rotateY(2*PI,0,25);<br />
planettransform.getBeh().rotateY(12*PI,0,25);<br />
ah.animate();<br />
Note that we chose to attach the same transformation property<br />
to both the torus and the planet. Alternatively, we could have<br />
made a group containing both, and attached the transformation<br />
property just to this group.<br />
4 Case Study:<br />
Shortest-Path Algorithm Animation<br />
This section contains a case study of using ANIM3D with<br />
the Zeus <strong>al</strong>gorithm animation system [1] to develop an animation<br />
of Dijkstra’s shortest-path <strong>al</strong>gorithm. We first describe<br />
the <strong>al</strong>gorithm, and then sketch the desired visu<strong>al</strong>ization of the<br />
<strong>al</strong>gorithm. Next, we present an overview of the Zeus methodology<br />
and fin<strong>al</strong>ly, we present the actu<strong>al</strong> implementation of the<br />
animation.<br />
The implementation consists of three elements. First, we<br />
define a set of “interesting events,” used for communication<br />
between the <strong>al</strong>gorithm and the view. Second, we annotate the<br />
<strong>al</strong>gorithm with the events. And fin<strong>al</strong>ly, we build a view, a<br />
window that displays interesting events graphic<strong>al</strong>ly.<br />
4.1 The Algorithm<br />
The single-source shortest-path problem can be stated as<br />
follows: given a directed graph G � �V� E� with weighted<br />
edges, and a designated vertex s, c<strong>al</strong>led the source, find the<br />
shortest path from s to <strong>al</strong>l other vertices. The length of a path<br />
is defined to be the sum of the weights of the edges <strong>al</strong>ong the<br />
path.<br />
The following <strong>al</strong>gorithm, due to Dijkstra [10], solves this<br />
problem (assuming <strong>al</strong>l edge weights are non-negative):<br />
for <strong>al</strong>l v 2 V do D�v� :� 1<br />
D�s� :� 0; S :� �<br />
while V n S 6� � do<br />
let u 2 V n S such that D�u� is minim<strong>al</strong><br />
S :� S � fug<br />
for <strong>al</strong>l neighbors v of u do<br />
D�v� :� minfD�v�� D�u� � W�u� v�g<br />
endfor<br />
endwhile<br />
In this pseudo-code, D�v� is the distance from s to v, W�u� v�<br />
is the weight of the edge from u to v, and S is the set of<br />
vertices that have been explored thus far. V n S denotes those<br />
elements in V that are not <strong>al</strong>so in S.<br />
4.2 The Desired Visu<strong>al</strong>ization<br />
An interesting 3D animation of this <strong>al</strong>gorithm is shown<br />
in Fig. 3. The vertices of the graph are displayed as white<br />
disks in the xy plane. Above each vertex v is a green column<br />
representing D�v�, the best distance from s to v known so far.<br />
Initi<strong>al</strong>ly, the columns above each vertex other than s will be<br />
infinitely (or at least quite) high. An edge from u to v with<br />
weight W�u� v� is shown by a white arrow which starts at the<br />
column over u at height 0 and ends at the column over v at<br />
height W�u� v�.<br />
Whenever a vertex u is selected to be added to S, the<br />
color of the corresponding disk changes from white to red.<br />
The addition D�u� � W�u� v� is animated by highlighting the<br />
arrow corresponding to the edge �u� v� and lifting it to the top<br />
of the column (i.e. raising it by D�u�). If D�u� � W�u� v�<br />
is sm<strong>al</strong>ler than D�v�, the end of the arrow will still touch the<br />
green column over D�v�, otherwise, it will not. In the former<br />
case, we shrink the column over v to height D�u� � W�u� v�<br />
to reflect the assignment of a new v<strong>al</strong>ue to D�v�, and color the<br />
arrow red, to indicate that it became part of the shortest-path<br />
tree. Otherwise, the arrow simply disappears.<br />
Upon completion, the 3D view shows a set of red arrows<br />
which form the shortest-path tree, and a set of green columns<br />
which represent the best distance D�v� from s to v.
Figure 3: These snapshots are from the animation of Dijkstra’s shortest-path <strong>al</strong>gorithm described in section 4. The left snapshot shows the data just before entering<br />
the main loop. The next snapshot shows the <strong>al</strong>gorithm about one-third complete. In the third snapshot, the <strong>al</strong>gorithm is about 2/3 complete, and the snapshot at<br />
the right shows the <strong>al</strong>gorithm upon completion.<br />
4.3 Zeus Methodology<br />
In the Zeus framework, strategic<strong>al</strong>ly important points of<br />
an <strong>al</strong>gorithm are annotated with procedure c<strong>al</strong>ls that generate<br />
“interesting events.” These events are reported to the Zeus<br />
event manager, which in turn forwards them to <strong>al</strong>l interested<br />
views. Each view responds to interesting events by drawing<br />
appropriate images. The advantages of this methodology are<br />
described elsewhere [6].<br />
4.4 The Interesting Events<br />
The interesting events for Dijkstra’s shortest-path <strong>al</strong>gorithm<br />
(and many other shortest-path <strong>al</strong>gorithms) are as follows:<br />
� addVertex(u,x,y,d) adds a vertex u (where u is an<br />
integer identifying the vertex) to the graph. The vertex<br />
is shown at position �x� y� in the xy plane. In addition,<br />
D�u� is declared to be d.<br />
� addEdge(u,v,w) adds an edge from u to v with<br />
weight w to the graph.<br />
� selectVertex(u) indicates that u was added to S.<br />
� raiseEdge(u,v,d) visu<strong>al</strong>izes the addition D�u� �<br />
W�u� v� by raising the edge �u� v� by d (where the c<strong>al</strong>ler<br />
passes D�u� for d).<br />
� lowerDist(u,d) indicates that D�u� gets lowered to<br />
d.<br />
� promoteEdge(u,v) indicates that the edge �u� v� is<br />
part of the shortest-path tree.<br />
� demoteEdge(u,v) indicates that the edge �u� v� is not<br />
part of the shortest-path tree.<br />
In addition, we need another event for house keeping purposes:<br />
� start(m) is c<strong>al</strong>led at the very beginning of an <strong>al</strong>gorithm’s<br />
execution; it initi<strong>al</strong>izes the view to hold up to m<br />
vertices and up to m 2 edges.<br />
4.5 Annotating the Algorithm<br />
Here is an annotated version of the <strong>al</strong>gorithm we showed<br />
before:<br />
views.start(jV j)<br />
for <strong>al</strong>l v 2 V do D�v� :� 1<br />
D�s� :� 0; S :� �<br />
for <strong>al</strong>l v 2 V do views.addVertex(v,v x,v y,D�v�)<br />
for <strong>al</strong>l �u� v� 2 E do views.addEdge(u,v,W�u� v�)<br />
while V n S 6� � do<br />
let u 2 V n S such that D�u� is minim<strong>al</strong><br />
S :� S � fug<br />
views.selectVertex(u)<br />
for <strong>al</strong>l neighbors v of u do<br />
views.raiseEdge(u,v,D�u�)<br />
if D�v� � D�u� � W�u� v� then<br />
views.demoteEdge(u,v)<br />
else<br />
D�v� :� D�u� � W�u� v�<br />
views.promoteEdge(u,v)<br />
views.lowerDist(v,D�v�)<br />
endif<br />
endfor<br />
endwhile<br />
In this pseudo-code, views is the dispatcher provided by<br />
Zeus. The dispatcher will notify <strong>al</strong>l views the user has selected<br />
for the <strong>al</strong>gorithm.<br />
4.6 The View<br />
A view is an object that has a method corresponding to<br />
each interesting event, and a number of data fields. In this<br />
view, the data fields are as follows: a RootGO object that<br />
contains <strong>al</strong>l graphic<strong>al</strong> objects of the scene, together with a<br />
camera and light sources; arrays of graphic<strong>al</strong> objects holding<br />
the disks (vertices), columns (distances), arrows (graph edges),<br />
and shortest-path tree edges; and an “animation handle” for
w<br />
c<br />
e<br />
b a<br />
Figure 4: The structure of an arrow generated by the addEdge method.<br />
triggering animations. This leads us to a skelet<strong>al</strong> view:<br />
let view = {<br />
scene => RootGO_NewStd(),<br />
ah => AnimHandle_New(),<br />
verts => ok, (* initi<strong>al</strong>ized by method start *)<br />
dists => ok, (* initi<strong>al</strong>ized by method start *)<br />
parent => ok, (* initi<strong>al</strong>ized by method start *)<br />
edges => ok, (* initi<strong>al</strong>ized by method start *)<br />
start => meth(self,m) ... end,<br />
addVertex => meth(self,u,x,y) ... end,<br />
addEdge => meth(self,u,v,w) ... end,<br />
selectVertex => meth(self,u) ... end,<br />
raiseEdge => meth(self,u,v,z) ... end,<br />
lowerDist => meth(self,u,z) ... end,<br />
promoteEdge => meth(self,u,v) ... end,<br />
demoteEdge => meth(self,u,v) ... end,<br />
};<br />
The Zeus system has a control panel that <strong>al</strong>lows the user to<br />
select an <strong>al</strong>gorithm and attach any number of views to it.<br />
Whenever the user creates a new 3D view, a new Obliq interpreter<br />
is started, and reads the view definition. The <strong>al</strong>gorithm<br />
and <strong>al</strong>l views run in the same process, but in different threads;<br />
thread creation is very light-weight. The above expression<br />
creates a new object view, and initi<strong>al</strong>izes view.scene to<br />
be a RootGO, and view.ah to be an animation handle.<br />
The remainder of this section fleshes out the 8 methods<br />
of view, which correspond to the 8 interesting events:<br />
� The start method is responsible for initi<strong>al</strong>izing<br />
view.verts, view.dists, and view.parent to be<br />
arrays of size m, and view.edges to be an m � m array.<br />
The elements of the newly created arrays are initi<strong>al</strong>ized to<br />
the dummy v<strong>al</strong>ue ok. Here is the code:<br />
start => meth(self,m)<br />
self.verts := array_new(m, ok);<br />
self.dists := array_new(m, ok);<br />
self.parent := array_new(m, ok);<br />
self.edges := array2_new(m, m, ok);<br />
end<br />
� The addVertex method adds a new vertex to the view.<br />
Vertices are represented by white disks that lie in the xy<br />
plane. Above each vertex, we <strong>al</strong>so show a green column of<br />
height d, provided that d is greater than 0. The location of<br />
the cylinder’s base is constant, while its top is controlled by<br />
an animatable point property v<strong>al</strong>ue.<br />
addVertex => meth(self,u,x,y,d)<br />
self.verts[u] := DiskGO_New(<br />
[x,y,0],<br />
[0,0,1],<br />
0.2);<br />
self.scene.add(self.verts[u]);<br />
if d > 0 then<br />
let top = PointProp_NewSync(self.ah,[x,y,d]);<br />
self.dists[u] := CylinderGO_New(<br />
[x,y,0],<br />
top,<br />
0.1);<br />
SurfaceGO_SetColor(self.dists[u],"green");<br />
self.scene.add(self.dists[u]);<br />
end;<br />
end<br />
� The addEdge method adds an edge (represented by an<br />
arrow) from vertex u to vertex v. The arrow starts at the at<br />
the disk representing u, and ends at the column over v at<br />
height w. An arrow is composed of a cone, a cylinder, and<br />
two disks; its geometry is computed based on the “Center”<br />
property of the disks representing the vertices to which it is<br />
attached. Figure 4 illustrates the relationship.<br />
addEdge => meth(self,u,v,w)<br />
let a = DiskGO_GetCenter(self.verts[u]).get();<br />
let b = DiskGO_GetCenter(self.verts[v]).get();<br />
let c = Point3_Plus(b,[0,0,w]);<br />
let d = Point3_Minus(c,a);<br />
let e = Point3_Minus(c,Point3_Sc<strong>al</strong>e(d,0.4));<br />
let grp = GroupGO_New();<br />
grp.setProp(GO_Transform,<br />
TransformProp_NewSync(self.ah));<br />
grp.add(DiskGO_New(a,d,0.1));<br />
grp.add(CylinderGO_New(a,e,0.1));<br />
grp.add(DiskGO_New(e,d,0.2));<br />
grp.add(ConeGO_New(e,c,0.2));<br />
self.edges[u][v] := grp;<br />
self.scene.add(grp);<br />
end<br />
� The selectVertex method indicates that a vertex u has<br />
been added to the set S by coloring u’s disk red:<br />
selectVertex => meth(self,u)<br />
SurfaceGO_SetColor(self.verts[u],"red");<br />
end
� The raiseEdge method highlights the edge from u to v<br />
by coloring it yellow, and then lifting it up by z. The arrow<br />
is moved by sending a “translate” request to its transformation<br />
property. The translation is controlled by the animation<br />
handle self.ah, and sh<strong>al</strong>l take 2 seconds to complete.<br />
C<strong>al</strong>ling self.ah.animate() causes <strong>al</strong>l animation requests<br />
controlled by self.ah to be processed.<br />
raiseEdge => meth(self,u,v,z)<br />
SurfaceGO_SetColor(self.edges[u][v],"yellow");<br />
let pv = GO_GetTransform(self.edges[u][v]);<br />
pv.getBeh().translate(0,0,z,0,2);<br />
self.ah.animate();<br />
end<br />
� The method lowerDist indicates that the “cost” D�u� of<br />
vertex u got lowered, by shrinking the green cylinder representing<br />
D�u�. This is done by sending a linMoveTo<br />
(“move over a linear path to”) request to the “Point2” property<br />
of the cylinder.<br />
lowerDist => meth(self,u,z)<br />
let pv = CylinderGO_GetPoint2(self.dists[u]);<br />
let p = pv.get();<br />
pv.getBeh().linMoveTo([p[0], p[1], z], 0, 2);<br />
self.ah.animate();<br />
end<br />
� The method promoteEdge indicates that �u� v�, the edge<br />
that is currently highlighted, sh<strong>al</strong>l become part of the<br />
shortest-path tree. This is indicated by coloring the edge<br />
red. If there <strong>al</strong>ready was a red edge leading to v, it is<br />
removed from the view.<br />
promoteEdge => meth(self,u,v)<br />
SurfaceGO_SetColor(self.edges[u][v],"red");<br />
if self.parent[v] isnot ok then<br />
self.demoteEdge(self.parent[v],v);<br />
end;<br />
self.parent[v] := u;<br />
end<br />
� Fin<strong>al</strong>ly, the method demoteEdge removes the edge �u� v�<br />
from the view:<br />
demoteEdge => meth(self,u,v)<br />
self.scene.remove(self.edges[u][v]);<br />
end<br />
This completes our example. The complete view is about<br />
70 lines of code, compared to the roughly 2000 lines of the<br />
PEXlib-based version that generated the animations presented<br />
in [5]. This measure is fairly honest; we did not add any function<strong>al</strong>ity<br />
(such as a new class ArrowGO) to the base library in<br />
order to optimize this example. Furthermore, turnaround time<br />
during the design of this view was limited only by the design<br />
process per se (and our typing speed), whereas compiling a<br />
single file and relinking with the Zeus system takes sever<strong>al</strong><br />
minutes.<br />
5 Related Work<br />
There are two areas that have influenced ANIM3D:<br />
gener<strong>al</strong>-purpose 3D animation libraries and <strong>al</strong>gorithm animation<br />
systems that have been used for developing 3D views.<br />
The most closely related gener<strong>al</strong>-purpose animation library<br />
is OpenInventor [17, 18], an object-oriented graphics<br />
library with a C++ API. OpenInventor, like ANIM3D, represents<br />
a scene as a DAG of “nodes”. Geometric primitives,<br />
cameras, lights, and groups are <strong>al</strong>l speci<strong>al</strong> types of nodes.<br />
However, there are three key differences between ANIM3D<br />
and OpenInventor:<br />
� ANIM3D includes an embedded interpretive language,<br />
which is instrument<strong>al</strong> for achieving fast turnaround and<br />
short design cycles.<br />
� OpenInventor views properties (such as colors and transformations)<br />
as ordinary nodes in the scene DAG. This<br />
means that the order of nodes in a group becomes important.<br />
In this respect, ANIM3D is more declarative than<br />
OpenInventor: the order in which objects are added to a<br />
group does not matter.<br />
� In a number of aspects, OpenInventor requires the programmer<br />
to do more work than ANIM3D requires. For<br />
example, OpenInventor clients have to explicitly redraw<br />
a scene whereas ANIM3D uses a damage-repair model to<br />
automatic<strong>al</strong>ly redraw just those primitives that need to be<br />
redrawn.<br />
Nonetheless, OpenInventor is a very impressive commerci<strong>al</strong><br />
product that greatly simplifies 3D graphics. Many of the<br />
ideas of OpenInventor can be found in work done at Brown<br />
University [16, 19].<br />
There are three <strong>al</strong>gorithm animation systems that have<br />
been used for developing 3D views, Pavane, Polka3D, and<br />
GASP.<br />
In Pavane [8], the computation<strong>al</strong> model is based on tuplespaces<br />
and mappings between them. Entering tuples into<br />
the “animation tuple space” has the side-effect of updating the<br />
view. A sm<strong>al</strong>l collection of 3D primitives are available (points,<br />
lines, polygons, circles, and spheres), and the only animation<br />
primitives are to change the positions of the primitives.<br />
Polka3D [14], like Zeus, follows the BALSA model for<br />
animating <strong>al</strong>gorithms. Algorithms communicate with views<br />
using “interesting events,” and views draw on the screen in<br />
response to the events. The graphics library is similar to<br />
ANIM3D in go<strong>al</strong>s and features, but it appears to be a bit slimmer<br />
and more focused on <strong>al</strong>gorithm animations. Unlike our<br />
system, views are not interpreted, so turnaround time is not<br />
instantaneous.<br />
The GASP [9] system is tuned for developing animations<br />
of computation<strong>al</strong> geometry <strong>al</strong>gorithms involving three (and<br />
two) dimensions. Because a primary go<strong>al</strong> of the system is to
isolate the user from details of how the graphics is done, a user<br />
is limited to choosing from among a collection of animation<br />
effects supplied by the system. The viewing choices are typic<strong>al</strong>ly<br />
stored in a separate “style” file that is read by the system<br />
at runtime; thus, GASP provides rapid turnaround. However,<br />
it does not provide the flexibility to develop arbitrary views<br />
with arbitrary animation effects.<br />
6 Conclusion<br />
The first part of this paper described ANIM3D, an objectoriented<br />
3D animation library targeted at visu<strong>al</strong>izing combinatori<strong>al</strong><br />
structures, and in particular at animating <strong>al</strong>gorithms.<br />
The second part presented a case study showing how to use<br />
ANIM3D within the Zeus <strong>al</strong>gorithm animation system for producing<br />
a 3D visu<strong>al</strong>ization of a graph-travers<strong>al</strong> <strong>al</strong>gorithm.<br />
ANIM3D is based on three concepts: scenes are described<br />
by DAGs of graphic<strong>al</strong> objects, time-variant property v<strong>al</strong>ues<br />
are the basic animation mechanism, and c<strong>al</strong>lbacks are the<br />
mechanism by which clients can specify reactive behavior.<br />
These concepts provide a simple, yet powerful framework for<br />
building animations.<br />
ANIM3D provides fast turnaround by incorporating an<br />
interpretive language that <strong>al</strong>lows the user to modify the code<br />
of a program even as it runs. Previous experience has shown<br />
us that powerful animation facilities and fast turnaround time<br />
are cruci<strong>al</strong> for enabling non-expert users to construct new<br />
<strong>al</strong>gorithm animations.<br />
7 Acknowledgments<br />
We are grateful to Allan Heydon and Lucille Glassman<br />
for helping to improve the qu<strong>al</strong>ity of the presentation.<br />
References<br />
[1] Marc H. Brown. Zeus: A System for Algorithm Animation<br />
and Multi-View Editing. 1991 IEEE Workshop on<br />
Visu<strong>al</strong> Languages (October 1991), 4–9.<br />
[2] Marc H. Brown. The 1992 SRC Algorithm Animation<br />
Festiv<strong>al</strong>. 1993 IEEE Symposium on Visu<strong>al</strong> Languages<br />
(August 1993), 116–123.<br />
[3] Marc H. Brown. The 1993 SRC Algorithm Animation<br />
Festiv<strong>al</strong>. Research Report 126, Digit<strong>al</strong> Equipment Corp.,<br />
Systems Research Center, P<strong>al</strong>o Alto, CA (1994).<br />
[4] Marc H. Brown and John Hershberger. Color and Sound<br />
in Algorithm Animation. Computer, 25(12):52–63, December<br />
1992.<br />
[5] Marc H. Brown and Marc Najork. Algorithm Animation<br />
Using 3D Interactive Graphics. ACM Symposium on User<br />
Interface Software and Technology (November 1993),<br />
93–100.<br />
[6] Marc H. Brown and Robert Sedgewick. A System for<br />
Algorithm Animation. Computer Graphics, 18(3):177–<br />
186, July 1984.<br />
[7] Luca Cardelli. Obliq: A language with distributedscope.<br />
Research Report 122, Digit<strong>al</strong> Equipment Corp., Systems<br />
Research Center, P<strong>al</strong>o Alto, CA (April 1994).<br />
[8] Gruia-Cat<strong>al</strong>in Roman, Kenneth C. Cox, C. Don<strong>al</strong>d<br />
Wilcox, and Jerome Y. Plun. Pavane: A System for<br />
Declarative Visu<strong>al</strong>ization of Concurrent Computations.<br />
Journ<strong>al</strong> of Visu<strong>al</strong> Languages and Computing, 3(2):161–<br />
193, June 1992.<br />
[9] David Dobkin and Ayellet T<strong>al</strong>. GASP—A System to Facilitate<br />
Animating Geometric Algorithms. Technic<strong>al</strong> Report,<br />
Department of Computer Science, Princeton University,<br />
1994.<br />
[10] E. W. Dijkstra. A note on two problems in connexion<br />
with with graphs. Numerische Mathematik, 1:269–271,<br />
1959.<br />
[11] Robert A. Duisberg. Animated Graphic<strong>al</strong> Interfaces Using<br />
Tempor<strong>al</strong> Constraints. ACM CHI ’86 Conf. on Human<br />
Factors in Computing (April 1986), 131–136.<br />
[12] Steven C. Glassman. A Turbo Environment for Producing<br />
Algorithm Animations. 1993 IEEE Symp. on Visu<strong>al</strong><br />
Languages (August 1993), 32–36.<br />
[13] Mark S. Manasse and Greg Nelson. Trestle Reference<br />
Manu<strong>al</strong>. Research Report 68, Digit<strong>al</strong> Equipment Corp.,<br />
Systems Research Center, P<strong>al</strong>o Alto, CA, December<br />
1991.<br />
[14] John T. Stasko and Joseph F. Wehrli. Three-Dimension<strong>al</strong><br />
Computation Visu<strong>al</strong>ization. 1993 IEEE Symposium on<br />
Visu<strong>al</strong> Languages (August 1993), 100 – 107.<br />
[15] John T. Stasko. TANGO: A Framework and System for<br />
Algorithm Animation. Computer, 23(9):27–39, September<br />
1990.<br />
[16] Paul S. Strauss. BAGS: The Brown Animation Generation<br />
System. Technic<strong>al</strong> Report CS–88–22, Brown University,<br />
May 1988.<br />
[17] Paul S. Strauss. IRIS Inventor, a 3D Graphics Toolkit.<br />
OOPSLA’93 Conf. Proc., (September 1993), 192–200.<br />
[18] Paul S. Strauss and Rikk Carey. An Object-Oriented<br />
3D Graphics Toolkit. ACM Computer Graphics (SIG-<br />
GRAPH ’92) (July 1992), 341–349.<br />
[19] Robert C. Zeleznik et <strong>al</strong>. An Object-Oriented Framework<br />
for the Integration of Interactive Animation Techniques.<br />
ACM Computer Graphics (SIGGRAPH ’91), (July 1991),<br />
105–111.
Figure 1a: Closest-Pair Figure 1b: Heapsort<br />
Figure 1c: k-d Tree Figure 1d: Shakersort<br />
Figure 1e: Red-Black and 2-3-4 Trees Figure 3c: Shortest-Path
Strata�Various� � Multi�Layer Visu<strong>al</strong>ization of Dynamics<br />
in Software System Behavior<br />
Abstract<br />
Current software visu<strong>al</strong>ization tools are inadequate<br />
for understanding� debugging� and tuning re<strong>al</strong>istic<strong>al</strong>ly<br />
complex applications. These tools often present only<br />
static structure� or they present dynamics from only a<br />
few of the many layers of a program and its underly�<br />
ing system. This paper introduces �PV�� a prototype<br />
program visu<strong>al</strong>ization system which provides concur�<br />
rent visu<strong>al</strong> presentation of behavior from <strong>al</strong>l layers�<br />
including� the program itself� user�level libraries� the<br />
operating system� and the hardware� as this behavior<br />
unfolds over time. PV juxtaposes views from di�erent<br />
layers in order to facilitate visu<strong>al</strong> correlation� and <strong>al</strong>�<br />
lows these views to be navigated in a coordinated fash�<br />
ion. This results in an extremely powerful mechanism<br />
for exploring application behavior. Experience is pre�<br />
sented from actu<strong>al</strong> use of PV in production settings<br />
with programmers facing re<strong>al</strong> deadlines and serious<br />
performance problems.<br />
1 Visu<strong>al</strong>ization of Software Behavior<br />
To truly understand any re<strong>al</strong>istic<strong>al</strong>ly complex piece<br />
of software� for purposes of debugging or tuning� one<br />
must consider its execution�time behavior� not just its<br />
static structure. Actu<strong>al</strong> behavior is often far di�er�<br />
ent from expectations� and often results in poor per�<br />
formance and incorrect results. Further� the ultimate<br />
correctness and performance of an application �or lack<br />
thereof� arises not only from the behavior of the pro�<br />
gram itself� but <strong>al</strong>so from activity carried out on its<br />
beh<strong>al</strong>f by underlying system layers. These layers in�<br />
clude user�level libraries� the operating system� and<br />
the hardware. Fin<strong>al</strong>ly� problems often become appar�<br />
ent only when one considers the interleaving of various<br />
� ���<br />
Doug Kimelman� Bryan Rosenburg� Tova Roth<br />
IBM Thomas J. Watson Research Center<br />
Yorktown Heights� NY 10598<br />
kinds of activity� rather than cumulative activity sum�<br />
maries at the end of a run. Thus� for debugging and<br />
tuning applications in a re<strong>al</strong>istic<strong>al</strong>ly complex environ�<br />
ment� one must consider behavior at numerous layers<br />
of a system concurrently� as this behavior unfolds over<br />
time.<br />
Clearly� any textu<strong>al</strong> presentation of this amount of<br />
information would be overwhelming. A visu<strong>al</strong> presen�<br />
tation of the information is far more likely to be mean�<br />
ingful. Information is assimilated far more rapidly<br />
when it is presented in a visu<strong>al</strong> fashion� and trends and<br />
anom<strong>al</strong>ies are recognized much more readily. Further�<br />
animations� and views which incorporate time as an<br />
explicit dimension� reve<strong>al</strong> the interplay among compo�<br />
nents over time.<br />
With an appropriate visu<strong>al</strong> presentation of infor�<br />
mation concerning software behavior over time� one<br />
can �rst survey a program execution broadly using<br />
a large�sc<strong>al</strong>e �high�level� coarse�resolution� view� then<br />
narrow the focus as regions of interest are identi�ed�<br />
and descend into �ner�grained �more detailed� views�<br />
until a point is identi�ed for which full detail should<br />
be considered.<br />
Further� displays which juxtapose views from di�er�<br />
ent system layers in order to facilitate visu<strong>al</strong> correla�<br />
tion� and which <strong>al</strong>low these views to be navigated in a<br />
coordinated fashion� constitute an extremely powerful<br />
mechanism for exploring application behavior.<br />
2 PV � A Program Visu<strong>al</strong>ization Sys�<br />
tem<br />
PV� a prototype program visu<strong>al</strong>ization system de�<br />
veloped at IBM Research� embodies <strong>al</strong>l of the visu<strong>al</strong>�<br />
ization capabilities proposed above. Success with PV
in production settings and complex large�sc<strong>al</strong>e envi�<br />
ronments has veri�ed that these capabilities are indeed<br />
highly e�ective for understanding application behav�<br />
ior for purposes of debugging and tuning.<br />
Users often turn to program visu<strong>al</strong>ization when per�<br />
formance is disappointing � either performance does<br />
not match predictions� or it deteriorates as changes<br />
are introduced into the system� or it does not sc<strong>al</strong>e up<br />
�and perhaps even worsens�� as processors are added<br />
in a multiprocessor system� or it is simply insu�cient<br />
for the intended application.<br />
With PV� users watch for trends� anom<strong>al</strong>ies� and<br />
interesting correlations� in order to track down press�<br />
ing problems. Behavior<strong>al</strong> phenomena which one might<br />
never have suspected� or thought to pursue� are often<br />
dramatic<strong>al</strong>ly reve<strong>al</strong>ed. A user continu<strong>al</strong>ly replays the<br />
execution history� and rearranges the display to dis�<br />
card unnecessary information or to incorporate more<br />
of the relevant information. In this way� users examine<br />
and an<strong>al</strong>yze execution at successively greater levels of<br />
detail� to isolate �aws in an application. Resolution of<br />
the problems thus discovered often leads to signi�cant<br />
improvements in the performance of an application.<br />
PV shows hardware�level performance information<br />
�such as instruction execution rates� cache utilization�<br />
processor element utilization� delays due to branches<br />
and interlocks� if it is available� operating�system�level<br />
activity �such as context switches� address�space ac�<br />
tivity� system c<strong>al</strong>ls and interrupts� kernel performance<br />
statistics�� communication�library�level activity �such<br />
as message�passing� inter�processor communication��<br />
language�runtime activity �such as par<strong>al</strong>lel�loop sched�<br />
uling� dynamic memory <strong>al</strong>location�� and application�<br />
level�activity �such as <strong>al</strong>gorithm phase transitions� ex�<br />
ecution time pro�les� data structure accesses�.<br />
PV has been targeted to shared�memory par<strong>al</strong>�<br />
lel machines �the RP3�7��� distributed memory ma�<br />
chines �transputer clusters running Express�� work�<br />
station clusters �RISC System�6000 workstations run�<br />
ning Express�� and supersc<strong>al</strong>ar uniprocessor worksta�<br />
tions �RISC System�6000 with AIX�.<br />
PV is structured as an extensible system� with a<br />
framework and a number of plug�in components which<br />
perform an<strong>al</strong>ysis and display of event data generated<br />
by a running system. It includes a base set of com�<br />
ponents� and users are encouraged to add their own<br />
and con�gure them into networks with existing com�<br />
ponents. Novice users simply c<strong>al</strong>l up pre�established<br />
con�gurations of components in order to use estab�<br />
lished views of program behavior.<br />
Figures 1 through 6 show some of the many views<br />
provided by PV. Section 4 describes some of these<br />
views in detail and discusses their use.<br />
3 AIX Trace<br />
PV is trace�driven. It produces its displays by<br />
continu<strong>al</strong>ly updating views of program behavior as it<br />
reads through a trace containing an execution history.<br />
A trace consists of a time�ordered sequence of event<br />
records� each describing an individu<strong>al</strong> occurrence of<br />
some event of interest in the execution of the pro�<br />
gram. Typic<strong>al</strong>ly� an event record consists of an event<br />
type identi�er� a timestamp� and some event�speci�c<br />
data. Events of interest might include� sampling of<br />
a cache miss counter� a page fault� scheduling of a<br />
process� <strong>al</strong>location of a memory region� receipt of a<br />
message� or completion of some step of an <strong>al</strong>gorithm.<br />
A trace can be delivered to the visu<strong>al</strong>ization system<br />
live �possibly over a network�� as the event records are<br />
being generated� or it can be saved in a �le for later<br />
an<strong>al</strong>ysis.<br />
The standard AIX system �IBM�s version of Unix��<br />
as distributed for RS�6000s� includes an embedded<br />
trace facility. AIX Trace�6�� a service provided by the<br />
operating system kernel� accepts event records gener�<br />
ated at any level within the system and collects them<br />
into a centr<strong>al</strong> bu�er. As the event bu�er becomes full�<br />
blocks of event records are dumped to a trace �le� or<br />
dumped through a pipe to a process� e.g. for transmis�<br />
sion over a network. Alternatively� the system can be<br />
con�gured to simply maintain a large circular bu�er<br />
of event records that must be explicitly emptied by a<br />
user process.<br />
Comprehensive instrumentation within AIX itself<br />
provides information about activity within the kernel�<br />
and a system c<strong>al</strong>l is provided by which user processes<br />
can provide event records concerning activity within<br />
libraries or the application. On machines incorporat�<br />
ing hardware performance monitors� a device driver<br />
can unload hardware performance data� periodic<strong>al</strong>ly<br />
or at speci�c points during the execution of an appli�<br />
cation� and generate AIX event records containing the<br />
data.<br />
The variant of PV that is targeted to AIX worksta�<br />
tions is based on AIX Trace. Unless otherwise noted�<br />
<strong>al</strong>l of the applications discussed in this paper were<br />
run on AIX RS�6000 workstations with AIX Trace<br />
enabled. Traces were taken during a run of the appli�<br />
cation and saved in �les for later an<strong>al</strong>ysis.<br />
For the applications discussed here� tracing over�<br />
head was negligible � less than 5� in most cases. In<br />
no case was perturbation great enough to <strong>al</strong>ter the be�<br />
havior being investigated. Trace �le sizes in <strong>al</strong>l cases
were less than 16 megabytes.<br />
4 Views in Action � Experience with<br />
PV<br />
This section describes some of the many views pro�<br />
vided by PV� and explains their use� by way of exam�<br />
ples of actu<strong>al</strong> experience with PV.<br />
PV has been applied to a number of di�erent types<br />
of application across a number of domains� includ�<br />
ing� interactive graphics applications written in C���<br />
systems programs such as compilers written in C�<br />
computation�intensive scienti�c applications written<br />
in Fortran� I�O�intensive applications written in C�<br />
and a large� complex� heavily�layered� distributed ap�<br />
plication written in Ada.<br />
4.1 Views of Process Scheduling and Sys�<br />
tem Activity<br />
In one example� the developers of �G�� an interac�<br />
tive graphics application� 1 were concerned that it was<br />
taking 12 seconds from the time that the user entered<br />
the command to start the application� until the time<br />
that the main application window would respond to<br />
user input. They suspected that a lot of time was<br />
being lost in the Motif libraries.<br />
End�of�run summaries showed that 51 seconds out<br />
of a 97 second run were spent idle� but these sum�<br />
maries provided no indication of how many of these<br />
idle seconds were in fact warranted� perhaps waiting<br />
for user input� and how many were somehow on the<br />
critic<strong>al</strong> path for the application. Pro�les of time spent<br />
in various functions� and perus<strong>al</strong> of thousands of lines<br />
of detail in textu<strong>al</strong> reports� would not have been help�<br />
ful.<br />
PV views showing process scheduling <strong>al</strong>ongside op�<br />
erating system activity immediately highlighted the<br />
nature of this performance problem. The schedul�<br />
ing view consists of a strip of color growing to the<br />
right over time� with color used to indicate which<br />
process was running at any instant in time. �Figure 2<br />
shows this view in a window titled �AixProcess j Col�<br />
orStrip�.� The activity view consists of a similar strip<br />
of color� in which color is used to indicate what activ�<br />
ity was taking place at any instant in time. �Figure 2<br />
shows this view in a window titled �AixSystemState j<br />
ColorStrip�.� The two views can show the same time<br />
spans� and they can be <strong>al</strong>igned so that a point in one<br />
view corresponds to the same instant in time as the<br />
point immediately above or below it in the other view.<br />
Further� the two views <strong>al</strong>igned in this way can be navi�<br />
gated in a coordinated fashion � when the user zooms<br />
in on either view� expanding a region of interest in or�<br />
der to reve<strong>al</strong> greater detail� the other view expands<br />
the same region of time automatic<strong>al</strong>ly. 2<br />
�PV provides a number of other views which can<br />
be <strong>al</strong>igned and navigated in the same fashion� includ�<br />
ing views showing kernel performance statistics� hard�<br />
ware performance statistics� which loop of a function<br />
is currently active� or which user�de�ned phase of an<br />
<strong>al</strong>gorithm is currently being executed.�<br />
By viewing behavior as it unfolded over time� it was<br />
apparent that the two processes of application �G�<br />
�shown in Figure 2 as light pink and s<strong>al</strong>mon color�<br />
were not even running for much of the 12 seconds that<br />
they should have been rushing to establish the main<br />
application window ���. Further� it wasn�t even the X<br />
server process �light green� that was running instead of<br />
them. In fact the system was idle �dark purple� much<br />
of the time. Thus� 5 of the 51 idle seconds noted above<br />
were occurring during startup and hence were on the<br />
critic<strong>al</strong> path. Finding the point on the scheduling view<br />
where a process of application �G� went idle� zoom�<br />
ing in to show greater detail� and dropping down to<br />
the activity view� reve<strong>al</strong>ed the cause of the idle time�<br />
system c<strong>al</strong>ls to examine a number of �les were caus�<br />
ing large delays. Having narrowed the focus to a very<br />
sm<strong>al</strong>l window in time using the graphic views� a view<br />
was opened showing the detailed textu<strong>al</strong> trace report.<br />
As each event is displayed graphic<strong>al</strong>ly in other views�<br />
this view highlights the corresponding line in the re�<br />
port. With this level of detail it was immediately ob�<br />
vious that startup information had inadvertently been<br />
scattered across a number of �les which might well be<br />
remote�mounted and thereby incur signi�cant access<br />
pen<strong>al</strong>ties.<br />
Without the visu<strong>al</strong> correlation facilitated by juxta�<br />
position of views and coordinated navigation� it would<br />
have been much harder to make the connection be�<br />
tween the various aspects of this performance problem.<br />
At the very least� it would have taken much longer by<br />
any less direct means.<br />
4.2 Views of Memory Activity and Appli�<br />
cation Progress<br />
In another example� PV views reve<strong>al</strong>ed a number<br />
of memory�related problems in �A�� a compiler. Each<br />
1 �The stories you are about to hear are true. Only the names have been changed to protect the innocent.�<br />
2 Complete detail concerning the contents of these views can be found in a lengthy technic<strong>al</strong> report �8�.
view in this case is rectangular� with each position<br />
<strong>al</strong>ong the horizont<strong>al</strong> axis corresponding to some re�<br />
gion of a linear address space �the size of the region<br />
depends on sc<strong>al</strong>e of the display�. In one view� color<br />
is used to represent the size of a block of memory on<br />
the user heap. �Figure 5 shows this view in the upper<br />
window titled �AixM<strong>al</strong>loc j OneSpace�.� In another<br />
view� color is used to show the source �le name or<br />
line number that <strong>al</strong>located the block. �Figure 5 shows<br />
this view in the lower window titled �AixM<strong>al</strong>loc j One�<br />
Space�.� In a third view� color is used to represent the<br />
state of a page of the data segment of the user address<br />
space. �Figure 5 shows this view in the window titled<br />
�AixDataSeg j OneSpace�.� For purposes of correla�<br />
tion� the views are con�gured to show the same range<br />
of addresses� and they are <strong>al</strong>igned so that a given ad�<br />
dress occurs at the same horizont<strong>al</strong> position in each<br />
view. As well� zooming in on a region in one view au�<br />
tomatic<strong>al</strong>ly causes the corresponding zoom operation<br />
in the other view.<br />
Each of these views in Figure 5 is split into an<br />
upper h<strong>al</strong>f and a lower h<strong>al</strong>f� each representing part<br />
of the data segment of the address space of com�<br />
piler �A�. The left edge of the upper h<strong>al</strong>f represents<br />
address 0x24200000� successive points to the right<br />
<strong>al</strong>ong this h<strong>al</strong>f represent successively higher addresses�<br />
and the right edge represents address 0x24600000.<br />
Thus� the upper h<strong>al</strong>f of these views represent 2MB<br />
of the data segment. Similarly� the lower h<strong>al</strong>f of these<br />
views represents an expanded view of the 248KB from<br />
0x244CAE35 to 0x2448E571. The black guidelines<br />
show where the region represented by the lower h<strong>al</strong>f<br />
of a view �ts into the region represented by the upper<br />
h<strong>al</strong>f.<br />
These views showed a number of wastes of memory�<br />
none of which could technic<strong>al</strong>ly be classed a �leak�.<br />
Rather� they were �b<strong>al</strong>loons� � still referred to� but<br />
largely full of empty space. In one case� the heap views<br />
showed that every second page of the heap was not be�<br />
ing made available to the end user �shown in Figure<br />
5 �AixM<strong>al</strong>loc j OneSpace� as <strong>al</strong>ternating green and<br />
white blocks in the lower h<strong>al</strong>f of the view�� yet the cor�<br />
responding positions on the data segment view showed<br />
clearly that every page was being faulted in �shown in<br />
the lower h<strong>al</strong>f of Figure 5 �AixDataSeg j OneSpace� as<br />
<strong>al</strong>l magenta�. The heap views <strong>al</strong>so showed that <strong>al</strong>l of<br />
the blocks in question were of the same size. Having<br />
identi�ed blocks of a particular size as being prob�<br />
lematic� the source code for the <strong>al</strong>locator was quickly<br />
inspected� with particular attention to the treatment<br />
of blocks of the problematic size. It rapidly became<br />
apparent that� in certain situations� h<strong>al</strong>f of the heap<br />
was being left empty due to an unfortunate interac�<br />
tion between user code� the heap memory <strong>al</strong>locator�<br />
and the virtu<strong>al</strong> memory system.<br />
In another case� a static array was declared to be<br />
enormous. This was felt to be acceptable because<br />
re<strong>al</strong> memory pages were never faulted in unless they<br />
were required for the size of the program being com�<br />
piled. However� the data segment view emphasized<br />
that the array did occupy address space� and this<br />
became noteworthy when the compiler could not be<br />
loaded on sm<strong>al</strong>ler machine con�gurations� even though<br />
only moderate�sized programs needed to be compiled.<br />
Fin<strong>al</strong>ly� late in the run of this compiler� pages began<br />
�ashing in and out of the data segment view. Glancing<br />
at the system activity view �described earlier�� during<br />
the time that the page �ashing was occurring� <strong>al</strong>lowed<br />
this behavior to be correlated to periods of excessive<br />
disclaiming and subsequent reclaiming of pages by the<br />
compiler.<br />
An application phase view� which provides a<br />
roadmap to the progress of an application� <strong>al</strong>lowed<br />
this thrashing in the address space to be attributed<br />
directly to the o�ending phase of the compiler. The<br />
application phase view consists of a number of strips<br />
of color� as in the process scheduling and system activ�<br />
ity views described earlier. �Figure 5 shows this view<br />
in the window titled �AixPhase j ColorStrip�.� The<br />
strips are stacked one on top of the other� and they<br />
grow to the right together over time. The color of the<br />
top strip shows which user�de�ned phase of the appli�<br />
cation is in progress at any instant in time. The color<br />
of successively lower strips shows successively deeper<br />
sub�phases nested within the phases shown at the cor�<br />
responding positions on the higher strips. �This view<br />
can be driven by instrumentation in the form of sim�<br />
ple event generation statements inserted manu<strong>al</strong>ly or<br />
automatic<strong>al</strong>ly into the source� or by procedure entry<br />
and exit events generated using object code insertion<br />
techniques.�<br />
In the case of compiler �A�� correlation in time be�<br />
tween the application phase view and the data seg�<br />
ment view immediately made it clear that a back�<br />
end code generation phase �shown in Figure 5 as light<br />
green� was responsible for the excessive paging activ�<br />
ity.<br />
In another example� these memory�related views<br />
did in fact reve<strong>al</strong> a number of actu<strong>al</strong> memory leaks<br />
in �F�� a large Ada application. Due to the visu<strong>al</strong> na�<br />
ture of these views� it was immediately apparent that<br />
particular leaks were �ooding the address space �which<br />
was bleeding full of the color of the <strong>al</strong>locators in ques�<br />
tion� and hence required immediate attention. It was
just as apparent that other leaks were inconsequenti<strong>al</strong><br />
and could be ignored until after a rapidly approaching<br />
deadline. This is something which would not be read�<br />
ily apparent from the textu<strong>al</strong> report of convention<strong>al</strong><br />
speci<strong>al</strong>�purpose memory leak detectors.<br />
4.3 Views of Hardware Activity and<br />
Source Progress<br />
Fin<strong>al</strong>ly� in an example involving �T�� a<br />
computation�intensive scienti�c application� a view<br />
showing which loop of a program was active over<br />
time� in conjunction with a view of hardware perfor�<br />
mance statistics over time� highlighted opportunities<br />
for signi�cant improvements in performance.<br />
The program loop view is simply the application<br />
phase view described earlier� with color used to indi�<br />
cate which program loop is active at any instant in<br />
time �rather than which arbitrary user�de�ned phase<br />
is active�. �Figure 6 shows this view in the window<br />
titled �AixPhase j ColorStrip�.� The hardware per�<br />
formance view consists of a stack of linegraphs grow�<br />
ing to the right over time. �Figure 6 shows this view<br />
in the window titled �RS2Pmc j Sc<strong>al</strong>e j LineGraph�.�<br />
Hardware�level information� as discussed in Sections 2<br />
and 3� is sampled at loop boundaries and plotted on<br />
the various graphs. In this case� the two views showed<br />
the same time span and were <strong>al</strong>igned for purposes of<br />
correlation and navigation.<br />
These views <strong>al</strong>lowed programmers to easily iden�<br />
tify the longer�running loops and to correlate execu�<br />
tion of a particular loop with a dramatic decrease in<br />
MFLOPS. The hardware view showed that the loop<br />
was not cache�limited and was not a �xed point loop�<br />
yet one �oating point unit was seldom busy� while the<br />
other was extremely busy but completing very few in�<br />
structions. To understand the behavior of this partic�<br />
ular loop� a number of addition<strong>al</strong> views were opened<br />
to show the program source.<br />
Each source view highlights a line of source at the<br />
beginning of the major loop currently being executed.<br />
One of the views is� in e�ect� a �very high <strong>al</strong>titude�<br />
view of the source �as in �2��� in which the entire source<br />
of the program �ts within the single window. Al�<br />
though the code is illegible due to the �very sm<strong>al</strong>l<br />
font�� the over<strong>al</strong>l structure of the program is appar�<br />
ent� and the over<strong>al</strong>l progress of the application can<br />
be tracked easily. The code in the second view of<br />
the source is legible� but the view can only show a<br />
page of source at a time and must be scrolled in order<br />
to view di�erent parts of the program. �These two<br />
source views are shown side by side at the left of Fig�<br />
ure 6� beneath the PV control panel.� The third view<br />
shows the assembly language source� as generated by<br />
the compiler� with the same form of highlighting as<br />
the other two source views. �In �gure 6� this view is<br />
hidden behind the other windows.�<br />
For application �T�� glancing at the source views<br />
con�rmed that� for the loop in question� a divide in�<br />
struction was in fact causing one �oating point unit<br />
to remain fully busy while not completing very many<br />
instructions. The assembly view showed that the rea�<br />
son for the second �oating point unit not even keeping<br />
busy was an unnecessary dependence in the code. Us�<br />
ing these views for feedback� the programmer was able<br />
to experiment rapidly with manu<strong>al</strong> source transforma�<br />
tions� and ultimately to achieve a 12� improvement<br />
in the performance of application �T�.<br />
Over<strong>al</strong>l� through experience with PV in these situ�<br />
ations and many others� the visu<strong>al</strong>ization capabilities<br />
proposed above have proven tremendously e�ective for<br />
debugging and tuning� often in cases where tradition<strong>al</strong><br />
methods have failed.<br />
5 Future Research<br />
The user interface is bound to be a severe limitation<br />
of any current software visu<strong>al</strong>ization system. Typic<strong>al</strong><br />
displays of software are crude approximations� at best�<br />
to the elaborate ment<strong>al</strong> images that most program�<br />
mers have of the software systems they are developing.<br />
Opening� closing� and <strong>al</strong>igning windows on a relatively<br />
sm<strong>al</strong>l 2�dimension<strong>al</strong> screen is a cumbersome means of<br />
manipulating a few sm<strong>al</strong>l windows onto an elaborate<br />
conceptu<strong>al</strong> world.<br />
With the advent of su�ciently powerful virtu<strong>al</strong><br />
re<strong>al</strong>ity technology� a far more e�ective facility for<br />
software visu<strong>al</strong>ization could be achieved by map�<br />
ping multiple�layer software systems onto expansive 3�<br />
dimension<strong>al</strong> terrains� and providing more direct means<br />
for travers<strong>al</strong>. Travers<strong>al</strong> could involve high�level passes<br />
over the terrain to obtain an overview� and descent to<br />
lower�levels over regions of interest for more detailed<br />
views. The system could <strong>al</strong>so provide the ability to<br />
maintain a number of distinct perspectives onto the<br />
terrain. The panorama could include both representa�<br />
tions of the software entities themselves� as well as de�<br />
rived information such as performance measurements�<br />
and more abstract representations of the entities and<br />
the progress of their computation.
6 Related Work<br />
The notion of program visu<strong>al</strong>ization per se �15� �18�<br />
�rst appeared in the literature more than ten years<br />
ago �4�. Much of the initi<strong>al</strong> work in program visu<strong>al</strong>�<br />
ization� and many recent e�orts� are concerned solely<br />
with the static structure of a program. They do not<br />
consider dynamics of program behavior at <strong>al</strong>l.<br />
Algorithm animation work �1� �17� has focused<br />
strictly on sm<strong>al</strong>l <strong>al</strong>gorithms� rather than on actu<strong>al</strong> be�<br />
havior of large applications or on <strong>al</strong>l of the layers of<br />
large underlying systems. Further� <strong>al</strong>gorithm anima�<br />
tions often require large amounts of time to construct<br />
�days� weeks or even months�. This is acceptable in<br />
a teaching environment� where the animations will be<br />
used repeatedly on successive generations of students�<br />
but is unacceptable in a production software develop�<br />
ment environment where it is critic<strong>al</strong> that a tool can<br />
be applied readily to problems as they arise.<br />
Recently� there has been much work in the area<br />
of program visu<strong>al</strong>ization for par<strong>al</strong>lel systems �9� This<br />
work has in fact been concerned with dynamics� but<br />
much of it has been con�ned to communication or<br />
other aspects of par<strong>al</strong>lelism. Little consideration has<br />
been given to displaying other aspects of system be�<br />
havior. PIE �11� shows system�level activity over<br />
time� but its displays are limited primarily to con�<br />
text switching. Other system�level activity and activ�<br />
ity from the application and other levels of the system<br />
are not displayed simultaneously for correlation.<br />
The IPS�2 performance measurement system for<br />
par<strong>al</strong>lel and distributed programs �5� �14� does in�<br />
tegrate both application and system based metrics.<br />
However� system metrics are de<strong>al</strong>t with strictly in the<br />
form of �extern<strong>al</strong> time histograms�� each describing<br />
the v<strong>al</strong>ue of a single performance metric over time�<br />
as opposed to more gener<strong>al</strong> event data. Thus� where<br />
non�application data are concerned� IPS�2 is limited<br />
to strictly numeric presentations� such as tables and<br />
linegraphs. Dynamic animated displays of behavior�<br />
such as those showing system activity over time� or<br />
memory state as it evolves� are not possible with IPS�<br />
2. Program hierarchy displays are used primarily only<br />
for showing the over<strong>al</strong>l structure of an application� or<br />
for specifying the program components for which per�<br />
formance measurements are to be presented.<br />
Some vendors provide gener<strong>al</strong> facilities for tracing<br />
the system requests made by a given process. How�<br />
ever� these facilities tend to apply to a single process<br />
rather than the system as a whole� and hence are not<br />
useful for showing the interaction between a process<br />
and its surrounding environment. Furthermore� these<br />
facilities tend to have very high overheads.<br />
Pro�ling tools� such as the Unix utilities �prof�<br />
and �gprof�� have existed for some time� but these<br />
utilities simply show cumulative execution time� at the<br />
end of a run� on a function by function basis.<br />
A number of workstation vendors have recently ex�<br />
tended basic pro�ling facilities or debuggers by adding<br />
views to show time consumption and other resource<br />
utilization graphic<strong>al</strong>ly. Many of these tools now report<br />
utilization with granularity as �ne as a source line�<br />
and many <strong>al</strong>low sampling during experiments which<br />
can cover some part of a run rather than just an en�<br />
tire run. None of these tools� however� supports the<br />
notion of gener<strong>al</strong> visu<strong>al</strong> inspection of continuous be�<br />
havior and system dynamics at multiple levels within<br />
a system.<br />
Some debuggers are now including views of behav�<br />
ior in the memory arena� but none of these tools pro�<br />
vides the power and gener<strong>al</strong>ity of PV.<br />
The power of PV� and its novelty� lie in its com�<br />
bination of a number of important properties. PV<br />
provides both quantitative and animated displays� and<br />
it presents information from multiple layers of a pro�<br />
gram and its underlying system. Further� PV facil�<br />
itates correlation and coordinated navigation of the<br />
information displayed in its various views. Fin<strong>al</strong>ly�<br />
PV presents views which address important concerns<br />
for software behavior on mainstream workstation sys�<br />
tems� not just clusters or par<strong>al</strong>lel machines. PV em�<br />
bodies <strong>al</strong>l of these capabilities and it provides e�ec�<br />
tive industri<strong>al</strong>�strength support of large�sc<strong>al</strong>e applica�<br />
tions �even hundreds of megabytes of address space<br />
and hundreds of thousands of lines of code�.<br />
7 Conclusion<br />
In production settings� over a wide range of com�<br />
plex applications� PV has proven inv<strong>al</strong>uable in uncov�<br />
ering the nature and causes of program failures. De�<br />
velopers facing serious performance problems and im�<br />
minent deadlines have found it worthwhile to invest<br />
time to connect PV to their application� and to run<br />
and inspect visu<strong>al</strong>ization displays.<br />
Experience with PV indicates that concurrent vi�<br />
su<strong>al</strong> presentation of behavior from many layers� in�<br />
cluding the program itself� user�level libraries� the op�<br />
erating system� and the hardware� as this behavior<br />
unfolds over time� is essenti<strong>al</strong> for understanding� de�<br />
bugging� and tuning re<strong>al</strong>istic<strong>al</strong>ly complex applications.<br />
Systems that facilitate visu<strong>al</strong> correlation of such infor�<br />
mation� and that provide coordinated navigation of
multi�layer displays� constitute an extremely powerful<br />
mechanism for exploring application behavior.<br />
Acknowledgments<br />
Heartfelt thanks to Keith Shields� Barbara W<strong>al</strong>ters�<br />
and Christina Meyerson for hard work in the trenches�<br />
and to Fran Allen and Emily Plachy for unwavering<br />
support.<br />
References<br />
�1� M. Brown �Exploring Algorithms Using B<strong>al</strong>sa�<br />
II�� IEEE Computer 21�5�� pp. 14�36.<br />
�2� S.G. Eick� J.L. Ste�en� and E.E. Sumner� Jr.�<br />
�Seesoft�A Tool For Visu<strong>al</strong>izing Line Oriented<br />
Software Statistics�� IEEE Transactions on Soft�<br />
ware <strong>Engineering</strong> 18�11�� Nov. 1992� pp. 957�968.<br />
�3� M.T. Heath and J.A. Etheridge �Visu<strong>al</strong>izing the<br />
Performance of Par<strong>al</strong>lel Programs�� IEEE Soft�<br />
ware 8�5�� Sep. 1991� pp. 29�39.<br />
�4� C.F. Herot� G.P. Brown� R.T. Carling� M.<br />
Friedell� D. Kramlich� and R.M. Baecker �An<br />
Integrated Environment for Program Visu<strong>al</strong>iza�<br />
tion�� Automated Tools for Information Systems<br />
Design� H.�J. Schneider and A. J. Wasserman<br />
eds.� North�Holland Publishing Company� 1982�<br />
pp. 237�259.<br />
�5� J.K. Hollingsworth� R.B. Irvin� and B.P. Miller<br />
�The Integration of Application and System<br />
Based Metrics in a Par<strong>al</strong>lel Program Performance<br />
Tool�� Proc. Third Symposium on Principles and<br />
Practice of Par<strong>al</strong>lel Programming� SIGPLAN No�<br />
tices 26�7�� July 1991� pp. 189�200.<br />
�6� IBM Corporation� �AIX Version 3.1 for RISC<br />
System�6000 Performance Monitoring and Tun�<br />
ing Guide�� IBM Corporation� order number<br />
SC23�2365�00.<br />
�7� D.N. Kimelman and T.A. Ngo �The RP3 Pro�<br />
gram Visu<strong>al</strong>ization Environment�� The IBM<br />
Journ<strong>al</strong> of Research and Development 35�6�� Nov.<br />
1991.<br />
�8� D.N. Kimelman and B.S. Rosenburg �Program<br />
Visu<strong>al</strong>ization for Implementation Performance<br />
An<strong>al</strong>ysis�� IBM Research Technic<strong>al</strong> Report� Oc�<br />
tober 1993.<br />
�9� E. Kraemer and J. Stasko �The Visu<strong>al</strong>ization of<br />
Par<strong>al</strong>lel Systems� An Overview�� Journ<strong>al</strong> of Par�<br />
<strong>al</strong>lel and Distributed Computing 18�2�� 1993� pp.<br />
105�117.<br />
�10� T.J. LeBlanc� J.M. Mellor�Crummey� and R.J.<br />
Fowler �An<strong>al</strong>yzing Par<strong>al</strong>lel Program Execution<br />
Using Multiple Views�� Journ<strong>al</strong> of Par<strong>al</strong>lel and<br />
Distributed Computing 9�2�� Jun. 1990� pp. 203�<br />
217.<br />
�11� T. Lehr� Z. Seg<strong>al</strong>l� D.F. Vrs<strong>al</strong>ovic� E. Caplan�<br />
A.L. Chung� and C.E. Fineman� �Visu<strong>al</strong>izing Per�<br />
formance Debugging�� IEEE Computer 22�10��<br />
Oct. 1989� pp. 38�51.<br />
�12� A.D. M<strong>al</strong>ony� D.H. Hammerslag� and D.J.<br />
Jablonowski� �Traceview� A Trace Visu<strong>al</strong>ization<br />
Tool�� IEEE Software 8�5�� Sep. 1991� pp. 19�28.<br />
�13� A.D. M<strong>al</strong>ony and D.A. Reed �Visu<strong>al</strong>izing Par<strong>al</strong>�<br />
lel Computer System Performance�� CSRD Re�<br />
port No. 812� Center for Supercomputing Re�<br />
search and Development� University of Illinois at<br />
Urbana�Champaign� May 1988.<br />
�14� B.P. Miller� M. Clark� J. Hollingsworth� S. Kier�<br />
stead� S. Lim� and T. Torzewski �IPS�2� The<br />
Second Generation of a Par<strong>al</strong>lel Program Mea�<br />
surement System�� IEEE Transactions on Par<strong>al</strong>�<br />
lel and Distributed Systems 1�2�� Apr. 1990� pp.<br />
206�217.<br />
�15� B.A. Price� R.M. Baecker� and I.S. Sm<strong>al</strong>l �A<br />
Principled Taxonomy of Software Visu<strong>al</strong>ization��<br />
Journ<strong>al</strong> of Visu<strong>al</strong> Languages and Computing<br />
4�3�� 1993� pp. 211�266.<br />
�16� D.A. Reed� D.R. Olson� R.A. Aydt� T.M. Mad�<br />
hyastha� T. Birkett� D.W. Jensen� B.A.A. Nazief�<br />
and B.K. Totty� �Sc<strong>al</strong>able Performance Envi�<br />
ronments for Par<strong>al</strong>lel Systems�� University of<br />
Illinois Technic<strong>al</strong> Report UIUCDCS�R�91�1673�<br />
Mar. 1991.<br />
�17� J. Stasko �TANGO� A Framework and System for<br />
Algorithm Animation�� IEEE Computer 23�9��<br />
pp. 27�39.<br />
�18� J. Stasko and C. Patterson �Understanding and<br />
Characterizing Software Visu<strong>al</strong>ization Systems��<br />
Proc. 1992 IEEE Workshop on Visu<strong>al</strong> Languages�<br />
Sep. 1992� pp. 3�10.
Figure_1
Figure_2<br />
Figure_3
Figure_4
Figure_5
Figure_6
Di�erenti<strong>al</strong> Volume Rendering� A Fast Volume Visu<strong>al</strong>ization<br />
Technique for Flow Animation<br />
Han�Wei Shen and Christopher R. Johnson<br />
Department of Computer Science<br />
University of Utah<br />
S<strong>al</strong>t Lake City� UT 84112.<br />
E�mail� hwshen�cs.utah.edu and crj�cs.utah.edu<br />
Abstract<br />
We present a direct volume rendering <strong>al</strong>gorithm<br />
to speed up volume animation for �ow visu<strong>al</strong>izations.<br />
Data coherency between consecutive simulation time<br />
steps is used to avoid casting rays from those pixels<br />
retaining color v<strong>al</strong>ues assigned to the previous image.<br />
The <strong>al</strong>gorithm c<strong>al</strong>culates the di�erenti<strong>al</strong> information<br />
among a sequence of 3D volumetric simulation data.<br />
At each time step the di�erenti<strong>al</strong> information is used<br />
to compute the locations of pixels that need updating<br />
and a ray�casting method is utilized to produce the up�<br />
dated image. We illustrate the utility and speed of<br />
the di�erenti<strong>al</strong> volume rendering <strong>al</strong>gorithm with sim�<br />
ulation data from computation<strong>al</strong> bioelectric and �uid<br />
dynamics applications. We can achieve considerable<br />
disk�space savings and nearly re<strong>al</strong>�time rendering of<br />
3D �ows using low�cost� single processor workstations �<br />
for models which contain hundreds of thousands of<br />
data points.<br />
Introduction<br />
While there is a rich history of numeric<strong>al</strong> tech�<br />
niques for computing the dynamics of wave propaga�<br />
tion� only recently have researchers been able to vi�<br />
su<strong>al</strong>ize the complex dynamics of large 3D �ow simu�<br />
lations �1� 2� 3�. Visu<strong>al</strong>izations of �ow dynamics typ�<br />
ic<strong>al</strong>ly involve characterizing relevant features of vec�<br />
tor and sc<strong>al</strong>ar �elds. While visu<strong>al</strong>izing vector �elds<br />
is particularly important in many applications� it is<br />
<strong>al</strong>so important to quantify and visu<strong>al</strong>ly characterize<br />
sc<strong>al</strong>ar features of the �ow �eld such as� temperature�<br />
voltage� and magnitudes of vector quantities. Di�<br />
rect volume�rendering techniques� e�ective tools for<br />
exploring 3D sc<strong>al</strong>ar data� have been proposed as a<br />
methodology to visu<strong>al</strong>ize sc<strong>al</strong>ar features in the �ow<br />
� Such as the SGI Indy or comparable workstations<br />
�eld �4� 5� 6�. Unlike surface�rendering methods� direct<br />
volume�rendering methods can be used to visu<strong>al</strong>ize 3D<br />
sc<strong>al</strong>ar data without converting intermediate geometric<br />
primitives. By assigning appropriate colors and opac�<br />
ities to the sc<strong>al</strong>ar data� one can render objects semi�<br />
transparently to expand the amount of 3D information<br />
available at a �xed position. Volume�rendered images<br />
can <strong>al</strong>so be superimposed upon surface�oriented icons<br />
or textures� thus <strong>al</strong>lowing for simultaneous sc<strong>al</strong>ar and<br />
vector �eld composite visu<strong>al</strong>izations.<br />
A wide range of volume rendering techniques have<br />
been applied to the problem of �ow visu<strong>al</strong>ization. Ma<br />
and Smith �3� introduced a virtu<strong>al</strong> smoke technique<br />
to enhance visu<strong>al</strong>ization of gaseous �uid �ows. This<br />
technique <strong>al</strong>lows users to interactively insert a seed<br />
into an interesting location and only the region imme�<br />
diately surrounding the seed is rendered. Max et <strong>al</strong>.<br />
�5� introduced 3D textures advected by wind �ow upon<br />
volume rendered climate images to visu<strong>al</strong>ize both the<br />
sc<strong>al</strong>ar and vector �elds of the images. Craw�s and<br />
Max �7� make use of textured splats which utilize vol�<br />
ume splatting and 3D texture mapping techniques to<br />
reve<strong>al</strong> sc<strong>al</strong>ar and vector information simultaneously.<br />
Addition<strong>al</strong>ly� Max et <strong>al</strong>. �8� developed the concept of<br />
�ow volumes� volumetric equiv<strong>al</strong>ents of stream lines�<br />
to represent addition<strong>al</strong> information about the vector<br />
�eld.<br />
We are motivated to develop a more e�cient way<br />
to visu<strong>al</strong>ize sc<strong>al</strong>ar �elds by our attempts to visu<strong>al</strong>ize<br />
simulation data from a model of electric<strong>al</strong> wave prop�<br />
agation within the complex geometry of the heart and<br />
in large sc<strong>al</strong>e models of unsteady compressible �uid<br />
�ow �9� 10�. Because of the regular structures used<br />
to characterize the simulation data� we can use direct<br />
volume�rendering techniques to visu<strong>al</strong>ize the states at<br />
each time step. We characterize states within the<br />
model by assigning di�erent colors and opacities. By<br />
animating the volume�rendered images at each time
step� we can e�ectively investigate the propagation of<br />
waves throughout the volume.<br />
Direct volume�rendering methods employing ray<br />
casting <strong>al</strong>gorithms have become the standard meth�<br />
ods to visu<strong>al</strong>ize 3D sc<strong>al</strong>ar data. To characterize the<br />
dynamic behavior of the �ow �eld� one generates a se�<br />
ries of volume rendered images at di�erent time steps<br />
and then records� stores� and animates the sequence.<br />
Because direct volume rendering is very time consum�<br />
ing to re<strong>al</strong>ize such animations for models of any sig�<br />
ni�cant size �i.e. re<strong>al</strong>istic problems in science and en�<br />
gineering�� standard volume�rendering techniques are<br />
prohibitive for animating hundreds of time steps inter�<br />
actively. Moreover� the disk space required for storing<br />
hundreds or thousands of sets of volumetric simulation<br />
data could be overwhelming.<br />
The main contribution of this paper is the devel�<br />
opment of an <strong>al</strong>gorithm which signi�cantly reduces<br />
the time to create volume�rendered �ow animations<br />
of sc<strong>al</strong>ar �elds. Furthermore� our <strong>al</strong>gorithm reduces<br />
the amount of disk space needed for storing volume<br />
data. We achieve these reductions by implementing<br />
a di�erenti<strong>al</strong> volume�rendering method. The method<br />
utilizes data coherency between consecutive time steps<br />
of simulation data to accelerate the volume animation<br />
and to compress the volume data. The method is in�<br />
dependent of speci�c volume�rendering techniques and<br />
can be adapted into a variety of ray casting paradigms<br />
which can be used to further accelerate the visu<strong>al</strong>iza�<br />
tion process �11� 12� 13�.<br />
Di�erenti<strong>al</strong> Volume Rendering<br />
From preliminary studies of our wave propagation<br />
simulations� we noticed that the only elements which<br />
changed v<strong>al</strong>ues between consecutive time steps� when<br />
the time steps were sm<strong>al</strong>l� were the activated cells and<br />
their neighbors. We hypothesized that only a frac�<br />
tion of elements in the volume change from any given<br />
time step to the next in simulations of physic<strong>al</strong> �ow<br />
phenomena. In addition� when a sequence of prop�<br />
agating images is animated� the viewing parameters<br />
usu<strong>al</strong>ly don�t change. In our ray casting method� we<br />
are able to cast rays <strong>al</strong>ong a path corresponding only<br />
to changed data elements. Therefore� the pixels in<br />
the new image keep the same colors that they had<br />
previously unless they correspond to changed data<br />
elements. Retaining the color v<strong>al</strong>ues from the non�<br />
changing pixels results in a signi�cant time savings.<br />
The di�erenti<strong>al</strong> volume�rendering <strong>al</strong>gorithm thus ex�<br />
ploits the tempor<strong>al</strong> coherence between sets of volume<br />
data from di�erent time steps in order to speed up<br />
volume animation of the 3D �ow.<br />
Simulations<br />
Data<br />
Difference<br />
extractor<br />
Differenti<strong>al</strong> File<br />
Figure 1� Visu<strong>al</strong>ization Pipeline� Static Phase<br />
The di�erenti<strong>al</strong> volume rendering method separates<br />
the data generation and data visu<strong>al</strong>ization processes.<br />
Scientists perform simulations to obtain sequences of<br />
data at di�erent time steps. The di�erenti<strong>al</strong> volume�<br />
rendering <strong>al</strong>gorithm extracts the di�erenti<strong>al</strong> informa�<br />
tion which contains the di�erences between the data<br />
�les at each consecutive time step. According to the<br />
speci�ed viewing direction� the pixel positions where<br />
new rays need to be cast can be computed from the dif�<br />
ferenti<strong>al</strong> information and then the ray casting process<br />
is invoked to produce the updated image. Because the<br />
variation between consecutive time steps is sm<strong>al</strong>l� the<br />
di�erenti<strong>al</strong> information �le� which replaces the whole<br />
sequence of volume data� can yield tremendous savings<br />
in terms of disk space.<br />
Visu<strong>al</strong>ization Pipeline<br />
The visu<strong>al</strong>ization pipeline of the di�erenti<strong>al</strong><br />
volume�rendering method can be divided into two<br />
phases� static and dynamic.<br />
First� data is generated from a simulation which<br />
might typic<strong>al</strong>ly consist of hundreds or thousands of<br />
time steps worth of information. Second� the di�er�<br />
ence extractor is invoked to compare the simulation<br />
data of consecutive time steps to obtain the positions<br />
of changed data elements between simulation steps.<br />
The positions of those changed elements and their cor�<br />
responding time step v<strong>al</strong>ues are output into a single<br />
di�erenti<strong>al</strong> �le. Because the di�erenti<strong>al</strong> �le contains<br />
the state histories of <strong>al</strong>l the data elements through the<br />
whole course of the simulation� the only information<br />
needed for the rendering process� the volume data at<br />
each time step can be then discarded� yielding a con�<br />
siderable savings in terms of disk space. These oper�<br />
ations are classi�ed as the static phase because they<br />
need to be performed only once for a simulation. Fig�<br />
ure 1 illustrates the operations in the static phase.
Differenti<strong>al</strong> File<br />
Ray Caster Pixel C<strong>al</strong>culator<br />
P I X E L S<br />
Figure 2� Visu<strong>al</strong>ization Pipeline� Dynamic Phase<br />
The di�erenti<strong>al</strong> information obtained over the dura�<br />
tion of the simulations contains the 3D positions and<br />
v<strong>al</strong>ues of changed data elements. Those positions are<br />
independent of the viewing direction of the rendering.<br />
By pre�processing the simulation data and producing<br />
the di�erenti<strong>al</strong> �le in advance� we can avoid the delay<br />
of c<strong>al</strong>culating the di�erenti<strong>al</strong> information while per�<br />
forming ray casting.<br />
At each time step� the positions of changed ele�<br />
ments are extracted from the di�erenti<strong>al</strong> �le and the<br />
pixels where new rays need to be cast can be computed<br />
according to the viewing direction and the sampling<br />
method. The resultant pixel positions are placed into<br />
a ray casting list to which the ray casting process refers<br />
before �ring new rays to produce the updated image.<br />
We classi�ed these operations as the dynamic phase<br />
because the pixels corresponding to those changed el�<br />
ements are dependent on the viewing direction. The<br />
pixel positions remain undetermined until the user<br />
speci�es the viewing parameters. The operations in<br />
the dynamic phase of the pipeline are illustrated in<br />
Figure 2 and are outlined <strong>al</strong>gorithmic<strong>al</strong>ly below.<br />
for �each time step t�<br />
�<br />
for �each changed element�x�y�z��<br />
�<br />
c<strong>al</strong>culate the corresponding pixel �u�v��<br />
update volume�x�y�z��<br />
store �u�v� into the ray casting list�<br />
�<br />
for �each pixel �u�v� in the ray casting list�<br />
�<br />
cast a ray from �u�v� into the volume�<br />
update the image v<strong>al</strong>ue�<br />
�<br />
�<br />
display the image�<br />
Pixel Positions C<strong>al</strong>culation<br />
There are many interpolation and ray sampling<br />
methods which can be used in the ray casting <strong>al</strong>go�<br />
rithm. For interactive rendering rates� but coarse im�<br />
age qu<strong>al</strong>ity� we can use a discrete ray which avoids the<br />
use of interpolation. To obtain higher qu<strong>al</strong>ity images�<br />
one can increase the sampling rate <strong>al</strong>ong the ray and<br />
use� for example� a trilinear interpolation scheme.<br />
Continuous Rays and Trilinear Interpolation�<br />
When using continuous ray sampling <strong>al</strong>ong with a tri�<br />
linear interpolation scheme� we compute the v<strong>al</strong>ue of<br />
any point in the volume by interpolating the v<strong>al</strong>ues of<br />
the data element�s encompassing eight vertices. If any<br />
of these eight data elements changes its v<strong>al</strong>ue� the in�<br />
terpolated v<strong>al</strong>ue of the point inside that cube needs to<br />
be re�computed. We de�ne the interpolation space of<br />
a data element as the space where the v<strong>al</strong>ues of <strong>al</strong>l the<br />
points located inside are in�uenced by that data ele�<br />
ment while the interpolation is performed. In the case<br />
of a 3D regularly structured grid� a vertex is shared<br />
by its eight adjacent cubes. Therefore� for any data<br />
element� its interpolation space is the volume of its<br />
eight adjacent cubes.<br />
To locate those pixels which will cast a ray through<br />
a data element�s interpolation space� we project the<br />
eight vertices of that cubic volume back to the image<br />
plane according to the viewing parameters �par<strong>al</strong>lel<br />
or perspective�. The pixels bound by the projected<br />
region then need to be updated.<br />
Discrete Rays and Zero�Order Interpolation�<br />
Discrete rays can be obtained by extending the dig�<br />
it<strong>al</strong> di�erenti<strong>al</strong> an<strong>al</strong>yzer �DDA� scan converting line<br />
<strong>al</strong>gorithm �14� into three dimensions. In a zero�order<br />
interpolation scheme� at each forwarding step only the<br />
nearest voxel is sampled. No actu<strong>al</strong> interpolation op�<br />
eration is performed. Suppose the 3D line equations<br />
are y � m1 � x � b and z � m2 � x � c� and both m1<br />
and m2 are less than 1 and greater than �1. Accord�<br />
ing to the discrete ray <strong>al</strong>gorithm� the ray in position<br />
x would be increased by 1 at each forwarding step.<br />
After i times of forwarding� the ray�s discrete position<br />
is �i� Round�m1 � i � b�� Round�m2 � i � c��� and the<br />
voxel located at that position is sampled.<br />
To c<strong>al</strong>culate pixels corresponding to the changed<br />
voxel element� one projects the voxel position back to<br />
the image plane according to the viewing direction.<br />
Most of the time the projected position won�t be lo�<br />
cated exactly at the image plane�s grid point. The four<br />
surrounding pixels of that projected point thus need
to be selected to cast new rays. We cast rays from the<br />
four surrounding pixels instead of choosing only the<br />
nearest pixel to assure that the changed voxel will be<br />
hit and sampled.<br />
Template Based Rays� When par<strong>al</strong>lel projection<br />
is used� <strong>al</strong>l rays �red from the image plane have the<br />
same slope and thus the same increment<strong>al</strong> form of<br />
forwarding path. Therefore� one can c<strong>al</strong>culate the<br />
increment<strong>al</strong> form once and store it as a template<br />
�12� 4�. During the ray casting procedure� instead<br />
of computing the ray�s new position at each time<br />
step� which increases computation<strong>al</strong> complexity� we<br />
can use ray templates. Suppose we have the forward�<br />
ing templates in u� v and w directions which have<br />
the forms of ray template�i�.u� ray template�i�.v� and<br />
ray template�i�.w. The ray template�i�.u stores� for in�<br />
stance� the distance the ray should march at the next<br />
step in u direction after the ray has taken i steps of<br />
forwarding. Suppose the current position of a ray is<br />
�u� v� w�� then the next position �u�� v�� w�� of the ray<br />
is c<strong>al</strong>culated as�<br />
u� � u � ray�template�i�.u�<br />
v� � v � ray�template�i�.v�<br />
w� � w � ray�template�i�.w�<br />
To guarantee a complete and uniform tessellation of<br />
the volume by 26�connected rays� sampling� we cast<br />
rays from the base�plane� which is par<strong>al</strong>lel to one of<br />
the volume faces. After having obtained the projected<br />
image on the base�plane� one performs a 2D mapping<br />
from the base�plane to the image plane to obtain the<br />
�n<strong>al</strong> image.<br />
The templates described above give us the informa�<br />
tion about how far a ray will forward at each step in<br />
each axis direction. From those templates� one com�<br />
putes the displacement a ray has forwarded in each<br />
direction after a particular time step. Inversely� we<br />
can <strong>al</strong>so obtain the number of forwarding steps corre�<br />
sponding to a particular displacement. This informa�<br />
tion gives us two more templates in each axis direc�<br />
tion which can be described as two functions� displace�<br />
ment to step�� and step to displacement��. Given<br />
a displacement from a volume point to the base<br />
plane� the displacement to step�� function will re�<br />
turn the steps taken by a ray to reach that point.<br />
Given a forwarding step number for a ray� the<br />
step to displacement�� will return the displacement<br />
from the base plane.<br />
With these extra templates� the pixel position c<strong>al</strong>�<br />
culation becomes simple. Given a point in volume<br />
space� we can �nd the distance from that point to the<br />
base plane. By using the displacement to step tem�<br />
plate� we are able to c<strong>al</strong>culate the steps taken by a<br />
ray from the base plane to that point. Thus we can<br />
look up the step to displacement templates to get the<br />
displacement in each direction� and the starting po�<br />
sition of the ray can be c<strong>al</strong>culated. By adopting the<br />
template�based ray casting method and utilizing pre�<br />
computed displacement and step templates� we can<br />
accurately and e�ciently c<strong>al</strong>culate the pixel positions.<br />
Acceleration of Ray Casting<br />
Coordinate Bu�er� Yagel and Shi �11� proposed a<br />
coordinate bu�er to store the �rst� and last�hit voxel<br />
positions for every pixel on the image plane <strong>al</strong>lowing<br />
one to rapidly skip empty space for subsequent render�<br />
ings. The di�erenti<strong>al</strong> volume rendering <strong>al</strong>gorithm fur�<br />
ther utilizes this idea for volume animations to speed<br />
up the ray casting process.<br />
If the viewing direction is �xed during the render�<br />
ing of a sequence of volume data� each ray from the<br />
image plane follows exactly the same forwarding path<br />
during the whole course of renderings with di�erent<br />
sets of volume data. If only a sm<strong>al</strong>l fraction of data<br />
elements change between consecutive simulation steps�<br />
then most of the information stored in the coordinate<br />
bu�er from the previous rendering can be retained.<br />
Initi<strong>al</strong>ly� the sampling range for each pixel consti�<br />
tutes the full depth of the volume. After the �rst<br />
rendering� the e�ective sampling range for each pixel<br />
can be obtained and stored. At each subsequent time<br />
step� when the di�erenti<strong>al</strong> volume rendering <strong>al</strong>gorithm<br />
extracts a changed data element from the di�erenti<strong>al</strong><br />
�le to compute the corresponding pixels� the 3D posi�<br />
tion of that data element can be compared with those<br />
computed pixels� e�ective sampling ranges stored in<br />
the coordinate bu�er to decide if those ranges� i.e.� the<br />
�rst� and last�hit voxel positions� need to be changed.<br />
If the changed element is located outside the speci�ed<br />
ranges� then the stored information needs updating.<br />
The new sampling ranges can then be used to skip<br />
empty space while performing the ray castings and<br />
thus the rendering can be further accelerated.<br />
Sample Caching� During the ray casting� the loc<strong>al</strong><br />
lighting c<strong>al</strong>culation� which includes the trilinear in�<br />
terpolation and shading computation� constitutes the<br />
most expensive part of the process. Ma et <strong>al</strong>. �13�<br />
proposed a sample caching technique which stores the<br />
interpolated data v<strong>al</strong>ue and loc<strong>al</strong> shading information<br />
at each sample point <strong>al</strong>ong a ray. This <strong>al</strong>lows users<br />
to interactively change mapping parameters� such as<br />
color and opacity� so that one only need to composite<br />
the cached information to update the image.<br />
To apply the sample caching technique� initi<strong>al</strong>ly the<br />
sampled v<strong>al</strong>ue and lighting information at each sample
point of a ray is saved. For a changed data element<br />
in the subsequent time step� only the sample points<br />
inside the surrounding regions of that new data ele�<br />
ment need to be resampled. The new sampled v<strong>al</strong>�<br />
ues are then used to update the sample cache. The<br />
correct position to insert or replace the new sampled<br />
result can be found from the corresponding pixel and<br />
the distance between the new data element and the<br />
image plane. After resampling the changed data el�<br />
ements and updating the sample cache� one needs to<br />
composite the new sample cache of the changed pix�<br />
els to update the image. By combining this technique<br />
with our di�erenti<strong>al</strong> volume rendering <strong>al</strong>gorithm� we<br />
can reduce the complexity of the sampling process and<br />
thus further accelerate the ray casting process.<br />
Results and Discussion<br />
We have implemented our di�erenti<strong>al</strong> volume ren�<br />
dering on two sets of simulation data� one from a<br />
biomedic<strong>al</strong> application and the other from a computa�<br />
tion<strong>al</strong> �uid dynamics application. All the comparisons<br />
below consist of the performances of our ray casting<br />
software with and without the di�erenti<strong>al</strong> rendering<br />
capability. The performance measurements were ev<strong>al</strong>�<br />
uated on a single 100 MHz MIPS R4000 processor.<br />
Note that the focus should be on the relative perfor�<br />
mances of the ray casting <strong>al</strong>gorithms with and with�<br />
out di�erenti<strong>al</strong> capability instead of on any one tech�<br />
nique�s e�ciency.<br />
In the electric<strong>al</strong> wave propagation simulation� we<br />
attempted to simulate the electric<strong>al</strong> impulse conduc�<br />
tion in the heart using an anatomic<strong>al</strong>ly accurate cel�<br />
lular automation model. Simulation data consisted of<br />
the state histories of <strong>al</strong>l the elements in the model over<br />
the duration of the simulation. Scientists were inter�<br />
ested in following the activation wavefront and study�<br />
ing phenomena that facilitate� promote and�or termi�<br />
nate abnorm<strong>al</strong> propagation. Appropriate colors and<br />
opacities were assigned to the di�erent states when<br />
volume rendering was performed. Data is computed<br />
at each time step within 128 � 128 � 128 cubic ele�<br />
ments. To test the di�erenti<strong>al</strong> rendering <strong>al</strong>gorithms�<br />
we computed data at 100 time steps. For display we<br />
used a 256�256 image plane. Figure 3 depicts the vol�<br />
ume rendered images of the propagation of electric<strong>al</strong><br />
activity within the heart.<br />
In the computation<strong>al</strong> �uid dynamics simulation<br />
�10�� numeric<strong>al</strong> results were computed by software<br />
which uses the MacCormack method to solve the<br />
three dimension<strong>al</strong> unsteady compressible Navier�<br />
Stokes equations. The results simulated a laminar<br />
�ow entering a rectangular region. The region had<br />
Time Changed Regular Ray Di�erenti<strong>al</strong><br />
Step Elements Casting Ray Casting<br />
0 100� 100� 100�<br />
20 3.505� 100� 3.33�<br />
40 4.531� 100� 4.93�<br />
60 1.369� 100� 1.58�<br />
80 0.379� 100� 0.36�<br />
Table 1� Percentage of rays being cast at selected<br />
time steps for both regular and di�erenti<strong>al</strong> ray casting<br />
methods� electric<strong>al</strong> wave propagation simulation.<br />
a sm<strong>al</strong>l inlet at one end and a fully wide open outlet<br />
at the other end. Data is computed at 64 � 64 � 64<br />
regular grid points and displayed in a 128 � 128 image<br />
plane. Figure 4 shows the volume rendered images of<br />
the laminar �ow propagation.<br />
On the an<strong>al</strong>ysis of our simulation data� we noticed<br />
that a maximum of 4.77� of the elements in the elec�<br />
tric<strong>al</strong> wave propagation simulation� and a maximum of<br />
2.57� in the laminar �ow simulation� changed states<br />
between time steps. Therefore� we could exploit the<br />
data coherency.<br />
The disk space used by the 100 time steps of<br />
128 � 128 � 128 volume data in the electric<strong>al</strong> wave<br />
propagation simulation was 2.10 M Bytes � 100 �<br />
210 MB. Using the di�erenti<strong>al</strong> volume rendering <strong>al</strong>go�<br />
rithm� which only requires 2.08 MB for a di�erenti<strong>al</strong><br />
�le and 2.1 MB for the �rst time step of volume� we<br />
were able to save more than 95� in storage costs. In<br />
the laminar �ow simulation� the disk space require�<br />
ment was 4.09 MB for a di�erenti<strong>al</strong> �le and 0.262 MB<br />
for the �rst 64�64�64 volume. The regular rendering<br />
<strong>al</strong>gorithm for 130 time steps needed 0.262 MB � 130<br />
� 34.06 MB. This amounts to a savings of 88�.<br />
Table 1 lists the average percentages of rays being<br />
cast both with and without use of the di�erenti<strong>al</strong> ca�<br />
pability at di�erent time steps of electric<strong>al</strong> wave prop�<br />
agation data. The <strong>al</strong>gorithm without the di�erenti<strong>al</strong><br />
capability <strong>al</strong>ways shot 100� of rays at any time step.<br />
That is� the <strong>al</strong>ogirithm requires every pixel to �re a<br />
ray to sample the volume data. In the di�erenti<strong>al</strong> ray<br />
casting method� after the �rst rendering which needs<br />
to cast 100� of rays to obtain the initi<strong>al</strong> image� the<br />
subsequent 99 renderings cast rays only when neces�<br />
sary. This signi�cantly reduced the number of rays<br />
cast. Table 2 shows the results for rendering the lam�<br />
inar �ow propagation data.<br />
Table 3 and Table 4 list the average rendering time<br />
required for both simulations for a single image at se�
Time Changed Regular Ray Di�erenti<strong>al</strong><br />
Step Elements Casting Casting<br />
0 100� 100� 100�<br />
20 1.82� 100� 3.48�<br />
40 2.45� 100� 4.65�<br />
60 1.46� 100� 2.79�<br />
80 0.20� 100� 1.44�<br />
100 0.04� 100� 0.32�<br />
120 0.005� 100� 0.15�<br />
Table 2� Percentage of rays being cast at selected<br />
time steps for both regular and di�erenti<strong>al</strong> ray casting<br />
methods� laminar �ow simulation.<br />
Time Changed Regular Ray Di�. Ray Casting<br />
Step Elements Casting Time Pct.<br />
0 100� 13.399 13.399 100�<br />
10 1.148� 13.398 0.446 3.47�<br />
20 3.505� 13.389 0.733 5.47�<br />
30 4.435� 13.347 0.880 6.59�<br />
40 4.531� 13.315 0.924 6.94�<br />
50 3.619� 13.377 0.807 6.03�<br />
60 1.369� 13.390 0.422 3.15�<br />
70 0.607� 13.401 0.291 2.17�<br />
80 0.379� 13.397 0.265 1.97�<br />
90 0.089� 13.398 0.234 1.75�<br />
Table 3� Rendering time �in seconds� at selected time<br />
steps using both the regular and di�erenti<strong>al</strong> ray cast�<br />
ing <strong>al</strong>gorithms� electric<strong>al</strong> propagation simulation data<br />
lected time steps using our ray casting software both<br />
with and without adopting the di�erenti<strong>al</strong> capability.<br />
The rendering time for the �rst image �time step 0�<br />
in the di�erenti<strong>al</strong> volume rendering was the same as<br />
that in the regular ray casting <strong>al</strong>gorithm. However� for<br />
subsequent renderings� there was a signi�cant reduc�<br />
tion in rendering time. For the electric<strong>al</strong> wave prop�<br />
agation data� the average time to render 100 images<br />
without adopting the di�erenti<strong>al</strong> method was approx�<br />
imately 13�39 � 100 � 1339 seconds. Di�erenti<strong>al</strong> vol�<br />
ume rendering achieved the same amount of rendering<br />
and same image qu<strong>al</strong>ity in only 13.5 � 52 � 65.5 sec�<br />
onds. For the laminar �ow simulation� the di�erenti<strong>al</strong><br />
volume rendering method took 17.98 seconds to render<br />
130 time steps. The rendering <strong>al</strong>gotithm without the<br />
di�erenti<strong>al</strong> <strong>al</strong>gorithm needed approximately 2�45�130<br />
Time Changed Regular Ray Di�. Ray Casting<br />
Step Elements Casting Time Pct.<br />
0 100� 2.245 2.245 100�<br />
20 1.82� 2.245 0.23 10.24�<br />
40 2.45� 2.248 0.28 16.27�<br />
60 1.46� 2.239 0.19 8.48�<br />
80 0.20� 2.241 0.08 3.56�<br />
100 0.04� 2.241 0.04 1.78�<br />
120 0.005� 2.246 0.02 0.89�<br />
Table 4� Rendering time�in seconds� at selected time<br />
steps using both the regular and the di�erenti<strong>al</strong> ray<br />
casting <strong>al</strong>gorithms� laminar �ow simulation data<br />
Time Changed Di�erenti<strong>al</strong> Ray Casting<br />
Step Elements Pixel Ray Tot<strong>al</strong><br />
C<strong>al</strong>culation Casting<br />
1 0� 0 2.372 2.372<br />
3 10� 0.226 0.173 0.439<br />
5 20� 0.516 0.282 0.798<br />
7 30� 0.765 0.413 1.178<br />
9 40� 1.019 0.529 1.548<br />
11 50� 1.265 0.641 1.906<br />
13 60� 1.515 0.771 2.286<br />
15 70� 1.766 0.884 2.650<br />
17 80� 2.017 1.013 3.030<br />
19 90� 2.266 1.116 3.382<br />
Table 5� Rendering time �in seconds� for di�erent<br />
amount of changed elements in a 64 � 64 � 64 volume<br />
� 318.5 seconds. Our <strong>al</strong>gorithm for rendering both<br />
sets of data achieved a savings of more than 90�.<br />
To understand the limitations and robustness of<br />
the di�erenti<strong>al</strong> volume rendering <strong>al</strong>gorithm� we used<br />
a 64 � 64 � 64 volume� 128 � 128 image plane and in�<br />
creased the number of changed elements at each time<br />
step. Table 5 lists the rendering times of our <strong>al</strong>go�<br />
rithm for di�erent percentages of changed data ele�<br />
ments. The experiment was designed such that the<br />
�ow started propagating from one corner of the vol�<br />
ume and eventu<strong>al</strong>ly occupied 95� of the whole volume<br />
in 20 time steps. The number of changed elements in�<br />
creased as the propagation proceeded.<br />
Except for the �rst rendering time� which was the<br />
same as that in the regular ray casting� the di�eren�<br />
ti<strong>al</strong> ray casting time at each time step was shorter<br />
than the regular ray casting time. Although our ray
casting time remained sm<strong>al</strong>ler than the regular ray<br />
casting time� the pixel c<strong>al</strong>culation time increased with<br />
the increasing number of changed elements. When<br />
the number of changed elements increased� the time of<br />
pixel c<strong>al</strong>culation increased to the point of diminishing<br />
returns. From our experiments� when the percentage<br />
of changed elements was over 50�� the performance<br />
of the di�erenti<strong>al</strong> volume rendering method became<br />
worse than the regular ray casting method.<br />
Although our <strong>al</strong>gorithm has limitations when the<br />
number of changed elements exceeds 50�� for most<br />
�ow visu<strong>al</strong>ization applications the number of changed<br />
elements during the propagation at each time step<br />
constitutes only a sm<strong>al</strong>l fraction of the whole volume.<br />
Furthermore� these changed elements tend to cluster<br />
together. Therefore� di�erenti<strong>al</strong> volume rendering rep�<br />
resents an attractive technique for sc<strong>al</strong>ar �eld �ow vi�<br />
su<strong>al</strong>ization.<br />
Summary<br />
We have presented a di�erenti<strong>al</strong> volume rendering<br />
<strong>al</strong>gorithm which exploits data coherency between con�<br />
secutive time steps of data to achieve fast volume ani�<br />
mation. This method can potenti<strong>al</strong>ly save tremendous<br />
amounts of disk space and CPU time over existing<br />
methods. The <strong>al</strong>gorithm begins by preprocessing the<br />
simulation data over time and extracting the di�er�<br />
enti<strong>al</strong> information between sequenti<strong>al</strong> time steps. At<br />
each time step� the pixel locations from which new rays<br />
need to be cast can be c<strong>al</strong>culated and the ray casting<br />
process is invoked to update the image. Our <strong>al</strong>gorithm<br />
has been successfully applied to both biomedic<strong>al</strong> and<br />
computation �uid dynamics applications. We are cur�<br />
rently working on a par<strong>al</strong>lel version of the <strong>al</strong>gorithm.<br />
Acknowledgments<br />
This work was supported in part by the Whitaker<br />
Foundation. The authors would like to thank P.<br />
Gharpure for the heart wave propagation data� and<br />
K. Ma for his CFD simulation software. We would<br />
<strong>al</strong>so like to thank Professors R. Yagel� J. Painter and<br />
K. Coles for their helpful comments and suggestions.<br />
Furthermore� we appreciate access to facilities which<br />
are part of the NSF STC for Computer Graphics and<br />
Scienti�c Visu<strong>al</strong>ization.<br />
References<br />
�1� J.L. Helman and L. Hesselink. Visu<strong>al</strong>izing vec�<br />
tor �eld topology in �uid �ows. IEEE Computer<br />
Graphics and Applications� 11�3��36�46� 1991.<br />
�2� A. Globus� C. Levit� and T. Lasinski. A tool<br />
for visu<strong>al</strong>izing the topology of three dimension<strong>al</strong><br />
vector �elds. In Proc. of Vis. �91� pages 33�40.<br />
IEEE CS Press� 1991.<br />
�3� K.�L. Ma and Smith P.J. Virtu<strong>al</strong> smoke� An in�<br />
teractive 3d �ow visu<strong>al</strong>ization technique. In Proc.<br />
of Vis. �92� pages 46�53. IEEE CS Press� 1992.<br />
�4� A. Kaufman. Volume Visu<strong>al</strong>ization. IEEE CS<br />
Press� Los Alamitos� CA� 1990.<br />
�5� N. Max� R. Craw�s� and D. Williams. Visu<strong>al</strong>izing<br />
wind velocities by advecting cloud textures. In<br />
Proc. of Vis. �92� pages 171�178. IEEE CS Press�<br />
1992.<br />
�6� P.G. Swann and S.K. Semw<strong>al</strong>. Volume rendering<br />
of �ow�visu<strong>al</strong>ization point data. In Proc. of Vis.<br />
�91� pages 25�32. IEEE CS Press� 1991.<br />
�7� R. Craw�s and N. Max. Texture splats for 3d<br />
sc<strong>al</strong>ar and vector �eld visu<strong>al</strong>ization. In Proc. of<br />
Vis. �93� pages 261�265. IEEE CS Press� 1993.<br />
�8� N. Max� Becker B.� and R. Craw�s. Flow volume<br />
for interactive vector �eld visu<strong>al</strong>ization. In Proc.<br />
of Vis. �93� pages 19�23. IEEE CS Press� 1993.<br />
�9� P. Ghapure and C.R. Johnson. A 3d cellular au�<br />
tomata model of the heart. In Proc. of 15th An�<br />
nu<strong>al</strong> IEEE EMBS Int. Conf. IEEE Press� 1993.<br />
�10� K.�L. Ma and K. Sikorski. A distributed <strong>al</strong>�<br />
gorithm for the three�dimension<strong>al</strong> compressible<br />
navier�stokes equations. Transputer Res. and<br />
App.� 4� 1990.<br />
�11� R Yagel and Z. Shi. Accelerating volume anima�<br />
tion by space�leaping. In Proc. of Vis. �93� pages<br />
62�69. IEEE CS Press� Oct. 1993.<br />
�12� R Yagel and A. Kaufman. Template�based vol�<br />
ume viewing. In Proceedings of EUROGRAPH�<br />
ICS �92� pages 153�157. Blackwell� Cambridge�<br />
England� Sept. 1992.<br />
�13� K. L. Ma� M. F. Cohen� and J. S. Painter. Volume<br />
seeds� A volume exploration technique. J. of Vis.<br />
and Comp. Animation� 2�135�140� 1991.<br />
�14� J. Foley and A. van Dam. Computer Graphics�<br />
Principles and Practices. Addison�Wesley� 1990.
Fast Surface Rendering from Raster Data by Voxel Travers<strong>al</strong> Using<br />
Chessboard Distance<br />
Miloˇs ˇSrámek<br />
Slovak Academy of Sciences, Bratislava, Slovak Republic<br />
miloss@umhp.savba.sk<br />
Abstract<br />
The increasing distinguishingcapability of tomographic<br />
and other 3D scanners as well as the new voxelization <strong>al</strong>gorithms<br />
place new demands on visu<strong>al</strong>ization techniques<br />
aimed at interactivity and rendition qu<strong>al</strong>ity. Among others,<br />
triangulation on a subvoxel level based on the marching<br />
cube <strong>al</strong>gorithm has gained popularity in recent years.<br />
However, without graphics hardware support, rendering<br />
many sm<strong>al</strong>l triangles could be awkward.<br />
We present a surface rendering approach based on ray<br />
tracing of segmented volumetric data. We show that if a<br />
proper interpolation scheme and voxel travers<strong>al</strong> <strong>al</strong>gorithm<br />
are used, high qu<strong>al</strong>ity images can be obtained within an<br />
acceptable time and without hardware support.<br />
1 Introduction<br />
During the last decades we have encountered an immense<br />
boom in the development of computing machinery,<br />
which has enabled us, among others, to generate and manipulate<br />
large matrices of three and even higher dimension<strong>al</strong><br />
data. The data results either from of some simulation processes<br />
(e.g. gas flow simulation) or is the product of various<br />
types of 3D scanners, which have found an important<br />
place, e.g. in medic<strong>al</strong> diagnostics (CT, MR, PET scanners).<br />
Caused by the increased resolving ability of the scanners,<br />
the qu<strong>al</strong>ity of the fin<strong>al</strong> 3D reconstruction of the data comes<br />
into prominence. An inevitable condition for the visu<strong>al</strong>ization<br />
of details, comparable with the voxel size is the<br />
application of an <strong>al</strong>gorithm that enables us to define the<br />
surface of the scanned object with subvoxel precision.<br />
This development has resulted in a large number of visu<strong>al</strong>ization<br />
techniques, among which triangulation on a voxel<br />
level has gained popularity [11]. Its basic idea is to approximate<br />
the object surface within a space, defined by eight<br />
neighboring data samples (cell) by up to four triangles, resulting<br />
in a surface model that can be rendered by standard<br />
tools. The continuous nature of this model enables us to<br />
render the object in various sc<strong>al</strong>es without danger of blocky<br />
artifacts caused by the limited sampling frequency of the<br />
scanner. The large number of triangles, typic<strong>al</strong>ly 10 5 –10 6 ,<br />
causes no problems when rendering through some hardware<br />
renderer. On the other hand, in spite of the rapidly<br />
decreasing hardware prices, many laboratories still exist<br />
with no access to such engines. In this case, rendering a<br />
big amount of primitives can become very awkward.<br />
Another drawback of the surface model approach is the<br />
separation of the surface from the volume data (origin<strong>al</strong><br />
samples) processing. Many of applications exist (e.g. in<br />
medic<strong>al</strong> diagnostics), where just the combined data representation<br />
is important [6] and can grant the operator deeper<br />
insight into the problem.<br />
Direct visu<strong>al</strong>ization techniques omitting the intermediate<br />
surface model represent an <strong>al</strong>ternative, which can overcome<br />
the two aforementioned drawbacks of the surface<br />
model approach. Tradition<strong>al</strong>ly, they split into two categories:<br />
volume rendering and surface rendering. The first<br />
one represents a class of methods, where <strong>al</strong>l scene voxels<br />
contribute to the resulting image by means of color compositing.<br />
Since no binary decisions between object and<br />
background are done, these approaches are claimed to be<br />
suitable for rendering weak surfaces and thin structures too.<br />
However, interpretation of such images can often lead to<br />
difficulties.<br />
The surface rendering approach lies h<strong>al</strong>f way between<br />
the surface model and volume rendering techniques. Its<br />
prerequisite is an object mask, obtained from the origin<strong>al</strong><br />
gray level scene by some kind of segmentation. Only<br />
the boundary mask voxels contribute to the fin<strong>al</strong> image by<br />
means of a color v<strong>al</strong>ue derived from the loc<strong>al</strong> properties and<br />
a chosen shading model. Ray tracing can be used to solve<br />
the visibility problem and to enhance the 3D perception by<br />
simulating highlights, shades, reflection and refraction.<br />
In this paper, we would like to present a direct approach<br />
to the visu<strong>al</strong>ization of volumetric data based on ray tracing,<br />
with no intermediate surface model. We sh<strong>al</strong>l show,<br />
that if a suitable interpolation scheme and a voxel travers<strong>al</strong><br />
<strong>al</strong>gorithm are used, high qu<strong>al</strong>ity renditions can be achieved<br />
with the possibility to magnify details within a reasonable<br />
time, and without hardware support.<br />
1.1 Ray tracing<br />
Ray tracing has been established in the last decades as<br />
a tool for high qu<strong>al</strong>ity rendering. Its main drawback is<br />
the high computation<strong>al</strong> cost, which can be, among others,<br />
overcome by space subdivision techniques. The scene is<br />
subdivided, either uniformly or hierarchic<strong>al</strong>ly, into voxels,<br />
containing only fractions of the objects. To reduce the<br />
number of necessary ray-object intersection tests, only the<br />
voxels pierced by a given ray are inspected. Various voxel<br />
travers<strong>al</strong> <strong>al</strong>gorithms solving this task were proposed [4,<br />
1, 3, 8]. An experiment has shown [1], that the optim<strong>al</strong><br />
subdivision rate is relatively low, resulting only in a few<br />
thousands of voxels.<br />
Scanned or simulated volumetric data sets are usu<strong>al</strong>ly<br />
represented in a similar form, as a 3D raster. The difference<br />
is in the typic<strong>al</strong> size (10 6 –10 7 voxels) and in the fact,<br />
that we have only one kind of object, the voxel itself. The
v<strong>al</strong>ue assigned to the voxel represents a density of some<br />
measured or simulated primary parametric field. Ray tracing<br />
(or its simplified form ray casting) was used for the<br />
implementation of volume [9] and surface rendering of either<br />
scanned [13] or voxelized data [19, 18]. In the surface<br />
rendering case it is necessary to introduce some interpolation<br />
scheme for the precise detection of the ray-surface<br />
intersection point.<br />
In order to obtain high qu<strong>al</strong>ity renditions in an acceptable<br />
time, the voxel travers<strong>al</strong> <strong>al</strong>gorithm should have the<br />
following properties:<br />
1. it should enable rays with arbitrary start point and<br />
direction (perspective views and recursive ray tracing),<br />
2. it should enable ray-surface intersection point with<br />
subvoxel precision (norm<strong>al</strong> computation for shading<br />
and ray refraction/reflection), and<br />
3. it should exploit various kind of coherency for speed<br />
up [12].<br />
1.2 Previous work<br />
The voxel travers<strong>al</strong> <strong>al</strong>gorithms used in volume visu<strong>al</strong>ization<br />
can be categorized as<br />
1. continuous ray generators (floating point 3D DDA),<br />
which define the ray as a sequence of usu<strong>al</strong>ly equidistant<br />
points on a line. Due to its <strong>al</strong>gorithmic simplicity,<br />
it was used by more authors [9, 14]. However, it is<br />
not possible to apply any of the ray connectivity criteria<br />
[8] to the sequence of voxels thus defined, and<br />
the ray can skip some important voxels. This is usu<strong>al</strong>ly<br />
overcome by increasing the point density, which<br />
degrades the <strong>al</strong>gorithm performance.<br />
2. discrete ray generators, which generate the sequence<br />
of voxels pierced by a ray directly.<br />
In the latter category we can further distinguish integer<br />
based <strong>al</strong>gorithms, which assume that the ray has start and<br />
end points with integer coordinates [8] and <strong>al</strong>gorithms enabling<br />
arbitrary start point and direction [1, 3].<br />
Not <strong>al</strong>l voxels contribute to the rendered image with the<br />
same weight. Only some of them belong to the interresting<br />
objects, while the others can be traversed rapidly or even tot<strong>al</strong>ly<br />
skipped. This capability is c<strong>al</strong>led space-leaping [18].<br />
The idea to switch between the lower precision but faster<br />
26-connected line generator in the background region and<br />
the precise 6-connected one in the object vicinity was introduced<br />
in [19]. Another popular approach for fast empty<br />
space leaping is based on hierarchic<strong>al</strong> subdivision [10, 15].<br />
Digit<strong>al</strong> distance transforms were used in [21] to speed up<br />
the floating point 3D DDA <strong>al</strong>gorithm as well as in [7]<br />
for 26-connected ray templates travers<strong>al</strong>. Coherency between<br />
consecutive images was used for minimizing the<br />
background leaping time in [5, 20].<br />
2 Surface rendering of raster data<br />
It is necessary to define some kind of interpolation surface<br />
that is at least C 0 continuous across the voxel boundaries,<br />
in order to detect the object surface with subvoxel<br />
precision. The exact surface point should be then searched<br />
for as an intersection of the ray with that surface. This task<br />
splits into two parts:<br />
1. finding the voxel, where the ray-surface intersection<br />
can be found, i.e. the discrete scene travers<strong>al</strong>, and<br />
2. exact computation of the intersection position within<br />
the voxel.<br />
First, we sh<strong>al</strong>l de<strong>al</strong> with the suitable surface interpolation<br />
and the exact ray-surface intersection computation and then<br />
with the scene travers<strong>al</strong>.<br />
2.1 Definitions<br />
Let the 3D image P be a set of K � L � M v<strong>al</strong>ues,<br />
representing samples of some measured property in the<br />
vertices of a regular unit grid:<br />
P � fpijk 2 R : 0 � i � K� 0 � j � L� 0 � k � M g�<br />
where i, j and k are integers.<br />
Let us segment P into n subsets u l, such that<br />
�<br />
l<br />
u l � P �<br />
�<br />
l<br />
u l � ��<br />
Let u l be the l th object and l its identifier. Let I �<br />
f0� 1� � � �n � 1g be a set of object identifiers and let l 2 I.<br />
The binary image B is the set<br />
B � fbijk 2 I : 0 � i � K� 0 � j � L� 0 � k � M g�<br />
We can assume without any loss of gener<strong>al</strong>ity, that border<br />
v<strong>al</strong>ues of B, i.e. those, for which at least one coordinate<br />
i, j or k is either equ<strong>al</strong> 0 or K � 1, L � 1 and M � 1<br />
respectively, belong to the 0 th object.<br />
Let voxel be a tuple Vijk � �vijk� hijk�, where vijk ��<br />
i� i � 1�� � j� j � 1�� � k� k � 1� is voxel volume and<br />
hijk 2 f0� 1g is its v<strong>al</strong>ue. The point �i� j� k� is a voxel<br />
vertex and similarly the point �i � 0�5� j � 0�5� k � 0�5�<br />
is the voxel center. The voxel v<strong>al</strong>ue hijk will have the<br />
following meaning:<br />
hijk � 0 means certainty that none of the object surfaces<br />
pass through this voxel, and<br />
hijk � 1 means, that we are not sure about this.<br />
The voxel v<strong>al</strong>ue depends on the binary image B and on<br />
the choice of the surface approximation. We denote voxels<br />
with v<strong>al</strong>ues equ<strong>al</strong> to 0 (resp. 1) 0-voxels (resp. 1-voxels).<br />
We denote the set of points D � f�i� j� k� : 0 � i �<br />
p� 0 � j � q� 0 � k � rg voxel scene domain and the set<br />
S�p� q� r� � fVijk : �i� j� k� 2 Dg voxel scene. The voxel<br />
scene S C �M� N� O� is c<strong>al</strong>led center representation of the<br />
image P, if the sample pijk is assigned to the center of the<br />
voxel Vijk. An<strong>al</strong>ogously, it is the vertex representation S V ,<br />
if the sample is assigned to the voxel vertex. Apparently<br />
the size of the scene S V domain <strong>al</strong>ong each axis is 1 voxel<br />
sm<strong>al</strong>ler than that of S C .<br />
Let the voxels whose <strong>al</strong>l corresponding bijk � 0 be<br />
c<strong>al</strong>led background voxels (in both representations) and the<br />
rest foreground voxels.
2.2 Surface point definition by ray tracing<br />
Let the surface S ijk<br />
of the object u l<br />
l be defined within<br />
the volume of Vijk by means of an interpolating function<br />
Fl and the threshold v<strong>al</strong>ue tl: S ijk<br />
l<br />
� fF l�x� y� z� � ijk� � t l : �x� y� z� 2 v ijkg�<br />
The � ijk represent v<strong>al</strong>ues p ijk or b ijk in some neighborhood<br />
of a voxel V ijk. We speak of gray level interpolating<br />
function if p ijk v<strong>al</strong>ues are used and we suppose, that the<br />
object l was segmented by thresholding with a threshold t l.<br />
In the case of some other segmentation method we use the<br />
v<strong>al</strong>ues b ijk in such a way that to samples b ijk � l we assign<br />
v<strong>al</strong>ue 1 and to samples with b ijk 6� l we assign v<strong>al</strong>ue 0. In<br />
this case we speak about binary interpolating function and<br />
we use v<strong>al</strong>ue t l � 0�5 for <strong>al</strong>l objects as the threshold.<br />
We get the exact position of the ray-object surface intersection<br />
by solving the system of equations:<br />
X � A � t�u<br />
Fl�x� y� z� �ijk� � tl� (1)<br />
where A is the eye position and �u is the ray direction vector.<br />
It may happen that a voxel is intersected by the surfaces<br />
of more than one object. In this case, it is necessary to<br />
compute the intersections with <strong>al</strong>l of them and to take the<br />
nearest to the eye point into consideration.<br />
In the following we sh<strong>al</strong>l describe some possibilities for<br />
the definition of the function Fl in dependency of �ijk.<br />
2.3 0-order interpolation in the center representation<br />
We sh<strong>al</strong>l use this kind of interpolation for faster, less<br />
precise rendering of the 3D image. Let us define Fl within<br />
the voxel volume as<br />
�<br />
1 if bijk � l<br />
Fl�x� y� z� �ijk� �<br />
0 if bijk 6� l<br />
which means that the binary interpolating function is constant<br />
within the voxel volume. The voxel v<strong>al</strong>ue hijk is in<br />
this case initi<strong>al</strong>ized by min�1� bijk� (Figure 1a). To detect<br />
the surface by ray tracing means to find the first voxel of<br />
the ray with a nonzero v<strong>al</strong>ue without further intersection<br />
computation.<br />
2.4 Trilinear interpolation in the center representation<br />
The trilinear interpolation function is defined as<br />
Fl�x� y� z� �ijk� �<br />
txyzxyz � txyxy � txzxz � tyzyz �<br />
txx � tyy � tzz � t�<br />
The coefficients t � � �txyz depend on the v<strong>al</strong>ues<br />
v0� v1� � � � � v7, positioned in the voxel Vijk vertices. Since<br />
in the center representation we assume that the samples<br />
of the scanned field are situated in voxel centers, the v<strong>al</strong>ues<br />
v0� v1� � � � � v7 must be computed as a mean over those<br />
voxels sharing the given vertex.<br />
This approach gives smooth surfaces due to the mean<br />
computation. It has been observed that such surfaces can<br />
be shifted into the object, which may completely “smooth<br />
out” object details comparable with the voxel size.<br />
Another consequence is that the surface can be detected<br />
not only within object voxels but <strong>al</strong>so within background<br />
voxels in their vicinity. Therefore, in this case, we sh<strong>al</strong>l<br />
assign the v<strong>al</strong>ue 0 only to those background voxels of the<br />
scene S C , which are not 26-adjacent to an object voxel. To<br />
<strong>al</strong>l other voxels we sh<strong>al</strong>l assign 1 (Figure 1b).<br />
We sh<strong>al</strong>l prefer this kind of interpolation, due to its<br />
smoothing ability, for objects segmented by some other<br />
method as the thresholding.<br />
2.5 Trilinear interpolation in the vertex representation<br />
The interpolating function is in this case defined<br />
as in the previous section, with the exception that<br />
the v<strong>al</strong>ues v0� v1� � � �� v7 are directly given by samples<br />
s ijk � � �s i�1j�1k�1 positioned in the voxel vertices. We<br />
assign v<strong>al</strong>ue 0 to background voxels and 1 to foreground<br />
voxels. This kind of interpolation is suitable for scenes<br />
with details on a voxel level.<br />
Of course, higher order interpolation schemes considering<br />
a larger environment of the voxel, can be used, too, at<br />
the cost of a higher computation<strong>al</strong> complexity.<br />
3 Discrete ray travers<strong>al</strong><br />
In the previous sections we came to the result that, because<br />
of the segmentation and the choice of the interpolation<br />
method, we can partition the scene into 0-voxels<br />
with no object surface and 1-voxels, where a ray-surface<br />
intersection can be found. Let us define a discrete ray as<br />
an ordered sequence of voxels Vi of the scene S C (S V ),<br />
pierced by the ray with the equation X � A � t�r.<br />
The go<strong>al</strong> of the voxel scene travers<strong>al</strong> <strong>al</strong>gorithm is to<br />
find the ray’s first 1-voxel. We sh<strong>al</strong>l proceed with the<br />
following voxel of the ray only in such a case, that no<br />
ray-surface intersection is found within the volume of the<br />
previous one. If we add to the requirement of correctness of<br />
the surface point detection the requirement of high speed<br />
too, the discrete ray travers<strong>al</strong> <strong>al</strong>gorithm should have the<br />
following properties:<br />
1. it should pass the region of background voxels usu<strong>al</strong>ly<br />
surroundingthe object as fast as possible, i.e. it should<br />
utilize the object scene coherency and<br />
2. it must not miss any object voxel, i.e. the voxels of the<br />
ray should fulfill the condition of 6-adjacency [19] at<br />
least in the vicinity of the object.<br />
In the <strong>al</strong>gorithm design, we start from the assumption<br />
that the chessboard distance(CD) [2] to the nearest object<br />
voxels is assigned to each 0-voxel Vijk. Thus a cubic macro<br />
region is created:<br />
O n �i� j� k� � fhpqr � 0 : i � n � p � i � n�<br />
j � n � q � j � n� k � n � r � k � ng<br />
with its center in Vijk and with side size 2n � 1. Since<br />
CD is independent of the projection parameters, we can<br />
c<strong>al</strong>culate it during a preprocessing phase. No extra space is<br />
necessary for the storage of the distance information, if we<br />
use the origin<strong>al</strong>ly “empty” background voxels. In order to
-<br />
-<br />
-<br />
-<br />
sample b = 0<br />
ijk<br />
sample b = 1,2,3...<br />
ijk<br />
0-voxel<br />
1-voxel<br />
(a)<br />
Figure 1: Scene initi<strong>al</strong>ization: (a) S C for 0 order interpolation,<br />
(b) S C for trilinear interpolation (c) S V for trilinear<br />
interpolation<br />
(b)<br />
(c)<br />
t 3<br />
t 2<br />
t 1<br />
t 0<br />
0 1 2 3<br />
Figure 2: Entry point coordinate thresholds<br />
ray<br />
distinguish between the object identifier and the distance,<br />
a flag bit is reserved within each voxel descriptor.<br />
We know that there are no object voxels within<br />
O n �i� j� k�, so we can jump from V ijk directly to the first<br />
ray’s voxel outside of O n �i� j� k�. The travers<strong>al</strong> speed up<br />
is thus achieved by reducing the number of visited voxels.<br />
Detailed description of the <strong>al</strong>gorithm is in [16], therefore we<br />
limit ourselves only to a brief description of its main loop,<br />
i.e. to the c<strong>al</strong>culation of steps between macro regions and<br />
to the description of the travers<strong>al</strong> of a single macro region.<br />
Since the <strong>al</strong>gorithm is symmetric with respect to <strong>al</strong>l axes,<br />
we sh<strong>al</strong>l present only the relations for the x axis. Further,<br />
we sh<strong>al</strong>l assume that the direction vector has only nonnegative<br />
coordinates. Gener<strong>al</strong>ization to <strong>al</strong>l possible directions<br />
is done by the proper initi<strong>al</strong>ization of some variables.<br />
3.1 Scene travers<strong>al</strong><br />
Let us imagine that we have reached the voxel Vijk with<br />
the assigned CD � n at an entry point �p � �px� py� pz�,<br />
whose coordinates are expressed with respect to �i� j� k�.<br />
Let the entry (exit) face be that through which the ray<br />
enters (exits) the voxel.<br />
It is necessary to find the nearest intersection of the line<br />
X � �p � s�r with the planes x � n, y � n and z � n in<br />
order to find the first ray voxel outside of O n �i� j� k�. Let us<br />
suppose that the entry face is of type X, i.e. perpendicular<br />
to the x axis. We can see in Figure 2 that for each n there<br />
exists such a threshold v<strong>al</strong>ue tx y�n� of the input coordinate<br />
py that (2D case)<br />
1. if py � tx y�n�, then the exit face is <strong>al</strong>so of X type, and<br />
2. if py � tx y�n�, then it is of Y type,<br />
which in the 3D case holds for pz, too. The upper index<br />
denotes the type of the entry face. It can be shown that<br />
t x<br />
y�n� � �n � 1� rx � ry<br />
�<br />
The basic scheme of the <strong>al</strong>gorithm is outlined in Figure 3,<br />
and the scheme for computation of the exit face type in<br />
Figure 4. The expression py � t z<br />
ry<br />
y�n� � pz enables us to<br />
rz distinguish between exit types Y and Z when the type is<br />
not X.<br />
rx
while(in scene and object not found )<br />
n = GetMacroRegionSize();<br />
if(faceType == X)<br />
macroRegionStep(x,y,z,n);<br />
else if(faceType == Y)<br />
macroRegionStep(y,z,x,n);<br />
else if(faceType == Z)<br />
macroRegionStep(z,x,y,n);<br />
end while<br />
Figure 3: CD <strong>al</strong>gorithm: scene travers<strong>al</strong><br />
macroRegionStep(x,y,z,n)<br />
f<br />
if(py � t x<br />
y�n� and pz � t x<br />
z�n�)<br />
else<br />
NoChangeMacroRegionStep(x,y,z,n);<br />
if(py � t z<br />
else<br />
ry y�n� � pz ) rz ChangeMacroRegionStep(x,y,z,n);<br />
ChangeMacroRegionStep(x,z,y,n);<br />
g<br />
Figure 4: CD <strong>al</strong>gorithm: macro region step<br />
3.2 Macro region travers<strong>al</strong><br />
In this part we describe briefly the c<strong>al</strong>culation of the<br />
next voxel position and the coordinates of the new entry<br />
point. Two kinds of steps across the macro region can be<br />
distinguished as shown in Figure 4:<br />
1. without face type change (NoChangeMacroRegion-<br />
Step, Figure 5a), and<br />
2. with face type change (ChangeMacroRegionStep,Figure<br />
5b).<br />
The first case is a step across a slab defined by two par<strong>al</strong>lel<br />
planes with distance n. If we denote dx y�n� � n � ry , then<br />
rx for the next voxel holds:<br />
i 0<br />
j 0<br />
k 0<br />
� i � n<br />
� j � int�d x<br />
y�n��� p0<br />
y � fract�dx y�n�� � k � int�d x<br />
z �n��� p0<br />
z � fract�dx z �n��<br />
The second case is an<strong>al</strong>ogous; only the intersection with<br />
the plane x � 0 must be c<strong>al</strong>culated (Figure 5b):<br />
py � ry<br />
� px<br />
rx<br />
3.3 Further speed up<br />
There are some possibilities for a further speed up of the<br />
CD travers<strong>al</strong> <strong>al</strong>gorithm:<br />
1. both arrays t�n� and d�n� can be precomputed. However,<br />
in this case the <strong>al</strong>gorithm can be used only for a<br />
par<strong>al</strong>lel projection,<br />
P y<br />
p y<br />
p’ y<br />
p y<br />
y<br />
y<br />
2<br />
2<br />
a<br />
p x b<br />
ray<br />
p’ y<br />
x<br />
d<br />
y<br />
[2]<br />
ray<br />
P y<br />
x<br />
d<br />
y<br />
[2]<br />
Figure 5: Macro region travers<strong>al</strong>: (a) entry and exit face of<br />
the same type, (b) with different types<br />
2. implementation in the fixed point arithmetics is possible,<br />
and<br />
3. the decision variable triple �px� py� pz� can be replaced<br />
by<br />
�p 0<br />
x� p 0<br />
y� p 0<br />
px<br />
z� � �<br />
rx<br />
� py<br />
ry<br />
� pz<br />
�<br />
rz<br />
As a consequence we get rid of some multiplications.<br />
4 Implementation and results<br />
All <strong>al</strong>gorithms were implemented in the C language on a<br />
DECstation 5000/200 equipped with 48 MB of main memory.<br />
Figure 7 shows the impact of the subvoxel precision surface<br />
detection on the visu<strong>al</strong> qu<strong>al</strong>ity of the rendered image.<br />
The 64x64x64 data were rendered to a 500x500 image with<br />
either 0-order interpolation (a) or trilinear interpolation(b).<br />
x<br />
x
The scheme based on the vertex scene representation (Section<br />
2.5) was chosen due to the importance of details.<br />
The 500x500 image in Figure 8 was rendered by the<br />
CD voxel travers<strong>al</strong> <strong>al</strong>gorithm using trilinear interpolation<br />
with recursion depth 4 in 128 seconds. The skull data was<br />
obtained by a CT tomograph,the teapot and the implicit surface<br />
were voxelized from their an<strong>al</strong>ytic<strong>al</strong> description [17].<br />
All objects were combined into a 200x200x110 scene.<br />
To obtain information about the behavior of the CD<br />
<strong>al</strong>gorithm over scenes with various complexities, a computer<br />
experiment was set up, based on rendering of scenes<br />
with randomly positioned spheres of various size and number.<br />
Its performance was compared with three similar <strong>al</strong>gorithms<br />
known from the literature, fulfilling the conditions<br />
from the Section 1.1<br />
The first one is Cleary’s and Wyvill’s <strong>al</strong>gorithm [3] for<br />
fast voxel travers<strong>al</strong> (FVT), generating a sequence of voxels<br />
pierced by the ray in a uniformly subdivided scene. The<br />
decision which voxel will be the next in the sequence is<br />
controlled by three variables dx, dy and dz, recording the<br />
tot<strong>al</strong> distances <strong>al</strong>ong the ray from some common point to<br />
the last crossings with X, Y and Z type voxel face.<br />
The second Ray Acceleration by Distance Coding<br />
(RADC) <strong>al</strong>gorithm [21] is a modification of the 3D-DDA<br />
<strong>al</strong>gorithm, which takes advantage of a 3D digit<strong>al</strong> distance<br />
to speed up the voxel travers<strong>al</strong>. Since this <strong>al</strong>gorithm works<br />
with various approximations of the Euclidean distance, we<br />
included tests with the chessboard (Figure 6, RADCchess)<br />
and chamfer (RADCchamf) distances. A sampling rate of<br />
1.4 samples per volume distance has been chosen.<br />
The third one, the Spackman’s and Willis’s SMART<br />
(Spati<strong>al</strong> Measure for Accelerated Ray Tracing) navigation<br />
oct-tree travers<strong>al</strong> [15] works on an oct-tree represented as<br />
a breadth first list.<br />
The notion of the spati<strong>al</strong> coherency leads to the following<br />
idea: The “more” coherent scene contains few larger objects,<br />
while the “less” coherent scene contains many sm<strong>al</strong>l<br />
objects. The scene with a single spheric<strong>al</strong> object has the<br />
highest spati<strong>al</strong> coherency. Since the sphere has the sm<strong>al</strong>lest<br />
surface-to-volume ratio (SVR), we propose this ratio<br />
to be a measure of the scene coherency for the purpose of<br />
<strong>al</strong>gorithm comparison.<br />
The sequence of scene phantoms was generated in the<br />
following manner. The scene built up of 128x128x128<br />
voxels was subdivided into NxNxN subregions (N �<br />
1� � � � � 10). Within each subregion, a voxelized sphere was<br />
randomly placed (1–1024 spheres), such that tot<strong>al</strong> volume<br />
of <strong>al</strong>l spheres was identic<strong>al</strong> for <strong>al</strong>l N. Thus we obtained<br />
scenes with equ<strong>al</strong> number of object voxels but different<br />
SVR. Chessboard and chamfer distance initi<strong>al</strong>ization took<br />
from 18 to 21 seconds.<br />
In the experiment, only par<strong>al</strong>lel primary rays were traced<br />
until the first object voxel was found, with no subsequent<br />
shading. The results of the experiment are depicted in<br />
Figure 6. The y axis v<strong>al</strong>ues represent the pure travers<strong>al</strong><br />
time necessary for rendering of a 250x250 image. V<strong>al</strong>ues<br />
on the left side of the graph correspond to the simple scenes<br />
with low number of spheres, while those on the right side<br />
belong to the more complex scenes.<br />
We see that the proposed CD travers<strong>al</strong> <strong>al</strong>gorithm outperforms<br />
<strong>al</strong>l three <strong>al</strong>gorithms over the whole SVR range,<br />
delivering the best results in comparison to FVT for the<br />
less complex scenes. Experiments with tomographic data<br />
travers<strong>al</strong> time [s]<br />
22<br />
20<br />
18<br />
16<br />
14<br />
12<br />
10<br />
8<br />
6<br />
4<br />
FVT<br />
SMART<br />
RADCchess<br />
RADCchamf<br />
2<br />
0.1 0.2 0.3 0.4 0.5 0.6 0.7 0.8<br />
surface/volume ratio<br />
Figure 6: Comparison of various voxel travers<strong>al</strong> <strong>al</strong>gorithms<br />
gave results similar to those from the left side for most of<br />
the scanned objects. We further see from Figure 6 that<br />
the travers<strong>al</strong> time for the FVT <strong>al</strong>gorithm is shorter for the<br />
denser populated scenes. In that case the surface is encountered<br />
earlier, which shortens the tot<strong>al</strong> distance traversed.<br />
All other <strong>al</strong>gorithms show opposite behavior. In this case<br />
the shorter distance is surpassed by sm<strong>al</strong>ler macro regions<br />
which results in shorter mean step.<br />
It is apparent that beyond some scene complexity the<br />
macro region based travers<strong>al</strong> <strong>al</strong>gorithms are, due to their<br />
larger one step cost, slower than the FVT <strong>al</strong>gorithm. For<br />
example, in semitransparent volume rendering, where the<br />
travers<strong>al</strong> is not stopped at the object surface, but <strong>al</strong>l or at<br />
least a lot of voxels should be traversed, it proved to be<br />
useful to switch between the CD travers<strong>al</strong> <strong>al</strong>gorithm in the<br />
background region and the FVT within the object.<br />
5 Conclusion<br />
We concentrated in the paper on the following topics:<br />
1. we showed how, based on the segmentation and choice<br />
of the interpolation function, the voxel v<strong>al</strong>ues should<br />
be initi<strong>al</strong>ized to enable efficient travers<strong>al</strong> of the scene,<br />
2. we proposed the CD voxel travers<strong>al</strong> <strong>al</strong>gorithm based<br />
on cubic macro regions defined by the chessboard distance,<br />
and<br />
3. we compared it with other similar <strong>al</strong>gorithms known<br />
from the literature.<br />
Some problems remain open, however, such as the utilization<br />
of the ray-to-ray coherency in the CD travers<strong>al</strong><br />
<strong>al</strong>gorithm, or the efficient computation of the ray-surface<br />
CD
intersections. These will be the subject of our further research.<br />
Acknowledgement<br />
This project has been parti<strong>al</strong>ly supported by the grant<br />
No. 2/999003/92 from the Slovak Grant Agency and by the<br />
grant P8189-MED from the FWF (Austria). The data were<br />
provided by Dr. Serge Weis from the University of Munich,<br />
Institute for Neuropathology (skull) and by University of<br />
North Carolina (molecule). Speci<strong>al</strong> thanks are due the<br />
Instituteof InformationProcessing of Austrian Academy of<br />
Sciences for supporting my work and to colleagues at both<br />
institutes in Bratislava and Vienna for helpful comments<br />
and discussions.<br />
References<br />
[1] John Amanatides and Andrew Woo. A fast voxel<br />
travers<strong>al</strong> <strong>al</strong>gorithm for ray tracing. In G. Marech<strong>al</strong>,<br />
editor, Proc. EUROGRAPHICS ’87, pages 3–10.<br />
North-Holland, 1987.<br />
[2] Gunilla Borgefors. Distance transformations in digit<strong>al</strong><br />
images. Computer Vision, Graphics, and Image<br />
Processing, 34(3):344–371, 1986.<br />
[3] John C. Cleary and Geoff Wyvill. An<strong>al</strong>ysis of an<br />
<strong>al</strong>gorithm for fast ray tracing using uniform space<br />
subdivision. The Visu<strong>al</strong> Computer, 4(2):65–83, July<br />
1988.<br />
[4] Akira Fujimoto, Takayuki Tanaka, and Kansei Iwata.<br />
Arts: Accelerated ray-tracing system. IEEE Computer<br />
Graphics and Applications, 6(4):16–26, 1986.<br />
[5] B. Gudmundson and M. Randen. Increment<strong>al</strong> generation<br />
of projections of CT-volumes. In Proceedings of<br />
the First Conference on Visu<strong>al</strong>ization in Biomedic<strong>al</strong><br />
Computing, pages 27–34, Atlanta, GA, May 1990.<br />
[6] Karl Heinz Höhne, Michael Bomans, Andreas Pommert,<br />
Martin Riemer, Carsten Schiers, Ulf Tiede, and<br />
Gunnar Wiebecke. 3D visu<strong>al</strong>ization of tomographic<br />
volume data using the gener<strong>al</strong>ized voxel model. The<br />
Visu<strong>al</strong> Computer, 6(1):28–36, February 1990.<br />
[7] Igor Holländer and Miloˇs ˇSrámek. An Interactive<br />
Tool for Manipulation and Presentation of 3D Tomographic<br />
Data. In H. U. Lemke, K. Inamura, C. C. Jaffee,<br />
and R. Felix, editors, CAR ’93 Computer Assisted<br />
Radiology, pages 278–383, Berlin, 1993. Springer-<br />
Verlag.<br />
[8] Arie Kaufman and Ey<strong>al</strong> Shimony. 3D scan-conversion<br />
<strong>al</strong>gorithms for voxel-based graphics. In Frank<br />
Crow and Stephen M. Pizer, editors, Proceedings of<br />
1986 Workshop on Interactive 3D Graphics, pages<br />
45–75, Chapel Hill, North Carolina, October 1986.<br />
[9] Marc Levoy. Display of surfaces from volume data.<br />
IEEE Computer Graphics and Applications, 8(3):29–<br />
37, May 1988.<br />
[10] Marc Levoy. Efficient ray tracing of volume data.<br />
ACM Transactions on Computer Graphics, 9(3):245–<br />
261, 1990.<br />
[11] W. E. Lorensen and H. E. Cline. Marching cubes:<br />
A high-resolution 3D surface construction <strong>al</strong>gorithm.<br />
Computer Graphics, 21(4):163–169, July 1987.<br />
[12] Matasaka Ohta and Mamoru Maekawa. Ray coherence<br />
theorem and constant time ray tracing <strong>al</strong>gorithm.<br />
In T. Kunii, editor, Computer Graphics 1987 – Proceedings<br />
of CG Internation<strong>al</strong> ’87, pages 303–314.<br />
Springer–Verlag, 1987.<br />
[13] Andreas Pommert, Michael Bomans, and Karl Heinz<br />
Höhne. Volume visu<strong>al</strong>ization in magnetic resonance<br />
angiography. IEEE Computer Graphics and Applications,<br />
12(5):12–13, September 1992.<br />
[14] R. A. Robb and C. Barillot. Interactive 3-D image<br />
display and an<strong>al</strong>ysis. In Proceedings SPIE on Hybrid<br />
Image and Sign<strong>al</strong> Processing, volume 939, pages<br />
173–195, Bellingham, WA, 1988.<br />
[15] John Spackman and Philip Willis. The SMART<br />
navigation of a ray through an oct-tree. Comput.&Graphics,<br />
15(2):185–194, 1991.<br />
[16] Miloˇs ˇSrámek. Cubic macro-regions for fast voxel<br />
travers<strong>al</strong>. Machine Graphics & Vision, 3(1/2):171–<br />
179, 1994.<br />
[17] Miloˇs ˇSrámek. Gray level voxelization: A tool for simultaneous<br />
rendering of scanned and an<strong>al</strong>ytic<strong>al</strong> data.<br />
In Eugen Ruˇzick´y, Pavol Eliáˇs, and Andrej Ferko, editors,<br />
Proceedings of the Tenth Spring School on Computer<br />
Graphics and its Applications, pages 159–168,<br />
Bratislava, Slovak Republic, June 1994. Comenius<br />
University.<br />
[18] Sidney W. Wang and Arie Kaufman. Volume sampled<br />
voxelization of geometric primitives. In Visu<strong>al</strong>ization<br />
’93, pages 78–84, San Jose, CA, October 1993.<br />
[19] Roni Yagel, Daniel Cohen, and Arie Kaufman. Discrete<br />
ray tracing. IEEE Computer Graphics and Applications,<br />
12(5):19–28, September 1992.<br />
[20] Roni Yagel and Zhouhong Shi. Accelerating volume<br />
animation by space-leaping. InVisu<strong>al</strong>ization ’93,<br />
pages 62–84, San Jose, CA, October 1993.<br />
[21] Karel J. Zuiderveld, Anton H. J. Koning, and Max A.<br />
Viergever. Acceleration of ray-casting using 3D distance<br />
transforms. In R. A. Robb, editor, Visu<strong>al</strong>ization<br />
in Biomedic<strong>al</strong> Computing II, Proc. SPIE 1808, pages<br />
324–335, Chapel Hill, NC, 1992.
(a) (b)<br />
Figure 7: Electrone density map of High Potenti<strong>al</strong> Iron Protein molecule : (a) 0-order interpolation, (b) trilinear interpolation<br />
Figure 8: Scene with voxelized and scanned objects
Par<strong>al</strong>lel Performance Measures for Volume Ray Casting<br />
Abstract<br />
We describe a technique for achieving fast volume<br />
ray casting on par<strong>al</strong>lel machines� using a load b<strong>al</strong>anc�<br />
ing scheme and an e�cient pipelined approach to com�<br />
positing. We propose a new model for measuring the<br />
amount of work one needs to perform in order to ren�<br />
der a given volume� and use this model to obtain a<br />
better load b<strong>al</strong>ancing scheme for distributed memory<br />
machines. We <strong>al</strong>so discuss in detail the design trade�<br />
o�s of our technique. In order to v<strong>al</strong>idate our model<br />
we have implemented it on the Intel iPSC�860 and the<br />
Intel Paragon� and conducted a detailed performance<br />
an<strong>al</strong>ysis.<br />
1 Introduction<br />
As researchers and engineers use volume render�<br />
ing to study complex physic<strong>al</strong> and abstract structures<br />
they need a coherent� powerful� easy to use visu<strong>al</strong>iza�<br />
tion tool� that lets them interactively change <strong>al</strong>l the<br />
necessary parameters. Unfortunately� even with the<br />
latest volume rendering acceleration techniques run�<br />
ning on top�of�the�line workstations� it still takes a<br />
few seconds to a few minutes to volume render images.<br />
This is clearly far from interactive. With the advent<br />
of par<strong>al</strong>lel machines� scanners and instrumentation�<br />
larger and larger datasets �typic<strong>al</strong>ly from 32MB to<br />
512MB� are being generated that would not even �t<br />
in memory of a workstation class machine. Even if ren�<br />
dering time is not a major concern� big datasets may<br />
be expensive to hold in storage� and extremely slow to<br />
transfer to a typic<strong>al</strong> workstations over network links.<br />
These problems lead to the question of whether the<br />
visu<strong>al</strong>ization should be performed directly on the par�<br />
<strong>al</strong>lel machines that generate the simulation data or<br />
sent over to a high performance graphics workstation<br />
for post�processing. First� if the visu<strong>al</strong>ization software<br />
was integrated in the simulation software� there would<br />
be no need for extra storage and visu<strong>al</strong>ization could<br />
be an active part of the simulation. Second� large par�<br />
<strong>al</strong>lel machines can render these datasets faster than<br />
workstations can� possibly in re<strong>al</strong>�time or at least giv�<br />
ing the possibility of achieving interactive rates. Fi�<br />
n<strong>al</strong>ly� if re<strong>al</strong> integration between the simulation and<br />
Cl�audio T. Silva and Arie E. Kaufman<br />
Department of Computer Science<br />
State University of New York at Stony Brook<br />
Stony Brook� NY 11794�4400<br />
the visu<strong>al</strong>ization tool is possible� one could interac�<br />
tively �steer� the simulation� and possibly terminate<br />
simulations that are wrong or uninteresting at an ear�<br />
lier stage instead of performing long and expensive<br />
archiving operations for the generated datasets. In<br />
this paper we focus on the architecture and perfor�<br />
mance measures of visu<strong>al</strong>ization <strong>al</strong>gorithms that are<br />
running directly on the par<strong>al</strong>lel machines.<br />
Clearly� an <strong>al</strong>gorithm that runs on a par<strong>al</strong>lel ma�<br />
chine has to be e�cient and should be able to make<br />
good use of the computing power. A conserva�<br />
tive tradeo� between sc<strong>al</strong>ability and actu<strong>al</strong> process�<br />
ing speed is very important. Also� the <strong>al</strong>gorithm has<br />
to be space e�cient� and for the case of a distributed<br />
memory MIMD machine� memory duplication should<br />
be avoided. In this paper we propose a space e��<br />
cient� fast par<strong>al</strong>lel <strong>al</strong>gorithm that addresses these is�<br />
sues. This <strong>al</strong>gorithm will be the basis of a visu<strong>al</strong>ization<br />
library in the molds just described using the VolVis<br />
system �1� as its front end.<br />
A large number of par<strong>al</strong>lel <strong>al</strong>gorithms for volume<br />
rendering have been recently proposed. Schroeder and<br />
S<strong>al</strong>em �13� have proposed a shear based technique for<br />
the CM�2 that could render 128 3 volumes at multi�<br />
ple frames a second� using a low qu<strong>al</strong>ity �lter. The<br />
main drawback of their technique is low image qu<strong>al</strong>�<br />
ity. Their <strong>al</strong>gorithm had to redistribute and resam�<br />
ple the dataset for each view change. Montani et <strong>al</strong>.<br />
�10� developed a distributed memory ray tracer for the<br />
nCUBE� that used a hybrid image�based load b<strong>al</strong>anc�<br />
ing and context sensitive volume distribution. An in�<br />
teresting point of their <strong>al</strong>gorithm is the use of clus�<br />
ters to generate higher drawing rates at the expense<br />
of data replication. However� their rendering times are<br />
well over interactive times. Using a di�erent volume<br />
distribution strategy but still a static data distribu�<br />
tion� Ma et <strong>al</strong>. �9� have achieved better frame rates on<br />
a CM�5. In their approach the dataset is distributed<br />
in a K�d tree fashion and the compositing is done in a<br />
tree structure. Others �6� 3� 11� have used similar load<br />
b<strong>al</strong>ancing schemes using static data distribution� for<br />
either image compositing or ray data�ow compositing.
Nieh and Levoy �12� have par<strong>al</strong>lelized an e�cient vol�<br />
ume ray caster �8� and achieved very impressive per�<br />
formance on a shared memory DASH machine.<br />
In this paper we concentrate on the par<strong>al</strong>lelization<br />
of a simple but fast method for ray casting� c<strong>al</strong>led<br />
PARC �polygon assisted ray casting� �2�. Our par<strong>al</strong>lel<br />
implementation uses a static data decomposition and<br />
an image compositing scheme. We have implementa�<br />
tions that work on the Intel iPSC�860 and the Intel<br />
Paragon. In Section 2 we explain the important issues<br />
in designing and writing a par<strong>al</strong>lel ray caster� followed<br />
by Section 3� where we study a new method for mea�<br />
suring the work done by a ray caster. In Section 4 we<br />
describe our <strong>al</strong>gorithm and its implementation.<br />
2 Performance Considerations<br />
In an<strong>al</strong>yzing the performance of par<strong>al</strong>lel <strong>al</strong>gorithms�<br />
there are many considerations related to the machine<br />
limitations� like for instance� communication network<br />
latency and throughput �11�. Latency can be mea�<br />
sured as the time it takes a message to leave the<br />
source processor and be received at the destination<br />
end. Throughput is the amount of data that can be<br />
sent on the connection per unit time. These num�<br />
bers are particularly important for <strong>al</strong>gorithms in dis�<br />
tributed memory architectures. They can change the<br />
behavior of a given <strong>al</strong>gorithm enough to make it com�<br />
pletely impractic<strong>al</strong>.<br />
Throughput is not a big issue for methods based<br />
on volume ray casting that perform static data distri�<br />
bution with ray data�ow as most of the communica�<br />
tion is amortized over time �10� 6� 3�. On the other<br />
hand� methods that perform compositing at the end<br />
of rendering or that have communication scheduled<br />
as an implicit synchronization phase have a higher<br />
chance of experiencing throughput problems. The rea�<br />
son for this is that communication is scheduled <strong>al</strong>l at<br />
the same time� usu<strong>al</strong>ly exceeding the machines archi�<br />
tectur<strong>al</strong> limits. One should try to avoid synchronized<br />
phases as much as possible.<br />
Latency is <strong>al</strong>ways a major concern� any <strong>al</strong>gorithm<br />
that requires communication pays a price for using the<br />
network. The start up time for message communica�<br />
tion is usu<strong>al</strong>ly long compared to CPU speeds. For<br />
instance� in the iPSC�860 it takes at least 200�s to<br />
complete a round trip message between two proces�<br />
sors. Latency hiding is an important issue in most<br />
<strong>al</strong>gorithms� if an <strong>al</strong>gorithm often blocks waiting for<br />
data on other processors to continue its execution� it<br />
is very likely this <strong>al</strong>gorithm will perform badly. The<br />
classic ways to hide latency is to use pipelining or pre�<br />
fetching �5�.<br />
Even though latency and throughput are very im�<br />
portant issues in the design and implementation of a<br />
par<strong>al</strong>lel <strong>al</strong>gorithm� the most important issue by far is<br />
load b<strong>al</strong>ancing. No par<strong>al</strong>lel <strong>al</strong>gorithm can perform well<br />
without a good load b<strong>al</strong>ancing scheme.<br />
Again� it is extremely important that the <strong>al</strong>gorithm<br />
has as few inherently sequenti<strong>al</strong> parts as possible if at<br />
<strong>al</strong>l. Amadahl�s law �5� shows how speed up depends<br />
on the par<strong>al</strong>lelism available in your particular <strong>al</strong>go�<br />
rithm and that any� however sm<strong>al</strong>l� sequenti<strong>al</strong> part<br />
will eventu<strong>al</strong>ly limit the speed up of your <strong>al</strong>gorithm.<br />
Given <strong>al</strong>l the constraints above� it is clear that to<br />
obtain good load b<strong>al</strong>ancing one wants an <strong>al</strong>gorithm<br />
that�<br />
� Needs low throughput and spreads communica�<br />
tion well over the course of execution.<br />
� Hides the latency� possibly by pipelining the oper�<br />
ations and working on more than one image over<br />
time.<br />
� Never causes processors to idle and�or wait for<br />
others without doing useful work.<br />
A subtle point in our requirements is in the last<br />
phrase� how do we classify useful work � We de�ne<br />
useful work as the number of instructions Iopt executed<br />
by the best sequenti<strong>al</strong> <strong>al</strong>gorithm available to volume<br />
render a dataset. Thus� when a given par<strong>al</strong>lel im�<br />
plementation uses a suboptim<strong>al</strong> <strong>al</strong>gorithm� it ends up<br />
using a much larger number of instructions than the�<br />
oretic<strong>al</strong>ly necessary as each processor executes more<br />
instructions than I opt<br />
P<br />
�P denotes the number of pro�<br />
cessors�. Clearly� one needs to compare with the best<br />
sequenti<strong>al</strong> <strong>al</strong>gorithm as this is the actu<strong>al</strong> speed up the<br />
user gets by using the par<strong>al</strong>lel <strong>al</strong>gorithm instead of the<br />
sequenti<strong>al</strong> one.<br />
The last point on useful work is usu<strong>al</strong>ly neglected<br />
in papers on par<strong>al</strong>lel volume rendering and we be�<br />
lieve this is a serious �aw in some previous approaches<br />
to the problem. In particular� it is widely known<br />
that given a transfer function and some segmentation<br />
bounds� the amount of useful information in a volume<br />
is only a fraction of its tot<strong>al</strong> size. Based on this fact�<br />
we can claim that <strong>al</strong>gorithms that use static data dis�<br />
tribution based only on spati<strong>al</strong> considerations are pre�<br />
senting �e�ciency� numbers that can be inaccurate�<br />
maybe by a large margin.<br />
To avoid the pitf<strong>al</strong>ls of norm<strong>al</strong> static data distri�<br />
bution� we present in the next section a new way to<br />
achieve re<strong>al</strong>istic load b<strong>al</strong>ancing. Our load b<strong>al</strong>ancing<br />
scheme� does not sc<strong>al</strong>e linearly as others claimed be�<br />
fore� but achieves very fast rendering times while min�<br />
imizing the �work� done by the processors.<br />
3 Load B<strong>al</strong>ancing<br />
This section explains our new approach to load b<strong>al</strong>�<br />
ancing� which is based on the PARC �polygon assisted<br />
ray casting� <strong>al</strong>gorithm �2�. The section presents a<br />
short description of PARC and describes di�erent ap�<br />
proaches to using it as a load b<strong>al</strong>ancing technique.<br />
PARC can be characterized as a presence acceleration
technique �4�� like the octree decompositions of Levoy<br />
�8�. Instead of stepping through the whole volume for<br />
rendering� only the parts that contain relevant data<br />
are used� this can save an enormous amount of ren�<br />
dering time� not only in volume stepping� but <strong>al</strong>so be�<br />
cause it greatly decreases the number of compositing<br />
and shading c<strong>al</strong>culations one needs to perform.<br />
The ration<strong>al</strong> behind PARC is simple. As one needs<br />
to c<strong>al</strong>culate the integr<strong>al</strong> I �R t1<br />
t0 e�R t<br />
��s�ds<br />
t0 I�t�dt dur�<br />
ing rendering� PARC �nds tighter bounds for t0 and t1�<br />
thus� substanti<strong>al</strong>ly lowering the rendering time. PARC<br />
does this by enclosing the volume with a rough polyg�<br />
on<strong>al</strong> approximation� which is transformed and scan<br />
converted into front and back Z bu�ers. For each ray<br />
the front one gives us a conservative estimate for t0�<br />
and the back one gives the t1 estimate.<br />
In order to skip over empty space inside volumes�<br />
our implementation of PARC uses pre�c<strong>al</strong>culated<br />
cubes <strong>al</strong>igned with the primary axes to bound cubes<br />
inside the volume. For each particular view� we scan<br />
convert the cubes into a Z bu�er �implemented in soft�<br />
ware� to obtain closer bounds on the interv<strong>al</strong>s where<br />
the ray integr<strong>al</strong>s need to be c<strong>al</strong>culated. This method<br />
achieves speeds comparable with the fastest high qu<strong>al</strong>�<br />
ity volume renderers.<br />
One can specify the number of cubes in the sub�<br />
division of the origin<strong>al</strong> dataset. This determines the<br />
accuracy of the t0 and t1 estimates� the higher the<br />
number of cubes� the closer to the exact intersection<br />
points they are. If the estimates are accurate� we per�<br />
form less work on the ray� but on the other hand the<br />
scan conversion time is higher as the number of cubes<br />
grows very fast. For instance� one can ask for a level 4<br />
PARC approximation� this means the dataset is par�<br />
titioned to 24 interv<strong>al</strong>s in each of the coordinate di�<br />
rections� for a tot<strong>al</strong> of 4096 sm<strong>al</strong>l cubes. Depending<br />
on the low and high threshold speci�ed� one usu<strong>al</strong>ly<br />
gets a much lower number of such cubes. For instance�<br />
with a level 4 PARC approximation of a CT 3D recon�<br />
structed head at a 20�200 threshold� only 38� of the<br />
cubes are non�empty.<br />
The cubes generated by PARC are the basic units<br />
for our load b<strong>al</strong>ancing. As the cubes are very close<br />
approximation of the amount of work one has to per�<br />
form during ray tracing� we use the number of cubes<br />
a processor has as the measure of how much work is<br />
performed by that particular processor. Let P denote<br />
the number of processors� and ci the number of cubes<br />
processor i has. To achieve a good load b<strong>al</strong>ancing we<br />
need a scheme that minimizes the following heuristic<br />
function for a partition X � �c1� c2� � � ���<br />
f�X� � max<br />
i6�j jci � cjj� 8i� j � P �1�<br />
The main problem in implementing this approach<br />
is that for ray casting to be e�cient the dataset part<br />
of a particular processor need to be contiguous. Not<br />
only this makes compositing easier but it <strong>al</strong>so reduces<br />
the number of intersection c<strong>al</strong>culations required. Once<br />
one decides what shape to assign to each processor�<br />
one just needs to use either Equation 1 or a variation of<br />
it. For the rest of the paper we describe an implemen�<br />
tation of our load b<strong>al</strong>ancing scheme that uses slabs�<br />
which are consecutive slices of the dataset <strong>al</strong>igned on<br />
two major axes� as the basic partition blocks of the<br />
dataset for load b<strong>al</strong>ancing. Slabs are very easy to im�<br />
plement and we show that they provide a good sense of<br />
load b<strong>al</strong>ance. In the case of slabs� the PARC <strong>al</strong>gorithm<br />
produces an ordered list of number� b1� b2� � � � � bn�<br />
which are the number of cubes in each slab. We need<br />
to �nd indices pairs �k1 1� k2 1�� �k1 2� k2 2� � � �� �k1 P � k2 P �� that<br />
minimizes the following expression�<br />
f�X� � max<br />
i6�j<br />
������ k2 i X<br />
m�k1 k<br />
bm �<br />
i<br />
2 j X<br />
m�k1 bm<br />
j<br />
������<br />
� 8i� j � P �2�<br />
The problem of computing the optim<strong>al</strong> �as de�ned<br />
by our heuristic choice� load b<strong>al</strong>ance partition indices<br />
can be solved naively as follows. We can compute <strong>al</strong>l<br />
the possible partitions of the integer n� where n is<br />
the number of slabs� into P numbers� where P is the<br />
number of processors. For example� if n � 5� and P �<br />
3� then 1 � 1 � 3 represents the solution that gives the<br />
�rst slab to the �rst processor� the second slab to the<br />
second processor and the remaining three slabs to the<br />
third processor. Enumerating <strong>al</strong>l possible partitioning<br />
to get the optim<strong>al</strong> one is a feasible solution but can<br />
be very computation<strong>al</strong>ly expensive for large n and P .<br />
At this time we have a Prolog implementation of a<br />
slightly revised <strong>al</strong>gorithm. Instead of c<strong>al</strong>culating the<br />
minmax Equation 2� we choose the permutation with<br />
the sm<strong>al</strong>lest square di�erence from the average.<br />
In order to show how well our approach works in<br />
practice� let us work out the example of using our<br />
load b<strong>al</strong>ancing example to divide the neghip dataset<br />
�the negative potenti<strong>al</strong> of a high�potenti<strong>al</strong> iron pro�<br />
tein of 66 3 resolution� for four processors� using a<br />
level 4 PARC decomposition with a 10 to 200 v<strong>al</strong>ue<br />
threshold. After running PARC we get the following<br />
16 numbers� one for each slab� out of the 1570 to�<br />
t<strong>al</strong> cubes�f12� 28� 61� 138� 149� 154� 139� 104� 106�<br />
139� 156� 151� 129� 62� 29� 13g. The naive ap�<br />
proach of other volume renderers has been to assign<br />
an equ<strong>al</strong> part of the volume to each processor� result�<br />
ing in the following partition� f12�28�61�138�239�<br />
149�154�139�104�546� 106�139�156�151�552�<br />
129�62�29�13�233g� where processors 2 and 3 have<br />
twice as much work than processor 1 and 4. Our ap�<br />
proach based on Equation 2 gives us f388� 397� 401�<br />
384g� clearly a much more b<strong>al</strong>anced solution.<br />
One can see that some con�gurations will yield bet�<br />
ter load b<strong>al</strong>ancing than others but this is a limitation
of the particular space subdivision one chooses to im�<br />
plement� the more complex the subdivision one <strong>al</strong>lows�<br />
the better load b<strong>al</strong>ancing but the harder it is to im�<br />
plement a suitable load b<strong>al</strong>ancing scheme and the as�<br />
sociated ray caster. Figure 1 plots the examples just<br />
described for the naive approach. Figure 2 shows how<br />
well our load b<strong>al</strong>ancing scheme works for a broader<br />
set of processor arrangements. By comparing both<br />
plots� one can see that our <strong>al</strong>gorithm generates much<br />
smoother curves� thus leading to better load b<strong>al</strong>anc�<br />
ing.<br />
Number of cubes<br />
600<br />
500<br />
400<br />
300<br />
200<br />
100<br />
out of 4 processors<br />
out of 8 processors<br />
0<br />
1 2 3 4 5 6 7 8<br />
Processor Number<br />
Figure 1� The graph shows the number of cubes per<br />
processor under naive load b<strong>al</strong>ancing.<br />
Number of cubes<br />
800<br />
700<br />
600<br />
500<br />
400<br />
300<br />
200<br />
out of 2 processors<br />
out of 3 processors<br />
out of 4 processors<br />
out of 8 processors<br />
out of 10 processors<br />
100<br />
1 2 3 4 5 6 7 8 9 10<br />
Processor Number<br />
Figure 2� Load b<strong>al</strong>ancing measures for our <strong>al</strong>gorithm.<br />
The graph shows the number of cubes the processor<br />
receives in our <strong>al</strong>gorithm.<br />
Figures 3 and 4 show the rendering times on the<br />
Intel Paragon� showing the correlation between the<br />
number of cubes a processor has and the amount of<br />
work it has to perform. By comparing these graphs<br />
Time to Render (msec)<br />
11000<br />
10500<br />
10000<br />
9500<br />
9000<br />
8500<br />
8000<br />
7500<br />
7000<br />
6500<br />
time to render with 4 processors<br />
6000<br />
1 2 3 4<br />
Node Number<br />
Figure 3� Naive load b<strong>al</strong>ancing on the Paragon. The<br />
graph shows the actu<strong>al</strong> rendering times for 4 proces�<br />
sors using the naive load b<strong>al</strong>ancing.<br />
Time to Render (msec)<br />
11000<br />
10500<br />
10000<br />
9500<br />
9000<br />
8500<br />
8000<br />
7500<br />
7000<br />
6500<br />
time to render with 4 processors<br />
6000<br />
1 2 3 4<br />
Node Number<br />
Figure 4� Our load b<strong>al</strong>ancing on the Paragon. The<br />
graph shows the actu<strong>al</strong> rendering times for 4 proces�<br />
sors using our load b<strong>al</strong>ancing.
and those in Figures 1 and 2� one can observe that our<br />
load b<strong>al</strong>ancing is e�ective and accurate� compared to<br />
the naive approach of equ<strong>al</strong>ly subdividing the dataset.<br />
If one was c<strong>al</strong>culating a single image� the tot<strong>al</strong> render�<br />
ing time of the image subparts would be the maximum<br />
of every processor plus the compositing time. As will<br />
be seen in the next section� we use a pipeline approach<br />
to optimize image generation performance� by amor�<br />
tizing compositing over time.<br />
4 Par<strong>al</strong>lel Ray Casting<br />
The version of our par<strong>al</strong>lel PARC�based volume ray<br />
caster described here uses the NX�2 library on the<br />
iPSC�860 and the Paragon� <strong>al</strong>though previous ver�<br />
sions <strong>al</strong>so ran under TCP�IP on workstations. We<br />
plan to release a production level version of this code<br />
on the iPSC�860� Paragon� PVM� network worksta�<br />
tions �TCP�IP� together with a distribution version<br />
of VolVis �1�.<br />
In order to avoid the processors having direct ac�<br />
cess to the dataset description �les� we chose to broad�<br />
cast once the necessary information for the rendering�<br />
like the dataset� processor assignments� transfer func�<br />
tions� and so on� and have <strong>al</strong>l the processors synchro�<br />
nize during this phase. Clearly� this may make our<br />
implementation unsuitable for someone that needs to<br />
generate only a single image� speci<strong>al</strong>ly because some<br />
machines �like the iPSC�860� have slow processor ac�<br />
cess to NFS mounted �les. The best scenario is one<br />
where the datasets are generated on the par<strong>al</strong>lel ma�<br />
chine� and not moved in and out at <strong>al</strong>l.<br />
After initi<strong>al</strong>ization� user commands representing<br />
di�erent viewing angles are sent to <strong>al</strong>l the processors<br />
by broadcast messages. Only information like trans�<br />
formation matrices and image sizes are sent at this<br />
time to minimize the communication cost per image.<br />
In order to avoid �ooding the par<strong>al</strong>lel machine with re�<br />
quests� a feedback synchronization technique is used.<br />
It basic<strong>al</strong>ly b<strong>al</strong>ances the requests rate with the ma�<br />
chine power available. The �ow of messages in the<br />
<strong>al</strong>gorithm is shown in Figure 5.<br />
The feedback synchronization techniques we use are<br />
based on work by Van Jacobson �7�� who designed a<br />
set of techniques to avoid congestion in TCP�IP net�<br />
works. We use a variation of his slow�start and round�<br />
trip�time estimation technique� where the host slowly<br />
sends requests and adaptively changes the rate of re�<br />
quests with the feedback it receives from the network.<br />
This is implemented by having the host keep the num�<br />
ber of outstanding image render requests� and setting<br />
a maximum on this number based on the number of<br />
processors and the amount of memory each has. At<br />
the start of the computation the host begins sending<br />
image requests to the processors� and for every image<br />
received it sends two requests to the processors until<br />
the maximum is achieved. Also the host keeps a run�<br />
ning average of the time taken to compute an image�<br />
Node 1 Node 2 Node 3<br />
Node 0<br />
User Workstation<br />
Node 4<br />
Figure 5� Overview of communication �ow in the <strong>al</strong>�<br />
gorithm. Arrow width represents the expected band�<br />
width necessary in each communication link.<br />
computed as Tf � �Ti � �1 � ��M� where Tf is the<br />
new estimate� Ti was the initi<strong>al</strong> estimate� M is the<br />
time measured in the last image computation� and �<br />
is an amortization constant. By changing � we can<br />
make the host more or less responsive to changes in<br />
rendering times. By using this procedure� when this<br />
time increases the host can adaptively decrease the<br />
rate of requests or increase the rate if the processors<br />
begin computing images faster.<br />
In the computing processors� a set of working re�<br />
quests are queued and serviced on demand. Basic<strong>al</strong>ly�<br />
there are two di�erent kinds of requests� rendering re�<br />
quests and compositing requests. The �rst type of re�<br />
quest is received directly from the host �where sup�<br />
posedly the user is waiting for images to show up��<br />
while the second comes from other slab neighboring<br />
processors. The computing processor keeps servicing<br />
both types of requests� by picking a message from each<br />
queue.<br />
While servicing a rendering request the processor<br />
<strong>al</strong>locates enough memory for it� renders it� and keeps<br />
the rendered image around until a compositing request<br />
for that particular image comes from its respective<br />
neighboring processor� then composites its part of the<br />
image and sends it over to the other neighboring pro�<br />
cessor� and continues working on a new rendering re�<br />
quest. The last processor on a chain� sends the whole<br />
image back to the user�s workstation. If a composit�<br />
ing request is received for an image that is not ren�<br />
dered yet we take the approach of computing it right<br />
away rather then delaying it as this could double our<br />
memory requirements for images. Once requests are<br />
serviced the memory is immediately freed.<br />
This approach is simple and e�ective. One of<br />
the clear advantages is that if we disregard the mes�<br />
sage and synchronization overhead for a moment� we<br />
see that we are maximizing the computation overlap<br />
among processors and getting a much better utiliza�
tion of the communication network as messages are<br />
being sent during the whole course of the image com�<br />
putation time instead of just at a certain point in time.<br />
One may claim that other� tree based� composit�<br />
ing schemes �9� may yield better results� however� the<br />
drawbacks of these schemes �low processor utilization<br />
during compositing and high network utilization dur�<br />
ing the peak of compositing� are major. Even though<br />
the tree approach would give a �n<strong>al</strong> image in O�log n�<br />
time steps� it still needs asymptotic<strong>al</strong>ly the same num�<br />
ber of messages. Therefore� it does not save any com�<br />
putation time� but it actu<strong>al</strong>ly wastes it when some of<br />
the processors become idle.<br />
The use of a pipelined compositing approach� where<br />
images are asynchronously generated and saved in<br />
bu�ers� requires the use of the feedback synchroniza�<br />
tion technique to avoid increasing the memory over�<br />
head without bounds. An interesting side e�ect of this<br />
technique is that our <strong>al</strong>gorithm automatic<strong>al</strong>ly adjusts<br />
itself to the rendering times of the particular machine<br />
and�or con�guration being used� like the number of<br />
processors and network performance.<br />
5 Performance An<strong>al</strong>ysis<br />
In this section we present a few performance �g�<br />
ures of our <strong>al</strong>gorithm and demonstrate that our ap�<br />
proach is sound and fast. The main points that we<br />
are discussing are� the e�ectiveness of PARC load b<strong>al</strong>�<br />
ancing� the communication overhead of the composit�<br />
ing scheme� <strong>al</strong>gorithm behavior under di�erent shad�<br />
ing models� and overhead as compared to a sequenti<strong>al</strong><br />
implementation. The e�ectiveness of our PARC load<br />
b<strong>al</strong>ancing was studied extensively in the last section�<br />
but to complete our choice of using PARC as our ray<br />
casting <strong>al</strong>gorithm� it is interesting to compare its ad�<br />
vantages to a more naive ray casting approach where<br />
no presence accelerations are adopted.<br />
A convention<strong>al</strong> ray caster where the rays are cast<br />
from start to end by c<strong>al</strong>culating intersections with the<br />
bounding box of the object is only slightly di�erent<br />
from a PARC ray caster. A PARC ray caster actu�<br />
<strong>al</strong>ly does more work than a naive one� as it needs to<br />
scan convert and to �nd t0 and t1 from the Z bu�er.<br />
The place that a PARC ray caster re<strong>al</strong>ly gains perfor�<br />
mance is in the fact that it better approximates the<br />
volume bounds. It should be clear that the higher<br />
the cost of the shading function per step� the more<br />
advantageous it is to c<strong>al</strong>culate these bounds well. In<br />
Figure 6� we can see how a PARC based ray caster per�<br />
forms against a naive ray caster under di�erent shad�<br />
ing functions. For our purposes we consider �light�<br />
shading a method that uses 5�10 instructions per sam�<br />
ple� �medium� a method that uses 50 instructions per<br />
sample� and �heavy� shading functions require about<br />
300 instructions per sample. Nieh and Levoy �12� have<br />
reported that trilinear interpolating a ray sample takes<br />
320 instructions. One can see from Figure 6 that not<br />
only times but <strong>al</strong>so the rate of increase of cost de�<br />
creases as one computes more samples.<br />
Rendering Times (sec)<br />
70<br />
60<br />
50<br />
40<br />
30<br />
20<br />
10<br />
naive<br />
parc<br />
0<br />
0 50 100 150 200 250 300<br />
Shading cost in # of instructions.<br />
Figure 6� PARC versus naive ray casting. Times were<br />
c<strong>al</strong>culated on a Sparc1000.<br />
The work performed during rendering each ray can<br />
be broken into Ir� the initi<strong>al</strong>ization work� and Wr� the<br />
work performed to c<strong>al</strong>culate and shade the samples<br />
<strong>al</strong>ong the ray. If perfect load b<strong>al</strong>ancing is achieved for<br />
every ray� each processor will perform W r<br />
P � Ir work<br />
per ray� that is� the initi<strong>al</strong>ization time is replicated<br />
for every ray. If Wr � Ir� then we can achieve very<br />
high sc<strong>al</strong>ability with the <strong>al</strong>gorithm� otherwise� as the<br />
number of processors increases the amount of work<br />
done on the initi<strong>al</strong>ization by <strong>al</strong>l the processors P Ir gets<br />
larger than Wr� thus limiting the performance. This<br />
makes optimization of the initi<strong>al</strong>ization time critic<strong>al</strong><br />
to the performance of the <strong>al</strong>gorithm.<br />
Initi<strong>al</strong>ization time is composed of sever<strong>al</strong> compo�<br />
nents� the most time consuming being the PARC pro�<br />
jection time and the transformation time. Right now<br />
it takes anywhere from 350 msec to 1600 msec to scan<br />
convert a level 4 PARC approximation on the ma�<br />
chines we used. We believe scan conversion itself can<br />
be done on the order of 20 times faster when the code<br />
is re�written in a more e�cient way� possibly in i860<br />
speci�c code. By broadcasting at the beginning only<br />
the necessary PARC polygons we can <strong>al</strong>so avoid in�<br />
creasing the number of polygons that need to be scan<br />
converted in each processor� and at the same time de�<br />
crease the memory requirement. Until these changes<br />
get incorporated in our code� our timings are going<br />
to be around the 1 second mark� even if the rest of<br />
the <strong>al</strong>gorithm takes no time at <strong>al</strong>l. However� over<strong>al</strong>l<br />
rendering times decreased substanti<strong>al</strong>ly after we op�<br />
timized our transformation time by factoring out <strong>al</strong>l<br />
common matrix multiplications and inlining the ones<br />
inside tight loops.<br />
All of the performance numbers presented in the<br />
rest of the section are for the Intel Paragon. The Intel
Paragon uses an Intel i860XP� a 50MHz supersc<strong>al</strong>ar<br />
microprocessor� and a 2D mesh interconnection net�<br />
work. Every processor of the machine actu<strong>al</strong>ly con�<br />
tains two i860XPs� but only one is used for computa�<br />
tion.<br />
Figures 7 and 8 show the average time to composite<br />
di�erent image sizes in three di�erent machine con�g�<br />
urations and for �ve di�erent screen sizes� ignoring<br />
completely the rendering time. We use a slow start<br />
technique for these measures �only when pipelining�.<br />
It is interesting to compare the �gures as one can see<br />
that our pipelining method can very well hide the ef�<br />
fects of the network and the work done to composite<br />
the image. For instance� every processor has to spend<br />
around 52 msec to composite a 300 2 image �only com�<br />
pute time�� if we consider 6 processors� it will take<br />
over 300 msec of CPU time to generate this image�<br />
still with our pipelining approach the user only sees<br />
65 msec as opposed to 330 msec a sequenti<strong>al</strong> compos�<br />
ite requires.<br />
Time to composite fin<strong>al</strong> image (msec)<br />
250<br />
200<br />
150<br />
100<br />
50<br />
0<br />
500x500 image<br />
400x400 image<br />
300x300 image<br />
200x200 image<br />
100x100 image<br />
10 15 20 25 30<br />
Number of processors<br />
Figure 7� Timing as seen by a user of the arriving of<br />
images using our pipelining approach.<br />
In Figure 9� we present some of our rendering times.<br />
These are rendering times for our �rst implementation<br />
and should not be regarded as what we are expecting<br />
for the production level code. One can see from the<br />
graph that our <strong>al</strong>gorithm sc<strong>al</strong>es well as the number<br />
of processors increases. Also our prediction that the<br />
higher the shading cost� the better the par<strong>al</strong>lel sc<strong>al</strong>a�<br />
bility can be seen from the graphs. We have �ltered<br />
out the PARC rendering time from the numbers. We<br />
expect to speed the PARC projection times up by at<br />
least 20 times with the new scan conversion routines�<br />
and with a new set of fast PARC projection techniques<br />
being designed we anticipate getting scan conversion<br />
to under 25 msec. At this time� the best rates attain�<br />
able by our <strong>al</strong>gorithm are about 1.5 frames�sec on a<br />
32 processor con�guration of our Intel Paragon for a<br />
256 2 image size. This is very competitive and even<br />
Time to composite fin<strong>al</strong> image (msec)<br />
6000<br />
5000<br />
4000<br />
3000<br />
2000<br />
1000<br />
0<br />
500x500 image<br />
400x400 image<br />
300x300 image<br />
200x200 image<br />
100x100 image<br />
10 15 20 25 30<br />
Number of processors<br />
Figure 8� Timing as seen by a user of the arriving of<br />
images using sequenti<strong>al</strong> composite.<br />
better than other rendering times published for ma�<br />
chines with this number of processors.<br />
Average Rendering Times (msec)<br />
80000<br />
70000<br />
60000<br />
50000<br />
40000<br />
30000<br />
20000<br />
10000<br />
heavy<br />
medium<br />
light<br />
0<br />
0 5 10 15 20 25 30 35<br />
Number of processors<br />
Figure 9� Rendering times on an Intel Paragon.<br />
6 Conclusions and Future Work<br />
We have shown that using PARC cubes for measur�<br />
ing useful work generates an intuitive way to load b<strong>al</strong>�<br />
ance volume ray casting on distributed memory par�<br />
<strong>al</strong>lel machines. This not only generates a method that<br />
is theoretic<strong>al</strong>ly sound but its preliminary implementa�<br />
tion seems to present a method that is both e�cient<br />
and sc<strong>al</strong>able.<br />
We have <strong>al</strong>so proposed a new method for com�<br />
positing that achieves better throughput than previ�<br />
ous methods and that can be used to generate better<br />
refresh rates. If one cannot accept the delay pipelin�<br />
ing imposes� one can <strong>al</strong>ways make judicious replication<br />
of volume data� for instance� one volume for every 16
processors to avoid long image delay times and still<br />
keep high refresh rates.<br />
We believe our method is simple� fast� uses co�<br />
herency and achieves high resource utilization on a<br />
given machine. As we use PARC� we achieve a<br />
high utilization of the compute processors and thus<br />
a very fast rendering time on every processor. Be�<br />
cause of our pipelined compositing scheme� we achieve<br />
a much higher network utilization than other methods.<br />
Fin<strong>al</strong>ly� our feedback synchronization image request<br />
technique guarantees a constant �ow of information<br />
that adapts itself to di�erent con�gurations of proces�<br />
sor performance and network utilization.<br />
Our current implementation can be greatly im�<br />
proved and optimized. One of our main concerns is to<br />
smoothly integrate <strong>al</strong>l the par<strong>al</strong>lel code into VolVis�<br />
so our users can take advantage not only of its in�<br />
tuitive and �exible user interface� but <strong>al</strong>so of greater<br />
speed provided by par<strong>al</strong>lel machines. Other plans in�<br />
clude the porting of our <strong>al</strong>gorithm to other architec�<br />
tures and a more detailed performance an<strong>al</strong>ysis of the<br />
whole <strong>al</strong>gorithm. We are <strong>al</strong>so planning on introduc�<br />
ing optimization that would <strong>al</strong>low the system to use<br />
data replication and sharing whenever <strong>al</strong>lowed. This<br />
way users with multiple processor shared�memory ma�<br />
chines� like a network of Sparc1000s would be able to<br />
get better performance.<br />
Another direction of future work is the extension of<br />
our load b<strong>al</strong>ancing technique to non�slabs partitions.<br />
The major problem is that computing optim<strong>al</strong> parti�<br />
tions in one dimention �the slab case� is <strong>al</strong>ready hard<br />
and computation<strong>al</strong>ly expensive. Another interesting<br />
question is whether this method can be extended to<br />
irregular shaped grids.<br />
Acknowledgments<br />
This research has been supported by the Nation<strong>al</strong> Sci�<br />
ence Foundation under grants CCR�9205047 and DCA<br />
9303181 and by the Department of Energy under the<br />
PICS grant. Speci<strong>al</strong> thanks to Rick Avila and Lisa<br />
Sobierajski for sever<strong>al</strong> enlightening discussions about<br />
PARC� volume rendering� and the implementation of<br />
VolVis. We are grateful to Juliana Freire for imple�<br />
menting the e�cient Prolog <strong>al</strong>gorithm described in<br />
Section 3 in the XSB system developed at Stony Brook<br />
by David Warren.<br />
References<br />
�1� R. Avila� T. He� L. Hong� A. Kaufman� H. P�s�<br />
ter� C. Silva� L. Sobierajski� and S. Wang. Volvis�<br />
A diversi�ed volume visu<strong>al</strong>ization system. In Vi�<br />
su<strong>al</strong>ization �94 Proceedings. IEEE CS Press� Oc�<br />
tober 1994.<br />
�2� R. Avila� L. Sobierajski� and A. Kaufman. To�<br />
wards a comprehensive volume visu<strong>al</strong>ization sys�<br />
tem. In Visu<strong>al</strong>ization �92 Proceedings� pages 13�<br />
20. IEEE CS Press� 1992.<br />
�3� E. Camahort and I. Chakravarty. Integrating vol�<br />
ume data an<strong>al</strong>ysis and rendering on distributed<br />
memory architectures. In 1993 Par<strong>al</strong>lel Render�<br />
ing Symposium Proceedings� pages 89�96. ACM<br />
Press� October 1993.<br />
�4� J. Danskin and P. Hanrahan. Fast <strong>al</strong>gorithms<br />
for volume ray tracing. In 1992 Workshop on<br />
Volume Visu<strong>al</strong>ization Proceedings� pages 91�98.<br />
ACM Press� October 1992.<br />
�5� J. Hennesy and D. Paterson. Computer Ar�<br />
chitecture� A Quantitative Approach. Morgan�<br />
Kaufmann� 1990.<br />
�6� W. Hsu. Segmented ray casting for data par<strong>al</strong>�<br />
lel volume rendering. In 1993 Par<strong>al</strong>lel Rendering<br />
Symposium Proceedings� pages 7�14. ACM Press�<br />
October 1993.<br />
�7� V. Jacobson. Congestion avoidance and control.<br />
Computer Communication Review� 18�4��314�29�<br />
1988.<br />
�8� M. Levoy. E�cient ray tracing of volume data.<br />
ACM Transations on Graphics� 9�3��245�261�<br />
1990.<br />
�9� K. Ma� J. Painter� C. Hansen� and M. Krogh. A<br />
data distributed par<strong>al</strong>lel <strong>al</strong>gorithm for ray�traced<br />
volume rendering. In 1993 Par<strong>al</strong>lel Render�<br />
ing Symposium Proceedings� pages 15�22. ACM<br />
Press� October 1993.<br />
�10� C. Montani� R. Perego� and R. Scopigno. Par<strong>al</strong>lel<br />
volume visu<strong>al</strong>ization on a hypercube architecture.<br />
In 1992 Workshop on Volume Visu<strong>al</strong>ization Pro�<br />
ceedings� pages 9�16. ACM Press� October 1992.<br />
�11� U. Neumann. Par<strong>al</strong>lel volume�rendering <strong>al</strong>go�<br />
rithm performance on mesh�connected multicom�<br />
puters. In 1993 Par<strong>al</strong>lel Rendering Symposium<br />
Proceedings� pages 97�104. ACM Press� October<br />
1993.<br />
�12� J. Nieh and M. Levoy. Volume rendering on sc<strong>al</strong>�<br />
able shared�memory mimd architectures. In 1992<br />
Workshop on Volume Visu<strong>al</strong>ization Proceedings�<br />
pages 17�24. ACM Press� October 1992.<br />
�13� P. Schroeder and J. S<strong>al</strong>em. Fast rotation of vol�<br />
ume data on data par<strong>al</strong>lel architectures. In Visu�<br />
<strong>al</strong>ization �91 Proceedings� pages 50�57. IEEE CS<br />
Press� 1991.
Spiders� A New User Interface for Rotation and Visu<strong>al</strong>ization of<br />
N�dimension<strong>al</strong> Point Sets<br />
Kirk L. Du�n<br />
Brigham Young University<br />
kirkl�python.cs.byu.edu<br />
Abstract<br />
We present a new method for creating n�<br />
dimension<strong>al</strong> rotation matrices from manipulating the<br />
projections of n�dimension<strong>al</strong> data coordinate axes<br />
onto a viewing plane. A user interface for n�<br />
dimension<strong>al</strong> rotation is implemented. The interface<br />
is shown to have no rotation<strong>al</strong> hysteresis.<br />
1 Introduction<br />
Many techniques for visu<strong>al</strong>izing n�dimension<strong>al</strong><br />
data sets separate the data into its component dimen�<br />
sions� <strong>al</strong>lowing the user to look at various coordinate<br />
combinations in a way that hopefully brings under�<br />
standing. These methods do well at avoiding the tra�<br />
dition<strong>al</strong> projection to two dimensions that hides data.<br />
However the data relationships are not immediately<br />
intuitive to our brains� which are used to transforming<br />
large amounts of information from three dimension<strong>al</strong><br />
projections down to two.<br />
On the other hand� projection of n�dimension<strong>al</strong><br />
information down to two may be slightly more intu�<br />
itive� but su�ers from the curse of data hiding due to<br />
projection. Moving the data in n�space� by predeter�<br />
mined motion or direct manipulation can help solve<br />
this problem.<br />
Asimov�s �grand tour��Asi85� made it possible<br />
to step through <strong>al</strong>l possible projections of an n�<br />
dimension<strong>al</strong> data set onto two dimensions in a use�<br />
ful manner. Hurley and Buja introduced a means of<br />
creating �guided tours� of the data by <strong>al</strong>lowing the<br />
user to create two disparate projection plane orienta�<br />
tions and interpolate between them�Hur88�. A good<br />
method of interpolation is to create a n�dimension<strong>al</strong><br />
rotation between the two orientations and sample<br />
<strong>al</strong>ong the rotation angle�BA86�. Subsequent data ro�<br />
tation tools� while similar� have retained this inter�<br />
polation approach for creating smooth motion in the<br />
projected data�YR91� SC90�.<br />
Here we present a new technique for creating<br />
n�dimension<strong>al</strong> rotations from information projected<br />
onto the viewing plane. From this technique we<br />
develop an interface for interactively rotating n�<br />
dimension<strong>al</strong> point sets. User control over the rotation<br />
sequence is �ne enough that no direct interpolation<br />
between projections is needed. Section 2 will review<br />
some of the important principles from matrix <strong>al</strong>gebra.<br />
Section 3 will develop the main <strong>al</strong>gorithm for creating<br />
n�dimension<strong>al</strong> rotation matrices from manipulationof<br />
data projections in the viewing plane. Section 4 will<br />
William A. Barrett<br />
Brigham Young University<br />
discuss some of the implementation aspects of the <strong>al</strong>�<br />
gorithm and present an implementation of an interac�<br />
tive n�dimension<strong>al</strong> rotation interface that is free from<br />
hysteresis e�ects. Section 5 will demonstrate the ma�<br />
nipulation of two 5�dimension<strong>al</strong> data sets using the<br />
interface� and section 6 will point out some possible<br />
areas of re�nement for the interface.<br />
2 Background<br />
2.1 Notation<br />
In this paper we will hold to an extension of the<br />
notation used in most of the computer graphics liter�<br />
ature� a n�dimension<strong>al</strong> point is represented by an�<br />
dimension<strong>al</strong> row vector and is post�multiplied by any<br />
transformation matrices. The vector composed of <strong>al</strong>l<br />
zeros except for a 1 in position i will be denoted ei.<br />
2.2 Coordinate Frames<br />
We represent a n�dimension<strong>al</strong> data set as a set<br />
of points in an n�dimension<strong>al</strong> Euclidian space R n .<br />
There are two ways of investigating the projection of<br />
a set of n�dimension<strong>al</strong> points onto a 2�dimension<strong>al</strong><br />
viewing plane. In the �rst� the coordinate system<br />
of the data and the coordinate system of the view�<br />
ing space coincide. A viewing plane is arbitrarily<br />
placed in the viewing space and the data is projected<br />
onto the plane. The second approach to projecting<br />
n�dimension<strong>al</strong> data onto a viewing plane moves the<br />
coordinate system of the data with respect to the co�<br />
ordinate system of the viewing space. In this latter<br />
approach the viewing plane remains �xed.<br />
Because a rotation leaves the coordinate system<br />
origin invariant� it is possible to focus on the rotation<br />
as a transformation of a vector from the origin to the<br />
data point. This <strong>al</strong>lows the creation of coordinate<br />
frames� a cluster of unit vectors that point down the<br />
positive princip<strong>al</strong> axes of the underlying coordinate<br />
system.<br />
Using coordinate frames gives us some powerful<br />
tools�Piq90�. If we start with an untransformed data<br />
coordinate frame� multiplying each axis vector ei in<br />
turn by the rotation matrix� it can be seen that the<br />
new position in view space of the axis is given by row<br />
iof the rotation matrix.<br />
A corollary to this fact is that if we specify the<br />
new position of the axis vectors such that they remain<br />
orthonorm<strong>al</strong> then the new positions de�ne the rows of
the rotation matrix 1 R.<br />
2.3 Orthogon<strong>al</strong> Projections in<br />
n Dimensions<br />
We de�ne the orthogon<strong>al</strong> projection of an n di�<br />
mension<strong>al</strong> point onto a subspace of lower dimension<br />
�the viewing subspace� as the point in the subspace<br />
closest to the data point. If b1 ���bm�m� nare basis<br />
vectors of the viewing subspace� then the projection<br />
xproj of a data point x is de�ned by<br />
xproj �<br />
mX<br />
i�1<br />
x � bi� �1�<br />
If the b are equiv<strong>al</strong>ent to the standard basis vec�<br />
tors ei then the projection of x onto bi is simply the<br />
i�th coordinate of x.<br />
3 Arbitrary Rotations in<br />
n Dimensions<br />
In three dimensions� rotations are commonly<br />
speci�ed in terms of an angle about an arbitrary axis.<br />
However� it is more correct to think of rotation as tak�<br />
ing place in a plane embedded in the space�Nol67�. In<br />
3�dimension<strong>al</strong> rotations� this plane is the plane per�<br />
pendicular to the axis of rotation. In more than three<br />
dimensions� the idea of rotation about an axis goes<br />
awry because there are an in�nite number of axes that<br />
are perpendicular to any given plane. But as long as<br />
a plane in the space is speci�ed <strong>al</strong>ong with a center of<br />
rotation in the plane� the rotation is uniquely de�ned.<br />
The simplest rotation to<br />
describe in n�dimension<strong>al</strong> space occurs in the plane<br />
formed by anytwo coordinate axes. The rotation ma�<br />
trix Rab��� for the rotation of axis xa in the direction<br />
of xb by the angle � is<br />
Rab��� �<br />
8<br />
�����<br />
�����<br />
rij<br />
�<br />
�<br />
�<br />
�<br />
�<br />
�<br />
��<br />
�<br />
�<br />
rii � 1 i 6� a� i 6� b<br />
raa � cos �<br />
rbb � cos �<br />
rab � � sin �<br />
rba � sin �<br />
rij � 0 elsewhere<br />
9<br />
�����<br />
�<br />
�����<br />
�2�<br />
That is� Rab��� is an identity matrix except for the<br />
entries at the intersection of rows a and b and columns<br />
a and b. Since there are � � n<br />
princip<strong>al</strong> axes planes� n�<br />
2<br />
dimension<strong>al</strong> rotations are built up as the composition<br />
of speci�ed rotations in each of the princip<strong>al</strong> planes.<br />
This composition is accomplished by multiplying the<br />
corresponding rotation matrices together.<br />
Our go<strong>al</strong> is to provide an intuitive means of spec�<br />
ifying an n�dimension<strong>al</strong> interface� hopefully in a con�<br />
cise graphic<strong>al</strong> manner. The key to our approach is<br />
in the observation that if an axis is not contained in<br />
the viewing plane nor is perpendicular to the viewing<br />
plane� then the axis and its projection onto the view�<br />
ing plane de�ne another plane in which rotation can<br />
1 Actu<strong>al</strong>ly� this is not quite true. The negation of a data<br />
axis is <strong>al</strong>so <strong>al</strong>lowed in this de�nition which corresponds to a<br />
re�ection of the data about that axis. However� the <strong>al</strong>gorithm<br />
presented here will not produce re�ections.<br />
occur. Moreover� by manipulating the projection of<br />
an axis� it is possible to rotate the axis in the rotation<br />
plane such that the axis remains consistent with its<br />
projection. Figure 1 illustrates this observation for<br />
n �3.<br />
Figure 1� A 3�dimension<strong>al</strong> coordinate frame before<br />
rotation �l� and after rotation �r�. The rotation plane<br />
is de�ned by the rightmost data axis in each diagram<br />
and its projection. The circle at the bottom of each<br />
diagram shows the projection of the data coordinate<br />
axes onto the viewing plane.<br />
3.1 Rotation in the Plane<br />
The problem here is to rotate the selected axis xi<br />
by an unknown angle � to its new position x0 i . All<br />
that is known are the magnitudes of the projections<br />
of the axis.<br />
Let xi be a unit vector representing the positive<br />
direction of the i�th axis of the data coordinate sys�<br />
tem embedded in the n�dimension<strong>al</strong> viewing coordi�<br />
nate system. The projection of xi onto the viewing<br />
plane is denoted xiproj . The position and projection<br />
of the axis after rotation are denoted x0 i and x0iproj<br />
respectively. See �gure 2.<br />
In the rotation plane� xi can be decomposed<br />
into two vectors� xiproj� and a component orthog�<br />
on<strong>al</strong> to the viewing plane� xi� such that xi� �<br />
xi � xiproj . These two vectors set up an orthogon<strong>al</strong><br />
coordinate system in the rotation plane. Now xi can<br />
be represented by the coordinates �miproj �mi��where � kxi�k.<br />
Since xi and x 0 i are unit vectors� given m0 iproj �<br />
miproj � kxiprojk and mi�<br />
the magnitude of the new projected component can<br />
be determined� namely m 0 i� �<br />
q<br />
0 2<br />
1 � m . Conse�<br />
iproj
x i<br />
x i ’<br />
x i ’<br />
proj<br />
x<br />
’<br />
i<br />
x i proj<br />
x i<br />
Figure 2� Rotation in the plane de�ned by xi and its<br />
projection on the viewing plane. The data coordinate<br />
axis vector xi is rotated to x 0 i.<br />
quently� the parameters for rotation in the plane are<br />
cos � � xi � x 0<br />
i � miproj m0 � mi�m0 iproj i�<br />
�3�<br />
sin � � kxi � x 0<br />
ik � miproj m0i�<br />
� mi�m0 � �4�<br />
iproj<br />
Thus any vector v in the plane can be rotated using<br />
the standard rotation equations<br />
v 0 �<br />
� ��<br />
v � xiproj v � xi� cos � sin �<br />
�<br />
kxiprojk kxi�k � sin � cos �<br />
More importantly�<br />
x 0<br />
i � m 0<br />
xi�<br />
i� kxi�k<br />
� m0<br />
xiproj<br />
iproj<br />
kxiprojk<br />
� �5�<br />
�6�<br />
To determine the n�dimension<strong>al</strong> rotation matrix<br />
R� <strong>al</strong>l that remains is to �nd the new positions of<br />
each axis vector. This is accomplished by decom�<br />
posing each data space coordinate axis vector into<br />
three components� a vector orthogon<strong>al</strong> to the rota�<br />
tion plane� and two vector components in the rotation<br />
plane. These last two vectors are the projection of the<br />
data axis vector onto xiproj and xi� respectively. The<br />
rotation is c<strong>al</strong>culated for the rotation plane compo�<br />
nents and the results added to the orthogon<strong>al</strong> vector<br />
component. This gives the rotated position of the axis<br />
vector.<br />
Let a and b be the coordinates of data axis xj<br />
projected onto the rotation plane� i.e.<br />
a � xjprojxiproj � xj � xiproj<br />
kxiprojk<br />
�7�<br />
b � xjprojxi� � xj � xi�<br />
� �8�<br />
kxi�k<br />
Let xjorth be the orthogon<strong>al</strong> componentofxjwith<br />
respect to the rotation plane. Then<br />
xjorth � xj � a xiproj xi�<br />
� b � �9�<br />
kxiprojk kxi�k<br />
After rotation� the new position of the data axis<br />
vector x0 j can be expressed<br />
in<br />
x 0<br />
j � xjorth ��acos � � b sin �� xiproj<br />
kxiprojk<br />
��a sin � � b cos �� xi�<br />
� �10�<br />
kxi�k<br />
Substituting �9� into �10� and simplifying results<br />
x 0<br />
j � xj ��a�cos � � 1� � b sin �� xiproj<br />
kxiprojk<br />
��b�cos � � 1� � a sin �� xi�<br />
� �11�<br />
kxi�k<br />
3.2 Algorithm<br />
The foregoing development gives us the following<br />
<strong>al</strong>gorithm for creating an n�dimension<strong>al</strong> rotation ma�<br />
trix.<br />
Input�<br />
R � the current rotation matrix. The rows<br />
of this matrix are the axis vectors of the<br />
data coordinate system. The elements<br />
of R are denoted rij.<br />
i � the index of the data coordinate axis<br />
m 0<br />
proj<br />
that determines the plane of rotation.<br />
� the desired magnitude of the<br />
projected component of the selected<br />
data axis.<br />
axis1� axis2 � the viewing space axes<br />
de�ning the viewing plane.<br />
Output�<br />
R 0 � the new rotation matrix describing<br />
the transformation from data<br />
coordinate space to viewing<br />
coordinate space.<br />
Variables�<br />
mproj � the current magnitude of the<br />
projected component ofthe<br />
selected data axis.<br />
m� � the current magnitude of the<br />
orthogon<strong>al</strong> component ofthe<br />
m 0<br />
�<br />
selected data axis.<br />
� the orthogon<strong>al</strong> component<br />
magnitude of the rotated data axis.<br />
cos� sin � the rotation parameters of the<br />
rotation.<br />
k1� k2� sum �intermediate v<strong>al</strong>ues<br />
Find magnitude of projected component of selected<br />
axis.
sum � 0<br />
for �1 � � � 2�<br />
sum � sum � r 2<br />
i axis�<br />
mproj � p sum<br />
Find component magnitude of selected axis<br />
perpendicular to viewing plane.<br />
sum � 0<br />
for �1 � � � n�<br />
if �� 6� axis1 and � 6� axis2�<br />
sum � sum � r 2<br />
i�<br />
m� � p sum<br />
m 0<br />
� �<br />
q<br />
0 2<br />
1 � mproj C<strong>al</strong>culate projection plane parameters.<br />
cos � mproj � m 0<br />
proj � m� � m 0<br />
�<br />
sin � mproj � m 0<br />
� � m� � m 0<br />
proj<br />
Rotate each data space axis.<br />
for �1 � j � n�<br />
sum � 0<br />
for �1 � � � 2�<br />
sum � sum � rj axis� � ri axis�<br />
a � sum�mproj<br />
sum � 0<br />
for �1 � � � n�<br />
if �� 6� axis1 and � 6� axis2�<br />
sum � sum � ri� � rj�<br />
b � sum�m�<br />
k1 � �a � �cos � 1� � b � sin��mproj<br />
k2 � �b � �cos � 1� � a � sin��m�<br />
for �1 � � � n�<br />
if �� � axis1 or � � axis2�<br />
r 0<br />
j� � rj� � k1 � ri�<br />
else<br />
r 0<br />
j� � rj� � k2 � ri�<br />
The simpli�ed formulation of the main inner loop<br />
from �11� is justi�ed by noting that if we limit the<br />
viewing plane to be one of the princip<strong>al</strong> planes in<br />
the viewing coordinate system� then xiproj has non�<br />
zero components only <strong>al</strong>ong the axes speci�ed by the<br />
viewing plane. Likewise� xi� will <strong>al</strong>ways have 0 coor�<br />
dinates in those two dimensions.<br />
4 Implementation<br />
4.1 Interface<br />
We have used two approaches in applying the<br />
above formulas to the development of user interfaces<br />
for n�dimension<strong>al</strong> rotation. Each approach <strong>al</strong>lows the<br />
user to select a data coordinate axis and drag the<br />
projected end of the axis in the viewing plane. From<br />
the path traversed in the viewing plane� a sequence of<br />
n�dimension<strong>al</strong> rotation matrices is created. The dif�<br />
ference in the two approaches is in how the change in<br />
position of a selected projected axis is turned into a<br />
rotation matrix.<br />
In the �rst approach R is composed of two rota�<br />
tions� the �rst occurs in the plane formed by axis xi<br />
and its projection xiproj. The amount of rotation is<br />
determined by the change in length of the projected<br />
axis. The second rotation occurs in the viewing plane<br />
and accounts for the change in projected orientation<br />
of xiproj. Figure 3 illustrates for n �3.<br />
However� rotation in the projection plane pro�<br />
vides no new visu<strong>al</strong> information. In practice� the set<br />
of projected axes tends to spin wildly in the viewing<br />
plane. This in turn makes it di�cult to adjust the<br />
relative positions of the projected axes.<br />
The second approach to the creation of n�<br />
dimension<strong>al</strong> rotation matrices <strong>al</strong>so decomposes R into<br />
two rotations. The �rst rotation rotates the selected<br />
axis xi in the plane formed by itself and its origin<strong>al</strong><br />
projection so that xi is perpendicular to the viewing<br />
plane. The second rotation rotates xi from its posi�<br />
tion perpendicular to the viewing plane to a position<br />
consistent with the projected position. �Figure 4�.<br />
4.2 Lack of Hysteresis<br />
This latter approach to rotation possesses a nice<br />
theoretic<strong>al</strong> qu<strong>al</strong>ity. Let the rotation of xi from its<br />
position on the viewing plane� xiproj ��uj�vj�toits<br />
new position x 0<br />
iproj ��uj�1�vj�1� be denoted jRj�1<br />
for any j. But this is the composition of two other<br />
matrices� jRj�1 � jPQj�1 where jP is the rotation<br />
of xi to a position perpendicular to the viewing plane<br />
and Qj�1 is the rotation of xi from the perpendicular<br />
space to its new position corresponding to x 0 iproj .<br />
Now if a user selects an axis xi at position �u0�v0�<br />
on the viewing plane and drags the projected axis<br />
around the viewing plane� then the rotation matrix<br />
of this transformation is the composition of the rota�<br />
tion matrices of every point on the path of the dragged<br />
projected axis in the viewing plane� i.e.<br />
0Rm � 0PQ1 1PQ2 ���jPQj�1 ���m�1PQm �12�<br />
for the path in the viewing plane of �u0�v0�� ����<br />
�um�vm�.<br />
But rotating an axis perpendicular to the viewing<br />
plane and then rotating it back to the same position<br />
is an identity operation. This means that Qj jP�I.<br />
Consequently� �12� collapses to<br />
0Rm � 0PQm� �13�<br />
Thus dragging a projected axis with this method<br />
is a conservative operation. The rotation matrix re�<br />
sulting from dragging xiproj ��u0�v0� to its new po�<br />
sition x0 iproj ��um�vm� is the same� regardless of the<br />
path taken from �u0�v0�to�um�vm�2 .<br />
This lack ofhysteresis is a highly desirable prop�<br />
erty for interactive rotation<strong>al</strong> interfaces for at least<br />
two reasons� First� the user can follow anypath in<br />
the viewing plane when dragging a projected axis and<br />
be guaranteed of receiving the same rotation matrix�<br />
given the same start and end points of the drag. If<br />
2 As long as the path does not pass through the projection<br />
of the origin of the data coordinate viewing system onto the<br />
viewing plane.
Figure 3� Repositioning a projected coordinate axis by 1� rotating for new projected coordinate axis length� and<br />
2� rotating in the viewing plane for new projected coordinate axis orientation.<br />
Figure 4� Repositioning a projected coordinate axis by 1� rotating axis perpendicular to viewing plane� and 2�<br />
rotating out of perpendicular space to new projected axis position.<br />
the desired projected target is overshot or missed� the<br />
axis can be dragged back to the desired position. Sec�<br />
ondly� the interface need not process every point in<br />
the path of the dragged projected axis in order to<br />
maintain consistent interface operation. If the data is<br />
being replotted as the axis is dragged� then a rotation<br />
matrix need be created only from the current viewing<br />
plane position. Any other positions traversed since<br />
the last plotting step can be discarded� giving a great<br />
computation<strong>al</strong> savings if the data set is large.<br />
The unit quaternions <strong>al</strong>so share this lack ofhys�<br />
teresis� which has generated signi�cant interest in<br />
their use in 3�dimension<strong>al</strong> rotation interfaces�Sho92�.<br />
Now this property can be extended to n�dimension<strong>al</strong><br />
rotations as well.<br />
4.3 Orthonorm<strong>al</strong>ity<br />
As presented� this <strong>al</strong>gorithm is highly dependent<br />
on the fact that the axis vectors are orthonorm<strong>al</strong>. In<br />
practice� as numeric<strong>al</strong> error creeps in� the rotation<br />
matrix R ceases to be orthogon<strong>al</strong>. This is a standard<br />
problem in 3�d interfaces where the rotation matrix<br />
is occasion<strong>al</strong>ly re�orthogon<strong>al</strong>ized. Our experience has<br />
been that renorm<strong>al</strong>izing the rows of the rotation ma�<br />
trix is su�cient to maintain orthogon<strong>al</strong>ity. Without<br />
renorm<strong>al</strong>ization� numeric<strong>al</strong> error quickly dominates�<br />
making R useless.<br />
Actu<strong>al</strong>ly� nothing in the derivation of the <strong>al</strong>go�<br />
rithm depends on the mutu<strong>al</strong> orthogon<strong>al</strong>ity of the<br />
coordinate axis vectors. Therefore� the <strong>al</strong>gorithm<br />
given above will properly transform any set of vec�<br />
tors through a rotation speci�ed by an�dimension<strong>al</strong><br />
vector and its projection. But in such a case� the<br />
resulting vectors can not be used to form the new ro�<br />
tation matrix.<br />
4.4 Boundary Conditions<br />
Because the <strong>al</strong>gorithm decomposes every n�space<br />
vector into two rotation plane components� it is nec�<br />
essary that the axis xi that determines the rotation<br />
plane be distinct from its projection onto the viewing<br />
plane. Consequently� speci<strong>al</strong> measures must be taken<br />
when xi lies in the viewing plane or is perpendicular<br />
to the viewing plane. In practice� due to discretization<br />
error in the interface� conditions when xi is close to<br />
the viewing plane or close to the perpendicular must<br />
<strong>al</strong>so be considered.<br />
In our implementation� when an axis projection<br />
is dragged within a sm<strong>al</strong>l distance of the center of the<br />
viewing plane� the axis snaps perpendicular to the<br />
viewing plane and stays there. When a user wishes to<br />
drag one axis �of possibly sever<strong>al</strong>� out of the space per�<br />
pendicular to the viewing plane� she clicks the mouse<br />
on the center of the projected coordinate frame. A<br />
text menu o�ers a selection of the available perpen�<br />
dicular axes. After a selection is made� a point on the<br />
viewing plane is selected� and the axis is rotated out<br />
to this position. From there the axis can be dragged<br />
like any others visible on the viewing plane.<br />
5 Application<br />
In our work in the Brigham Young University<br />
Computer Vision Laboratory we have implemented<br />
this interface to help visu<strong>al</strong>ize images and color<br />
gamuts as 5�dimension<strong>al</strong> point sets. Each pixel in a<br />
full color image is given �ve spati<strong>al</strong> coordinates� x� y�<br />
red� green� and blue. Each of these data points is <strong>al</strong>so<br />
given a color corresponding to its red� green� and blue
components. This is done for convenience only and is<br />
not necessary for the functioning of the interface. The<br />
mean of the data set is subtracted from <strong>al</strong>l points so<br />
that rotation will occur about the center of the data<br />
set.<br />
The orthogon<strong>al</strong> projection of the data set is kept<br />
separate from the rotation<strong>al</strong> interface� which has ac�<br />
quired the appellation of a�spider.� This is due to<br />
the appearance of many moving �legs� on the viewing<br />
plane when many coordinate axes are simultaneously<br />
visible.<br />
Our combining the projected axes into one �gure<br />
is in direct contrast to Hurley�s data viewer�HB90��<br />
which assigns each axis its own interface item. Our<br />
experience seems to indicate that combining the axes<br />
into a single �gure is acceptable when using relatively<br />
low dimension data sets. However� we have imple�<br />
mented the spiders with the facility to display an ar�<br />
bitrary subset of the full data axis complement. We<br />
have <strong>al</strong>so used the powerful concept of linking demon�<br />
strated by Buja� McDon<strong>al</strong>d� et <strong>al</strong>�BMMS91� to link<br />
sever<strong>al</strong> spiders simultaneously to a single data set.<br />
Figure 5 shows an image undergoing 5D rotation.<br />
At �rst only the x and y components are visible. Then<br />
the red axis is dragged out of the space perpendicular<br />
to the viewing plane. Because of the correspondence<br />
between the color attributes and the spati<strong>al</strong> coordi�<br />
nates� <strong>al</strong>l of the points with high red v<strong>al</strong>ues appear to<br />
move in the direction of the projected red axis. Note<br />
that as the red axis is brought out slightly� a pseudo<br />
3D e�ect occurs. Next the green axis is dragged out<br />
and the x axis pushed back into the perpendicular<br />
space. Fin<strong>al</strong>ly� the blue axis is brought out� the y<br />
axis pushed in� and the three remaining color axes ar�<br />
ranged evenly in the projection plane. The points in<br />
the data set re<strong>al</strong>ign themselves into a pattern remi�<br />
niscent of a color wheel.<br />
6 Conclusion<br />
We have demonstrated a new method c<strong>al</strong>led �spi�<br />
ders� for interactively rotating n�dimension<strong>al</strong> point<br />
sets. The technique provides n�dimension<strong>al</strong> rotation<br />
matrices solely from information about the current<br />
data coordinate system and its projection onto the<br />
viewing plane. The interface has no rotation<strong>al</strong> hys�<br />
teresis� similar to the more robust 3D interfaces used<br />
today.<br />
The spiders are not without problems. They do<br />
su�er from the �curse of projection� and data hiding<br />
with dense sets associated with <strong>al</strong>l projective tech�<br />
niques. And like other visu<strong>al</strong>ization methods� as more<br />
dimensions are added to the system� the increment<strong>al</strong><br />
return in understanding decreases. Nevertheless� we<br />
feel that the interactive nature of this technique pro�<br />
vides a powerful tool to help understand the universe<br />
of data around us.<br />
References<br />
�Asi85� Daniel Asimov. The grand tour� A tool for<br />
viewing multidimension<strong>al</strong> data. SIAM Jour�<br />
n<strong>al</strong> on Scienti�c and Statistic<strong>al</strong> Computing�<br />
6�1��128�143� January 1985.<br />
�BA86� Andreas Buja and Daniel Asimov. Grand tour<br />
methods� An outline. In Proceedings of the<br />
18th Symposium on the Interface� pages 63�<br />
67. American Statistic<strong>al</strong> Association� 1986.<br />
�BMMS91� Andreas Buja� John Alan McDon<strong>al</strong>d� John<br />
Mich<strong>al</strong>ak� and Werner Stuetzle. Interactive<br />
data visu<strong>al</strong>ization using focusing and linking.<br />
In IEEE Conference on Visu<strong>al</strong>ization� pages<br />
156�163� 1991.<br />
�HB90� Catherine Hurley and Andreas Buja. An<strong>al</strong>yz�<br />
ing high�dimension<strong>al</strong> data with motion graph�<br />
ics. SIAM Journ<strong>al</strong> on Scienti�c and Statistic<strong>al</strong><br />
Computing� 11�6��1193�1211� November 1990.<br />
�Hur88� Catherine Hurley. A demonstration of the<br />
data viewer. In Proceedings of the 20th Sympo�<br />
sium on the Interface� pages 108�113. Ameri�<br />
can Statistic<strong>al</strong> Association� 1988.<br />
�Nol67� A. Michael Noll. A computer technique for<br />
displaying n�dimension<strong>al</strong> hyperobjects. Com�<br />
munications of the ACM� 10�8��469�473� Au�<br />
gust 1967.<br />
�Piq90� Michael E. Pique. Rotation tools. In An�<br />
drew S. Glassner� editor� Graphics Gems�<br />
pages 465�469. Academic Press� 1990.<br />
�SC90� Deborah F. Swayne and Dianne Cook. Xgobi�<br />
A dynamic graphics program implemented in<br />
x with a link to s. In Proceedings of the 22nd<br />
Symposium on the Interface� pages 544�547.<br />
American Statistic<strong>al</strong> Association� 1990.<br />
�Sho92� Ken Shoemake. Arcb<strong>al</strong>l� A user interface for<br />
specifying three�dimension<strong>al</strong> orientation using<br />
a mouse. In Proceedings of Graphics Interface<br />
�92. Morgan Kaufmann� 1992.<br />
�YR91� Forrest W. Young and Penny Rheingans. Vi�<br />
su<strong>al</strong>izing structure in high�dimension<strong>al</strong> multi�<br />
variate data. IBM Journ<strong>al</strong> of Research and<br />
Development� 35�1��97�107� 1991.
Abstract<br />
Pseudocoloring is a frequently used technique in<br />
scientific visu<strong>al</strong>ization for mapping a color to a data<br />
v<strong>al</strong>ue. When using pseudocolor and animation to<br />
visu<strong>al</strong>ize data that contain missing regions displayed as<br />
black or transparent, the missing regions popping in<br />
and out can distract the viewer from the more relevant<br />
information. Filling these gaps with interpolated data<br />
could lead to a misinterpretation of the data. This<br />
paper presents a method for combining pseudo−<br />
coloring and graysc<strong>al</strong>e in the same colormap. V<strong>al</strong>id<br />
data are mapped to colors in the colormap. The<br />
luminance v<strong>al</strong>ues of the colors bounding areas of<br />
missing data are used in interpolating over these<br />
regions. The missing data are mapped to the graysc<strong>al</strong>e<br />
portion of the colormap. This approach has the<br />
advantages of eliminating distracting gaps caused by<br />
missing data and distinguishing between those areas<br />
that represent v<strong>al</strong>id data and those areas that do not.<br />
This approach was inspired by a technique used in the<br />
restoration of paintings.<br />
1 Introduction<br />
1.1 Art Restoration<br />
Restorer: A Visu<strong>al</strong>ization Technique for Handling Missing Data<br />
In art the term restoration refers to "... the<br />
replacement of missing parts and the filling in of<br />
missing areas in a damaged work of art. [1] In his<br />
book The Materi<strong>al</strong>s of the Artist & their Use in<br />
Painting, Max Doerner states: "In the case of v<strong>al</strong>uable<br />
works it is best not to attempt corrections, additions, or<br />
overpainting, but rather to maintain the faulty areas in a<br />
neutr<strong>al</strong> color tone which harmonizes with the gener<strong>al</strong><br />
tone of the painting. The restorer in such cases should<br />
not glory in his skill in making his additions appear to<br />
be parts of the origin<strong>al</strong>." [2] Restorers who believe that<br />
Ray Twiddy, John Cav<strong>al</strong>lo, and Shahram M. Shiri<br />
Hughes STX Corporation, NASA Goddard Space Flight Center,<br />
Scientific Visu<strong>al</strong>ization Studio, Code 932, Greenbelt, MD 20771<br />
only the origin<strong>al</strong> paint is permissible, use neutr<strong>al</strong> tones to<br />
retouch the damaged areas to minimize interference with<br />
the aesthetic appreciation of the painting. This approach<br />
is not without controversy and there are those in the art<br />
world who favor an approach to retouching that deceives<br />
the viewer completely. [3]<br />
1.2 Data Restoration<br />
A similar controversy exists in the re<strong>al</strong>m of scientific<br />
visu<strong>al</strong>ization. There are those who believe that missing<br />
data should be indicated either by mapping to a color<br />
outside the v<strong>al</strong>id data domain or by making those areas<br />
completely transparent. Others believe in applying some<br />
method of interpolation that smoothes over the areas of<br />
missing data. Although the latter approach has the<br />
advantage of eliminating distracting gaps caused by<br />
missing data, it does not distinguish between v<strong>al</strong>id data<br />
and interpolated data. The approach we present uses<br />
luminance interpolation to visu<strong>al</strong>ly blend the missing data<br />
with the v<strong>al</strong>id data while at the same time distinguishing<br />
missing data areas by their lack of color.<br />
1.3 Visu<strong>al</strong> Perception<br />
In the process of seeing, we are dependent on<br />
observing the interactive juxtaposition of gradations of<br />
tone from brightness (or lightness) to darkness. The<br />
presence or absence of color does not affect ton<strong>al</strong> v<strong>al</strong>ues.<br />
Ton<strong>al</strong> v<strong>al</strong>ues are constant and are infinitely more<br />
important than color in seeing. The contrast of tone<br />
enables us to see patterns that we can simplify into objects<br />
with shape, dimension, and texture. [4]<br />
The term brightness is used to refer to the quantity of<br />
light in the psychologic<strong>al</strong> sense of perceived intensity.<br />
The terms luminance and intensity refer to the amount of<br />
light energy reflected or emitted from a surface. The<br />
perception of brightness depends upon the sensitivity of<br />
the eye. The perception of changes in intensity is
nonlinear. For example, if you cycle through the settings<br />
on a three−way 50−100−150−watt light bulb, the step<br />
between 50 to 100 seems much greater than the step<br />
between 100 to 150. [5]<br />
Our perception of brightness of objects often depends<br />
upon the luminance of adjacent objects. This perceptu<strong>al</strong><br />
effect is c<strong>al</strong>led simultaneous brightness contrast. This<br />
effect can be seen when gray squares of the same<br />
luminance are displayed on gray backgrounds that are<br />
lighter and darker (see Figure 1). On the lighter<br />
background the gray appears darker and on the darker<br />
background it appears lighter. Simultaneous color<br />
contrast is the effect in the visu<strong>al</strong> system when the<br />
perception of a color in an area is influenced by the<br />
colors of the adjacent areas. For example, a gray square<br />
surrounded by red will be perceived as tinted green. [6]<br />
Figure 1: When two gray squares of equ<strong>al</strong> luminance<br />
are placed on a background of varying luminance, the<br />
square on the lighter background appears darker and the<br />
square on the darker background appears lighter.<br />
The Restorer technique reduces the effect of<br />
simultaneous brightness contrast by matching the<br />
luminance of the grays used to fill a missing data region<br />
to the luminance of the adjacent colors (see Plate 1).<br />
The effect of simultaneous color contrast is largely<br />
dependent upon the saturation of the colors selected for<br />
the p<strong>al</strong>ette. Studies by C. Ware [7] show a colormap<br />
based on the physic<strong>al</strong> spectrum (red+blue, blue,<br />
blue+green, green, green+red, red) offers minim<strong>al</strong><br />
contrast distortion.<br />
1.4 Selecting a Color P<strong>al</strong>ette<br />
There are many sources of information on the use of<br />
color for aesthetic purposes [8, 9, 10] and for coding [11,<br />
12, 13]. Although selecting a color p<strong>al</strong>ette based upon<br />
constant lightness or v<strong>al</strong>ue is one of the preferred<br />
methods for providing color harmony, it is not<br />
recommended in this case. A p<strong>al</strong>ette based upon light<br />
and dark contrasts takes advantage of the fact that the<br />
eye is more sensitive to spati<strong>al</strong> variation in intensity than<br />
spati<strong>al</strong> variation in chromaticity. A p<strong>al</strong>ette based upon<br />
the physic<strong>al</strong> spectrum with variation in lightness<br />
provides both aesthetic harmony and extends the range<br />
for coding. Our technique was chosen to compensate for<br />
situations where colors vary greatly in lightness or v<strong>al</strong>ue.<br />
It is based upon matching each color in the p<strong>al</strong>ette to a<br />
gray of equ<strong>al</strong> luminance.<br />
2 The Restorer Technique<br />
The Restorer technique fills in missing data regions<br />
so that the images can either be used in an animation<br />
without distracting gaps, or studied individu<strong>al</strong>ly with the<br />
missing data regions easily distinguishable. Hence,<br />
Restorer was designed to satisfy three main<br />
considerations in filling missing data areas: to match the<br />
luminance of the adjacent colors, to provide stability for<br />
consistency, and to provide a unique fill solution.<br />
By matching the luminance at the boundary, the fill<br />
will be least intrusive in viewing data sets using a p<strong>al</strong>ette<br />
with large variations in luminance. The luminance<br />
associated with a color is dependent on the display<br />
device. In the cases treated so far, we are de<strong>al</strong>ing with<br />
the Nation<strong>al</strong> Television System Committee (NTSC)<br />
standard, as discussed in Foley, et <strong>al</strong> [14]. The<br />
luminance (Y) for NTSC is c<strong>al</strong>culated from the red (R),<br />
green (G), and blue (B) components of the color by:<br />
Y = 0.30 R + 0.59 G + 0.11 B.<br />
Since the filled area should not distract the viewer in<br />
an animation, it should be fairly consistent from one<br />
frame to the next while still following the shape of the<br />
data. In a stable fill <strong>al</strong>gorithm, sm<strong>al</strong>l changes in the<br />
luminance in the vicinity of the missing data will cause<br />
only sm<strong>al</strong>l changes in the fill. Uniqueness implies that<br />
there should be only one fill that would result from the<br />
<strong>al</strong>gorithm.<br />
In each of the fill <strong>al</strong>gorithms that will be discussed,<br />
the input consists of a two−dimension<strong>al</strong> array containing<br />
the v<strong>al</strong>id data, a two−dimension<strong>al</strong> array marking the
missing data, and a colormap. In some implementations,<br />
this can be a single pseudocolored image with the missing<br />
data marked by a unique color. The <strong>al</strong>gorithms will be<br />
applied only to the regions of the image where the data is<br />
missing and will leave the v<strong>al</strong>id regions undisturbed. In<br />
each case a neutr<strong>al</strong> gray is added into the image, with the<br />
luminance of the gray determined by the <strong>al</strong>gorithm.<br />
2.1 Laplacian Fill<br />
In the Laplacian Fill Algorithm, the luminance, Y, in<br />
the interior of the missing data regions, is a solution of<br />
Laplace’s equation,<br />
2 Y(x,y) = 0,<br />
and it matches the luminance of the adjacent v<strong>al</strong>id data.<br />
The gener<strong>al</strong> property of Laplace’s equation is that it will<br />
not have a maximum or minimum in the region. It will<br />
<strong>al</strong>so tend to average the luminance of the interior, giving<br />
more weight to the near edges. It has the advantage that<br />
some structures are continued across the missing areas.<br />
This solution will satisfy <strong>al</strong>l of the three conditions stated<br />
earlier. [15]<br />
The Laplacian Fill Algorithm was implemented using<br />
the Gauss−Seidel <strong>al</strong>gorithm [16] for computing the<br />
luminance. The method converged rapidly because the<br />
luminance was represented by a byte array and, gener<strong>al</strong>ly,<br />
the missing areas were sm<strong>al</strong>l.<br />
2.2 Rank Fill<br />
The Rank Fill Algorithm applies multiple rank filters<br />
to the missing data. The rank filter is a convolution<br />
process by which the v<strong>al</strong>ue of a function at a point is<br />
replaced with the maximum v<strong>al</strong>ue found anywhere within<br />
the sm<strong>al</strong>l defined region or kernel. This filter will not<br />
affect a function within a region where the function is<br />
uniform or slowly varying. [17]<br />
In order to implement the Rank Fill Algorithm, a<br />
network of modules was generated using IRIS Explorer<br />
on a Silicon Graphics Workstation. The function<strong>al</strong>ity of<br />
the network as shown in Figure 2 is separated into three<br />
categories: Data Input Modules, Filtering Modules, and<br />
Overlay (Filling) Modules.<br />
The Data Input Modules read the physic<strong>al</strong> data and<br />
convert them into Explorer data format. For<br />
three−dimension<strong>al</strong> data, the OrthoSlice Module is used to<br />
extract two−dimension<strong>al</strong> slices. A colormap is applied to<br />
the data and a pseudocolor image is generated.<br />
The Filtering Modules generate a graysc<strong>al</strong>e image of<br />
the pseudocolor image and apply two rank filters with<br />
rank levels of 8 and 6, respectively. The result is then<br />
passed through a median filter. The rank filters extend the<br />
luminance of the data in the vicinity of the edges into the<br />
missing areas, and the median filter smoothes the<br />
luminance in the interior regions. In effect, a unique<br />
luminance is generated for the image that covers the<br />
missing areas consistent with the luminance of the data<br />
bounding these regions.<br />
The Overlay Modules use the missing data array as a<br />
mask to insert the filtered luminance into the missing data<br />
regions of the pseudocolor image from the Data Input<br />
Modules.<br />
Data Input<br />
Modules<br />
Graysc<strong>al</strong>e Data<br />
Rank Filter:<br />
Level 8<br />
Rank Filter:<br />
Level 6<br />
Median Filter<br />
Filtering Modules<br />
Input Data<br />
Figure 2: A block diagram of data flow using rank filters<br />
and a median filter applied to the missing regions.<br />
Restored Data combines the graysc<strong>al</strong>e luminance<br />
overlayed on the missing regions of the pseudocolored<br />
data.<br />
2.3 Modified Rank Fill<br />
Generate<br />
Colormap<br />
Pseudocolor<br />
Data<br />
Create A Mask<br />
from<br />
the Missing Data<br />
Apply the Mask<br />
to Filtered Data<br />
Overlay Filter<br />
Result with<br />
Pseudocolor Data<br />
Overlay<br />
Modules<br />
Display<br />
Restored Data<br />
The Modified Rank Fill is a combination of the Rank Fill<br />
and the Laplacian Fill. In some cases, the missing data<br />
regions are too large for the Rank Fill Algorithm to
completely fill. In these cases, the output from the Rank<br />
Fill Algorithm is used as input to the Laplacian Fill<br />
Algorithm in order to fill the remaining areas of the<br />
missing data regions.<br />
3 Results<br />
The technique discussed in this paper has been applied<br />
to sever<strong>al</strong> test cases and to atmospheric data sets that<br />
contain missing data. In Plate 2a a test chart of saturated<br />
squares of red, green, blue, and yellow provides a<br />
background for a black linear pattern representing missing<br />
data. Plate 2b shows the result of the Restoration<br />
technique, using the Laplacian Fill. In order to ev<strong>al</strong>uate<br />
the results shown in Plate 2b, the color image was<br />
converted to a graysc<strong>al</strong>e image and is shown in Plate 2c.<br />
Restorer was completely successful in areas where black<br />
was surrounded by a single hue. In those areas where<br />
black overlapped two or four hues of contrasting<br />
luminance, the technique was less successful and we see a<br />
blurring of the gray v<strong>al</strong>ues as it attempts to interpret the<br />
contour of the underlying colored squares.<br />
The second test illustrates the ability of Restorer to<br />
reduce the distractions caused by missing data when<br />
dynamic<strong>al</strong>ly slicing through a three−dimension<strong>al</strong> data set.<br />
Plate 3 shows images from an animation sequence in<br />
which three geometric shapes (a triangle, a square, and a<br />
circle) were placed at fixed positions to indicate missing<br />
data in a data set which contained no missing data. As the<br />
cutting plane moves though the data in the first animation<br />
sequence, the black shapes appear to float in front of the<br />
data while the shapes, restored by the Laplacian Fill, blend<br />
with the background. In the next animation sequence,<br />
Restorer eliminates the distractions caused when the black<br />
shapes appear randomly, popping in and out of the scene..<br />
Restorer was next applied to glob<strong>al</strong> column ozone data<br />
collected by the Tot<strong>al</strong> Ozone Mapping Spectrometer<br />
(TOMS) on Nimbus−7 for the period January 1, 1992,<br />
through April 30, 1993. Plate 4 illustrates the three basic<br />
steps in the Restoration process to fill the missing areas.<br />
The origin<strong>al</strong> data is shown in Plate 4a. Plate 4b shows the<br />
result of using the rank and median filters that correctly<br />
fill for most cases. In this instance the area was too large<br />
for the rank and median filters, so it was completed using<br />
the Laplacian Fill (see Plate 4c).<br />
4 Conclusions<br />
In this paper we have presented a method for filling<br />
regions of missing data by using the luminance of the<br />
colors representing v<strong>al</strong>id data in the neighborhood of the<br />
missing data. The method has the advantages of visu<strong>al</strong>ly<br />
blending the restored areas with the origin<strong>al</strong> data while<br />
remaining distinguishable upon closer inspection. This<br />
approach successfully eliminates distracting gaps when<br />
viewing images in an animation.<br />
The Laplacian fill was found to be adequate for filling<br />
areas where the luminance varies monotonic<strong>al</strong>ly across the<br />
missing regions. For example, the fills shown in the<br />
geometric shapes in Plate 3 reduce the distractions while<br />
still marking the missing data regions. In cases similar to<br />
the one illustrated in Plate 4, where a narrow missing<br />
region extends between two bright areas across a dark belt,<br />
the Laplacian Fill Algorithm gives an unacceptably bright<br />
fill. The luminance at the center of the fill was<br />
approximately the average of the luminance of the bright<br />
and dark regions. Because of the nonlinearity in visu<strong>al</strong><br />
perception of intensity, the filled region seemed much<br />
brighter than the dark band and not significantly dimmer<br />
than the bright bands.<br />
The Rank Fill was developed to restore images with<br />
the pathologies just described. Like the Laplacian Fill, the<br />
Rank Fill will fill sm<strong>al</strong>l areas with the average of the<br />
surrounding luminance. However, in the case of the long<br />
narrow region described above, the luminance v<strong>al</strong>ue<br />
assigned to the center of the region is determined by the<br />
luminance of the nearest v<strong>al</strong>id data on the left and right<br />
sides. This maintains the pattern of luminance in the<br />
origin<strong>al</strong> data.<br />
The rank filter in the Rank Fill Algorithm can be<br />
applied sever<strong>al</strong> times to completely fill the missing data<br />
regions. Experimentation with the number of iterations<br />
has shown that if it is applied more than five times, the<br />
luminance will converge to the highest v<strong>al</strong>ue of the full<br />
image. The result is that the fill will not meet the criteria<br />
of matching the luminance of the adjacent v<strong>al</strong>id data. In<br />
these cases, the Laplacian Fill Algorithm is used to<br />
complete the fill.<br />
It is our intention to further investigate the limitations<br />
of the rank filter after two repetitions. Currently, the<br />
number of repetitions is based upon visu<strong>al</strong> inspection of<br />
the missing data regions and the convergence of the<br />
graysc<strong>al</strong>e with the boundaries of these areas. Ide<strong>al</strong>ly, we<br />
would like to automate this process so that the number of<br />
rank filters applied to the missing regions would be<br />
determined by a complete fill of <strong>al</strong>l the missing areas.<br />
Another option that is being added to Restorer is to derive<br />
the luminance of the missing data areas in a<br />
two−dimension<strong>al</strong> slice by interpolating the luminance of<br />
the slices adjacent to it. We <strong>al</strong>so intend to apply the
Restorer technique to other types of physic<strong>al</strong> data such as<br />
oceanography, wind, and fluid flow data sets.<br />
5 Acknowledgments<br />
This work is being done under NASA Contract Number<br />
NAS5−32350. We would like to thank Dr. Horace Mitchell<br />
and Dr. James Strong of the Scientific Visu<strong>al</strong>ization and<br />
Applications Branch, and Dr. Mark Schoeberl of the<br />
Atmospheric Chemistry and Dynamics Branch at NASA<br />
Goddard Space Flight Center for their support.<br />
We are very grateful to Pamela O’Neil for her hard work<br />
and excellent video production. We <strong>al</strong>so wish to thank Houra<br />
Rais for proofreading this paper.<br />
References<br />
[1] R. Mayer, A Dictionary of Art Terms and Techniques, Thomas<br />
Y. Crowell Co., New York, 1969, p. 90.<br />
[2] M. Doerner, The Materi<strong>al</strong>s of the Artist & their Use in<br />
Painting, Revised Edition, Harcourt, Brace & World, Inc.,<br />
New York, 1962, p. 310.<br />
[3] F. Kelly, Art Restoration: A Guide to the Care and<br />
Preservation of Works of Art, McGraw−Hill Book Co., New<br />
York, 1972, pp. 181−192.<br />
[4] D. A. Dondis, A Primer of Visu<strong>al</strong> Literacy, The MIT Press,<br />
Cambridge, Mass, 1973, pp. 85−103.<br />
[5] J. D. Foley et <strong>al</strong>., Computer Graphics: Principles and<br />
Practices, 2nd. edition, Addison−Wesley Publishing<br />
Company, Reading, Mass., 1990, pp. 563−564.<br />
[6] S. Coren, C. Porac, L.M. Ward, Sensation and Perception,<br />
Academic Press, New York, 1979, pp. 150−155.<br />
[7] C. Ware, "Color Sequences for Univariate Maps: Theory,<br />
Experiments, and Principles", IEEE Computer Graphics &<br />
Applications, Vol. 8, No. 5, Sept. 1988, pp. 41−49.<br />
[8] J. Itten, The Art of Color: The subjective experience and<br />
objective ration<strong>al</strong>e of color, Van Nostrand Reinhold Co.,<br />
New York, 1973.<br />
[9] J. Albers, Interaction of Color, Revised Edition, Y<strong>al</strong>e<br />
University Press, New Haven, Conn. 1976.<br />
[10] E. R. Tufte, Envisioning Information, Graphics Press,<br />
Cheshire, Conn., 1990, pp 81−95.<br />
[11] J. D. Foley and J. Grimes, "Using Color in Computer<br />
Graphics," IEEE Computer Graphics and Applications, Vol.<br />
8, No. 5, Sept. 1988, pp. 25−27.<br />
[12] R. E. Christ, "Review and An<strong>al</strong>ysis of Color Coding Research<br />
for Visu<strong>al</strong> Displays," Human Factors, Vol. 17, No. 6, June<br />
1975, pp. 542−570.<br />
[13] W. Cleveland and R. McGill, "A Color−Caused Optic<strong>al</strong><br />
Illusion on a Statistic<strong>al</strong> Graph," American Statistician, Vol.<br />
37, May 1983, pp. 101−105.<br />
[14] J. D. Foley et <strong>al</strong>., Computer Graphics: Principles and<br />
Practices, 2nd. edition, Addison−Wesley, Reading, Mass.,<br />
1990, p. 589.<br />
[15] W. H. Press et <strong>al</strong>., Numeric<strong>al</strong> Recipes in C, Cambridge<br />
University Press, Cambridge, Mass., 1988, pp. 636−643.<br />
[16] W. H. Press et <strong>al</strong>., Numeric<strong>al</strong> Recipes in C, Cambridge<br />
University Press, Cambridge, Mass., 1988, pp. 673−676.<br />
[17] R. C. Gonz<strong>al</strong>ez, P. Wintz, Digit<strong>al</strong> Image Processing, 2nd<br />
edition, Addison−Wesley Publishing Company, Reading,<br />
Mass., 1987, pp. 162−163.
Plate 1: When two gray squares of equ<strong>al</strong> luminance are<br />
placed on a background of varying luminance, the square<br />
on the lighter background appears darker and vice versa.<br />
If the luminance of the gray squares is equ<strong>al</strong> to the<br />
luminance of the background, the squares blend into the<br />
background.<br />
Plate 2: The black areas in a. represent the areas of<br />
missing data. The missing areas have been filled in b.<br />
based upon the luminance of the adjacent colors. The<br />
corresponding graysc<strong>al</strong>e version of b. is shown in c.<br />
Plate 3: Three black geometric shapes are used to<br />
simulate areas of missing data in a 2D slice through a 3D<br />
data set which contains no missing data The Restored<br />
version appears above the un−Restored.<br />
a.<br />
b.<br />
c.<br />
Plate 4: The Restoration sequence on Tot<strong>al</strong> Ozone<br />
data from Nimbus−7 TOMS for Feb. 13, 1993: a. the<br />
origin<strong>al</strong> data; b. using Rank and Median filters; c.<br />
fin<strong>al</strong> step after using the Laplacian fill.
Please reference the following QuickTime movie located in the MOV<br />
directory:<br />
QTOZONEJ.MOV<br />
Copyright © 1994 by NASA Goddard Space Flight Center<br />
QuickTime is a trademark of Apple Computer, Inc.
Abstract<br />
Meaningful scientific visu<strong>al</strong>izations benefit the interpretation<br />
of scientific data, concepts and processes.<br />
To ensure meaningful visu<strong>al</strong>izations, the visu<strong>al</strong>ization<br />
system needs to adapt to desires, disabilities and abilities<br />
of the user, interpretation aim, resources (hardware,<br />
software) available, and the form and content of<br />
the data to be visu<strong>al</strong>ized. We suggest to describe these<br />
characteristics by four models: user model, problem<br />
domain/task model, resource model and data model.<br />
This paper makes suggestions for the generation of a<br />
user model as a basis for an adaptive visu<strong>al</strong>ization<br />
system.<br />
We propose to extract information about the user<br />
by involving the user in interactive computer tests and<br />
games. Relevant abilities tested are color perception,<br />
color memory, color ranking, ment<strong>al</strong> rotation, and fine<br />
motor coordination.<br />
1. Introduction<br />
User Modeling for Adaptive Visu<strong>al</strong>ization Systems<br />
G. O. Domik B. Gutkauf<br />
University of Paderborn University of Colorado<br />
D-33095 Paderborn, Germany Boulder, CO. 80309-0430, USA<br />
domik@uni-paderborn.de gutkauf@cs.colorado.edu<br />
The transformation of physic<strong>al</strong> phenomena (denoted<br />
as “Re<strong>al</strong>ity” in Figure 1) into computer readable<br />
numbers is a prerequisite to computer visu<strong>al</strong>ization<br />
([1]). Visu<strong>al</strong>ization denotes the actu<strong>al</strong> process of mapping<br />
numbers to pictures. The viewer’s interpretation<br />
of a picture is the fin<strong>al</strong> stage of visu<strong>al</strong>ization. Figure 1<br />
distinguishes between two go<strong>al</strong>s of visu<strong>al</strong>ization: gaining<br />
new insight into the numbers represented in the<br />
picture (e.g. interpreting the qu<strong>al</strong>ity of a computer<br />
model representing a physic<strong>al</strong> phenomena) or gaining<br />
a better understanding of the re<strong>al</strong> phenomena itself.<br />
Meaningful computer visu<strong>al</strong>izations benefit the interpretation<br />
of (scientific) data, concepts and processes.<br />
Qu<strong>al</strong>itative measurements for the meaningfulness of<br />
pictures have been defined as “expressive” and “effective”<br />
by [2]. Such systems are <strong>al</strong>so c<strong>al</strong>led “graphic<strong>al</strong>ly<br />
articulate” [3]. Often a tri<strong>al</strong>-and-error approach leads<br />
to finding the most expressive and effective (graphic<strong>al</strong>ly<br />
articulate) visu<strong>al</strong>izations. Ineffective, inexpressive<br />
(graphic<strong>al</strong>ly inarticulate) computer visu<strong>al</strong>ization is<br />
at best useless and at worst misleading. However, the<br />
v<strong>al</strong>ue of a picture for the purpose of a particular interpretation<br />
is often not obvious to the viewer before its<br />
use for interpretation. The same picture might bring<br />
about new insights to one user, but not to another; the<br />
same picture might be effective for one scientific problem,<br />
but not for another; the same animation might be<br />
adequate to understand a problem on one type of hardware,<br />
but not on another. In order to generate the most<br />
meaningful picture for a specific instance, a careful<br />
mapping process from “numbers to pictures” is necessary.<br />
The next section discusses the factors influencing<br />
the qu<strong>al</strong>ity of a visu<strong>al</strong>ization.<br />
2. Factors influencing the qu<strong>al</strong>ity of visu<strong>al</strong>izations:<br />
data, user, task, problem domain<br />
and resources<br />
Past scientific visu<strong>al</strong>ization literature, e.g. [4], [5],<br />
[6], [7], [8], [9], indicate the need for a careful mapping<br />
process from numeric<strong>al</strong> data to visu<strong>al</strong> attributes<br />
of a picture. A meaningful visu<strong>al</strong>ization must fit syn-<br />
Re<strong>al</strong>ity Numbers Pictures Viewer<br />
Figure 1: The essence of visu<strong>al</strong>ization is a mapping process from numbers to pictures.
tax and semantics of the numeric<strong>al</strong> data v<strong>al</strong>ues to be<br />
represented, support the interpretation aim (task), conform<br />
to the problem domain, adapt to the user as well<br />
as be adequately supported by available computer resources.<br />
Large scientific institutions, e.g. the Nation<strong>al</strong><br />
Center for Supercomputing Applications (NCSA),<br />
have in the past provided visu<strong>al</strong>ization experts to aid<br />
scientists with the mapping process on an individu<strong>al</strong><br />
basis. Visu<strong>al</strong>ization experts collect <strong>al</strong>l background information<br />
necessary to generate meaningful pictures<br />
before starting the actu<strong>al</strong> visu<strong>al</strong>ization process, therefore<br />
minimizing tri<strong>al</strong>-and-error time. In lieu of help<br />
from a visu<strong>al</strong>ization expert, the visu<strong>al</strong>ization system itself<br />
should be “knowledgeable” about background information.<br />
We suggest to form<strong>al</strong>ly describe the knowledge<br />
of the system by four models: user model, data<br />
model, resource model, and problem domain/task<br />
model. The more knowledge the visu<strong>al</strong>ization system<br />
possesses about user, data, resources and problem domain/task,<br />
the better it can adapt to one specific visu<strong>al</strong>ization<br />
instance. Lack of knowledge in any of the<br />
above named areas will lead to a tri<strong>al</strong>-and-error approach<br />
in finding meaningful visu<strong>al</strong>izations, or in the<br />
worst case, will result in misleading visu<strong>al</strong>izations. We<br />
c<strong>al</strong>l visu<strong>al</strong>ization systems that are able to conform to a<br />
specific visu<strong>al</strong>ization instance “adaptive visu<strong>al</strong>ization<br />
systems”. Adaptive visu<strong>al</strong>ization systems belong to a<br />
new class of “intelligent visu<strong>al</strong>ization systems”.<br />
2.1 Data model<br />
The “data model” serves to organize information in<br />
the numbers to be visu<strong>al</strong>ly represented. The potenti<strong>al</strong><br />
of visu<strong>al</strong> indicators in a picture to express information<br />
as well as artifacts is dependent on syntactic and semantic<br />
characteristics of these numbers, such as dynamic<br />
range, data type, dimensions, structures and dependencies.<br />
The need for data models to organize complex data<br />
sets for visu<strong>al</strong>ization has recently been recognized, e.g.<br />
[10], [11], [12], [13],[14]. However, the use of data<br />
models for adaptive or intelligent visu<strong>al</strong>ization systems<br />
is still rare. Mickus-Miceli ([15]) suggests the use<br />
of an object-oriented data model to model both the<br />
structur<strong>al</strong> and behavior<strong>al</strong> components of the data as a<br />
basis for an intelligent visu<strong>al</strong>ization system.<br />
2.2 Resource model<br />
The “Resource model” identifies the hardware and<br />
software environment a user works in. It should contain<br />
information on the display hardware, input and<br />
output devices, processors, speci<strong>al</strong> graphics extensions,<br />
as well as software modules available, and any<br />
other factors influencing capabilities and limitations of<br />
the computer. If relevant, this <strong>al</strong>so includes lightening<br />
of the room the user works in, or other factors influencing<br />
the performance of the system without actu<strong>al</strong>ly<br />
being part of the system.<br />
2.3 Problem domain/task model<br />
Certain problem domains prefer specific pictori<strong>al</strong><br />
representations. Often this preference is rooted in tradition,<br />
and emphasized through education. Sometimes<br />
the use of particular visu<strong>al</strong> cues seems “common<br />
sense”, such as the use of blue for lower elevations (in<br />
particular for water), or for cold temperatures. However,<br />
if the objects to be represented are abstract, artifici<strong>al</strong><br />
color mapping is established. In electric<strong>al</strong> engineering,<br />
positive charges are encoded in red and negative<br />
charges in blue or black. While such color mapping<br />
is not “common sense”, it is taught in schools<br />
univers<strong>al</strong>ly throughout the world, and becomes “common<br />
sense” for electric<strong>al</strong> engineers.<br />
In a similar way, different interpretation aims (such<br />
as “locating”, “visu<strong>al</strong>ly correlate”, or “identify”) demand<br />
different visu<strong>al</strong> expressions for quick and accurate<br />
interpretation. While problem domain and interpretation<br />
aim are very different factors influencing the<br />
qu<strong>al</strong>ity of visu<strong>al</strong>izations, we here suggest the use of<br />
one model to represent information on both. This has<br />
no deeper purpose than to minimize the number of<br />
models in an adaptive visu<strong>al</strong>ization system.<br />
The fourth model, the user model, is described in<br />
more detail in the next section.<br />
3. User model<br />
The “user model” describes the collective information<br />
the system has of a particular user (viewer). A picture<br />
is subjectively interpreted by the viewer in dependency<br />
of past experiences, education, gender, culture,<br />
and individu<strong>al</strong> limitations, abilities and requirements.<br />
E.g., color deficient viewers are limited in interpreting<br />
color pictures; a person with deficient fine motor skills<br />
will have problems accurately pointing at sm<strong>al</strong>l objects<br />
on the screen. In order to create a user model, the system<br />
needs to learn facts about the user. Most of these<br />
facts can be extracted from observing the user performing<br />
speci<strong>al</strong> tasks. In the following sections we<br />
will describe the generation of a user model in more<br />
detail.
3.1 User modeling<br />
User modeling denotes the generation of the user<br />
model by extracting information from the user ([16]).<br />
Information can be extracted from the user in one of<br />
three ways:<br />
a) Through explicit modeling: the user typic<strong>al</strong>ly fills<br />
out a form and answers to direct questions.<br />
b) Through implicit modeling: the user is being observed<br />
in his/her use of the system.<br />
c) The user is asked to solve speci<strong>al</strong> tasks and is being<br />
observed in doing so.<br />
A complete user model evolves in sever<strong>al</strong> stages,<br />
whereby each style of user modeling is being used.<br />
Typic<strong>al</strong>ly, the extraction of information starts with explicit<br />
modeling to inquire about gender, age, or education.<br />
Subsequently, the user has to complete speci<strong>al</strong><br />
tasks that reve<strong>al</strong> limitations of his/her vision and/or<br />
hand-eye coordination. By continuously observing the<br />
user in his/her use of the visu<strong>al</strong>ization system, the user<br />
model can be improved over time. Significant information<br />
for the user model is expected from the completion<br />
of speci<strong>al</strong> tasks. We have therefore focused on<br />
implementing speci<strong>al</strong> tests that reve<strong>al</strong> abilities and disabilities<br />
of the user. Most of the tests are currently implemented<br />
at the motivation<strong>al</strong> level of education<strong>al</strong><br />
games: users enjoy performing the tests and may c<strong>al</strong>l<br />
them up repeatedly. Motivation in performing these<br />
tests is important both for the purpose of user modeling<br />
as well as for training certain abilities through repetitive<br />
performance of the tests.<br />
3.2. Parameters of the user model<br />
The following five abilities describing the performance<br />
of a user as relevant for visu<strong>al</strong>ization have been<br />
investigated in more detail: color perception, color<br />
memory, color ranking, ment<strong>al</strong> rotation, and fine<br />
motor coordination. Addition<strong>al</strong>ly we have found sever<strong>al</strong><br />
abilities that might be of influence, but have not<br />
been investigated in any detail so far: reasoning, size<br />
recognition, perceptu<strong>al</strong> speed, visu<strong>al</strong> versus verb<strong>al</strong> recognition,<br />
and embedded figure recognition.<br />
Following is a description of each of the five user<br />
abilities investigated, explaining its relationship to visu<strong>al</strong>ization<br />
and the speci<strong>al</strong> tasks which extract information<br />
about this ability from the user. Between fifteen<br />
and twenty users were tested for each of the abilities.<br />
In three of the five abilities (perception, ment<strong>al</strong><br />
rotation, fine motor coordination) we were able to derive<br />
quantitative ev<strong>al</strong>uations of the results. In two of<br />
the five abilities (color ranking and color memory) the<br />
test results are described in a qu<strong>al</strong>itative manner.<br />
Color perception: Color perception is defined as<br />
the process of distinguishing points or homogeneous<br />
patches of light by a subject. It is a cognitive ability<br />
and varies among people. Color perception depends on<br />
a person’s color deficiency, gender, ethnologic<strong>al</strong> information,<br />
qu<strong>al</strong>ity of monitor used and the lightening situation<br />
in the room. No gener<strong>al</strong> assumption of color<br />
perception for one visu<strong>al</strong>ization instance can therefore<br />
be made a priori.<br />
Since color graphics workstations have become a<br />
standard equipment at scientific institutions, color coding<br />
is one of the most commonly used visu<strong>al</strong>ization<br />
techniques to represent data. Colors used must be set<br />
to v<strong>al</strong>ues that are easily distinguished by the viewer.<br />
Therefore the go<strong>al</strong> for the “color perception test” is to<br />
find a set of discriminatory colors. A standardized test<br />
optometrists use to determine color deficiencies, the<br />
“Farnsworth Hue 100” test ([17]), has been used as a<br />
basis. In a very similar manner, the essence of our test<br />
is to sort forty pastel (low saturation) color chips so<br />
that every chip has a minim<strong>al</strong> color difference to its<br />
neighbor. Figure 2 (upper row) shows the arrangement<br />
of color chips at the start of the test, Figure 2<br />
(lower row) shows the correct result after rearranging<br />
the chips. In order to use perceptu<strong>al</strong>ly similar leaps between<br />
the forty color chips, the CIELUV color space<br />
([18]) is used. Colors that can not be distinguished<br />
would appear out of order in the test results. We use<br />
only forty colors instead of one hundred or more to<br />
keep the user motivated to perform the test. Our first<br />
results indicate that these forty colors give us enough<br />
information to eliminate colors that would cause problems<br />
for color coding.<br />
For twenty users two parameters each were measured:<br />
a) the time it took the user to perform the color<br />
perception test, and b) an error factor describing the errors<br />
in the fin<strong>al</strong> arrangement of the color chips. In<br />
order to compare measured time between slow and<br />
quick users, we used the time difference between the<br />
actu<strong>al</strong> timing measurement of the color perception test<br />
and similar tasks (e.g. sorting numbers, sorting angles).<br />
A v<strong>al</strong>ue of zero on the time difference axis in<br />
Figure 3 (a) specifies that the color perception test was<br />
finished in the same or less amount of time than other<br />
similar tasks. Specific<strong>al</strong>ly user 9 and user 18 show significantly<br />
long times to perform the test. Both users<br />
have been diagnosed as color deficient in competent<br />
optometric tests.<br />
The error factor e c c<strong>al</strong>culated for each test result is
Time Difference (sec.)<br />
Error Factor (e c )<br />
Error Factor (e c )<br />
700<br />
600<br />
500<br />
400<br />
300<br />
200<br />
100<br />
2<br />
1<br />
5<br />
4<br />
3<br />
2<br />
1<br />
1 5 10 15<br />
User Number<br />
Figure 3(a): Timing for color perception<br />
test<br />
green<br />
dependent on the misplacements of chips relative to<br />
their neighbors:<br />
e c = abs(c c -c l ) + abs(c r -c c )-2,<br />
with c c ... current chip number, c l ... number of left<br />
chip, c r ... number of right chip. Figure 3 (b) reflects<br />
the error factor for each of the forty chips for a typic<strong>al</strong><br />
non-color deficient user who misplaced one color chip.<br />
Figure 3 (c) shows the error factor for each chip for<br />
user 9 (color deficient).<br />
20<br />
Color ranking: Color ranking is the association of<br />
color with ordin<strong>al</strong> or quantitative data items. If a temperature<br />
sc<strong>al</strong>e is to be displayed, standard color mapping<br />
(low temperature mapped to blue, high temperatures<br />
mapped to red, yellow and white) may be used. If<br />
no “standard mapping” is known for specific data<br />
characteristics, an artifici<strong>al</strong> ranking of colors from<br />
“low” to “high” is necessary. Because human perception<br />
has no inherent ranking of colors, the association<br />
of color with ordin<strong>al</strong> or quantitative data items is individu<strong>al</strong>,<br />
depending on the problem domain as well as<br />
the viewer’s education, color deficiencies and preference.<br />
Interpreting the meaning of a color picture often involves<br />
instant recognition of low v<strong>al</strong>ues versus high<br />
v<strong>al</strong>ues. The presence of a color sc<strong>al</strong>e showing the used<br />
1 5 10 15 20<br />
Chip Position<br />
25 30 35 40<br />
Figure 3(b): Error Factor of non color deficient user<br />
yellow-green cyan-blue<br />
1 5 10 15 20 25 30 35 40<br />
Chip Position<br />
Figure 3(c): Error factor of color deficient user<br />
color range and its associations is extremely important.<br />
Still, misinterpretation can only be avoided, if the<br />
viewer is in agreement with the association. The go<strong>al</strong><br />
of the “color ranking test” is therefore to have the<br />
viewer reve<strong>al</strong> their own intuition on color sequences.<br />
This is done by having the user match colors of an<br />
available color gamut (see Figure 4) to a number sc<strong>al</strong>e<br />
from one to ten. Typic<strong>al</strong> color sc<strong>al</strong>es expected from<br />
this test were:
lack (0) - purple - blue - cyan - dark-green - lightgreen<br />
- yellow - orange - red - white (10)<br />
or<br />
black(0) - purple - blue - cyan - dark-green - lightgreen<br />
- red - orange - yellow - white (10)<br />
Results from the color ranking test proved very individu<strong>al</strong>.<br />
Even though spectr<strong>al</strong> sc<strong>al</strong>es and increasing<br />
perceptu<strong>al</strong> brightness were among the fifteen test results,<br />
most users lacked a specific strategy. We are<br />
currently devising the test to receive more meaningful<br />
results. The user chosen color sc<strong>al</strong>e should be used<br />
preferably for visu<strong>al</strong>ization of ordin<strong>al</strong> data items.<br />
Color memory: Color memory is the ability of a<br />
person to rec<strong>al</strong>l a color from memory. Even though we<br />
are able to distinguish between numerous colors [19]),<br />
we can only do so when comparing one color to another.<br />
If color samples are not directly compared to each<br />
other we can only process a sm<strong>al</strong>l fraction of colors<br />
(around ten). Interpreting the meaning of a color picture<br />
series often involves recognizing (and therefore<br />
remembering) the same color in sever<strong>al</strong> pictures. Specific<strong>al</strong>ly<br />
for the distinction of nomin<strong>al</strong> data items, we<br />
prefer to use colors the user can easily distinguish.<br />
The idea for the corresponding “color memory”<br />
test has been borrowed from the well known game<br />
“Memory”. Nine color cards (Figure 5) are shown to<br />
the user for ten seconds. When they are turned facedown,<br />
the user needs to pick the correct color corresponding<br />
to one color card that will be shown to<br />
him/her. The user may guess as many times as needed,<br />
but the amount of guesses is entered in a log file. The<br />
game can vary in difficulty by changing the timing <strong>al</strong>lowed<br />
to view the nine cards. As in <strong>al</strong>l other tests and<br />
games introduced in this paper, the results (what colors<br />
are memorized best) are not only dependent on user’s<br />
abilities but <strong>al</strong>so on the qu<strong>al</strong>ity of hardware and lightning<br />
environment. For our purposes we see this as an<br />
advantage of modeling the current environment as perfectly<br />
as possible rather than a lack of separation between<br />
the content of different visu<strong>al</strong>ization models<br />
(e.g. user model and resource model).<br />
Ment<strong>al</strong> rotation: Ment<strong>al</strong> rotation is the ability to<br />
rotate ment<strong>al</strong> representations of two and three dimension<strong>al</strong><br />
objects. The response time required by degree<br />
of rotation is c<strong>al</strong>led “ment<strong>al</strong> rotation rate”. Determination<br />
of the ment<strong>al</strong> rotation rate is used to study the<br />
speed of spati<strong>al</strong> information processing and as such<br />
part of intelligence/ability tests.<br />
One of the most interesting and pioneering re-<br />
search areas in visu<strong>al</strong>ization today is the use of glyphs<br />
to represent multi-variate data (e.g. [20], [21], [22],<br />
[23]). In some cases, rotation of glyphs (in two or<br />
three dimensions) denote changes of variables. In<br />
order to interpret rotated glyphs, ment<strong>al</strong> rotation needs<br />
to be applied. The Joslyn-Glyph ([23], representation<br />
of a cube with variable height, width, depth, rotation<br />
angles in three dimensions, and color) is a good example<br />
for the three-dimension<strong>al</strong> case: an interpretation of<br />
an individu<strong>al</strong> glyph is only possible by performing<br />
ment<strong>al</strong> rotation. The “ment<strong>al</strong> rotation test” consists of<br />
a set of twenty pairs of rotated objects; the viewer has<br />
to decide if the represented objects are the same or<br />
mirror images of each other. A standard set of 3-dimension<strong>al</strong><br />
objects ([24]) was used. Both error rate and<br />
response time are measured and recorded. “Response<br />
time” of the ment<strong>al</strong> rotation test was again norm<strong>al</strong>ized<br />
similarly to the user perception test. A v<strong>al</strong>ue of zero<br />
expressed (<strong>al</strong>most) no hesitation between deciding on<br />
mirror or rotated image. The results of fifteen test<br />
Error (# out of 20)<br />
11<br />
10<br />
9<br />
8<br />
7<br />
6<br />
5<br />
4<br />
3<br />
2<br />
1<br />
III<br />
I<br />
IV<br />
1 2 3 4 5 6 7 8 9<br />
Time (sec.)<br />
Figure 6: Result of ment<strong>al</strong> rotation test<br />
users in Figure 6 are divided into four quadrants: quadrant<br />
I shows users that are both fast and accurate in<br />
their ment<strong>al</strong> rotation ability; quadrant IV shows users<br />
that are both slow and error prone. The divisions between<br />
the quadrants are established by the mean v<strong>al</strong>ues<br />
over <strong>al</strong>l users. For users inside quadrant IV, interpretation<br />
of glyphs that encode rotation should be<br />
avoided.<br />
Fine motor coordination: Fine motor coordination<br />
is the user’s ability to perform precision manu<strong>al</strong><br />
tasks, demanding good eye-hand coordination and<br />
motor speed. This ability is influenced by age, gender,<br />
experience, motor (dis)abilities of the user as well as<br />
the input device used. With increasing age the ability<br />
to coordinate the interaction between eye and hand de-<br />
II
creases ([25]). While in gener<strong>al</strong> men are faster in tapping<br />
a single key, women are faster in moving sm<strong>al</strong>l<br />
objects to a specific destination. Players of computer<br />
games are an excellent example to show the increase<br />
of fine motor coordination with experience. Natur<strong>al</strong>ly,<br />
motor disabilities impair fine motor coordination. Addition<strong>al</strong>ly<br />
to these individu<strong>al</strong> characteristics of a user,<br />
type and qu<strong>al</strong>ity of the input device used plays a large<br />
role in the accuracy of fine motor coordination.<br />
Interactive visu<strong>al</strong>ization requires fine motor coordination,<br />
e.g. to point at sm<strong>al</strong>l objects or to trace structures<br />
on the screen. The “fine motor coordination test”<br />
as currently implemented determines the user’s speed<br />
and error rate to trace a predefined path (see Figure 7).<br />
Error rate, as an indicator for accuracy, is measured by<br />
counting the number of times the user leaves the predefined<br />
path (green path in Figure 7).<br />
Error Factor *<br />
10<br />
9<br />
8<br />
7<br />
6<br />
5<br />
4<br />
3<br />
2<br />
1<br />
The result of fifteen test users in Figure 8 compares<br />
time and error rate: as in the previous user test, the<br />
quadrants are separated by the mean error rate and<br />
mean user’s speed, respectively. Quadrant I describes<br />
the best candidates for a quick and accurate access via<br />
mouse. Quadrant IV describes users with a certain<br />
handicap for these tasks. Initi<strong>al</strong> tests showed, that the<br />
type of pointing device used was a major influence to<br />
the results. In order to observe differences in the user’s<br />
ability <strong>al</strong>one, the same mouse was used for <strong>al</strong>l tests.<br />
4. Outlook<br />
III<br />
Meaningful visu<strong>al</strong>izations have often been created<br />
through tri<strong>al</strong>-and-error in the past. The generation of a<br />
priori meaningful visu<strong>al</strong>izations will effectively increase<br />
scientific productivity. Such visu<strong>al</strong>izations can<br />
be supported by adapting visu<strong>al</strong> representations to the<br />
characteristics of user, data, resources, and problem to<br />
be solved. In this paper we have explained the use of<br />
tests and games to extract information characterizing<br />
the user. It was our go<strong>al</strong> to implement tests as well as<br />
games in a motivation<strong>al</strong> format.<br />
Ability tests and their implementation are explained<br />
in full detail in [26]. We are planning the following<br />
improvements for the future:<br />
Sever<strong>al</strong> addition<strong>al</strong> user abilities, such as reasoning,<br />
size recognition, perceptu<strong>al</strong> speed, visu<strong>al</strong> versus verb<strong>al</strong><br />
recognition, and embedded figure recognition, seem to<br />
be of importance but their ability tests have not been<br />
designed yet. Addition<strong>al</strong>ly, the user’s knowledge about<br />
visu<strong>al</strong>ization should influence the use of visu<strong>al</strong> representations.<br />
Some of the implemented ability tests need<br />
to be extended: The ment<strong>al</strong> rotation test is specific<strong>al</strong>ly<br />
developed for three dimension<strong>al</strong> objects, however, a 2-<br />
1 5 10 15 20 25 30<br />
Time (sec.)<br />
* Number of times predefined path was accidently left<br />
I<br />
IV<br />
Figure 8: Results of fine motor coordination test<br />
II<br />
dimension<strong>al</strong> rotation test would <strong>al</strong>so seem of importance.<br />
The fine motor coordination test is specific<strong>al</strong>ly<br />
developed to test the user’s abilities with a mouse;<br />
<strong>al</strong>ternative tests to determine strengths/weaknesses of<br />
other input devices should be developed. While the results<br />
of our ability tests are well understood, they have<br />
not been implemented yet into a visu<strong>al</strong>ization system,<br />
which will be an important step for the future.<br />
Acknowledgement<br />
Thanks to Dr. Stephen Franklin, University of C<strong>al</strong>ifornia,<br />
Irvine, for very useful criticism to a previous<br />
version of Figure 1. The authors <strong>al</strong>so gratefully acknowledge<br />
the conversion of the “color perception<br />
test” from HSV to CIELUV (Figure 2) by M. Riese<br />
and M. Roland and the development of the game<br />
“Color memory” (Figure 5) by J. Blume and M.
Buschmann-Raczynski.<br />
References<br />
[1] Domik, G., in print, Visu<strong>al</strong>ization Education, Computer<br />
& Graphics, 18(3), 1994.<br />
[2] Mackinlay, J., 1986, Automating the Design of Graphic<strong>al</strong><br />
Presentations of Relation<strong>al</strong> Information, ACM Trans. on<br />
Graphics, Vol. 5, No. 2, April 1986, pp 110-141.<br />
[3] Feiner, S., Mackinlay, J., and Marks, J., 1992, Automating<br />
the Design of Effective Graphics for Intelligent User Interfaces.<br />
In Tutori<strong>al</strong> at the 1992 Conference on Computer<br />
Human Interaction, 1992.<br />
[4] De Ferrari, L., 1991, New Approaches in Scientific Visu<strong>al</strong>isation,<br />
Technic<strong>al</strong> Report CSIRO-DIT TR-HJ-91-06,<br />
CSIRO Division of Information Technology, GPO Box 664,<br />
Canberra ACT 2601 AUSTRALIA.<br />
[5] Haber, R. B. and D.A. McNabb, 1990, Visu<strong>al</strong>ization Idioms:<br />
A Conceptu<strong>al</strong> Model for Scientific Visu<strong>al</strong>ization Systems,<br />
in “Visu<strong>al</strong>ization in Scientific Computing”, ed. by<br />
G.M. Nielson, B. Shriver, and L. Rosenblum, IEEE Computer<br />
Society Press Tutori<strong>al</strong>, pp. 74-93.<br />
[6] Robertson, P.K. , 1991, A Methodology for Choosing<br />
Data Representations, IEEE Computer Graphics and Applications,<br />
Vol. 11, No. 3, May 1991, pp. 56-68.<br />
[7] Senay, H. and E. Ignatius, 1990, Rules and Principles of<br />
Scientific Data Visu<strong>al</strong>ization, GWU-IIST-90-13, May 1990,<br />
Department of Electric<strong>al</strong> <strong>Engineering</strong> and Computer Science,<br />
The George Washington University, Washington, D.C.<br />
20052.<br />
[8] Senay, H. and E. Ignatius, 1992, A Knowledge Based<br />
System for Scientific Data Visu<strong>al</strong>ization, Technic<strong>al</strong> Report<br />
TR-92-79, CESDIS, Goddard Space Flight Center, Code<br />
930.5, Greenbelt, MD 20771.<br />
[9] Wehrend, S. and C. Lewis, 1990, A Problem-oriented<br />
Classification of Visu<strong>al</strong>ization Techniques, Proceedings of<br />
Visu<strong>al</strong>ization 1990, IEEE Computer Society Press.<br />
[10] Lee, J.P. and G.Grinstein (editors), 1993, Workshop on<br />
Database Issues for Data Visu<strong>al</strong>ization. IEEE Society/Visu<strong>al</strong>ization<br />
‘93, October 1993.<br />
[11] Roth, S.F., John Kolojejchick, J.Mattis, and J. Goldstein,<br />
1993, Interactive Graphic Design Using Automatic<br />
Presentation Knowledge. In Zahid Ahmed, Kristina Miceli,<br />
Steve Casner, and Steve Roth, editors, Workshop on Intelligent<br />
Visu<strong>al</strong>ization Systems. IEEE Computer Society/Visu<strong>al</strong>ization<br />
‘93, October 1993.<br />
[12] Treinish, L.A. and M.L. Gough, 1987, A Software<br />
Package for the Data-Independent Storage of Multi-Dimension<strong>al</strong><br />
Data, Eos Trans. Amer. Geophys. Union 68, No. 28,<br />
633-635 (July 1987).<br />
[13] Campbell, W.J., N.M. Short, and L. A. Treinish, 1989,<br />
Adding Intelligence to Scientific Data Management, Computers<br />
in Physics 3, No. 3 (May 1989).<br />
[14] Mickus-Miceli, K.D. and G. Domik, 1992, An Enriched<br />
Framework for Multidisciplinary Data An<strong>al</strong>ysis, Symposium<br />
on Intelligent Scientific Computation, American Association<br />
for Artifici<strong>al</strong> Intelligence (AAAI), F<strong>al</strong>l 1992 Symposium Series,<br />
Cambridge MA, October 23-25, 1992.<br />
[15] Mickus-Miceli, K.D. (in preparation), An Object-Oriented<br />
Data Model to Support the Design of Effective Graphics<br />
for Scientific Visu<strong>al</strong>ization, Graduate Thesis, Department<br />
of Computer Science, University of Colorado, Boulder,<br />
CO. 80309-0430. In preparation (to be finished August<br />
1994).<br />
[16] Fischer, G., 1991, The Importance of Models in Making<br />
Complex Systems Comprehensible, in D. Ackerman and M.<br />
Tauber (editors) Ment<strong>al</strong> Models and Human Computer Communications,<br />
Elsevier Science, Amsterdam, pp. 3-36, 1991.<br />
[17] Higgins, K.E., 1975, The logic of color vision testing, a<br />
primer.<br />
[18] Travis, D., 1991, Effective Color Displays, Academic<br />
Press.<br />
[19] Hunt, R.W., 1987, Measuring Color, Ellis Horwood<br />
Limited, Market Cross House, Cooperstreet, Chichester,<br />
West Sussex, PO 191EB, England.<br />
[20] Picket, R.M. and Grinstein, G.G., 1988, Iconographics<br />
Displays for Visu<strong>al</strong>izing Multidimension<strong>al</strong> Data, Proceedings<br />
of the 1988 IEEE Conference on Systems, Man and Cybernetics,<br />
Vol. I, Beijing and Shenyang, People’s Republic<br />
of China, pp. 514-519.<br />
[21] Beddow, J., 1990, Shape Coding of Multidimension<strong>al</strong><br />
Data on a Microcomputer Display, Proceedings of Visu<strong>al</strong>ization<br />
'90, IEEE Computer Society Press, October pp. 238-<br />
237.<br />
[22] Levkowitz, H., 1991, Color Icons: Merging Color and<br />
Texture Perception for Integrated Visu<strong>al</strong>ization of Multiple<br />
Parameters, Proceedings of Visu<strong>al</strong>ization '91, IEEE Computer<br />
Society Press, pp. 164-170.<br />
[23] Domik, G., C. Joslyn, and T. Segura, 1993, Macroscopic<br />
and Microscopic Aspects of Glyphs, Proceedings of the<br />
Vienna Conference on Human Computer Interaction, Sept.<br />
20-22, 1993, Lecture Notes in Computer Science, Springer<br />
Verlag.<br />
[24] Shepard, R.N. and J. Metzler, 1971, Ment<strong>al</strong> Rotation of<br />
three dimension<strong>al</strong> objects. Science, 171, pp. 701-703.<br />
[25] Ruff, R.M. and S.B. Parker, 1993, Gender and age-specific<br />
changes in motor speed and eye-hand coordination in<br />
adults: normative v<strong>al</strong>ues for the finger tapping and grooved<br />
pegboard tests. Perceptu<strong>al</strong> and motor skills, 76, pp. 1219-<br />
1230.<br />
[26] Gutkauf, B., 1994, User Modeling in Scientific Visu<strong>al</strong>ization,<br />
Graduate Thesis, Department of Computer Science,<br />
University of Colorado, Boulder, CO. 80309-0430.
Figure 2: (upper row) Arrangements of color chips at start of color perception test.<br />
(lower row) Correct result after rearranging chips.<br />
Figure 4: Color gamut for color ranking test.<br />
Figure 5: Color Memory game. Nine color cards are<br />
uncovered for ten seconds at the beginning of the game.<br />
Figure 7: Fine motor coordination test. User traces green path from white rectangle<br />
to black rectangle. Errors (leaving green path) are counted and speed is measured.
Streamb<strong>al</strong>l Techniques for Flow Visu<strong>al</strong>ization<br />
Manfred Brill<br />
Hans Hagen<br />
Hans�Christian Rodrian<br />
Computer Science Department<br />
University of Kaiserslautern<br />
Germany<br />
Abstract<br />
We introduce the concept of streamb<strong>al</strong>ls for �ow visu�<br />
<strong>al</strong>ization. Streamb<strong>al</strong>ls are based upon implicit surface<br />
generation techniques adopted from the well�known<br />
metab<strong>al</strong>ls. Their property to split or merge automati�<br />
c<strong>al</strong>ly in areas of signi�cant divergence or convergence<br />
makes them an ide<strong>al</strong> tool for the visu<strong>al</strong>ization of arbi�<br />
trary complex �ow �elds. Using convolution surfaces<br />
generated by continuous skeletons for streamb<strong>al</strong>l con�<br />
struction o�ers the possibility to visu<strong>al</strong>ize even tensor<br />
�elds.<br />
1 Introduction<br />
1.1 Streamlines and stream surfaces<br />
Streamlines� streaklines� pathlines and timelines play<br />
an important role in �ow visu<strong>al</strong>ization. Most of these<br />
terms are directly derived from experiment<strong>al</strong> �ow vi�<br />
su<strong>al</strong>ization� where the corresponding phenomena are<br />
generated by inserting foreign materi<strong>al</strong> into the �ow<br />
and observing it while it moves through the �eld.<br />
� Streaklines are produced by continuously inject�<br />
ing materi<strong>al</strong> like smoke or little hydrogen bubbles<br />
into the �ow at certain points and watching the<br />
resulting clouds of particles.<br />
� Pathlines can be obtained by putting sm<strong>al</strong>l ob�<br />
jects into the �ow �eld and exposing a photo�<br />
graph for a longer time� thus depicting the traces<br />
of these objects over time.<br />
� Timelines are given by observing a line of particles<br />
�owing with the stream and making snapshots at<br />
sever<strong>al</strong> time steps.<br />
Wladimir Djatschin<br />
Stanislav V. Klimenko<br />
Computer Science Department<br />
Institute for High Energy Physics �IHEP�<br />
Russia<br />
1<br />
� Streamlines �n<strong>al</strong>ly are de�ned as curves tangent<br />
to the velocity �eld in every point.<br />
For steady �ows streaklines� pathlines and stream�<br />
lines obviously coincide �7�.<br />
In computation<strong>al</strong> �ow visu<strong>al</strong>ization� streak�� path��<br />
time�� and streamlines are often simulated to get an<br />
insight into the structure of a �ow �eld. Though these<br />
constructions are powerful tools for the investigation<br />
of two�dimension<strong>al</strong> �elds� they are not very well suited<br />
for the visu<strong>al</strong>ization of three�dimension<strong>al</strong> �eld data as<br />
they heavily su�er from display ambiguities when be�<br />
ing displayed in two dimensions on a computer screen.<br />
Therefore� streak�� path�� stream�� or timelines are of�<br />
ten used to build time surfaces or streak�� path�� and<br />
stream ribbons� �tubes� or �surfaces� which in conjunc�<br />
tion with standard lighting and shading techniques<br />
can provide a much better idea of the over<strong>al</strong>l topology<br />
of a 3D �ow �eld. Furthermore� loc<strong>al</strong> parameters of<br />
the �eld can be mapped onto these surfaces and thus<br />
be displayed together with the �eld�s velocity struc�<br />
ture.<br />
1.2 Previous work<br />
Many new techniques for �ow visu<strong>al</strong>ization have been<br />
presented in the last few years �7�.<br />
Schroeder et. <strong>al</strong>. �8� introduced the stream polygon<br />
technique� where n�sided� regular polygons perpen�<br />
dicular to the loc<strong>al</strong> velocity vector are placed <strong>al</strong>ong<br />
a streamline. E�ects like twist or sc<strong>al</strong>ar parameters<br />
of the �eld are displayed by accordingly rotating and<br />
shearing the polygons or changing attributes like ra�<br />
dius or color. By sweeping stream polygons <strong>al</strong>ong<br />
streamlines� three�dimension<strong>al</strong> stream tubes can be<br />
built.
Another method is the generation of stream sur�<br />
faces by connecting adjacent streamlines with poly�<br />
gons. Speci<strong>al</strong> care has to be taken whenever diver�<br />
gence of the �ow causes adjacent streamlines to sep�<br />
arate or convergence causes streamlines to come very<br />
close to each other� as the polygon<strong>al</strong> approximation<br />
may become poor in these cases.<br />
Helman and Hesselink �4� proposed an <strong>al</strong>gorithm<br />
which connects the critic<strong>al</strong> points of the vector �eld<br />
on the surface of an object to form a two�dimension<strong>al</strong><br />
skeleton. This skeleton represents the glob<strong>al</strong> topology<br />
of the �ow on the surface. Starting from points on<br />
the skeleton� streamlines in the �ow around the object<br />
are c<strong>al</strong>culated. By tesselating adjacent streamlines�<br />
stream surfaces are built. To avoid splitting of the<br />
stream surfaces in areas of divergence� the surfaces are<br />
recursively re�ned by introducing addition<strong>al</strong> starting<br />
points for the streamline c<strong>al</strong>culations.<br />
Hultquist �5� introduced an <strong>al</strong>gorithm which simul�<br />
taneously traces a set of particles originating from dis�<br />
crete points on some curve through the �eld and con�<br />
nects the resulting paths with triangles. In this way�<br />
an advancing front of a steadily growing stream sur�<br />
face is obtained. Whenever the divergence between<br />
two of these particles becomes too big� new particles<br />
are inserted into the front� when particles come too<br />
close to each other� some of them are removed.<br />
Van Wijk �9� proposed the usage of so�c<strong>al</strong>led surface<br />
particles for �ow visu<strong>al</strong>ization. With this technique� a<br />
big number of particles released from a number of par�<br />
ticle sources are traced through the �ow �eld. By po�<br />
sitioning the particle sources on a curve and displaying<br />
<strong>al</strong>l particles as sm<strong>al</strong>l geometric primitives shaped and<br />
coloured in dependency of certain �eld parameters�<br />
the impression of stream surfaces textured according<br />
to loc<strong>al</strong> parameters can be given.<br />
A di�erent approach which guarantees the genera�<br />
tion of smooth stream surfaces was <strong>al</strong>so introduced by<br />
Van Wijk �10�. The centr<strong>al</strong> concept of this method is<br />
the representation of stream surfaces as implicit sur�<br />
faces f�x� � C representing the sweep of an initi<strong>al</strong><br />
curve through the �eld. The shape of the initi<strong>al</strong> curve<br />
is de�ned by the v<strong>al</strong>ue of f at the in�ow boundaries.<br />
To c<strong>al</strong>culate f� Van Wijk proposes two methods� solv�<br />
ing the convection equation or tracing backwards the<br />
trajectories of grid points. The same technique can be<br />
used for the construction of time surfaces or stream<br />
volumes.<br />
1.3 Overview<br />
In this article we present a new method for �ow visu�<br />
<strong>al</strong>ization based upon implicit surface generation tech�<br />
2<br />
niques adopted from metab<strong>al</strong>ls. We c<strong>al</strong>l the resulting<br />
objects streamb<strong>al</strong>ls.<br />
In particular� streamb<strong>al</strong>ls are distinguished by their<br />
ability to split or merge with each other automatic<strong>al</strong>ly<br />
depending on their distances. By advancing appropri�<br />
ate skeletons through the �eld and displaying the re�<br />
sulting streamb<strong>al</strong>ls� streak�� stream�� path�� and time�<br />
lines as well as �surfaces� or �volumes can easily be vi�<br />
su<strong>al</strong>ized� no matter how complex the given �eld may<br />
be. The mathematic<strong>al</strong> representation of streamb<strong>al</strong>ls<br />
o�ers a variety of mapping possibilities for parame�<br />
ters of the �ow �eld.<br />
Section 2.1 introduces the concept of streamb<strong>al</strong>ls<br />
de�ned by a set of discrete centerpoints and their<br />
usage in �ow visu<strong>al</strong>ization. In Section 2.2� the con�<br />
cept of streamb<strong>al</strong>ls constructed from continuous two�<br />
dimension<strong>al</strong> skeletons� which open up a wider range<br />
of visu<strong>al</strong>ization possibilities� is introduced. In Sec�<br />
tion 2.3� some mapping techniques for streamb<strong>al</strong>ls are<br />
presented. The rendering method that we used is de�<br />
scribed in Section 2.4. Fin<strong>al</strong>ly� Section 3 contains a<br />
short summary and concluding remarks.<br />
2 Streamb<strong>al</strong>ls<br />
2.1 Streamb<strong>al</strong>ls with discrete skeletons<br />
2.1.1 Basic concept<br />
In 1982� Blinn �1� introduced the usage of implicit<br />
surfaces to display molecular compounds. With his<br />
method� a potenti<strong>al</strong> �eld F de�ned by a �nite set S of<br />
centerpoints si is used to generate an implicit surface<br />
which represents the molecules.<br />
At a given point x in space� F �S� x� is given as the<br />
sum of weighted in�uence functions Ii�x� generated by<br />
each of these centers�<br />
F �S� x� � X<br />
i<br />
wiIi�x� � X<br />
wie �aifi�x� � �1�<br />
where fi�x� describes the shape� ai the size� and wi<br />
the strength of the potenti<strong>al</strong> �eld.<br />
Based on this �eld an isosurface F �S� x� � C is<br />
constructed.<br />
For example� if there is only one centerpoint s1 and<br />
if a1 � 1<br />
R2 and f1�x� � jjx � s1jj 2� the resulting iso�<br />
surface will be a sphere whose radius depends on R.<br />
G. Wyvill et. <strong>al</strong>. �11� used a similar technique to<br />
construct what they c<strong>al</strong>led soft objects. To loc<strong>al</strong>ize<br />
i
the in�uence of the centerpoints and to avoid the com�<br />
putation of the exponenti<strong>al</strong> function� they applied the<br />
following polynomi<strong>al</strong> approximation�<br />
Ii�x� �<br />
8<br />
����<br />
����<br />
a fi�x�6<br />
R 6<br />
� b fi�x�4<br />
R 4<br />
� c fi�x�2<br />
R 2<br />
�<br />
� 1 � fi�x� � R<br />
0 � fi�x� � R<br />
�2�<br />
with fi�x� � jjx � sijj and a� b� and c chosen to satisfy<br />
Ii�0� � 1 Ii�R�2� � 0�5 Ii�R� � 0<br />
I 0 i�0� � 0 I 0 i�R� � 0<br />
�3�<br />
The described primitives are commonly known as<br />
metab<strong>al</strong>ls or blobby objects. Metab<strong>al</strong>ls are distin�<br />
guished by numerous useful properties�<br />
� A single centerpoint generates a single� spheric<strong>al</strong><br />
surface.<br />
� As two centerpoints come close� their correspond�<br />
ing shells blend smoothly� i.e. the resulting surface<br />
is C 1 �continuous.<br />
� If two or more centerpoints coincide� a single�<br />
larger sphere is produced �in fact� if the v<strong>al</strong>ue of<br />
C is chosen properly� the sphere generated by two<br />
of such centers will have exactly twice the volume<br />
as a sphere produced by one single centerpoint�.<br />
� as two centerpoints separate� the blending process<br />
is reversed.<br />
2.1.2 Discrete streamb<strong>al</strong>ls<br />
The basic idea for visu<strong>al</strong>izing �ow data with stream�<br />
b<strong>al</strong>ls is to use the positions of particles in the<br />
�ow as centerpoints for implicit surfaces� which then<br />
by blending with each other form three�dimension<strong>al</strong><br />
streamlines� stream surfaces etc. The centerpoints can<br />
be looked upon as a discrete skeleton of the surface<br />
constructed in this way. Referring both to the term<br />
metab<strong>al</strong>ls and to the usage of discrete skeletons we<br />
c<strong>al</strong>l the resulting three�dimension<strong>al</strong> objects discrete<br />
streamb<strong>al</strong>ls.<br />
To represent a streamline using discrete stream�<br />
b<strong>al</strong>ls we simply distribute a number of centerpoints<br />
<strong>al</strong>ong this streamline close enough to each other to<br />
let the surrounding isosurfaces blend. This blend�<br />
ing process is shown in Figure 1. By increasing the<br />
number of centerpoints si step by step� a continu�<br />
ous� three�dimension<strong>al</strong> representation of a streamline<br />
is produced.<br />
3<br />
Figure 1� The blending process of the streamb<strong>al</strong>ls.<br />
To construct stream surfaces� a number of particles<br />
originating from di�erent positions on some starting<br />
curve are advanced through the �ow �eld. Their posi�<br />
tions at sever<strong>al</strong> time steps are used as a skeleton for the<br />
streamb<strong>al</strong>ls. When the particles initi<strong>al</strong>ly are close to<br />
each other� they will produce a continuous and smooth<br />
surface� which will split automatic<strong>al</strong>ly in areas where<br />
divergence occurs� and merge automatic<strong>al</strong>ly in areas of<br />
convergence. An example for this can be seen in Fig�<br />
ure 2� where the �ow around an obstacle� simulated<br />
by the combination of a source and a sink� is shown.<br />
Notice how the streamb<strong>al</strong>ls split around the obstacle<br />
and merge again behind it. Color is used to map the<br />
velocity of the �ow.<br />
Figure 2� Discrete streamb<strong>al</strong>ls �owing around an ob�<br />
stacle.<br />
Time surfaces for any given time t � t0 � �t are<br />
built by distributing skeleton points on a starting sur�<br />
face at a time t � t0 and letting them �ow with the
Figure 3� Three snapshots of a time surface hitting an<br />
obstacle.<br />
�eld for a time �t. Figure 3 simultaneously shows<br />
three snapshots of a time surface hitting the same ob�<br />
stacle as in Figure 2. Though the time surface splits<br />
on the obstacle� the obstacle�s shape can clearly be<br />
seen.<br />
Stream volumes of arbitrary initi<strong>al</strong> shape are gen�<br />
erated by advancing a cloud of particles through the<br />
�ow �eld� which are initi<strong>al</strong>ly arranged to form the de�<br />
sired shape� and using their positions over time as a<br />
skeleton for the streamb<strong>al</strong>ls.<br />
As can be seen from the �gures� streamb<strong>al</strong>ls have<br />
the convenient property to split automatic<strong>al</strong>ly in areas<br />
of signi�cant divergence and to merge with each other<br />
in areas where convergence occurs. This behavior is a<br />
natur<strong>al</strong> consequence of the properties of metab<strong>al</strong>ls.<br />
Thus� streamb<strong>al</strong>ls will not necessarily produce<br />
closed stream surfaces. The way in which streamb<strong>al</strong>ls<br />
behave in such cases� however� can give v<strong>al</strong>uable in�<br />
formation on the structure of the �ow. In order to<br />
produce closed surfaces nevertheless� one can simply<br />
release addition<strong>al</strong> particles in areas of high divergence.<br />
2.2 Streamb<strong>al</strong>ls with continuous skele�<br />
tons<br />
2.2.1 Basic concept<br />
Bloomenth<strong>al</strong> and Shoemake �2� gener<strong>al</strong>ized the idea of<br />
metab<strong>al</strong>ls proposing the usage of an arbitrary skeleton<br />
consisting of a continuum of points �i.e. lines� curves<br />
etc.� instead of a limited number of centerpoints to<br />
generate the in�uence function.<br />
The �eld function F is given by the convolution of<br />
the skeleton�s characteristic function � S�x� with the<br />
weighted in�uence function I�x��<br />
4<br />
F �S� x� � � S�x� � �I�x� �<br />
Z<br />
�2S<br />
����I��� x�d� �4�<br />
Using an exponenti<strong>al</strong> in�uence function� we get<br />
F �S� x� �<br />
Z<br />
�2S<br />
jjx��jj2<br />
�<br />
����e 2 d� �5�<br />
The convolution surface is given by building an iso�<br />
surface F �S� x� � C.<br />
To get reasonable computation times� we used an<br />
in�uence function similar to the one we <strong>al</strong>ready used<br />
for the streamb<strong>al</strong>ls with discrete skeletons�<br />
I��� x� �<br />
and<br />
8<br />
���<br />
���<br />
af��� x� 3 � bf��� x� 2 �<br />
� cf��� x� � 1 � f��� x� � 1<br />
f��� x� �<br />
jjx � �jj2<br />
R 2<br />
0 � f��� x� � 1<br />
�6�<br />
�7�<br />
again with a� b� and c chosen to satisfy the conditions<br />
�3�.<br />
The objects generated in this way preserve <strong>al</strong>l useful<br />
properties of Blinn�s implicit surfaces.<br />
2.2.2 Continuous streamb<strong>al</strong>ls<br />
Convolution surfaces with continuous skeletons are a<br />
powerful tool for �ow visu<strong>al</strong>ization. They provide the<br />
ability to produce perfectly smooth surfaces around<br />
their skeletons.<br />
With the discrete streamb<strong>al</strong>ls� we used a set of par�<br />
ticle positions as a skeleton for an implicit surface.<br />
Now we use these points to construct a continuous<br />
skeleton which in turn generates the implicit surface.<br />
To represent a streamline� for example� we trace a<br />
particle <strong>al</strong>ong this streamline through sever<strong>al</strong> discrete<br />
time steps and connect the single particle positions to<br />
build the skeleton of the streamb<strong>al</strong>l. The resulting<br />
three�dimension<strong>al</strong> streamline gener<strong>al</strong>ly will be thin�<br />
ner and more regular than one produced by discrete<br />
streamb<strong>al</strong>ls using the same points as a skeleton.<br />
Stream surfaces again are constructed from a set of<br />
three�dimension<strong>al</strong> streamlines which are very close to<br />
each other �Figure 4�.<br />
Similarly� time surfaces are built of a number of<br />
three�dimension<strong>al</strong> timelines.
Figure 4� A stream surface produced by a rake of 100<br />
3D�streamlines in a �ow �eld containing a vortex.<br />
When time surfaces are traced through the �eld�<br />
speci<strong>al</strong> attention has to be paid to obstacles to prevent<br />
the time surfaces from being pulled �through� the ob�<br />
stacle. This problem can be overcome by controlling<br />
the length of the skeleton segments and dividing them<br />
if necessary.<br />
2.3 Mapping of loc<strong>al</strong> �eld parameters<br />
Streamb<strong>al</strong>ls o�er a variety of possibilities for the map�<br />
ping of loc<strong>al</strong> �eld parameters. Besides standard map�<br />
ping techniques� new mapping techniques based on the<br />
mathematic<strong>al</strong> representation of the streamb<strong>al</strong>ls can be<br />
applied.<br />
With discrete streamb<strong>al</strong>ls� for example� an easy<br />
method to map the v<strong>al</strong>ue of a loc<strong>al</strong> parameter <strong>al</strong>ong<br />
a streamline is to choose the radius of the in�uence<br />
functions of each skeleton point according to the pa�<br />
rameter�s v<strong>al</strong>ue at that point. The result is a three�<br />
dimension<strong>al</strong> streamline whose diameter corresponds to<br />
the magnitude of the parameter to map. In Figure 5<br />
we used this technique to map the velocity of the �ow.<br />
A similar method has been used for the upper layer<br />
of the streamb<strong>al</strong>ls shown in Figure 6. The radius of the<br />
in�uence function of these streamb<strong>al</strong>ls was increased<br />
at sever<strong>al</strong> discrete positions <strong>al</strong>ong the streamline. By<br />
choosing the distances of these positions dependent<br />
on the absolute v<strong>al</strong>ue of the velocity of the �eld� a<br />
good idea of this parameter�s v<strong>al</strong>ue <strong>al</strong>ong the stream�<br />
line is given. It can be seen clearly that velocity is<br />
lower in front of the obstacle and higher on the side<br />
of it. To increase the radius of the in�uence functions<br />
at certain positions� we just placed discrete stream�<br />
b<strong>al</strong>ls� each with a skeleton consisting of exactly one<br />
centerpoint� <strong>al</strong>ong the streamline.<br />
5<br />
Figure 5� Discrete streamb<strong>al</strong>ls in a �ow �eld contain�<br />
ing a vortex. Both radius and color show velocity.<br />
A di�erent method has been used to map the ve�<br />
locity on the surface of the lower layer of streamb<strong>al</strong>ls<br />
in Figure 6.<br />
Figure 6� Di�erent mapping methods using stream�<br />
b<strong>al</strong>ls.<br />
With this mapping technique loc<strong>al</strong> sc<strong>al</strong>ar parame�<br />
ters are mapped as roughness of the surface. For this�<br />
the amplitude of a three�dimension<strong>al</strong> oscillating func�<br />
tion F �x� is modulated by the v<strong>al</strong>ue of velocity. The<br />
potenti<strong>al</strong> function of the streamb<strong>al</strong>ls then is superim�<br />
posed by F �x�. For simplicity� we choose F to be<br />
F �x� � sin�f1x1�sin�f2x2�sin�f3x3�� �8�<br />
where the fi are �not necessarily di�erent� frequencies.<br />
As the described mapping techniques in�uence only<br />
the geometry of our streamb<strong>al</strong>ls� more common map�<br />
ping techniques� using e.g. materi<strong>al</strong> properties of the
surface� can be applied simultaneously. In <strong>al</strong>l our �g�<br />
ures we addition<strong>al</strong>ly used simple color mapping to de�<br />
pict velocity.<br />
The streamb<strong>al</strong>ls in the middle of Figure 6 show a<br />
di�erent color mapping method. The component of<br />
the velocity which describes the deviation of the �ow<br />
from the centr<strong>al</strong> axis is mapped as color spots on the<br />
surface of these streamb<strong>al</strong>ls. The density of the color<br />
spots depends on the absolute v<strong>al</strong>ue of the considered<br />
velocity component.<br />
Similar to a technique introduced by Hesselink and<br />
Delmarcelle �3�� continuous streamb<strong>al</strong>ls can be used for<br />
the representation of tensor data. For this purpose the<br />
skeleton is directed <strong>al</strong>ong a so�c<strong>al</strong>led hyperstreamline<br />
�a curve tangent to the main eigenvector of a tensor<br />
�eld�. At every point of the skeleton a loc<strong>al</strong> coordinate<br />
system ��1� �2� �3� is used with �1 tangent to the main<br />
eigenvector e1 at this point and �2 and �3 oriented in<br />
the directions of the two eigenvectors e2 and e3 which<br />
are perpendicular to the main eigenvector. Choosing<br />
the radius of the in�uence function in the directions<br />
of �2 and �3 corresponding to the absolute v<strong>al</strong>ues of<br />
the two eigenvectors e2 and e3� an asymmetric<strong>al</strong> in�u�<br />
ence function can be constructed. The resulting iso�<br />
surface will have an asymmetric<strong>al</strong> cross section with<br />
orientation and diameter dependent on the directions<br />
and eigenv<strong>al</strong>ues of these two eigenvectors. Using some<br />
mapping technique to show the eigenv<strong>al</strong>ue of the main<br />
eigenvector� it is possible to represent not only direc�<br />
tion� but even the magnitude of <strong>al</strong>l three eigenvectors<br />
at the same time.<br />
2.4 Rendering<br />
For rendering� the �eld function F �S� x� of the stream�<br />
b<strong>al</strong>ls is ev<strong>al</strong>uated on a regular grid. The isosurface<br />
F �S� x� � C is extracted from this grid by a simpli�ed<br />
marching cubes <strong>al</strong>gorithm� and the resulting triangles<br />
are rendered using Iris Explorer.<br />
The modi�ed marching cubes <strong>al</strong>gorithm processes<br />
the grid slice by slice� so only two slices have to be<br />
held in memory at one time �6�. As the polynomi<strong>al</strong> in�<br />
�uence functions �2� or �6� are used� each part of the<br />
skeleton has only a loc<strong>al</strong> in�uence on the �eld func�<br />
tion. Therefore� when computing the v<strong>al</strong>ues of the<br />
�eld function for a grid point x� F �S� x� has to be<br />
ev<strong>al</strong>uated only for those parts of the skeleton which<br />
are close enough to that grid point to in�uence the<br />
potenti<strong>al</strong> �eld at x. This greatly reduces computation<br />
costs.<br />
For high grid resolutions� as they may be neces�<br />
sary to see �ne details� the huge number of triangles<br />
generated by the marching cubes <strong>al</strong>gorithm is a con�<br />
6<br />
siderable drawback. For this reason we are working<br />
on a fast adaptive triangulation <strong>al</strong>gorithm� which will<br />
both reduce the number of �eld function ev<strong>al</strong>uations<br />
and the number of triangles produced.<br />
3 Summary<br />
The proposed technique proves to be useful for 3D �ow<br />
visu<strong>al</strong>ization in sever<strong>al</strong> ways�<br />
� The representation of streamlines� stream sur�<br />
faces and stream volumes as well as time surfaces<br />
is possible in a quite easy and natur<strong>al</strong> way.<br />
� Streamb<strong>al</strong>ls split or merge automatic<strong>al</strong>ly in areas<br />
of signi�cant divergence or convergence. V<strong>al</strong>u�<br />
able information on the �ow is given by the way<br />
in which the streamb<strong>al</strong>ls divide or blend in these<br />
cases.<br />
� Due to the underlying mathematic<strong>al</strong> representa�<br />
tion� streamb<strong>al</strong>ls provide powerful mapping pos�<br />
sibilities for �ow�related parameters. Hence� they<br />
are not only suited for the examination of vector<br />
�elds� but can even be used for the exploration of<br />
the complex structure of tensor �elds.<br />
� Streamb<strong>al</strong>ls can be applied even in cases of very<br />
complex �ow �elds.<br />
Acknowledgements<br />
The research for this project is funded by a grant of the<br />
�Stiftung Innovation f�ur Rheinland�Pf<strong>al</strong>z� awarded to<br />
the University of Kaiserslautern. Wladimir Djatschin<br />
is supported by the DAAD.<br />
Many thanks to Henrik Weimer for programming<br />
and helpful discussion.<br />
References<br />
�1� J. Blinn� A Gener<strong>al</strong>ization of Algebraic Surface<br />
Drawing� ACM Transactions on Graphics Vol. 1�<br />
No. 3� 1982� pp. 235�256<br />
�2� J. Bloomenth<strong>al</strong>� K. Shoemake� Convolution Sur�<br />
faces� Computer Graphics 25�4� 1991� pp. 251�<br />
256<br />
�3� T. Delmarcelle� L. Hesselink� Visu<strong>al</strong>ization of<br />
Second Order Tensor Fields and Matrix Data�<br />
Proceedings of Visu<strong>al</strong>ization �92� pp. 316�323
�4� J. L. Helman� L. Hesselink� Visu<strong>al</strong>izing Vector<br />
Field Topology in Fluid Flows� IEEE Computer<br />
Graphics � Applications �91� pp. 36�46<br />
�5� J. P. M. Hultquist� Constructing Stream Surfaces<br />
in Steady 3D Vector Fields� Proceedings of Visu�<br />
<strong>al</strong>ization �92� pp. 171�178<br />
�6� M. Matzat� R. H. van Lengen� Marching�Cube�<br />
Algorithmus zur Ober��achenrekonstruktion me�<br />
dizinischer Daten� Projektarbeit� Fachb. Infor�<br />
matik� Universit�at Kaiserslautern� 1994<br />
�7� F. H. Post� T. van W<strong>al</strong>sum� Fluid Flow Visu<strong>al</strong>iza�<br />
tion� Focus on Scienti�c Visu<strong>al</strong>ization� Springer�<br />
1993� pp. 1�40<br />
7<br />
�8� W. Schroeder� C. Volpe� W. Lorensen� The<br />
Stream Polygon� A Technique for 3D Vector Field<br />
Visu<strong>al</strong>ization� Proceedings of Visu<strong>al</strong>ization �91�<br />
pp. 126�132<br />
�9� J. J. van Wijk� Rendering Surface Particles� Pro�<br />
ceedings of Visu<strong>al</strong>ization �92� pp. 54�61<br />
�10� J. J. van Wijk� Implicit Stream Surfaces� Pro�<br />
ceedings of Visu<strong>al</strong>ization �93� pp. 245�252<br />
�11� G. Wyvill� C. McPheeters� B. Wyvill� Data<br />
structure for soft objects� The Visu<strong>al</strong> Computer<br />
1986�2�� pp. 227�234
Volume Rendering Methods for Computation<strong>al</strong> Fluid Dynamics Visu<strong>al</strong>ization<br />
David S. Eberty Roni Yagelz Jim Scottx Yair Kurzionz<br />
yComputer Science Department, University of Maryland B<strong>al</strong>timore County, B<strong>al</strong>timore, MD 21228 �<br />
zDepartment of Computer and Information Science, The Ohio State University, Columbus, Ohio 43210<br />
xDepartment of Aeronautic<strong>al</strong> and Astronautic<strong>al</strong> <strong>Engineering</strong>, The Ohio State University, Columbus, Ohio 43210<br />
Abstract<br />
This paper describes three <strong>al</strong>ternative volume rendering<br />
approaches to visu<strong>al</strong>izing computation<strong>al</strong> fluid dynamics<br />
(CFD) data. One new approach uses re<strong>al</strong>istic volumetric<br />
gas rendering techniques to produce photo-re<strong>al</strong>istic images<br />
and animationsfrom sc<strong>al</strong>ar CFD data. The second uses ray<br />
casting that is based on a simpler illuminationmodel and is<br />
mainly centered around a versatile new tool for the design<br />
of transfer functions. The third method employs a simple<br />
illumination model and rapid rendering mechanisms to<br />
provide efficient preview capabilities. These tools provide<br />
a large range of volume rendering capabilities to be used by<br />
the CFD explorer to render rapidly for navigation through<br />
the data, to emphasize data features (e.g., shock waves)<br />
with a specific transfer function, or to present a re<strong>al</strong>istic<br />
rendition of the model.<br />
1 Introduction<br />
This paper describes three <strong>al</strong>ternative approaches for<br />
volumetric visu<strong>al</strong>ization of CFD data. One new approach<br />
uses a re<strong>al</strong>istic surface and volumetric rendering and animation<br />
system which will <strong>al</strong>low scientists to obtain accurate<br />
photo-re<strong>al</strong>istic images and animations of their simulations,<br />
containing more information in a more comprehensible<br />
format than current tools available to the researchers. The<br />
second approach is based on ray casting without the modeling<br />
of self shadows. It is mainly intended to support the<br />
interactive design of transfer function. Currently this tool<br />
supports transfer function mapping voxel v<strong>al</strong>ue (density)<br />
and gradient to opacity and mapping of voxel v<strong>al</strong>ues to<br />
colors. The third approach is mainly intended for interactive<br />
preview of the data. It is based on an extended<br />
implementation of the template based ray casting [1] that<br />
supports screen and volume supersampling. To support<br />
interactivity, this renderer is based on a very simple illumi-<br />
� e-mail: ebert@cs.umbc.edu<br />
nation model. Combined, these tools are shown to provide<br />
effective visu<strong>al</strong>ization of sc<strong>al</strong>ar CFD data.<br />
1.1 Background and the state of CFD<br />
visu<strong>al</strong>ization<br />
Computation<strong>al</strong>fluid dynamics is an active research area.<br />
CFD research involves large three-dimension<strong>al</strong> volumes of<br />
data. The data from CFD simulations often contains many<br />
data v<strong>al</strong>ues per three-dimension<strong>al</strong> location (e.g., velocity,<br />
pressure, density, energy, temperature). Recently, scientific<br />
visu<strong>al</strong>ization systems have been developed to aid CFD<br />
researchers in the interpretation of these computation<strong>al</strong><br />
data sets, including commerci<strong>al</strong> systems such as Data Visu<strong>al</strong>izer,<br />
AVS, and Iris Explorer T M , and non-commerci<strong>al</strong><br />
systems such as FAST by NASA Ames Research Center.<br />
Techniques used in these systems include isosurface rendering,<br />
stream-lines, contour plots, and three-dimension<strong>al</strong><br />
volume visu<strong>al</strong>ization.<br />
Current visu<strong>al</strong>ization systems for CFD simulations are<br />
lacking in the following way:<br />
Many current systems fail to accurately display the entirety<br />
of the three-dimension<strong>al</strong> data from the CFD simulations.<br />
CFD simulations model three-dimension<strong>al</strong><br />
flow phenomena. Surface based rendering techniques,<br />
stream-lines, and contour plots can only capture a<br />
sm<strong>al</strong>l fraction of the data in a three-dimension<strong>al</strong> simulation,<br />
resulting in important information being hidden<br />
or not easily discernible in the resulting images. Volume<br />
visu<strong>al</strong>ization is an important tool for discerning<br />
three-dimension<strong>al</strong> data, especi<strong>al</strong>ly three-dimension<strong>al</strong><br />
sc<strong>al</strong>ar data. A comparison of Figures 1, 3 and Figure<br />
2 reve<strong>al</strong>s the quantity of information that can be lost<br />
in tradition<strong>al</strong> visu<strong>al</strong>ization systems. Figure 2 uses<br />
a standard ray-marching volume rendering <strong>al</strong>gorithm<br />
[2] to produce results similar to a isosurface renderer;<br />
whereas, Figure 1 uses our gaseous CFD visu<strong>al</strong>ization<br />
system and Figure 3 is rendered by our ray caster<br />
which employs a speci<strong>al</strong>ly designed opacity transfer<br />
function.
There has been some recent work on addressing some<br />
of these shortcomings. However, these systems only<br />
overcome some of the shortcomings of current CFD visu<strong>al</strong>ization<br />
systems. Surface particles [3], and a combination<br />
of volume rendering, vector fields, and texturing [4] have<br />
been used to capture the dynamics and massive information<br />
content in a CFD simulation.<br />
While visu<strong>al</strong>ization systems for CFD have concentrated<br />
on simple illumination and shading models, recent advances<br />
in computer graphics for re<strong>al</strong>istic rendering of gases<br />
and fluids have produced dramatic and near photo-re<strong>al</strong>istic<br />
images of water, steam, fog, and smoke [5, 6, 7, 8, 9]. These<br />
techniques use physic<strong>al</strong>ly-based rendering techniques to<br />
display these natur<strong>al</strong> phenomena re<strong>al</strong>istic<strong>al</strong>ly. These photore<strong>al</strong>istic<br />
rendering techniques can be incorporated into volume<br />
visu<strong>al</strong>ization to provide important perceptu<strong>al</strong> cues for<br />
comprehending complex three-dimension<strong>al</strong> data.<br />
Our systems for CFD visu<strong>al</strong>ization combine sever<strong>al</strong><br />
volume rendering techniques which provide the scientist<br />
with the option to trade time for image qu<strong>al</strong>ity. One<br />
technique employs a sophisticated illumination model to<br />
render our test data in approximately 83 seconds. The<br />
second technique simplifies illumination and emphasizes<br />
materi<strong>al</strong> modeling (via transfer functions) to render the<br />
data in approximately 64 seconds. The third technique<br />
is mainly intended for speedy rendering based on a basic<br />
illumination model and materi<strong>al</strong> modeling which produce<br />
an image in approximately 27 seconds. All reported times<br />
in this paper where taken on a HP 9000 Series Workstation<br />
model 735.<br />
1.2 Turbo-jet compressor visu<strong>al</strong>ization<br />
The development of advanced aerospace propulsionsystems<br />
relies heavily upon the management of critic<strong>al</strong> flow<br />
features which influence performance and operating characteristics.<br />
In order to understand the critic<strong>al</strong> flow behavior,<br />
numeric<strong>al</strong> simulation techniques must be used to complement<br />
experiment<strong>al</strong> studies. Among the propulsion system<br />
components in which some of the most complex flow behavior<br />
is encountered are the turbomachinery components.<br />
In the compressor, the flow may be entering a stage at a supersonic<br />
velocity in which case a complex system of shocks<br />
and expansion waves form through the blade passage. This<br />
system of shocks and expansions not only produce losses<br />
themselves, but <strong>al</strong>so contribute to other flow features which<br />
degrade performance. In order to control such flow features<br />
in a manner to optimize performance and minimize losses,<br />
numeric<strong>al</strong> solution of the time-dependent Navier-Stokes<br />
equations is necessary. Such solutions provide the velocity<br />
field, <strong>al</strong>ong with pressure, density and temperature variation<br />
in time and space through the compressor rotor blade<br />
passages. To understand the nature of these phenomena<br />
and their influence on performance, it is desirable to be<br />
able to have a visu<strong>al</strong> representation of the computed flow<br />
data which can be compared directly with experiment<strong>al</strong><br />
flow visu<strong>al</strong>ization. This type of data is particularly v<strong>al</strong>uable<br />
in the an<strong>al</strong>ysis of shock waves for which the tempor<strong>al</strong><br />
and spati<strong>al</strong> variation can have a significant impact on the<br />
mass flow rate of air passing through the compressor. The<br />
use of interactive visu<strong>al</strong>ization will provide the engineer a<br />
means of an<strong>al</strong>yzing the behavior of such critic<strong>al</strong> flow features<br />
as he controls the flow entering the compressor stage<br />
under investigation. Specific<strong>al</strong>ly, this represents control<br />
of the operating condition through interactive variation of<br />
the flow pressure, velocity, or temperature, <strong>al</strong>l of which<br />
influence performance characteristics. Other flow features<br />
which are of specific interest and play cruci<strong>al</strong> roles in the<br />
over<strong>al</strong>l performance and operation of turbomachinery devices<br />
include: vortices which form around the blade leading<br />
edges and <strong>al</strong>ong the corners at the blade - hub junction,<br />
and boundary layer growth and separation. The an<strong>al</strong>ysis<br />
of these features and their influence is <strong>al</strong>so significantly<br />
enhanced through the use of interactive flow visu<strong>al</strong>ization<br />
of the type demonstrated here.<br />
We have applied the three visu<strong>al</strong>ization techniques of<br />
our system to this problem of visu<strong>al</strong>izing the flow between<br />
two blades of the compressor of a turbo-jet engine [10].<br />
The computation<strong>al</strong> mesh for the simulation is a threedimension<strong>al</strong><br />
curvilinear grid with dimensions of 64 � 46 �<br />
18. For visu<strong>al</strong>ization purposes, the computation<strong>al</strong> grid<br />
was resampled to a rectilinear grid with dimensions of<br />
64 � 64 � 32.<br />
2 The gas visu<strong>al</strong>ization system<br />
Our gaseous visu<strong>al</strong>ization system demonstrates the benefits<br />
of re<strong>al</strong>istic volumetric rendering techniques for flow<br />
visu<strong>al</strong>ization.<br />
A more complete description of the system can be found<br />
in [5, 11]. The system has the following features:<br />
Fast combination of surface-based objects and volume<br />
data.<br />
Fast, accurate, physic<strong>al</strong>ly-based atmospheric attenuation<br />
and illumination models for low-<strong>al</strong>bedo gases.<br />
Fast volumetric shadowing <strong>al</strong>gorithm.<br />
The system is a hybrid surface and volume rendering<br />
system, which uses a fast scanline a-buffer rendering<br />
<strong>al</strong>gorithm for the surface-defined objects in the scene,<br />
while volume modeled objects are volume rendered. The<br />
<strong>al</strong>gorithm first creates the a-buffer for a scanline containing<br />
a list for each pixel of <strong>al</strong>l the fragments that parti<strong>al</strong>ly or
fully cover the pixel. Then, if a volume is active for a pixel,<br />
the extent of volume rendering needed is determined.<br />
The volume rendering is performed next, creating a-buffer<br />
fragments for the separate sections of the volumes. Volume<br />
rendering ceases once full coverage of the pixel by volume<br />
or surfaced-defined elements is achieved. Fin<strong>al</strong>ly, these<br />
volume a-buffer fragments are sorted into the a-buffer<br />
fragment list based on their average Z-depth v<strong>al</strong>ues and<br />
the a-buffer fragment list is rendered to produce the fin<strong>al</strong><br />
color of the pixel.<br />
The system supports volume rendering of both procedur<strong>al</strong><br />
and scientific data-defined volumes. The rendering<br />
techniques currently available in this system for volumes<br />
include gas-based rendering methods and tradition<strong>al</strong><br />
density-based volumetric rendering [2].<br />
2.1 Gaseous volume rendering <strong>al</strong>gorithm<br />
The volume rendering technique used for gases in this<br />
system is similar to the one discussed in [2]. The ray from<br />
the eye through the pixel is traced through the defining<br />
geometry of the volume. For each increment through the<br />
volume sections, the density is determined from the CFD<br />
data. The color, density, opacity, shadowing, and illumination<br />
of each sample is then c<strong>al</strong>culated. The illumination<br />
and densities are accumulated based on a low-<strong>al</strong>bedo illumination<br />
model for gases and atmospheric attenuation. The<br />
following <strong>al</strong>gorithm is the basic gas rendering <strong>al</strong>gorithm:<br />
for each section of gas<br />
for each increment <strong>al</strong>ong the ray<br />
get color, density, & opacity of<br />
this element<br />
if self_shadowing<br />
retrieve shadowing of this element<br />
from the solid shadow table<br />
color = c<strong>al</strong>culate gas illumination<br />
using opacity, density and the<br />
appropriate model<br />
fin<strong>al</strong>_color = fin<strong>al</strong>_color + color;<br />
sum_density =sum_density +density;<br />
if( transparency < 0.01)<br />
stop tracing<br />
increment sample_point<br />
create the a_buffer fragment<br />
In sampling <strong>al</strong>ong the ray, a Monte Carlo method is used<br />
to choose the sample point to reduce <strong>al</strong>iasing artifacts. In<br />
the gaseous model, we are approximating an integr<strong>al</strong> to c<strong>al</strong>culate<br />
the opacity <strong>al</strong>ong the ray [12]. Therefore, the opacity<br />
is the density obtained from ev<strong>al</strong>uating a volume density<br />
function multiplied by the step-size. The approximation<br />
used is<br />
opacity � 1 � e �� Ptfar ��x�t��y�t��z�t���t<br />
tnear<br />
where � is the optic<strong>al</strong> depth of the materi<strong>al</strong>, ��� is the<br />
density of the materi<strong>al</strong>, tnear is the starting point for the<br />
volume tracing, and tfar is the ending point. The fin<strong>al</strong><br />
increment <strong>al</strong>ong the ray may be sm<strong>al</strong>ler, so its opacity is<br />
sc<strong>al</strong>ed proportion<strong>al</strong>ly [13].<br />
The volume density functions interpolate the v<strong>al</strong>ues<br />
stored in the CFD grid and <strong>al</strong>low density sc<strong>al</strong>ars and<br />
power functions to be applied to enhance the visu<strong>al</strong>ization<br />
results. By applying a density sc<strong>al</strong>ar, more volumetric<br />
information can be seen. Applying a power function to the<br />
density <strong>al</strong>lows the contrast in change of the densities to be<br />
increased. The following function is used to achieve these<br />
results:<br />
power exponent<br />
density � �density � density sc<strong>al</strong>ar�<br />
2.2 Illumination <strong>al</strong>gorithm<br />
For the gaseous rendering, the following low-<strong>al</strong>bedo<br />
illumination model is used, where the phase-function is<br />
based on the summation of Henyey-Greenstein functions<br />
as described in [14]:<br />
B �<br />
where I is<br />
tfar X<br />
tnear<br />
e ���<br />
X<br />
i<br />
P t<br />
tnear<br />
��x�u��y�u��z�u���u � I �<br />
��x�t�� y�t�� z�t�� � �t�<br />
Ii�x�t�� y�t�� z�t��phase����<br />
P hase��� is the phase function, the function characterizing<br />
the tot<strong>al</strong> brightness of a particle as a function of the<br />
angle between the light and the eye [14]. Ii�x�t�� y�t�� z�t��<br />
is the amount of light from light source i reflected from<br />
this element.<br />
The system <strong>al</strong>so features a fast, accurate table-based<br />
volume shadowing technique [5] to increase the visu<strong>al</strong><br />
re<strong>al</strong>ism of the resulting images. The system can, therefore,<br />
accurately display three-dimension<strong>al</strong> gases and the<br />
shadows they cast.<br />
2.3 Results for gaseous rendering<br />
A comparison of the results achievable through the<br />
three-dimension<strong>al</strong> gas rendering of our system and more<br />
tradition<strong>al</strong> volumetric rendering techniques can be seen in<br />
Figures 1 and 2. Both figures show the visu<strong>al</strong>ization of the
static pressure for the computation, illuminated with two<br />
light sources. Figure 1 shows the data visu<strong>al</strong>ized using the<br />
gaseous volumetric rendering techniques. Figure 2 shows<br />
the results achievable using more tradition<strong>al</strong> volumetric<br />
rendering techniques, where the gradient of the change in<br />
the data is used to imply surfaces and a tradition<strong>al</strong> Phong<br />
surface illumination model is used. Figure 2 is lacking<br />
in sever<strong>al</strong> respects. First, the lack of shadowing makes<br />
the understanding of the image more difficult. Second, the<br />
implied surfaces obscure the details of the flow data within.<br />
Third, addition<strong>al</strong> flow detail is lost because of the sm<strong>al</strong>l<br />
degree of change in the v<strong>al</strong>ues in the data. In contrast, notice<br />
the details in the changes in the pressure that can be seen in<br />
Figure 1. Also notice the depth of information that can be<br />
discerned in this image. The image uses self-shadowing of<br />
the volume data, as well as shadowing of the volume onto<br />
the w<strong>al</strong>ls to increase the understandability of the data. As<br />
you can see, much more of the three-dimension<strong>al</strong> flow can<br />
be seen using our gas visu<strong>al</strong>ization technique.<br />
The advantages of the gas visu<strong>al</strong>ization prototype system<br />
can be clearly seen from comparing these two images.<br />
These images were computed at a resolution of 512�341<br />
and took 83 seconds each to compute. Lower resolution<br />
images can be combined with rendering optimizations and<br />
more powerful graphics workstations to achieve interactivity<br />
of the visu<strong>al</strong>izations.<br />
Figure 5 shows the flexibility of the system for visu<strong>al</strong>ization.<br />
This figure contains 9 images with varying density<br />
sc<strong>al</strong>ing and power exponent v<strong>al</strong>ues used in the visu<strong>al</strong>ization.<br />
The following table has the parameter v<strong>al</strong>ues for each<br />
image in the figure (image 1 is the top-left image, image 9<br />
is the bottom-right image).<br />
Image Density Sc<strong>al</strong>ar Exponent<br />
1 1.0 3.0<br />
2 1.0 1.84<br />
3 1.0 0.98<br />
4 0.91 3.0<br />
5 0.91 1.84<br />
6 0.91 0.98<br />
7 0.73 3.0<br />
8 0.73 1.84<br />
9 0.73 0.98<br />
From left to right in the image, the power exponent is<br />
decreased, increasing the density of the data. From top to<br />
bottom, the density sc<strong>al</strong>ing factor is decreased, increasing<br />
the transparency of the flow.<br />
This sequence of images demonstrates how the variation<br />
of transparency/opacity can be used to investigate the<br />
spati<strong>al</strong> gradients of a particular flow quantity. In this<br />
case, the static pressure varies significantly throughout the<br />
flowfield and among the critic<strong>al</strong> flow features. The most<br />
critic<strong>al</strong> flow features, which arise as gradients in the static<br />
pressure, are shock and expansion waves. These waves<br />
appear as abrupt changes or nearly discontinuous changes<br />
in the static pressure. In the sequence of renderings shown<br />
here, the shock can be seen as the abrupt change from blue<br />
to white <strong>al</strong>ong the vertic<strong>al</strong> part of what appears as a cutout<br />
region on the left hand side of the image. Once again, the<br />
shock is caused by the turning of the flow as it enters the<br />
blade passage. It is readily apparent that the strength of the<br />
shock varies significantly across the flowfield or <strong>al</strong>ong the<br />
blade leading edge (the blade’s geometry-angle thickness<br />
and twist vary in the radi<strong>al</strong> direction from hub to tip). This<br />
sequence <strong>al</strong>lows the viewer to look into the flowfield and<br />
see where the most intense or sharpest gradients exist and<br />
what their influence is on the subsequent (downstream)<br />
flow. In this figure, the greatest pressure gradient exists<br />
at the region which appears as the cutout in the upper left<br />
hand region of the flowfield just after the flow enters the<br />
blade passage. This is indicative of the greatest shock<br />
strength. Examination of the successive images across and<br />
down the figure reve<strong>al</strong>s that the shock strength decreases<br />
as it approaches the adjacent blade surface. This sequence<br />
<strong>al</strong>so gives an indication of the three-dimension<strong>al</strong>ity of<br />
the shock geometry and shock strength which can have a<br />
significant influence on the operating characteristics of the<br />
compressor. Such an<strong>al</strong>ysis is especi<strong>al</strong>ly v<strong>al</strong>uable when it is<br />
incorporated into animations which will provide a means<br />
of an<strong>al</strong>yzing the time variation as well.<br />
3 The ray caster<br />
This renderer is a ray caster that is equipped with<br />
a versatile new mechanism for the design of color and<br />
opacity transfer functions. These are interactively defined<br />
by the user prior to rendering.<br />
Processing commences with some initi<strong>al</strong>ization computations.<br />
We start by computing the norm<strong>al</strong> vector at<br />
each voxel. Unlike tradition<strong>al</strong> 6-neighborhood centr<strong>al</strong><br />
difference based gradient c<strong>al</strong>culation, our computation<br />
considers <strong>al</strong>l 26 neighbors, attenuating by p 2 the 18neighbors<br />
and by p 3 the 26-neighbors. The norm<strong>al</strong> vector<br />
�Nx� Ny� Nz� p is used in shading and its magnitude<br />
r � Nx 2 � Nx 2 � Nx 2 , is utilized to index our 2D<br />
opacity transfer function. We c<strong>al</strong>culate the magnitude of<br />
the gradient at each voxel location and store them in a 3D<br />
byte array of the same size as the origin<strong>al</strong> data set.<br />
Given a data set and light source information, we duplicate<br />
the origin<strong>al</strong> data set and shade the newly generated<br />
one. We apply diffuse lighting on the data set using the<br />
computed norm<strong>al</strong> at each voxel �Nx� Ny� Nz� and the<br />
raw densities as intensity v<strong>al</strong>ues �. Given m light sources<br />
located at direction Li � �lxi� lyi� lzi�� i � 1� � � � � m,
we set the shaded voxel intensity S to:<br />
S �<br />
mX<br />
i�1<br />
� � �lxi � Nx � lyi � Ny � lzi � Nz � 1��2<br />
which is simply the intensity times cosine the angle between<br />
Li and N (norm<strong>al</strong>ized to the range �0� 1�). Note that we<br />
assume that <strong>al</strong>l light sources have intensity 1.<br />
These preliminary c<strong>al</strong>culations require two addition<strong>al</strong><br />
memory banks the size of the origin<strong>al</strong> data set for storing the<br />
shaded data set and the gradient information. Alternatively,<br />
these computations can be performed on-the-fly, which<br />
will save the need for the extra storage and <strong>al</strong>low viewdependent<br />
light effects such as specular light. Once this<br />
initi<strong>al</strong>ization is completed, the data is ready for rendering.<br />
The ray caster traverses image space. For each subsample<br />
a ray is shot. Along the ray, at user controlled distances<br />
�t, a trilinearilyinterpolated sample is taken in each<br />
of the three datasets at the sample points x�t�� y�t�� z�t�.<br />
These sampled v<strong>al</strong>ues participate in the illumination c<strong>al</strong>culation<br />
to produce the fin<strong>al</strong> intensity for that sample point,<br />
as described in the next section. After <strong>al</strong>l the samples <strong>al</strong>ong<br />
a ray are collected and composited, the compositing buffer<br />
contains a floating point number representing the intensity<br />
at the corresponding image sub-sample. When <strong>al</strong>l image<br />
rays are shot, the fin<strong>al</strong> image is derived by averaging <strong>al</strong>l<br />
sub-samples in a pixel and transforming the floating point<br />
intensities into the integer range [0,255].<br />
The ray caster is equipped with an interactive tool, as<br />
well as an interpreter that can be used to build 1D and 2D<br />
transfer functions. The language supported by this simple<br />
modeler contains various boolean operators (min, max,<br />
add, subtract, etc.) between sever<strong>al</strong> 1D and 2D linear and<br />
exponenti<strong>al</strong> primitives. Using this tool, the user can define<br />
such transfer functions as threshold rendering, iso-v<strong>al</strong>ue<br />
rendering, gradient emphasis by opacity and so on. The<br />
user defined transfer functions are ev<strong>al</strong>uated and converted<br />
into 1D and 2D tables that are used by the renderer as color<br />
and opacity lookup tables. These tables are indexed by<br />
raw voxel v<strong>al</strong>ue, gradient magnitude, and the like, as we<br />
describe in the next section.<br />
3.1 Illumination <strong>al</strong>gorithm<br />
Our illumination procedure takes as input a dataset<br />
consisting of one byte per voxel intensity and is capable<br />
of generating one or three band images. Each band in the<br />
image has a pair of transfer functions associated with it:<br />
1. Voxel v<strong>al</strong>ue to intensity transfer function which maps<br />
origin<strong>al</strong> intensities to desired ones (implemented as a<br />
1D lookup table).<br />
2. Voxel v<strong>al</strong>ue and gradient to opacity which sets the<br />
transparency of each voxel during the ray casting<br />
process (implemented as a 2D lookup table).<br />
Given a sample triple ��� S� r�, where � is the raw<br />
intensity, S is the shaded intensity, and r is the gradient,<br />
<strong>al</strong>l sampled at x�t�� y�t�� z�t�, we c<strong>al</strong>culate two new v<strong>al</strong>ues<br />
for each color band �: ��, the transparency v<strong>al</strong>ue and ���,<br />
the intensity v<strong>al</strong>ue:<br />
�� � T F 2D�r� ��<br />
��� � T F 1D�S�<br />
where TF are 1D and 2D transfer functions designed by<br />
the user. Although we currently use the above 1D and 2D<br />
functions, the same mechanism we developed can be used<br />
to function<strong>al</strong>ly bind reflectivity to gradient, for example,<br />
and to develop transfer function of higher dimension<strong>al</strong>ity.<br />
The compositing scratchpad consists of a pair �I�� O��<br />
of float numbers, where I� stands for intensity and O� for<br />
opacity (in each color band �). Compositing of ���� ����<br />
onto the compositing scratchpad is performed as follows :<br />
I� � I� � I� � �� � O�<br />
O� � O� � �1 � ���<br />
After we composite a ray, I� contains the fin<strong>al</strong> pixel<br />
intensity.<br />
3.2 Results for the ray caster<br />
The dataset was shaded in 5 seconds and gradient<br />
c<strong>al</strong>culation took 5 addition<strong>al</strong> seconds. Rendering time for<br />
<strong>al</strong>l images (256 2 resolution) is 35 seconds when one ray<br />
is traced from each pixel. The transfer function used for<br />
rendering Figure 3 was<br />
T F 1D�S� � S �<br />
T F 2D�r� �� � �r � �� �<br />
In Figure 3a we assigned � � 0�3 and � � 1�1. In Figure 3b<br />
we assigned � � 0�3 and � � 0�5.<br />
Figure 3 shows a typic<strong>al</strong> rendering of the flowfield static<br />
pressure generated using the computed Navier-Stokes flowfield<br />
data between two adjacent compressor rotor blades.<br />
In this figure, the flowfield is oriented such that the flow<br />
is entering the blade passage from the left and proceeds<br />
to the right and out the back of the page as it exits the<br />
blade passage. It should be noted that the data set used<br />
in this rendering has been truncated in the vicinity of the<br />
blade trailing edge or in the region where the flow leaves<br />
the blade passage. The specific transfer function used in<br />
this rendering reve<strong>al</strong>s various regions in the flow in which
large gradients exist. These are the regions in which abrupt<br />
changes are present. Specific<strong>al</strong>ly, the rapid change from<br />
dark to light near the left hand boundary appears to capture<br />
the gener<strong>al</strong> shape of the shock wave produced as the<br />
supersonic flow is turned when it enters the blade passage.<br />
As the flow proceeds toward the exit, the variation in the<br />
shading <strong>al</strong>ong the boundaries bounded by solid surfaces<br />
might be associated with the presence of the boundary layer<br />
<strong>al</strong>ong the solid surfaces. However, there are other flow<br />
quantities, such as velocity, which will reve<strong>al</strong> much more<br />
of the detail of the boundary layer behavior, including its<br />
growth and separation.<br />
In the vicinity of the blade trailing edge, there appears to<br />
be a region of separated flow which may well be associated<br />
with the important phenomena of vortex shedding and<br />
interaction. These flow features have been subjected to<br />
a preliminary examination using an interactive animation<br />
procedure to look at the three-dimension<strong>al</strong> nature of their<br />
behavior at a single instant in time. The extension of<br />
the three-dimension<strong>al</strong> rendering procedure to include the<br />
tempor<strong>al</strong> variation will provide even greater detail which<br />
will be of v<strong>al</strong>ue in understanding these flow features.<br />
4 Template-based rendering<br />
In par<strong>al</strong>lel viewing, where the observer is placed at<br />
infinity, <strong>al</strong>l rays have exactly the same form. Therefore,<br />
there is no need to reactivate a line <strong>al</strong>gorithm for each ray.<br />
Instead, we compute the form of the ray once and store it<br />
in a data structure c<strong>al</strong>led a ray-template. All rays can then<br />
be generated by following the ray template. This approach<br />
has great advantages both in terms of performance and in<br />
terms of accuracy, as we show later.<br />
The rays, however, differ in the appropriate portion of<br />
the template that should be repeated. We choose a plane,<br />
par<strong>al</strong>lel to one of the volume faces, to serve as a base-plane<br />
for the template placement. The image is computed by<br />
sliding the template <strong>al</strong>ong that plane, emitting a ray at each<br />
of its pixels. This placement guarantees a complete and<br />
uniform tessellation of the volume by 26-rays.<br />
The proposed <strong>al</strong>gorithm is composed of three phases:<br />
initi<strong>al</strong>ization, ray casting, and 2D mapping. In the first<br />
phase, the base-plane is computed and a template in the<br />
viewing direction is constructed. In the second phase, a<br />
ray is traversed from each pixel inside the image extent by<br />
repeating the sequence of steps stored in the ray template.<br />
In the last phase, the projected image is mapped from<br />
the base-plane onto the screen-plane by employing a 2D<br />
image transformation. The proposed <strong>al</strong>gorithm guarantees<br />
uniform sampling and is based on simple c<strong>al</strong>culations that<br />
form the basis for an extremely efficient implementation.<br />
We now turn to describe, in more detail, each of the<br />
<strong>al</strong>gorithm’s three phases.<br />
The basic <strong>al</strong>gorithm can be slightly modified to support<br />
multiple rays emitted from the same pixel, but from different<br />
sub-pixel addresses [15]. Instead of having one type<br />
of ray (i.e., one template), we now have sever<strong>al</strong> templates,<br />
one for each relative position of the ray-origin in a pixel.<br />
For example, if we want a supersampling rate of four rays<br />
per pixel, for the pixel at coordinate �i� j�, these four rays<br />
will originate from �i � 1�4� j � 1�4�. We observe that for<br />
<strong>al</strong>l �i� j� the rays �i � 1�4� j � 1�4� have the same form.<br />
Therefore we need only four different templates - one for<br />
each relative displacement from the pixel origin.<br />
The template-based <strong>al</strong>gorithm can <strong>al</strong>so be modified to<br />
efficiently support multiple samples per voxel [15]. If we<br />
assume that rays are emitted from the centers of the pixels<br />
in a plane that is par<strong>al</strong>lel to one of the volume faces (such<br />
as the base-plane), then <strong>al</strong>l these sample points are in the<br />
same relative position inside the voxel; that is, they have<br />
exactly the same set of distances to the eight corners of<br />
the voxel. Therefore, we can employ a continuous line<br />
<strong>al</strong>gorithm to generate a template of floating point steps.<br />
For each sample point, we can pre-compute the weight<br />
to be assigned to each of the voxel v<strong>al</strong>ues participating<br />
in the sampling operation. This will save the need to<br />
compute, for each sample, the weights of <strong>al</strong>l eight voxel<br />
v<strong>al</strong>ues participating in the trilinear interpolation. This<br />
template based ray casting <strong>al</strong>gorithm uses very few (eight,<br />
on the average) integer additions per sample, instead of the<br />
naive implementation which requires tens of floating-point<br />
additions and multiplications.<br />
4.1 Illumination <strong>al</strong>gorithm<br />
To benefit from the template <strong>al</strong>gorithm, illumination<br />
capabilities were kept to a minimum. Illumination is based<br />
on the Phong illumination model with one light source.<br />
Samples are shaded on-the-fly and <strong>al</strong>l samples <strong>al</strong>ong a ray<br />
are increment<strong>al</strong>ly composited. The ray stops when a user<br />
defined opacity threshold is reached. Transfer function<br />
for color assignment to raw voxel v<strong>al</strong>ue is a simple linear<br />
p<strong>al</strong>ette of grey (i.e., ��� � �). Transfer function for<br />
opacity assignment is <strong>al</strong>so a simple linear p<strong>al</strong>ette assigning<br />
�� � ��6 so that the rays would accumulate less opacity<br />
and will not stop in one or two steps. Norm<strong>al</strong> is c<strong>al</strong>culated<br />
by centr<strong>al</strong> difference in a 6-neighborhood. Shading includes<br />
ambient, diffuse, and specular shading.<br />
4.2 Results for the template-based rendering<br />
The gas images shown in Figure 4 were generated<br />
by an adaptive variation of the ray template <strong>al</strong>gorithm.<br />
This approach renders the empty space using one template
(discrete) and another template at the region of the data<br />
v<strong>al</strong>ues. In this area, samples are taken at �t � 0�7.<br />
The generation of this 140 2 resolution image, took 3.01<br />
seconds for one ray per-pixel, which is approximately 3<br />
times faster than the previous <strong>al</strong>gorithm. Supersampling<br />
increases rendering time linearly (e.g., 4-rays per pixel<br />
takes 12.1 seconds). At �t � 0�3, the image is rendered<br />
in 4.11 seconds.<br />
5 Future extensions<br />
There are sever<strong>al</strong> extensions that can be made to the<br />
current system. First of <strong>al</strong>l, further optimizations of the<br />
rendering <strong>al</strong>gorithms are being explored by the authors to<br />
increase the performance of the system.<br />
Second, we are developing techniques to support the<br />
visu<strong>al</strong>ization of unstructured, multi-level, and adaptive<br />
grid data [16]. The current system will only <strong>al</strong>low the<br />
display of structured (rectilinear) grid data. Note that<br />
illumination models and transfer function design are the<br />
same for <strong>al</strong>l types of grids, only stepping <strong>al</strong>ong the ray<br />
and sampling methods change. Techniques have been<br />
developed to resample structured and unstructured grid<br />
data to a rectilinear grid for visu<strong>al</strong>ization; however, this<br />
step may introduce <strong>al</strong>iasing artifacts into the resulting<br />
images. Resampling unstructured or multi-resolution data<br />
is <strong>al</strong>so too time consuming to be done in an interactive<br />
system. For instance, resampling the curvilinear grid data<br />
used in Figures 1 and 2 took sever<strong>al</strong> minutes. Direct<br />
support for unstructured grids and multi-level solution of<br />
adaptive grids is needed. The use of adaptive, multidimension<strong>al</strong>,<br />
and unstructured grids has increased greatly<br />
in the recent past [17, 18]. These grid structures <strong>al</strong>low<br />
for better utilization of computation<strong>al</strong> power during the<br />
CFD simulations and need to be supported in an interactive<br />
visu<strong>al</strong>ization system. We plan to explore incorporating<br />
and enhancing these recent <strong>al</strong>gorithms for unstructured<br />
grids into our visu<strong>al</strong>ization system. We will <strong>al</strong>so develop<br />
<strong>al</strong>gorithms for the direct support of multi-level grids and<br />
multi-level solution of adaptive grids.<br />
Fin<strong>al</strong>ly, a graphic<strong>al</strong> user-interface for the visu<strong>al</strong>ization<br />
system needs to be developed to increase the usability<br />
and interactivity of the system. A significant part of this<br />
task involves the development of the interface between the<br />
computation<strong>al</strong> model and the visu<strong>al</strong>ization system to <strong>al</strong>low<br />
direct interaction with the computations to aid debugging.<br />
6 Conclusion<br />
We have described and compared three new efficient<br />
volume rendering techniques for flow visu<strong>al</strong>ization and<br />
demonstrated their v<strong>al</strong>ue for visu<strong>al</strong>izing the flow between<br />
two blades of a turbo-jet compressor. As can be seen<br />
from the resulting images in this paper, these techniques<br />
provide higher qu<strong>al</strong>ity images than most CFD visu<strong>al</strong>ization<br />
systems. Combining these techniques in a single system<br />
can provide CFD researchers with a powerful visu<strong>al</strong>ization<br />
system. With these tools, researchers can see photore<strong>al</strong>istic<br />
images of their flows for detailed an<strong>al</strong>ysis and <strong>al</strong>so<br />
produce high-qu<strong>al</strong>ity images at interactive rates for testing<br />
and debugging of the computation<strong>al</strong> model.<br />
While the renderings we generated of the static pressure<br />
provide a good representation of flow features caused<br />
by pressure gradients, numerous other flow quantities will<br />
provide even better representations of other significant flow<br />
features. Thus, these renderings represent a significant step<br />
in the development of an important, enabling technology<br />
for the an<strong>al</strong>ysis of complex flow phenomena encountered<br />
in advanced aerospace propulsion systems as well as a wide<br />
range of other CFD visu<strong>al</strong>ization applications.<br />
References<br />
[1] R. Yagel and A. Kaufman, ‘‘Template-Based Volume<br />
Viewing,’’ Computer Graphics Forum, vol. 11,<br />
pp. 153--157, September 1992.<br />
[2] K. Perlin and E. Hoffert, ‘‘Hypertexture. Proceedings<br />
of SIGGRAPH’89,’’ in Computer Graphics 23,3,<br />
pp. 253--262, July 1989.<br />
[3] J. J. van Wijk, ‘‘Flow visu<strong>al</strong>ization with surface particles,’’<br />
IEEE Computer Graphics and Applications,<br />
vol. 13, pp. 18--24, July 1993.<br />
[4] N. Max, R. Crawfis, and D. Williams, ‘‘Visu<strong>al</strong>ization<br />
for climate modeling,’’ IEEE Computer Graphics<br />
and Applications, vol. 13, pp. 18--24, July 1993.<br />
[5] D. Ebert and R. Parent, ‘‘Rendering and animation of<br />
gaseous phenomena by combining fast volume and<br />
scanline A-buffer techniques. Proceedings of SIG-<br />
GRAPH’90,’’ in Computer Graphics 24,4, pp. 357--<br />
366, August 1990.<br />
[6] D. Ebert, W. Carlson, and R. Parent, ‘‘Solid spaces<br />
and inverse particle systems for controlling the animation<br />
of gases and fluids,’’ The Visu<strong>al</strong> Computer,<br />
vol. 10, no. 4, pp. 179--190, 1994.<br />
[7] M. Kass and G. Miller, ‘‘Rapid, stable fluid dynamics<br />
for computer graphics. Proceedings of SIG-<br />
GRAPH’90,’’ in Computer Graphics 24,4, pp. 49--<br />
58, August 1990.
[8] G. Gardner, ‘‘Forest fire simulation,’’ in Computer<br />
Graphics (SIGGRAPH ’90 Proceedings) (F. Baskett,<br />
ed.), vol. 24, p. 430, Aug. 1990.<br />
[9] H. Rushmeier and K. Torrance, ‘‘The zon<strong>al</strong> method<br />
for c<strong>al</strong>culating light intensities in the presence of a participating<br />
medium. Proceedings of SIGGRAPH’87,’’<br />
in Computer Graphics 21,4, pp. 293--302, July 1987.<br />
[10] J. Scott and W. L. Hankey, ‘‘Navier-stokes solutions<br />
of unsteady flow in a compressor rotor,’’ ASME<br />
Journ<strong>al</strong> of Turbo Machinery, vol. 108, pp. 206--215,<br />
October 1986.<br />
[11] D. S. Ebert, Solid Spaces: A Unified Approach to<br />
Describing Object Attributes. PhD thesis, The Ohio<br />
State University, 1991.<br />
[12] J. Kajiya and B. Von Herzen, ‘‘Ray tracing volume<br />
densities. Proceedings of SIGGRAPH’84,’’ in<br />
Computer Graphics 18,3, pp. 165--174, July 1984.<br />
[13] J. Kajiya and T. Kay, ‘‘Rendering fur with three dimension<strong>al</strong><br />
textures. Proceedings of SIGGRAPH’89,’’<br />
in Computer Graphics 23,3, pp. 271--280, July 1989.<br />
[14] J. Blinn, ‘‘Light reflection functions for simulation<br />
of clouds and dusty surfaces. Proceedings of SIG-<br />
GRAPH’82,’’ in Computer Graphics 16,3, pp. 21--<br />
29, July 1982.<br />
[15] R. Yagel, ‘‘High qu<strong>al</strong>ity template-based volume<br />
viewing,’’ Tech. Rep. OSU-CISRC-10/92-TR28, Department<br />
of Computer and Information Science, The<br />
Ohio State University, 2036 Neil Ave, Columbus,<br />
Ohio 43210-1277, October 1992.<br />
[16] R. Yagel, ‘‘Volume rendering polyhedr<strong>al</strong> grids by increment<strong>al</strong><br />
slicing,’’ Tech. Rep. OSU-CISRC-10/93-<br />
TR35, Department of Computer and Information Science,<br />
The Ohio State University, 2036 Neil Ave,<br />
Columbus, Ohio 43210-1277, October 1993.<br />
[17] H. Neeman, ‘‘A decomposition <strong>al</strong>gorithm for visu<strong>al</strong>izing<br />
irregular grids,’’ in Computer Graphics (San<br />
Diego Workshop on Volume Visu<strong>al</strong>ization), vol. 24,<br />
pp. 49--56, Nov. 1990.<br />
[18] M. P. Garrity, ‘‘Raytracing irregular volume data,’’ in<br />
Computer Graphics (San Diego Workshop on Volume<br />
Visu<strong>al</strong>ization), vol. 24, pp. 35--40, Nov. 1990.
Figure 1: Gas Rendering of static pressure. Figure 2: Tradition<strong>al</strong> isosurface volume<br />
rendering of static pressure.<br />
Figure 3: Changing opacity transfer function<br />
to emphasize gradient<br />
Figure 4: Adaptive template−based rendering<br />
Figure 5: Varying density sc<strong>al</strong>ing and power exponent v<strong>al</strong>ues.
Abstract<br />
Line Integr<strong>al</strong> Convolution (LIC), introduced by Cabr<strong>al</strong><br />
and Leedom in Siggraph '93, is a powerful technique for<br />
imaging and animating vector fields. We extend the LIC<br />
paradigm in three ways:<br />
1. The existing technique is limited to vector fields over<br />
a regular Cartesian grid. We extend it to vector fields over<br />
parametric surfaces, specific<strong>al</strong>ly those found in curvilinear<br />
grids, used in computation<strong>al</strong> fluid dynamics simulations.<br />
2. Periodic motion filters can be used to animate the flow<br />
visu<strong>al</strong>ization. When the flow lies on a parametric surface,<br />
however, the motion appears misleading. We explain why<br />
this problem arises and show how to adjust the LIC<br />
<strong>al</strong>gorithm to handle it.<br />
3. We introduce a technique to visu<strong>al</strong>ize vector<br />
magnitude as well as vector direction. Cabr<strong>al</strong> and Leedom<br />
have suggested a method for variable-speed animation,<br />
which is based on varying the frequency of the filter<br />
function. We develop a different technique based on kernel<br />
phase shifts which we have found to show substanti<strong>al</strong>ly<br />
better results.<br />
Our implementation of these <strong>al</strong>gorithms utilizes texturemapping<br />
hardware to run in re<strong>al</strong> time, which <strong>al</strong>lows them to<br />
be included in interactive applications.<br />
1. Introduction<br />
Visu<strong>al</strong>izing Flow Over Curvilinear Grid Surfaces<br />
Using Line Integr<strong>al</strong> Convolution<br />
Lisa K. Forssell<br />
Computer Sciences Corporation, NASA Ames Research Center<br />
and Stanford University<br />
lisaf@cs.stanford.edu<br />
Providing an effective visu<strong>al</strong>ization of a vector field is<br />
a ch<strong>al</strong>lenging problem. Large vector fields, vector fields<br />
with wide dynamic ranges in magnitude, and vector fields<br />
representing turbulent flows can be difficult to visu<strong>al</strong>ize<br />
effectively using common techniques such as drawing<br />
arrows or other icons at each data point, or drawing<br />
streamlines[2]. Drawing arrows of length proportion<strong>al</strong> to<br />
vector magnitude at every data point can produce cluttered<br />
and confusing images. In areas of turbulence, arrows and<br />
streamlines can be difficult to interpret.<br />
Various techniques have been developed which attempt<br />
to address some of these problems. Max, Becker, and<br />
Crawfis[13], Ma and Smith[12], and Max, Crawfis, and<br />
Williams[14] have implemented systems which advect<br />
clouds, smoke, and flow volumes. These techniques show<br />
the flow on a coarse level but do not highlight finer details.<br />
Hin and Post[11] and van Wijk[16] have visu<strong>al</strong>ized flows<br />
with particle-based techniques, which show loc<strong>al</strong> aspects of<br />
the flow. Bryson and Levit [4] have used an immersive<br />
virtu<strong>al</strong> environment for the exploration of flows. Helman<br />
and Hesselink[10] have generated representations of the<br />
vector field topology, which use glyphs to show critic<strong>al</strong><br />
points in the flow.<br />
In this paper we discuss a new technique for visu<strong>al</strong>izing<br />
vector fields which provides an attractive <strong>al</strong>ternative to<br />
existing techniques. Our technique makes use of Line<br />
Integr<strong>al</strong> Convolution (LIC)[5], which is a powerful<br />
technique for imaging and animating vector fields. The<br />
image of a vector field produced with LIC is a dense display<br />
of information, and flow features on the surface are clearly<br />
evident.<br />
The LIC <strong>al</strong>gorithm as presented by Cabr<strong>al</strong> and Leedom<br />
in [5] is applicable only to vector fields over regular 2dimension<strong>al</strong><br />
Cartesian grids. However, the grids used in<br />
computation<strong>al</strong> fluid dynamics simulations are often<br />
curvilinear. In this paper we show how to extend the LIC<br />
<strong>al</strong>gorithm to visu<strong>al</strong>ize vector fields over parametric surfaces.<br />
Thus, for example, our extended <strong>al</strong>gorithm <strong>al</strong>lows us to<br />
visu<strong>al</strong>ize the flow over the surface of an aircraft or turbine.<br />
In the origin<strong>al</strong> work on LIC, a technique for animation<br />
of vector field visu<strong>al</strong>izations is presented. Our work extends<br />
this animation technique to apply to the parametric surfaces<br />
found in curvilinear grids as well.<br />
Lastly, we present a new technique for displaying<br />
vector magnitude which can be applied to both 2dimension<strong>al</strong><br />
regular grids and parametric surfaces. Our<br />
method varies the speed of the flow animation to give an<br />
intuitive representation of vector magnitude.<br />
In the next section we discuss the basic LIC <strong>al</strong>gorithm.<br />
In section 3 we describe our extension to curvilinear<br />
surfaces. In section 4, we discuss the implementation of<br />
animation for curvilinear grid surfaces. In section 5, we<br />
introduce our technique for displaying vector magnitude. In<br />
section 6, we describe our implementation of <strong>al</strong>l the<br />
<strong>al</strong>gorithms in the paper. We conclude with a brief discussion<br />
of directions for further applications of the LIC <strong>al</strong>gorithm in<br />
vector field visu<strong>al</strong>ization.
2. Background<br />
The Line Integr<strong>al</strong> Convolution (LIC) <strong>al</strong>gorithm takes as<br />
input a vector field lying on a Cartesian grid and a texture<br />
bitmap of the same dimensions as the grid, and outputs an<br />
image wherein the texture has been “loc<strong>al</strong>ly blurred”<br />
according to the vector field. There is a one-to-one<br />
correspondence between grid cells in the vector field, and<br />
pixels in the input and output image. Each pixel in the output<br />
image is determined by the one-dimension<strong>al</strong> convolution of<br />
a filter kernel and the texture pixels <strong>al</strong>ong the loc<strong>al</strong><br />
streamline indicated by the vector field, according to the<br />
following formula:<br />
∑<br />
Cout ( i, j)<br />
= Cin ( p)<br />
⋅ h ( p)<br />
p ⊂ τ<br />
where<br />
τ = the set of grid cells <strong>al</strong>ong the streamline within a set<br />
distance 0.5 l from the point (i, j), shown as the shaded cells<br />
in Figure 1.<br />
l = the length of the convolution kernel<br />
C in (p) = input texture pixel at grid cell p<br />
β<br />
∫<br />
h ( p)<br />
= k ( w)<br />
dw<br />
α<br />
where<br />
α = the arclength of the streamline from the point (i, j) to where<br />
the streamline enters cell p<br />
β = the arclength of the streamline from the point (i,j) to where<br />
the streamline exits cell p<br />
k(w) = the convolution filter function<br />
Figure 1.A vector field where the streamline through point (i,j)<br />
is shaded.<br />
Thus each pixel of the output image is a weighted average<br />
of <strong>al</strong>l the pixels corresponding to grid cells <strong>al</strong>ong the<br />
streamline which passes through that pixel’s cell. Section 4<br />
of [5] provides the complete details of the <strong>al</strong>gorithm. When<br />
this <strong>al</strong>gorithm is applied at every pixel, the resulting image<br />
appears as if the texture were “smeared” in the direction of<br />
the vector field.<br />
i,j<br />
Figure 2.The input white noise bitmap on left is smeared using<br />
LIC on a circular vector field to produce the output image on<br />
the right.<br />
3. Curvilinear Grid Surfaces<br />
Because of the one-to-one correspondence between grid<br />
cells and pixels in the input/output images, the <strong>al</strong>gorithm<br />
described above requires that the vector field lie on a<br />
regular, Cartesian grid. Here we show how to use the<br />
<strong>al</strong>gorithm on 2-dimension<strong>al</strong> slices of structured curvilinear<br />
grids, which describe parametric surfaces.<br />
We denote the curvilinear space coordinates of a point as<br />
ξ = ( ξ, η, ζ)<br />
and the physic<strong>al</strong> space coordinates as<br />
x = ( x, y, z)<br />
. The vector which describes the velocity of<br />
the flow at each point is<br />
∂x<br />
∂t<br />
∂x<br />
∂t<br />
∂y<br />
∂t<br />
∂z<br />
∂t<br />
We transform the vector field to the coordinate system of<br />
the curvilinear grid, hereafter c<strong>al</strong>led “computation<strong>al</strong> space.”<br />
The transformation from physic<strong>al</strong> space to computation<strong>al</strong><br />
space is performed by multiplying the physic<strong>al</strong>-space<br />
velocity vectors by the inverse Jacobian matrix s.t.<br />
∂ξ<br />
∂t<br />
∂η<br />
∂t<br />
∂ζ<br />
∂t<br />
=<br />
The computation<strong>al</strong>-space vectors give velocity in gridcells<br />
per unit time. Because the data points are given for<br />
integer coordinates in computation<strong>al</strong> space, this constitutes<br />
a regular Cartesian grid.<br />
We can compute a LIC-image of any 2-dimension<strong>al</strong><br />
=<br />
∂x ∂x ∂x<br />
∂ξ<br />
∂η<br />
∂ζ<br />
∂y ∂y ∂y<br />
∂ξ<br />
∂η<br />
∂ζ<br />
∂z ∂z ∂z<br />
∂ξ<br />
∂η<br />
∂ζ<br />
−1<br />
∂x<br />
∂t<br />
⋅<br />
∂y<br />
∂t<br />
∂z<br />
∂t
slice of the grid by projecting the vector field onto it. For<br />
example, if we want to examine the k=1 plane of the<br />
computation<strong>al</strong> grid, which in many CFD data formats<br />
usu<strong>al</strong>ly lies on the surface of the object about which the flow<br />
is being simulated, we drop the (∂ζ/∂t) term and use the 2dimension<strong>al</strong><br />
vector [∂ξ/∂t, ∂η/∂t] T in the LIC <strong>al</strong>gorithm.<br />
The resulting image, which is a visu<strong>al</strong>ization of the<br />
vector field in computation<strong>al</strong> space (see Figure 3) is then<br />
mapped onto the surface in physic<strong>al</strong> space using a standard<br />
inverse mapping <strong>al</strong>gorithm, such as that described in [9].<br />
The inverse mapping converts the vector field<br />
representation back into physic<strong>al</strong> space (Figure 3). The fin<strong>al</strong><br />
result is a visu<strong>al</strong>ization of the flow which is dense, easily<br />
interpreted, and effectively handles the complicated areas of<br />
the flow.<br />
Figure 3. Top: a LIC image of the computation<strong>al</strong>-space velocity<br />
field over the surface of the space shuttle. The input texture is white<br />
noise, and the convolution kernel is a simple box filter. Below: the<br />
LIC image above texture mapped over the space shuttle in physic<strong>al</strong><br />
space. Note the separation apparent on the fuselage and the vortices<br />
at the wingtip.<br />
4. Animation<br />
While the image described above and shown in Figure<br />
3 correctly shows the streamline direction of the vector field,<br />
the visu<strong>al</strong>ization is ambiguous in regards to whether the flow<br />
is moving forward or backward <strong>al</strong>ong the lines indicated. To<br />
disambiguate the direction of flow, animation is useful.<br />
Also, animating a flow visu<strong>al</strong>ization is physic<strong>al</strong>ly<br />
meaningful.<br />
As Cabr<strong>al</strong> and Leedom discuss in [5], periodic motion<br />
filters [6] can be used together with LIC to create the<br />
impression of motion, such that a flow appears to be moving<br />
in the direction of the vector field. A sm<strong>al</strong>l number n of LIC<br />
images are computed, where in frame i the filter kernel is<br />
phase shifted by is/n, where s is the period of the filter<br />
function. When played back, these images cause the<br />
appearance of ripples moving in the direction of the vector<br />
field. Because the filter kernel is periodic, the n frames can<br />
be cycled through continu<strong>al</strong>ly for smooth motion.<br />
On a parametric surface, the images are ‘played’ by<br />
texture mapping each in turn onto the surface. However,<br />
addition<strong>al</strong> steps must be taken to ensure that the animation<br />
does not introduce misleading information into the<br />
visu<strong>al</strong>ization. The conversion from computation<strong>al</strong> space to<br />
physic<strong>al</strong> space maps square grid cells into quadrilater<strong>al</strong>s of<br />
varying dimensions. Therefore, the length of the<br />
convolution filter, which is measured in computation<strong>al</strong><br />
space units, is mapped to varying lengths in physic<strong>al</strong> space.<br />
The length of the periodic filter determines the size and<br />
speed of the “ripples” in the animation. The speed is given<br />
by the amount of phase shift in physic<strong>al</strong> space per unit time.<br />
Thus, if the period of one filter function is longer in physic<strong>al</strong><br />
space than another, that ripple appears to move faster than a<br />
shorter filter.<br />
As a result of the warping that occurs in the mapping<br />
from computation<strong>al</strong> to physic<strong>al</strong> space, the animation appears<br />
uneven and erratic. In areas where the grid is sparse, the flow<br />
appears as little ripples moving fast, because the convolution<br />
kernel has been compressed, and in areas where the grid is<br />
dense, the flow appears as large ripples moving slowly.<br />
Since there is no correlation between apparent speed and<br />
actu<strong>al</strong> speed of the flow, this motion is highly misleading.<br />
The situation can be corrected by varying the length of<br />
the convolution filter while computing the LIC image. The<br />
length of the convolution filter must vary inversely with the<br />
grid density in the direction of the flow. Where the grid is<br />
sparse in physic<strong>al</strong> space, we want to use a narrow<br />
convolution filter in computation<strong>al</strong> space, as it will be<br />
stretched out when mapped. Likewise, where the grid is<br />
dense in physic<strong>al</strong> space, we want to use a wide filter in<br />
computation<strong>al</strong> space, as it will be compressed when<br />
mapped. See figure 4, next page.
We compute frames where the length of the convolution<br />
kernel used in the LIC <strong>al</strong>gorithm at each grid cell p is given<br />
by<br />
where<br />
Physic<strong>al</strong> Space<br />
Dense<br />
Area of<br />
Grid<br />
Sparse<br />
Area of<br />
Grid<br />
a is the minimum length of the kernel, measured in grid<br />
cells<br />
b controls the range of possible kernel lengths, and<br />
r is the grid density at grid cell p in the direction of the<br />
flow.<br />
a must greater than 1; if the length of the filter is 1 or less,<br />
the LIC <strong>al</strong>gorithm simply returns the input texture pixel,<br />
unaffected by the vector field.<br />
b must be set to a finite length which will vary with the<br />
particular grid.<br />
r(p) for each grid cell is given by<br />
Computation<strong>al</strong> Space<br />
Figure 4. A convolution filter function in physic<strong>al</strong> space and<br />
computation<strong>al</strong> space. The go<strong>al</strong> is for the filter to be of uniform length in<br />
physic<strong>al</strong> space, regardless of grid density. Therefore we stretch the filter in<br />
computation<strong>al</strong> space in areas where the grid is dense, and compress the<br />
filter in computation<strong>al</strong> space in areas where the grid is sparse.<br />
b<br />
l ( p)<br />
= a +<br />
r ( p)<br />
∂x<br />
∂ξ<br />
∂y<br />
∂ξ<br />
∂z<br />
∂ξ<br />
∂x<br />
∂η<br />
∂y<br />
∂η<br />
∂z<br />
∂η<br />
∂x<br />
∂ζ<br />
∂y<br />
∂ζ<br />
∂z<br />
∂ζ<br />
r(p) for the entire grid is computed by the following steps:<br />
−1<br />
dx<br />
dt<br />
dx<br />
dt<br />
1) Norm<strong>al</strong>ize the vector field to unity in physic<strong>al</strong> space.<br />
2) Convert to computation<strong>al</strong> space using the inverse<br />
•<br />
Jacobian as described in section 3.<br />
3) Take the magnitude of the computation<strong>al</strong>-space<br />
vectors.<br />
Figure 5 shows a single texture frame of an animation<br />
sequence computed in this way. When the 10 texture<br />
frames are played back, the flow appears smooth and even<br />
everywhere on the surface, rather than uneven and erratic.<br />
Thus we are able to use periodic motion filters even on<br />
parametric surfaces from curvilinear grids.<br />
Figure 5a. A single texture frame from an animated sequence computed<br />
using the LIC <strong>al</strong>gorithm with a raised cosine filter. The length of the filter<br />
varies inversely with the grid density in the direction of the flow. Therefore<br />
the ripples appear stretched in some areas and compressed in others.<br />
Details in section 4.<br />
5b. Close-up of the texture frame from above mapped onto the curvilinear<br />
grid, used to simulate flow around a post. The bottom edge of the texture<br />
maps around the post. When mapped onto the grid, the ripples are of uniform<br />
size. When animated, the ripples give the impression of smooth flow.<br />
5. Variable Speed<br />
The next step in flow animation, whether on a regular<br />
grid or on a parametric surface, is to give a visu<strong>al</strong>ization of<br />
vector magnitude as well as vector direction. Thus, in a CFD<br />
flow visu<strong>al</strong>ization, the periodic motion should be slow<br />
where the flow has low velocity and quick where the flow<br />
has high velocity. Cabr<strong>al</strong> and Leedom [5] suggest achieving<br />
this effect by varying the frequency of the filter function,<br />
while keeping its length constant. However, the limited<br />
dynamic range (experimentation shows only between 2 and<br />
4 ripples per kernel are interpretable) and the artifacts<br />
caused by changing the shape of the filter make it difficult to
use this approach for meaningful results. We have found that<br />
a better solution is to vary the amount of filter function phase<br />
shift at each grid cell in proportion to the physic<strong>al</strong>-space<br />
vector magnitude.<br />
The amount of phase shift is what determines the<br />
apparent speed, given a uniform-length filter kernel. An<br />
infinitesim<strong>al</strong>ly sm<strong>al</strong>l phase shift will appear not to move at<br />
<strong>al</strong>l. Likewise, a 90-degree phase shift in every frame will<br />
produce a full cycle in four frames, which appears to move<br />
very quickly. (At anything greater than 180 degrees,<br />
tempor<strong>al</strong> <strong>al</strong>iasing occurs.) Phase shifts ranging from 0 to 90<br />
degrees can be mapped to the actu<strong>al</strong> range of physic<strong>al</strong> vector<br />
magnitude for a convincing variable-speed animation.<br />
In a frame from a variable-speed animation sequence,<br />
each pixel will be computed with a convolution kernel that<br />
has a phase shift proportion<strong>al</strong> to the corresponding grid<br />
cell’s physic<strong>al</strong> vector magnitude. Therefore the period of the<br />
filter function is different at each pixel, and there is no fixed<br />
number of frames that can be used in a cyclic animation.<br />
Therefore, we adopt the following strategy of sampling the<br />
“re<strong>al</strong>” solution and interpolating to find the pixel v<strong>al</strong>ues<br />
which we will display.<br />
In practice, the texture frames are computed as follows:<br />
1) First compute N LIC images, such that in image i,<br />
where θi is the amount of filter phase shift, θι = is/N.<br />
As in section 4 s is the period of the filter function.<br />
The larger N, the more accurate the visu<strong>al</strong>ization. The<br />
intensity of pixel p in image i is defined as T(i, p).<br />
2) For each grid cell p , let<br />
y − min ( y)<br />
q =<br />
max ( y)<br />
− min ( y)<br />
where y denotes physic<strong>al</strong> vector magnitude at grid<br />
cell p. q is a re<strong>al</strong> number in [0,1] that gives the vector<br />
magnitude in cell p relative to the magnitudes in the<br />
whole grid.<br />
3) The intensity of pixel p in frame j of the displayed<br />
image, I(j,p), is found by interpolating linearly<br />
between the two LIC images from step (1) closest to<br />
it:<br />
Let<br />
α q<br />
at cell p. Then<br />
N<br />
N<br />
jmodN q j modN<br />
4 4 −<br />
=<br />
I ( j, p)<br />
( 1 − α)<br />
T q N<br />
j modN p<br />
4 ,<br />
( )<br />
=<br />
αT q N<br />
j modN p<br />
4 ,<br />
( )<br />
+<br />
6. Implementation<br />
We use the texture-mapping capabilities of a high-end<br />
workstation [8] to display surfaces with LIC-images<br />
mapped onto them in an interactive program. All LIC<br />
images are computed prior to running the interactive<br />
program, since the LIC <strong>al</strong>gorithm is fairly computeintensive<br />
(images take on the order of sever<strong>al</strong> seconds to<br />
minutes to compute). The hardware is capable of switching<br />
between pre-loaded textures quickly enough that we are able<br />
to run animation in re<strong>al</strong> time, while the user manipulates the<br />
surface.<br />
For single-speed periodic motion, we find that 5 - 12<br />
texture frames is sufficient for smooth animation.<br />
For variable-speed animation, we are no longer able to<br />
precompute a finite number of frames and cycle through<br />
them, because the amount of phase shift varies at every grid<br />
cell. However, steps 2 and 3 of the <strong>al</strong>gorithm described in<br />
section 5 are not compute intensive, once the N LIC-images<br />
of step 1 have been precomputed. This implies that a re<strong>al</strong><br />
time implementation of variable-speed animation should be<br />
possible. Unfortunately, we have not been able to achieve<br />
this with our hardware, an SGI Re<strong>al</strong>ity Engine, because the<br />
time required to load a new texture into the texture cache is<br />
too long to permit good frame rates. However, we expect<br />
that within the foreseeable future texture-mapping hardware<br />
will <strong>al</strong>low fast texture definition and this feature will be<br />
possible.<br />
In the meantime, we have experimented with two<br />
<strong>al</strong>ternative solutions.<br />
(1) C<strong>al</strong>culate and store a large number of texture frames<br />
using a re<strong>al</strong> phase shift at every grid cell which is a linear<br />
function of the physic<strong>al</strong> vector magnitude in that grid cell.<br />
The number of frames required for anything more than a few<br />
seconds of animation using this solution is so large that<br />
storage requirements quickly exceed the memory<br />
capabilities of a workstation. Therefore either (a) the short<br />
sequence of animation must be continu<strong>al</strong>ly restarted, which<br />
causes the flow to appear to “jump” every few seconds, or<br />
(b) the animation must be stored on video or another digit<strong>al</strong><br />
playback device, and the re<strong>al</strong> time interactivity possible with<br />
<strong>al</strong>l other techniques described in this paper are forfeited. We<br />
show an implementation of (a). The animation is smooth in<br />
spurts of 5 seconds, and the speed of the flow is clearly<br />
varying across the surface (see video).<br />
(2) Approximate the continuous solution by choosing a<br />
minimum phase shift, φ, and quantizing <strong>al</strong>l phase shifts as<br />
integer multiples of φ. In this solution, only M = s/φ frames<br />
need to be precomputed, because the M frames will form a<br />
complete cycle. The drawback of this solution is that it is<br />
susceptible to <strong>al</strong>iasing and rasterization caused by the<br />
sampling and quantization of phase shifts. The advantage is
that it can be played continu<strong>al</strong>ly in re<strong>al</strong> time on a<br />
workstation, without the jumps of solution (1).<br />
To compute the frames for this discretized solution, we<br />
follow the same steps as described for the continuous<br />
solution in section 5, but round q to the nearest multiple of<br />
1/M. In this case there is no interpolation and M frames<br />
suffice to form a cycle of animation.<br />
In our implementation of solution (2), we see that while<br />
the speed of the flow is clearly varying, <strong>al</strong>iasing and<br />
rasterization artifacts do appear.<br />
7. Future Work<br />
There are sever<strong>al</strong> promising directions for future work.<br />
First, in order for this technique to become useful for practic<strong>al</strong><br />
applications, a number of extensions must be implemented.<br />
Foremost among these are multigrid solutions,<br />
unsteady flows, and unstructured grids.<br />
Also, we hope to extend this technique to the visu<strong>al</strong>ization<br />
of 3-dimension<strong>al</strong> vector fields. While the LIC <strong>al</strong>gorithm<br />
in itself extends easily to a 3-dimension<strong>al</strong> Cartesian<br />
grid, the output image data requires addition<strong>al</strong> processing<br />
before a useful image is produced. Cutting planes, isosurfaces,<br />
or volume rendering techniques will be necessary for<br />
this extension. Experimentation with input textures and<br />
convolution filters will be needed to achieve effective images.<br />
Furthermore, new <strong>al</strong>gorithms will be required to handle<br />
curvilinear grids in this situation as well.<br />
8. Summary<br />
We have presented sever<strong>al</strong> extensions to Line Integr<strong>al</strong><br />
Convolution. First, we have described how to use the LIC<br />
<strong>al</strong>gorithm on curvilinear grid surfaces. We have shown how<br />
to solve the problems that arise when using periodic motion<br />
filters in LIC on a curvilinear surface. Lastly, we have introduced<br />
a method of incorporating visu<strong>al</strong>ization of vector<br />
magnitude into the LIC <strong>al</strong>gorithm, by showing the animation<br />
at variable speeds. All <strong>al</strong>gorithms are designed such<br />
that with modern graphics hardware the surfaces can be displayed,<br />
animated, and manipulated in re<strong>al</strong> time.<br />
Our visu<strong>al</strong>ization technique provides intuitive and accurate<br />
information about the vector field, and thus is a useful<br />
complement to other visu<strong>al</strong>ization techniques.<br />
Acknowledgments<br />
The author wishes to thank David Yip, who provided<br />
support of many forms throughout this research, the Applied<br />
Research Branch staff of NASA Ames, who offered<br />
helpful discussions, Marc Levoy, who gave advice on the<br />
research and on the writing of this paper, and Brian Cabr<strong>al</strong><br />
and Casey Leedom, who made their LIC code publicly<br />
available.<br />
References<br />
[1] D. Asimov, “Notes on the Topology of Vector Fields<br />
and Flows,” NASA Ames Research Center Report RNR-<br />
93-003, February, 1993<br />
[2] M. Bailey, C. Hansen, Introduction to Scientific Visu<strong>al</strong>ization<br />
Tools and Techniques, Course Notes, ACM SIG-<br />
GRAPH (1993).<br />
[3] G. Bancroft, F. Merritt, T. Plessel, P. Kelaita, R. Mc-<br />
Cabe, A. Globus, “FAST: A Multi-Processing Environment<br />
for Visu<strong>al</strong>ization of CFD,” Proc.Visu<strong>al</strong>ization ‘90, IEEE<br />
Computer Society, San Francisco (1990).<br />
[4] S. Bryson, C. Levit, “The Virtu<strong>al</strong> Windtunnel: An Environment<br />
for the Exploration of Three-Dimension<strong>al</strong> Unsteady<br />
Flows,” Proc. Visu<strong>al</strong>ization ‘91, IEEE Computer<br />
Society, San Diego (1991).<br />
[5] B. Cabr<strong>al</strong>, C. Leedom, “Imaging Vector Fields Using<br />
Line Integr<strong>al</strong> Convolution,” Computer Graphics Proceedings<br />
‘93, ACM SIGGRAPH (1993)<br />
[6] W.T. Freeman, E.H. Adelson, D.J. Heeger, “Motion<br />
Without Movement,” Computer Graphics Proceedings ‘91,<br />
ACM SIGGRAPH (1991)<br />
[7] A. Globus, C. Levit, T. Lasinski, “A Tool for Visu<strong>al</strong>izing<br />
the Topology of Three-Dimension<strong>al</strong> Vector Fields,”<br />
Proc.Visu<strong>al</strong>ization ‘91, IEEE Computer Society, San Diego<br />
(1991).<br />
[8] Graphics Library Programming Guide, Volume II, Silicon<br />
Graphics, Inc. (1992)<br />
[9] E. Haines, “Essenti<strong>al</strong> Ray Tracing Algorithms”, Chapter<br />
2 in A. Glassner,Ed., An Introduction to Ray Tracing, Academic<br />
Press (1989)<br />
[10] J. Helman, L. Hesselink, “Surface Representation of<br />
Two- and Three- Dimension<strong>al</strong> Fluid Flow Topology,”<br />
Proc.Visu<strong>al</strong>ization ‘90, IEEE Computer Society, San Francisco<br />
(1990).<br />
[11] A. Hin, F. Post, “Visu<strong>al</strong>ization of Turbulent Flow with<br />
Particles,” Proc. Visu<strong>al</strong>ization ‘93, IEEE Computer Society,<br />
San Jose(1993).<br />
[12] K-L. Ma, P. Smith, “Virtu<strong>al</strong> Smoke: An Interactive 3D<br />
Flow Visu<strong>al</strong>ization Technique,” Proc. Visu<strong>al</strong>ization ‘92,<br />
IEEE Computer Society, Boston (1992).<br />
[13] N. Max, B. Becker, R. Crawfis, “Flow Volumes for Interactive<br />
Vector Field Visu<strong>al</strong>ization,” Proc. Visu<strong>al</strong>ization<br />
‘93, IEEE Computer Society, San Jose(1993).<br />
[14] N. Max, R. Crawfis, D. Williams, “Visu<strong>al</strong>izing Wind<br />
Velocities by Advecting Cloud Textures,” Proc. Visu<strong>al</strong>ization<br />
‘92, IEEE Computer Society, Boston (1992).
[15] P. P. W<strong>al</strong>atka, P. G. Buning, PLOT3D User’s Manu<strong>al</strong>,<br />
NASA Technic<strong>al</strong> Memorandum 101067, NASA Ames Research<br />
Center.<br />
[16] J. van Wijk, “Rendering Surface-Particles,” Proc. Visu<strong>al</strong>ization<br />
‘92, IEEE Computer Society, Boston (1992).<br />
[17] W.H. Press, et <strong>al</strong>., Numeric<strong>al</strong> Recipes in C: The Art of<br />
Scientific Computing, Cambridge University Press, Cambridge<br />
(1988).
1a. The flow over the surface of the space shuttle visu<strong>al</strong>ized in<br />
FAST with arrow icons for velocity vectors and glyphs for critic<strong>al</strong><br />
points in the topology.<br />
2a. Detail of the top of the fuselage of the space shuttle, visu<strong>al</strong>ized<br />
in FAST.<br />
3a. Detail of the wing of the shuttle.<br />
1b. The flow over the surface of the space shuttle visu<strong>al</strong>ized using<br />
Line Integr<strong>al</strong> Convolution on the computation<strong>al</strong> space vector field<br />
and texture mapped onto the shuttle surface.<br />
2b. Detail of the top of the fuselage of the space shuttle, visu<strong>al</strong>ized<br />
using LIC for curvilinear surfaces.<br />
3b. Detail of the wing of the shuttle.
Abstract<br />
Vector field rendering is difficult in 3D because the<br />
vector icons overlap and hide each other. We propose four<br />
different techniques for visu<strong>al</strong>izing vector fields only near<br />
surfaces. The first uses motion blurred particles in a thickened<br />
region around the surface. The second uses a voxel<br />
grid to contain integr<strong>al</strong> curves of the vector field. The third<br />
uses many anti<strong>al</strong>iased lines through the surface, and the<br />
fourth uses hairs sprouting from the surface and then<br />
bending in the direction of the vector field. All the methods<br />
use the graphics pipeline, <strong>al</strong>lowing re<strong>al</strong> time rotation and<br />
interaction, and the first two methods can animate the texture<br />
to move in the flow determined by the velocity field.<br />
Introduction<br />
There are many representations of velocity fields:<br />
streamlines, stream surfaces, particle traces, simulated<br />
smoke, ..., etc. One of the simplest is to scatter vector<br />
icons, for example, sm<strong>al</strong>l line segments, throughout the<br />
volume. There are two fundament<strong>al</strong> problems with such an<br />
approach. First, the 2D projection of a line segment is ambiguous;<br />
many 3D segments can have the same projection.<br />
Second, densely scattered icons can overlap and obscure<br />
each other, leading to a confusing image. These problems<br />
can be parti<strong>al</strong>ly solved with re<strong>al</strong> time (or playback) animation,<br />
since motion par<strong>al</strong>lax can resolve the projection ambiguities.<br />
In addition, icon motion in the velocity direction<br />
can give added visu<strong>al</strong> information.<br />
The second problem can <strong>al</strong>so be resolved by restricting<br />
the icons to speci<strong>al</strong> regions of interest. For example, in<br />
[Crawfis92] and [Crawfis93], the vectors’ opacity depended<br />
on their magnitude, so only the regions of highest velocity<br />
were emphasized. In this paper we take the region of<br />
interest to be on or near a contour surface. The sc<strong>al</strong>ar function<br />
being contoured can come directly from the vector<br />
field, for example, the vector magnitude or a vector com-<br />
Visu<strong>al</strong>izing 3D Velocity Fields Near<br />
Contour Surfaces<br />
Nelson Max<br />
Roger Crawfis<br />
Charles Grant<br />
Lawrence Livermore Nation<strong>al</strong> Laboratory<br />
Livermore, C<strong>al</strong>ifornia 94551<br />
ponent. It can <strong>al</strong>so be an independent sc<strong>al</strong>ar field defined<br />
on the same volume, for example, porosity in a flow simulation,<br />
or a linear or quadratic function for interactive slicing.<br />
We report here on four different techniques for<br />
visu<strong>al</strong>izing velocity fields near contour surfaces.<br />
Spot Noise<br />
Van Wijk [vanWijk91] generated a direction<strong>al</strong> texture<br />
by superimposing many oriented shapes such as ellipses.<br />
For texture on curved surfaces, the texture plane is<br />
mapped to the surface, and the texture generation accounts<br />
for the stretching induced by the mapping. Van Wijk visu<strong>al</strong>ized<br />
a tangenti<strong>al</strong> velocity field on a ship hull with this<br />
method. Cabr<strong>al</strong> [Cabr<strong>al</strong>93] has generated similar but more<br />
accurate 2D velocity textures by “Line Integr<strong>al</strong> Convolution”<br />
of random noise, and Forssell [Forssell94] extended<br />
this with mapping to visu<strong>al</strong>ize velocity near an airplane<br />
surface. Both of these techniques can be animated to make<br />
the texture flow. However, they are not applicable to contour<br />
surfaces, which cannot easily be parameterized.<br />
Stolk and van Wijk [Stolk92, vanWijk93] have <strong>al</strong>so<br />
visu<strong>al</strong>ized flows with surface particles: individu<strong>al</strong> spots<br />
motion-blurred to elliptic<strong>al</strong> shapes and composited separately<br />
onto the image in software. Each spot has a surface<br />
norm<strong>al</strong>, which is carried <strong>al</strong>ong appropriately by the flow,<br />
and used in the shading. These particles can <strong>al</strong>so move in<br />
animation, but only on surfaces related to the flow, not on<br />
fixed contour surfaces of an unrelated function. Here we<br />
use the same sort of spots, but take advantage of hardware<br />
rendering for interactive speed. We do not restrict the particles<br />
to lie on a surface, and therefore do not use norm<strong>al</strong>s<br />
in the shading. Instead, we think of the particles as<br />
spheres, which are motion blurred to ellipsoids. We only<br />
draw particles which lie within a specified distance D of<br />
the contour surface of interest.<br />
We should emphasize that most of the previous work<br />
represents tangenti<strong>al</strong> flows on a surface, for example, a<br />
stream surface, but the problem we are trying to address
uses contour surfaces of functions possibly unrelated to<br />
the velocity vectors, which are therefore not usu<strong>al</strong>ly tangent<br />
to the surface.<br />
We assume that the vector field V(x, y, z) and the sc<strong>al</strong>ar<br />
function f(x, y, z) are defined on the same rectilinear lattice.<br />
To estimate the distance d(x, y, z) of a particle at (x, y,<br />
z) from the contour surface f(x, y, z) = C, we use a technique<br />
described by Levoy [Levoy88]. We approximate the<br />
gradient ∇f(x,<br />
y, z) by finite differences of the neighboring<br />
vertex v<strong>al</strong>ues of f, and store the magnitude | ∇f(x,<br />
y, z)|.<br />
Then<br />
d ( x, y, z)<br />
=<br />
f ( x, y, z)<br />
− C<br />
∇f ( x, y, z)<br />
where the quantities f(x, y, z) and | ∇f(x,<br />
y, z)| are trilinearly<br />
interpolated from the eight surrounding lattice vertices.<br />
We wish to randomly deposit particles uniformly into<br />
the region R where d(x, y, z) < D. Assuming the specified<br />
distance D is larger than the cell size in the lattice, the following<br />
procedure does this efficiently. We mark <strong>al</strong>l lattice<br />
vertices which are within D of the contour surface, and<br />
then mark <strong>al</strong>l cells which have at least one marked vertex.<br />
These markings are updated whenever the user changes C<br />
or D. We randomly insert a specified number N of particles<br />
in each marked cell, and render a particle at (x, y, z) only if<br />
d(x, y, z) < D.<br />
The particles are kept in a linked list, which <strong>al</strong>so contains<br />
their ages. They are moved in each time step by second<br />
order Runge-Kutta integration, using velocities<br />
trilinearly interpolated from the lattice vertices. If a particle<br />
moves into an unmarked cell or out of the data volume,<br />
it is scheduled for deletion from the linked list. At each<br />
time step, we <strong>al</strong>so check that <strong>al</strong>l marked cells still have N<br />
particles, and add or delete particles as necessary.<br />
The particle size is proportion<strong>al</strong> to a factor b = s(d),<br />
which is equ<strong>al</strong> to 1 for sm<strong>al</strong>l d and decreases continuously<br />
to zero when d reaches D. Thus the particles fade in as<br />
they first cross into R, and fade out as they leave. Since a<br />
particle could randomly be created near the contour surface<br />
to replace another particle leaving a cell, we actu<strong>al</strong>ly<br />
take b = minimum(s(d), ka), where k is a constant and a is<br />
the age of the particle. This makes new particles fade in at<br />
birth. They are similarly faded out when deleted.<br />
As in [vanWijk93], we draw the particles as blurred<br />
ellipses, stretched out in the direction of motion. However<br />
we do the compositing using the hardware in our SGI<br />
workstations. A single blurred disk is used as the texture,<br />
and is mapped to a 3D rectangle. If r is the radius of the<br />
particle, P is its position vector relative to the viewpoint,<br />
and V is its velocity vector, then the rectangle vertices are<br />
at P + S + T, P + S - T, P - S - T, and P - S + T, where<br />
Figure 1. Spot noise near contour surface<br />
V P<br />
S r and .<br />
×<br />
S P<br />
= T V r<br />
V × P<br />
×<br />
= +<br />
S × P<br />
Basic<strong>al</strong>ly, T is <strong>al</strong>ong the velocity direction, but the second<br />
term is added so that the particle will shrink to a sm<strong>al</strong>l<br />
round dot of radius r when the velocity approaches zero or<br />
is oriented near the viewing direction. Because these semitransparent<br />
particles are sent through the graphics pipeline<br />
after the opaque objects, they can be combined with<br />
opaque contour surfaces in the z-buffer and be appropriately<br />
hidden. Currently they are <strong>al</strong>l the same color, so they<br />
do not need to be sorted. (See [Max93].) Figure 1 shows a<br />
collection of ellipsoid<strong>al</strong> motion-blurred particles near a<br />
contour of velocity magnitude on a “tornado” velocity data<br />
set. Figure 2 includes a contour surface of velocity magnitude,<br />
which hides some of the dots. Figure 3 represents a<br />
0.5 micron simulation of the airflow through a HEPA filter.<br />
Figure 2. Spots noise with contour surface.
An animation has been produced showing the flow at varying<br />
velocity contours, from high to low. A contour region<br />
of moderate flows is illustrated here. Figure 4 illustrates a<br />
velocity contour near zero and close to the met<strong>al</strong>lic fibers.<br />
The implementation is in C++, using SGI’s Inventor<br />
for the user viewing interface. The contour v<strong>al</strong>ue C and<br />
width D are controlled by sliders. On our office workstations<br />
with Elan graphics, the actu<strong>al</strong> texture mapping is<br />
done in software, but the same code automatic<strong>al</strong>ly c<strong>al</strong>ls the<br />
hardware texture mapping on the Onyx workstation in<br />
our Graphics Lab. We can thus get re<strong>al</strong> time rotation and<br />
particle motion on sm<strong>al</strong>l data sets, and interactive performance<br />
on large data sets.<br />
Particle traces on 2D surfaces<br />
The go<strong>al</strong> of this technique is to represent the magnitude<br />
and direction of a vector field at each point on an arbitrary<br />
set of surfaces (not necessarily a contour surface),<br />
<strong>al</strong>lowing long flowlines to be easily understood, but without<br />
having the visu<strong>al</strong>ization become too dense or too<br />
sparse at any point.<br />
To do this we try to draw long, evenly spaced particle<br />
traces. The beginning and ends of these traces do not necessarily<br />
indicate a source or sink in the vector field. Traces<br />
begin and end over the entire surface in order to keep a<br />
nearly constant density of lines in the image. The particle<br />
trace lines are broken into sm<strong>al</strong>l segments of contrasting<br />
color. The length of the segments represents the magnitude<br />
of the vector field (i.e. a constant time interv<strong>al</strong>). The direction<br />
of the segments is the direction of the vector field at<br />
that point projected onto the 2D surface. In still pictures,<br />
using a sawtooth shaped color map across each segment<br />
resolves the direction<strong>al</strong> ambiguity of the lines. We experimented<br />
with sever<strong>al</strong> different projections of the vector<br />
field to the surfaces.<br />
Once the particle traces are c<strong>al</strong>culated and rendered,<br />
color table animation can be used to add motion to the display<br />
so that the lines “flow” in the direction of the vector<br />
field with a velocity proportion<strong>al</strong> to the magnitude of the<br />
vector field at each point. This flow animation was a primary<br />
go<strong>al</strong> of this technique. Color table animation is an<br />
old technique [Shoup79] which has been applied to flow<br />
visu<strong>al</strong>ization by Van Gelder and Wilhelms [VanGelder92].<br />
The first step in this technique is to scan convert the<br />
surfaces into an octree. A piecewise linear representation<br />
of the 2D surface(s) is stored in the octree. Each cell holds<br />
a plane equation (four numbers). The octree <strong>al</strong>lows us to<br />
use any kind of surface (as long as the surface does not<br />
pass through any leaf cell twice, which is unavoidable for<br />
self-intersecting surfaces). The octree <strong>al</strong>lows fast access to<br />
adjacent cells but is much more memory efficient than a<br />
full 3D grid. Only those cells that intersect the surfaces are<br />
present in the octree. In this implementation, the surfaces<br />
are subdivided down to a constant size cell.<br />
A seed point is then chosen to try to place the first particle<br />
trace. The particle is advected <strong>al</strong>ong the surface in<br />
both directions, forward and backwards, using a variable<br />
step size Euler’s method. We continue to advect the particle<br />
until it reaches a stagnation zone, reaches an edge of<br />
the surface, or becomes too close to its own trace or that of<br />
another particle. The particle trace is considered acceptable<br />
if it is longer than the current length threshold. If the<br />
trace is too short, it is erased and a new seed point is tried.<br />
The length of the erased trace is preserved in the cells in<br />
which it passed. This v<strong>al</strong>ue is used to prevent extensive rec<strong>al</strong>culation<br />
while backtracking.<br />
The seed points are chosen on an integer lattice in a<br />
spati<strong>al</strong>ly hierarchi<strong>al</strong> manner so that the first particle traces<br />
will start well away from each other and are likely to be<br />
traced for long distances before getting too close to other<br />
lines. Random placement of seed points would <strong>al</strong>so be<br />
likely to yield long lines for the first points chosen, but<br />
would not guarantee that some seed point was near every<br />
point on the surfaces. All seed points, at some particular<br />
resolution, are tried first using a large length threshold.<br />
Then the length threshold is reduced and the process is repeated.<br />
Gradu<strong>al</strong>ly reducing the length threshold from<br />
some maximum to minimum produces the most esthetic<strong>al</strong>ly<br />
pleasing distribution of particle traces, but takes longer<br />
to c<strong>al</strong>culate than using a single length threshold v<strong>al</strong>ue.<br />
Projections<br />
Four techniques were tried for projecting a 3D vector<br />
onto the 2D surface. Three techniques, norm<strong>al</strong>, xy norm<strong>al</strong><br />
and cylinder projections, are viewpoint independent. The<br />
eye projection technique is viewpoint dependent. Viewpoint<br />
dependent techniques require the particle traces to be<br />
rec<strong>al</strong>culated each time the viewpoint is changed, while<br />
viewpoint independent techniques do not require this rec<strong>al</strong>culation.<br />
To compare these four projections and their<br />
ability to indicate the 3D flow, we have used a simple test<br />
case: a constant velocity field.<br />
Norm<strong>al</strong> Projection<br />
With the norm<strong>al</strong> projection technique, the 3D vector<br />
at a point on the surface is projected onto the surface in a<br />
direction par<strong>al</strong>lel to the surface norm<strong>al</strong> at that point. This<br />
projection, while being very straightforward, can yield<br />
very nonintuitive particle traces. Figure 5 shows the tornado<br />
surface in a vector field in which <strong>al</strong>l vectors are in exactly<br />
the same direction, pointing to the upper right at 45
degrees. The uniformity of the vector field is not at <strong>al</strong>l apparent<br />
with this projection.<br />
XY Norm<strong>al</strong> Projection<br />
Figure 5. Norm<strong>al</strong> Projection<br />
The xy norm<strong>al</strong> projection technique is designed for<br />
producing film loops where the viewpoint is rotated about<br />
the z (vertic<strong>al</strong>) axis. In this technique the 3D vector is projected<br />
onto the surface in the direction of a vector which<br />
consists of only the x and y components of the surface norm<strong>al</strong><br />
at that point. As can be seen in figure 6, this preserves<br />
the z component of the vector field and gives a somewhat<br />
more intuitive visu<strong>al</strong>ization, but the uniformity of the vector<br />
field is still not readily apparent.<br />
Figure 6. XY Projection<br />
Cylinder Projection<br />
The cylinder projection technique is <strong>al</strong>so designed for<br />
producing film loops where the viewpoint is rotated about<br />
the z (vertic<strong>al</strong>) axis. In this technique the 3D vector is projected<br />
onto the surface in the direction of a vector which<br />
points away from the rotation<strong>al</strong> axis. As can be seen in figure<br />
7, this gives results very similar to the xy norm<strong>al</strong> projection.<br />
This projection is only suitable for simple surfaces<br />
which are centered on the rotation<strong>al</strong> axis.<br />
Eye Projection<br />
Figure 7. Cylinder Projection<br />
In the eye projection technique, the 3D vectors are<br />
projected onto the surfaces in a direction par<strong>al</strong>lel to the<br />
viewing direction. As shown in figure 8, for a single image<br />
this technique produces the most intuitive representation<br />
of the constant direction vector field. The uniform direc-<br />
Figure 8. Eye Projection
tion of the vector field is readily apparent. When changing<br />
the viewpoint for a film loop, the projection of the 3D vectors<br />
to the surfaces changes, resulting in a different set of<br />
particle traces. We attempt to minimize the visu<strong>al</strong> effect of<br />
these changes by using the same set of tri<strong>al</strong> seed points as<br />
the previous frame, and by starting each particle trace with<br />
the same “phase” as a nearby trace in the previous frame.<br />
Figure 9. is a color reprint of Figure 6..<br />
In conclusion, the uniformly spaced, animated particle<br />
traces are an effective means of visu<strong>al</strong>izing a 2D vector<br />
field, but the projection of a 3D vector field onto a 2D<br />
curved surface loses and distorts some of the information<br />
from the 3D field, limiting the usefulness of these techniques<br />
for 3D. This is a difficulty for our go<strong>al</strong> of representing<br />
flows non-tangenti<strong>al</strong> to the surface. It is still an<br />
effective technique for stream surfaces or other tangenti<strong>al</strong><br />
flows.<br />
Line Bundles<br />
Line bundles use the back-to-front compositing and<br />
overlapping of splatting to construct a volume of tiny line<br />
segments. Taken as a whole, these line segments construct<br />
the appearance of a fibrous volume. While drawing many<br />
tiny vectors to represent a vector field is not new, we have<br />
combined this idea with back-to-front compositing and<br />
techniques to generate anisotropic textures (see Figure<br />
10). Our basic implementation plan is to extend the concept<br />
of splats - each data point is composited into the<br />
frame buffer in a back-to-front manner [Crawfis93]. Rather<br />
than trying to reconstruct a C 1 3D sign<strong>al</strong>, we want a<br />
very discontinuous, yet anti<strong>al</strong>iased, 3D volume representation.<br />
At each data point, a collection of anti<strong>al</strong>iased lines is<br />
splatted. The lines are randomly scattered within a 3D<br />
bounding box associated with each splat. The hue, saturation,<br />
v<strong>al</strong>ue and center position within the box are <strong>al</strong>l ran-<br />
Figure 10. Line bundle tornado with magnification<br />
Figure 11 Line bundle near aerogel surface<br />
domly perturbed. The direction of each line is in the<br />
direction of the flow field. The jittering of the color and<br />
position produce a nice anisotropic texture oriented in the<br />
direction if the flow field, even when the lines are so dense<br />
that there is no space between them. The primary color<br />
about which we jitter can be different for each splat or can<br />
be fixed for the entire volume. Having different colors per<br />
splat <strong>al</strong>lows us to encode addition<strong>al</strong> information about the<br />
volume, either the vector magnitude, some separate sc<strong>al</strong>ar<br />
field, or a position<strong>al</strong> indicator. Using a single primary color<br />
<strong>al</strong>lows us to precompute the line bundle into a GL object,<br />
which is then very rapidly reoriented and redrawn at<br />
each data point. Line bundles in excess of over 300 line<br />
segments can be used for each data point with no degradation<br />
in re<strong>al</strong>-time performance.<br />
Three key issues are addressed in these fibrous volumes:<br />
back-to-front compositing for a thin wispy-like appearance,<br />
anti<strong>al</strong>iased lines with transparent heads and tails<br />
to avoid unwanted edges, and controlled jittering of colors<br />
and positions to avoid regular patterns or completely filled<br />
regions. Figure 10 shows a sample tornado data set using a<br />
homogenous color that is heavily jittered. A zoomed in<br />
portion of the image is to the left of it. Notice the anti<strong>al</strong>iasing<br />
and lack of any hard edges. Figure 12 shows the wind<br />
field over North America in a simulated glob<strong>al</strong> climate<br />
model. Data points close to the isocontour surface of a particular<br />
wind velocity magnitude were chosen for the line<br />
bundle splatting. Figure 11 represents the airflow through<br />
a filter substrate known as aerogel.The data points were<br />
chosen to lie close to the surface of the filter particles. This<br />
provides a nice mossy appearance. In Figure 13, points<br />
were chosen near a velocity contour of the HEPA filter<br />
simulation, and are color coded by velocity, giving a solid<br />
volume with a fibrous texture. These images can be generated<br />
in re<strong>al</strong> time on a mid- to high-end graphic<strong>al</strong> workstation.
Hairs<br />
We tried to use the line bundles to represent the flow<br />
around or near a surface. This broke down when the flow<br />
was slightly into the surface. A solution is to grow tiny<br />
hairs coming out of the surface. We draw the line segments<br />
out of the surface first and then have them bend in<br />
the flow field, much like norm<strong>al</strong> hair. Sever<strong>al</strong> controls over<br />
this behavior are offered. The physic<strong>al</strong> layout of the hairs<br />
are specified by a number of connected line segments, by<br />
an interpolation of the norm<strong>al</strong> vector and the velocity vector,<br />
and by a stiffness or weighting factor per segment. The<br />
default number of segments is six, and <strong>al</strong>l of the images<br />
here were generated using only six segments. The interpolation<br />
is completely specified by the user with coefficients<br />
t i at each line segment point. A new direction<strong>al</strong> vector is<br />
generated using the formula: Direction = w i * ( t i * Norm<strong>al</strong><br />
+ (1-t i ) * Velocity * Velocity_Sc<strong>al</strong>e). The Norm<strong>al</strong> vector<br />
is norm<strong>al</strong>ized, and the velocity is sc<strong>al</strong>ed by the user<br />
parameter Velocity_Sc<strong>al</strong>e. Smooth curves or sharp bends<br />
can be specified with the proper t i ’s. The Direction vector<br />
is then added to the endpoint of the last line segment. The<br />
weighting by w i is useful to control the apparent stiffness<br />
of the hair. Greater weights can be given to the initi<strong>al</strong> segment<br />
in the direction of the norm<strong>al</strong>, lower weights to the<br />
middle segments and fin<strong>al</strong>ly, large weights can be given to<br />
the last one or two line segments to produce longer hairs in<br />
the velocity direction. This defines an individu<strong>al</strong> hair. A<br />
number of hairs are scattered throughout the splat volume<br />
and jittered from one splat to the next. The splats are positioned<br />
near the contour surface by the method of Levoy<br />
discussed above. They are moved towards the contour surface<br />
by a multiple of the gradient.<br />
The color and transparency of the hairs are controlled<br />
by a weighted function of the hair’s root color, a specified<br />
splat color, a vector head color, and an HSV space jittering.<br />
The user specifies a root color and a vector head color.<br />
A splat color is derived from a sc<strong>al</strong>ar field to color table<br />
mapping. At each segment, the user can specify the fraction<br />
of the root color, the fraction of the splat color, and the<br />
fraction of the vector head color that the endpoint of that<br />
segment should be. A random jitter is added to this fin<strong>al</strong><br />
color. The jittering is controlled by a sc<strong>al</strong>e factor for each<br />
component. All computations are performed in HSV<br />
space, with the hue wrapping around from one to zero, and<br />
the saturation and v<strong>al</strong>ue components clamped at zero and<br />
one. A transparency v<strong>al</strong>ue is <strong>al</strong>so specified at each segment.<br />
No jittering is applied to this.<br />
Figure 14 shows our tornado with very sparse and<br />
opaque hairs. With these settings you can clearly see the<br />
hairs coming from the norm<strong>al</strong> direction and bending into<br />
the velocity direction. Figure 15 has more hairs that are<br />
much more transparent.<br />
Conclusions<br />
How do these techniques relate to each other and previously<br />
developed techniques? Table 1. correlates 3D vector<br />
field visu<strong>al</strong>ization techniques to various attributes and<br />
problem tasks. Our motto throughout this research is that<br />
we are not developing better techniques, but expanding on<br />
the set of tools available. Different scientists can gain insight<br />
better with different tools and many tools are usu<strong>al</strong>ly<br />
required in an an<strong>al</strong>ysis. We have not tried to be <strong>al</strong>l encompassing<br />
or thorough. There are many other techniques that<br />
should be added: stream tubes, topology extraction, shaded<br />
particles, etc. There are <strong>al</strong>so many other characteristics<br />
that should be considered. Hopefully it is a useful starting<br />
point.<br />
Acknowledgments<br />
This work was performed under the auspices of the<br />
U.S. Department of Energy by Lawrence Livermore Nation<strong>al</strong><br />
Laboratory under contract number W-7405-ENG-<br />
48, with specific support from an intern<strong>al</strong> LDRD grant.<br />
Barry Becker helped with some of the programming and<br />
debugging, and Jan Nunes helped with the video production.<br />
Th HEPA filter data is courtesry of Bob Corey at<br />
LLNL. The Aerogel data is courtesy of Tony Ladd and<br />
Elaine Chandler, both at LLNL. We would <strong>al</strong>so like to<br />
thank the reviewers for their v<strong>al</strong>uable comments.
Hedgehogs<br />
Particle<br />
Trace<br />
Stream<br />
Line<br />
Stream<br />
Ribbon<br />
Flow<br />
Volume Textured<br />
Splats<br />
Stream<br />
Surface<br />
LIC<br />
Spot<br />
Noise<br />
Line<br />
Bundles<br />
Constrai<br />
ned<br />
Stream<br />
Lines<br />
Dimension<strong>al</strong>ity 0D/1D 0D 1D 2D 3D 3D 2D/3D 2D/3D 3D 3D 2D 2D<br />
Hardware<br />
Accelerated<br />
Doesn’t<br />
Require<br />
Advection<br />
Dynamic<br />
Motion<br />
Glob<strong>al</strong><br />
Representation<br />
● ● ● ● ● ● ❍ ❍ ● ● ● ◗<br />
● ❍ ❍ ❍ ❍ ● ❍ ❍ ❍ ● ❍ ●<br />
❍ ● ❍ ❍ ◗ ● ❍ ● ● ❍ ● ❍<br />
◗ ❍ ❍ ❍ ● ● ◗ ● ● ● ❍ ❍<br />
Near Surfaces ❍ ❍ ❍ ❍ ❍ ◗ ❍ ◗ ● ◗ ● ●<br />
Near<br />
Tangenti<strong>al</strong><br />
Surfaces<br />
Unsteady<br />
Flows<br />
❍ ❍ ❍ ❍ ❍ ❍ ● ● ● ● ● ❍<br />
❍ ● ❍ ❍ ◗ ● ❍ ◗ ❍ ● ❍ ◗<br />
User Probing ❍ ● ● ● ● ❍ ◗ ❍ ❍ ❍ ❍ ❍<br />
Interactive<br />
Rendering<br />
References<br />
◗ ● ● ● ● ◗ ◗ ❍ ◗ ● ❍ ●<br />
Table 1: Comparison of 3D Vector Field Visu<strong>al</strong>ization Techniques<br />
[Cabr<strong>al</strong>93] Brian Cabr<strong>al</strong> and Lieth Leedom, “Imaging vector<br />
fields using line integr<strong>al</strong> convolution,” Computer Graphics<br />
Proceedings, Annu<strong>al</strong> Conference Series, ACM Siggraph,<br />
New York (1993) pp. 263 - 270<br />
[Crawfis92] Roger Crawfis and Nelson Max, “Direct volume visu<strong>al</strong>ization<br />
of three dimension<strong>al</strong> vector fields,” Proceedings,<br />
1992 Workshop on Volume Visu<strong>al</strong>ization, ACM Siggraph,<br />
New York (1992) pp. 261 - 266<br />
[Crawfis93] Roger Crawfis and Nelson Max, “Texture splats for<br />
3D sc<strong>al</strong>ar and vector field visu<strong>al</strong>ization,” Proceedings, Visu<strong>al</strong>ization<br />
’93, IEEE Computer Society Press, Los Alamitos,<br />
CA (1993) pp. 261 - 266<br />
[Forsell94] Lisa Forssell, “Visu<strong>al</strong>izing flow over curvilinear grid<br />
surfaces using line integr<strong>al</strong> convolution,” these proceedings.<br />
Levoy88] Mark Levoy, “Display of surfaces from volume data,”<br />
IEEE Computer Graphics and Applications Vol. 8, No. 5<br />
(May 1988) pp. 29 - 37<br />
[Shoup79] Richard Shoup “Color table animation,” Computer<br />
Graphics Vol. 13 No. 4 (August 1979) pp. 8 - 13<br />
[Stolk92] J. Stolk and J. J. van Wijk “Surface particles for 3D<br />
flow visu<strong>al</strong>ization,” in “Advances in Scientific Visu<strong>al</strong>iza-<br />
Hairs<br />
tion,” F. H. Post and A. J. Hin, eds., Springer, Berlin (1992)<br />
pp. 119 - 130<br />
[VanGelder92] Allen Van Gelder and Jane Wilhelms, “Interactive<br />
animated visu<strong>al</strong>ization of flow fields,” Proceedings, 1992<br />
Workshop on Volume Visu<strong>al</strong>ization, ACM, New York (1992)<br />
pp. 47 - 54<br />
[vanWijk91] J. J. van Wijk “Spot noise: texture synthesis for data<br />
visu<strong>al</strong>ization,” Computer Graphics Vol. 25 No. 4 (July 1991)<br />
pp. 309 - 318<br />
[vanWijk93] J. J. van Wijk “Flow visu<strong>al</strong>ization with surface particles,”<br />
IEEE Computer Graphics and Applications Vol. 13<br />
No. 4 (July 1993) pp. 18 - 24
Figure 3.Spot noise rendering of HEPA filter..<br />
Figure 9. Projected Streamlines - XY Projection.<br />
Figure 13. Line bundle rendering of HEPA filter.<br />
Figure 4. Spot noise near filter fibers.<br />
Figure 12. Line bundle near aerogel surface.<br />
Figure 15. Finer hair on tornado velocity contour.
Abstract<br />
Time�dependent �unsteady� �ow �elds are com�<br />
monly generated in Computation<strong>al</strong> Fluid Dynamics<br />
�CFD� simulations� however� there are very few �ow<br />
visu<strong>al</strong>ization systems that generate particle traces in<br />
unsteady �ow �elds. Most existing systems generate<br />
particle traces in time�independent �ow �elds. A par�<br />
ticle tracing system has been developed to generate par�<br />
ticle traces in unsteady �ow �elds. The system was<br />
used to visu<strong>al</strong>ize sever<strong>al</strong> 3D unsteady �ow �elds from<br />
re<strong>al</strong>�world problems� and it has provided useful insights<br />
into the time�varying phenomena in the �ow �elds.<br />
In this paper� the design requirements and the archi�<br />
tecture of the system are described. Some examples of<br />
particle traces computed by the system are <strong>al</strong>so shown.<br />
1 Introduction<br />
Particle systems were introduced in �14� to model<br />
fuzzy objects like �re� clouds� and water. For this type<br />
of particle system� the motion of the particle is based<br />
on some stochastic model. Extensions to this type<br />
of particle system have included modeling of snow�<br />
grass� smoke� and �reworks. In CFD� particle traces<br />
can be used to visu<strong>al</strong>ize sever<strong>al</strong> time�varying phenom�<br />
ena in the �ow �eld. For example� vortex shedding�<br />
formation� and separation �15�. When particle traces<br />
are used in this context� the motion of the particle is<br />
based on the physic<strong>al</strong> velocity from the �ow �eld.<br />
An instantaneous streamline is a curve that is tan�<br />
gent to the vector �eld at an instant in time. In time�<br />
independent �steady� �ow� instantaneous streamlines<br />
are computed from the �ow �eld at an instant in time.<br />
A streakline is a line joining the positions at an instant<br />
in time of <strong>al</strong>l particles that have been released from<br />
a �xed location� c<strong>al</strong>led the seed location. In unsteady<br />
�ow� streaklines are computed from sever<strong>al</strong> thousand<br />
UFAT � A Particle Tracer<br />
for Time�Dependent Flow Fields<br />
David A. Lane<br />
Computer Sciences Corporation<br />
NASA Ames Research Center<br />
M�S T27A�2<br />
Mo�ett Field� CA 94035<br />
time steps. Streaklines are commonly simulated by<br />
releasing particles continuously from the seed loca�<br />
tions at each time step. In hydrodynamics� streaklines<br />
are simulated by releasing hydrogen bubbles rapidly<br />
from the seed locations. Instantaneous streamlines<br />
and streaklines are identic<strong>al</strong> in steady �ow �elds.<br />
In this paper� I introduce a particle tracing sys�<br />
tem c<strong>al</strong>led Unsteady Flow An<strong>al</strong>ysis Toolkit �UFAT��<br />
which generates particle traces in unsteady �ow �elds.<br />
UFAT di�ers from existing systems in that it com�<br />
putes streaklines from a large number of time steps�<br />
performs particle tracing in �ow �elds with moving<br />
grids� provides a save�restore option� and supports<br />
playback. Preliminary results of UFAT were presented<br />
in �10�. This paper describes the design requirements<br />
and the architecture of UFAT. First� the basic problem<br />
of particle tracing in unsteady �ow �elds is described.<br />
The design requirements and the particle tracing <strong>al</strong>�<br />
gorithms of UFAT are then described. Examples of<br />
streaklines computed for three re<strong>al</strong>�world problems are<br />
shown� and the performance of UFAT is an<strong>al</strong>yzed. Fi�<br />
n<strong>al</strong>ly� future enhancements for UFAT are discussed.<br />
2 Particle Tracing<br />
The basic problem of particle tracing can be stated<br />
as follows� assume that a vector function � V �p� t� is<br />
de�ned for <strong>al</strong>l p in the domain D and t 2 �t1� t n��<br />
where n is the number of time steps in the unsteady<br />
�ow. For any particle p 2 D� �nd the path of p. The<br />
path of p is governed by the following equation�<br />
dp<br />
dt � � V �p� t�� �1�<br />
The path of p can be found by numeric<strong>al</strong>ly integrating<br />
Equation �1�. Sever<strong>al</strong> schemes can be used to inte�<br />
grate the above equation. A common scheme is the
second�order Runge�Kutta integration with adaptive<br />
stepsizing. Let p0 be the initi<strong>al</strong> point �the seed loca�<br />
tion� of the particle p and k � 0. Then�<br />
p � � p k � h � V �p k� t��<br />
p k�1 � p k � h� � V �p k� t� � � V �p � � t � h���2�<br />
t � t � h and k � k � 1� �2�<br />
where h � c�max� � V �p k��� max�� is the maximum ve�<br />
locity component of � V �p k�� and 0 � c � 1� The con�<br />
stant c controls the step size of the particle. If c is<br />
sm<strong>al</strong>l� then the particle will traverse many steps in<br />
the grid cell. Sm<strong>al</strong>l v<strong>al</strong>ues of c should be used for grid<br />
regions with rapidly varying velocity. Otherwise� the<br />
particle p may advance out of the domain in just a<br />
few steps. The integration scheme stated above can<br />
be performed in the physic<strong>al</strong> coordinate space or in<br />
the computation<strong>al</strong> coordinate space. If the integra�<br />
tion is performed in computation<strong>al</strong> space� then it is<br />
simple and fast. During the integration� a cell search<br />
operation is performed to determine the grid cell that<br />
p k�1 lies in. Since the grid domain D is rectilinear<br />
in computation<strong>al</strong> space� the grid cell can be easily de�<br />
termined by taking the integer computation<strong>al</strong> coor�<br />
dinates of p k�1. For example� if the computation<strong>al</strong><br />
coordinates of p k�1 are ��� �� ��� then p k�1 lies in grid<br />
cell �int���� int���� int����. In the physic<strong>al</strong> coor�<br />
dinate space� the grid domain D is curvilinear. The<br />
cell search operation usu<strong>al</strong>ly requires performing an<br />
iterative <strong>al</strong>gorithm to �nd the cell that p k�1 lies in.<br />
A common <strong>al</strong>gorithm used is the Newton�Raphson<br />
method. Although particle integration can be done<br />
faster in the computation<strong>al</strong> coordinate space than in<br />
the physic<strong>al</strong> coordinate space� integrating in compu�<br />
tation<strong>al</strong> space may be inaccurate if there are singular�<br />
ities in the grid. For computation<strong>al</strong> space integration�<br />
physic<strong>al</strong> velocities are transformed into computation<strong>al</strong><br />
velocities. Singularities in the grid could result in in��<br />
nite transformed velocities �4�. For this reason� UFAT<br />
performs particle integration in physic<strong>al</strong> space.<br />
If the grid is moving in time� then p k�1 is likely<br />
to be in a grid cell di�erent from the cell that p k lies<br />
in. To determine the cell that p k�1 lies in� the cell<br />
search operation discussed above is performed. If the<br />
grid consists of sever<strong>al</strong> blocks �a type of grid known<br />
as a multi�block grid�� then p k�1 may lie in a block<br />
di�erent from the block that p k lies in. If p k is near<br />
the boundary of a block� then it is necessary to check<br />
if p k�1 will be in a di�erent block. This <strong>al</strong>so requires a<br />
cell search operation. For a detailed discussion of the<br />
basic problems in particle tracing� see �5� and �13�.<br />
3 Related Work<br />
Presently� many systems are available for steady<br />
�ow visu<strong>al</strong>ization. However� most of these systems<br />
only provide instantaneous visu<strong>al</strong>ization of the �ow<br />
data. For example� instantaneous streamlines� isosur�<br />
faces� and slicing planes. Sever<strong>al</strong> e�ective techniques<br />
were recently developed for interactive interrogation<br />
of instantaneous �ow �elds. Some of these techniques<br />
are described in �6�8�11�. To date� there are very few<br />
particle tracing systems that can generate streaklines<br />
using a large number of time steps from unsteady �ow<br />
�elds. Two of these are Virtu<strong>al</strong> Wind Tunnel �VWT�<br />
�3� and pV3 �7�. VWT provides interactive visu<strong>al</strong>iza�<br />
tion of particle traces in a virtu<strong>al</strong> environment using<br />
a stereo head�tracked display and a data glove. Al�<br />
though VWT is an e�ective interactive tool for un�<br />
steady �ow visu<strong>al</strong>ization� it requires a preprocessing<br />
of the �ow data� and the number of time steps that<br />
the user can visu<strong>al</strong>ize is determined by the memory<br />
size of the system. pV3 <strong>al</strong>lows interactive animation<br />
of unsteady �ow data by looping through an input �le<br />
that contains the names of the �ow data �les. This is<br />
similar to an interactive scripting approach. pV3 does<br />
not save the visu<strong>al</strong>ization results� hence� playback is<br />
not supported and re�c<strong>al</strong>culation is required to repeat<br />
the animation.<br />
4 Requirements<br />
It is common to generate sever<strong>al</strong> thousand time<br />
steps of �ow data in a CFD simulation� however� it<br />
is presently impossible to visu<strong>al</strong>ize �ow data from <strong>al</strong>l<br />
these time steps at one time. Scientists sometimes<br />
use one of the following approaches� �1� visu<strong>al</strong>ize the<br />
data at some snapshots in time or �2� save every nth<br />
time step of the data and then visu<strong>al</strong>ize the subset of<br />
data. Regardless of the approach used� there are usu�<br />
<strong>al</strong>ly hundreds of time steps that need to be visu<strong>al</strong>ized<br />
�10�. A requirement for UFAT is that it must be able<br />
to compute streaklines from a large number of time<br />
steps.<br />
A complex grid usu<strong>al</strong>ly consists of sever<strong>al</strong> grid<br />
blocks. For some grids� one or more grid blocks may<br />
move as a function of time� a characteristic of grids<br />
with rigid�body motion. Moving grids are commonly<br />
used in pitching airfoils� oscillating �aps� rotating tur�<br />
bine fans of combustion engines� and rotating heli�<br />
copter blades. Another requirement for UFAT is that
it must be able to compute particle traces in unsteady<br />
�ow with moving grids.<br />
The ability to visu<strong>al</strong>ize a sc<strong>al</strong>ar quantity in the �ow<br />
data can be cruci<strong>al</strong> for some �ow an<strong>al</strong>ysis. Quantities<br />
that are commonly computed are temperature� pres�<br />
sure� mach number� and density. A requirement for<br />
UFAT is that it must assign a color to each particle<br />
based on the v<strong>al</strong>ue of a speci�ed quantity sampled at<br />
the particle�s location. The color of the particle can<br />
<strong>al</strong>so be based on its position� the time at which it was<br />
released� or the seed location where it was released.<br />
Interactive visu<strong>al</strong>ization of large time�dependent<br />
�ow �elds is di�cult or nearly impossible due to the<br />
data size. Sometimes� a scripting approach is used<br />
to save the visu<strong>al</strong>ization results from each time step�<br />
and the visu<strong>al</strong>ization results are then played back at a<br />
later time. In some visu<strong>al</strong>ization systems� interactive<br />
visu<strong>al</strong>ization is feasible by using one of the following<br />
approaches� �1� preprocess the data so that a number<br />
of time steps can be stored in memory or �2� sample<br />
the �ow data at a lower resolution so that the data<br />
can be stored in memory. By storing the �ow data<br />
in memory� the data can be interactively visu<strong>al</strong>ized.<br />
The latter approach is usu<strong>al</strong>ly not desirable because<br />
the accuracy of the �ow data is lost when the data is<br />
sampled at a lower resolution. With either approach�<br />
the size of the physic<strong>al</strong> memory dictates how much<br />
�ow data can be visu<strong>al</strong>ized interactively. Although<br />
these two approaches can provide interactive visu<strong>al</strong>�<br />
ization� important features may not be detected be�<br />
cause of the reduced representation of the �ow data.<br />
Using a scripting approach� the entire �ow data can be<br />
an<strong>al</strong>yzed. Furthermore� once the visu<strong>al</strong>ization results<br />
have been saved� the scientist can play back the results<br />
repeatedly without any addition<strong>al</strong> computation. Visu�<br />
<strong>al</strong>ization playback is another requirement for UFAT.<br />
5 Unsteady Flow An<strong>al</strong>ysis Toolkit<br />
UFAT was developed to compute streaklines using a<br />
large number of time steps in 3D unsteady �ow �elds.<br />
It handles single and multi� block curvilinear grids�<br />
and the grid may have rigid�body motion. Particles<br />
are released continuously from the speci�ed seed lo�<br />
cations at each time step. The particles are advected<br />
through <strong>al</strong>l time steps until they leave the grid domain.<br />
UFAT saves the current positions of the particles at<br />
each time step� thus� the particle traces can be played<br />
back at a later time. Particles are colored according<br />
to a sc<strong>al</strong>ar quantity. The quantity may be a physic<strong>al</strong><br />
quantity of the �ow �e.g. pressure� temperature� and<br />
density�� a position coordinate �x� y� or z� of the parti�<br />
cle� the time at which the particle was released� or the<br />
seed location where the particle was released. UFAT<br />
uses an adaptive�time integration scheme to advect<br />
the particles in the physic<strong>al</strong> coordinate space. The<br />
integration scheme can be of second or fourth order.<br />
UFAT <strong>al</strong>so <strong>al</strong>lows particles to be traced <strong>al</strong>ong the grid<br />
surface. This type of particle trace simulates oil �ow<br />
on a surface. Sometimes� the available disk on a sys�<br />
tem may not be able to store <strong>al</strong>l time steps of �ow<br />
data. UFAT provides a save�restore option so that<br />
particle tracing can be performed in sever<strong>al</strong> run ses�<br />
sions. This <strong>al</strong>lows particle traces to be computed from<br />
many time steps without requiring <strong>al</strong>l time steps to be<br />
online at one time.<br />
5.1 Data Structure<br />
In order to advect particles through <strong>al</strong>l time steps�<br />
UFAT stores the two most recent time steps of the �ow<br />
data in memory. Particles are successively advected<br />
from the current time step to the next time step. The<br />
particle traces are stored in a two�dimension<strong>al</strong> array<br />
of size N s � N t� where N s is the number of seed lo�<br />
cations and N t is the number of time steps. Each<br />
entry in the array is a structure that contains the<br />
physic<strong>al</strong> and computation<strong>al</strong> coordinates of the parti�<br />
cle and the time at which the particle was released<br />
from the seed location. There is <strong>al</strong>so an array of size<br />
N s that stores the number of particles in each trace.<br />
Let T race Length�s� denote the number of particles in<br />
trace s� and it is initi<strong>al</strong>ized to zero. At each time step�<br />
a new particle is released from the seed location and<br />
T race Length�s� is incremented by one. When a parti�<br />
cle in trace s leaves the grid domain� T race Length�s�<br />
is decremented by one.<br />
5.2 Algorithm<br />
This section outlines the particle tracing <strong>al</strong>�<br />
gorithm in UFAT. The following procedures in<br />
the <strong>al</strong>gorithm are described� Step Through Time���<br />
Advect Trace��� and Advect Particle��. Proce�<br />
dure Step Through Time�� steps through <strong>al</strong>l time<br />
steps in the given �ow data and c<strong>al</strong>ls Advect Trace��.<br />
The main task of procedure Advect Trace�� is to<br />
advect the active particles in <strong>al</strong>l traces from the<br />
current time step to the next time step. The ac�<br />
tu<strong>al</strong> particle integration is performed in procedure<br />
Advect Particle��. For brevity� let current time de�<br />
note the current time step and next time denote the<br />
next time step. For each procedure� a description is<br />
given followed by the pseudocode of the procedure.<br />
Procedure Step Through Time�� begins by loading<br />
the �rst two time steps of the �ow and grid data
into memory. If the grid is �xed� then only one<br />
grid is loaded into memory. Then� it steps through<br />
<strong>al</strong>l time steps in the �ow data. For each time step�<br />
the following tasks are performed� �1� C<strong>al</strong>l procedure<br />
Advect Trace�� to advect particles in every trace<br />
from current time to next time. �2� Write the cur�<br />
rent particle traces to the trace �le. A frame marker<br />
is <strong>al</strong>so written to denote the end of each time step.<br />
�3� Read the next time step�s �ow. If the grid is mov�<br />
ing in time� then read the next time step�s grid. The<br />
pseudocode for this procedure is given below�<br />
Procedure Step Through Time��<br />
Read first two time steps of flow and grid data<br />
For t � 1 to Nt � 1 do<br />
Advect Trace�t� t � 1�<br />
Write current traces to the trace file<br />
Read the next time step�s flow data<br />
If moving grid then<br />
Read the next time step�s grid<br />
End for<br />
Procedure Advect Trace�� advects particles in ev�<br />
ery trace from current time to next time. The pro�<br />
cedure performs the following steps for each trace�<br />
�1� Copy <strong>al</strong>l particles in the trace to a working trace<br />
array w. �2� C<strong>al</strong>l procedure Advect Particle�� to<br />
advect each particle in the working trace w from<br />
current time to next time. If the particle is inside<br />
the grid domain D after the advection� then the par�<br />
ticle is saved to the trace. Otherwise� the particle is<br />
considered to be inactive and it is discarded. �3� Re�<br />
lease a new particle from the trace�s seed location and<br />
save the particle in the trace. The pseudocode for this<br />
procedure is as follows�<br />
Procedure Advect Trace�current time� next time�<br />
For s � 1 to Ns do<br />
Copy trace s to working trace w<br />
W Length � T race Length�s�<br />
Remove <strong>al</strong>l particles in trace s<br />
T race Length�s� � 0<br />
For i � 1 to W Length do<br />
p � the ith particle in working trace w<br />
Advect Particle�current time� next time� p�<br />
If p 2 D then<br />
Store p in trace s<br />
T race Length�s� � T race Length�s� � 1<br />
End if<br />
End for<br />
Release a new particle from seed s and<br />
store it in trace s<br />
T race Length�s� � T race Length�s� � 1<br />
End for<br />
Procedure Advect Particle�� advects the given<br />
particle p from current time to next time. The pseu�<br />
docode shown below uses the second�order Runge�<br />
Kutta integration scheme given in Equation �2� and<br />
is based on a predictor�corrector <strong>al</strong>gorithm used in<br />
PLOT3D �5�. The �ow data is only given at some<br />
number of time steps. If t 6� t i for i � 1� � � � � N t�<br />
then an interpolation in time is performed. Since the<br />
velocity is known only at discrete points in the grid�<br />
when p does not coincide with a grid point� a trilinear<br />
interpolation in physic<strong>al</strong> space is <strong>al</strong>so performed. Fol�<br />
lowing are the steps in procedure Advect Particle���<br />
�1� Initi<strong>al</strong>ize t to current time. The variable t is in�<br />
cremented at each advection and the procedure exits<br />
when t � next time or when the particle has left the<br />
grid domain D. �2� Interpolate the velocity � V at p. �3�<br />
Compute the time increment h� where h � c�max� � V �<br />
and c is a fraction of the grid cell that each particle<br />
must take inside the cell. The constant c can be con�<br />
sidered as a norm<strong>al</strong>ized stepsize and 0 � c � 1. For<br />
example� if the particle must traverse �ve steps in a<br />
cell� then let c � 0�2. �4� Increment t by h. �5� Com�<br />
pute the predictor p � . �6� Interpolate the velocity � V �<br />
at p � . �7� Compute the corrector� which is the posi�<br />
tion of p after the advection. Below is the pseudocode<br />
for procedure Advect Particle��.<br />
Procedure Advect Particle�current time� next time� p�<br />
t � current time<br />
While �t � next time AND p 2 D � do<br />
�V � Interpolate Velocity�p� t� current time�<br />
next time�<br />
Adjust�<br />
h � c�max��V �<br />
If �t � h � next time� h � next time � t<br />
t � t � h<br />
f Predictor step g<br />
p � � p � h � � V<br />
�V � � Interpolate Velocity�p � � t � h�<br />
current time� next time�<br />
f Adaptive stepsizing g<br />
�Vtot<strong>al</strong> � ��V � �V � ��2<br />
If �h � max��Vtot<strong>al</strong>� � c� then<br />
�V � �Vtot<strong>al</strong><br />
t � t � h<br />
Goto Adjust<br />
Endif<br />
f Corrector step g<br />
p � p � h � � � V � � V � ��2<br />
End while<br />
Although the pseudocode shown above only pro�<br />
vides a second�order integration scheme� a fourth�<br />
order integration scheme has <strong>al</strong>so been implemented in
UFAT. Procedure Interpolate Velocity��� which is<br />
not shown� interpolates velocity in time followed by a<br />
trilinear interpolation in the physic<strong>al</strong> space. When a<br />
new position for p is computed� a cell search step is<br />
performed to determine the grid cell that p lies in �see<br />
Section 2�.<br />
5.3 Animation<br />
The most e�ective method to view streaklines is to<br />
animate the particle traces. UFAT saves streaklines<br />
at each given time step to a trace �le� which can then<br />
be animated with a visu<strong>al</strong>ization system. Although<br />
particles may traverse in non�uniform time steps� the<br />
positions of the particles are sampled at uniform time<br />
steps �i.e. the given time steps�. The particle trace<br />
�le contains basic graphics primitives such as points<br />
and lines. These basic primitives can be written in<br />
a format so that they can be easily read by other vi�<br />
su<strong>al</strong>ization systems such as AVS� IRIS Explorer� and<br />
FAST �2�. The only requirement for the visu<strong>al</strong>ization<br />
system is that it must be able to animate the streak�<br />
lines through a given sequence of time steps.<br />
6 Distributed Visu<strong>al</strong>ization<br />
It is common that an unsteady �ow data set is too<br />
large to be stored loc<strong>al</strong>ly on a graphics workstation.<br />
The �ow data set is often stored on a remote system<br />
with a large disk capacity. The computation is then<br />
performed on the remote system while the results are<br />
sent over the network to the graphics workstation for<br />
interactive visu<strong>al</strong>ization. The data transfer rate on<br />
the network must be fast enough so that the image<br />
on the graphics workstation can be updated at least<br />
15 frames per second for a reasonable animation. The<br />
size of the particle traces at each time step is relatively<br />
sm<strong>al</strong>l compared to the size of the grid �le. Thus� the<br />
particle traces at each time step can be sent over the<br />
network in a reasonably short period of time. If the<br />
grid is moving in time� then a new grid must <strong>al</strong>so<br />
be sent over the network at each time step. It may<br />
take sever<strong>al</strong> seconds to transfer a grid consisting of<br />
sever<strong>al</strong> million grid points� depending on the speed of<br />
the network. Hence� distributed �ow visu<strong>al</strong>ization is<br />
practic<strong>al</strong> if the data transfer rate of the network is fast<br />
enough to handle the amount of data that will be sent<br />
over the network.<br />
7 Results<br />
This section shows some streaklines that were com�<br />
puted by UFAT for three unsteady �ow data sets. Al�<br />
though the examples shown in this section are only<br />
from CFD applications� other applications with time�<br />
dependent �ow data can easily use UFAT to gener�<br />
ate streaklines. The input data must consist of the<br />
grid geometry and the �ow quantities sampled at the<br />
grid points. Currently� UFAT only supports curvilin�<br />
ear grids.<br />
The �rst data set is a clipped Delta Wing with con�<br />
trol surfaces� which oscillate at a frequency of eight<br />
Hertz �Hz� and with an amplitude of 6.65 degrees.<br />
Each oscillation cycle consists of 5�000 time steps. For<br />
visu<strong>al</strong>ization purpose every 50th time step is saved�<br />
for a tot<strong>al</strong> of 100 time steps per cycle. The clipped<br />
Delta Wing grid consists of 250 thousand points in<br />
seven blocks. For this CFD simulation� the scientists<br />
ev<strong>al</strong>uated a new zoning method c<strong>al</strong>led �virtu<strong>al</strong> zones��<br />
which is used for grids with time�varying boundary<br />
conditions. Virtu<strong>al</strong> zones simplify the grid genera�<br />
tion problem for complex geometries and for time�<br />
dependent geometries �9�. Figure 1 shows the seed<br />
locations� which are colored by position� at the lead�<br />
ing edge of the clipped Delta Wing. Figure 2 shows<br />
streaklines at time step 7� where the control surfaces<br />
have de�ected 2 degrees up. The evenly spaced parti�<br />
cle traces �colored in cyan� near the center of the wing<br />
indicates that the �ow is relatively steady in that re�<br />
gion. However� the �ow is very turbulent near the<br />
tip of the wing. Figure 3 shows the streaklines after<br />
the control surfaces have completed one oscillation. At<br />
this time� the control surfaces have de�ected 5 degrees<br />
up. This �gure shows that some particles �colored in<br />
red�� which were released from the outer part of the<br />
leading edge of the wing� have moved toward the tip<br />
of the wing due to the control surfaces. This behavior<br />
can be seen clearly in an animation of the streaklines.<br />
The second data set is an arrow wing con�guration<br />
of a supersonic transport in transonic regime. Tran�<br />
sonic �utter is known as a design problem on this con�<br />
�guration. Scientists want to develop a computation<strong>al</strong><br />
tool to examine the in�uence of control surface oscil�<br />
lations on the lift of the transport for the suppression<br />
of the �utter. The arrow wing grid consists of ap�<br />
proximately one million points in four blocks. The<br />
control surfaces oscillate at a frequency of 15 Hz and<br />
with an amplitude of 8 degrees. Figure 4 shows streak�<br />
lines surrounding the transport at time steps 25 and<br />
175. The particles are colored by their seed locations�<br />
where the particles were released. It can be seen that<br />
there is vortic<strong>al</strong> separation from the leading edges of<br />
the wing. From the simulation� it was found that<br />
the symmetric oscillation produces higher lift than the<br />
anti�symmetric oscillation �12�.
The third data set is the proposed airborne observa�<br />
tory known as the Stratospheric Observatory For In�<br />
frared Astronomy �SOFIA�. SOFIA is a modi�ed Boe�<br />
ing 747SP transport with a large cavity that holds a<br />
three�meter class telescope. The CFD scientists want<br />
to assess the safety and optic<strong>al</strong> performance of a large<br />
cavity in the 747SP �1�. SOFIA would be the successor<br />
to the Kuiper Airborne Observatory �KAO�� which is<br />
the only aircraft in the world that currently provides<br />
this type of infrared observing capability. SOFIA con�<br />
sists of approximately four million points in 41 grids.<br />
A tot<strong>al</strong> of 50 time steps were saved for the visu<strong>al</strong>�<br />
ization. Figure 5 shows streaklines surrounding the<br />
SOFIA airborne observatory at time step 40. In the<br />
�gure� the telescope �parti<strong>al</strong>ly visible� inside the cav�<br />
ity of the jet is colored in cyan. The particles are<br />
colored by the time of their release from a rake posi�<br />
tioned in the aperture of the cavity. Blue represents<br />
the earliest time and orange represents the most re�<br />
cent time. Figure 6 shows a close�up view of the tele�<br />
scope without the aircraft body. The �oating object<br />
�colored in gray� above the telescope is the secondary<br />
mirror of the telescope. The cavity is represented by<br />
the semitransparent surface enclosing the telescope.<br />
Note that some particles are trapped inside the cavity�<br />
while some have escaped and passed the empennage.<br />
8 Performance<br />
The performance of UFAT depends on three fac�<br />
tors� �1� the grid size� �2� the number of time steps�<br />
and �3� the number of seed locations. At each time<br />
step� UFAT reads the �ow data �le �and the grid �le<br />
if the grid is moving in time�. Depending on the disk<br />
I�O rate and the grid size� it could take from sever<strong>al</strong><br />
seconds up to sever<strong>al</strong> minutes to read the �ow and<br />
grid �les at each time step. For example� if the disk<br />
I�O rate is 10 megabytes per second� then it would<br />
take approximately 1.2 seconds to read a grid �le with<br />
one million grid points� assuming that there are three<br />
physic<strong>al</strong> coordinates �x� y� and z� for each grid point.<br />
If the �ow data �le �solution �le� contains �ve sc<strong>al</strong>ar<br />
quantities� then it would take approximately 2.0 sec�<br />
onds to read the �le. Thus� it would require a tot<strong>al</strong> of<br />
3.2 seconds per time step to read the grid and solu�<br />
tion data. The number of particles that UFAT advects<br />
at each time step increases linearly. If there are 100<br />
seed locations and 1�000 time steps� then the maxi�<br />
mum number of particles that UFAT can advect at<br />
time step 1�000 is 100�000 particles. Using the clipped<br />
Delta Wing as an example� it took approximately 2.3<br />
seconds to read a grid �le and 3.0 seconds to read<br />
a solution �le at each time step on a Silicon Graph�<br />
ics 320 VGX graphics workstation. The size of the<br />
grid �le is four megabytes and the solution �le is �ve<br />
megabytes. It took approximately 21 minutes to com�<br />
pute streaklines from 100 time steps and with 36 seed<br />
locations using a single 33�megahertz processor on the<br />
VGX graphics workstation. This includes the time<br />
to read the grid and solution �les at each time step.<br />
The size of the trace �le generated by UFAT is 2.5<br />
megabytes.<br />
9 Future Work<br />
A disadvantage of the current version of UFAT is<br />
that it performs particle tracing sequenti<strong>al</strong>ly. Particle<br />
tracing is an �embarrassingly� par<strong>al</strong>lel application. It<br />
would be ide<strong>al</strong> to take advantage of multiple proces�<br />
sors to perform particle tracing in par<strong>al</strong>lel since each<br />
particle trace can be computed independently. A par�<br />
<strong>al</strong>lel version of UFAT has been developed on the Cray<br />
C90� Convex C3240� and SGI systems. The initi<strong>al</strong> re�<br />
sults indicate that the performance can be improved<br />
by sever<strong>al</strong> factors� depending on the number of proces�<br />
sors used. Another enhancement that is currently be�<br />
ing investigated is how to distribute the particle trac�<br />
ing task to a cluster of heterogeneous systems using a<br />
message passing library. An issue to be worked out is<br />
how to minimize the amount of data that each system<br />
needs for particle trace computation. The go<strong>al</strong> is to<br />
have a distributed par<strong>al</strong>lel version of UFAT that would<br />
provide interactive particle tracing in large�sc<strong>al</strong>e un�<br />
steady �ow �elds.<br />
Acknowledgments<br />
The �ow data sets were provided by Chris Atwood�<br />
Goetz Klopfer� Steve Klotz� and Shigeru Obayashi.<br />
This work was supported by NASA under contract<br />
NAS 2�12961.<br />
References<br />
�1� Atwood� C. and van D<strong>al</strong>sem� W.� Flow�eld Sim�<br />
ulation about the Stratospheric Observatory for<br />
Infrared Astronomy� AIAA Journ<strong>al</strong> of Aircraft�<br />
Monterey� C<strong>al</strong>ifornia� September 1993� pp. 719�<br />
727.<br />
�2� Bancroft� G.� Merritt� F.� Plessel� T.� Kelaita� P.�<br />
McCabe� K.� and Globus� A.� FAST� A Multi�<br />
Processed Environment for Visu<strong>al</strong>ization of Com�<br />
putation<strong>al</strong> Fluid Dynamics� in� A. Kaufman� ed.�<br />
Proceedings of Visu<strong>al</strong>ization �90� San Francisco�<br />
C<strong>al</strong>ifornia� October 1990� pp. 14�27.
�3� Bryson� S. and Levit� C.� The Virtu<strong>al</strong> Wind Tun�<br />
nel� IEEE Computer Graphics � Applications�<br />
Vol. 12� No. 4� July 1992� pp. 25�34.<br />
�4� Buning� P.� Sources of error in the graphic<strong>al</strong> an<strong>al</strong>�<br />
ysis of CFD results� Journ<strong>al</strong> of Scienti�c Comput�<br />
ing� Vol. 3� No. 2� 1988� pp. 149�164.<br />
�5� Buning� P. and Steger� J.� Graphics and Flow<br />
Visu<strong>al</strong>ization in Computation<strong>al</strong> Fluid Dynamics�<br />
7th Computation<strong>al</strong> Fluid Dynamics Conference�<br />
Cincinnati� Ohio� July 1985� AIAA 85�1507.<br />
�6� de Leeuw� W. and van Wijk� J.� A Probe for Loc<strong>al</strong><br />
Flow Field Visu<strong>al</strong>ization� in� G. Nielson and D.<br />
Bergeron� eds.� Proceedings of Visu<strong>al</strong>ization �93�<br />
San Jose� C<strong>al</strong>ifornia� October 1993� pp. 39�45.<br />
�7� Haimes� R.� pV3� A Distributed System for<br />
Large�Sc<strong>al</strong>e Unsteady CFD Visu<strong>al</strong>ization� 32nd<br />
AIAA Aerospace Sciences Meeting and Exhibit�<br />
Reno� Nevada� January 1994.<br />
�8� Hin� A. and Post� F.� Visu<strong>al</strong>ization of Turbulent<br />
Flow with Particles� in� G. Nielson and D. Berg�<br />
eron� eds.� Proceedings of Visu<strong>al</strong>ization �93� San<br />
Jose� C<strong>al</strong>ifornia� October 1993� pp. 46�52.<br />
�9� Klopfer� G. and Obayashi� S.� Virtu<strong>al</strong> Zone<br />
Navier�Stokes Computations for Oscillating Con�<br />
trol Surfaces� 11th Computation<strong>al</strong> Fluid Dynam�<br />
ics Conference� Orlando� Florida� July 1993�<br />
AIAA 93�3363�CP.<br />
�10� Lane� D.� Visu<strong>al</strong>ization of Time�Dependent Flow<br />
Fields� in� G. Nielson and D. Bergeron� eds.� Pro�<br />
ceedings of Visu<strong>al</strong>ization �93� San Jose� C<strong>al</strong>ifor�<br />
nia� October 1993� pp. 32�38.<br />
�11� Max� N.� Becker� B.� and Craw�s� R.� Flow Vol�<br />
umes for Interactive Vector Field Visu<strong>al</strong>ization�<br />
in� G. Nielson and D. Bergeron� eds.� Proceedings<br />
of Visu<strong>al</strong>ization �93� San Jose� C<strong>al</strong>ifornia� Octo�<br />
ber 1993� pp. 19�24.<br />
�12� Obayashi� S.� Chui� I.� and Guruswamy� G.�<br />
Navier�Stokes Computations on Full�Span Wing�<br />
Body Con�guration with Oscillating Control Sur�<br />
faces� AIAA Atmospheric Flight Mechanics Con�<br />
ference� August 1993� AIAA�93�3687.<br />
�13� Post� F. and van W<strong>al</strong>sum� T.� Fluid Flow Visu<strong>al</strong>�<br />
ization� in� H. Hagen� H. Mueller� and G. Nielson�<br />
eds.� Focus on Scienti�c Visu<strong>al</strong>ization� Springer�<br />
Berlin� 1993� pp. 1�40.<br />
�14� Reeves� W.� Particle Systems � A Technique for<br />
Modeling a Class of Fuzzy Objects� ACM Trans�<br />
action on Graphics� Vol. 2� 1983� pp. 91�108.<br />
�15� Schlichting� H.� Boundary Layer�Theory� Mc�<br />
Graw Hill� New York� 1979.
The Design and Implementation of the Cortex Visu<strong>al</strong>ization System<br />
Deb Banerjee Chris Morley Wayne Smith<br />
Abstract<br />
Cortex has been designed for interactive an<strong>al</strong>ysis<br />
and display of simulation data generated by CFD ap�<br />
plications based on unstructured�grid solvers. Unlike<br />
post�processing visu<strong>al</strong>ization environments� Cortex is<br />
designed to work in co�processing mode with the CFD<br />
application. This signi�cantly reduces data storage<br />
and data movement requirements for visu<strong>al</strong>ization and<br />
<strong>al</strong>so <strong>al</strong>lows users to interactively steer the application.<br />
Further� Cortex supports high�performance by running<br />
on massively par<strong>al</strong>lel computers and workstation clus�<br />
ters.<br />
An important go<strong>al</strong> for Cortex is to provide visu<strong>al</strong>�<br />
ization to a variety of solvers which di�er in their so�<br />
lution methodologies and supported �ow models. Cou�<br />
pled with the co�processing requirement� this has re�<br />
quired the development of a well de�ned programming<br />
interface to the CFD solver that lets the the visu<strong>al</strong>iza�<br />
tion system communicate e�ciently with the solver�<br />
and requires minim<strong>al</strong> programming e�ort for porting<br />
to new solvers. Further� the requirement for targeting<br />
multiple solvers and application niches demands that<br />
the visu<strong>al</strong>ization system be rapidly and easily modi��<br />
able. Such �exibility is attained in Cortex by using<br />
the high�level� interpreted language Scheme for im�<br />
plementing user�interfaces and high�level visu<strong>al</strong>ization<br />
functions. By making the Scheme interpreter avail�<br />
able from the Cortex text interface� the user can <strong>al</strong>so<br />
customize and extend the visu<strong>al</strong>ization system.<br />
1 Introduction<br />
Cortex is a visu<strong>al</strong>ization system developed for in�<br />
teractive control and visu<strong>al</strong>ization of simulations per�<br />
formed with a variety of unstructured CFD solver<br />
codes. Most current visu<strong>al</strong>ization systems for CFD<br />
are either post�processing systems�1� 6� or data�ow<br />
Fluent Inc.<br />
Centerra Resource Park<br />
Lebanon� NH 03766<br />
fdeb�cmm�wasg��uent.com<br />
visu<strong>al</strong>ization�13� systems. Post�processing systems<br />
read in data which the CFD application has written<br />
out to disk in a format recognizable by the visu<strong>al</strong>iza�<br />
tion system. A drawback of this paradigm is that it<br />
hinders interactivity. The user cannot conveniently<br />
observe the solution as it evolves or modify �ow�<br />
solution parameters in response to those observations.<br />
Data�ow visu<strong>al</strong>izations systems <strong>al</strong>low co�processing<br />
where the CFD application can run as a module in<br />
the network. This lets the user observe the �ow��eld<br />
at frequent interv<strong>al</strong>s as the solution evolves. However�<br />
the visu<strong>al</strong>ization modules in the network may require<br />
a copy of the �ow��eld to perform the visu<strong>al</strong>ization. In<br />
addition to increasing data storage requirements� such<br />
data movement can cause signi�cant network commu�<br />
nication when the CFD application runs on a remote<br />
compute�server and the rendering modules run on the<br />
users loc<strong>al</strong> workstation. Addition<strong>al</strong>ly� in data�ow sys�<br />
tems the �ow of data is directed from the applica�<br />
tion towards the display. Features such as application<br />
steering and data probes require data��ow in the re�<br />
verse direction � from the user�interface or display to<br />
the CFD application. Cortex is a co�processing visu�<br />
<strong>al</strong>izing system which has a well�de�ned programming<br />
interface to the CFD application. This programming<br />
interface was designed to minimize data storage and<br />
data movement requirements. This programming in�<br />
terface has been ported to a variety of unstructured�<br />
grid solvers that di�er in their solution methodologies<br />
and supported �ow models. Currently� Cortex is avail�<br />
able as the visu<strong>al</strong>ization system for the following CFD<br />
codes� �1� Rampant�10� designed for solving transonic<br />
compressible �ows� �2� Fluent�UNS designed for solv�<br />
ing low�speed incompressible �ows and �3� Nekton �8�<br />
for very low�speed creeping �ows. These solvers have<br />
2D versions based on triangular and quadrilater<strong>al</strong> cells<br />
and 3D versions based on tetrahedr<strong>al</strong> and hexahedr<strong>al</strong><br />
cells.<br />
Cortex has been designed for providing interactive
visu<strong>al</strong>ization to a wide variety of solvers and applica�<br />
tion niches. This requires that the visu<strong>al</strong>ization sys�<br />
tem be able to provide user�interfaces that are cus�<br />
tomized to the application. In Cortex� both graphi�<br />
c<strong>al</strong> and text interfaces are implemented in the high�<br />
level� interpreted language Scheme. This lets devel�<br />
opers and users interactively and rapidly modify the<br />
user�interface. Similarly� most high�level visu<strong>al</strong>ization<br />
functions are <strong>al</strong>so implemented in Scheme on top of<br />
low�level functions that are implemented in C. The<br />
advantage of using Scheme is that it supports rapid�<br />
interactive development lending �exibility to the visu�<br />
<strong>al</strong>ization system.<br />
Currently CFD solvers are solving increasingly<br />
larger problems. For example� Cortex has been used<br />
to visu<strong>al</strong>ize a Rampant simulation over a 3D tetrahe�<br />
dr<strong>al</strong> automobile intake cylinder head mesh consisting<br />
of 800�000 cells. This has driven the implementation of<br />
those codes on massively par<strong>al</strong>lel computers and work�<br />
station clusters. In addition to reducing run�times�<br />
larger problems can be run only on par<strong>al</strong>lel computers<br />
due to larger available memory. Often� these problems<br />
cannot even be run on a seri<strong>al</strong> computer. Domain de�<br />
composition is a commonly used programming model<br />
for par<strong>al</strong>lelizing solvers � the �ow�domain is parti�<br />
tioned among processors and an instance of the solver<br />
is run on each node. A seri<strong>al</strong> visu<strong>al</strong>ization system for a<br />
par<strong>al</strong>lel CFD solver would require that the entire �ow�<br />
domain be copied over across the network. It is more<br />
e�cient if the visu<strong>al</strong>ization system� or at least those<br />
portions of it that require access to the �ow�domain�<br />
<strong>al</strong>so be implemented in par<strong>al</strong>lel and run on the same<br />
processors as the solver. Cortex has been par<strong>al</strong>lelized<br />
on a variety of par<strong>al</strong>lel architectures including Intel<br />
IPSC�860� Intel Paragon and on workstation clusters.<br />
Cortex and the CFD application exist as either a<br />
single process� two processes or multiple processes for<br />
the par<strong>al</strong>lel version. The Cortex implementation has<br />
various forms� �1� a library for a single process ap�<br />
plication� �2� a visu<strong>al</strong>ization process and a client li�<br />
brary that links in the CFD application to form the<br />
solver process� �3� a visu<strong>al</strong>ization process �same as<br />
in �2�� and multiple instances of client libraries that<br />
communicate with the visu<strong>al</strong>ization process through<br />
a portable communication library for the par<strong>al</strong>lel ver�<br />
sions. However� <strong>al</strong>l these implementations are derived<br />
from a single set of sources �les by using di�erent C<br />
pre�processor switches during compilation and linking.<br />
The rest of the paper is organized as follows. In<br />
Section 2� we describe the primary go<strong>al</strong>s that have<br />
driven the design of Cortex. The software architec�<br />
ture of Cortex is outlined in Section 3. Among the<br />
software modules described in Section 3� the data<br />
mapping module is of speci<strong>al</strong> interest since it accesses<br />
solver data through an API�application programming<br />
interface�. This module and its integration with the<br />
solver is described in Section 4. Further� the data<br />
mapping module is that portion of Cortex that runs<br />
on massively par<strong>al</strong>lel computers and on workstation<br />
clusters. The par<strong>al</strong>lel implementation is described in<br />
Section 5. The ability to customize and extend Cor�<br />
tex using Scheme is described in Section 6 and� �n<strong>al</strong>ly�<br />
Cortex is compared to other visu<strong>al</strong>ization systems in<br />
Section 7.<br />
2 Design Go<strong>al</strong>s<br />
The Cortex visu<strong>al</strong>ization system has been designed<br />
to provide advanced visu<strong>al</strong>ization techniques� a mod�<br />
ern graphic<strong>al</strong> interface� and a programmable textu<strong>al</strong><br />
interface to a family of unstructured CFD codes which<br />
di�er in their solution methodologies and supported<br />
�ow models. The major design go<strong>al</strong>s of Cortex are�<br />
1. Interactivity� User interaction must be sup�<br />
ported by a variety of means including direct ma�<br />
nipulation of view parameters via a virtu<strong>al</strong> track�<br />
b<strong>al</strong>l method and interactive modi�cation of color<br />
maps. In addition� users should be able to query<br />
data v<strong>al</strong>ues on a displayed object. For example�<br />
users can ask for cell coordinates and velocity v<strong>al</strong>�<br />
ues at any point of an iso�surface by simply click�<br />
ing at that point. Fin<strong>al</strong>ly� users can interactively<br />
steer the simulation by modifying solution param�<br />
eters of the �ow�solver or by adapting the grid.<br />
2. Sc<strong>al</strong>ability� The visu<strong>al</strong>ization system should<br />
support CFD applications running on work�<br />
station clusters and massively par<strong>al</strong>lel comput�<br />
ers. The visu<strong>al</strong>ization system should minimize<br />
data storage and network communication require�<br />
ments. It should store only that part of the �ow�<br />
�eld that makes up the displayed object which�<br />
in gener<strong>al</strong>� could be orders of magnitudes sm<strong>al</strong>ler<br />
than the entire �ow��eld data. In addition to re�<br />
ducing computation time� an important reason<br />
for running simulations in par<strong>al</strong>lel is the large<br />
available memory which makes it feasible to run<br />
very large problems involving millions of cells.<br />
Since the �ow��eld can not even be stored on a<br />
seri<strong>al</strong> computer� the portion of the visu<strong>al</strong>ization<br />
system that requires access to �ow data must <strong>al</strong>so<br />
be executed in par<strong>al</strong>lel with the solver.
3. Solver Portability� The visu<strong>al</strong>ization applica�<br />
tion should provide user�interfaces and visu<strong>al</strong>iza�<br />
tion functions to a variety of CFD solvers which<br />
are organized around potenti<strong>al</strong>ly distinct domain<br />
data structures and are targeted towards distinct<br />
application areas. Integration with new solvers<br />
should require minim<strong>al</strong> addition<strong>al</strong> programming<br />
e�ort. Access from the visu<strong>al</strong>ization system to<br />
solver data structures should be through clear�<br />
well�de�ned interfaces.<br />
4. Flexibility� Since the visu<strong>al</strong>ization system is tar�<br />
geted towards multiple solvers and application<br />
niches� it should be �exible� i.e.� extensible and<br />
customizable. For example� implementing appli�<br />
cation steering requires that solvers provide user�<br />
interfaces that <strong>al</strong>low modi�cation of �ow�solution<br />
parameters. Both the user�interfaces and �ow�<br />
solution parameters are solver�speci�c. The vi�<br />
su<strong>al</strong>ization system should <strong>al</strong>low rapid interactive<br />
development and modi�cation of user�interfaces<br />
and visu<strong>al</strong>ization functions when porting to new<br />
solvers.<br />
3 Software Architecture<br />
3.1 Overview<br />
The seri<strong>al</strong> implementation of Cortex has the follow�<br />
ing software modules as shown in Figure 1.<br />
1. Data Mapping� Data mapping functions in�<br />
cluding iso�surface extraction� particle tracking�<br />
generation of contours and velocity vectors are<br />
implemented here. This is the only portion of<br />
Cortex that runs as part of the CFD application<br />
process. It has has access to the solver through a<br />
well�de�ned API �Application Programming In�<br />
terface�. This module is described in greater de�<br />
tail in Section 4. It is <strong>al</strong>so that portion of Cortex<br />
that has been implemented to run on massively<br />
par<strong>al</strong>lel computers and workstation clusters as de�<br />
scribed in Section 5.<br />
2. Graphics� Display and view manipulation rou�<br />
tines are implemented in this module. All low�<br />
level graphics subroutines are implemented by<br />
c<strong>al</strong>ls to the HOOPS�14� graphics library to pro�<br />
vide platform independent graphics. This module<br />
receives data from the data mapping module via<br />
RPC�s.<br />
3. User Interface� Cortex provides a graphic<strong>al</strong><br />
point�and�click user interface and a command�line<br />
text interface. The Cortex graphic<strong>al</strong> user inter�<br />
face is based on Motif. Routines for implementing<br />
various widgets including tables and lists are de�<br />
�ned in this module.<br />
4. Scheme Interpreter� A Scheme interpreter is<br />
available from the Cortex text interface. This lo�<br />
c<strong>al</strong> interpreter which runs as part of the visu<strong>al</strong>�<br />
ization process has access to a wide variety of C<br />
functions implemented in other Cortex modules.<br />
Graphic<strong>al</strong> and text interfaces have been imple�<br />
mented as Scheme functions that c<strong>al</strong>l Cortex C<br />
routines which have been made accessible to the<br />
interpreter. Similarly� there is a Scheme inter�<br />
preter which runs as part of the remote solver<br />
process.<br />
When a seri<strong>al</strong> CFD solver runs under the Cortex<br />
visu<strong>al</strong>ization system� the resulting application has one<br />
of the following structures.<br />
1. Single Process� The solver and Cortex runs as a<br />
single process. In this case Cortex is implemented<br />
as a library that is linked in with the solver.<br />
2. Two Process� The solver and Cortex runs as<br />
two processes. In this case� the Cortex modules<br />
�2�� �3� and �4� make up the visu<strong>al</strong>ization pro�<br />
cess that runs on the user�s loc<strong>al</strong> work�station.<br />
All graphics operations such as rotations� pan�<br />
ning� color�map editing etc. are performed in<br />
this process thereby providing greater interactiv�<br />
ity and frees the compute�server concentrate on<br />
running the simulation only. The Cortex data<br />
mapping module� is linked with the solver to form<br />
the solver process that may possibly run on a<br />
remote high�performance compute�server. The<br />
solver process communicates with the visu<strong>al</strong>iza�<br />
tion process through sockets and RPC�s. User<br />
commands are sent from the user�interface to the<br />
solver process via sockets and display data is<br />
transmitted from the solver process to the visu<strong>al</strong>�<br />
ization process via RPC�s.<br />
An interesting feature in Cortex is the use of<br />
Scheme interpreters in the visu<strong>al</strong>ization process and<br />
the solver process. C functions in each process can be<br />
made accessible to the respective Scheme interpreters.<br />
This is done at run�time by registering the C function<br />
and its Scheme name with the interpreter. This <strong>al</strong>�<br />
lows the interpreter to ev<strong>al</strong>uate the scheme function by<br />
simply c<strong>al</strong>ling the relevant C function. Cortex trans�<br />
forms <strong>al</strong>l user commands from the GUI and text inter�<br />
face into a collection of Scheme function c<strong>al</strong>ls. These<br />
Scheme functions are either ev<strong>al</strong>uated loc<strong>al</strong>ly in the
User Interface<br />
Toolkit<br />
Visu<strong>al</strong>ization Process<br />
Rendering<br />
Engine<br />
Scheme Interpreter (GUI and Text user interface)<br />
RPC’s<br />
Data<br />
Mapping<br />
Scheme Interpreter<br />
(API)<br />
Solver Process<br />
(Sockets)<br />
CFD<br />
Application<br />
Figure 1� Software Architecture of Cortex �Two�Process Implementation�<br />
visu<strong>al</strong>ization process or transmitted to the Scheme in�<br />
terpreter on the solver process via sockets.<br />
Application steering is implemented in Cortex by<br />
de�ning C functions in the CFD application that mod�<br />
ify appropriate solution parameters or adapt the grid.<br />
Next these C functions are bound to Scheme function<br />
names and made available to the solver Scheme in�<br />
terpreter. Fin<strong>al</strong>ly� the GUI and text user interfaces<br />
are implemented for this feature. These user�interface<br />
functions are converted into a collection of Scheme<br />
function c<strong>al</strong>ls by the loc<strong>al</strong> Scheme interpreter. Some<br />
of these c<strong>al</strong>ls will be ev<strong>al</strong>uated remotely in the solver<br />
Scheme interpreter by c<strong>al</strong>ling relevant C functions.<br />
Section 6 provides more details on using Scheme for<br />
interactively de�ning user�interfaces.<br />
3.2 Par<strong>al</strong>lel Implementation<br />
The par<strong>al</strong>lel implementation of Cortex is based on<br />
domain decomposition. This model was chosen since<br />
this is a commonly used model for par<strong>al</strong>lelizing CFD<br />
solvers. In fact� both the CFD solvers� Rampant and<br />
Nekton� have been par<strong>al</strong>lelized�11� 2� using this model.<br />
In this model� the �ow domain is partitioned among<br />
multiple processors and an instance of the solver is<br />
run on each processor or node. In par<strong>al</strong>lel Cortex�<br />
the data mapping module is partitioned into a host<br />
program and a node program as shown in Figure 2.<br />
The node module is linked in with the solver node<br />
program and executes on each processor. The visu�<br />
<strong>al</strong>ization process remains unchanged from the seri<strong>al</strong><br />
implementation since the host makes it appear as if<br />
the data is coming from a seri<strong>al</strong> solver process. De�<br />
tails are provided in Section 5.<br />
4 Data Mapping in Cortex<br />
Data mapping�12� consists of transforming appli�<br />
cation data into renderable objects. Function<strong>al</strong>ly� this<br />
module receives data from the the solver� converts it to<br />
desired geometric objects� and transmits the converted<br />
data to the rendering engine. For example� during con�<br />
touring� a 2D triangular cell from the grid is mapped<br />
into a 2D triangle with color map indices �based on<br />
�eld v<strong>al</strong>ues� at each node and is then sent to the<br />
renderer for display. The module handles visu<strong>al</strong>iza�<br />
tion functions such as iso�surfacing� particle tracking�<br />
contouring and velocity vector generation. Section4.1<br />
describes how this module uses surfaces to minimize
User Interface<br />
Toolkit<br />
Visu<strong>al</strong>ization Process<br />
Rendering<br />
Engine<br />
(RPC’s)<br />
network communication. Data mapping requires in�<br />
tensive access to the application�s data structures. In<br />
tradition<strong>al</strong> post�processing visu<strong>al</strong>ization systems� this<br />
module loads in the entire grid <strong>al</strong>ong with required<br />
�eld�v<strong>al</strong>ues at each node. In Section 4.2� we show how<br />
Cortex reduces its memory overhead by having the<br />
data mapping module execute with the solver as part<br />
of the same process.<br />
4.1 Surfaces<br />
In Cortex� a visu<strong>al</strong>ization may be performed by<br />
de�ning portions of the domain that are of interest.<br />
These portions are represented and stored as surfaces<br />
in Cortex. For example� users may create an iso�<br />
surface of any of the stored or derived solution quan�<br />
tities� or use quadratic functions in x� y� z to de�ne<br />
lines� planes or other geometry. They may then ob�<br />
serve �ow��eld variables such as density� pressure and<br />
velocity vectors on that surface. Such surfaces are cre�<br />
ated� typic<strong>al</strong>ly� at the beginning of the simulation and<br />
the �ow��eld is observed on it at frequent interv<strong>al</strong>s as<br />
the simulation unfolds through time. This makes it<br />
useful to store surfaces during creation so that suc�<br />
cessive displays of �ow��eld v<strong>al</strong>ues on it will avoid re�<br />
Scheme Interpreter (GUI and Text interface)<br />
Scheme Inter.<br />
Data Map<br />
Node program<br />
CFD App.<br />
Node Program<br />
(Sockets)<br />
Scheme Interpreter<br />
Host Program =<br />
Data Map Host + CFD Host<br />
Multiport (Portable Communication Library)<br />
Node Program 1 Node Program 2 Node program n<br />
Figure 2� Software Architecture of Par<strong>al</strong>lel Cortex<br />
computation of the surface grid. Further� storing such<br />
surfaces on the visu<strong>al</strong>ization process which executes<br />
on the loc<strong>al</strong> graphics workstation results in reduction<br />
in network tra�c. This is because only �eld�v<strong>al</strong>ues<br />
and not the surface grid needs to be transported from<br />
the solver process to the visu<strong>al</strong>ization process across<br />
the network during� for example� contour and velocity�<br />
vector displays. Since network data movement can<br />
bottleneck distributed visu<strong>al</strong>izations� such techniques<br />
are important for enhancing performance.<br />
4.2 Data Mapping API<br />
Cortex has been designed to be integrated with the<br />
CFD application and has access to the solver�s data<br />
structures through a well�de�ned API. However� it is<br />
important that the solver�speci�c components of the<br />
API be as sm<strong>al</strong>l as possible� thereby minimizing pro�<br />
gramming e�ort in porting Cortex to a new solver.<br />
Only the data mapping module in Cortex accesses<br />
solver functions and data through the API. This is<br />
achieved by having the data mapping module share<br />
the solver process�s address space. The rest of Cor�<br />
tex may run as a separate process as is the case in<br />
the two�process and par<strong>al</strong>lel implementations. The
float SV�Cell�Coordinates PROTO��CX�Cell�ID c� int dim���<br />
void SV�Cell�V<strong>al</strong>ues PROTO��CX�Cell�Id c� float �v<strong>al</strong>���<br />
float SV�Node�V<strong>al</strong>ue PROTO��CX�Node�Id n���<br />
void CX�Contour�Poly PROTO��int npts� float �points� float �v<strong>al</strong>s���<br />
separate Cortex process communicates with the data<br />
mapping module through sockets and RPC�s.<br />
The data mapping API of Cortex has two compo�<br />
nents�<br />
1. Solver De�ned� These functions are provided<br />
by the solver. The data mapper uses them to<br />
query the solver about data v<strong>al</strong>ues including cell<br />
and node v<strong>al</strong>ues and coordinates� and cell con�<br />
nectivity. Cortex can handle triangular� quadri�<br />
later<strong>al</strong>� tetrahedr<strong>al</strong> and hexahedr<strong>al</strong> cells. Fur�<br />
ther� these cells may have sub�cells de�ned within<br />
them. E�ort has been made to keep the solver<br />
API concise and simple since it has to be imple�<br />
mented separately for each speci�c solver.<br />
2. Cortex De�ned� These functions are exported<br />
by Cortex for use directly in CFD applications.<br />
Figure 3 provides some of the API functions.Cortex<br />
has been integrated with three separate solvers�<br />
�1�Rampant� �2� Nekton and �3� Fluent�UNS. The<br />
only addition<strong>al</strong> programming e�ort for integration was<br />
in implementing the solver�de�ned portion of the data<br />
mapping API in each solver.<br />
5 Par<strong>al</strong>lel Implementation of Cortex<br />
In this section we describe the implementation of<br />
Cortex on massively par<strong>al</strong>lel architectures and work�<br />
station clusters. The need for par<strong>al</strong>lelization was<br />
driven by the fact that the solver may be running in<br />
par<strong>al</strong>lel. Running a par<strong>al</strong>lel solver under seri<strong>al</strong> Cor�<br />
tex requires signi�cant data movement from the solver<br />
to Cortex though slow communication networks. Fur�<br />
ther� Cortex requires large amounts of memory� often<br />
not available on seri<strong>al</strong> workstations� to store the re�<br />
sulting data. Our approach was to par<strong>al</strong>lelize the data<br />
mapping module which� as described earlier� runs as<br />
part of the solver process in the seri<strong>al</strong> environment.<br />
An addition<strong>al</strong> possibility is to par<strong>al</strong>lelize the renderer.<br />
Currently� we have not pursued this possibility. It is<br />
not clear whether par<strong>al</strong>lel renderers can out�perform<br />
workstations with hardware support for rendering. In<br />
fact in �3�� it is reported that it would take between<br />
Figure 3� Functions in the Data Mapping Module API<br />
10 and 20 high�end RISC workstations to equ<strong>al</strong> the<br />
performance of the SGI VGX graphics system. The<br />
data mapping module performs functions that include<br />
iso�surface extraction� particle tracking� surface con�<br />
touring� and generation of velocity vectors. Most vi�<br />
su<strong>al</strong>ization functions except particle tracking are em�<br />
barassingly par<strong>al</strong>lel. Particle tracking is communica�<br />
tion intensive since particles frequently migrate across<br />
processors.<br />
Par<strong>al</strong>lel implementations of CFD solvers are usu<strong>al</strong>ly<br />
based on a domain decomposition strategy in which<br />
the spati<strong>al</strong> domain for a problem is partitioned into<br />
sm<strong>al</strong>ler sub�domains or partitions� and a separate in�<br />
stance of the solver is invoked to simulate the �ow<br />
within each partition. Information is transferred be�<br />
tween neighboring partitions <strong>al</strong>ong partition bound�<br />
aries. Communication is proportion<strong>al</strong> to the perimeter<br />
of the partition which is usu<strong>al</strong>ly an order of magnitude<br />
sm<strong>al</strong>ler than the size of the partition� and hence does<br />
not slow down the simulation. We have par<strong>al</strong>lelized<br />
the data mapping module using domain decomposi�<br />
tion. A separate instance of the module runs in each<br />
processor or node and performs the visu<strong>al</strong>ization on<br />
its portion of the data. These sub�visu<strong>al</strong>izations are<br />
sent to a host instance of the module which combines<br />
the sub�instances and sends the data over to the visu�<br />
<strong>al</strong>ization process for display.<br />
Our par<strong>al</strong>lel implementation of iso�surfacing� based<br />
on the marching cubes <strong>al</strong>gorithm�7�� is similar to that<br />
reported in �4�. Sub�surfaces generated on each node<br />
must be communicated to the host which then trans�<br />
fers it to the visu<strong>al</strong>ization process. The visu<strong>al</strong>ization<br />
process is the same as in the seri<strong>al</strong> implementation<br />
� the host process makes it appear as if there is a<br />
seri<strong>al</strong> solver process generating the data. The cre�<br />
ation of each loc<strong>al</strong> iso�surface does not require any<br />
communication since <strong>al</strong>l cells are stored loc<strong>al</strong>ly. This<br />
is achieved by having the solver store cells lying on<br />
the boundary of domain partitions on both proces�<br />
sors. As described before� representations of surfaces<br />
are maintained both in the visu<strong>al</strong>ization process and<br />
the solver process. The reduces network communica�<br />
tion requirements� e.g.� when a surface is contoured<br />
only the �eld�v<strong>al</strong>ues at each point need to be trans�<br />
mitted form the nodes to the host and then onto the
visu<strong>al</strong>ization process for display.<br />
We have observed that network communication is<br />
usu<strong>al</strong>ly the slowest component in par<strong>al</strong>lel visu<strong>al</strong>iza�<br />
tion. In the above example� the iso�surfaces can be<br />
generated quite quickly� but they have to be transmit�<br />
ted to the host process� one at a time. Other visu<strong>al</strong>�<br />
ization functions such as particle tracking have even<br />
higher communication overhead. In particle tracking<br />
the track of a massless particle in the �ow��eld is gen�<br />
erated and displayed. The user speci�es the set of<br />
points from where the particles are released. Parti�<br />
cles keep f<strong>al</strong>ling o� sub�domains and require to be<br />
restarted at a sub�domain stored in a remote parti�<br />
tion causing large communication overheads.<br />
6 Extensibility and Customizability<br />
through Scheme<br />
User�interfaces and high�level visu<strong>al</strong>ization func�<br />
tions have been implemented in Scheme in Cortex.<br />
Scheme is a high�level interpreted language with fea�<br />
tures such as dynamic typing� automatic garbage col�<br />
lection and has functions as �rst class objects. These<br />
features make Scheme highly suited for rapid inter�<br />
active prototyping. User�interfaces and visu<strong>al</strong>ization<br />
functions can be modi�ed dynamic<strong>al</strong>ly in the same<br />
Cortex session. Such customization is performed not<br />
only by developers but <strong>al</strong>so by users. This �exibil�<br />
ity is achieved by making a Scheme interpreter avail�<br />
able from the text interface. Examples of such Scheme<br />
functions are provided in Figure 4.<br />
cx�clear�menubar clears the menu bar. menus is<br />
a Scheme variable that contains the menu�names with<br />
their descriptors. �cx�delete�menu is implemented<br />
in C in the user�interface module. cx�add�item adds<br />
a new menu�item. �cx�add�item is de�ned in C in<br />
the user�interface module.<br />
In Cortex� Scheme is used primarily for two pur�<br />
poses.<br />
1. User interfaces� All GUI panels� application<br />
menubars and c<strong>al</strong>lbacks are de�ned in Scheme in<br />
terms of functions implemented in a low�level Mo�<br />
tif toolkit in C. CFD application developers and<br />
users can add or modify existing interfaces and<br />
add new ones interactively without quitting the<br />
session. This is particularly important for Cortex<br />
since it has been to targeted to a number of dis�<br />
tinct solvers which support di�erent �ow�models.<br />
2. Modify and de�ne new visu<strong>al</strong>ization func�<br />
tions� Visu<strong>al</strong>ization functions that have been im�<br />
plemented in Cortex in C are accessible from the<br />
Scheme interpreter. Users can de�ne new visu�<br />
<strong>al</strong>ization functions using Scheme with these pre�<br />
de�ned visu<strong>al</strong>ization functions.<br />
7 Comparisons With Other Visu<strong>al</strong>iza�<br />
tion Systems<br />
Cortex provides an easy way for CFD developers to<br />
integrate advanced� par<strong>al</strong>lel and distributed visu<strong>al</strong>iza�<br />
tion techniques and modern graphic<strong>al</strong> interfaces into<br />
their applications. Di�erent aspects of Cortex such as<br />
integration with the CFD application� use of Scheme<br />
as an extension language and par<strong>al</strong>lel and distributed<br />
execution have been implemented in other visu<strong>al</strong>iza�<br />
tion systems. To our knowledge� Cortex is the �rst<br />
visu<strong>al</strong>ization application that integrates them into a<br />
coherent whole and has been implemented on a wide<br />
variety of platforms for 3 di�erent CFD solvers.<br />
Gener<strong>al</strong> purpose visu<strong>al</strong>ization systems such as<br />
Fieldview�6�� FAST�1� and PV�WAVE are designed for<br />
post�processing which requires the CFD application<br />
tp write out one or more �les containing the complete<br />
results of the simulation. Cortex� however� provides<br />
an integrated visu<strong>al</strong>ization environment for CFD ap�<br />
plications where simulation data is accessed directly<br />
from the application through a well�de�ned interface.<br />
The lack of integration implies that the stand <strong>al</strong>one<br />
visu<strong>al</strong>ization systems must read in the entire �ow�<br />
�eld to process it� and users cannot steer the solu�<br />
tion process. The Cortex visu<strong>al</strong>ization environment is<br />
quite �exible � developers and users can rapidly and<br />
interactively modify user�interfaces and visu<strong>al</strong>ization<br />
functions through a high�level interpreted language.<br />
The extension language in Cortex is a full�featured�<br />
standard high level programming language� rather<br />
than an ad�hoc scripting language. Cortex resembles<br />
SuperGlue�5� in providing Scheme as an extension lan�<br />
guage. SuperGlue is designed for post�processing and<br />
o�ers object�oriented extensions to Scheme. Integra�<br />
tion of the visu<strong>al</strong>ization system with the CFD applica�<br />
tion has <strong>al</strong>so been implemented successfully in pV3�3�.<br />
There are a number of visu<strong>al</strong>ization packages such<br />
as AVS�13�� Explorer and Khoros�9� which are orga�<br />
nized around the data �ow model and <strong>al</strong>low users to<br />
interactively create customized visu<strong>al</strong>ization systems<br />
through a visu<strong>al</strong> programming environment. While<br />
Cortex does not provide such an appe<strong>al</strong>ing interface<br />
to customize the visu<strong>al</strong>izations� it <strong>al</strong>so does not ex�<br />
hibit many of the problems of the data �ow approach.<br />
There is a single visu<strong>al</strong>ization process� rather than the<br />
multiple processes common in data �ow systems. This
�define �cx�clear�menubar�<br />
�for�each �lambda �m� ��cx�delete�menu �menu��id m��� menus�<br />
�set� menus �����<br />
�define �cx�add�item menu item accel mnemonic test c<strong>al</strong>lback�<br />
�let ��m �if �string� menu� �name��menu menu� �id��menu menu���<br />
�id �f��<br />
�if �not m� �error �cx�add�item� no such menu.� menu��<br />
�set� id ��cx�add�item �menu��id m� item accel mnemonic c<strong>al</strong>lback��<br />
�menu��item m item id test� id��<br />
Figure 4� Examples of Scheme Functions for User Interfaces<br />
reduces the consumption of system resources such as<br />
�le descriptors and memory. In addition� data��ow vi�<br />
su<strong>al</strong>ization system are designed for data�ow in the for�<br />
ward direction � from application to display. Features<br />
such as interactive querying of simulation data v<strong>al</strong>ues<br />
from an image are di�cult to implement in such sys�<br />
tems. On the other hand� Cortex is directed towards<br />
the CFD domain� and is therefore not as gener<strong>al</strong> as<br />
some existing visu<strong>al</strong>ization systems.<br />
References<br />
�1� G. V. Bancroft et <strong>al</strong>. FAST� A multiprocessed<br />
environment for visu<strong>al</strong>ization of computation<strong>al</strong><br />
�uid dynamics. In Proceedings of Visu<strong>al</strong>ization<br />
�90� pages 14�27� San Francisco� C<strong>al</strong>ifornia� Oct.<br />
1990.<br />
�2� P. F. Fischer� E. M. R�nquist� and T. A. Pat�<br />
era. Par<strong>al</strong>lel spectr<strong>al</strong> element methods for vis�<br />
cous �ows. In G. F. Carey� editor� Par<strong>al</strong>lel Su�<br />
percomputing� Methods� Algorithms and Applica�<br />
tions� pages 223�238. John Wiley� 1989.<br />
�3� R. Haimes. pV3� A distributed system for large<br />
sc<strong>al</strong>e unsteady CFD visu<strong>al</strong>ization. AIAA Paper�<br />
1994.<br />
�4� C. D. Hansen and P. Hinker. Massively par<strong>al</strong>lel<br />
isosurface extraction. In Proceedings of Visu<strong>al</strong>�<br />
ization �92� pages 107�114� Boston� Mass.� Oct.<br />
1992.<br />
�5� J.P.Hultquist and E.L.Raible. SuperGlue� A<br />
programming environment for visu<strong>al</strong>ization. In<br />
Proceedings of Visu<strong>al</strong>ization �92� pages 243�251�<br />
Boston� Mass.� Oct. 1992.<br />
�6� S. M. Legensky. Advanced visu<strong>al</strong>ization on desk�<br />
top workstations. In Proceedings of Visu<strong>al</strong>ization<br />
�91� pages 372�377� San Diego� C<strong>al</strong>ifornia� Oct.<br />
1991.<br />
�7� W. Lorensen and H. Cline. A high resolution 3D<br />
surface construction <strong>al</strong>gorithm. Computer Graph�<br />
ics� 21�163�169� 1987.<br />
�8� Y. Maday and A. T. Patera. Spectr<strong>al</strong> el�<br />
ement methods for the incompressible navier�<br />
stokes equations. In A. K. Noor and J. T. Oden�<br />
editors� State of the Art Surveys on Computa�<br />
tion<strong>al</strong> Mechanics� pages 71�143. ASME� 1989.<br />
�9� J. Rasure� D. Argiro� T. Sauer� and C. Williams.<br />
A visu<strong>al</strong> language and software development en�<br />
vironment for image processing. Internation<strong>al</strong><br />
Journ<strong>al</strong> of Imaging Systems and Technology�<br />
1991.<br />
�10� W. Smith and G. Spragle. Unstructured grid �ow<br />
solver applied to trains� planes� and automobiles.<br />
AIAA Paper 93�0889� 1993.<br />
�11� T. Tysinger and W. Smith. An e�cient un�<br />
structured multigrid solver for MIMD par<strong>al</strong>�<br />
lel machines. Technic<strong>al</strong> report� Fluent Inc�<br />
10 Cavendish Court� Lebanon� NH 03766�1442�<br />
1993.<br />
�12� C. Upson. Volumetric visu<strong>al</strong>ization techniques. In<br />
D. F. Rogers and R. A. Earnshaw� editors� State<br />
of the Art in Computer Graphics� chapter 5� pages<br />
313�350. Springer�Verlag� 1991.<br />
�13� C. Upson et <strong>al</strong>. The application visu<strong>al</strong>ization sys�<br />
tem� A computation<strong>al</strong> environment for scienti�c<br />
visu<strong>al</strong>ization. IEEE Computer Graphics and Ap�<br />
plications� 9�4��30�42� 1989.<br />
�14� G. Wiegand and R. Covey. HOOPS Graphics Sys�<br />
tem� Reference Manu<strong>al</strong>� Verison 3.1. Ithaca Soft�<br />
ware� 1001 Marina Village Parkway� Alameda�<br />
CA 94501� 1992.
Figure 5� Unstructured tetrahedr<strong>al</strong> mesh for Pampa jet in Par<strong>al</strong>lel Rampant on workstation clusters� Panels for<br />
interactive addition of compute�nodes and optimizing communication are shown.
An Annotation System for 3D Fluid Flow Visu<strong>al</strong>ization<br />
Maria M. Loughlin John F. Hughes<br />
Cambridge Research Lab Department of Computer Science<br />
Digit<strong>al</strong> Equipment Corporation Brown University� Box 1910<br />
One Kend<strong>al</strong>l Sq.� Cambridge� MA 02139 Providence� RI 02812<br />
loughlin�crl.dec.com jfh�cs.brown.edu<br />
Abstract<br />
Annotation is a key activity of data an<strong>al</strong>ysis. How�<br />
ever� current data an<strong>al</strong>ysis systems focus <strong>al</strong>most exclu�<br />
sively on visu<strong>al</strong>ization. We propose a system which in�<br />
tegrates annotations into a visu<strong>al</strong>ization system. An�<br />
notations are embedded in 3D data space� using the<br />
Post�it 1 metaphor. This embedding <strong>al</strong>lows contextu<strong>al</strong>�<br />
based information storage and retriev<strong>al</strong>� and facil�<br />
itates information sharing in collaborative environ�<br />
ments. We provide a tradition<strong>al</strong> database �lter and<br />
a Magic Lens 2 �lter to create speci<strong>al</strong>ized views of the<br />
data. The system is customized for �uid �ow applica�<br />
tions� with features which <strong>al</strong>low users to store param�<br />
eters of visu<strong>al</strong>ization tools and sketch 3D volumes.<br />
1 Introduction<br />
In a study to characterize the data an<strong>al</strong>ysis process�<br />
Springmeyer et <strong>al</strong>. �13� observed scientists an<strong>al</strong>yzing<br />
scienti�c data. They found that recording results and<br />
histories of an<strong>al</strong>ysis sessions is a key activity of data<br />
an<strong>al</strong>ysis. Two types of annotating were observed�<br />
� recording� or preserving contextu<strong>al</strong> information<br />
throughout an investigation<br />
� describing� or capturing conclusions of the an<strong>al</strong>y�<br />
sis sessions.<br />
Despite the importance of annotation� current systems<br />
for data an<strong>al</strong>ysis emphasize visu<strong>al</strong>ization and provide<br />
little or no annotation support.<br />
In this paper� we describe a system that supports<br />
annotation as an integrated part of a �uid �ow visu�<br />
<strong>al</strong>ization system. Unlike typic<strong>al</strong> annotations on static<br />
2D images� our system embeds annotations in 3D data<br />
space. This immersion makes it easy to associate user<br />
1 Post�it is a registered trademark of 3M.<br />
2 Magic Lens is a trademark of Xerox Corporation.<br />
comments with the features they describe. To avoid<br />
clutter and data hiding� annotations are represented<br />
by graphic<strong>al</strong> annotation markers that have associated<br />
information. Therefore� graphic<strong>al</strong> attributes of the<br />
markers� such as size and color� can di�erentiate an�<br />
notations with di�erent functions� authors� etc.<br />
Annotations can easily be added� edited and<br />
deleted. Also� many sets of annotations can simultane�<br />
ously be loaded into a visu<strong>al</strong>ization. This <strong>al</strong>lows scien�<br />
tists� collaborating on a data set� to use annotations as<br />
a form of communication� as well as a history of data<br />
an<strong>al</strong>ysis sessions. Annotation markers <strong>al</strong>so aid scien�<br />
tists in navigating through the data space by providing<br />
landmarks at interesting positions. Figures 1�a���c�<br />
show the visu<strong>al</strong>ization environment� annotation mark�<br />
ers� and the annotation content panel. Figure 1�d�<br />
shows a Magic Lens �lter which hides the annota�<br />
tion markers and widget handles. The implementa�<br />
tion has been applied to three�dimension<strong>al</strong> Computa�<br />
tion<strong>al</strong> Fluid Dynamics �CFD� applications. However�<br />
the techniques can be used in visu<strong>al</strong>ization systems of<br />
many disciplines. The design can <strong>al</strong>so be extended to<br />
3D stereo and virtu<strong>al</strong>�re<strong>al</strong>ity environments.<br />
This paper is organized in six sections. Section 2<br />
reviews previous approaches to annotation. Section<br />
3 describes design guidelines for annotation systems.<br />
Section 4 details our implementation of annotation<br />
within a visu<strong>al</strong>ization system. In the last two sections�<br />
we discuss possible future work and conclusions.<br />
2 Background<br />
Scienti�c visu<strong>al</strong>ization systems provide little� if any�<br />
support for annotation. For example� the Application<br />
Visu<strong>al</strong>ization System �AVS� �15� and the Flow An<strong>al</strong>y�<br />
sis Software Toolkit �FAST� �1�� two software environ�<br />
ments for visu<strong>al</strong>izing scienti�c data� facilitate attach�<br />
ment of labels to static 2D images. These systems<br />
<strong>al</strong>so <strong>al</strong>low a user to record and playback a sequence
�a� hedgehog and streamlines showing �b� annotation markers �sm<strong>al</strong>l geometric<br />
3D �uid �ow objects� placed at points of high velocity<br />
�c� annotation content panel �d� Magic Lens �lter hiding annotation<br />
markers and widget handles<br />
Figure 1� The visu<strong>al</strong>ization and annotation system.
of interactions with the visu<strong>al</strong>ization. This support<br />
is useful for generating presentations from the data�<br />
but does not facilitate the recording and describing<br />
operations observed by Springmeyer et <strong>al</strong>.<br />
Outside the scienti�c visu<strong>al</strong>ization domain� anno�<br />
tations have been integrated in di�erent applications.<br />
MacDraw� a 2D paint program� introduced a notes<br />
feature� which <strong>al</strong>lows static 2D annotations using the<br />
Post�it metaphor. Media View �11�� a multi�media<br />
publication system� <strong>al</strong>lows annotations in <strong>al</strong>l media<br />
components including text� line art� images� sound�<br />
video� and computer animations. The format of anno�<br />
tations has been expanded� but their use is still limited<br />
to presentation of information in a static environment.<br />
Document annotation is used as a means of commu�<br />
nication in the Wang Laboratories multi�media com�<br />
munication system� Freestyle �7�. Freestyle�s multi�<br />
media messages are based on images� including screen<br />
snapshots and hand�drawn sketches. Freestyle ad�<br />
vances the concept of annotations as communicators�<br />
but does not address the issues of clutter and manage�<br />
ment of annotations in the environment.<br />
Verlinden et <strong>al</strong>. �16� developed an annotation sys�<br />
tem to explore communication in Virtu<strong>al</strong> Re<strong>al</strong>ity �VR�<br />
environments. In gener<strong>al</strong>� annotation in immersive<br />
VR systems is restricted� as the user must interrupt<br />
the session to interact with objects in the re<strong>al</strong> world�<br />
such as notebooks and computer monitors. Verlin�<br />
den�s system overcomes this problem by embedding<br />
verb<strong>al</strong> annotations in the VR space. The annotations<br />
are represented as visu<strong>al</strong> 3D markers. When the user<br />
activates a marker� the verb<strong>al</strong> message stored with<br />
that marker is played. This system is unique in that<br />
it embeds annotations in 3D scenes� but it is limited<br />
to verb<strong>al</strong> annotations and provides no support for an�<br />
notation �ltering. It <strong>al</strong>so limits annotations to a �xed<br />
position in a time�based environment.<br />
3 Design Issues<br />
We have extracted� both from the Springmeyer et<br />
<strong>al</strong>. study and from our own experience with scien�<br />
ti�c visu<strong>al</strong>ization� a set of three design guidelines that<br />
seem appropriate for an annotation system. These<br />
guidelines� discussed below� formed the basis for the<br />
design of our system.<br />
Guideline 1� To support ongoing recording of con�<br />
textu<strong>al</strong> information� an annotation system must be<br />
an integr<strong>al</strong> part of a visu<strong>al</strong>ization system. E�ective<br />
placement and storage of annotations are required.<br />
Tradition<strong>al</strong>ly� annotations to scienti�c visu<strong>al</strong>iza�<br />
tions are recorded on paper or in electronic �les� and<br />
both the dataset and the �les are labeled to mark their<br />
association. This separation of data and annotations<br />
means that some e�ort is required to �nd the data<br />
features described by annotations. The 3D data space<br />
of many scienti�c applications provides the context in<br />
which annotations should be placed. Recording anno�<br />
tations in this space capit<strong>al</strong>izes on a human�s ability<br />
to locate information based on its spati<strong>al</strong> location.<br />
However� inserting annotations in the data space<br />
creates an immediate con�ict between the annotation<br />
and visu<strong>al</strong>ization functions� both compete for screen<br />
territory. We do not wish to impose restrictions on the<br />
amount of information that can be recorded. At the<br />
same time� we do not wish the annotations to obscure<br />
data� since information is contained in the data itself.<br />
Our approach is to decompose an annotation into<br />
� an annotation marker� or sm<strong>al</strong>l geometric object<br />
that identi�es the position of the annotation in<br />
the data space<br />
� an annotation content in which a user stores in�<br />
formation.<br />
By clicking on a marker� a user can expand the<br />
associated annotation to read or edit its content. Sep�<br />
arating the annotation�s content from the annotation<br />
marker in this way <strong>al</strong>lows direct insertion of arbitrar�<br />
ily large annotations.<br />
Guideline 2� Annotations must be powerful enough<br />
to capture information considered important by the<br />
user.<br />
There are di�erent types of information. Tanimoto<br />
�14� distinguishes between data �raw �gures and mea�<br />
surements�� information �re�ned data which may an�<br />
swer the users� questions� and knowledge �information<br />
in context�. Similarly� Bertin �3� considers informa�<br />
tion as a relationship which can exist between ele�<br />
ments� subsets or sets. The broader the relationship�<br />
the higher the level of information.<br />
In our annotation system� we provide support for<br />
di�erent levels of information in two ways. First�<br />
within each annotation� scientists can record both nu�<br />
meric<strong>al</strong> and textu<strong>al</strong> details� and high�level information<br />
speci�c to �uid �ow. This is discussed in section 4.4.<br />
Second� the system supports hierarchic<strong>al</strong>ly organized<br />
annotations. The hierarchic<strong>al</strong> structure <strong>al</strong>lows scien�<br />
tists to record facts in separate annotations� and group<br />
related annotations in sets that describe broader ob�<br />
servations.
Although some data� such as date of creation and<br />
author� are likely to be relevant to <strong>al</strong>l applications� it<br />
is possible that knowledge can be captured only when<br />
an annotation system is customized for a speci�c ap�<br />
plication. The customization would ensure that anno�<br />
tations can represent information relevant in the con�<br />
text of the application. For example� if the data of a<br />
particular application is time�varying� the annotation<br />
system should provide time�varying annotations that<br />
can track the features being described.<br />
Guideline 3� The user interface �UI� of an anno�<br />
tation system will play a key role in determining its<br />
acceptance �or lack thereof� by scientists.<br />
We considered many established UI rules �6� and<br />
designed our annotation system accordingly. One rule<br />
states that a UI should <strong>al</strong>low users to work with min�<br />
im<strong>al</strong> conscious attention to its tools. We achieve this<br />
go<strong>al</strong> by using a direct manipulation interface� that is�<br />
an interface in which the objects that can be manipu�<br />
lated are represented physic<strong>al</strong>ly. For example� the vol�<br />
ume of data a�ected by the Magic Lens �lter can be<br />
controlled directly by moving and resizing the phys�<br />
ic<strong>al</strong> representation of the lens. Another design rule<br />
states that an interface should provide feedback� e.g.�<br />
on the current settings of domain variables. In our sys�<br />
tem� annotation markers give visu<strong>al</strong> feedback on the<br />
location of annotations� and marker geometry gives<br />
feedback on annotation content.<br />
Because the geometric data space of �uid �ow ap�<br />
plications has three dimensions� we considered design<br />
issues speci�c to 3D graphic<strong>al</strong> user interfaces �5�. One<br />
issue is the complexity introduced by 3D viewing pro�<br />
jections� visibility determination� etc. A second issue<br />
is that the degrees of freedom in the 3D world are not<br />
easily speci�ed with common hardware input devices.<br />
A third issue is that a 3D interface can easily obscure<br />
itself. We use guidelines outlined by Snibbe et <strong>al</strong>. �12�<br />
to de<strong>al</strong> with these problems. For example� we provide<br />
shadows� constrained to move in a plane� to simplify<br />
positioning of annotation markers �see section 4.3.2�.<br />
We provide feedback on the orientation of the data by<br />
option<strong>al</strong>ly drawing the princip<strong>al</strong> axes and planes. We<br />
<strong>al</strong>so ensure that annotations do not obscure data� by<br />
making it easy for a user to change the viewpoint and<br />
resize or hide annotation markers.<br />
4 Implementation<br />
This section describes the implemented annotation<br />
system. We �rst set the context by describing �uid<br />
�ow visu<strong>al</strong>ization and the development environment.<br />
Then we discuss the main components of the anno�<br />
tation system� the annotation markers� support for<br />
information capture� and interaction techniques.<br />
4.1 Fluid Flow Visu<strong>al</strong>izations<br />
Computation<strong>al</strong> �uid dynamics �CFD� uses com�<br />
puters to simulate the characteristics of �ow physics.<br />
Computed �ow data is typic<strong>al</strong>ly stored as a 3D grid<br />
of vector and sc<strong>al</strong>ar v<strong>al</strong>ues �e.g.� velocity� temperature�<br />
and vorticity v<strong>al</strong>ues�� which are static in a steady �ow�<br />
and change over time in an unsteady �ow. CFD visu�<br />
<strong>al</strong>ization tools <strong>al</strong>low a scientist to examine the char�<br />
acteristics of the data with 3D computer displays.<br />
Interaction with the visu<strong>al</strong> representation is essen�<br />
ti<strong>al</strong> in the exploration and an<strong>al</strong>ysis of the data� and has<br />
three go<strong>al</strong>s� feature identi�cation� scanning� and prob�<br />
ing �8�. Feature identi�cation techniques help �nd �ow<br />
features over the entire domain� and give the scientist<br />
a feel for the position of interesting parts of the �ow<br />
volume. Scanning techniques are used to interactively<br />
search the domain� by varying one or more parame�<br />
ters� through space or through sc<strong>al</strong>ar and vector �eld<br />
v<strong>al</strong>ues. Probing techniques are loc<strong>al</strong>ized visu<strong>al</strong>ization<br />
tools� typic<strong>al</strong>ly used to gather quantitative informa�<br />
tion in the �n<strong>al</strong> step of investigating a �ow feature.<br />
The Computer Graphics Group at Brown Univer�<br />
sity has developed a �ow visu<strong>al</strong>ization system� to<br />
study modes of interaction with �ow tools. The an�<br />
notation system was built as part of this visu<strong>al</strong>ization<br />
system. This provided a test�bed for techniques to<br />
integrate visu<strong>al</strong>ization and annotation function<strong>al</strong>ity.<br />
4.2 The Development Environment<br />
The annotation system was developed using C��<br />
and FLESH� an object oriented animation and mod�<br />
eling scripting language �10�. The FLESH objects de�<br />
�ned for the annotation system include annotation<br />
markers� lenses� and �lters. Some of these FLESH<br />
classes have corresponding C�� classes� in which data<br />
is stored and compute�intensive operations performed.<br />
This <strong>al</strong>lows us to bene�t from the power of an in�<br />
terpreted interactive prototyping system and the e��<br />
ciency of a compiled language.<br />
4.3 Annotation Markers<br />
Annotations are represented in the 3D data space<br />
by sm<strong>al</strong>l geometric markers. Each marker has an as�<br />
sociated content which the user can edit at any time.
4.3.1 Marker Graphic<strong>al</strong> Attributes<br />
The geometry of a marker gives visu<strong>al</strong> feedback on the<br />
content of the annotation. In the �uid �ow visu<strong>al</strong>iza�<br />
tions system� the user can de�ne annotation keywords<br />
�e.g.� plume� vortex�� and select a geometry to asso�<br />
ciate with each keyword. Then� when the user assigns<br />
a keyword to an annotation in the system� the anno�<br />
tation�s marker takes the associated shape. It is likely<br />
that other mappings between graphic<strong>al</strong> attributes of<br />
markers and annotation content would <strong>al</strong>so be useful.<br />
For example� the color saturation of a marker could<br />
depend on the age or priority of the annotation.<br />
The graphic<strong>al</strong> attributes of annotations are <strong>al</strong>so<br />
user�customizable. The size and color of <strong>al</strong>l markers<br />
in one level of hierarchy can be changed. We predict<br />
that this feature would be useful if many scientists<br />
work collaboratively on a data set� and each scientist<br />
de�nes a unique color and size for his markers.<br />
4.3.2 Marker Behavior<br />
Since the function of a marker is simply to identify<br />
points of interest in the visu<strong>al</strong>ization� its behavior<br />
is quite simple. A marker is created when the user<br />
presses the annotation push�button. It appears at the<br />
point on which the user is focussed� making it easy for<br />
the user to position it near the feature of interest.<br />
Using the mouse� a scientist can translate and ro�<br />
tate markers. He can <strong>al</strong>so project interactive shadows<br />
of the marker on the planes de�ned by the princip<strong>al</strong><br />
axes �9�. Each shadow is constrained to move in the<br />
plane in which it lies. If a user moves a shadow� the<br />
marker moves in a par<strong>al</strong>lel plane. This constrained<br />
translation helps to precisely position a marker.<br />
Markers can be highlighted in response to a �lter<br />
request. In the current system� the color of a marker<br />
changes to a bright yellow when highlighted. This<br />
simple approach seems adequate.<br />
Since the features of unsteady �uid �ows change<br />
over time� we would like the annotation describing a<br />
particular feature to follow the feature�s movement in<br />
the visu<strong>al</strong>ization. The current annotation system pro�<br />
vides parti<strong>al</strong> support for this by <strong>al</strong>lowing the user to<br />
specify the position of an annotation at any number of<br />
points in time. The annotation markers then linearly<br />
interpolate between the speci�ed positions in time.<br />
4.4 Knowledge Stored<br />
Our annotations can store generic information� as<br />
well as information speci�c to �uid �ow applications.<br />
The generic information includes keyword� textu<strong>al</strong><br />
summary and description� author� and date. We<br />
consulted with �uid �ow experts to understand how<br />
the information content of annotations could be cus�<br />
tomized for �uid �ow applications.<br />
4.4.1 Parameters of Visu<strong>al</strong>ization Tools<br />
One of the additions to the annotation system sug�<br />
gested by the �uid �ow experts results from the in�<br />
teractive nature of �uid �ow an<strong>al</strong>ysis. As described<br />
earlier� a scientist must insert �ow visu<strong>al</strong>ization tools<br />
�such as streamlines and iso�surfaces� in the data space<br />
to see the underlying data. Much time is spent deter�<br />
mining which tools most e�ectively highlight a feature�<br />
and positioning and orienting both the tools and view�<br />
point to best show o� the feature being described.<br />
To support this activity� our concept of an annota�<br />
tion was expanded to include parameters of �ow vi�<br />
su<strong>al</strong>ization tools. When a user wishes to store the<br />
parameters of a set of tools� he or she presses a button<br />
to indicate that a set of tools is being saved� and then<br />
clicks on the tools of interest. The time�varying lo�<br />
cation� orientation� size� and other parameters of the<br />
tools are saved with the annotation. This can be re�<br />
peated any number of times for di�erent groupings of<br />
tools with di�erent parameters. When an annotation<br />
is restored� the user is presented with a list of <strong>al</strong>l saved<br />
sets of tools� and can recover each set of tools to see<br />
how they illustrate the annotated feature.<br />
4.4.2 3D Volume Descriptions<br />
It <strong>al</strong>so became obvious that annotation markers� which<br />
are appropriate for locating point features in a visu<strong>al</strong>�<br />
ization� are not su�cient for CFD applications. Fluid<br />
�ows contain volume features� such as vortices �masses<br />
of �ow with a whirling or circular motion� and plumes<br />
�mobile columns of �ow�. We therefore <strong>al</strong>low users<br />
to associate an annotation with a volume of the data<br />
space� rather than a single point in the space.<br />
To specify a volume� the user positions �pegs� that<br />
de�ne the region�s extreme vertices. The convex hull<br />
of the pegs is computed using the quickhull <strong>al</strong>gorithm<br />
�2� and is rendered in either wireframe or transpar�<br />
ent mode. Vertices can be added� deleted and moved�<br />
and the volume redrawn repeatedly. Figure 2 shows a<br />
volume which has been de�ned in this way.<br />
This implementation provides a simple way to draw<br />
volumes. However� since it uses a convex hull� certain<br />
shapes� such as a 3D �L� shape� cannot be sketched.
Figure 2� A volume de�ned as the convex hull of pegs.<br />
4.5 Retrieving the Annotations<br />
E�ective information retriev<strong>al</strong> and communication<br />
requires that a user can easily identify annotations<br />
relating to a speci�c topic� by a speci�c author� etc.<br />
The system facilitates such data �ltering in two ways.<br />
First� a tradition<strong>al</strong> database �lter <strong>al</strong>lows users to<br />
specify selection criteria �such as the annotation au�<br />
thor or keyword� via a Motif panel. Markers of anno�<br />
tations that satisfy the search criteria are highlighted.<br />
A second �lter uses the Magic Lens metaphor in�<br />
troduced by Bier et <strong>al</strong>. �4�. A Magic Lens �lter is a<br />
rectangular frame� placed in front of the visu<strong>al</strong>ization�<br />
that appears as if it moves on a sheet of glass between<br />
the cursor and the display. The lens performs some<br />
function on the application objects behind it.<br />
Four functions are de�ned for the lens in the anno�<br />
tation system. The �rst sets the color of <strong>al</strong>l objects�<br />
except annotation markers� to gray. This helps users<br />
�nd markers in a cluttered scene. The second displays<br />
only annotations that satisfy the criteria speci�ed in<br />
the Motif database �lter. The third lens function hides<br />
<strong>al</strong>l annotation markers behind the lens. Fin<strong>al</strong>ly� the<br />
default function hides <strong>al</strong>l annotation markers and <strong>al</strong>l<br />
interaction handles on the visu<strong>al</strong>ization tools behind<br />
the lens. Other lens functions could be de�ned� for ex�<br />
ample� a lens could remove <strong>al</strong>l �uid �ow tools except<br />
those in the user�sketched volume behind the lens.<br />
We believe that the Magic Lens �lter <strong>al</strong>leviates<br />
the problem of visu<strong>al</strong>ization and annotation functions<br />
sharing the same screen space. Using the lens� a sci�<br />
entist can choose either to tightly integrate the two<br />
functions or to focus exclusively on either visu<strong>al</strong>iza�<br />
tion or annotation.<br />
5 Future Work<br />
The work described in this paper could be expanded<br />
in a number of ways.<br />
For the �uid �ow application� the facility for record�<br />
ing visu<strong>al</strong>ization tool parameters could be extended to<br />
record view parameters. Annotations could <strong>al</strong>so be�<br />
come more active in the data investigation process.<br />
For example� annotation markers could be used as<br />
seed points for automatic �ow feature�characterization<br />
code. The output of the feature�characterization<br />
code �i.e.� speci�cations of the feature found� could<br />
then be added to the annotation content. Feature�<br />
characterization code could <strong>al</strong>so be used to improve<br />
support for time�varying annotations. If the location<br />
of an annotation marker were constrained to the fea�<br />
ture�s position �as found by feature�characterization<br />
code�� the marker would follow the movement of the<br />
feature over time.<br />
We would <strong>al</strong>so like to implement annotations in<br />
other applications and environments. For example�<br />
virtu<strong>al</strong> re<strong>al</strong>ity environments pose many new research<br />
problems. User studies would have to be performed to<br />
determine which annotation mod<strong>al</strong>ities would be ap�<br />
propriate in this space. If textu<strong>al</strong> annotations were ap�<br />
propriate� we would have to determine where to place<br />
the text� �oating in space near the marker� or on 2D<br />
panels which exist in the virtu<strong>al</strong> space� or perhaps in<br />
some other place. New interaction mechanisms for an�<br />
notation markers and �lters should <strong>al</strong>so be developed.<br />
Fin<strong>al</strong>ly� we would like to expand the scope of an�<br />
notations. Springmeyer et <strong>al</strong>. noted that scientists<br />
record their interactions with visu<strong>al</strong>ization systems.<br />
Perhaps the annotation system could help in record�<br />
ing and examining these edit trails. Also� scientists<br />
routinely compare di�erent data sets. The current<br />
annotation system could be redesigned to �t in the<br />
context of more than one data set.<br />
We hope that further experience with the current<br />
system and its extension to other applications and en�<br />
vironments will <strong>al</strong>low us to ev<strong>al</strong>uate our design guide�<br />
lines� and develop principles for customization of a<br />
gener<strong>al</strong>�purpose annotation system.<br />
6 Conclusion<br />
The importance of annotation and the lack of anno�<br />
tation support in data an<strong>al</strong>ysis tools led us to develop<br />
a system that integrates annotation and visu<strong>al</strong>ization.<br />
We hope our system will help scientists by<br />
� storing annotations with the correct data set
� providing powerful �lters to sort annotations<br />
� making it easy to relate a comment to a data<br />
feature �both are located in the 3D data space�<br />
� giving team members ready access to the deci�<br />
sions and judgements of other scientists<br />
� reducing session setup time by easy restoration of<br />
visu<strong>al</strong>ization tools<br />
� providing a means of communication between col�<br />
laborating scientists.<br />
Initi<strong>al</strong> feedback from scientists indicates that the<br />
integration of annotation and visu<strong>al</strong>ization facilitates<br />
the ongoing recording activity observed by Spring�<br />
meyer et <strong>al</strong>. At the same time� the ability to group and<br />
�lter annotations supports the organization of an<strong>al</strong>ysis<br />
conclusions� i.e.� the describing activity.<br />
Acknowledgments<br />
The authors thank the members of the Graphics<br />
Group at Brown and the Visu<strong>al</strong>ization group at CRL<br />
for their support. The paper is based on the Master�s<br />
thesis of the �rst author� whose attendance at Brown<br />
University was made possible by Digit<strong>al</strong> Equipment<br />
Corporation�s Graduate <strong>Engineering</strong> Education Pro�<br />
gram. The work was supported in part by grants from<br />
Digit<strong>al</strong> Equipment Corporation� NSF� DARPA� IBM 3 �<br />
NCR 4 � Sun 5 � and HP 6 .<br />
References<br />
�1� G. Bancroft� F. Merritt� T. Plessel� P. Kelaita�<br />
R. McCabe� and A. Globus. Fast� A multi�<br />
processed environment for visu<strong>al</strong>ization of com�<br />
putation<strong>al</strong> �uid dynamics. Proc. First IEEE Con�<br />
ference on Visu<strong>al</strong>ization� pages 14�27� 1990.<br />
�2� C. Barber� D. Dobkin� and H. Huhdanpaa. The<br />
quickhull <strong>al</strong>gorithm for convex hull. Technic<strong>al</strong> Re�<br />
port GCG53� Geometry Center� U. Minnesota�<br />
July 1993.<br />
�3� J. Bertin. Graphics and Graphic Information<br />
Processing. W<strong>al</strong>ter de Gruyter and Co.� 1981.<br />
3IBM is a registered trademark of the Internation<strong>al</strong> Business<br />
Machines Corporation.<br />
4NCR is a registered trademark of the NCR Corporation.<br />
5Sun is a registered trademark of Sun Microsystems� Inc.<br />
6HP is a registered trademark of the Hewlett�Packard<br />
Company.<br />
�4� E. Bier� M. Stone� K. Pier� W. Buxton� and<br />
T. DeRose. Toolglass and magic lenses� The see�<br />
through interface. Proc. SIGGRAPH �93� pages<br />
73�80� 1993.<br />
�5� D. Conner� S. Snibbe� K. Herndon� D. Robbins�<br />
R. Zeleznik� and A. van Dam. Three�dimension<strong>al</strong><br />
widgets. Proc. Symposium on Interactive 3D<br />
Graphics� pages 183�188� 1992.<br />
�6� J. Foley� A. van Dam� S. Feiner� and J. Hughes.<br />
Computer Graphics Principles and Practice. Ad�<br />
dison Wesley� 2nd edition� 1992.<br />
�7� E. Francik� S. Rudman� D. Cooper� and S. Levine.<br />
Putting innovation to work� Adoption strategies<br />
for multimedia communication systems. Commu�<br />
nications of the ACM� 34�12��53�63� Dec. 1991.<br />
�8� R. Haimes and D. Darmof<strong>al</strong>. Visu<strong>al</strong>ization in<br />
computation<strong>al</strong> �uid dynamics�a case study. Proc.<br />
Second IEEE Conference on Visu<strong>al</strong>ization� pages<br />
392�397� 1991.<br />
�9� K. Herndon. Interactive shadows. UIST Proceed�<br />
ings� pages 1�6� November 1992.<br />
�10� T. Meyer and N. Huang. Programming in �esh.<br />
Technic<strong>al</strong> report� Department of Computer Sci�<br />
ence� Brown University� 1993.<br />
�11� R. Phillips. Mediaview� a gener<strong>al</strong> multimedia dig�<br />
it<strong>al</strong> publication system. Communications of the<br />
ACM� 34�7��74�83� July 1991.<br />
�12� S. Snibbe� K. Herndon� D. Robbins� D. Conner�<br />
and A. van Dam. Using deformations to explore<br />
3d widget design. Proc. SIGGRAPH �92� pages<br />
351�352� 1992.<br />
�13� R. Springmeyer� M. Blattner� and N. Max. A<br />
characterization of the scienti�c data an<strong>al</strong>ysis<br />
process. Proc. Second IEEE Conference on V isu�<br />
<strong>al</strong>ization� pages 351�352� 1992.<br />
�14� S. Tanimoto. The Elements of Arti�ci<strong>al</strong> Intelli�<br />
gence. Computer Science Press� 1990.<br />
�15� C. Upson and et <strong>al</strong>. The application visu<strong>al</strong>ization<br />
system� A computation<strong>al</strong> environment for scien�<br />
ti�c visu<strong>al</strong>ization. IEEE Computer Graphics and<br />
Applications� 9�4��60�69� July 1989.<br />
�16� J. Verlinden� J. Bolter� and C. van der Mast.<br />
Voice annotation� Adding verb<strong>al</strong> information to<br />
virtu<strong>al</strong> environments. Proc. European Simulation<br />
Symposium� pages 60�69� 1993.
�a� Hedgehog and streamlines showing �b� Annotation markers �sm<strong>al</strong>l geometric<br />
3D �uid �ow objects� placed at points of high velocity<br />
�c� Annotation content panel �d� Magic Lens �lter hiding annotation<br />
markers and widget handles
Abstract<br />
Discretized Marching Cubes<br />
C. Montani ‡ , R. Scateni ⋆ , R. Scopigno †<br />
‡ I.E.I. – Consiglio Nazion<strong>al</strong>e delle Ricerche, Via S. Maria 46, 56126 Pisa, ITALY<br />
⋆ Centro di Ricerca, Sviluppo e Studi Superiori Sardegna (CRS4), Cagliari, ITALY<br />
† CNUCE – Consiglio Nazion<strong>al</strong>e delle Ricerche , Via S. Maria 36, 56126 Pisa, ITALY<br />
Since the introduction of standard techniques for isosurface<br />
extraction from volumetric datasets, one of the hardest<br />
problems has been to reduce the number of triangles (or<br />
polygons) generated.<br />
This paper presents an <strong>al</strong>gorithm that considerably reduces<br />
the number of polygons generated by a Marching Cubes-like<br />
scheme without excessively increasing the over<strong>al</strong>l computation<strong>al</strong><br />
complexity. The <strong>al</strong>gorithm assumes discretization of<br />
the dataset space and replaces cell edge interpolation by<br />
midpoint selection. Under these assumptions, the extracted<br />
surfaces are composed of polygons lying within a finite number<br />
of incidences, thus <strong>al</strong>lowing simple merging of the output<br />
facets into large coplanar polygons.<br />
An experiment<strong>al</strong> ev<strong>al</strong>uation of the proposed approach on<br />
datasets related to biomedic<strong>al</strong> imaging and chemic<strong>al</strong> modelling<br />
is reported.<br />
1 Introduction<br />
The use of the Marching Cubes (MC) technique, origin<strong>al</strong>ly<br />
proposed by W. Lorensen and H. Cline [7], is considered to<br />
be a standard approach to the problem of extracting isosurfaces<br />
from a volumetric dataset. Marching Cubes is a very<br />
practic<strong>al</strong> and simple <strong>al</strong>gorithm and many implementations<br />
are available both as part of commerci<strong>al</strong> systems or as public<br />
domain software.<br />
Despite its extensive use in many applications, it does have<br />
some particular shortcomings: topologic<strong>al</strong> inconsistency [1],<br />
<strong>al</strong>gorithm computation<strong>al</strong> efficiency and excessive output data<br />
fragmentation. Standard MC produces no consistent notion<br />
of object connectivity; the loc<strong>al</strong> surface reconstruction criterion<br />
used give rise to a number of topologic<strong>al</strong> ambiguities,<br />
and therefore MC may output surfaces which are not necessarily<br />
coherent. These shortcomings have been extensively<br />
studied [11] and solutions have been proposed [12, 15, 8].<br />
MC computation<strong>al</strong> efficiency can be increased by exploiting<br />
implicit par<strong>al</strong>lelism (each cell can be independently processed)<br />
[4] and by avoiding the visiting and testing of empty<br />
cells or regions of the volume [14].<br />
Excessive fragmentation of the output data can prevent interactive<br />
rendering when high resolution datasets are processed.<br />
What has changed since the technique was introduced<br />
seven years ago, has been the amount of data to be<br />
processed while extracting such surfaces. Equipments that<br />
can generate volumetric datasets as large as 512∗512∗[≤ 512]<br />
are now gener<strong>al</strong>ly available, and we are on the way to achieving<br />
machines capable of producing 1024 ∗ 1024 ∗ [≤ 1024]<br />
datasets or, in other words, 1 Gigavoxel per dataset. Although<br />
an isosurface does not usu<strong>al</strong>ly cross <strong>al</strong>l the voxels,<br />
we can understand how easy it is to generate more than one<br />
million triangles per surface. State-of-the-art hardware is<br />
not yet fast enough to manipulate such masses of data in<br />
re<strong>al</strong> time.<br />
These obstacles gave rise to substanti<strong>al</strong> research aimed at<br />
reducing the number of triangles generated by MC. The solutions<br />
proposed can be classified into adaptive techniques,<br />
where the cell size is loc<strong>al</strong>ly adapted to the shape of the surface<br />
[10] or the dataset is organized into high and low interest<br />
areas and more primitives are produced in selected areas<br />
only; and filtering techniques, where facet meshes returned<br />
by a surface fitting <strong>al</strong>gorithm are filtered in order to merge<br />
or eliminate part of them.<br />
Filtering–based approaches can be classified as:<br />
a) coplanar facets merging, in which facets are filtered by<br />
searching for and merging coplanar and adjacent facets [6];<br />
b) elimination of tiny facets, where the irregularity of the<br />
surface produced is reduced by eliminating the tiny triangles<br />
produced when the iso-surface passes near a vertex or<br />
an edge of a cubic cell; this is accomplished by bending the<br />
mesh so that a number of selected mesh nodes will lie on the<br />
iso–surface and the tiny triangles will degenerate into single<br />
vertices. The solution is based on a modified iso-surface fitting<br />
<strong>al</strong>gorithm and a filtering phase; 40% reductions in the<br />
number of triangles are reported [9];<br />
c) approximated surface fitting, based on trading off data<br />
reduction for a reduction in the precision of the representation<br />
generated, using error criteria to measure the suitability<br />
of the approximated surfaces.<br />
Schroeder et <strong>al</strong>. [13] proposed an <strong>al</strong>gorithm based on multiple<br />
filtering passes, that by an<strong>al</strong>ysing loc<strong>al</strong>ly the geometry<br />
and topology of a triangle mesh removes vertices that pass<br />
a minim<strong>al</strong> distance or curvature angle criterion. The advantage<br />
of this approach is that any level of reduction can be<br />
obtained, on the condition that a sufficiently coarse approx-
Figure 1: The set of different vertex locations produced by<br />
DiscMC.<br />
imation threshold is set; reductions up to 90% have been<br />
obtained with an approximation error lower than the voxel<br />
size.<br />
In another approach, by Hoppe et <strong>al</strong>. [5], mesh optimization<br />
is achieved by ev<strong>al</strong>uating an energy function over the<br />
mesh, and then minimizing this function by either removing/moving<br />
vertices or collapsing/swapping edges.<br />
Both approaches require a topologic<strong>al</strong> representation of the<br />
mesh to be decimated.<br />
In this work we propose Discretized Marching Cubes<br />
(DiscMC), an <strong>al</strong>gorithm situated h<strong>al</strong>f-way between the cuberille<br />
method, which assumes constant v<strong>al</strong>ue voxels and<br />
directly returns the voxels faces (orthogon<strong>al</strong> to the volume<br />
axes) [3], and the cell interpolation approach of MC. On the<br />
basis of two simple considerations, which both relate to data<br />
characteristics and visu<strong>al</strong>ization requirements, our solution<br />
leads to interesting reductions in output fragmentation by<br />
applying a very simple filtering approach. Moreover, the<br />
use of an unambiguous triangulation scheme [8] <strong>al</strong>lows isosurfaces<br />
without topologic<strong>al</strong> anom<strong>al</strong>ies to be obtained.<br />
2 The Discretized Marching Cubes Algorithm<br />
Given a binary dataset, linear interpolation is not needed<br />
to extract isosurfaces. When a cell edge in a binary dataset<br />
has both on and off corners, the midpoint of the edge is the<br />
intersection being looked for.<br />
In a number of applications where approximated isosurfaces<br />
might be acceptable, the former assumption can be reasonably<br />
extended to n–v<strong>al</strong>ue high resolution datasets. The maxim<strong>al</strong><br />
approximation error involved by adopting midpoint interpolation<br />
is 1/2 of the cell size, and in some applications<br />
the resolution of the dataset justifies such a lack of precision.<br />
Considering a 512 ∗ 512 ∗ [≤ 512] resolution, rendering<br />
the isosurface generated produces approximately the same<br />
images whether linear interpolation or midpoint selection is<br />
used.<br />
Discretized Marching Cubes (DiscMC) is here proposed<br />
as an evolution of MC based on midpoint selection. The<br />
set of vertices that can be generated by DiscMC are shown<br />
in Figure 1: there are only 13 different spati<strong>al</strong> locations on<br />
which new vertices can be created (12 cell-edge midpoints<br />
plus the cell centroid). Moreover, applying midpoint selection<br />
in MC <strong>al</strong>lows for a finite set of planes where the generated<br />
facets lie. We have only 13 different plane incidences<br />
onto which a facet can lie, and these are described by the<br />
following equations:<br />
Figure 2: The facets returned by DiscMC for each different<br />
plane incidence.
Figure 3: The sets of facets returned by DiscMC for each<br />
cell vertex configuration.<br />
x = c, y = c, z = c,<br />
x ± y = c, x ± z = c, y ± z = c,<br />
x ± y ± z = c.<br />
As shown in Figure 2, for each incidence the <strong>al</strong>gorithm generates<br />
a limited number of different facets.<br />
The following considerations are the basis of our DiscMC<br />
<strong>al</strong>gorithm:<br />
a) each facet can be simply classified in terms of its shape<br />
and plane incidence;<br />
b) the limited number of different plane incidences increases<br />
the percentage of coplanar adjacent facets and therefore<br />
drastic<strong>al</strong>ly reduces the number of polygons returned while<br />
preserving sm<strong>al</strong>l, but possibly significant, roughnesses;<br />
c) the <strong>al</strong>gorithm does not require interpolation of the surface<br />
intersections <strong>al</strong>ong the edges of the cells; this implies that it<br />
works in integer arithmetic (except for the computation of<br />
norm<strong>al</strong>s) at a higher speed than standard methods.<br />
2.1 A new lookup table<br />
For each on-off combination of the cell vertices (there are<br />
256 different combinations), the standard MC lookup table<br />
(lut) codes the number of triangles produced and the cell<br />
edges on which these vertices lie.<br />
DiscMC requires a simple reorganization of the standard MC<br />
lut. Midpoint selection means that the number of different<br />
facets returned by DiscMC is fixed, and we only have a constant<br />
number of different output primitives for each plane<br />
Figure 4: Some cell configurations and related DiscMC<br />
lookup table entries.<br />
incidence: only right triangles are generated on planes x = c,<br />
y = c and z = c (Figures 2.1, 2.2 and 2.3); only rectangles on<br />
planes x ± y = c, x ± z = c and y ± z = c (Figures 2.4, 2.5,<br />
2.6, 2.7, 2.8 and 2.9); only equilater<strong>al</strong> triangles on planes<br />
x ± y ± z = c (Figures 2.10, 2.11, 2.12 and 2.13). Moreover,<br />
using midpoint interpolation means that the geometric<strong>al</strong> location<br />
of facet vertices depends solely on the vertices configuration<br />
and the position of the cell in the dataset mesh.<br />
Under these assumptions, the resulting facet set returned<br />
by DiscMC for each of the canonic<strong>al</strong> MC configurations is<br />
reported in Figure 3. With respect to the origin<strong>al</strong> propos<strong>al</strong><br />
by Lorensen and Cline we omit configuration 14 (this can be<br />
obtained by reflection from configuration 11, i.e. configuration<br />
k in Figure 3.). Furthermore, three more configurations<br />
have to be managed in order to prevent topologic<strong>al</strong> ambiguity<br />
(configurations n, o and p in Figure 3 [8]).<br />
Each facet is coded in the DiscMC lut by using a shape code,<br />
which codifies the shape and position of the facet (1..4 for<br />
right triangles, 1..2 for rectangles and 1..8 for equilater<strong>al</strong> triangles),<br />
and an incidence code, i.e. the plane on which the<br />
facet lies. Geometric<strong>al</strong> information on the facet vertices is<br />
not explicitly stored in the DiscMC lut.<br />
For each cell vertex configuration, DiscMC lut stores from<br />
zero up to seven facets, each represented by a shape code<br />
(1..8) and an incidence code (-13..13). We use signed incidences<br />
to store separately facets which lie on the same plane<br />
and have opposite norm<strong>al</strong>s direction (both in order to give<br />
an implicit representation of facet orientation and to fast<br />
facet search in the postprocessing merging phase).<br />
Some cell configurations are graphic<strong>al</strong>ly represented in Figure<br />
4, together with the corresponding DiscMC lut entries.<br />
2.2 Isosurface extraction<br />
The isosurface reconstruction process returns intermediate<br />
results using a set of indexed data structures. The volume<br />
dataset is processed slice by slice. For each cell traversed<br />
by an isosurface, the DiscMC produces a set of facets by
means of the DiscMC lut. Each facet is coded by its shape,<br />
incidence and the index of the cell in which it lies (i.e. its<br />
geometic<strong>al</strong> position).<br />
In order to optimize the merging phase the facets produced<br />
are stored in a number of hash tables, one for each different<br />
incidence of the facets. Thus, 26 hash tables are used, and<br />
hash indexes are computed in terms of shape code and cell<br />
index.<br />
2.3 Post-processing merging phase<br />
The merging phase begins when the isosurfaces have been<br />
fitted. Each hash table is an<strong>al</strong>yzed in order to search for<br />
adjacent faces, which by construction of the hash tables will<br />
<strong>al</strong>so be iso-oriented and mergeable. Hash coding is chosen<br />
to <strong>al</strong>low a rapid search for adjacent facets (a nearly constant<br />
mean access time has been measured in a number of <strong>al</strong>gorithm<br />
runs).<br />
The merging <strong>al</strong>gorithm does not work with the vertex coordinates<br />
of each merging polygon, but adopts Freeman’s<br />
chains [2] as an intermediate representation scheme. In this<br />
scheme, a polygon<strong>al</strong> line is represented by the coordinates<br />
of the starting point of the chain and a set of directed links,<br />
that is, a set of relative displacements. This solution <strong>al</strong>lows<br />
the unnecessary vertices to be rapidly eliminated.<br />
The merging <strong>al</strong>gorithm is simple and efficient. Due to<br />
the limited number of facet shapes and orientations, for each<br />
facet f and for each edge e of f the facet f ′ which might be<br />
adjacent on e to f is univoc<strong>al</strong>ly determined. The <strong>al</strong>gorithm<br />
is outlined in Figure 5 (an example is shown in Figure 6).<br />
PUSH ∗ verifies, for each edge pushed onto the edgestack,<br />
if an opposite edge exists on the stack, i.e. an edge with the<br />
same geometric<strong>al</strong> position but moving in the opposite direction.<br />
If this edge exists, mark both the edges as connecting<br />
edges. Marked edges will produce either connecting links<br />
(i.e. links which connect the starting point of the chain to<br />
the boundary of the region, or the boundary of the region<br />
to the boundary of the holes; see links 2 and 7 in the 15th<br />
tiles triple of Figure 6), or consecutive opposite links that<br />
have to be eliminated due to the reconstruction <strong>al</strong>gorithm<br />
adopted.<br />
The Merge <strong>al</strong>gorithm main loop iterates until hash tables<br />
are empty. For each iteration of the first while loop, Merge<br />
produces the boundary of a region (anticlockwise in our implementation)<br />
and the boundaries of the holes (clockwise),<br />
if any. At the end of each iteration the boundaries of regions<br />
and holes are reconstructed by eliminating the marked links<br />
and, if necessary, by splitting the chain. Chains are then<br />
converted in the usu<strong>al</strong> vertex–based representation.<br />
The Merge <strong>al</strong>gorithm uses a set of simple lookup tables<br />
which permit a gener<strong>al</strong> procedure to be designed irrespective<br />
of the type of the facets and the plane they belong to. These<br />
lookup tables store:<br />
• the edges to be pushed onto the edgestack (depending<br />
on the starting point chosen);<br />
• the edges to be pushed onto the edgestack when an<br />
adjacent facet has been found, or otherwise the link to<br />
be added to the Freeman’s chain;<br />
• the position (with respect to the current cell) of the<br />
cells to be inspected for adjacent facets.<br />
In addition, through lookup tables we convert the chain links<br />
into relative displacements depending on the incidence plane<br />
we are examining.<br />
Figure 7: The links of Freeman’s chains for (a) right triangles<br />
belonging to plane 3, (b) rectangles of plane 9, and (c)<br />
equilater<strong>al</strong> triangles of plane 12.<br />
As previously introduced, with Freeman’s chain representation<br />
scheme (Figure 7 shows the links used for three types of<br />
elementary primitives) unnecessary vertices can be removed<br />
by simply converting equ<strong>al</strong> consecutive links into a single<br />
segment.<br />
The worst case computation<strong>al</strong> complexity of the merging<br />
phase is linear to the number of facets returned by the isosurface<br />
reconstructor. For each edge, the merger computes<br />
the potenti<strong>al</strong> adjacent facet and searches for such a facet in<br />
the hash table (a nearly constant time operation). In the<br />
worst case, when no mergeable facet pairs exist, the test is<br />
repeated e times for each facet f, with e the number of edges<br />
of facet f.<br />
2.4 Vertex norm<strong>al</strong>s computation<br />
Norm<strong>al</strong>s on the vertices of the isosurfaces extracted are<br />
needed in order to compute Gouraud or Phong shading.<br />
Norm<strong>al</strong>s can be computed during isosurface extraction (in<br />
terms of gradients [16], as in standard MC) or after the<br />
merging phase. In the current DiscMC implementation we<br />
computed vertex norm<strong>al</strong>s at the end of the merging process<br />
in order to avoid computing and storing a lot of unnecessary<br />
vertex norm<strong>al</strong>s. However, further processing of the volume<br />
data is thus needed.<br />
3 Ev<strong>al</strong>uation of results and conclusions<br />
We tested DiscMC on a series of different datasets and compared<br />
results with a classic MC implementation. Table 1 reports<br />
the number of polygons generated and it refers to three<br />
datasets: Sphere is a voxelized sphere, Buckyb<strong>al</strong>l is the<br />
electron density around a molecule of C60 (courtesy of AVS<br />
Internation<strong>al</strong> Centre) and Head is a CAT scanned dataset<br />
(courtesy of of Niguarda Hospit<strong>al</strong>, Milan, It<strong>al</strong>y). The numbers<br />
of facets and vertices returned by Classic MC and DiscMC<br />
are reported in Table 1. DiscMC returns triangular<br />
(3 − facets), quadrilater<strong>al</strong> (4 − facets) or n-sided facets
Algorithm MERGE<br />
input HT1, ..., HT26:facet hash tables;<br />
output F :facet list;<br />
begin<br />
for each hash table HTi do<br />
while HTi is not empty do<br />
• extract a facet f from hash table HTi;<br />
• select one of the vertices of f as the starting point of the<br />
current Freeman chain;<br />
• push the edges of the facet onto the edgestack (LIFO);<br />
{each edge is coded in the edgestack by the shape code of the current facet<br />
and the shape code and the cell coordinates of the potenti<strong>al</strong> adjacent facet.<br />
This notation will indicate, for each edge extracted from edgestack,<br />
the source facet and the adjacent facet to be searched for.}<br />
while edgestack is not empty do<br />
er:=POP(edgestack); {er:edge record}<br />
fadj:=er.adjacent facet;<br />
if facet fadj is contained in HTi<br />
then<br />
• extract the facet fadj;<br />
for each edge ej ∈ fadj such that ej �= er do<br />
PUSH ∗ (edgestack, ej); {PUSH ∗ : see text in Section 2.3}<br />
else<br />
• add a link to the chain which is directed according to the current edge er;<br />
• if the edge is a connecting edge, add a marked link to the current chain<br />
(e.g. the link with a white arrow head in the 16th tile triple in Figure 6);<br />
• insert the current Freeman chain into F ;<br />
end <strong>al</strong>gorithm.<br />
(n − facets); the respective numbers are in the rightmost<br />
three columns in Table 1.<br />
Time comparison needs to be split into three steps: facet<br />
extraction, merging and generation of norm<strong>al</strong>s. The percentage<br />
of time spent in each stage of the computation varies<br />
from dataset to dataset; on average, it takes about 10% of<br />
the tot<strong>al</strong> time to extract facets, 85% to merge polygons, and<br />
about 5% to generate norm<strong>al</strong>s. The buckyb<strong>al</strong>l dataset and<br />
the head dataset, which are comparable in terms of voxel<br />
number, took around 2-3 minutes and 6-7 minutes, respectively,<br />
on an IBM RISC6000/550 workstation.<br />
It is difficult to make a time comparison with other filtering<br />
approaches, because most of them do not report the<br />
running times but only the simplification percentages obtained.<br />
The mesh optimization approach by Hoppe et <strong>al</strong>.<br />
[5] is the only <strong>al</strong>ternative technique which reports running<br />
times; the simplification of meshes (8000-18000 facets) with<br />
this method, which produces very good results indeed, took<br />
tens of minutes on a DEC Alpha workstation.<br />
In the propos<strong>al</strong> by Schroeder et <strong>al</strong>. [13] running times are<br />
not reported, but the decimation phase is a much more complex<br />
task than the simple merging phase of DiscMC. In fact,<br />
the simplification of the mesh is obtained by multiple passes<br />
over the mesh. At each pass a vertex is selected for remov<strong>al</strong>,<br />
<strong>al</strong>l triangles that are incident on that vertex are removed,<br />
and the resulting hole is patched by computing a new loc<strong>al</strong><br />
triangulation.<br />
On the other hand, in the worst case, DiscMC has a complexity<br />
linear to the number of edges: for each edge of each<br />
facet, it searches for the adjacent facet on a hash list (a<br />
constant time and cheap operation), and makes an insertion/remov<strong>al</strong><br />
onto/from the edge stack.<br />
The reduction in time complexity is significant, because the<br />
Figure 5: Pseudocode of the Merge <strong>al</strong>gorithm<br />
design go<strong>al</strong> of DiscMC was to give simplified meshes with<br />
high efficiency, to be used, for example, while searching for<br />
the correct threshold. Once this threshold has been selected,<br />
a more sophisticated method such as [13] can be used to obtain<br />
the best approximated mesh.<br />
Another characteristic which differentiates DiscMC from<br />
other simplification approaches is that it does not entail<br />
managing a geo-topologic<strong>al</strong> representation of the triangle<br />
mesh. The topologic<strong>al</strong> relations are implicitly stored in the<br />
coding scheme used (facets shape and incidence) and this<br />
simplifies the implementation at the cost of single constant–<br />
time search into hash lists.<br />
The results obtained and the good qu<strong>al</strong>ity of the output<br />
images (the colour plates in Figures 9 and 11 were obtained<br />
with our <strong>al</strong>gorithm, while the ones on Figures 8 and 10 were<br />
obtained with classic MC without mesh simplification) support<br />
our claim that Discretized Marching Cubes represents<br />
a v<strong>al</strong>id tool for the rapid reconstruction and visu<strong>al</strong>ization of<br />
isosurfaces from medium and high resolution 3D datasets.<br />
One of the most s<strong>al</strong>ient characteristics of the <strong>al</strong>gorithm is<br />
that integer arithmetic is sufficient, and restricts the use of<br />
floating point computations to norm<strong>al</strong>s only. This is an important<br />
factor which enhances the over<strong>al</strong>l performance.<br />
Discretized Marching Cubes is both a v<strong>al</strong>id solution for applications<br />
where the precision of the result is not critic<strong>al</strong> or<br />
<strong>al</strong>so as an intermediate solution to speed up the time needed<br />
to tune parameters, relegating to the fin<strong>al</strong> stage <strong>al</strong>one the<br />
use of techniques that are more precise in terms of visu<strong>al</strong><br />
results or geometric<strong>al</strong> approximation, such as ray tracing or<br />
standard MC.
Figure 6: Steps required to merge a number of adjacent facets: for each iteration, the figure represents the facets remaining<br />
in the facet list (left tile), the edges present on the edge stack (centre tile) and the current Freeman chain (right tile). In the<br />
edge stack tiles, the label associated with the edges represents the order of insertion in the stack (1 is the top edge); edges<br />
which have a circled label represent connecting edges. In the chain tiles, arrows with a white end represent connecting links.<br />
Classic MC DiscMC<br />
# facets # vertices # facets # vertices # 3-facet # 4-facet # n-facet<br />
Sphere (100 3 ) 37,784 18,556 5,501 9,594 0 5,167 334<br />
Buckyb<strong>al</strong>l (128 3 ) 204,408 103,072 17,039 28,528 1,238 12,200 3,601<br />
Head (256 2 x33) 428,181 216,431 57,413 77,712 13,005 34,856 9,552<br />
Table 1: The number of facets returned by the Discretized Marching Cubes and classic Marching Cubes <strong>al</strong>gorithms on three<br />
different datasets.
4 Acknowledgements<br />
This work has been parti<strong>al</strong>ly carried out with the financi<strong>al</strong><br />
contribution of the Sardinian Region<strong>al</strong> Authorities.<br />
References<br />
[1] M. J. Dürst. Letters: Addition<strong>al</strong> reference to “Marching<br />
Cubes. ACM Computer Graphics, 22(4):72–73, 1988.<br />
[2] H. Freeman. Computer processing of line-drawing images.<br />
ACM Computing Surveys, 6:57–97, 1974.<br />
[3] D. Gordon and J.K. Udupa. Fast surface tracking in 3D<br />
binary images. Computer Vision, Graphics and Image<br />
Processing, (45):196–214, 1989.<br />
[4] C.D. Hansen and P. Hinker. Massively par<strong>al</strong>lel isosurface<br />
extraction. In A.E. Kaufman and G.M. Nielson, editors,<br />
Visu<strong>al</strong>ization ’92 Proceedings, pages 77–83. IEEE<br />
Computer Society Press, 1992.<br />
[5] H. Hoppe, T. DeRose, T. Duchamp, J. McDon<strong>al</strong>d,<br />
and W. Stuetzle. Mesh optimization. ACM Computer<br />
Graphics (SIGGRAPH ’93 Conf. Proc.), pages 19–26,<br />
August 1-6 1993.<br />
[6] A.D. K<strong>al</strong>vin, C.B. Cutting, B. Haddad, and M.E. Noz.<br />
Constructing topologic<strong>al</strong>ly connected surfaces for the<br />
comprehensive an<strong>al</strong>ysis of 3D medic<strong>al</strong> structures. SPIE<br />
Vol. 1445 Image Processing, pages 247–259, 1991.<br />
[7] W. Lorensen and H. Cline. Marching cubes: a high resolution<br />
3D surface construction <strong>al</strong>gorithm. ACM Computer<br />
Graphics, 21(4):163–170, 1987.<br />
[8] C. Montani, R. Scateni, and R. Scopigno. A modified<br />
look-up table for implicit disambiguation of Marching<br />
Cubes. The Visu<strong>al</strong> Computer, Vol.10, 1994, to appear.<br />
[9] D. Moore and J. Warren. Compact isocontours from<br />
sampled data. In D. Kirk, editor, Graphics Gems III,<br />
pages 23–28. Academic Press, 1992.<br />
[10] H. Muller and M. Stark. Adaptive generation of surfaces<br />
in volume data. The Visu<strong>al</strong> Computer, 9(4):182–<br />
199, 1993.<br />
[11] P. Ning and J. Bloomenth<strong>al</strong>. An Ev<strong>al</strong>uation of Implicit<br />
Surface Tilers. IEEE Computer Graphics & Applications,<br />
13(6):33–41, Nov. 1993.<br />
[12] B.A. Payne and A.W. Toga. Surface mapping brain<br />
functions on 3D models. IEEE Computer Graphics &<br />
Applications, 10(2):41–53, Feb. 1990.<br />
[13] W.J. Schroeder, J.A. Zarge, and W. Lorensen. Decimation<br />
of triangle mesh. ACM Computer Graphics,<br />
26(2):65–70, July 1992.<br />
[14] J. Wilhelms and A. Van Gelder. Octrees for faster<br />
isosurface generation. ACM Computer Graphics,<br />
24(5):57–62, Nov. 1990.<br />
[15] J. Wilhelms and A. Van Gelder. Topologic<strong>al</strong> considerations<br />
in isosurface generation. ACM Computer Graphics,<br />
24(5):79–86, Nov 1990.<br />
[16] R. Yagel, D. Cohen, and A. Kaufman. Norm<strong>al</strong> estimation<br />
in 3D discrete space. The Visu<strong>al</strong> Computer,<br />
8:278–291, 1992.
Figure 8� Isosurface reconstruction from the Buckyb<strong>al</strong>l dataset using standard<br />
MC �no mesh simpli�cation�.<br />
Figure 9� Isosurface reconstruction from the Buckyb<strong>al</strong>l dataset using DiscMC.
Figure 10� Isosurface reconstruction from the Head dataset using standard MC<br />
�no mesh simpli�cation�.<br />
Figure 11� Isosurface reconstruction from the Head dataset using DiscMC.
Approximation of Isosurface in the Marching Cube�<br />
Ambiguity Problem.<br />
Abstract<br />
The purpose of the present article is the considera�<br />
tion of the problem of ambiguity over the faces arising<br />
in the Marching Cube <strong>al</strong>gorithm. The article shows<br />
that for unambiguous choice of the sequence of the<br />
points of intersection of the isosurface with edges con�<br />
�ning the face it is su�cient to sort them <strong>al</strong>ong one<br />
of the coordinates. It <strong>al</strong>so presents the solution of this<br />
problem inside the cube. The graph theory methods are<br />
used to approximate the isosurface inside the cell.<br />
Introduction<br />
Let there be a rectilinear volume grid whose nodes<br />
contain the v<strong>al</strong>ues of the function Fijk � F �x� y� z�.<br />
The problem is to approximate the isosurface<br />
S� � f�x� y� z� � F �x� y� z� � �g� �1�<br />
In the MC <strong>al</strong>gorithm �1�� �2� the isosurface is ap�<br />
proximated sequenti<strong>al</strong>ly in <strong>al</strong>l cells comprising the vol�<br />
ume grid and intersecting the speci�ed surface.<br />
In this case the coordinates of the points of of edges<br />
intersecting the isosurface are computed. Then the<br />
part of the surface intersecting the given cell is con�<br />
structed at the points obtained.<br />
In virtue of symmetry there are only 15 possible<br />
types of intersection of the isosurface and the cubic<br />
cell.<br />
The problem is that during approximation of the<br />
isosurface there is a possibility for �holes� to appear<br />
inside the cells of the volume grid as a result of the<br />
wrong connection of the points on the edges of the<br />
cells �see Figure 1�. Here and in what follows the<br />
black points denote the edges outside the isosurface<br />
Fnode � �. In the MC method this problem is solved<br />
for each cell separately without taking into account<br />
the e�ect of the adjacent cells. Now the problem is to<br />
connect the points at the cell edges correctly� in which<br />
case the problem of �holes� appearing at the cell edges<br />
is solved.<br />
Sergey V. Matveyev<br />
Computer Science Department<br />
Institute for High Energy Physics<br />
142284� Protvino� Moscow Region� Russia<br />
E�mail� matveyev�desert.ihep.su<br />
Figure 1� Ambiguity at the Edge<br />
To connect the points correctly one may use the<br />
v<strong>al</strong>ue of the function at the edge center �2�.<br />
The comparison of the v<strong>al</strong>ue at the point with the<br />
one on the isosurface <strong>al</strong>lows one to conclude whether<br />
the given point is inside or outside the isosurface.<br />
However this solution does not <strong>al</strong>ways yield the correct<br />
result �see Figure 2�.<br />
Figure 2� Example of wrong connection<br />
For the solution of this problem Nielson and<br />
Hamann �4� proposed to use a bilinear representation<br />
of the function. In this case the curve describing the
intersection of the isosurface with the edge will be a<br />
hyperbolic one.<br />
De�ning the v<strong>al</strong>ue of the function at the point of the<br />
intersection of the hyperbola asymptotes we may tell<br />
in what sequence it is necessary to connect points at<br />
the edge �see Figure 3� because this point lies between<br />
the isolines at the edge.<br />
Figure 3� Two Ways of Connecting the Points at the<br />
Edge<br />
Another problem is that inside the cell it is neces�<br />
sary to obtain the isosurface topologic<strong>al</strong>ly equiv<strong>al</strong>ent<br />
to the given one �3�� �4�. The solution to this prob�<br />
lem consists in the correct connection of the points<br />
in the cell volume and in separating triangles �in the<br />
gener<strong>al</strong> case of polygons� approximating the isosurface<br />
correctly. The possible cases are an<strong>al</strong>yzed in the paper<br />
by Nielson and Hamann �4�.<br />
Figure 4� Cell<br />
Let 8 v<strong>al</strong>ues of the function Bi �see Figure 4� be<br />
speci�ed in the cube nodes. A trilinear interpolation<br />
will be a natur<strong>al</strong> description of the function inside the<br />
cell. In this case when going over to the face we ob�<br />
tain a bilinear description and when going over to the<br />
edge we obtain a linear one. Then using a unity cube<br />
for the description of the cell we obtain the following<br />
equation�<br />
F �x� y� z� � a � bx � cy � dz � �2�<br />
� exy � fxz � gyz � hxyz�<br />
where 0 � x � 1� 0 � y � 1� 0 � z � 1.<br />
The constants are de�ned as<br />
a � B1�<br />
b � B2 � B1�<br />
c � B4 � B1�<br />
d � B5 � B1� �3�<br />
e � B3 � B1 � B2 � B4�<br />
f � B6 � B1 � B2 � B5�<br />
g � B8 � B1 � B4 � B5�<br />
h � B7 � B5 � B4 � B2 � B1 � B3 � B6 � B8�<br />
Solution at the Cell Edges<br />
To determine the point of the intersection of the<br />
isosurface with the cell edge the MC method uses the<br />
linear interpolation. The bilinear interpolation will be<br />
a natur<strong>al</strong> representation of the function at the edge.<br />
Figure 5� Sorting points at the edge<br />
When an<strong>al</strong>yzing the function behaviour at the edge<br />
we will use the edge projection onto a unity square.<br />
Then the function behaviour at the edge is described<br />
by the equation in loc<strong>al</strong> coordinates u� v�<br />
F �u� v� � a � bu � cv � duv� �4�<br />
where 0 � u � 1� 0 � v � 1.<br />
For the straight line u � const equation �2� will<br />
depend only on one variable<br />
F �u � const� v� � F �v�� �5�<br />
and� hence� will have not more than one solution on<br />
the section from 0 to 1� i.e. not more than one inter�<br />
section with the isosurface.
Let us sort the points of the intersection of the edges<br />
with the isosurface with respect to u and connect them<br />
in pairs �see Figure 5�� in which case the condition of<br />
�one intersection� will be satis�ed.<br />
In this case for v � const this rule is satis�ed auto�<br />
matic<strong>al</strong>ly.<br />
Figure 6� Inadmissible intersection of the isosurface<br />
with edge<br />
Let us assume that this is not so and the case shown<br />
in Figure 6 is possible. Let the isosurface with the<br />
function v<strong>al</strong>ue S0 � f�x� y� z� � F �x� y� z� � 0g be<br />
approximated. As to other cases� they are reduced by<br />
the transfer of the coordinates. Then for the points of<br />
the intersection of the isosurface with the face edges<br />
the following inequ<strong>al</strong>ities should hold true�<br />
B01<br />
B01 � B11<br />
B00<br />
B00 � B01<br />
B10<br />
B10 � B00<br />
B11<br />
B11 � B10<br />
�<br />
�<br />
�<br />
�<br />
We obtain from the 1st pair that<br />
B01<br />
B10<br />
and from the 2nd one that<br />
B01<br />
B10<br />
B00<br />
�<br />
B00 � B10<br />
B10<br />
�<br />
B10 � B11<br />
B11<br />
B11 � B01<br />
B01<br />
�<br />
B01 � B00<br />
� �6�<br />
� �B00 � B01��B01 � B11�<br />
� �7�<br />
�B00 � B10��B10 � B11�<br />
� �B01 � B00��B11 � B01�<br />
� �8�<br />
�B10 � B00��B11 � B10�<br />
So� we have proved that this case is impossible.<br />
Consequently� to connect the points at the edge cor�<br />
rectly it is su�cient to sort them <strong>al</strong>ong one of the<br />
coordinates.<br />
Obtaining Points inside the Cell<br />
Now let us consider the function behaviour inside<br />
the cell. As a complexity criteria we use the number<br />
of the isosurface intersections with the cube diagon<strong>al</strong>s<br />
�see Figure 7�.<br />
In the case of one intersection it is su�cient to have<br />
the v<strong>al</strong>ues of the function in the cell nodes� whereas<br />
in the case of two intersections one may introduce an<br />
addition<strong>al</strong> point inside the cell that can be the point<br />
of the intersection of the diagon<strong>al</strong>s as it was o�ered<br />
in the work by E. Chernyaev and S. Matveyev �5�.<br />
However� using the technique o�ered it is impossible<br />
to determine the intersection points for the case pre�<br />
sented in Figure 2. The technique o�ered in the paper<br />
by Nielson and Hamann �4� that consists in obtaining<br />
an addition<strong>al</strong> point belonging to the isosurface inside<br />
the cell will yield the correct result in cases 7a� b� c<br />
Figure 7� Types of intersections with the diagon<strong>al</strong><br />
In the case of three intersections it becomes impos�<br />
sible to reconstruct the topology using the technique<br />
o�ered. The point is that it is necessary to obtain ad�<br />
dition<strong>al</strong> points belonging to the isosurface inside the<br />
cube.<br />
Let us construct on the diagon<strong>al</strong>s of the cube six<br />
rectilinear slices� each determined by two diagon<strong>al</strong>s<br />
�see Figure 8�� S1476 �points B1� B4� B7� B6�� S2385�<br />
S1278� S3456� S1573 S2684.<br />
Let us introduce a loc<strong>al</strong> variable � connected with<br />
the position of the point on the diagon<strong>al</strong>. Then the<br />
equations describing the function behaviour on the di�<br />
agon<strong>al</strong>s B1 � B7� B2 � B8� B4 � B6� B5 � B3 are equ<strong>al</strong><br />
to<br />
F ��� �� �� � a � �b � c � d�� � �9�<br />
��e � f � g�� 2 � h� 3 �<br />
F �1 � �� �� �� � a � b � ��b � c � d � e � f�� �<br />
���e � f � g � h�� 2 � h� 3 �<br />
F ��� 1 � �� �� � a � c � �b � c � d � e � g�� �<br />
���e � f � g � h�� 2 � h� 3 �<br />
F ��� �� 1 � �� � a � d � �b � c � d � f � g�� �<br />
respectively� where 0 � � � 1.<br />
��e � f � g � h�� 2 � h� 3 �
Figure 8� Con�guration of slices<br />
Hence� on the diagon<strong>al</strong>s the function is speci�ed by<br />
a cubic equation and there is a possibility to �nd the<br />
coordinates �i of three intersections with the diagon<strong>al</strong><br />
of the surface approximated.<br />
Two cube edges and two diagon<strong>al</strong>s of the cube faces<br />
form the edges con�ning each slice �see Figure 8�. The<br />
points of the isosurface intersection with the diagon<strong>al</strong>s<br />
of the cube edges are found from equations �2� be�<br />
coming a bilinear one on the edge by introducing the<br />
parameter �. On the diagon<strong>al</strong>s of the cube edges the<br />
function will have a quadratic dependence on � and�<br />
hence� will have not more than two intersections with<br />
the isosurface.<br />
The next step is the correct connection of the ob�<br />
tained points in the planes of the slices.<br />
Figure 9� Slice S3456 in loc<strong>al</strong> coordinates<br />
Let us consider the slice S3456 shown in Figure 9.<br />
Let us go over to the loc<strong>al</strong> coordinate system �u�v�<br />
related to this slice. Then for the straight line u �<br />
const equation �2� will have a linear dependence�<br />
F ��� const� const� � F ���� �10�<br />
and for the line v � const it will have a quadratic one�<br />
F �const� 1 � �� �� � F �� 2 �� �11�<br />
Figure 10� Graph for the cell points<br />
Hence� the points sorting on the slice with respect<br />
to u speci�es the correct sequence for their connection.<br />
In this case the points lying on the edges �boundary�<br />
of the slice should be marked as boundary ones at<br />
which there is the transition from one isoline to an�<br />
other one. On the sorted list these points should be<br />
at the adjacent places. In the gener<strong>al</strong> case� the list is<br />
as follows�<br />
fb1� i1� ���� b2� b3� ik� ���� im� b4� ���� bn�1� ���� bng�<br />
where �b�oundary points� �i�nner points�<br />
and the set of the isolines is presented in the form �see<br />
Figure 9�<br />
fb1� i1� ���� b2g� fb3� ik� ���� im� b4g� ���� fbn�1� ���� bng�<br />
Approximation of Isosurface inside the<br />
Cube<br />
As a result of previous steps we obtained a large set<br />
of points and segments constructed at these points.<br />
We will consider these points to be the nodes of<br />
a graph and segments to be its arcs �see Figure 10�.<br />
Here bj denote the points belonging to the boundary<br />
of the cell �lying on the faces� and ij denote those<br />
inside it.<br />
Let us construct the adjacency matrix of this graph�<br />
adj �<br />
0<br />
B<br />
�<br />
0 � � � 1 � � � 1 0<br />
0 0 � � � 1 � � � 1<br />
0 0 0 � � � 1 0<br />
. . . . . .<br />
0 0 0 � � � � � � 0<br />
1<br />
C<br />
A<br />
�12�
Here 0 means the absence of the connection between<br />
points i and j and 1 presence of such a connection<br />
or the path equ<strong>al</strong> to 1. In this case the elements of<br />
the main diagon<strong>al</strong> and those below it are equ<strong>al</strong> to 0<br />
because it is su�cient for us to take into account only<br />
once that the node i is connected with that of j.<br />
Now consider the expression �6�<br />
�adj�i� 1� and adj�1� j�� or<br />
�adj�i� 2� and adj�2� j�� or � � � �13�<br />
or �adj�m� 1� and adj�m� j���<br />
The v<strong>al</strong>ue of this expression is equ<strong>al</strong> to 1 if there<br />
is a path of length 2 from the node i to the node j.<br />
From here one can �nd out through which node they<br />
are connected.<br />
It is seen from the matrix that element �ij� of ma�<br />
trix adj2 is equ<strong>al</strong> to Boolean product of adjacency ma�<br />
trix by itself�<br />
adj2 � adj � adj<br />
Now let us �nd the logic<strong>al</strong> sum of matrixes adj and<br />
adj2�<br />
adj12 � adj and adj2<br />
The element �ij� of the matrix adj12 obtained is<br />
equ<strong>al</strong> to 1 if the nodes i and j are the vertices of<br />
a triangle. The third node can be found from the<br />
expression �13� used for the construction of the matrix<br />
adj2.<br />
The matrix of paths equ<strong>al</strong> to 3 is obtained as a<br />
result of Boolean product of the adjacency matrix by<br />
the one of paths equ<strong>al</strong> to 2�<br />
If matrix adj13�<br />
adj3 � adj � adj2�<br />
adj13 � adj and adj3<br />
contains elements equ<strong>al</strong> to 1 we may mark the nodes<br />
approximating the isosurface by quadrangles. Their<br />
triangulation is carried out following� for example� the<br />
criterion o�ered by Choi and his co�authors �7�. If <strong>al</strong>l<br />
elements of matrix adj13 are equ<strong>al</strong> to 0 this means that<br />
triangles are su�cient for approximation and there is<br />
no need in further c<strong>al</strong>culations.<br />
The given procedure will be carried out m times<br />
until <strong>al</strong>l the elements of the matrix adj1m are equ<strong>al</strong> to<br />
0.<br />
Conclusions and Acknowledgments<br />
The present work o�ers a new approach to the so�<br />
lution of the problem of ambiguity at the cell edge<br />
using the MC <strong>al</strong>gorithm. It has been shown that for<br />
such a solution it is su�cient to sort the points of the<br />
intersection of the isosurface with the edges con�ning<br />
the given face <strong>al</strong>ong one of the coordinates and then<br />
to connect them in pairs.<br />
The procedure of approximating the surfaces of a<br />
complicated con�gurations inside a volume cell was<br />
presented. It <strong>al</strong>so shows the technique for obtaining<br />
inside it the points lying on the surface and for con�<br />
necting them in the correct sequence. The obtained<br />
points and connections between them are presented in<br />
the form of a graph. To approximate the isosurface�<br />
the graph theory methods are used.<br />
To conclude� the author would like to express his<br />
sincere gratitude to V. Gusev for fruitful discussions<br />
and <strong>al</strong>so to L. Milichenko and V. Yankova for them<br />
assistance in the preparation of the text of this paper.<br />
References<br />
�1� Lorensen W.E. and Cline H.E. �Marching Cubes�<br />
A High�Resolution 3D Surface Construction Al�<br />
gorithm�� SIGGRAPH 87 Conference Proceed�<br />
ings�Computer Graphics� Vol. 21� No. 4� pp. 163�<br />
169� July 1987.<br />
�2� Wyvill G.� McPheeters C.� Wyvill B. �Data struc�<br />
tures for soft objects�� The Visu<strong>al</strong> Computer� Vol.<br />
2� No. 4� pp. 227�234� 1986.<br />
�3� J. Wilhelms� A.Van Gelder� �Topologic<strong>al</strong> Con�<br />
siderations in Isosurface Generation Extended<br />
Abstract�� Computer Graphics� Vol. 24� No. 5�<br />
pp. 79�86� 1990.<br />
�4� G.M. Nielson� B. Hamann� �The Asymptotic<br />
Decider� Resolving the Ambiquity in Marching<br />
Cubes�� Proceedings of Visu<strong>al</strong>ization�91� IEEE<br />
Computer Society Press� pp. 83�90� 1991.<br />
�5� E.V. Chernyaev� S.V. Matveyev� �The Main As�<br />
pects of Visu<strong>al</strong>ization of Isosurfaces of Implic�<br />
itly Speci�ed Function�� Internation<strong>al</strong> Confer�<br />
ence GraphiCon�92� Theses� Moscow� P. 15�17�<br />
1992.<br />
�6� Y. Langsam� M. Angenstein� A. Tenenbaum�<br />
�Data Structures for Person<strong>al</strong> Computers��<br />
Prentice�H<strong>al</strong>l� Inc� 1985.<br />
�7� B.K. Choi� H.Y. Shin� Y.I.Yoon and J.W. Lee�<br />
�Triangulation of scattered data in 3D Space��<br />
CAD� Vol. 20� No. 5� pp. 239�248� 1988.
Nonpolygon<strong>al</strong> Isosurface Rendering for Large Volume Datasets<br />
James W. Durkin John F. Hughes<br />
Program of Computer Graphics Computer Science Department<br />
Cornell University Brown University<br />
Ithaca, NY 14853 Providence, RI 02912<br />
Abstract<br />
Surface-based rendering techniques, particularly those<br />
that extract a polygon<strong>al</strong> approximation of an isosurface,<br />
are widely used in volume visu<strong>al</strong>ization. As dataset size<br />
increases though, the computation<strong>al</strong> demands of these<br />
methods can overwhelm typic<strong>al</strong>ly available computing resources.<br />
Recent work on accelerating such techniques has<br />
focused on preprocessing the volume data or postprocessing<br />
the extracted polygonization. Our new <strong>al</strong>gorithm concentrates<br />
instead on streamlining the surface extraction<br />
process itself so as to accelerate the rendering of large volumes.<br />
The technique shortens the convention<strong>al</strong> isosurface<br />
visu<strong>al</strong>ization pipeline by eliminating the intermediate polygonization.<br />
We compute the contribution of the isosurface<br />
within a volume cell to the resulting image directly from a<br />
simplified numeric<strong>al</strong> description of the cell/surface intersection.<br />
Our approach <strong>al</strong>so reduces the work in the remaining<br />
stages of the visu<strong>al</strong>ization process. By quantizing the<br />
volume data, we exploit precomputed and cached data at<br />
key processing steps to improve rendering efficiency. The<br />
resulting implementation provides comparatively fast renderings<br />
with reasonable image qu<strong>al</strong>ity.<br />
1 Introduction<br />
1.1 Background<br />
Increasingly complex environments present an ongoing<br />
ch<strong>al</strong>lenge to computer graphics. A dominant source of increased<br />
complexity in volume visu<strong>al</strong>ization is growth in<br />
data size. Early volume datasets typic<strong>al</strong>ly ranged from 64 3<br />
to 128 3 voxels, while many of today’s volumes are reaching<br />
the 512 3 to 1024 3 voxel range. The introduction of higher<br />
resolution data acquisition devices and more complex simulations<br />
suggests this growth trend will continue.<br />
The essenti<strong>al</strong> difficulty such growth poses is that the computation<strong>al</strong><br />
complexity of most volume rendering <strong>al</strong>gorithms<br />
is O�n 3 � for a dataset of size n� n� n. 1 Thus doubling volume<br />
dimension, say from 256 3 to 512 3 , yields an eightfold<br />
increase in computation<strong>al</strong> cost. Even today’s fastest workstations<br />
are, at best, barely keeping pace with the demands<br />
of rendering large volumes in reasonable amounts of time.<br />
1.2 Prior work<br />
Volume data has, by itself, no visible manifestation. Implicit<br />
in its visu<strong>al</strong>ization is the creation of an intermediate<br />
representation, some visible object or phenomenon, that<br />
can be rendered. Levoy [3] classifies volume rendering <strong>al</strong>gorithms<br />
by the intermediate representation they employ.<br />
1 The notable exception is frequency-domain volume rendering [5, 9],<br />
with a complexity of O�n 2 logn�.<br />
Among the classes are surface-based techniques, those using<br />
polygons or surface patches as the representation. Such<br />
techniques have proved popular due to their ease of use,<br />
range of applicability, and comparatively fast execution.<br />
Surface-based techniques are characterized by the application<br />
of a surface detector to the data, followed by a fitting<br />
of geometric primitives to the detected surface, and the rendering<br />
of the resulting geometric representation. The techniques<br />
differ primarily in their choice of primitives and the<br />
sc<strong>al</strong>e at which they are defined. The primitives are typic<strong>al</strong>ly<br />
fitted to an approximation of an isosurface of the continuous<br />
sc<strong>al</strong>ar field within cells of the volume. 2<br />
The best known of these techniques is the Marching<br />
Cubes <strong>al</strong>gorithm [4]. Processing the volume cell by cell,<br />
the <strong>al</strong>gorithm classifies each cell based on the v<strong>al</strong>ue of its<br />
voxels relative to that of the isosurface being reconstructed.<br />
The classification yields a binary encoding that provides an<br />
index into a table describing the polygon<strong>al</strong> approximation<br />
of the isosurface within the cell. Polygon vertex positions<br />
are computed by interpolating voxel v<strong>al</strong>ues, as specified by<br />
the indexed table entry. The generated polygons are transferred<br />
to a hardware or software polygon renderer for display.<br />
Gouraud shading is often used to achieve a smoother<br />
image. To do this, the <strong>al</strong>gorithm approximates the volume<br />
gradient at voxel positions and interpolates these gradient<br />
vectors to produce norm<strong>al</strong>s at polygon vertices.<br />
Wyvill et <strong>al</strong>. [12] present a very similar technique. They<br />
too classify cell voxels relative to isosurface v<strong>al</strong>ue and c<strong>al</strong>culate<br />
polygon vertex positions by voxel v<strong>al</strong>ue interpolation.<br />
Their technique differs from Marching Cubes in that<br />
it uses an approximate v<strong>al</strong>ue at the center of a cell face to<br />
select among <strong>al</strong>ternate polygon configurations.<br />
An <strong>al</strong>ternative to isosurface polygonization is the pointbased<br />
Dividing Cubes <strong>al</strong>gorithm [1]. It subdivides volume<br />
cells into sub-cells with lattice spacing equ<strong>al</strong> to the image<br />
grid spacing. Data v<strong>al</strong>ues for sub-cell vertices are interpolated<br />
from the divided cell’s vertex voxels. Sub-cells intersecting<br />
the surface are identified as those having v<strong>al</strong>ues both<br />
above and below the isosurface v<strong>al</strong>ue. For these sub-cells,<br />
a norm<strong>al</strong> vector is interpolated from volume gradients as in<br />
Marching Cubes. This norm<strong>al</strong> is used to shade the intersection<br />
point, considered to lie at the sub-cell center, which is<br />
then projected onto the image plane where the computed intensity<br />
is assigned to the appropriate pixel.<br />
Recent work has focused on improving the performance<br />
of such techniques. Wilhelms and Van Gelder [11] use spa-<br />
2 We adopt the terminology of Wilhelms [10], referring to individu<strong>al</strong><br />
volume data points as voxels, and to a region of space bounded by a set of<br />
voxels (typic<strong>al</strong>ly eight for regular volumes) as acell.
ti<strong>al</strong> data structures as a preprocess to reduce the work devoted<br />
to regions within the volume of little or no interest.<br />
Schroeder et <strong>al</strong>. [8] reduce the number of triangles required<br />
for the polygon<strong>al</strong> representation of objects through a postprocess,<br />
making the extracted representation renderable on<br />
typic<strong>al</strong> graphics hardware.<br />
1.3 Motivation<br />
As dataset size grows, the processing demands of convention<strong>al</strong><br />
techniques can severely tax even the fastest workstations.<br />
Consider an example. The industri<strong>al</strong> CT dataset of<br />
the turbine blade in Figure 6 (<strong>al</strong>so illustrated by Schroeder<br />
et <strong>al</strong>. [8]) contains 300 slices, each of size 512�512. The<br />
isosurface created from this data by Marching Cubes contains<br />
approximately 1.7 million triangles. Sever<strong>al</strong> stages in<br />
the <strong>al</strong>gorithm are particularly expensive when processing<br />
such complex surfaces. The number of floating point operations<br />
required to c<strong>al</strong>culate position, norm<strong>al</strong>, and color information<br />
for the 5.1 million triangle vertices is enormous,<br />
even when reusing data at shared vertices. The amount of<br />
data transferred to the display system is <strong>al</strong>so enormous: at<br />
50 bytes per vertex, it is roughly 250 megabytes of information.<br />
Fin<strong>al</strong>ly, rendering 1.7 million polygons is beyond the<br />
capabilities of <strong>al</strong>l but the most advanced workstations.<br />
The necessity of such expensive processing is an open<br />
question. In a typic<strong>al</strong> image, say 512�512 pixels, these 1.7<br />
million polygons are each rendered at sub-pixel size. One<br />
can well suggest that, given the sm<strong>al</strong>l contribution of each<br />
polygon to the fin<strong>al</strong> image, the tremendous work involved<br />
in processing polygons for such a surface is probably excessive.<br />
An <strong>al</strong>ternative to preprocessing the volume data or<br />
post-processing the polygon<strong>al</strong> surface is to concentrate instead<br />
on the surface extraction process itself. Our technique<br />
streamlines the isosurface visu<strong>al</strong>ization pipeline by eliminating<br />
the intermediate polygonization stage and reducing<br />
the work required at the remaining stages.<br />
2 Foundations<br />
Our <strong>al</strong>gorithm is based, in part, on three observations<br />
about the surface-based rendering of large volumes:<br />
Cell projections are sm<strong>al</strong>l<br />
In a ‘complete’ image of a large volume, a cell projects<br />
to about the size of a pixel. If we make the correspondence<br />
exact (i.e., volume inter-voxel spacing equ<strong>al</strong>s image interpixel<br />
spacing), an orthographic projection of an n 3 volume<br />
has a maximum image size of p 3 n � p 3 n pixels. For n<br />
between 512 and 1024, the image occupies from 60–240%<br />
of a typic<strong>al</strong> workstation screen, suggesting that using such<br />
a correspondence produces sufficiently large images.<br />
Isosurfaces are loc<strong>al</strong>ly <strong>al</strong>most planar<br />
The intersection of an isosurface with a cell is <strong>al</strong>most <strong>al</strong>ways<br />
well approximated by a plane. The function whose<br />
isosurface we are reconstructing was sampled in some way<br />
to generate the volume data. Unless the origin<strong>al</strong> function<br />
was band-limited before sampling, the data will contain<br />
<strong>al</strong>iasing. We therefore assume we are reconstructing the<br />
isosurface of the (unique) band-limited function f whose<br />
samples constitute our volume. Such band-limited func-<br />
11<br />
10<br />
11<br />
10<br />
12 12<br />
Origin<strong>al</strong><br />
2<br />
2<br />
6 1<br />
4<br />
10<br />
2<br />
2<br />
Quantized<br />
Figure 1: Geometric change resulting from data quantization.<br />
Left: origin<strong>al</strong> v<strong>al</strong>ues and placement of planar approximation of the<br />
level 6 isosurface. Right: data quantized to a range of 3 centered<br />
on the origin<strong>al</strong> isolevel, and resulting shift in isosurface position.<br />
tions are <strong>al</strong>ways C ∞ . Sard’s Theorem [6] guarantees that<br />
for <strong>al</strong>most every (in the measure-theoretic sense) isosurface<br />
v<strong>al</strong>ue v, the isosurface f �1 �v� contains no zeroes of the gradient<br />
of f . Thus <strong>al</strong>most every isosurface is loc<strong>al</strong>ly smooth<br />
(by the implicit function theorem). Smooth surfaces can be<br />
approximated by their tangent planes, to an accuracy that<br />
depends on the surface curvature. The inaccuracy of our<br />
method is thus quantified by the loc<strong>al</strong> curvature of the isosurface.<br />
Near singular points, this can become arbitrarily<br />
large, but surface-based methods typic<strong>al</strong>ly suffer from this:<br />
cells containing singular points are gener<strong>al</strong>ly ambiguous.<br />
Data can be quantized<br />
To reduce rendering expense, we want to exploit precomputed<br />
and cached data whenever possible (e.g., using a precomputed<br />
approximation of the isosurface within a cell). To<br />
keep such data of reasonable size, we need to index it not<br />
by full-range volume data, but by a quantized representation<br />
of a cell’s voxel v<strong>al</strong>ues. Quantized data can produce<br />
a reasonably accurate isosurface approximation. Figure 1<br />
shows that quantizing the data introduces some error; increasing<br />
the <strong>al</strong>lowable range for the quantized representation<br />
reduces the error, but cannot eliminate it. Although we<br />
have not form<strong>al</strong>ly an<strong>al</strong>yzed the error due to quantization,<br />
our empiric<strong>al</strong> results suggest that the visu<strong>al</strong> artifacts that result<br />
are acceptable. In any event, the quantization error is<br />
in the sub-cell placement of the isosurface, and hence (after<br />
projection) in the sub-pixel placement of the surface image.<br />
If the origin<strong>al</strong> data indicates the presence of surface within a<br />
cell, so too will the quantized data (if processed properly):<br />
isosurface topology is not <strong>al</strong>tered, so no spurious surfaces<br />
or erroneous holes are introduced.<br />
3 Algorithm overview<br />
To render an image, we start with a volume dataset, an<br />
isolevel �, a viewing direction, and lighting information.<br />
As we precompute an approximation of the isosurface<br />
within a cell and index it by voxel v<strong>al</strong>ues, our first step is to<br />
limit the data range within the volume. We choose a range<br />
r and quantize voxel v<strong>al</strong>ues to an interv<strong>al</strong> of length r that<br />
contains �. To illustrate, let us assume that � lies h<strong>al</strong>fway<br />
<strong>al</strong>ong this interv<strong>al</strong> (in practice this is not a requirement).<br />
The quantization may be as simple as clamping v<strong>al</strong>ues to<br />
the range ��r�2 � � � ��r�2, or may involve a more complicated<br />
sc<strong>al</strong>ing of v<strong>al</strong>ues from a larger range, encompassing<br />
both r and �, into the range � � r�2 � � � � � r�2.<br />
2<br />
2<br />
0<br />
2
Next is the computation of the planar isosurface approximation<br />
data, the isoplane table (see Section 4.1). This table<br />
depends only on r and �, and can therefore be precomputed.<br />
For each possible eight-tuple of v<strong>al</strong>ues at the cell vertices,<br />
the table contains a description of the planar approximation<br />
of the isosurface within that cell, including the area of the<br />
plane within the cell and the plane norm<strong>al</strong>.<br />
The second step of the <strong>al</strong>gorithm proper is initi<strong>al</strong>ization<br />
of the image, corresponding to a region on the projection<br />
plane. The inter-pixel spacing on this plane is made equ<strong>al</strong> to<br />
the inter-voxel spacing in the volume. Thus the projection<br />
of a cell overlaps at most nine image pixels. The color and<br />
α channels of the image are initi<strong>al</strong>ized to zero.<br />
The third step in the <strong>al</strong>gorithm uses the isoplane table to<br />
compute a rendering of the isosurface. The volume is traversed<br />
from front to back and each cell is examined. The<br />
quantized voxel v<strong>al</strong>ues at a cell’s vertices are used as an index<br />
into the isoplane table, which contains the area and norm<strong>al</strong><br />
vector for the isosurface approximation within the cell.<br />
If the area is zero (the isosurface does not intersect the<br />
cell), or if the dot product of the norm<strong>al</strong> and the projection<br />
direction is negative (the surface is back-facing), the cell is<br />
ignored. Otherwise, the area is multiplied by this dot product<br />
to find the projected area of the cell’s isosurface on the<br />
image plane. We compute the light reflected from the surface<br />
fragment (if not previously computed) and record it in<br />
a cached data structure c<strong>al</strong>led the intensity table (see Section<br />
4.2), indexed by the cell’s eight voxel v<strong>al</strong>ues.<br />
We accumulate into the image the light reflected from the<br />
surface fragment towards the image plane. Lacking precise<br />
geometric information describing the position of the surface<br />
within the cell, we assume that the projection of the surface<br />
fragment is evenly distributed across that of the entire cell<br />
onto the image plane. We can therefore clip the cell’s projection<br />
against the pixels in the image plane to compute the<br />
fraction of the reflected light that should be composited into<br />
each of the nine pixels the cell projection may overlap. We<br />
avoid repeated clipping by precomputing a table describing<br />
the projection/pixel overlap for a representative set of the<br />
possible projection positions (see Section 4.3).<br />
Using a modification of standard compositing (see Section<br />
4.4) we accumulate v<strong>al</strong>ues in the image until the α<br />
v<strong>al</strong>ue for a pixel is 1.0, after which no more light is composited<br />
into the pixel.<br />
4 Algorithm details<br />
This <strong>al</strong>gorithm exploits precomputed and cached data<br />
wherever possible, an approach that might well be termed<br />
look-up tables everywhere. We discuss the most important<br />
of these tables, and other implementation details, below.<br />
4.1 Isoplane table<br />
The precomputed planar approximation of the isosurface<br />
within volume cells depends on the quantized data range r<br />
and the isosurface level � — more precisely, on the location<br />
of � within an interv<strong>al</strong> of length r. We therefore create<br />
a table whose entries are indexed by eight-tuples of v<strong>al</strong>ues<br />
�v0 � � � � �v7� (vi in the range 0 � � � r�1) and associated with a<br />
level � 0 between 0 and r�1.<br />
Suppose the vertices of the unit cube are labeled by bi-<br />
nary numbers so that, for example, vertex 6 has coordinates<br />
�x�y�z� � �1�1�0� (as 610 � 1102). Table entry �v0�v1� � � ��<br />
corresponds to a cube whose vertex 0 has v<strong>al</strong>ue v0, vertex 1<br />
has v<strong>al</strong>ue v1, and so on. Given the v<strong>al</strong>ues v0� � � � �v7 at these<br />
corners (whose positions we denote p0� � � � � p7), we approximate<br />
the isosurface by a plane determined by these v<strong>al</strong>ues.<br />
We do this by one of three methods, <strong>al</strong>l variants of the<br />
same technique. Certain vertices of the cube are marked,<br />
and those vertices <strong>al</strong>one are used to find a least-squares bestfit<br />
plane. That is to say, we seek the function<br />
such that<br />
f �x�y�z� � Ax � By �Cz � D<br />
∑ � f �pi� � vi�<br />
i2M<br />
2 � where M � fmarked verticesg<br />
is minimized. This is a straightforward least-squares problem<br />
in the unknowns A, B, C, and D.<br />
The three methods differ in the choice of which cell vertices<br />
to mark. The first method marks <strong>al</strong>l vertices, yielding<br />
a least-squares solution using <strong>al</strong>l available data. We c<strong>al</strong>l<br />
this method <strong>al</strong>l-voxels. In the second, we mark only cube<br />
edge endpoints with v<strong>al</strong>ues on opposite sides of the isosurface<br />
level. The method, c<strong>al</strong>led edge-crossings, is an<strong>al</strong>ogous<br />
to Marching Cubes’ identification of polygon vertex locations.<br />
In the third method, if any vertex has a v<strong>al</strong>ue at either<br />
extreme of the quantized data range, and <strong>al</strong>l three neighbor<br />
vertices (those connected to it by an edge) share the same<br />
v<strong>al</strong>ue, then that vertex is unmarked; <strong>al</strong>l others vertices are<br />
marked. This approach reduces the error in the approximation<br />
of the plane equation by eliminating data v<strong>al</strong>ues that<br />
violate the assumption of linearity due to the limited range<br />
of the table. We term this technique sans-clamped. For<br />
any cell intersecting the isosurface, there are at least four<br />
marked voxels for any of the three methods, so the leastsquares<br />
problem <strong>al</strong>ways has a unique solution.<br />
Having found the function f above, we consider the<br />
plane f �x�y�z� � � 0 to be our ‘best linear approximation’<br />
to the isosurface. We clip this plane to the bounds of the<br />
cell, compute the area remaining, and record this in the table<br />
<strong>al</strong>ong with A, B, and C, which constitute the plane norm<strong>al</strong>.<br />
The table as described has r 8 entries. We store the area<br />
and norm<strong>al</strong> data as floating-point numbers. At four bytes<br />
per v<strong>al</strong>ue, we have sixteen bytes per table entry. Using ten<br />
megabytes as a rough limit for such precomputed data, the<br />
maximum <strong>al</strong>lowable r is 5.<br />
Fortunately, we can exploit the symmetry of the cube to<br />
give us a table compression scheme. A cube centered at the<br />
origin has many geometric symmetries: rotations about the<br />
x-, y- and z-axes, reflections in the xy-, yz-, and xz-planes,<br />
and combinations of these. For any eight-tuple of v<strong>al</strong>ues labeling<br />
the cube’s vertices, we consider the labelings derived<br />
from it by applying such symmetries to the cube as equiv<strong>al</strong>ent.<br />
That is, the area of the planar isosurface approximation<br />
for each is the same, and the surface norm<strong>al</strong>s are simple<br />
transformations of one another. We wish to map each<br />
such equiv<strong>al</strong>ence class to a single entry in our compressed<br />
isoplane table. Doing so requires that we produce just one
Data Uncompressed Compressed Compression<br />
range size size factor<br />
2 256 65 3.94<br />
4 65,536 5,995 10.93<br />
6 1,679,916 100,446 16.72<br />
8 16,777,216 793,650 21.14<br />
10 100,000,000 4,076,215 24.53<br />
Table 1: Isoplane table information forr in the range 2–10. Shown<br />
are the number of entries for the uncompressed and compressed<br />
forms, and the compression factor for each r v<strong>al</strong>ue.<br />
entry for the equiv<strong>al</strong>ence class in generating the table, and<br />
that we can identify that entry and appropriately transform<br />
the stored data when accessing the table.<br />
To identify a canonic<strong>al</strong> element for the equiv<strong>al</strong>ence class,<br />
we permute the eight-tuple of cell vertex v<strong>al</strong>ues �v0� � � � �v7�<br />
(using only permutations <strong>al</strong>lowable under rotation and reflection)<br />
so that the v<strong>al</strong>ue at p0 is the sm<strong>al</strong>lest of the eight<br />
and the v<strong>al</strong>ues at p1, p2, and p4 satisfy the relation v1 � v2 �<br />
v4. In generating the table, we limit ourselves to one entry<br />
per equiv<strong>al</strong>ence class by iterating over v<strong>al</strong>ues that obey the<br />
stated restrictions. Using this scheme, the size of the isoplane<br />
table for a range r is<br />
r�1<br />
∑<br />
a�0<br />
r�1<br />
∑<br />
b�a<br />
r�1<br />
∑<br />
c�b<br />
r�1<br />
∑ �r � a�<br />
d�c<br />
4 �<br />
an eighth-degree polynomi<strong>al</strong> in r. In the limit, as r � ∞, the<br />
size approaches 1�48r 8 . Table 1 gives size information for<br />
representative v<strong>al</strong>ues of r.<br />
In accessing the compressed table, the voxel v<strong>al</strong>ues at cell<br />
vertices are permuted according to the above scheme, and<br />
the permuted tuple is used for table look-up. The permutation<br />
is a linear transformation of the cell, so we apply the<br />
inverse adjoint of this transformation in extracting the norm<strong>al</strong><br />
vector. The processing required to access data from the<br />
compressed table is approximately double that for the uncompressed<br />
table. Only with such compression though, is<br />
this precomputation technique feasible for larger v<strong>al</strong>ues of<br />
r. In practice, we observe an actu<strong>al</strong> increase in rendering<br />
time with compressed isoplane tables of only 1–10%. That<br />
this is lower than the raw increase in access time suggests,<br />
makes sense; isoplane table access is not the only step in<br />
rendering, nor do <strong>al</strong>l cells intersect the isosurface (access<br />
time for ‘empty’ cells is the same for both table forms).<br />
The incentive to use as large an r as possible is strong,<br />
as the quantized data range is a major factor in determining<br />
image qu<strong>al</strong>ity. Figure 2 shows the result of using tables<br />
of varying r v<strong>al</strong>ue. As expected, image qu<strong>al</strong>ity improves<br />
with larger tables. 3 We typic<strong>al</strong>ly keep precomputed tables<br />
for ranges of 2, 4, 6, and 8, with � 0 at the range midpoint.<br />
The first two tables are usu<strong>al</strong>ly kept uncompressed, and the<br />
latter two in compressed form.<br />
4.2 Intensity table<br />
In examining each cell, we look up its isosurface approximation<br />
in the isoplane table and apply the user-defined<br />
3 The test sphere, with its large, constant-curvature surface, highlights<br />
the effects of the quantization and linear approximation; lowerr v<strong>al</strong>ues frequently<br />
produce satisfactory images on re<strong>al</strong>-world datasets.<br />
Figure 2: Test volume containing a ‘spheric<strong>al</strong>’ isosurface, rendered<br />
using isoplane tables with different v<strong>al</strong>ues of r. Clockwise<br />
from upper left, v<strong>al</strong>ues for r are 2, 4, 6, and 8.<br />
lighting definition to the data found there, computing the<br />
color of light reflected from the cell’s isosurface fragment.<br />
To avoid repetitive c<strong>al</strong>culations, we cache this information<br />
in the intensity table, indexed by the cell’s voxel v<strong>al</strong>ues.<br />
With an uncompressed isoplane table, we could add the information<br />
to that table at run-time, but for a compressed table,<br />
the need to permute the surface norm<strong>al</strong> makes this impossible.<br />
In principle, this table is of size r 8 . To limit the size in<br />
practice, we <strong>al</strong>locate space for the intensity table in parts.<br />
We first <strong>al</strong>locate a table of pointers of size r 4 , indexed by<br />
the cell’s first four voxel v<strong>al</strong>ues. This part of the table is<br />
quite sm<strong>al</strong>l, requiring only 4,096 pointers for r � 8. We <strong>al</strong>locate<br />
‘data pages’ only when we must compute the light<br />
intensity for a given eight-tuple of v<strong>al</strong>ues on that page. The<br />
data pages are of size r 4 , and are indexed by the cell’s last<br />
four voxel v<strong>al</strong>ues. Individu<strong>al</strong> entries on the data pages are<br />
computed only as needed, and are reused by later cells with<br />
the same eight voxel v<strong>al</strong>ues.<br />
To minimize space requirements, we use only four bytes<br />
per entry, one byte each for the red, green, and blue color<br />
v<strong>al</strong>ues plus a byte for flags used in table management. This<br />
follows the heuristic that eight bit color v<strong>al</strong>ues are adequate<br />
in image compositing, but higher accuracy is required for<br />
the α-channel. We compute the α v<strong>al</strong>ue elsewhere in the<br />
rendering process (using the projected area of the cell’s isosurface)<br />
and do not cache it in the intensity table.<br />
This approach provides what we feel is the best tradeoff<br />
among access time, memory usage, and time spent computing<br />
intensity v<strong>al</strong>ues. In practice, cell voxel v<strong>al</strong>ues are not<br />
evenly distributed (they tend to cluster), so for typic<strong>al</strong> r v<strong>al</strong>ues<br />
(4 and above) we rarely <strong>al</strong>locate <strong>al</strong>l data pages or compute<br />
a large percentage of the entries on <strong>al</strong>located pages.<br />
4.3 Cell projection table<br />
As we restrict ourselves to par<strong>al</strong>lel projections, the projections<br />
of any two cells onto the image plane are congruent.<br />
By precomputing a limited set of cell projections, we can
approximate the projection of any volume cell and avoid the<br />
expense of repeated projection operations. We exploit this<br />
in computing the contribution to the image of a cell’s projected<br />
isosurface fragment.<br />
At the start of rendering, we project the vertices of a single<br />
cell onto the image plane and compute their convex hull,<br />
thus providing the polygon<strong>al</strong> projection of the whole cell.<br />
We c<strong>al</strong>culate the position of the lower left corner of the projected<br />
polygon’s bounding rectangle and designate it as the<br />
projection marker (see Figure 3). The polygon is translated<br />
so that the projection marker lies at the origin of the image<br />
plane: the polygon now lies on a 3�3 pixel grid whose<br />
lower left corner has coordinates �0�0�. We clip the polygon<br />
to each of the nine pixels and record the fraction of its area<br />
lying within each. If we offset the position of the polygon<br />
so that its marker lies at each of a discrete set of sub-pixel<br />
positions in the region �0�1���0�1�, performing the clip and<br />
record operation each time, we then have a reasonable approximation<br />
of the cell’s projected area over the 3�3 grid<br />
for any projection (and hence any cell) position. We use a<br />
20�20 array of sub-pixel positions, which can be computed<br />
quickly and provides reasonable accuracy.<br />
We can compute the position of the projection marker for<br />
each cell intersecting the isosurface, and use the fraction<strong>al</strong><br />
part of that position (modulo the discretization rate) as an<br />
index into the cell projection table. The corresponding table<br />
entry gives the fraction of the light contributed by the<br />
cell to be composited into each of the nine pixels its projection<br />
may overlap. Exploiting the congruency further, we<br />
need perform the complete projection marker c<strong>al</strong>culation<br />
only for the first cell visited; the position of any other projection<br />
marker can be computed via a simple offset from the<br />
first cell’s marker, based on the x, y, and z offset of the cell’s<br />
position relative to that of the initi<strong>al</strong> cell.<br />
Distributing the light contributed by a surface fragment<br />
evenly across the cell’s projection is an approximation.<br />
Some approximation is necessary to avoid the prohibitive<br />
expense of storing in the isoplane table a precise geometric<br />
description of the isosurface intersection. Using an even<br />
distribution is roughly equiv<strong>al</strong>ent to averaging over <strong>al</strong>l positions<br />
within the cell of a fragment with that area and norm<strong>al</strong>.<br />
Clipping the cell’s projection to pixel boundaries is<br />
equiv<strong>al</strong>ent to convolving the projection with a box filter and<br />
point sampling at pixel centers. It would be straightforward<br />
to extend the method to use arbitrary filters, and as the cell<br />
projection table is precomputed the cost would be negligible.<br />
Our experience, however, indicates that box filtering,<br />
in conjunction with the averaging operation just discussed,<br />
yields sufficiently good results.<br />
4.4 Compositing<br />
As described above, for each cell containing a frontfacing<br />
piece of the isosurface we compute the amount of<br />
light reflected toward the image plane, and then distribute<br />
that light to the nine pixels onto which the cell projects.<br />
In essence we are compositing a series of 3�3 pixel subimages<br />
into an accumulating larger image. Porter and<br />
Duff’s image compositing <strong>al</strong>gebra [7] assumes that the contents<br />
of two pixels being composited are randomly dis-<br />
Figure 3: Projection of a cell onto the image plane. The fraction of<br />
the projected area lying within each of the nine pixels is stored in<br />
the cell projection table, which is indexed by the sub-pixel location<br />
of the projection marker.<br />
tributed. In our situation this assumption is <strong>al</strong>most <strong>al</strong>ways<br />
f<strong>al</strong>se, so we extend the <strong>al</strong>gebra by a new operator to compensate.<br />
Consider the case where adjacent cells both project onto<br />
the same image pixel and contain adjoining bits of the isosurface<br />
(see Figure 4). As the first cell’s surface fragment is<br />
composited onto the target pixel, the pixel becomes partly<br />
covered; as the second cell’s surface fragment is composited,<br />
the previously uncovered part of the pixel becomes<br />
completely covered. Let us c<strong>al</strong>l the first cell’s projection<br />
the foreground pixel A and the second cell’s projection the<br />
background pixel B, and assume that the α v<strong>al</strong>ue for each is<br />
0.5. Using the Porter-Duff over operator, where<br />
FA � 1�0 and FB � 1�0 � αA �<br />
the α v<strong>al</strong>ue of the composited pixel (A over B) is<br />
�FA�αA���FB�αB� � �1�0�0�5���0�5�0�5� � 0�75 �<br />
The composited pixel has less coverage than expected and<br />
appears too dark.<br />
In this case, the contents were not at <strong>al</strong>l independently<br />
distributed. To address this situation we replace over with<br />
a new compositing operator, add. For add the v<strong>al</strong>ues of FA<br />
and FB are<br />
FA � 1�0 and FB � min� �1�0 � αA��αB� 1�0 � �<br />
The α v<strong>al</strong>ue of the composited pixel (A add B) is now<br />
�FA�αA���FB�αB� � �1�0�0�5���1�0�0�5� � 1�0 �<br />
This gives the composited pixel the expected (full) coverage<br />
and the correct intensity.<br />
The assumption that the contributions from multiple cells<br />
to a single pixel is not independent fails in some cases.<br />
If non-neighboring cells contribute to the same pixel, the<br />
Porter-Duff independence assumption is v<strong>al</strong>id. We therefore<br />
expect slightly-too-bright edges when multiple silhouette<br />
edges project onto the same pixel. We have not observed<br />
this in practice, nor do we expect to: a pixel generic<strong>al</strong>ly<br />
is the projection of the interior of a surface, and being<br />
on the projection of a silhouette is unusu<strong>al</strong>. Being on
Figure 4: The isosurface projected from adjacent cells is not independently<br />
distributed within the image pixel.<br />
the projection of two silhouettes is very unlikely, and should<br />
happen only at isolated pixels. The error is du<strong>al</strong> to that made<br />
by a Z-buffer renderer, in which a nearby polygon that parti<strong>al</strong>ly<br />
covers a pixel can tot<strong>al</strong>ly obscure a distant polygon<br />
that completely covers the pixel, yielding a too-dim image.<br />
5 Algorithm extensions<br />
The <strong>al</strong>gorithm as described makes every effort to reduce<br />
the work at key steps in the rendering process. The characteristics<br />
of the volume data and its rendered image that<br />
make the acceleration possible <strong>al</strong>so limit the types of data<br />
we can process and the kinds of image we can render. Limitations<br />
include quantizing the volume as a whole prior to<br />
rendering, restricting processing to regular-uniform data 4 ,<br />
and rendering only orthographic views.<br />
These limitations are not, however, fundament<strong>al</strong>: each<br />
can be relaxed or eliminated, at some addition<strong>al</strong> cost. We<br />
have extended the <strong>al</strong>gorithm in various ways. The more important<br />
extensions implemented so far are described below.<br />
We give the user control in enabling these extensions, so<br />
that the visu<strong>al</strong>ization needs can dictate the tradeoff between<br />
flexibility and speed.<br />
5.1 Cell-based quantization<br />
Our extensive use of precomputed and cached data requires<br />
restricting the volume’s data range, so that we can use<br />
the cell voxel v<strong>al</strong>ues as a look-up table index. Norm<strong>al</strong>ly this<br />
involves processing the volume once per isosurface level,<br />
prior to the start of rendering. This quantization requires<br />
visiting each voxel only once, and is comparatively fast.<br />
Quantizing prior to rendering gives the best speed-up, but<br />
limits our accuracy in approximating the isosurface within<br />
a cell. The range of v<strong>al</strong>ues across cells intersecting the<br />
isosurface is not <strong>al</strong>ways the same, and can be much less<br />
than the data range over which we quantize the volume as<br />
a whole. We can therefore achieve a more accurate approximation<br />
if we quantize voxels on a cell-by-cell basis rather<br />
than once per volume. Unfortunately, cell-by-cell quanti-<br />
4 Regular volumes are those with voxels arranged on a regular lattice,<br />
with constant spacing <strong>al</strong>ong each axis. Uniform refers to equ<strong>al</strong> spacing<br />
<strong>al</strong>ong <strong>al</strong>l axes.<br />
Figure 5: Test volume illustrating the potenti<strong>al</strong> difference between<br />
quantization strategies. Left: volume quantized as a whole prior to<br />
rendering. Right: volume processed during rendering using cellbased<br />
quantization.<br />
zation may give a voxel different quantized v<strong>al</strong>ues depending<br />
on the cell being ev<strong>al</strong>uated. To do this as a preprocess<br />
would require storing multiple v<strong>al</strong>ues per voxel, which is<br />
prohibitively expensive for large volumes.<br />
We do, however, <strong>al</strong>low cell-based quantization. When<br />
specified, we skip the quantization preprocess and quantize<br />
during the rendering. For each cell that contains isosurface,<br />
we copy its voxel v<strong>al</strong>ues to loc<strong>al</strong> storage and quantize using<br />
the data range over just that cell. We then use these quantized<br />
v<strong>al</strong>ues as our table look-up index.<br />
For certain data, this processing can produce a marked<br />
improvement in image qu<strong>al</strong>ity, particularly surface smoothness.<br />
The dataset for Figure 5 is a 256 3 volume, with fullrange<br />
eight bit data. The volume contains a ‘spheric<strong>al</strong>’ isosurface,<br />
of radius 120, at a level of 127.5. The data in the<br />
vicinity of the surface ranges from 0 to 255, via a linear<br />
ramp, over a distance of eight voxels. Prequantizing the<br />
volume from the full range of 256 into a range of 8 (corresponding<br />
to the isoplane table range used for rendering)<br />
leaves us roughly one bit of accuracy per voxel v<strong>al</strong>ue, for<br />
cells intersecting the surface. Using cell-based quantization<br />
<strong>al</strong>lows us to achieve <strong>al</strong>most the full three bits <strong>al</strong>lowed by the<br />
isoplane table. The resulting improvement in image qu<strong>al</strong>ity<br />
is clear. While in practice, only a limited number of volumes<br />
actu<strong>al</strong>ly exhibit such characteristics, the feature is <strong>al</strong>ways<br />
available for use as desired.<br />
5.2 Non-uniform volumes<br />
The isoplane table data is computed for cubic<strong>al</strong> cells. If<br />
the voxel spacing in the volume is not uniform, so that the<br />
cells are par<strong>al</strong>lelepipeds, we typic<strong>al</strong>ly resample the volume<br />
to make it uniform. By modifying our <strong>al</strong>gorithm slightly we<br />
can avoid this resampling. The transformation from a cube<br />
to a gener<strong>al</strong> par<strong>al</strong>lelepiped is just a non-uniform sc<strong>al</strong>ing, so<br />
we can still use the precomputed isoplane table data. The<br />
area and norm<strong>al</strong> information extracted from the table must,<br />
however, be transformed prior to its use.<br />
Let us denote the inter-voxel spacing <strong>al</strong>ong the three axes<br />
of the non-uniform volume by Sx, Sy, and Sz. We index<br />
into the isoplane table using the quantized cell v<strong>al</strong>ues, as described<br />
previously. Before using the isosurface fragment’s<br />
area and norm<strong>al</strong> though, we must first compute its ‘sc<strong>al</strong>etransformed’<br />
norm<strong>al</strong> and area, N 0 and A 0 respectively.<br />
We transform the norm<strong>al</strong> vector N by the sc<strong>al</strong>e transfor-
mation, saving the result as the vector U to be used in computing<br />
N 0 and A 0 . U is c<strong>al</strong>culated as<br />
U � � �Nx �Sx�� �Ny �Sy�� �Nz �Sz� � �<br />
To compute N 0 , we norm<strong>al</strong>ize U,<br />
The transformed area A 0 is<br />
A 0 � A<br />
N 0 � U �jjU jj �<br />
�<br />
�N 0<br />
x Sy Sz� 2 � �N 0<br />
y Sx Sz� 2 � �N 0<br />
z Sx Sy� 2� 1�2<br />
� A �Sx Sy Sz� jjU jj �<br />
The factor �Sx Sy Sz� can be computed once for the entire<br />
volume. The net expense of this non-uniform sc<strong>al</strong>ing is<br />
therefore three divides, one vector norm<strong>al</strong>ization, and two<br />
multiplications per cell.<br />
We must <strong>al</strong>so adjust the size of our pixel grid in the cell<br />
projection table, since the projection of a cell in the nonuniform<br />
volume may not <strong>al</strong>ways lie within a 3�3 pixel area<br />
(for a 1�1�2 inter-voxel spacing, the projection may cover<br />
any of the pixels in a 4�4 region).<br />
6 Results<br />
We illustrate the <strong>al</strong>gorithm’s use with datasets from the<br />
medic<strong>al</strong> and industri<strong>al</strong> communities. The data was processed<br />
and rendered on Hewlett-Packard Series 700 workstations,<br />
typic<strong>al</strong>ly with machines having sufficient re<strong>al</strong><br />
memory to contain both the volume data and the precomputed/cached<br />
tables. No graphics hardware acceleration<br />
was used. All images were rendered with a r � 8, edgecrossings,<br />
compressed isoplane table.<br />
Figure 6 shows a CT scan of a turbine blade. The origin<strong>al</strong><br />
dataset comprised 300 slices, each of size 512�512, with a<br />
1�1�2 cell aspect ratio. To obtain cubic<strong>al</strong> cells, we resampled<br />
the volume to size 512�512�600,using trilinear interpolation.<br />
The image shows fine detail and smooth shading.<br />
The holes on the leading edge of the blade, the slots <strong>al</strong>ong its<br />
tail, and the seri<strong>al</strong> number on the base are <strong>al</strong>l clearly visible.<br />
The concave surface of the blade is smoothly shaded. The<br />
slightly rough texture on the surface of the base results from<br />
features in the origin<strong>al</strong> data (either noise or actu<strong>al</strong> surface<br />
information) that are visible when viewing slices in isolation.<br />
The few minor artifacts visible <strong>al</strong>ong some flat surfaces<br />
are caused by the limited range of norm<strong>al</strong>s available<br />
due to data quantization. The image took 10 minutes, 9.6<br />
seconds to render.<br />
Figure 7 shows a human pelvis CT study. The origin<strong>al</strong><br />
data contained 56 slices, each of size 256�256. To obtain<br />
cubic<strong>al</strong> cells we again interpolated intermediate slices, this<br />
time using a cubic B-spline. The resulting 256�256�111<br />
volume was rendered in 18.1 seconds. Notice the smooth<br />
shading <strong>al</strong>ong bone surfaces and the fine detail visible on<br />
the spin<strong>al</strong> column.<br />
Figure 8 is an image of an angiography dataset showing<br />
vasculature in the pelvic region. The dataset was 80 slices,<br />
with 256�256 samples each. We resampled the volume to<br />
384�384�240 for rendering, both to obtain cubic<strong>al</strong> cells<br />
and provide a larger volume for testing. The origin<strong>al</strong> data<br />
Figure 6: Industri<strong>al</strong> CT scan of a turbine blade [volume size: 512�<br />
512�600 — isoplane table range: 8].<br />
is fairly noisy, but the <strong>al</strong>gorithm nonetheless extracts sufficient<br />
fine detail to interpret the key elements of the blood<br />
vessel structure. Although rendered with a r � 8 isoplane<br />
table, for data of this type sm<strong>al</strong>ler ranges (e.g., r � 4) produce<br />
nearly identic<strong>al</strong> results. Rendering time for the image<br />
was 86.5 seconds.<br />
In considering the rendering performance, note that the<br />
<strong>al</strong>gorithm currently make no use of spati<strong>al</strong> data structures,<br />
such as octrees or bounding volumes, to accelerate the rendering.<br />
As such, every cell in the volume is examined in<br />
generating the surface representation. Clearly spati<strong>al</strong> data<br />
structures can reduce the effort expended on regions of the<br />
volume not intersecting the isosurface, yielding a corresponding<br />
improvement in performance. We chose to focus<br />
on reducing the work at cells containing isosurface, knowing<br />
that spati<strong>al</strong> acceleration techniques could be integrated<br />
later. Based on existing work using such approaches (e.g.,<br />
Wilhelms and Van Gelder [11], Laur and Hanrahan [2]) and<br />
our own observations on the sm<strong>al</strong>l percentage of cells that<br />
intersect a typic<strong>al</strong> isosurface, we expect a substanti<strong>al</strong> speedup<br />
from using such a technique, quite likely a factor of ten<br />
or more.<br />
7 Future work<br />
After integrating a spati<strong>al</strong> acceleration mechanism, next<br />
on our list of future work items is an error an<strong>al</strong>ysis of the<br />
<strong>al</strong>gorithm. The approximations made at various stages of<br />
the rendering process to minimize cost introduce some ‘errors’<br />
into the resulting image. The main sources of error are<br />
data quantization, the approximation of the surface within a<br />
cell by a plane, and the projection of that surface approximation<br />
onto the image plane. It is fairly straightforward to<br />
quantify the error at each stage. The more difficult problem<br />
is relating the separate error metrics in a way relevant to actu<strong>al</strong><br />
image qu<strong>al</strong>ity.
Figure 7: CT study of a human pelvis [volume size: 256�256�<br />
111 — isoplane table range: 8].<br />
We could use such error measures to improve accuracy,<br />
even if we cannot develop a single qu<strong>al</strong>ity metric. For instance,<br />
we could store an error v<strong>al</strong>ue based on the closeness<br />
of the planar surface approximation, for each isoplane table<br />
entry. We could use this v<strong>al</strong>ue, <strong>al</strong>one or in combination<br />
with some quantization error measure, to decide whether<br />
the surface approximation for a given cell is sufficiently accurate.<br />
If not, we could subdivide the cell, interpolating interior<br />
v<strong>al</strong>ues as necessary, and recursively apply our surface<br />
approximation method to the resulting sub-cells.<br />
We are <strong>al</strong>so interested in examining higher-order isosurface<br />
approximations that could be stored in a minimum of<br />
space. One motivation for this stems from what we term<br />
ambiguous cells. For a cell intersecting the isosurface, it is<br />
possible for the least-squares solution in Section 4.1 to have<br />
A�B�C�0. Such ambiguous cases have reflectance functions<br />
that are not well approximated by the reflection function<br />
of a plane. An extended <strong>al</strong>gorithm might enhance the<br />
isoplane table in these cases by storing a second-order approximation<br />
of the reflectance function.<br />
Fin<strong>al</strong>ly, we hope to develop a par<strong>al</strong>lel or distributed implementation<br />
of the <strong>al</strong>gorithm. The minim<strong>al</strong> processing in<br />
the main rendering loop, mostly table index generation and<br />
look-up table access, makes the <strong>al</strong>gorithm comparatively<br />
simple to implement in a multiprocessor environment. Its<br />
object-order nature <strong>al</strong>so provides for convenient data partitioning<br />
without replication across processing nodes. The<br />
only communications-intensive step would be compositing<br />
sub-images to produce a complete image of the isosurface.<br />
8 Acknowledgements<br />
This work was supported by the NSF/ARPA Science and<br />
Technology Center for Computer Graphics and Scientific<br />
Visu<strong>al</strong>ization (ASC-8920219). The first author <strong>al</strong>so received<br />
support as an ONR-NDSEG fellow. We gratefully<br />
acknowledge the equipment grants from Hewlett-Packard<br />
Company and Sun Microsystems, on whose workstations<br />
this research was conducted. We <strong>al</strong>so wish to thank those<br />
who provided us with volume data: Terry Yoo of the University<br />
of North Carolina at Chapel Hill, William Schroeder<br />
of Gener<strong>al</strong> Electric Company Corporate Research and De-<br />
Figure 8: Angiography dataset showing pelvic vasculature [volume<br />
size: 384�384�240 — isoplane table range: 8].<br />
velopment, and Dr. E. Kent Yucel of Massachusetts Gener<strong>al</strong><br />
Hospit<strong>al</strong> – Harvard Medic<strong>al</strong> School. Fin<strong>al</strong>ly, speci<strong>al</strong><br />
thanks to Richard Lobb for his encouragement during the<br />
writing and his assistance with volume resampling.<br />
References<br />
[1] H. E. Cline, W. E. Lorensen, S. Ludke, C. R. Crawford, and<br />
B. C. Teeter. Two <strong>al</strong>gorithms for the three-dimension<strong>al</strong> reconstruction<br />
of tomograms. Medic<strong>al</strong> Physics, 15(3):320–<br />
327, May/June 1988.<br />
[2] David Laur and Pat Hanrahan. Hierarchic<strong>al</strong> splatting: A progressive<br />
refinement <strong>al</strong>gorithm for volume rendering. Computer<br />
Graphics (SIGGRAPH ’91 Conference Proceedings),<br />
25(4):285–288, July 1991.<br />
[3] Marc Levoy. A taxonomy of volume visu<strong>al</strong>ization <strong>al</strong>gorithms.<br />
Introduction to Volume Visu<strong>al</strong>ization – SIGGRAPH<br />
’91 Course Notes, July 1991.<br />
[4] William E. Lorensen and Harvey E. Cline. Marching cubes:<br />
A high resolution 3D surface construction <strong>al</strong>gorithm. Computer<br />
Graphics (SIGGRAPH ’87 Conference Proceedings),<br />
21(4):163–169, July 1987.<br />
[5] Tom M<strong>al</strong>zbender. Fourier volume rendering. ACM Transactions<br />
on Graphics, 12(3):233–250, July 1993.<br />
[6] John W. Milnor. Topology from the Differentiable Viewpoint.<br />
The University Press of Virginia, Charlottesville, VA, 1965.<br />
[7] Thomas Porter and Tom Duff. Compositing digit<strong>al</strong> images.<br />
Computer Graphics (SIGGRAPH ’84 Conference Proceedings),<br />
18(3):253–259, July 1984.<br />
[8] William J. Schroeder, Jonathan A. Zarge, and William E.<br />
Lorensen. Decimation of triangle meshes. Computer Graphics<br />
(SIGGRAPH ’92 Conference Proceedings), 26(2):65–70,<br />
July 1992.<br />
[9] Takashi Totsuka and Marc Levoy. Frequency domain volume<br />
rendering. In Proceedings: SIGGRAPH ’93 Conference,<br />
pages 271–278. ACM SIGGRAPH, August 1993.<br />
[10] Jane Wilhelms. Decisions in volume rendering. State of the<br />
Art in Volume Visu<strong>al</strong>ization – SIGGRAPH ’91 Course Notes,<br />
July 1991.<br />
[11] Jane Wilhelms and Allen Van Gelder. Octrees for faster<br />
isosurface generation. ACM Transactions on Graphics,<br />
11(3):201–227, July 1992.<br />
[12] Geoff Wyvill, Craig McPheeters, and Brian Wyvill. Data<br />
structures for soft objects. The Visu<strong>al</strong> Computer, 2(4):227–<br />
234, April 1986.
Mix�Match� A Construction Kit for Visu<strong>al</strong>ization<br />
Abstract<br />
We present an environment in which users can in�<br />
teractively create di�erent visu<strong>al</strong>ization methods. This<br />
modular and extensible environment encapsulates most<br />
of the existing visu<strong>al</strong>ization <strong>al</strong>gorithms. Users can eas�<br />
ily construct new visu<strong>al</strong>ization methods by combining<br />
simple� �ne grain building blocks. These components<br />
operate on a loc<strong>al</strong> subset of the data and gener<strong>al</strong>ly ei�<br />
ther look for target features or produce visu<strong>al</strong> objects.<br />
Intermediate compositions may <strong>al</strong>so be used to build<br />
more complex visu<strong>al</strong>izations. This environment pro�<br />
vides a foundation for building and exploring novel vi�<br />
su<strong>al</strong>ization methods.<br />
Key Words and Phrases� interactive� extensible�<br />
spray rendering� smart particles� visu<strong>al</strong>ization environ�<br />
ment.<br />
1 Introduction<br />
The diverse needs of scientists demand the devel�<br />
opment of gener<strong>al</strong> purpose� �exible and extensible vi�<br />
su<strong>al</strong>ization environments. Flexibility and extensibility<br />
are particularly important since no monolithic pack�<br />
age can be expected to satisfy every need. Users often<br />
need variations on a particular technique and there are<br />
<strong>al</strong>ways new techniques being developed. In this pa�<br />
per� we present an environment for the �exible creation<br />
of visu<strong>al</strong>ization techniques from basic building blocks.<br />
Designing a technique involves identifying the tasks as�<br />
sociated with target feature detection and behavior<strong>al</strong><br />
responses for displaying those features. This process is<br />
simpli�ed by the categorization of these tasks into dif�<br />
ferent classes and the form<strong>al</strong>ization of what constitutes<br />
a v<strong>al</strong>id construction. A complete and v<strong>al</strong>id construc�<br />
tion de�nes a new visu<strong>al</strong>ization method. Each com�<br />
ponent of a construction is usu<strong>al</strong>ly very simple and<br />
operates in a loc<strong>al</strong> subset of the data space. One of<br />
these components speci�es which loc<strong>al</strong> subset of data<br />
to process next. Hence� we can think of these construc�<br />
tions as active processes that can be replicated and sent<br />
to work on di�erent parts of the data. In fact� these<br />
Alex Pang and Naim Alper<br />
Baskin Center for<br />
Computer <strong>Engineering</strong> � Information Sciences<br />
University of C<strong>al</strong>ifornia� Santa Cruz<br />
Santa Cruz� CA 95064 USA<br />
processes embody particle systems that interact with<br />
the data they encounter. Other tradition<strong>al</strong> <strong>al</strong>gorithms<br />
can <strong>al</strong>so be decomposed and reconstructed with similar<br />
components using this environment.<br />
In the next section� we describe how our work dif�<br />
fers from related work. We then describe the Spray<br />
Rendering framework and how Mix�Match enriches it.<br />
This is followed by detailed description of the intern<strong>al</strong>s<br />
of Mix�Match. Fin<strong>al</strong>ly� we show a couple of construc�<br />
tions and their e�ects.<br />
2 Related Work<br />
In the last few years the data �ow paradigm has<br />
become popular in scienti�c visu<strong>al</strong>ization. Visu<strong>al</strong>iza�<br />
tion environments such as AVS �17�� Iris Explorer �15��<br />
Khoros �12�� apE �3�� and IBM Data Explorer �10� o�er<br />
many modules that perform �ltering� mapping and ren�<br />
dering tasks that can be combined to achieve a desired<br />
visu<strong>al</strong>ization go<strong>al</strong>. These systems o�er gener<strong>al</strong>ity� �ex�<br />
ibility� modularity and extensibility. They address the<br />
needs of novice� intermediate and expert users. Novices<br />
merely load and execute previously constructed net�<br />
works. Intermediate users use a network editor to con�<br />
struct such a network from existing modules while ex�<br />
pert users extend the system by adding modules.<br />
All of these systems can be classi�ed as large grain<br />
data �ow systems. Data �ow refers to the production<br />
and consumption of blocks of data as they �ow through<br />
modules in a network. Modules are required to ��re�<br />
as new data arrive. The granularity refers to the size<br />
of the data block that the module processes. In these<br />
systems� it is the same size as the data model �hence<br />
large� rather than being an atomic element of the data<br />
model �18�. Granularity may <strong>al</strong>so refer to the size<br />
and complexity of the modules. Once again� in these<br />
systems they are large in the sense that they implement<br />
complete <strong>al</strong>gorithms �e.g. mapping or �lter modules�.<br />
A drawback with this approach is that memory re�<br />
quirements become prohibitive and cause performance<br />
degradation when the data set and the network are<br />
large. Performance <strong>al</strong>so su�ers when there is a lot of
interaction or when the data is dynamic and contin�<br />
u<strong>al</strong>ly changing. Recently a �ne grain data �ow envi�<br />
ronment has been proposed to overcome some of these<br />
problems �16�. In this approach� the <strong>al</strong>gorithms are re�<br />
designed to work loc<strong>al</strong>ly on incoming chunks of data<br />
where the chunks are a few slices. However� visu<strong>al</strong>�<br />
ization <strong>al</strong>gorithms that require random access to the<br />
data set� such as streamlines for �ow visu<strong>al</strong>ization� are<br />
di�cult to convert.<br />
In spite of such shortcomings� these systems en�<br />
joy a large following mostly because of their �exibil�<br />
ity and extensibility to meet new user demands. The<br />
importance of these qu<strong>al</strong>ities have been recognized in<br />
other work. In ConMan� users constructed networks<br />
for dynamic<strong>al</strong>ly building and modifying graphics ap�<br />
plications �5�. Abram and Whitted used an interactive<br />
network based system for constructing shaders from<br />
building blocks �1�. Kass used an interactive data �ow<br />
programming environment to tackle many computer<br />
graphics problems �7�. Corrie and Mackerras recently<br />
extended the Renderman shading language to provide<br />
a modular and extensible volume rendering system<br />
based on programmable data shaders �2�.<br />
Our approach strives to maintain the extensibility<br />
and enhance the �exibility and interactivity of modu�<br />
lar visu<strong>al</strong>ization environments at the expense of some<br />
e�ciency. Instead of modules grinding on entire data<br />
sets that �ow through them� we send or assign light<br />
weight processes to work on a sm<strong>al</strong>l subset of the data.<br />
Thus the two main di�erentiating points are the gran�<br />
ularity of both the modules and size of working data<br />
set� and the execution style. Although the visu<strong>al</strong>iza�<br />
tion of the whole of the data set would computation<strong>al</strong>ly<br />
be more expensive with this approach� the �ne�grained<br />
nature of our components which work loc<strong>al</strong>ly on parts<br />
of the data <strong>al</strong>low quick� interactive exploration. The<br />
components are conceptu<strong>al</strong>ly simple and can be net�<br />
worked in a very �exible way to create more complex<br />
components. Because of our choice of execution style�<br />
large and dynamic data sets can be handled by loc<strong>al</strong>�<br />
izing these visu<strong>al</strong>ization components only to regions of<br />
interest.<br />
3 Spray Rendering<br />
In this section� we brie�y describe the Spray Ren�<br />
dering �11� framework which we use for the construc�<br />
tion and application of visu<strong>al</strong>ization methods using<br />
Mix�Match. Spray Rendering uses the metaphor of<br />
spray cans �lled with smart paint particles. These par�<br />
ticles are sprayed or delivered into the data set to high�<br />
light features of interest. Features can be displayed in<br />
a variety of ways depending on how the paint particles<br />
have been de�ned. To get di�erent visu<strong>al</strong> e�ects� users<br />
simply choose di�erent spray cans from a �shelf�. The<br />
regions that are displayed depend primarily on the po�<br />
sition and the direction of the spray can. Cans <strong>al</strong>so<br />
have nozzles that can train the particles into a focused<br />
beam or distribute them across a wider swath. The<br />
number of paint particles and the distribution of these<br />
particles can <strong>al</strong>so be varied.<br />
The key ingredient of Spray Rendering are the smart<br />
particles or sparts. These sparts are reminiscent of the<br />
Particle Systems introduced by Reeves �13� but <strong>al</strong>so<br />
possess some of the features of boids in �14� and �8�.<br />
Sparts are born and have a �nite life time. As they<br />
travel through the data space� they interact with the<br />
data� and perhaps among themselves� leaving behind<br />
them visu<strong>al</strong> e�ects for the users. These particle be�<br />
haviors can be roughly classi�ed into two categories�<br />
targets and visu<strong>al</strong> behaviors. Targets are features in<br />
the data set that the sparts are hunting for �e.g. iso�<br />
v<strong>al</strong>ues� gradients� combination of two �elds� etc.� while<br />
behaviors specify how sparts manifest themselves visu�<br />
<strong>al</strong>ly or non�visu<strong>al</strong>ly �e.g. leaving a polygon or an in�<br />
visible marker behind� attaching color attributes� etc.�.<br />
Some of these e�ects can be seen in Figure 1.<br />
Figure 1� Spray Rendering workspace show�<br />
ing e�ects of di�erent types of smart particles<br />
�sparts�. Users control viewing and spraying<br />
through either graphics window. The lower left<br />
graphics window shows the view from the cur�<br />
rent can.<br />
While sparts are conveniently portrayed to live in<br />
3D space and handle 3D data sets� they can <strong>al</strong>so be<br />
designed to operate in lower or higher dimension<strong>al</strong><br />
space. For example� to track data v<strong>al</strong>ues from a
stationary sensor� one can imagine the spart as sitting<br />
on the sensor and producing glyphs �e.g. polylines�<br />
according to changes in sensor readings. Or a spart<br />
can be c<strong>al</strong>led upon to handle time dependent �ow �elds<br />
where the spart is required to travel through time.<br />
Eventu<strong>al</strong>ly� a spart may <strong>al</strong>so map and travel through<br />
any N�parameter space. However� we still need to<br />
investigate this further since mapping parameter v<strong>al</strong>ues<br />
to Euclidean space will gener<strong>al</strong>ly produce scattered<br />
data sets. This <strong>al</strong>so complicates the point location test<br />
for a spart.<br />
In earlier implementations of Spray Rendering �11��<br />
we mentioned the idea of mixing di�erent targets and<br />
behaviors together to form new sparts. However� we<br />
only had prede�ned sparts in the sense that each spart<br />
on the shelf was a complete spart and could not be<br />
<strong>al</strong>tered. It was evident that since these sparts shared<br />
some common characteristics� they could be decom�<br />
posed into simpler components and reorganized <strong>al</strong>most<br />
arbitrarily. The next section discusses the issues and<br />
implementation details of how this is done.<br />
Note that the idea of visu<strong>al</strong>ization processes com�<br />
posed of basic building blocks moving through data<br />
does not require spray cans as a launching pad. Indeed�<br />
we have a mode where the processes are executed at<br />
each grid location.<br />
4 Mix�Match<br />
Here we an<strong>al</strong>yze the structure and components of a<br />
spart and how they can be categorized. We then dis�<br />
cuss the construction rules for building new sparts out<br />
of these components. We <strong>al</strong>so address issues such as<br />
macro facilities� multi�stage spawning� handling multi�<br />
ple data sets simultaneously and e�ciency.<br />
4.1 Building blocks of a spart<br />
As can be seen in Figure 1 each spart type produces<br />
a di�erent visu<strong>al</strong> e�ect. Sparts can be programmed<br />
to generate iso�surfaces� they can be asked to trace<br />
through �ow �elds and leave vector glyphs� ribbons<br />
or stream lines� or generate a quick�and�dirty volume<br />
rendering e�ect by mapping the data v<strong>al</strong>ues to colored<br />
points or spheres. Thus� each spart can be regarded as<br />
a di�erent visu<strong>al</strong>ization method.<br />
The go<strong>al</strong> of this research is to provide users the capa�<br />
bility to interactively create new visu<strong>al</strong>ization methods<br />
�or sparts�. We achieve this by providing a construc�<br />
tion kit� made up of an extensible list of spart building<br />
blocks� and <strong>al</strong>lowing users to �exibly combine di�erent<br />
pieces together.<br />
As noted earlier� prede�ned sparts have two gener<strong>al</strong><br />
types of components� target detection and behavior<strong>al</strong><br />
expression. We can further re�ne this an<strong>al</strong>ysis by not�<br />
ing that sparts are based on particle systems. They<br />
therefore have rules regarding when they are born and<br />
when they die. In addition� since these sparts are to<br />
be sent into the data space� they <strong>al</strong>so have position<br />
update rules that may be di�erent from those found in<br />
behavior<strong>al</strong> animation �collision avoidance� group cen�<br />
tering� etc.�. We have grouped these spart components<br />
into four categories�<br />
1. Targets. These are feature detection compo�<br />
nents. They operate on the data loc<strong>al</strong>ly and check<br />
to see whether a boolean condition is satis�ed.<br />
Components in this category may include loc<strong>al</strong><br />
pre�processing operations such as smoothing or<br />
gradient operators but not glob<strong>al</strong> ones such as<br />
Fourier transforms. Relation<strong>al</strong> operators� such as<br />
And�Or� are <strong>al</strong>so implemented as target functions<br />
and can be used to combine any functions that<br />
output a boolean.<br />
2. Behaviors. These are components that depend<br />
on a boolean condition� usu<strong>al</strong>ly a target being<br />
satis�ed� and may produce abstract visu<strong>al</strong>ization<br />
objects �AVOs� to be rendered.<br />
3. Position update. These are components that up�<br />
date the current position of a spart. For example�<br />
position changes may depend on the initi<strong>al</strong> spray<br />
direction or may be dictated by a �ow �eld.<br />
4. Birth�Death. These components decide whether<br />
the spart should die or spawn new sparts. For<br />
example� a spart may be terminated as soon as a<br />
target is found or wait until it has exited the data<br />
space.<br />
Figure 2� Components browser showing the list<br />
of functions categorized under targets� behav�<br />
iors �visu<strong>al</strong>s�� position update and death func�<br />
tions.<br />
Figure 2 shows a growing list of components under<br />
each category. Each element in the list is a building<br />
block that can be used in the creation of a spart. By
eaking down the spart into components� we <strong>al</strong>low<br />
the components to be used in the rapid prototyping of<br />
other sparts.<br />
Each building block in the construction kit is a<br />
regular C function with variable number and type of<br />
inputs and outputs. The input and output ports can<br />
be connected together interactively. There is strong<br />
type checking at the I�O connectivity but no type<br />
coercion. Apart from the number and types of inputs<br />
and outputs� components may <strong>al</strong>so have parameters<br />
that can be set by the user through widgets �e.g.<br />
threshold v<strong>al</strong>ue� step size� etc�. A spart is therefore a<br />
set of functions grouped together to carry out a speci�c<br />
visu<strong>al</strong>ization method.<br />
4.2 Putting them together<br />
F<strong>al</strong>se<br />
Birth<br />
Target<br />
Function<br />
Death<br />
Function<br />
True<br />
Behavior<br />
Function<br />
Position<br />
Update<br />
Death<br />
Figure 3� Flow chart illustrating the life�time of<br />
a typic<strong>al</strong> spart.<br />
The process of creating the spart corresponding to a<br />
visu<strong>al</strong>ization method can be seen as the mixing of dif�<br />
ferent pigments on a p<strong>al</strong>ette to obtain a desired color.<br />
In this an<strong>al</strong>ogy� the building blocks are the pigments.<br />
We c<strong>al</strong>l this process of mixing di�erent building blocks<br />
to obtain a desired visu<strong>al</strong> e�ect Mix�Match. The rules<br />
for putting the building blocks together are quite sim�<br />
ple. The basic pattern follows the typic<strong>al</strong> operations<br />
over the lifetime of a spart as illustrated in Figure 3.<br />
Note that Figure 3 is merely illustrative. For instance�<br />
there may be sparts that do not have a target function<br />
and whose behavior function executes uncondition<strong>al</strong>ly�<br />
or there may be death functions that depend on mul�<br />
tiple conditions.<br />
True<br />
F<strong>al</strong>se<br />
We provide both a textu<strong>al</strong> and a graphic<strong>al</strong> interface<br />
to the process of composing a spart and users can<br />
switch freely between the two. Spart construction<br />
starts with the selection of components to be included<br />
in the editor from the components browser �Figure 2�.<br />
As building blocks are included in the construction�<br />
users must manipulate the input and output �elds<br />
of each component to establish connections. In the<br />
textu<strong>al</strong> interface� this is done by editing the inputs and<br />
outputs such that a name given to an output �eld of a<br />
component and the input �eld of another component<br />
indicates a connection between them. In the graphic<strong>al</strong><br />
editor �Figure 4�� one merely selects the input and<br />
output names from the menus of the components in<br />
question. We have avoided the use of a programming<br />
language for the de�nition of a spart to make the task<br />
simpler for the scientist.<br />
Figure 4� The graphic<strong>al</strong> spart editor showing<br />
the iso�surface spart composition. The IsoSurf<br />
component is shown expanded to reve<strong>al</strong> the<br />
types and the status of connections. Circles<br />
indicate connections of the �elds while colors<br />
of the triangles represent the types of the �elds.<br />
Before enumerating the rules for constructing a<br />
spart� let us look at how a common visu<strong>al</strong>ization<br />
method can be expressed in the form of a spart as it<br />
would appear in the textu<strong>al</strong> spart editor. The March�<br />
ing Cubes <strong>al</strong>gorithm �9� can be converted to a loc<strong>al</strong>ized<br />
spart construction using three building blocks as illus�<br />
trated below. Instead of looking at every cell in the<br />
volume� individu<strong>al</strong> sparts handle a loc<strong>al</strong> subset of the<br />
data. In this particular example� it would be those<br />
cells that the spart visited as it travels through the<br />
data space.<br />
Iso�surface spart�<br />
IsoThresh � S1 � � Found � � Tag � � IsoV<strong>al</strong> �<br />
IsoSurf � S1 � � Found � � Tag � � IsoV<strong>al</strong> � � Obj �<br />
RegStep � S1 �
The above construction consists of a target function<br />
IsoThresh� a behavior function IsoSurf� and a posi�<br />
tion update function RegStep. The Streams compo�<br />
nent �Figure 4� exists in <strong>al</strong>l networks for binding data<br />
streams to the input ports of the other components.<br />
There is <strong>al</strong>so a default death function that kills the<br />
sparts once they exit the bounding box of the data set.<br />
Input �elds are identi�ed with � � while output �elds<br />
are identi�ed with � �. IsoThresh is a simple function<br />
that examines the cell the spart is in within the input<br />
stream S1. It sets the boolean Found if there exists<br />
a surface at the given iso�v<strong>al</strong>ue. In this case� IsoSurf<br />
will generate one or more polygon visu<strong>al</strong>ization objects<br />
Obj in that cell. The spart then advances a �xed step<br />
size according to the parameter set in RegStep. These<br />
functions are repeated until the spart is terminated af�<br />
ter exiting the bounding box of the data volume.<br />
The power of Mix�Match becomes evident when the<br />
user has the �exibility of modifying sparts to produce<br />
di�erent e�ects. For example� in the construction<br />
above� the death function could be made condition<strong>al</strong><br />
on an iso�surface being found. This slight modi�cation<br />
will produce iso�surfaces that are visible only from the<br />
spray can�s perspective. The position update function<br />
may be modi�ed to follow surface gradients. Likewise�<br />
the behavior function may be substituted with one that<br />
paints the entire cell achieving a cuberille e�ect�6�.<br />
For some sparts it may be undesirable to rely on<br />
position update and death functions that sample the<br />
data. In the example above� cells that are missed will<br />
not produce polygons and may result in discontinuous<br />
surfaces. For this reason� we provide a mode where<br />
the spart visits <strong>al</strong>l the cells and only the target and<br />
behavior functions are executed.<br />
There are a few simple rules for constructing sparts<br />
which are enforced either during construction or during<br />
parsing�<br />
1. Strong typing. The types of the input and output<br />
�elds of a connection must match. Type checking<br />
is done at the time the connection is being es�<br />
tablished in the graphic<strong>al</strong> editor and is postponed<br />
until parsing time in the textu<strong>al</strong> editor.<br />
2. No option<strong>al</strong> inputs. All function input �elds must<br />
either be connected to an output �eld or have a<br />
constant v<strong>al</strong>ue associated with it. Output �elds<br />
can be left �oating.<br />
3. Fan out but no fan in. There can only be a single<br />
connection into an input �eld. The same output<br />
�eld can be connected to multiple input �elds<br />
however.<br />
4. Acyclic graph. A directed graph where the edges<br />
denote the dependency between components has<br />
to be acyclic.<br />
5. Execution order. The components of a spart ex�<br />
ecute according to a speci�c order� target func�<br />
tions �rst� then behavior functions� position up�<br />
date functions and �n<strong>al</strong>ly birth�death functions.<br />
Topologic<strong>al</strong> sorting ensures correct dependency or�<br />
dering within each category. However� a com�<br />
ponent from a category that will execute earlier<br />
should not depend on another component that will<br />
execute later.<br />
The environment <strong>al</strong>so provides a macro facility to<br />
build a component from a collection of other com�<br />
ponents <strong>al</strong>lowing more succinct compositions. The<br />
macros can be nested and more than one macro can<br />
appear in a composition. Note that macros are like<br />
procedures and can be saved and used in compositions.<br />
They are not merely a temporary visu<strong>al</strong> grouping of<br />
components.<br />
4.3 Handling multi�parameter data sets<br />
A spart can handle multi�parameter data sets. Each<br />
parameter of a multiple parameter data set is treated<br />
as a separate data stream. The spart composition<br />
then contains separate components to handle di�erent<br />
data streams individu<strong>al</strong>ly. The stream identi�ers� e.g.<br />
S1� saved with the spart composition are bound by<br />
the user to the actu<strong>al</strong> data streams at the time the<br />
spart is loaded into a can. When two di�erent streams<br />
appear as input in the composition� it may mean that<br />
they are the two parameters of a data set with the<br />
same bounding volume� or two di�erent data sets with<br />
di�erent bounding volumes. The latter implies that<br />
there may be multiple incarnations of the spart� one<br />
in each stream. An incarnation in one stream may be<br />
dead but another may still be <strong>al</strong>ive and the spart will<br />
continue executing its program until <strong>al</strong>l incarnations<br />
are dead. This <strong>al</strong>lows us to look for relationships<br />
between parameters of the same data set or between<br />
parameters in di�erent data sets that have overlapping<br />
bounding volumes.<br />
Relation<strong>al</strong> expressions used in combining di�erent<br />
targets� whether from the same data stream or not�<br />
are <strong>al</strong>so implemented as target functions. For example�<br />
if the target functions TargetA and TargetB have<br />
boolean outputs A and B� they could be combined as<br />
follows�<br />
TargetA ... � A � ...<br />
TargetB ... � B � ...<br />
And � A � � B � � AandB �
4.4 Multi�stage spawning<br />
Sparts are initi<strong>al</strong>ly spawned as they are sprayed from<br />
the cans. Each time the user sprays or holds the spray<br />
button down� sparts are continu<strong>al</strong>ly being spawned and<br />
added to the can�s pool of sparts to be executed. These<br />
sparts are eventu<strong>al</strong>ly executed and terminate when<br />
they have satis�ed the death function.<br />
New sparts may <strong>al</strong>so be spawned during the life span<br />
of a spart. This is achieved by including a spawn<br />
function in the construction. The spawn function takes<br />
the name of the spart to be spawned as an argument.<br />
The new spart does not have to be the same as the<br />
parent spart. The spawn function is handy in certain<br />
situations. For instance� new sparts may be spawned<br />
in the vicinity where iso�surface sparts have located a<br />
surface. This will �ll in the surface more quickly than<br />
relying on the spraying marksmanship of the user.<br />
4.5 Extensibility<br />
One advantage of Mix�Match over other systems is<br />
the relative ease of writing sm<strong>al</strong>l �ne�grained functions<br />
that perform very speci�c tasks �e.g. update position<br />
in certain way or produce certain AVOs�. In compar�<br />
ison� coarse�grained modules are typic<strong>al</strong>ly larger and<br />
<strong>al</strong>so have some degree of code replication since some<br />
modules may be very similar in certain tasks but di�er<br />
on details.<br />
Extending the function<strong>al</strong>ity of the environment in�<br />
volves adding more functions to the browser. New<br />
functions must be registered so that they can be in�<br />
cluded in the browser. A con�guration manager pro�<br />
vides a graphic<strong>al</strong> user interface for this task. The user<br />
de�nes the number and types of the inputs and out�<br />
puts and graphic<strong>al</strong>ly designs the control widgets for<br />
the component. The con�guration manager then gen�<br />
erates appropriate wrapper code. The new component<br />
is integrated into the system by compilation and link�<br />
ing.<br />
4.6 E�ciency and object compaction<br />
There is a tradeo� between �exibility and e�ciency.<br />
If components exist at a low level� there is greater �ex�<br />
ibility in composition but one su�ers higher costs in<br />
execution overhead. Inversely� a high level component<br />
results in loss of �exibility. At the cost of code replica�<br />
tion and program size� one can include both the high<br />
level module and its components. At the extreme� one<br />
could have the spart be a single module. We c<strong>al</strong>l these<br />
prede�ned sparts. If a certain spart is to be used of�<br />
ten it may be worth the e�ort to re�implement it as a<br />
prede�ned spart.<br />
The building blocks are written independently from<br />
each other and hence have to determine at run time<br />
where to �nd the inputs and the parameters they need<br />
and where to send the outputs. This is handled by<br />
the components looking for their inputs and parame�<br />
ters from �xed places in their own structure. During<br />
parsing� memory is <strong>al</strong>located for the addresses of input<br />
and output �elds of each component. These addresses<br />
are �lled according to the connections in the compo�<br />
sition. All that the function does when c<strong>al</strong>led is to<br />
dereference the pointers from the component structure<br />
passed to it. Multiple instances can thus coexist in a<br />
composition.<br />
The main reason for the cost in execution is not so<br />
much the extra function c<strong>al</strong>ls and pointer dereferences<br />
but the fact that those functions that produce AVOs<br />
have to generate them at each c<strong>al</strong>l that satis�es the<br />
target function. For instance� a prede�ned streamline<br />
spart would accumulate vertices that de�ne a single<br />
multi�segmented line object �polyline�. A Mix�Match<br />
streamline spart� on the other hand� would de�ne a<br />
simple line segment consisting of the present and the<br />
previous vertex each time it is c<strong>al</strong>led. This causes inef�<br />
�ciency both in execution �many more c<strong>al</strong>ls to m<strong>al</strong>loc�<br />
and in storage �inner vertices are replicated�. The ren�<br />
dering time <strong>al</strong>so su�ers because of the greater number<br />
of AVOs generated that need to be traversed. To <strong>al</strong>le�<br />
viate the latter problem� objects of similar attributes<br />
are compacted periodic<strong>al</strong>ly into a single object. In<br />
the above example� <strong>al</strong>l the simple line segment objects<br />
would be compacted into a single polyline object.<br />
5 Examples<br />
In this section� we give some examples of spart com�<br />
positions. By changing single lines of these composi�<br />
tions� di�erent visu<strong>al</strong>izations can be achieved. Users<br />
can experiment with the di�erent compositions and<br />
save those that they are likely to use again.<br />
5.1 Flow visu<strong>al</strong>ization<br />
Showing streamlines is a typic<strong>al</strong> �ow visu<strong>al</strong>ization<br />
method for displaying vector �elds �Figure 5�. In this<br />
technique� the path of a massless particle through the<br />
�ow �eld is traced assuming that the vector at the<br />
current location is tangenti<strong>al</strong> to the path. The new<br />
position is c<strong>al</strong>culated by forward integration using the<br />
vector at the current location. Such a spart can be<br />
constructed as follows�<br />
Streamline spart�<br />
StreamLine � S1� � �TRUE � � Vec � � Obj �<br />
VecForwInteg � S1 � � Vec �
Figure 5� A spart that generates streamlines<br />
from a vector �eld. Iso�surfaces from a sc<strong>al</strong>ar<br />
�eld are <strong>al</strong>so shown in the background.<br />
This is a spart without a target function. The �rst<br />
component is a behavior function that uncondition�<br />
<strong>al</strong>ly outputs objects while the position update func�<br />
tion VecForwInteg c<strong>al</strong>culates the new position. The<br />
�rst component <strong>al</strong>so outputs the c<strong>al</strong>culated vector at<br />
the current location so that it can be used by the fol�<br />
lowing component. It is a good idea to pass interme�<br />
diate v<strong>al</strong>ues that may require expensive computation<br />
so that other components can use them without re�<br />
computation.<br />
Another technique for vector �eld visu<strong>al</strong>ization is to<br />
use vector glyphs. Usu<strong>al</strong>ly� the glyphs are placed at<br />
some sub�sampling of the grid but in spray rendering�<br />
we can place them at interv<strong>al</strong>s <strong>al</strong>ong the path of the<br />
spart. By replacing the behavior function in the com�<br />
position above with a behavior function that produces<br />
vector glyphs� we can place glyphs at interv<strong>al</strong>s <strong>al</strong>ong a<br />
streamline. Alternatively� we can include both behav�<br />
ior functions and obtain streamlines and glyphs <strong>al</strong>ong<br />
the streamline.<br />
5.2 Iso�surfaces<br />
We can make some minor variations to the iso�<br />
surface spart described in section 4.2. For example�<br />
we can combine two or more iso�surface seeking sparts<br />
within one construction. The target functions may be<br />
bound to the same input stream �i.e. looking for di�er�<br />
ent iso�v<strong>al</strong>ues� or they may be bound to di�erent input<br />
streams. The target function of the iso�surface spart<br />
can be used in a spart that does not actu<strong>al</strong>ly gener�<br />
ate an iso�surface� but merely uses this component as<br />
a �ltering operation. Another behavior that takes in<br />
a geometry�the iso�surface� as input and colors it ac�<br />
cording to a stream v<strong>al</strong>ue can be used to investigate a<br />
relationship between two parameters of a data set by<br />
showing the variation of one parameter over a surface<br />
on which the other parameter is constant as in �4�. The<br />
following composition illustrates these ideas�<br />
A spart with four streams�<br />
IsoThresh � S1 � � Fnd1 � � Tag1 � � V<strong>al</strong>1 �<br />
IsoSurf � S1 � � Fnd1 � � Tag1 � � V<strong>al</strong>1 � � Obj1 �<br />
AddColSurf � S2 � � Fnd1 � � Obj1 � � Obj2 �<br />
IsoThresh � S3 � � Fnd2 � � Tag2 � � V<strong>al</strong>2 �<br />
VecGlyph � S4 � � Fnd2 � � Vec �<br />
RegStep � S1 �<br />
In this example� an iso�surface is created based<br />
on one stream �S1�geopotenti<strong>al</strong> height� and the v<strong>al</strong>�<br />
ues of another stream �S2�humidity� are mapped onto<br />
the generated surface as color. A third stream<br />
�S3�temperature� is �ltered based on a threshold v<strong>al</strong>ue<br />
�S4�wind �eld� and vector glyphs are placed at those<br />
locations that satisfy this condition.<br />
Figure 6� A spart that shows the relationship<br />
between four input streams of a climate model.<br />
An iso�surface is generated from the geopoten�<br />
ti<strong>al</strong> height �eld and the relative humidity is<br />
mapped onto this surface. The temperature<br />
�eld is thresholded and wind vectors placed at<br />
the locations that would have produced an iso�<br />
surface.<br />
6 Conclusions<br />
Mix�Match is an extension to Spray Rendering
which <strong>al</strong>lows composition of visu<strong>al</strong>ization techniques<br />
from simple� �ne grain building blocks. Unlike the<br />
prede�ned sparts presented in our earlier work� the<br />
Mix�Match sparts are made up of elementary com�<br />
ponents and users are <strong>al</strong>lowed to edit them by adding�<br />
removing or changing di�erent components with the<br />
aid of a textu<strong>al</strong> or graphic<strong>al</strong> spart editor. This capa�<br />
bility encourages the users to experiment with di�erent<br />
ways of visu<strong>al</strong>izing their data. In contrast to data �ow<br />
networks� the execution model used here sends mul�<br />
tiple independent agents to di�erent loc<strong>al</strong>ities of the<br />
data space. Its strengths are its extensibility and the<br />
fact that users can create their own visu<strong>al</strong>ization meth�<br />
ods interactively. On the other hand� its weaknesses<br />
are primarily e�ciency and the duplication of e�ort by<br />
multiple sparts that enter the same data space.<br />
The current work opens up the proverbi<strong>al</strong> Pandora�s<br />
box. There are many issues that need to be resolved<br />
to fully exploit the capabilities of sparts. Among these<br />
are the travers<strong>al</strong> through unstructured grids and scat�<br />
tered data� mapping to par<strong>al</strong>lel architectures� inter�<br />
spart communication and letting sparts query scienti�c<br />
databases. Whether our approach o�ers advantages in<br />
massively par<strong>al</strong>lel environments is something that we<br />
will be investigating in the near term.<br />
Acknowledgements<br />
We would like to thank the other members of the<br />
spray team� Je� Furman� Tom Goodman� Elijah<br />
Saxon� and Craig Wittenbrink. We would <strong>al</strong>so like<br />
to thank Dr. Teddy Holt and Dr. Paul Hirschberg for<br />
kindly providing us the meteorologic<strong>al</strong> data sets used<br />
in the �gures. Support for this work is partly funded<br />
by NSF grant CDA�9115268 and ONR grant N00014�<br />
92�J�1807.<br />
References<br />
�1� Gregory D. Abram and Turner Whitted. Building<br />
block shaders. Computer Graphics �ACM SIGGRAPH<br />
Proceedings�� 24�4��283 � 288� August 1990.<br />
�2� Brian Corrie and Paul Mackerras. Data shaders. In<br />
Proceedings� Visu<strong>al</strong>ization �93� pages 275 � 282. IEEE<br />
Computer Society� 1993.<br />
�3� D. S. Dyer. A data�ow toolkit for visu<strong>al</strong>ization. IEEE<br />
Computer Graphics and Applications� 10�4��60 � 69�<br />
1990.<br />
�4� T. A. Foley and D. A. Lane. Multi�v<strong>al</strong>ued volumetric<br />
visu<strong>al</strong>ization. In Proceedings� Visu<strong>al</strong>ization �91� pages<br />
218 � 225. IEEE Computer Society� 1991.<br />
�5� Paul E. Haeberli. ConMan� A visu<strong>al</strong> programming<br />
language for interactive graphics. Computer Graphics<br />
�ACM Siggraph Proceedings�� 22�4��103 � 111� 1988.<br />
�6� G. T. Herman and H. K. Liu. Three�dimension<strong>al</strong><br />
display of human organs from computer tomograms.<br />
Computer Graphics and Image Processing� 9�1��1 � 21�<br />
1979.<br />
�7� Michael Kass. CONDOR� Constraint�based data�ow.<br />
Computer Graphics �ACM SIGGRAPH Proceedings��<br />
26�2��321�330� July 1992.<br />
�8� G. David Kerlick. Moving iconic objects in scienti�c<br />
visu<strong>al</strong>ization. In Proceedings� Visu<strong>al</strong>ization �90� pages<br />
124 � 130. IEEE Computer Society� 1990.<br />
�9� W. E. Lorensen and H. E. Cline. Marching cubes�<br />
A high resolution 3D surface construction <strong>al</strong>gorithm.<br />
Computer Graphics� 21�4��163 � 169� 1987.<br />
�10� B. Lucas� G. Abram� N. Collins� D. Epstein� D. Gresh�<br />
and K. McAuli�e. An architecture for a scienti�c<br />
visu<strong>al</strong>ization system. In Proceedings� Visu<strong>al</strong>ization�92�<br />
pages 107 � 114. IEEE Computer Society� 1992.<br />
�11� Alex Pang and Kyle Smith. Spray rendering� Visu<strong>al</strong>�<br />
ization using smart particles. In Proceedings� Visu<strong>al</strong>�<br />
ization �93� pages 283 � 290. IEEE Computer Society�<br />
1993.<br />
�12� J. Rasure� D. Argiro� T. Sauer� and C. Williams. Visu<strong>al</strong><br />
language and software development environment for<br />
image processing. Internation<strong>al</strong> Journ<strong>al</strong> of Imaging<br />
Systems and Technology� 2�3��183 � 199� 1990.<br />
�13� W. T. Reeves. Particle systems� A technique for<br />
modeling a class of fuzzy objects. Computer Graphics�<br />
17�3��359 � 376� 1983.<br />
�14� C. W. Reynolds. Flocks� herds and schools� A<br />
distributed behavior<strong>al</strong> model. Computer Graphics�<br />
21�4��25 � 34� 1987.<br />
�15� G. Sloane. IRIS Explorer Module Writer�s Guide.<br />
Silicon Graphics� Inc� Mountain View� 1992. Document<br />
Number 007�1369�010.<br />
�16� Deyang Song and Eric Golin. Fine�grain visu<strong>al</strong>ization<br />
<strong>al</strong>gorithms in data�ow environments. In Proceedings�<br />
Visu<strong>al</strong>ization �93� pages 126 � 133. IEEE Computer<br />
Society� 1993.<br />
�17� C. Upson. The application visu<strong>al</strong>ization system� A<br />
computation<strong>al</strong> environment for scienti�c visu<strong>al</strong>ization.<br />
IEEE Computer Graphics and Applications� 9�4��30 �<br />
42� 1989.<br />
�18� C. Williams� J. Rasure� and C. Hansen. The state of the<br />
art of visu<strong>al</strong> languages for visu<strong>al</strong>ization. In Proceedings�<br />
Visu<strong>al</strong>ization �92� pages 202 � 209. IEEE Computer<br />
Society� 1992.
Figure 1� A spart that produces contours and pseudo�<br />
color mapping of the cut plane of a humidity �eld.<br />
Figure 3� A spart that fuses 4 input streams� geopo�<br />
tenti<strong>al</strong> height� temperature� humidity and wind �eld.<br />
Figure 5� This spart maps wind directions to surface<br />
norm<strong>al</strong>s. Vorticity is used to color the bumpy surface.<br />
Figure 2� A slight variation of the same spart that dis�<br />
places the pseudocolored cut plane and contour lines.<br />
Figure 4� An isosurface spart applied to a temperature<br />
�eld� and a streamline spart applied to a wind �eld.<br />
Figure 6� An isosurface spart probe. The threshold<br />
v<strong>al</strong>ue is determined interactively from the probe tip.
A Lattice Model for Data Display<br />
William L. Hibbard 1&2 , Charles R. Dyer 2 and Brian E. Paul 1<br />
1 Space Science and <strong>Engineering</strong> Center<br />
2 Computer Sciences Department<br />
University of Wisconsin - Madison<br />
Abstract<br />
In order to develop a foundation for visu<strong>al</strong>ization,<br />
we develop lattice models for data objects and displays<br />
that focus on the fact that data objects are<br />
approximations to mathematic<strong>al</strong> objects and re<strong>al</strong><br />
displays are approximations to ide<strong>al</strong> displays. These<br />
lattice models give us a way to quantize the information<br />
content of data and displays and to define conditions on<br />
the visu<strong>al</strong>ization mappings from data to displays.<br />
Mappings satisfy these conditions if and only if they are<br />
lattice isomorphisms. We show how to apply this result<br />
to scientific data and display models, and discuss how it<br />
might be applied to recursively defined data types<br />
appropriate for complex information processing.<br />
1 Introduction<br />
Robertson et.<strong>al</strong>. have described the need for form<strong>al</strong><br />
models that can serve as a foundation for visu<strong>al</strong>ization<br />
techniques and systems [13]. Models can be developed<br />
for data (e.g., the fiber bundle data model [4] describes<br />
the data objects that computation<strong>al</strong> scientists use to<br />
approximate functions between differentiable manifolds),<br />
displays (e.g., Bertin's detailed an<strong>al</strong>ysis of static 2-D<br />
displays [1]), users (i.e., their tasks and capabilities),<br />
computations (i.e., how computations are expressed and<br />
executed), and hardware devices (i.e., their capabilities).<br />
Here we focus on the process of transforming data<br />
into displays. We define a data model as a set U of data<br />
objects, a display model as a set V of displays, and a<br />
visu<strong>al</strong>ization process as a function D: U → V. The usu<strong>al</strong><br />
approach to visu<strong>al</strong>ization is synthetic, constructing the<br />
function D from simpler functions. The function may be<br />
synthesized using rendering pipelines [5, 11, 12],<br />
defining different pipelines appropriate for different types<br />
of data objects within U. Object oriented programming<br />
may be used to synthesize a polymorphic function D [9,<br />
15] that applies to multiple data types within U.<br />
We will try to address the need for a form<strong>al</strong><br />
foundation for visu<strong>al</strong>ization by taking an an<strong>al</strong>ytic<br />
approach to defining D. Since an arbitrary function<br />
D: U → V will not produce displays D(u) that effectively<br />
communicate the information content of data objects<br />
u ∈ U, we seek to define conditions on D to ensure that it<br />
does. For example, we may require that D be injective<br />
(i.e., one-to-one), so that no two data objects have the<br />
same display. However, this is clearly not enough. If we<br />
let U and V both be the set of images of 512 by 512 pixels<br />
with 24 bits of color per pixel, then any permutation of U<br />
can be interpreted as an injective function D from U to V.<br />
But an arbitrary permutation of images will not<br />
effectively communicate information. Thus we need to<br />
define stronger conditions on the function D. Our<br />
investigation depends on some complex mathematics,<br />
<strong>al</strong>though we will only present the conclusions in this<br />
paper. The details are available in [7].<br />
2 Lattices as data and display models<br />
The purpose of data visu<strong>al</strong>ization is to communicate<br />
the information content of data objects in displays. Thus<br />
if we can quantify the information content of data objects<br />
and displays this may give us a way to define conditions<br />
on the visu<strong>al</strong>ization function D. The issue of information<br />
content has <strong>al</strong>ready been addressed in the study of<br />
programming language semantics [14], which seeks to<br />
assign meanings to programs. This issue arises because<br />
there is no <strong>al</strong>gorithmic way to separate non-terminating<br />
programs from terminating programs, so the set of<br />
meanings of programs must include an undefined v<strong>al</strong>ue<br />
for non-terminating programs. This v<strong>al</strong>ue contains less<br />
information (i.e., is less precise) than any of the v<strong>al</strong>ues<br />
that a program might produce if it terminates, and thus<br />
introduces an order relation based on information content<br />
into the set of program meanings. In order to define a<br />
correspondence between the ways that programs are<br />
constructed, and the sets of meanings of programs, Scott
developed an elegant lattice theory for the meanings of<br />
programs [16].<br />
Scientists have data with undefined v<strong>al</strong>ues, <strong>al</strong>though<br />
their sources are numeric<strong>al</strong> problems and failures of<br />
observing instruments rather than non-terminating<br />
computations. An undefined v<strong>al</strong>ue for pixels in satellite<br />
images contains less information than v<strong>al</strong>id pixel<br />
radiances and thus creates an order relation between data<br />
v<strong>al</strong>ues. Data are often accompanied by metadata [18]<br />
that describe their accuracy, for example as error bars,<br />
and these accuracy estimates <strong>al</strong>so create order relations<br />
between data v<strong>al</strong>ues based on information content (i.e.,<br />
precision). Fin<strong>al</strong>ly, array data objects are often<br />
approximations to functions, as for example a satellite<br />
image is a finite approximation (i.e., a finite sampling in<br />
both space and radiance) to a continuous radiance field,<br />
and such arrays may be ordered based on the resolution<br />
with which they sample functions.<br />
In gener<strong>al</strong> scientists use computer data objects as<br />
finite approximations to the objects of their mathematic<strong>al</strong><br />
models, which contain infinite precision numbers and<br />
functions with infinite ranges. Thus metadata for<br />
missing data indicators, numeric<strong>al</strong> accuracy and function<br />
sampling are re<strong>al</strong>ly centr<strong>al</strong> to the meaning of scientific<br />
data and should play an important role in a data model.<br />
We define a data model U as a lattice of data objects,<br />
ordered by how precisely they approximate mathematic<strong>al</strong><br />
objects. To say that U is a lattice [2] means that there is<br />
a parti<strong>al</strong> order on U (i.e., a binary relation such that, for<br />
<strong>al</strong>l u1 , u2 , u3 ∈ U, u1 ≤ u1 , u1 ≤ u2 & u2 ≤ u1 ⇒ u1 = u2 and u1 ≤ u2 & u2 ≤ u3 ⇒ u1 ≤ u3 ) and that any pair<br />
u1 , u2 ∈ U have a least upper bound (denoted by u1 ∨ u2 )<br />
and a greatest lower bound (denoted by u1 ∧ u2 ).<br />
The notion of precision of approximation <strong>al</strong>so<br />
applies to displays. They have finite resolutions in space,<br />
color and time (i.e., animation). 2-D images and 3-D<br />
volume renderings are composed of finite numbers of<br />
pixels and voxels and are finite approximations to<br />
ide<strong>al</strong>ized mathematic<strong>al</strong> displays. Thus we will assume<br />
that our display model V is a lattice and that displays are<br />
ordered according to their information content (i.e.,<br />
precision of approximation to ide<strong>al</strong> displays). In Sections<br />
4 and 5 we will present examples of scientific data and<br />
display lattices.<br />
We assume that U and V are complete lattices, so<br />
that they contain the mathematic<strong>al</strong> objects and ide<strong>al</strong><br />
displays that are limits of sets of data objects and re<strong>al</strong><br />
displays (a lattice is complete if any subset has a least<br />
upper bound and a greatest lower bound). Just as we<br />
study functions of ration<strong>al</strong> numbers in the context of<br />
functions of re<strong>al</strong> numbers (the completion of the ration<strong>al</strong><br />
numbers), we will study visu<strong>al</strong>ization functions between<br />
the complete lattices U and V, recognizing that data<br />
objects and re<strong>al</strong> displays are restricted to countable<br />
subsets of U and V.<br />
3 Conditions on visu<strong>al</strong>ization functions<br />
The lattice structures of U and V provide a way to<br />
quantize information content and thus to define<br />
conditions on functions of the form D: U → V. In order<br />
to define these conditions we draw on the work of<br />
Mackinlay [10]. He studied the problem of automatic<strong>al</strong>ly<br />
generating displays of relation<strong>al</strong> information and defined<br />
expressiveness conditions on the mapping from<br />
relation<strong>al</strong> data to displays. His conditions specify that a<br />
display expresses a set of facts (i.e., an instance of a set<br />
of relations) if the display encodes <strong>al</strong>l the facts in the set,<br />
and encodes only those facts.<br />
In order to interpret the expressiveness conditions<br />
we define a fact about data objects as a logic<strong>al</strong> predicate<br />
applied to U (i.e., a function of the form P: U → {f<strong>al</strong>se,<br />
true}). However, since data objects are approximations<br />
to mathematic<strong>al</strong> objects, we should avoid predicates such<br />
that providing more precise information about a<br />
mathematic<strong>al</strong> object (i.e., going from u1 to u2 where<br />
u1 ≤ u2 ) changes the truth v<strong>al</strong>ue of the predicate (e.g.,<br />
P(u1 ) = true but P(u2 ) = f<strong>al</strong>se). Thus we consider<br />
predicates that take v<strong>al</strong>ues in {undefined, f<strong>al</strong>se, true}<br />
(where undefined < f<strong>al</strong>se and undefined < true), and we<br />
require predicates to preserve information ordering (that<br />
is, if u1 ≤ u2 then P(u1 ) ≤ P(u2 ); functions that preserve<br />
order are c<strong>al</strong>led monotone). We <strong>al</strong>so observe that a<br />
predicate of the form P: U → {undefined, f<strong>al</strong>se, true} can<br />
be expressed in terms of two predicates of the form<br />
P: U → {undefined, true}, so we will limit facts about<br />
data objects to monotone predicates of the form<br />
P: U → {undefined, true}.<br />
The first part of the expressiveness conditions says<br />
that every fact about data objects is encoded by a fact<br />
about their displays. We interpret this as follows:<br />
Condition 1. For every monotone predicate<br />
P: U → {undefined, true}, there is a monotone predicate<br />
Q: V → {undefined, true} such that P(u) = Q(D(u)) for<br />
each u ∈ U.<br />
This requires that D be injective (if u 1 ≠ u 2 then<br />
there are P such that P(u 1 ) ≠ P(u 2 ), but if D(u 1 ) = D(u 2 )<br />
then Q(D(u 1 )) = Q(D(u 2 )) for <strong>al</strong>l Q, so we must have<br />
D(u 1 ) ≠ D(u 2 )).<br />
The second part of the expressiveness conditions<br />
says that every fact about displays encodes a fact about<br />
data objects. We interpret this as follows:
Condition 2. For every monotone predicate<br />
Q: V → {undefined, true}, there is a monotone predicate<br />
P: U → {undefined, true} such that Q(v) = P(D -1 (v)) for<br />
each v ∈ V.<br />
This requires that D -1 be a function from V to U, and<br />
hence that D be bijective (i.e., one-to-one and onto).<br />
However, it is too strong to require that a data model<br />
re<strong>al</strong>ize every possible display. Since U is a complete<br />
lattice it contains a maxim<strong>al</strong> data object X (the least<br />
upper bound of <strong>al</strong>l members of U). Then D(X) is the<br />
display of X and the notation ↓D(X) represents the<br />
complete lattice of <strong>al</strong>l displays less than D(X). We<br />
modify Condition 2 as follows:<br />
Condition 2'. For every monotone predicate<br />
Q: ↓D(X) → {undefined, true}, there is a monotone<br />
predicate P: U → {undefined, true} such that Q(v) =<br />
P(D -1 (v)) for each v ∈ ↓D(X).<br />
These conditions quantify the relation between the<br />
information content of data objects and the information<br />
content of their displays. We use them to define a class<br />
of functions:<br />
Definition. A function D: U → V is a display<br />
function if it satisfies Conditions 1 and 2'.<br />
In [7] we prove the following result about display<br />
functions:<br />
Proposition 1. A function D: U → V is a display<br />
function if and only if it is a lattice isomorphism from U<br />
onto ↓D(X) [i.e., for <strong>al</strong>l u 1 , u 2 ∈ U, D(u 1 ∨ u 2 ) =<br />
D(u 1 ) ∨ D(u 2 ) and D(u 1 ∧ u 2 ) = D(u 1 ) ∧ D(u 2 )].<br />
This result may be applied to any complete lattice<br />
models of data and displays. In the next three sections<br />
denote the least element of a lattice), and <strong>al</strong>so includes<br />
<strong>al</strong>l closed re<strong>al</strong> interv<strong>al</strong>s. We interpret the closed re<strong>al</strong><br />
interv<strong>al</strong> [x, y] as an approximation to an actu<strong>al</strong> v<strong>al</strong>ue that<br />
lies between x and y. In our lattice structure, these<br />
interv<strong>al</strong>s are ordered by the inverse of set containment,<br />
since a sm<strong>al</strong>ler interv<strong>al</strong> provides more precise<br />
information than a containing interv<strong>al</strong>. Figure 1<br />
illustrates the order relation on a continuous sc<strong>al</strong>ar type.<br />
Of course, an actu<strong>al</strong> implementation can only include a<br />
countable number of closed re<strong>al</strong> interv<strong>al</strong>s (such as the set<br />
of ration<strong>al</strong> interv<strong>al</strong>s).<br />
[0.0, 0.0] [0.01, 0.01] [0.5, 0.5]<br />
[0.0, 0.01]<br />
[0.0, 0.1]<br />
[0.0, 1.0]<br />
⊥<br />
[0.945, 0.945]<br />
[0.93, 0.95]<br />
[0.9, 1.0]<br />
[0.94, 0.97]<br />
Figure 1. The order relations among a few v<strong>al</strong>ues of a<br />
continuous sc<strong>al</strong>ar.<br />
We <strong>al</strong>so define discrete sc<strong>al</strong>ars to represent integer<br />
and string variables, such as year, frequency_count and<br />
satellite_name. If s is discrete then I s includes ⊥ and a<br />
countable set of incomparable v<strong>al</strong>ues (no integer is more<br />
precise than any other integer). Figure 2 illustrates the<br />
order relation on a discrete sc<strong>al</strong>ar type.<br />
. . .<br />
-3<br />
-2<br />
-1<br />
0 1 2 3 . . .<br />
⊥<br />
Figure 2. The order relations among a few v<strong>al</strong>ues of a<br />
discrete sc<strong>al</strong>ar.<br />
we will explore its consequences in one setting. Complex data types are constructed from sc<strong>al</strong>ar data<br />
4 A Scientific data model<br />
We will develop a scientific data model that<br />
integrates metadata for missing data indicators,<br />
numeric<strong>al</strong> accuracy and function sampling. We will<br />
develop this data model in terms of a set of data types,<br />
starting with sc<strong>al</strong>ar types used to represent the primitive<br />
variables of mathematic<strong>al</strong> models. Given a sc<strong>al</strong>ar type s,<br />
let I s denote the set of possible v<strong>al</strong>ues of a data object of<br />
the type s. First we define continuous sc<strong>al</strong>ars to<br />
represent re<strong>al</strong> variables, such as time, temperature and<br />
latitude. If s is continuous then I s includes the undefined<br />
v<strong>al</strong>ue, which we denote by the symbol ⊥ (usu<strong>al</strong>ly used to<br />
types as arrays and tuples. An array data type represents<br />
a function between mathematic<strong>al</strong> variables. For<br />
example, a function from time to temperature is<br />
approximated by data objects of the type (array [time] of<br />
temperature;). We say that time is the domain type of<br />
this array, and temperature is its range type. V<strong>al</strong>ues of<br />
an array type are sets of 2-tuples that are (domain, range)<br />
pairs. The set {([1.1, 1.6], [3.1, 3.4]), ([3.6, 4.1], [5.0,<br />
5.2]), ([6.1, 6.4], [6.2, 6.5])} is an array data object that<br />
contains three samples of a function from time to<br />
temperature. The domain v<strong>al</strong>ue of a sample lies in the<br />
first interv<strong>al</strong> of a pair and the range v<strong>al</strong>ue lies in the<br />
second interv<strong>al</strong> of a pair, as illustrated in Figure 3.<br />
Adding more samples, or increasing the precision of
samples, will create a more precise approximation to the<br />
function. Figure 4 illustrates the order relation on an<br />
array data type. The domain of an array must be a sc<strong>al</strong>ar<br />
type, but its range may be any sc<strong>al</strong>ar or complex type (its<br />
definition may not include the array's domain type).<br />
[6.2, 6.5]<br />
[5.0,5.2]<br />
[3.1, 3.4]<br />
[1.1, 1.6] [3.6, 4.1] [6.1, 6.4]<br />
Figure 3. An array samples a re<strong>al</strong> function as a set of<br />
pairs of interv<strong>al</strong>s.<br />
{([1.33, 1.40], [3.21, 3.24]),<br />
([3.72, 3.73], [5.09, 5.12]),<br />
([6.21, 6.23], [6.31, 6.35])}<br />
{([1.1, 1.6], [3.1, 3.4]),<br />
([3.6, 4.1], [5.0, 5.2]),<br />
([6.1, 6.4], [6.2, 6.5])}<br />
{([1.1, 1.6], ⊥ ),<br />
([3.6, 4.1], [5.0, 5.2]),<br />
([6.1, 6.4], ⊥ )}<br />
{([1.1, 1.6], [3.1, 3.4]),<br />
([3.6, 4.1], [5.0, 5.2]),<br />
([6.1, 6.4], [6.2, 6.5]),<br />
([7.3, 7.5], [8.1, 8.4])}<br />
φ (the empty set)<br />
Figure 4. The order relations among a few arrays.<br />
Tuple data types represent tuples of mathematic<strong>al</strong><br />
objects. For example, a 2-tuple of v<strong>al</strong>ues for temperature<br />
and pressure is represented by data objects of the type<br />
struct{temperature; pressure;}. Data objects of this type<br />
are 2-tuples (temp, pres) where temp ∈ I temperature<br />
and pres ∈ I pressure . We say that temperature and<br />
pressure are element types of the tuple. The elements of<br />
a tuple type may be any complex types (they must be<br />
defined from disjoint sets of sc<strong>al</strong>ars). A tuple data object<br />
x is less than or equ<strong>al</strong> to a tuple data object y if every<br />
element of x is less than or equ<strong>al</strong> to the corresponding<br />
element of y, as illustrated in Figure 5.<br />
([0.3, 0.4], [2.3, 2.4])<br />
([0.0, 0.9], [2.3, 2.4]) ([0.3, 0.4], [2.0, 2.9])<br />
(⊥, [2.3, 2.4]) ([0.0, 0.9], [2.0, 2.9]) ([0.3, 0.4], ⊥)<br />
(⊥, [2.0, 2.9])<br />
(⊥, ⊥)<br />
([0.0, 0.9], ⊥)<br />
Figure 5. The order relations among a few tuples.<br />
This data model is applied to a particular application<br />
by defining a finite set S of sc<strong>al</strong>ar types (these would<br />
represent the primitive variables of the application), and<br />
defining T as the set of <strong>al</strong>l types that can be constructed<br />
as arrays and tuples from the sc<strong>al</strong>ar types in S. For each<br />
type t ∈ T we can define a countable set H t of data<br />
objects of type t (these correspond to the data objects that<br />
are re<strong>al</strong>ized by an implementation).<br />
In order to apply our lattice theory to this data<br />
model, we must define a single lattice U and embed each<br />
H t in U. First define X = X{I s | s ∈ S} as the cross<br />
product of the v<strong>al</strong>ue sets of the sc<strong>al</strong>ars in S. Its members<br />
are tuples with one v<strong>al</strong>ue from each sc<strong>al</strong>ar in S, ordered<br />
as illustrated in Figure 5. Now we would like to define U<br />
as the power set of X (i.e., the set of <strong>al</strong>l subsets of X).<br />
However, power sets have been studied for the semantics<br />
of par<strong>al</strong>lel languages and there is a well known problem<br />
with constructing order relations on power sets [14]. We<br />
expect this order relation to be consistent with the order<br />
relation on X and <strong>al</strong>so consistent with set containment.<br />
For example, if a, b ∈ X and a < b, we would expect that<br />
{a} < {b}. Thus we might define an order relation<br />
between subsets of X by:<br />
(1) ∀A, B ⊆ X. (A ≤ B ⇔ ∀a ∈ A. ∃b ∈ B. a ≤ b)<br />
However, given a < b, (1) implies that {b} ≤ {a, b} and<br />
{a, b} ≤ {b} are both true, which contradicts {b} ≠<br />
{a, b}. This problem can be resolved by restricting the<br />
lattice U to sets of tuples such every tuple is maxim<strong>al</strong> in<br />
the set. That is, a set A ⊆ X belongs to the lattice U if
a < b is not true for any pair a, b ∈ A. The members of<br />
U are ordered by (1), as illustrated in Fig. 6, and form a<br />
complete lattice (see [7] for more details).<br />
{(Α, Β, ⊥)}<br />
{(Α, ⊥, ⊥), (⊥, Β, ⊥)}<br />
{(Α, ⊥, ⊥)} {(⊥, Β, ⊥)}<br />
{(⊥, ⊥, ⊥)}<br />
φ<br />
(the empty set)<br />
Figure 6. The order relations among a few members<br />
of a data lattice U defined by three sc<strong>al</strong>ars.<br />
(temp1, pres1) {( ⊥,<br />
temp1, pres1)}<br />
object of a<br />
tuple type<br />
set of one tuple with<br />
time v<strong>al</strong>ue = ⊥<br />
Figure 7. An embedding of a tuple type into a lattice.<br />
{(time1, temp1),<br />
(time2, temp2),<br />
(time3, temp3),<br />
. . .<br />
(timeN, tempN)}<br />
array of temperature<br />
v<strong>al</strong>ues indexed by<br />
time v<strong>al</strong>ues<br />
{(time1, temp1, ⊥ ),<br />
(time2, temp2, ⊥ ),<br />
(time3, temp3, ⊥ ),<br />
. . .<br />
(timeN, tempN, ⊥ )}<br />
set of tuples with<br />
pressure v<strong>al</strong>ues =<br />
Figure 8. An embedding of an array type into a lattice.<br />
To see how the data objects in Ht are embedded in<br />
U, consider a data lattice U defined from the three sc<strong>al</strong>ars<br />
time, temperature and pressure. Objects in the lattice U<br />
are sets of tuple of the form (time, temperature,<br />
pressure). We can define a tuple data type<br />
struct{temperature; pressure;}. A data object of this type<br />
is a tuple of the form (temp, pres) and can be mapped to<br />
a set of tuples (actu<strong>al</strong>ly, it is a set consisting of one tuple)<br />
in U with the form {(⊥, temp, pres)}. This embeds the<br />
tuple data type in the lattice U, as illustrated in Figure 7.<br />
Similarly, we can embed array data types in the data<br />
lattice. For example, consider an array data type (array<br />
⊥<br />
[time] of temperature;). A data object of this type<br />
consists of a set of pairs of (time, temp). This array data<br />
object can be embedded in U as a set of tuples of the form<br />
(time, temp, ⊥). Figure 8 illustrates this embedding.<br />
The basic ideas presented in Figs. 7 and 8 can be<br />
combined to embed complex data types, defined as<br />
hierarchies of tuples and arrays, in data lattices (see [7]<br />
for details).<br />
5 A scientific display model<br />
For our scientific display model, we start with<br />
Bertin's an<strong>al</strong>ysis of static 2-D displays [1]. He modeled<br />
displays as sets of graphic<strong>al</strong> marks, where each mark was<br />
described by an 8-tuple of graphic<strong>al</strong> primitive v<strong>al</strong>ues<br />
(i.e., two screen coordinates, size, v<strong>al</strong>ue, texture, color,<br />
orientation and shape). The idea of a display as a set of<br />
tuple v<strong>al</strong>ues is quite similar to the way we constructed the<br />
data lattice U. Thus we define a finite set DS of display<br />
sc<strong>al</strong>ars to represent graphic<strong>al</strong> primitives, we define Y =<br />
X{I d | d ∈ DS} as the cross product of the v<strong>al</strong>ue sets of<br />
the display sc<strong>al</strong>ars in DS, and we define V as the<br />
complete lattice of <strong>al</strong>l subsets A of Y such that every tuple<br />
is maxim<strong>al</strong> in A.<br />
set of animation steps:<br />
tuple of display<br />
sc<strong>al</strong>ar v<strong>al</strong>ues<br />
for a graphic<strong>al</strong><br />
mark<br />
interv<strong>al</strong> that mark<br />
persists during<br />
animation<br />
(time, x, y, z, red, green, blue)<br />
red green blue<br />
ranges of v<strong>al</strong>ues<br />
of mark's color<br />
components<br />
location and size<br />
of mark in volume<br />
x<br />
Figure 9. The roles of display sc<strong>al</strong>ars in an animated<br />
3-D display model.<br />
We can define a specific lattice V to model animated<br />
3-D displays in terms of a set of seven continuous display<br />
sc<strong>al</strong>ars: (x, y, z, red, green, blue, time}. A tuple of<br />
v<strong>al</strong>ues of these display sc<strong>al</strong>ars represents a graphic<strong>al</strong><br />
mark. The interv<strong>al</strong> v<strong>al</strong>ues of x, y and z represent the<br />
z<br />
y
locations and sizes of graphic<strong>al</strong> marks in the volume, the<br />
interv<strong>al</strong> v<strong>al</strong>ues of red, green and blue represent the<br />
ranges of colors of marks, and the interv<strong>al</strong> v<strong>al</strong>ues of time<br />
represent the place and duration of persistence of marks<br />
in an animation sequence. This is illustrated in Figure 9.<br />
A display in V is a set of tuples, representing a set of<br />
graphic<strong>al</strong> marks.<br />
Display sc<strong>al</strong>ars can be defined for a wide variety of<br />
attributes of graphic<strong>al</strong> marks, and need not be limited to<br />
simple v<strong>al</strong>ues. For example, a discrete display sc<strong>al</strong>ar<br />
may be an index into a set of complex shapes (i.e., icons).<br />
6 Sc<strong>al</strong>ar mapping functions<br />
Proposition 1 said that a function of the form<br />
D: U → V satisfies the expressiveness conditions (i.e., is<br />
a display function) if and only if D is a lattice<br />
isomorphism from U onto ↓D(X), a sublattice of V. We<br />
can now apply this to the scientific data and display<br />
lattices described in Section 4 and 5.<br />
The sc<strong>al</strong>ar and display sc<strong>al</strong>ar types play a speci<strong>al</strong><br />
role in characterizing display functions in the context of<br />
our scientific models. Given a sc<strong>al</strong>ar type s ∈ S, define<br />
U s ⊆ U as the set of embeddings of objects of type s in U.<br />
That is, U s consists of sets of tuples of the form<br />
{(⊥,...,b,...,⊥)} (this notation indicates that <strong>al</strong>l<br />
components of the tuple are ⊥ except the s component,<br />
which is b). Similarly, given a display sc<strong>al</strong>ar type<br />
d ∈ DS, define V d ⊆ V as the set of embeddings of<br />
objects of type d in V. In [7] we prove the following<br />
result:<br />
Proposition 2. If D: U → V is a display function,<br />
then we can define a mapping MAP D : S → POWER(DS)<br />
(this is the power set of DS) such that for <strong>al</strong>l sc<strong>al</strong>ars s ∈ S<br />
and <strong>al</strong>l for a ∈ U s , there is d ∈ MAP D (s) such that<br />
D(a) ∈ V d . The v<strong>al</strong>ues of D on <strong>al</strong>l of U are determined<br />
of designing displays as an assumption, but that it is a<br />
consequence of a more fundament<strong>al</strong> set of expressiveness<br />
conditions. Figure 10 provides examples of mappings<br />
from sc<strong>al</strong>ars to display sc<strong>al</strong>ars (lat_lon is a re<strong>al</strong>2d sc<strong>al</strong>ar,<br />
as described in Section 7).<br />
a<br />
n<br />
i<br />
m<br />
a<br />
t<br />
i<br />
o<br />
n<br />
type image_sequence =<br />
s<br />
t<br />
e<br />
p<br />
s<br />
array [time] of array [lat_lon] of structure {ir; vis;}<br />
x<br />
z<br />
y<br />
red green blue<br />
Figure 10. Mappings from sc<strong>al</strong>ars to display sc<strong>al</strong>ars.<br />
In [7] we present a precise definition (the details are<br />
complex) of sc<strong>al</strong>ar mapping functions and show that<br />
D: U → V is a display function if and only if it is a sc<strong>al</strong>ar<br />
mapping function. Here we will just describe the<br />
behavior of display functions on continuous sc<strong>al</strong>ars. If s<br />
is a continuous sc<strong>al</strong>ar and MAP D (s) = d, then D maps U s<br />
to V d . This can be interpreted by a pair of functions<br />
g s :R × R → R and h s :R × R → R (where R denotes the<br />
re<strong>al</strong> numbers) such that for <strong>al</strong>l {(⊥,...,[x, y],...,⊥)} in U s ,<br />
D({(⊥,...,[x, y],...,⊥)}) = {(⊥,...,[g s (x, y), h s (x, y)],...,⊥)},<br />
which is a member of V d . Define functions g' s :R → R<br />
and h' s :R → R by g' s (z) = g s (z, z) and h' s (z) = h s (z, z).<br />
Then the functions g s and h s can be defined in terms of<br />
g' s and h' s as follows:<br />
by its v<strong>al</strong>ues on the sc<strong>al</strong>ar embeddings U s . Furthermore, (2) g s (x, y) = min{g' s (z) | x ≤ z ≤ y} and<br />
(3) h s (x, y) = max{h' s (z) | x ≤ z ≤ y}.<br />
(a) If s is discrete and d ∈ MAP D (s) then d is<br />
(b)<br />
discrete,<br />
If s is continuous then MAPD (s) contains a<br />
single continuous display sc<strong>al</strong>ar.<br />
(c) If s ≠ s' then MAPD (s) ∩ MAPD (s') = φ.<br />
This tells us that display functions map sc<strong>al</strong>ars,<br />
which represent primitive variables like time and<br />
temperature, to display sc<strong>al</strong>ars, which represent<br />
graphic<strong>al</strong> primitives like screen axes and color<br />
components. Most displays are <strong>al</strong>ready designed in this<br />
way, as, for example, a time series of temperatures may<br />
be displayed by mapping time to one axis and<br />
temperature to another. The remarkable thing is that<br />
Proposition 2 tells us that we don't have to take this way<br />
These functions must satisfy the conditions illustrated in<br />
Figure 11.<br />
Although the complete lattices U and V include<br />
members containing infinite numbers of tuples (these are<br />
mathematic<strong>al</strong> objects and ide<strong>al</strong> displays) in [7] we prove<br />
the following:<br />
Proposition 3. Given a display function D: U → V,<br />
a data type t ∈ T and an embedding of a data object from<br />
H t to a ∈ U, then a contains a finite number of tuples<br />
and D(a) ∈ V contains a finite number of tuples.
h' s and g' s<br />
determine<br />
mapping to<br />
interv<strong>al</strong> in a<br />
continuous<br />
display<br />
sc<strong>al</strong>ar<br />
no lower bound<br />
no upper bound<br />
h' s<br />
interv<strong>al</strong> in a<br />
continuous sc<strong>al</strong>ar<br />
h' s above g' s<br />
g' s<br />
h' s and g' s both continuous<br />
and increasing (could<br />
both be decreasing)<br />
Figure 11. The behavior of a display function D on a<br />
continuous sc<strong>al</strong>ar interpreted in terms of the<br />
behavior of functions h' s and g' s .<br />
7 Implementation<br />
The data and display models described in Sections 4<br />
and 5, and the sc<strong>al</strong>ar mapping functions described in<br />
Section 6, are implemented in our VIS-AD system [6, 8].<br />
This system is intended to help scientists experiment<br />
with their <strong>al</strong>gorithms and steer their computations. It<br />
includes a programming language that <strong>al</strong>lows users to<br />
define sc<strong>al</strong>ar and complex data types and to express<br />
scientific <strong>al</strong>gorithms. The sc<strong>al</strong>ars in this language are<br />
classified as re<strong>al</strong> (i.e., continuous), integer (discrete),<br />
string (discrete), re<strong>al</strong>2d and re<strong>al</strong>3d. The re<strong>al</strong>2d and<br />
re<strong>al</strong>3d sc<strong>al</strong>ars have no an<strong>al</strong>og in the data model<br />
presented in Section 4, but are very useful as the domains<br />
of arrays that have non-Cartesian sampling in two and<br />
three dimensions. Users control how data are displayed<br />
by defining a set of mappings from sc<strong>al</strong>ar types (that they<br />
declare in their programs) to display sc<strong>al</strong>ar types. By<br />
defining a set of mappings a user defines a display<br />
function D: U → V that may be applied to display data<br />
objects of any type.<br />
The VIS-AD display model includes the seven<br />
display sc<strong>al</strong>ars described for animated 3-D displays in<br />
Section 5, and <strong>al</strong>so includes display sc<strong>al</strong>ars named<br />
contour and selector. Multiple copies of each of these<br />
may exist in a display lattice (the numbers of copies are<br />
determined by the user's mappings). Sc<strong>al</strong>ars mapped to<br />
contour are depicted by drawing isolevel curves and<br />
surfaces through the field defined by the contour v<strong>al</strong>ues<br />
in graphic<strong>al</strong> marks. For each selector display sc<strong>al</strong>ar, the<br />
user selects a set of v<strong>al</strong>ues and only those graphic<strong>al</strong><br />
marks whose selector v<strong>al</strong>ues that overlap this set are<br />
displayed. Contour is a re<strong>al</strong> display sc<strong>al</strong>ar and selector<br />
display sc<strong>al</strong>ars take the type of the sc<strong>al</strong>ar mapped to<br />
them. We plan to add re<strong>al</strong> display sc<strong>al</strong>ars for<br />
transparency and reflectivity to the system (to be<br />
interpreted by complex volume rendering of graphic<strong>al</strong><br />
marks), as well as a re<strong>al</strong>3d display sc<strong>al</strong>ar for vector (to<br />
be interpreted by flow rendering techniques).<br />
VIS-AD is available by anonymous ftp from<br />
iris.ssec.wisc.edu (144.92.108.63) in the pub/visad<br />
directory. Get the README file for complete<br />
inst<strong>al</strong>lation instructions.<br />
8 Recursively defined data types<br />
The data model in Section 4 is adequate for scientific<br />
data, but is inadequate for complex information<br />
processing which involves recursively defined data types<br />
[14]. For example, binary trees may be defined by the<br />
type bintree = struct{bintree; bintree; v<strong>al</strong>ue;} (a leaf<br />
node is indicated when both bintree elements of the tuple<br />
are undefined). Sever<strong>al</strong> techniques have been developed<br />
to model such data using lattices. In the current context,<br />
the most promising is c<strong>al</strong>led univers<strong>al</strong> domains [3, 17].<br />
Just as we embedded data objects of many different types<br />
in the domain U in Section 4, data objects of many<br />
different recursively defined data types are embedded in a<br />
univers<strong>al</strong> domain (which we <strong>al</strong>so denote by U).<br />
However, these embeddings have been defined in order to<br />
study programming language semantics, and have a<br />
serious problem in the visu<strong>al</strong>ization context. Data<br />
objects of many different types are mapped to the same<br />
member of U. For example, an integer and a function<br />
from the integers to the integers may be mapped to the<br />
same member of U, and thus any display function of the<br />
form D: U → V will generate the same display for these<br />
two data objects. Thus, in order to extend our lattice<br />
theory of visu<strong>al</strong>ization to recursively defined data types,<br />
other embeddings into univers<strong>al</strong> domains must be<br />
developed.<br />
A suitable display lattice V must <strong>al</strong>so be developed<br />
such that there exist lattice isomorphisms from a<br />
univers<strong>al</strong> domain U into V. Displays involving diagrams<br />
and hypertext links are an<strong>al</strong>ogous to the pointers usu<strong>al</strong>ly<br />
used to implement recursively defined data types. Thus<br />
the interpretation of V as a set of actu<strong>al</strong> displays may<br />
involve these graphic<strong>al</strong> techniques. However, since a<br />
large class of recursively defined data types can be<br />
embedded in U, and since V is isomorphic to U, these<br />
graphic<strong>al</strong> techniques must be applied in a very abstract<br />
manner to define a suitable lattice V.<br />
9 Conclusions<br />
It is easy to think of metadata as secondary when we<br />
are focused on the task of making visu<strong>al</strong>izations of data.<br />
However, it is centr<strong>al</strong> to the meaning of scientific data<br />
that they are approximations to mathematic<strong>al</strong> objects,<br />
and lattices provide a way to integrate metadata about<br />
precision of approximation into a data model. By
inging the approximate nature of data and displays into<br />
centr<strong>al</strong> focus, lattices provide a foundation for<br />
understanding the visu<strong>al</strong>ization process and an an<strong>al</strong>ytic<br />
approach to defining the mapping from data to displays.<br />
While Proposition 2 just confirms standard practice in<br />
designing displays, it is remarkable that this practice can<br />
be deduced from the expressiveness conditions.<br />
Although we have not derived any new rendering<br />
techniques by using lattices, the high level of abstraction<br />
of sc<strong>al</strong>ar mapping functions do provide a very flexible<br />
user interface for controlling how data are displayed.<br />
There will be considerable technic<strong>al</strong> difficulties in<br />
extending this work to recursively defined data types, but<br />
we are confident that the results will be interesting.<br />
Acknowledgments<br />
This work was support by NASA grant NAG8-828,<br />
and by the Nation<strong>al</strong> Science Foundation and the Defense<br />
Advanced Research Projects Agency under Cooperative<br />
Agreement NCR-8919038 with the Corporation for<br />
Nation<strong>al</strong> Research Initiatives.<br />
References<br />
[1] Bertin, J., 1983; Semiology of Graphics. W. J. Berg, Tr.<br />
University of Wisconsin Press.<br />
[2] Davey, B. A. and H. A. Priestly, 1990; Introduction to<br />
Lattices and Order. Cambridge University Press.<br />
[3] Gunter, C. A. and Scott, D. S., 1990; Semantic domains. In<br />
the Handbook of Theoretic<strong>al</strong> Computer Science, Vol. B., J.<br />
van Leeuwen ed., The MIT Press/Elsevier, 633-674.<br />
[4] Haber, R. B., B. Lucas and N. Collins, 1991; A data model<br />
for scientific visu<strong>al</strong>ization with provisions for regular and<br />
irregular grids. Proc. Visu<strong>al</strong>ization 91. IEEE. 298-305.<br />
[5] Haberli, P., 1988; ConMan: A visu<strong>al</strong> programming language<br />
for interactive graphics; Computer Graphics 22(4),<br />
103-111.<br />
[6] Hibbard, W., C. Dyer and B. Paul, 1992; Display of<br />
scientific data structures for <strong>al</strong>gorithm visu<strong>al</strong>ization.<br />
Visu<strong>al</strong>ization '92, Boston, IEEE, 139-146.<br />
[7] Hibbard, W. L., and C. R. Dyer, 1994; A lattice theory of<br />
data display. Tech. Rep. # 1226, Computer Sciences<br />
Department, University of Wisconsin-Madison. Also<br />
available as compressed postscript files by anonymous ftp<br />
from iris.ssec.wisc.edu (144.92.108.63) in the pub/lattice<br />
directory.<br />
[8] Hibbard, W. L., B. E. Paul, D. A. Santek, C. R. Dyer, A. L.<br />
Battaiola, and M-F. Voidrot-Martinez, 1994; Interactive<br />
visu<strong>al</strong>ization of Earth and space science computations.<br />
IEEE Computer speci<strong>al</strong> July issue on visu<strong>al</strong>ization.<br />
[9] Hultquist, J. P. M., and E. L. Raible, 1992; SuperGlue: A<br />
programming environment for scientific visu<strong>al</strong>ization. Proc.<br />
Visu<strong>al</strong>ization '92, 243-250.<br />
[10] Mackinlay, J., 1986; Automating the design of graphic<strong>al</strong><br />
presentations of relation<strong>al</strong> information; ACM Transactions<br />
on Graphics, 5(2), 110-141.<br />
[11] Nadas, T. and A. Fournier, 1987; GRAPE: An<br />
environment to build display processes, Computer Graphics<br />
21(4), 103-111.<br />
[12] Potmesil, M. and E. Hoffert, 1987; FRAMES: Software<br />
tools for modeling, animation and rendering of 3D scenes,<br />
Computer Graphics 21(4), 75-84.<br />
[13] Robertson, P. K., R. A. Earnshaw, D. Th<strong>al</strong>man, M. Grave,<br />
J. G<strong>al</strong>lup and E. M. De Jong, 1994; Research issues in the<br />
foundations of visu<strong>al</strong>ization. Computer Graphics and<br />
Applications 14(2), 73-76.<br />
[14] Schmidt, D. A., 1986; Denotation<strong>al</strong> Semantics.<br />
Wm.C.Brown.<br />
[15] Schroeder, W. J., W. E. Lorenson, G. D. Montanaro and C.<br />
R. Volpe, 1992; VISAGE: An object-oriented scientific<br />
visu<strong>al</strong>ization system, Proc. Visu<strong>al</strong>ization '92, 219-226.<br />
[16] Scott, D. S., 1971; The lattice of flow diagrams. In<br />
Symposium on Semantics of Algorithmic Languages, E.<br />
Engler. ed. Springer-Verlag, 311-366.<br />
[17] Scott, D. S., 1976; Data types as lattices. Siam J. Comput,<br />
5(3), 522-587.<br />
[18] Treinish, L. A., 1991; SIGGRAPH '90 workshop report:<br />
data structure and access software for scientific<br />
visu<strong>al</strong>ization. Computer Graphics 25(2), 104-118.
An Object Oriented Design for the Visu<strong>al</strong>ization of<br />
Multi-Variable Data Objects<br />
Abstract<br />
This paper presents an object-oriented system design<br />
supporting the composition of scientific data visu<strong>al</strong>ization<br />
techniques based on the definition of hierarchies of typed<br />
data objects and tools. Tradition<strong>al</strong> visu<strong>al</strong>ization systems<br />
focus on creating graphic<strong>al</strong> objects which often cannot be<br />
re-used for further processing. Our approach provides<br />
objects of different topologic<strong>al</strong> dimension to offer a<br />
natur<strong>al</strong> way of describing the results of visu<strong>al</strong>ization<br />
mappings. Seri<strong>al</strong> composition of data extraction tools is<br />
<strong>al</strong>lowed, while each intermediate visu<strong>al</strong>ization object<br />
shares a common description and behavior. Visu<strong>al</strong>ization<br />
objects can be re-used, facilitating the data exploration<br />
process by expanding the available an<strong>al</strong>ysis and correlation<br />
functions provided. This design offers an open-ended<br />
architecture for the development of new visu<strong>al</strong>ization<br />
techniques. It promotes data and software re-use,<br />
eliminates the need for writing speci<strong>al</strong> purpose software<br />
and reduces processing requirements during interactive<br />
visu<strong>al</strong>ization sessions.<br />
1. Introduction<br />
1.1. Visu<strong>al</strong>ization Objects and Processing<br />
Modules<br />
We examined sever<strong>al</strong> well-known visu<strong>al</strong>ization<br />
systems (AVS, Explorer, FAST, Khoros, ...) and the<br />
techniques they use to interconnect independent data<br />
processing modules. A typing system is usu<strong>al</strong>ly provided<br />
to define process interfaces, and connections are only<br />
<strong>al</strong>lowed between I/O ports accepting the same type of data.<br />
For this paper, the word type is used in the<br />
programming language sense for input and output abstract<br />
data structures. Graphic<strong>al</strong> output is usu<strong>al</strong>ly the endproduct<br />
of a visu<strong>al</strong>ization session. Thus, data of various<br />
types are passed between modules - each module possibly<br />
creating data of a new type - until displayable geometry is<br />
output for a fin<strong>al</strong> rendering. Data-flow architectures <strong>al</strong>ready<br />
support some form of data sharing. However, the data<br />
produced for the graphic<strong>al</strong> display stage of a visu<strong>al</strong>ization<br />
Jean M. Favre and James Hahn<br />
EE&CS Department<br />
The George Washington University<br />
Washington, DC 20052<br />
are collections of graphics primitives, using a systemdefined<br />
geometry type. Rendering/display modules become<br />
in effect a bottleneck, taking geometric data in, without<br />
<strong>al</strong>lowing their re-use by non-graphic<strong>al</strong> processing tools.<br />
Common visu<strong>al</strong>ization tools have too often focused on<br />
directly producing geometric data (for example, sets of<br />
polygons or line segments) ready for the fast hardware<br />
rendering workstations of the 1990's. Thus, individu<strong>al</strong><br />
polygons or lines are generated with norm<strong>al</strong> information<br />
and a color index or an RGB v<strong>al</strong>ue associated with each<br />
vertex. Rendering such objects can often be done in re<strong>al</strong><br />
time but unfortunately, rendering is the only operation<br />
that can be applied to such objects.<br />
1.2. Previous work<br />
Foley and Lane [2] have presented multi-v<strong>al</strong>ued<br />
visu<strong>al</strong>ization techniques. They assume the definition of a<br />
geometric object D (which can be formed of sever<strong>al</strong><br />
disjoint surfaces). D is a user-defined surface or an isosurface<br />
and is used as a v<strong>al</strong>ue probe to examine volume<br />
data at the surface of the object. Color Blended Contours,<br />
Projected Surface Graphs, Contour Curves on a Projected<br />
Surface Graph, Iso-Surface and Hyper-Surface Projection<br />
Graphs are the tools they use to compose volumetric<br />
rendering techniques. However, their work is restricted to<br />
the use of surfaces for geometric support, and their<br />
an<strong>al</strong>ysis of data is limited to rendering operations.<br />
The definition and use of object-oriented abstract data<br />
types for scientific visu<strong>al</strong>ization has been documented by<br />
sever<strong>al</strong> authors [3,6,8,11]. However, they do not de<strong>al</strong><br />
with composition techniques and a system design to<br />
support these techniques. The data types provided do not<br />
foster the re-use of data objects for composition purposes.<br />
In a Visu<strong>al</strong>ization '91 Workshop Report [1], the notion of<br />
"Functions of Sever<strong>al</strong> Variables" (FOSV) is discussed as<br />
the most important abstract data type relevant to scientific<br />
computations. The workshop participants propose to use<br />
this data class as the starting point for a reference model,<br />
and consider Visu<strong>al</strong>ization mappings as operations<br />
between FOSV instances. Lucas et <strong>al</strong>. [8] use this<br />
paradigm and present a high-level overview of Data<br />
Explorer. Our system design differs from their approach
y putting more emphasis on data integrity and<br />
requirements for Function<strong>al</strong> Composition.<br />
1.3. Motivation and Design Go<strong>al</strong>s<br />
To promote seri<strong>al</strong> composition of visu<strong>al</strong>ization<br />
techniques, we must augment the inter-connectivity of<br />
modules with carefully designed typed output and <strong>al</strong>low<br />
sever<strong>al</strong> visu<strong>al</strong>ization primitives to form a composite<br />
visu<strong>al</strong>ization object. We give visu<strong>al</strong>ization objects a<br />
broader function<strong>al</strong>ity than pure graphics primitives. An<br />
object-oriented design is used to encapsulate both<br />
geometry and field data so that objects can be freely<br />
exchanged between data operators. Each data class is<br />
endowed with data extraction and rendering operators. Our<br />
emphasis is on combining visu<strong>al</strong>ization techniques to<br />
create composite visu<strong>al</strong>ization designs and providing an<br />
abstraction which favors data and code re-use. It is<br />
particularly useful for multi-variate field data, where more<br />
than one sc<strong>al</strong>ar field is considered at each grid point, and<br />
where we can <strong>al</strong>ternate between different data field views,<br />
independently of the underlying geometry.<br />
In Section 2, we briefly introduce the object-oriented<br />
paradigm. Section 3 shows how most sets of scientific<br />
data can be described by the generic unstructured data grids<br />
in 3-D space and gives details about the gener<strong>al</strong> purpose<br />
sets of line-, surface- and volume-elements of points and<br />
the functions associated with them. Section 4 shows how<br />
data visu<strong>al</strong>ization tools are re-defined and combined to<br />
achieve Data Selection and Function<strong>al</strong> Composition.<br />
Section 5 describes sever<strong>al</strong> examples. We offer some<br />
discussion in section 6 and conclude in section 7.<br />
2. The Object-Oriented Paradigm<br />
In most convention<strong>al</strong> programming languages, every<br />
name (identifier) has a type associated with it. This type<br />
determines what operations can be applied to the name.<br />
For example, integer and floating point types come with<br />
the pre-defined +, -, *, / operators. The programming<br />
paradigm provided by object-oriented languages favors a<br />
similar process of defining types and associated operators.<br />
Abstraction is defined as the process of extracting<br />
essenti<strong>al</strong> properties of a concept. Data structures <strong>al</strong>low the<br />
abstraction of the structur<strong>al</strong> aspects of the data<br />
organization. Procedures and functions <strong>al</strong>low the<br />
abstraction of behavior<strong>al</strong> aspects. The C++ programmer<br />
can combine these two user-defined abstractions to create<br />
data classes, defining new types for which access to data is<br />
restricted to a specific set of access functions. The data<br />
structure thus embedded in a class definition can be<br />
initi<strong>al</strong>ized, accessed and operated upon by ways of these<br />
access functions. These functions are shared by <strong>al</strong>l<br />
instances of the class and common behavior among them<br />
is thus insured.<br />
Sub-classes can be derived from a parent class by<br />
sharing data structures and operations. Inheritance is the<br />
technique which <strong>al</strong>lows sub-classes of a parent class to reuse<br />
(inherit) the parent's functions. Using the objectoriented<br />
paradigm, our aim is to define high-level classes<br />
for each set of data common to the visu<strong>al</strong>ization field.<br />
Associated with these definitions are display and<br />
processing tools needed to operate on such sets of data.<br />
3. Data Classes based on the Spati<strong>al</strong><br />
Domain<br />
Gridded data are a common occurrence in scientific<br />
computations. Data may come in regular, rectilinear,<br />
curvilinear or arbitrary grids. As Butler et <strong>al</strong>. have<br />
remarked [1], visu<strong>al</strong>ization mappings gener<strong>al</strong>ly use and<br />
produce sets of points in space, with associated data<br />
v<strong>al</strong>ues. Furthermore, common data extraction tools are<br />
gener<strong>al</strong>ly mappings from n-D space to (n-k)-D space and<br />
most sets of data can be described by generic data<br />
structures in such spaces.<br />
To manipulate sets of points, sever<strong>al</strong> user-defined<br />
types are used. We use a Point class for points in R 3 ,<br />
with associated data v<strong>al</strong>ues. The elementary linear segment<br />
joining two Points is defined by the class LineCell.<br />
Likewise, the class SurfaceCell is represented by subclasses<br />
of the basic surface elements (triangle, quad, etc.),<br />
and the class VolumeCell, with sub-classes of<br />
elementary volume elements (tetrahedron, prism,<br />
hexahedron, etc.). The C++ classes PointSet,<br />
LineSet, SurfaceSet and VolumeSet are then used to<br />
organize sets of elementary objects of the respective types.<br />
A class hierarchy exists to combine cells of identic<strong>al</strong><br />
topologic<strong>al</strong> dimension, and the sets only manipulate<br />
pointers to the 1-D, 2-D or 3-D classes of cells. This<br />
<strong>al</strong>lows the combinations of cells of different sub-classes<br />
often found in Finite Element An<strong>al</strong>ysis (grids of mixed<br />
elements) and the data processing is then achieved with a<br />
look-up of the appropriate functions of each sub-class.<br />
3.1. Data Fields<br />
A gener<strong>al</strong> dataset will consist of points and associated<br />
data v<strong>al</strong>ues in the form of sc<strong>al</strong>ar, vector or tensor fields. A<br />
Field class provides a conceptu<strong>al</strong> definition which<br />
encompasses the PointSet, LineSet, SurfaceSet and<br />
VolumeSet sub-classes. An instance of class Field is a<br />
set of data with a given number of points, elementary<br />
cells, and field variables. Figure 1 shows part of our class<br />
hierarchy, with some of the basic entities we have defined:<br />
The following functions are provided with the<br />
definition of Field. The sub-classes LineSet,<br />
SurfaceSet and VolumeSet take advantage of method<br />
inheritance and can re-use <strong>al</strong>l of these:<br />
• Ev<strong>al</strong>uate the type of the cells and their<br />
connectivity.<br />
• Create a Postscript description file for hardcopy<br />
presentation.
VolumeSets<br />
Hexahedron Tetrahedron Prism<br />
Fields<br />
SurfaceSets<br />
Triangle Quad<br />
LineSets<br />
Sets of ... Sets of ...<br />
Sets of ...<br />
• Display the set as an opaque volume, a wire<br />
frame, a cloud of pseudo-colored points.<br />
• Display the set as deformed geometry.<br />
• Clip against geometric objects and display as<br />
above.<br />
• Clip against another instance of Field.<br />
• Copy, sc<strong>al</strong>e, reshape and orient a data glyph at<br />
selected points (See [6]).<br />
• Derive gradient, curl, divergence or Laplacian of a<br />
field variable.<br />
• Clip the set based on data v<strong>al</strong>ues or based on<br />
spati<strong>al</strong> coordinates.<br />
• Use the set of points as Point Locators (to<br />
initiate particle tracing for example).<br />
• Use the points' coordinates and/or their associated<br />
data v<strong>al</strong>ues.<br />
The core of a data visu<strong>al</strong>ization process consists of<br />
mappings of the dependent variables to graphic<strong>al</strong><br />
primitives. These mappings are implemented generic<strong>al</strong>ly<br />
by the processing functions of each sub-class of Field.<br />
When <strong>al</strong>l visu<strong>al</strong>ization tools are designed to use and<br />
output data of type Field (or its sub-types), function<strong>al</strong><br />
composition, whose go<strong>al</strong> is to combine visu<strong>al</strong>ization<br />
primitives into a composite visu<strong>al</strong>ization technique, can<br />
be readily implemented (see section 4). Instances of the<br />
sub-classes of Field can either use the functions defined<br />
above, or use speci<strong>al</strong>ized operations. For example, the<br />
PointSet class has functions to store, access or modify<br />
the coordinates and data v<strong>al</strong>ues of points and to draw the<br />
Figure 1: Class Hierarchy<br />
Line-Segment<br />
PointSets<br />
points in sever<strong>al</strong> ways. The other sub-classes have more<br />
speci<strong>al</strong>ized functions.<br />
3.2. LineSets<br />
A LineSet is defined as a set of variables of type<br />
LineCell with associated field v<strong>al</strong>ues representing a<br />
gener<strong>al</strong> 3-D space curve or line. Encapsulated with the<br />
definition of this data structure are a few speci<strong>al</strong>ized<br />
operations, available to <strong>al</strong>l instances of the class, such as:<br />
• Display the polyline as a simple curve, a tube,<br />
streamtube, or as a ribbon.<br />
• Compute its length.<br />
3.3. SurfaceSets<br />
The class SurfaceSet represents the data structure of<br />
a grid made of elementary surface elements of type<br />
SurfaceCell. A SurfaceSet is defined as a set of<br />
points with associated field v<strong>al</strong>ues (a domain in 3-D<br />
space), and an inter-element connectivity function (either<br />
implicit as for regular grids, or explicit as for FEM<br />
meshes) assembling points in the lattice. The set can be<br />
formed of multiple disjoint surface patches. For example,<br />
a 2-D Finite Difference grid is an instance of the class<br />
SurfaceSet. We now list a few common operations for<br />
such sets:<br />
• Compute iso-contour lines for a selected sc<strong>al</strong>ar<br />
field (LineSet objects).
• Compute streamline profiles based on a velocity<br />
vector (LineSet objects).<br />
• Decimate or optimize the "mesh" [4, 12, 14].<br />
• Compute the grid's surface area.<br />
• Combine LineSet objects into a SurfaceSet.<br />
• Apply Texture Mapping techniques on the<br />
surface to visu<strong>al</strong>ize a data component.<br />
3.4. VolumeSets<br />
The class VolumeSet characterizes the data structure<br />
of a grid made of elementary volume elements like a<br />
tetrahedr<strong>al</strong> mesh for instance. Associated with the volumes<br />
are operators such as:<br />
• Compute iso-contour surfaces for a selected sc<strong>al</strong>ar<br />
field (SurfaceSet objects).<br />
• Compute arbitrary cross-sections (SurfaceSet<br />
objects).<br />
• Compute boundary surfaces (SurfaceSet<br />
objects).<br />
• Compute streamlines based on a velocity field<br />
(LineSet objects).<br />
• Compute its volume.<br />
• Volume Render.<br />
At this point, it is easy to recognize that each<br />
visu<strong>al</strong>ization technique is defined as an operator for each<br />
class. These functions can be applied on the data v<strong>al</strong>ues<br />
and are used to create and exchange typed data objects<br />
between each other. Function<strong>al</strong> Composition derives from<br />
this careful design of typed data. We focus next on the<br />
mappings from VolumeSets, to SurfaceSets, to<br />
LineSets which are compositions of techniques. The reuse<br />
of <strong>al</strong>l the display and processing functions defined for<br />
these data types is at the base of Function<strong>al</strong> Composition.<br />
Boundary-surface<br />
s<br />
Cross-sections<br />
Iso-surfaces<br />
VolumeSets<br />
Streamlines<br />
SurfaceSets<br />
Iso-contour<br />
Cell-Boundaries Lines<br />
Streamlines<br />
LineSets<br />
Figure 2: Mappings between Field Objects<br />
4. Composition of Field Operators<br />
4.1. Function<strong>al</strong> Composition<br />
In our system, <strong>al</strong>l functions are defined as mappings from<br />
instances of Fields to other instances of Fields (or their<br />
sub-classes). Figure 2 gives examples of visu<strong>al</strong>ization<br />
techniques as mappings between variables of the<br />
subclasses of Field .<br />
Three-dimension<strong>al</strong> tools such as boundary surface-,<br />
cross-section- and isosurface-extraction, which in current<br />
systems are limited to creating displayable geometry, are<br />
enhanced by creating objects of type Field amenable to<br />
further enhancing and processing. Each instance of a<br />
Field encapsulates an underlying geometry and some field<br />
data. Thus, function<strong>al</strong> composition of data visu<strong>al</strong>ization<br />
tools is made possible by inheriting <strong>al</strong>l the display and<br />
processing methods defined for the grid classes. Multiple<br />
data extractions and geometry color mappings can be<br />
seri<strong>al</strong>ly composed, each taking a Field object and<br />
producing another Field object.<br />
An example of Function<strong>al</strong> Composition is to<br />
consider a VolumeSet V with data fields f1 through fn.<br />
An intermediate object S of type SurfaceSet is created<br />
with <strong>al</strong>l of V's data fields stored at its points. Likewise, L<br />
of type LineSet, inherits the data v<strong>al</strong>ues of S and <strong>al</strong>l<br />
SurfaceSet and LineSet operations remain available<br />
for S and L. For example,<br />
S = Cross-Section(V, F(x, y, z))<br />
/* cross-section surface F(x,y,z) = 0 */<br />
L = Iso-contour-Line(S, fj, nb, min, max)<br />
/* isocontour lines fj(X) = min to fj(X) = max */<br />
Or more succinctly, to highlight the function<strong>al</strong><br />
composition taking place:<br />
L = Iso-contour-Line(<br />
Cross-Section(V, F(x, y, z)), fj, nb, min, max)<br />
Figure 3 gives the schematic diagram showing the<br />
function<strong>al</strong> composition taking place in our example.<br />
Field objects are shown in ellipsoids while operators are<br />
shown in rectangles. We highlight the fact that each<br />
instance of Field can be displayed in sever<strong>al</strong> ways or<br />
passed downstream for further data extraction. Defining<br />
and processing the output of <strong>al</strong>l common data<br />
visu<strong>al</strong>ization tools as Fields promotes their function<strong>al</strong><br />
composition and <strong>al</strong>low further data processing. This<br />
object-oriented approach of designing high level objects<br />
for input and output of data visu<strong>al</strong>ization tools improves<br />
the fan-in and fan-out of processing modules both in the<br />
convention<strong>al</strong> function-based approach and in the new dataflow<br />
systems. Data and code reuse are highly favored. The<br />
visu<strong>al</strong>ization process gains efficiency and practic<strong>al</strong>ity by
4D Data<br />
Data<br />
projection<br />
VolumeSet<br />
V<br />
Cross-section<br />
SurfaceSet<br />
S<br />
Iso-contour<br />
Lines<br />
LineSet<br />
L<br />
Bounding<br />
Surface<br />
Display<br />
(Boundary Edges)<br />
Display<br />
(lines)<br />
SurfaceSet<br />
Display<br />
(Bounding Box)<br />
Data Flow<br />
Display Flow<br />
Composite Rendering<br />
Figure 3: System view of Data Objects and Operations for the given example.<br />
abstracting itself from hardware-oriented graphics<br />
primitives. This approach becomes very useful for multiv<strong>al</strong>ued<br />
field data sets where we can <strong>al</strong>ternate between<br />
different data field views, independently of the underlying<br />
geometry and without re-processing of the objects.<br />
Computation<strong>al</strong> requirements are thus reduced, promoting<br />
interactivity.<br />
4.2. Fields as Domain Selectors<br />
Function<strong>al</strong> Composition can be interpreted as a data<br />
filter of the first operand by the first operator, followed by<br />
the application of another technique on the result of the<br />
selection. Thus, Field objects can provide support for a<br />
data extraction operator while remaining parti<strong>al</strong>ly visible.<br />
Transparency may <strong>al</strong>low the user to see through an<br />
object, but the accurate display of multiple objects with<br />
various transparency indices is difficult. Field objects can<br />
be used instead without being displayed. Most often, we<br />
will re-use a SurfaceSet (such as a cross-section) as a<br />
data filter. Drawing its outside line-boundary can help<br />
visu<strong>al</strong>ize its extent in space, while it is re-used to apply<br />
other data extraction techniques, such as contour line<br />
drawing, or particle tracing confined to the plane. This<br />
function<strong>al</strong> composition is of great help to the scientist<br />
whose go<strong>al</strong> is to understand inter-relationships between<br />
data fields. By providing a way to restrict the domain of<br />
application of a data mapping to a sub-set of data of<br />
interest, correlation between data fields is more easily<br />
extracted and an<strong>al</strong>yzed.<br />
Field objects can <strong>al</strong>so be used as input parameters<br />
and their vertices can be used as point locators or seeds for<br />
operations like particle tracing, or iso-surface<br />
computations.<br />
4.3. Other Operations on Fields<br />
When Field instances are regarded as data selectors, it<br />
can be appropriate to apply Boolean operations between<br />
each instance. Union and intersection are very useful<br />
operations that can lead to increased expressiveness.
Figure 4: Data Visu<strong>al</strong>ization around a highspeed<br />
train<br />
These operators can be defined for each sub-class of<br />
Field, since the underlying data structure <strong>al</strong>lows multiple<br />
disjoint sub-sets of elementary cells. It is sometimes<br />
necessary to completely remove a part obstructing the<br />
view. Cut-aways, which remove features based on the<br />
spati<strong>al</strong> coordinates of their vertices, have <strong>al</strong>so been<br />
considered. Since each instance of a Field encapsulates<br />
an underlying geometry, we can perform Boolean<br />
operations on their geometric structures, while conserving<br />
<strong>al</strong>l field data. The union of Fields is quite straightforward<br />
but is only meaningful if the two objects merged carry the<br />
same data information.<br />
Other operations are <strong>al</strong>so available between Fields.<br />
For example, the tiling of a streamsurface (SurfaceSet)<br />
with individu<strong>al</strong> streamlines (LineSets). Ribbon and<br />
streamsurfaces can be constructed thusly. This example<br />
shows that we can reverse the natur<strong>al</strong> order of<br />
visu<strong>al</strong>ization processing shown in Figure 2 which<br />
emphasizes going from a higher dimension to a lower<br />
dimension. Of particular interest are grid definition<br />
techniques which <strong>al</strong>low us to construct computation<strong>al</strong><br />
grids by sc<strong>al</strong>ing, translating and revolving LineSets and<br />
SurfaceSets.<br />
5. Examples<br />
Our library of Field classes and operations has been<br />
implemented in C++ and runs on SGI workstations. The<br />
graphic toolkit Inventor [13] has been used to perform <strong>al</strong>l<br />
display operations. Our examples show compositions of<br />
data extraction capabilities and highlight the polymorphic<br />
display options available to objects of our three most<br />
important classes: VolumeSet , SurfaceSet and<br />
LineSet.<br />
Our first example in Figure 4 consists of a<br />
VolumeSet object of 127,049 tetrahedr<strong>al</strong> elements with<br />
energy, density and velocity (Vx, Vy, Vz) stored at each<br />
Figure 5: Visu<strong>al</strong>ization of Velocity Fields by<br />
Polymorphic Rendering<br />
grid point. The object under study is a high-speed train in<br />
a flow field. We focus our attention on the front of the<br />
vehicle and proceed by c<strong>al</strong>culating an isov<strong>al</strong>ue surface of<br />
the x-component of velocity which shows up as a large<br />
bulgy surface on the nose of the train. Cross sections<br />
<strong>al</strong>ong the direction of travel and perpendicularly to the<br />
direction of travel are <strong>al</strong>so computed. The addition of the<br />
SurfaceSets created is then used to show a composition<br />
of sever<strong>al</strong> data encoding. The cross-sections, the isosurface<br />
and the boundary surface are colored with the pressure field<br />
(lower left image) and combined to restrict the input<br />
domain for the computation of iso-energy lines, shown<br />
with a different colormap encoding the variations of the<br />
cross-velocity field. Note that the iso-surface actu<strong>al</strong>ly<br />
encodes four sc<strong>al</strong>ar variables simultaneously. A pseudocoloring<br />
of the pressure is shown while the iso-lines<br />
which are restricted to its surface are colored with a fourth<br />
data mapping.<br />
Our second example in Figure 5 shows polymorphic<br />
rendering of particle traces computed by a VolumeSet<br />
object. A cylinder in a transvers<strong>al</strong> flow is studied in a<br />
dataset of 246,725 volume cells. The volume object<br />
computes its boundary surface on which we compute an<br />
iso-pressure LineSet. Streamlines are <strong>al</strong>so computed as<br />
instances of LineSets. As such, they can be displayed<br />
in a multitude of ways, without requiring any speci<strong>al</strong>purpose<br />
coding. A rake of streamlines is computed and<br />
displayed as simple pseudo-colored space curves; another<br />
LineSet is displayed with velocity vector icons placed at<br />
regular interv<strong>al</strong>s, while another one is displayed as a tube<br />
and one is displayed as a ribbon, <strong>al</strong>lowing addition<strong>al</strong> color<br />
encodings (In this example, the streamline LineSets are<br />
colored with Pressure). Mappings to pseudo-colored<br />
geometric objects can be activated interactively on the<br />
various LineSets since the data and the geometry are<br />
encapsulated in the same data-structure.<br />
The performance of our library of tools provides for<br />
interactive inquiries. The train dataset was processed for<br />
isosurface and cross-sections in a few seconds, including<br />
triangulation and connectivity computations for more than
16,000 triangles. The surfaces were then joined, isocontoured<br />
and shaded in a few more seconds on an SGI<br />
Crimson. Similarly, the outside surface of the cylinder<br />
dataset was extracted and iso-contoured at interactive speed.<br />
We have a limited user interface which <strong>al</strong>lows a mix of<br />
keyboard inputs and direct manipulation via the Inventor<br />
toolkit. Since <strong>al</strong>l objects in the graphics scene contain<br />
geometry and data v<strong>al</strong>ues, computation<strong>al</strong> queries can be<br />
readily answered. Each common grid type has<br />
"constructor" methods available to read in and store sets of<br />
data points and no programming is required. However, the<br />
end-user would need to add an addition<strong>al</strong> member function<br />
for the given data type for data encoded in a new format.<br />
6. Discussion<br />
Since our visu<strong>al</strong>ization <strong>al</strong>gorithms rely on connected<br />
components of elementary cells, their implementation<br />
requires more work. For example, functions like Marching<br />
Cubes iso-surface extraction [7] or iso-contour lines are<br />
cell-based by nature and their output is tradition<strong>al</strong>ly cast<br />
into sets of disjoint geometric entities. Here, to take<br />
advantage of the grid data structures and guarantee surface<br />
continuity and a consistent right-hand rule ordering of the<br />
vertices, surfaces are more easily constructed as a moving<br />
front intersecting the volume [15]. Likewise, iso-contour<br />
lines must <strong>al</strong>so comply to our design and be fully<br />
connected lines, instead of the concatenation of line<br />
segments at rendering times. (This is curve sequence<br />
contouring versus grid sequence contouring [10]). Note<br />
that by construction, streamlines offer natur<strong>al</strong>ly connected<br />
paths and don't require new implementations. We reap an<br />
important benefit from this redesign. Consider iso-level<br />
data mappings. There is a well known ambiguity which<br />
arises when a cell spans a saddle in the data (Two opposite<br />
corners above and two below the threshold v<strong>al</strong>ue in a 2-D<br />
cell). This may lead to spurious holes or surface segments<br />
at rendering times, unless addition<strong>al</strong> efforts are invested to<br />
carefully handle these cases (See [9] for a very good<br />
survey). We have implemented these functions in an<br />
advancing front fashion to avoid this ambiguity. An<br />
active set of cells is maintained at the boundary of the<br />
isosurface and edge and orientation information is passed<br />
to the new candidate cells. Because isocontour lines or<br />
isosurfaces are constructed increment<strong>al</strong>ly, we obtain loc<strong>al</strong><br />
coherency in the numbering scheme of points and<br />
elementary cells. When re-used, the Field objects are<br />
more efficient and they do not require addition<strong>al</strong><br />
connectivity mapping or renumbering.<br />
7. Conclusion<br />
The data extraction operations we show in our<br />
examples are not new, but our contribution is to provide<br />
the environment where they can be easily combined. We<br />
defined elementary cells of various topologic<strong>al</strong> dimensions<br />
endowed with display and data extraction operators. They<br />
are assembled as Field objects to represent grids of data.<br />
Field objects encapsulate data fields with an underlying<br />
geometry and offer a rich function<strong>al</strong>ity. They avoid the<br />
strong type restrictions typic<strong>al</strong> in other systems by<br />
combining display and data manipulation operations.<br />
They can be re-used at different stages of the visu<strong>al</strong>ization<br />
process, thus increasing the fan-in and fan-out of<br />
processing modules and enabling better composition of<br />
data mappings. We could not achieve similar composite<br />
visu<strong>al</strong>ization in the other systems we are familiar with,<br />
because of their use of pure graphic<strong>al</strong> primitives.<br />
Our data objects can be joined or act as filters to<br />
promote the seri<strong>al</strong> composition of visu<strong>al</strong>ization<br />
techniques. This composition helps understand interrelationships<br />
between data fields and facilitates the<br />
an<strong>al</strong>ysis of data correlation. Our system design opens new<br />
ways to scientific exploration and provides an open-ended<br />
architecture for implementing new visu<strong>al</strong> representations<br />
whose effectiveness should be ev<strong>al</strong>uated by using<br />
principles of visu<strong>al</strong> perception [5].<br />
The structured definitions <strong>al</strong>so <strong>al</strong>low quantitative<br />
an<strong>al</strong>ysis to take place. For example, in medic<strong>al</strong> imaging,<br />
doctors may want to compute a volume contained between<br />
iso-radiation surfaces. In fluid flow, flux computations<br />
can be computed through surfaces of interest. Because the<br />
objects we manipulate are <strong>al</strong>l piece-wise approximations<br />
of well-behaved volumes, surfaces and lines, we can<br />
estimate lengths, surface areas, volumes and other<br />
numeric<strong>al</strong> v<strong>al</strong>ues.<br />
We have limited our discussion to grids of linear<br />
cells. We intend to expand our library of tools to handle<br />
cells with curved boundaries, often used in FEA. We will<br />
<strong>al</strong>so focus our effort to data sets in 3D space + time.<br />
Constructing streamsurfaces from streamlines or isov<strong>al</strong>ue<br />
surfaces from contour lines on successive cross-sections<br />
<strong>al</strong>so shows that visu<strong>al</strong>ization processes are not limited to<br />
mappings to lower dimensions. We plan to research other<br />
examples of mappings to higher dimensions.<br />
Acknowledgments<br />
We would like to thank Larry Gritz, Randy Rohrer<br />
and Daria Bergen for their v<strong>al</strong>uable help in editing our<br />
manuscript, Larry Cannon for his encouragement, and the<br />
Department of EE&CS at The George Washington<br />
University for its financi<strong>al</strong> support.<br />
References<br />
[1] Butler David M. and Hansen Charles.<br />
"Visu<strong>al</strong>ization'91 Workshop Report: Scientific<br />
Visu<strong>al</strong>ization Environments," Computer Graphics,<br />
26(3), pp. 213-116.<br />
[2] Foley Thomas A. and Lane David. "Multi-V<strong>al</strong>ued<br />
Volumetric Visu<strong>al</strong>ization," In Visu<strong>al</strong>ization'91, pp.<br />
218-225. IEEE Computer Society, October 1991.
[3] Geiben M. and Rumpf M. "Visu<strong>al</strong>ization of finite<br />
elements and tools for numeric<strong>al</strong> an<strong>al</strong>ysis," In Second<br />
Eurographics Workshop in Visu<strong>al</strong>ization, April 1991.<br />
[4] Hoppe Hugues, DeRose Tony, Duchamp Tom,<br />
McDon<strong>al</strong>d John, and Stuetzle Werner. "Mesh<br />
optimization," Computer Graphics, pp. 19-26, 1993.<br />
[5] Ignatius Eve, Senay Hikmet and Favre Jean. "An<br />
Intelligent System for Visu<strong>al</strong>ization Assistance," To<br />
appear in Journ<strong>al</strong> of Visu<strong>al</strong> Languages and Computing,<br />
1994.<br />
[6] Kerlic G. David. "Moving iconic objects in scientific<br />
visu<strong>al</strong>ization," In Visu<strong>al</strong>ization'90, pp. 124-129.<br />
IEEE Computer Society, October 1990.<br />
[7] Lorensen William E. and Cline Harvey E. "Marching<br />
cubes: A high resolution 3d surface construction<br />
<strong>al</strong>gorithm," Computer Graphics, 21(4), pp. 163-169,<br />
1987.<br />
[8] Lucas Bruce et <strong>al</strong>. "An Architecture for a Scientific<br />
Visu<strong>al</strong>ization System," In Visu<strong>al</strong>ization'92, pp. 107-<br />
114. IEEE Computer Society, October 1992.<br />
[9] Ning Paul and Bloomenth<strong>al</strong> Jules. "An Ev<strong>al</strong>uation of<br />
Implicit Surface Tilers," IEEE Computer Graphics and<br />
Applications, 13(6), pp. 33-41, November 1993.<br />
[10] Sabin M<strong>al</strong>com. "A survey of contouring methods,"<br />
Computer Graphics Forum, (5), pp. 325-340, 1986.<br />
[11] Schroeder W.J. and Lorensen W.E. "Visage: An objectoriented<br />
scientific visu<strong>al</strong>ization system," In<br />
Visu<strong>al</strong>ization'92, pp. 219-225. IEEE Computer<br />
Society, October 1992.<br />
[12] Schroeder W.J., Zarge J. A. and Lorensen W.E.<br />
"Decimation of Triangle Meshes," Computer<br />
Graphics, 26(2), pp. 65-70, 1992.<br />
[13] Strauss Paul S. and Carey Rikk. "An Object-Oriented<br />
3D Graphics Toolkit," Computer Graphics, 26(2), pp.<br />
341-349, 1992.<br />
[14] Turk, G. "Re-Tiling Polygon<strong>al</strong> Surfaces," Computer<br />
Graphics, 26(2), pp. 55-64, 1992.<br />
[15] Zahlten Cornelia. "Piecewise Linear Approximation of<br />
Isov<strong>al</strong>ued Surfaces," In Advances in Scientific<br />
Visu<strong>al</strong>ization, F.H. Post and A.J.S. Hin (Eds).
Abstract<br />
XmdvTool� Integrating Multiple Methods for Visu<strong>al</strong>izing<br />
Multivariate Data<br />
Much of the attention in visu<strong>al</strong>ization research has<br />
focussed on data rooted in physic<strong>al</strong> phenomena� which<br />
is gener<strong>al</strong>ly limited to three or four dimensions. How�<br />
ever� many sources of data do not share this dimen�<br />
sion<strong>al</strong> restriction. A critic<strong>al</strong> problem in the an<strong>al</strong>ysis of<br />
such data is providing researchers with tools to gain in�<br />
sights into characteristics of the data� such as anoma�<br />
lies and patterns. Sever<strong>al</strong> visu<strong>al</strong>ization methods have<br />
been developed to address this problem� and each has<br />
its strengths and weaknesses. This paper describes a<br />
system named XmdvTool which integrates sever<strong>al</strong> of<br />
the most common methods for projecting multivari�<br />
ate data onto a two�dimension<strong>al</strong> screen. This inte�<br />
gration <strong>al</strong>lows users to explore their data in a variety<br />
of formats with ease. A view enhancement mecha�<br />
nism c<strong>al</strong>led an N�dimension<strong>al</strong> brush is <strong>al</strong>so described.<br />
The brush <strong>al</strong>lows users to gain insights into spati<strong>al</strong><br />
relationships over N dimensions by highlighting data<br />
which f<strong>al</strong>ls within a user�speci�ed subspace.<br />
1 Introduction<br />
The major objectives of data an<strong>al</strong>ysis are to sum�<br />
marize and interpret a data set� describing the con�<br />
tents and exposing important features �6�. Visu<strong>al</strong>iza�<br />
tion can play an important role in each of these objec�<br />
tives� both in qu<strong>al</strong>itative ev<strong>al</strong>uation of the data and<br />
in conjunction with focussed quantitative an<strong>al</strong>ysis. A<br />
given visu<strong>al</strong>ization technique is gener<strong>al</strong>ly applicable to<br />
data of certain characteristics. This paper describes<br />
a system which has been developed for the display of<br />
multivariate data.<br />
Multivariate data can be de�ned as a set of enti�<br />
ties E� where the i th element e i consists of a vector<br />
with n observations� �x i1� x i2� ���� x in�. Each observa�<br />
tion �variable� may be independent of or interdepen�<br />
dent with one or more of the other observations. Vari�<br />
Matthew O. Ward<br />
Computer Science Department<br />
Worcester Polytechnic Institute<br />
Worcester� MA 01609<br />
ables may be discrete or continuous in nature� or take<br />
on symbolic �nomin<strong>al</strong>� v<strong>al</strong>ues. Variables <strong>al</strong>so have a<br />
sc<strong>al</strong>e associated with them� where sc<strong>al</strong>es are de�ned<br />
according to the existence or lack of an ordering rela�<br />
tionship� a distance �interv<strong>al</strong>� metric� and an absolute<br />
zero �origin�.<br />
When visu<strong>al</strong>izing multivariate data� each variable<br />
may map to some graphic<strong>al</strong> entity or attribute. In<br />
doing so� the type �discrete� continuous� nomin<strong>al</strong>� or<br />
sc<strong>al</strong>e may be changed to facilitate display. In such sit�<br />
uations� care must be taken� as a graphic<strong>al</strong> variable<br />
with a perceived characteristic �type or sc<strong>al</strong>e� which<br />
is mapped to a data variable with a di�erent charac�<br />
teristic can lead to misinterpretation.<br />
Many criteria can be used to gauge the e�ective�<br />
ness of a visu<strong>al</strong>ization technique for multivariate data.<br />
Some of these are directly measurable� such as the<br />
number of variables or data points which can be dis�<br />
played. Others require subjective ev<strong>al</strong>uation and are<br />
thus di�cult to quantify. The list below summarizes<br />
some of these criteria. In our studies of the vari�<br />
ous projection techniques we are examining these and<br />
other issues.<br />
Constraints on dimensions� <strong>al</strong>l of the projection<br />
techniques surveyed degrade in usefulness when<br />
the number of dimensions or variables exceeds a<br />
certain size.<br />
Constraints on data set size� each data projec�<br />
tion method <strong>al</strong>locates a certain amount of screen<br />
space for each data sample. As screen space is<br />
�nite� there exists a limit for e�ective visu<strong>al</strong>iza�<br />
tion.<br />
The e�ect of data distribution� sparse data sets<br />
may lead to poor screen utilization� while highly<br />
clustered data may make it di�cult to identify<br />
individu<strong>al</strong> samples.<br />
Occlusion� in many instances� di�erent data points
will map to the same location on the screen. It<br />
is important that the viewer be aware of these<br />
overlaps and perhaps have a strategy to obtain a<br />
view which avoids a given overlap.<br />
Perceptibility� the go<strong>al</strong> of visu<strong>al</strong>izing data is to try<br />
to understand the structure of the data or de�<br />
tect some data characteristics� such as anom<strong>al</strong>ies�<br />
extrema� and patterns. These features may be<br />
more readily apparent in some projection tech�<br />
niques than others.<br />
User interactions� visu<strong>al</strong>ization is incomplete with�<br />
out interaction. Each projection technique has a<br />
logic<strong>al</strong> set of interactive capabilities for view mod�<br />
i�cation and enhancement.<br />
Interpretation guides� users need reference points<br />
such as keys� labels� and grids to help interpret<br />
the data and determine its context.<br />
Use of color� color can be used to convey one or<br />
more variables of the data or to help highlight<br />
or deemphasize subsets of the data. As color per�<br />
ception varies both contextu<strong>al</strong>ly and between in�<br />
dividu<strong>al</strong>s� it should be used with care.<br />
3�Dimension<strong>al</strong> cues� other cues commonly found in<br />
3�D graphics� such as shading� translucency� and<br />
motion� can be used to reduce the over<strong>al</strong>l dimen�<br />
sion<strong>al</strong>ity� <strong>al</strong>though often at some cost in inter�<br />
pretability.<br />
2 N�Dimension<strong>al</strong> Data Visu<strong>al</strong>ization<br />
Methods<br />
Many techniques for projecting N�dimension<strong>al</strong> data<br />
onto two dimensions have been proposed and explored<br />
over the years. This section presents an overview of<br />
four classes of techniques� and describes their imple�<br />
mentation within XmdvTool.<br />
2.1 Scatterplots<br />
Scatterplots are one of the oldest and most com�<br />
monly used methods to project high dimension<strong>al</strong> data<br />
to 2�dimensions. In this method� N � �N � 1��2 pair�<br />
wise par<strong>al</strong>lel projections are generated� each giving the<br />
viewer a gener<strong>al</strong> impression regarding relationships<br />
within the data between pairs of dimensions. The<br />
projections are gener<strong>al</strong>ly arranged in a grid structure<br />
to help the user remember the dimensions associated<br />
with each projection. Many variations on the scatter�<br />
plot have been developed to increase the information<br />
content of the image as well as provide tools to facili�<br />
tate data exploration. Some of these include rotating<br />
the data cloud �12�� using di�erent symbols to distin�<br />
guish classes of data and occurrences of overlapping<br />
points� and using color or shading to provide a third<br />
dimension within each projection.<br />
The procedure for generating scatterplots within<br />
XmdvTool is quite straightforward. The display win�<br />
dow is divided into an N by N grid� and each data<br />
point results in N 2 points being drawn� using only two<br />
dimensions per view. Columns and rows in the grid<br />
are labeled according to the dimension they represent.<br />
Figure 1 presents a seven dimension<strong>al</strong> data set<br />
using scatterplots. Note that plotting each dimen�<br />
sion against itself <strong>al</strong>ong the diagon<strong>al</strong> provides dis�<br />
tribution information on the individu<strong>al</strong> dimensions.<br />
The data set contains statistics regarding crime in<br />
Detroit between 1961 and 1973� and consists of<br />
13 data points. The data set was obtained via<br />
anonymous ftp from unix.hensa.ac.uk in the directory<br />
�pub�statlib�datasets. Some dimensions of the origi�<br />
n<strong>al</strong> set have been eliminated to facilitate display us�<br />
ing scatterplots. The dimensions and their ranges are<br />
given in Table 1. Linear structures within sever<strong>al</strong> of<br />
the projections indicate some correlation between the<br />
two dimensions involved in the projections. Thus� for<br />
example� there is a correlation between the number<br />
of full�time police� the number of homicides� and the<br />
number of government workers �with a corresponding<br />
negative correlation in the percent of cleared homi�<br />
cides�.<br />
One major limitation of scatterplots is that they<br />
are most e�ective with sm<strong>al</strong>l numbers of dimensions�<br />
as increasing the dimension<strong>al</strong>ity results in decreasing<br />
the screen space provided for each projection. Strate�<br />
gies for addressing this limitation include using three<br />
dimensions per plot or providing panning or zooming<br />
mechanisms. Other limitations include being gener�<br />
<strong>al</strong>ly restricted to orthogon<strong>al</strong> views and di�culties in<br />
discovering relationships which span more than two<br />
dimensions. Advantages of scatterplots include ease<br />
of interpretation and relative insensitivity to the size<br />
of the data set.<br />
2.2 Glyphs<br />
The de�nition of a glyph covers a large number of<br />
techniques which map data v<strong>al</strong>ues to various geometric<br />
and color attributes of graphic<strong>al</strong> primitives or sym�<br />
bols �10�. Some of the many glyph representations<br />
proposed over the years include the following�
Dimension Minimum Maximum<br />
Full�time police per 100�000 population 255. 400.<br />
Unemployment rate 0. 12.<br />
Number of manufacturing workers in thousands 450. 620.<br />
Number of handgun licenses per 100�000 100. 1200.<br />
Number of government workers in thousands 120. 250.<br />
Percent homicides cleared by arrests 50. 100.<br />
Number of homicides per 100�000 0. 60.<br />
� Faces� where attributes such as location� shape�<br />
and size of features such as eyes� mouth� and ears<br />
are controlled by di�erent data dimensions �5�.<br />
� Andrews glyphs� which map data to functions<br />
�e.g. trigonometric� of N variables �1�.<br />
� Stars or circle diagrams� where each glyph con�<br />
sists of N lines emanating from a point at uni�<br />
formly separated angles with lengths determined<br />
by the v<strong>al</strong>ues of each dimension� with the end�<br />
points connected to form a polygon �13�.<br />
� Stick �gure icons� where the length� orientation�<br />
and color of N elements of a stick �gure are con�<br />
trolled by the dimension<strong>al</strong> v<strong>al</strong>ues �7�.<br />
� Shape coding� where each data point is repre�<br />
sented by a rectangle which has been decomposed<br />
into N cells and the dimension<strong>al</strong> v<strong>al</strong>ue controls the<br />
color of each cell �4�.<br />
In XmdvTool� we use the star glyph pattern �13�.<br />
The user can choose between either uniformly spaced<br />
glyphs or using two of the dimensions to determine<br />
the location of the glyph within the window. Each<br />
ray of the glyph has a minimum and maximum length�<br />
determined either by the user �for glyphs with data�<br />
driven locations� or by the size of the view area �for<br />
uniformly spaced glyphs�. A key for interpreting the<br />
dimensions is included in a separate window.<br />
Figure 2 shows an example of glyphs in XmdvTool<br />
using the same data set as in Figure 1. The evolu�<br />
tion of the shape over time indicates both trends and<br />
anom<strong>al</strong>ies. For example� the clear protrusion in the<br />
direction associated with cleared homicides �257 de�<br />
grees� found in the earlier shapes evolves into a con�<br />
cavity over time.<br />
Glyph techniques are gener<strong>al</strong>ly limited in the num�<br />
ber of data elements which can be displayed simulta�<br />
neously� as each may require a signi�cant amount of<br />
screen space to be viewed. The density and size con�<br />
straints of the elements� however� depend on the level<br />
Table 1� Dimensions of the Detroit data set.<br />
of perceptu<strong>al</strong> accuracy required. Also� it can be di��<br />
cult to compare glyphs which are separated in space�<br />
<strong>al</strong>though if data dimensions are not being used to de�<br />
termine glyph locations� the glyphs can be sorted or<br />
interactively clustered on the screen to help highlight<br />
similarities and di�erences. Most of the glyph tech�<br />
niques are fairly �exible as to the number of dimen�<br />
sions which can be handled� though discriminability<br />
may be a�ected for large v<strong>al</strong>ues of N �greater than 20<br />
or so�.<br />
2.3 Par<strong>al</strong>lel Coordinates<br />
Par<strong>al</strong>lel coordinates is a technique pioneered in the<br />
1970�s which has been applied to a diverse set of mul�<br />
tidimension<strong>al</strong> problems �8�. In this method� each di�<br />
mension corresponds to an axis� and the N axes are<br />
organized as uniformly spaced vertic<strong>al</strong> lines. A data<br />
element in N�dimension<strong>al</strong> space manifests itself as a<br />
connected set of points� one on each axis. Points lying<br />
on a common line or plane create readily perceived<br />
structures in the image.<br />
In generating the display of par<strong>al</strong>lel coordinates in<br />
XmdvTool� the view area is divided into N vertic<strong>al</strong><br />
slices of equ<strong>al</strong> width. At the center of each slice an<br />
axis is drawn� <strong>al</strong>ong with a label at the top end. Data<br />
points are generated as polylines across the N axes.<br />
Figure 3 shows an example of the Par<strong>al</strong>lel Coordi�<br />
nates technique using the same data set as in Figure 1.<br />
Clustering is evident among some of the lines� indicat�<br />
ing a degree of correlation. For example� the X�shaped<br />
structure between the axes for cleared cases and homi�<br />
cides indicates an inverse correlation� and the nearly<br />
par<strong>al</strong>lel lines betwen the axes for manufacturing work�<br />
ers and handgun licenses suggests a relatively constant<br />
increase in the rate of handgun ownership as manufac�<br />
turing jobs increase �some exceptions exist� however�.<br />
The major limitation of the Par<strong>al</strong>lel Coordinates<br />
technique is that large data sets can cause di�culty in<br />
interpretation� as each point generates a line� lots of<br />
points can lead to rapid clutter. Also� relationships
etween adjacent dimensions are easier to perceive<br />
than between non�adjacent dimensions. The number<br />
of dimensions which can be visu<strong>al</strong>ized is fairly large�<br />
limited by the horizont<strong>al</strong> resolution of the screen� <strong>al</strong>�<br />
though as the axes get closer to each other it becomes<br />
more di�cult to perceive structure or clusters.<br />
2.4 Hierarchic<strong>al</strong> Techniques<br />
Sever<strong>al</strong> recent techniques have emerged which in�<br />
volve projecting high dimension<strong>al</strong> data by embedding<br />
dimensions within other dimensions. In the 1�D case<br />
�11�� one starts by discretizing the ranges of each di�<br />
mension and assigning an ordering to the dimensions<br />
�dimensions are said to have unique �speeds��. A<br />
background color is <strong>al</strong>so associated with each speed.<br />
The next step is to divide the screen into C0 vertic<strong>al</strong><br />
strips� where C0 is the cardin<strong>al</strong>ity of the dimension<br />
with the slowest speed. The strips are colored accord�<br />
ing to that speed. Each of these strips is then divided<br />
into C1 strips and colored accordingly. This is re�<br />
peated until <strong>al</strong>l dimensions have been embedded and<br />
the data v<strong>al</strong>ue associated with each cell can be plotted<br />
on the vertic<strong>al</strong> axis.<br />
In 2�D �9�� an an<strong>al</strong>ogous technique c<strong>al</strong>led Dimen�<br />
sion<strong>al</strong> Stacking involves recursively embedding images<br />
de�ned by a pair of dimensions within pixels of a<br />
higher�level image. Unlike the previous system� how�<br />
ever� data is not restricted to functions� thus mak�<br />
ing this technique amenable to a wider range of data<br />
types. In Worlds within Worlds �2�� each location in a<br />
3�D space may in turn contain a 3�D space which the<br />
user may investigate in a hierarchic<strong>al</strong> fashion. The<br />
most detailed level may contain surfaces� solids� or<br />
point data.<br />
XmdvTool requires three types of information to<br />
project data using dimension<strong>al</strong> stacking. The �rst is<br />
the cardin<strong>al</strong>ity �number of buckets� for each dimen�<br />
sion. The range of v<strong>al</strong>ues for each dimension is then<br />
decomposed into that many equ<strong>al</strong> sized subranges.<br />
The second type of information needed is the order�<br />
ing for the dimensions� from outer�most �slowest� to<br />
inner�most �fastest�. Dimensions are assumed to <strong>al</strong>�<br />
ternate in orientation. The last piece of information<br />
used is the minimum size for the plotted data item<br />
�the system will increase this v<strong>al</strong>ue if the entire image<br />
can �t within the view area�. Each data point then<br />
maps into a unique bucket� which in turn maps to a<br />
unique location in the resulting image. If the image<br />
generated exceeds the size of the view area� scroll bars<br />
are automatic<strong>al</strong>ly generated to <strong>al</strong>low panning. A key<br />
is provided in a separate window to help users under�<br />
stand the order of embedding� and grid lines of varying<br />
intensity provide assistance in interpreting transitions<br />
between buckets at di�erent levels in the hierarchy.<br />
The sparseness of the data set of Figure 1 makes<br />
uncovering relationships di�cult using Dimension<strong>al</strong><br />
Stacking. Figure 4 shows a denser set consisting of 3�<br />
D drill hole data with a fourth dimension representing<br />
the ore grade found at the location �more than 8000<br />
data points�. Longitude and latitude are mapped to<br />
the outer dimensions� each with cardin<strong>al</strong>ity 10. Depth<br />
and ore grade map to the inner dimensions �ore grade<br />
is the vertic<strong>al</strong> orientation�� with cardin<strong>al</strong>ity 10 and 5�<br />
respectively. There is a clear region in which the ore<br />
grade improves with depth� and other places where<br />
digging had stopped prior to the ore grade f<strong>al</strong>ling sig�<br />
ni�cantly. By adjusting the cardin<strong>al</strong>ities and ranges<br />
for the various dimensions� a more detailed view of<br />
the data may be obtained �16�.<br />
The hierarchic<strong>al</strong> techniques are best suited for fairly<br />
dense data sets and do rather poorly with sparse data.<br />
This is due to the fact that each possible data point<br />
is <strong>al</strong>located a speci�c screen location �with overlaps<br />
avoidable by careful discretization of dimensions�� and<br />
as the dimension of the data increases� the screen space<br />
needed expands rapidly. In contrast� the techniques<br />
described earlier gener<strong>al</strong>ly do well with sparse data<br />
over high numbers of dimensions� though scatterplots<br />
are constrained somewhat it the maximum manage�<br />
able dimension. The major problem with hierarchic<strong>al</strong><br />
methods is the di�culty in determining spati<strong>al</strong> rela�<br />
tionships between points in non�adjacent dimensions.<br />
Two points which in fact are quite close in N�space<br />
may project to screen locations which are quite far<br />
apart. This is somewhat <strong>al</strong>leviated by providing users<br />
with the ability to rapidly change the nesting charac�<br />
teristics and discretization of the dimensions.<br />
3 N�Dimension<strong>al</strong> Brushing<br />
Another useful capability of XmdvTool is N�<br />
dimension<strong>al</strong> brushing �15�. Brushing is a process in<br />
which a user can highlight� select� or delete a subset<br />
of elements being graphic<strong>al</strong>ly displayed by pointing at<br />
the elements with a mouse or other suitable input de�<br />
vice. In situations where multiple views of the data<br />
are being shown simultaneously �e.g. scatterplots��<br />
brushing is often associated with a process known as<br />
Linking� in which brushing elements in one view af�<br />
fects the same data in <strong>al</strong>l other views. Brushing has<br />
been employed as a method for assisting data an<strong>al</strong>ysis<br />
for many years. One of the �rst brushing techniques<br />
was applied to high dimension<strong>al</strong> scatterplots �3�. In<br />
this system� the user speci�ed a rectangular region in
one of the 2�D scatterplot projections� and based on<br />
the mode of operation� points in other views corre�<br />
sponding to those f<strong>al</strong>ling within the brush were high�<br />
lighted� deleted� or labeled. Brushing has <strong>al</strong>so been<br />
used to help users select data points for which they<br />
desire further information. Smith et. <strong>al</strong>. �14� used<br />
brushing of images generated by stick �gure icons to<br />
obtain higher dimension<strong>al</strong> information through soni��<br />
cation for the selected data points.<br />
In XmdvTool� the notion of brushing has been<br />
extended to permit brushes to have dimension<strong>al</strong>ity<br />
greater than two. The go<strong>al</strong> is to <strong>al</strong>low the user to gain<br />
some understanding of spati<strong>al</strong> relationships in N�space<br />
by highlighting <strong>al</strong>l data points which f<strong>al</strong>l within a user�<br />
de�ned� relocatable subspace. N�D brushes have the<br />
following characteristics�<br />
Brush Shape� In XmdvTool� the shape of the brush<br />
is that of an N�D hyperbox. Other generic shapes�<br />
such as hyperellipses� will be added in the future�<br />
as well as customized shapes� which can consist<br />
of any connected arbitrary N�D subspace.<br />
Brush Size� For generic shapes the user simply<br />
needs to specify N brush dimensions. The mech�<br />
anism used by XmdvTool to perform this� <strong>al</strong>beit<br />
primitive� is to use N slider bars.<br />
Brush Boundary� In XmdvTool� the boundary of a<br />
brush is a step edge. Another possibility would<br />
be a ramp� with many possibilities for the shape<br />
of the ramp. Another interesting enhancement<br />
could be achieved by coloring data points accord�<br />
ing to the degree of brush coverage �where it f<strong>al</strong>ls<br />
<strong>al</strong>ong the ramp�.<br />
Brush Positioning� Brushes have a position which<br />
the user must be able to easily and intuitively<br />
control. In the gener<strong>al</strong> case� the user needs to<br />
specify N v<strong>al</strong>ues to uniquely position the brush.<br />
This is done in XmdvTool via the same sliders<br />
employed in size speci�cation.<br />
Brush Motion� Although XmdvTool currently sup�<br />
ports only manu<strong>al</strong> brush motion� we hope to im�<br />
plement sever<strong>al</strong> forms of brush path speci�cation<br />
in the future.<br />
Brush Display� N�dimension<strong>al</strong> space is usu<strong>al</strong>ly<br />
quite sparse� thus it is useful at times to display<br />
the subspace covered by the brush on the data<br />
display. The location can be indicated either by<br />
the brush�s boundary or a shaded region showing<br />
the area of coverage. In XmdvTool� brushes are<br />
displayed as shaded blue�grey regions� with data<br />
points which f<strong>al</strong>l within the brush highlighted in<br />
red.<br />
Brush size and position are currently speci�ed in a<br />
rather simplistic manner. The user selects the dimen�<br />
sion to be adjusted� and then changes the brush size or<br />
position via a slider. There are many opportunities for<br />
<strong>al</strong>lowing the user to directly manipulate the brush in<br />
the display area� <strong>al</strong>though each procedure would need<br />
to be customized based on the projection method in<br />
use. For example� the user could move or resize one<br />
dimension of the brush by dragging the edge or cen�<br />
ter of the brush <strong>al</strong>ong one of the axes of the Par<strong>al</strong>lel<br />
Coordinate display� or set the location of the brush<br />
by selecting one of the glyphs. Direct manipulation of<br />
the brush will be one of the features incorporated into<br />
future releases of XmdvTool.<br />
4 Summary and Conclusions<br />
This paper has presented an overview of the �eld<br />
of multivariate data visu<strong>al</strong>ization and has introduced<br />
a software package� named XmdvTool� to help users<br />
experiment with di�erent N�dimension<strong>al</strong> projection<br />
techniques. Each of the techniques has its strengths<br />
and weaknesses in regards to the types of data sets<br />
for which it is most appropriate. The number of di�<br />
mensions in the data as well as the range of v<strong>al</strong>ues<br />
and distribution within each dimension <strong>al</strong>l play im�<br />
portant roles. The go<strong>al</strong> of the user in examining the<br />
data� whether it be for patterns� anom<strong>al</strong>ies� or depen�<br />
dencies� is <strong>al</strong>so important in gauging the relative use�<br />
fulness of a technique. One of the long�term go<strong>al</strong>s of<br />
this research e�ort is to create a benchmark for ev<strong>al</strong>u�<br />
ating multivariate data visu<strong>al</strong>ization tools using data<br />
sets with a diversity of characteristics. The ev<strong>al</strong>ua�<br />
tion criteria listed in Section 2 �as well as other crite�<br />
ria� will be employed in the assessment process� <strong>al</strong>ong<br />
with studying the performance of human subjects in<br />
locating structure in data sets using di�erent tools.<br />
Future development of XmdvTool will include<br />
both generic view�enhancement techniques �addition<strong>al</strong><br />
brush capabilities� panning� zooming� clipping� and<br />
methods related to the speci�c projection techniques.<br />
Some of these will include experimenting with di�er�<br />
ent glyph structures� interactively changing the order<br />
of dimensions� and dynamic control over the binning<br />
for dimension<strong>al</strong> stacking. Some of these capabilities<br />
have <strong>al</strong>ready been implemented into N�Land �16�� a<br />
software package for exploring the capabilities of di�<br />
mension<strong>al</strong> stacking developed by the author and his
colleagues� and thus should be relatively easy to in�<br />
corporate.<br />
XmdvTool is written in C using X11R5� Athena<br />
Widgets� and the Widget Creation Library �Wcl�<br />
2.5�� and will be made available on anonymous ftp<br />
�wpi.wpi.edu� in the near future. Interested par�<br />
ties should contact the author at matt�cs.wpi.edu or<br />
check in the �contrib�Xstu� directory at the above<br />
mentioned site for the �le named XmdvTool.tar.Z.<br />
References<br />
�1� Andrews� D.F.� �Plots of high dimension<strong>al</strong> data��<br />
Biometrics� Vol. 28� pp. 125�136� 1972.<br />
�2� Beshers� C.� Feiner� S.� �AutoVisu<strong>al</strong>� rule�based<br />
design of interactive multivariate visu<strong>al</strong>izations��<br />
IEEE Computer Graphics and Applications� Vol.<br />
13� No. 4� pp. 41�49� 1993.<br />
�3� Becker� R.A.� Cleveland� W.S.� �Brushing Scatter�<br />
plots�� from Dynamic Graphics for Statistics �eds.<br />
W.S. Cleveland and M.E. McGill�� Wadsworth�<br />
Inc.� Belmont� CA� 1988.<br />
�4� Beddow� J.� �Shape coding of multidimension<strong>al</strong><br />
data on a microcomputer display�� Proceedings of<br />
Visu<strong>al</strong>ization �90� pp. 238 � 246� 1990.<br />
�5� Cherno�� H.� �The use of faces to represent points<br />
in k�dimension<strong>al</strong> space graphic<strong>al</strong>ly�� Journ<strong>al</strong> of the<br />
American Statistic<strong>al</strong> Association� Vol. 68� pp. 361�<br />
368� 1973.<br />
�6� Everitt� B.S.� Graphic<strong>al</strong> Techniques for Multivari�<br />
ate Data� Heinemann Education<strong>al</strong> Books� Ltd.�<br />
London� 1978.<br />
�7� Grinstein� G.� Pickett� R.� Williams� M.G.�<br />
�EXVIS� an exploratory visu<strong>al</strong>ization environ�<br />
ment�� Graphics Interface �89� 1989.<br />
�8� Inselberg� A.� Dimsd<strong>al</strong>e� B.� �Par<strong>al</strong>lel coordinates�<br />
a tool for visu<strong>al</strong>izing multidimension<strong>al</strong> geometry��<br />
Proceedings of Visu<strong>al</strong>ization �90� pp. 361 � 378�<br />
1990.<br />
�9� LeBlanc� J.� Ward� M.O.� Wittels� N.� �Exploring<br />
N�dimension<strong>al</strong> databases�� Proceedings of Visu<strong>al</strong>�<br />
ization �90� pp. 230 � 237� 1990.<br />
�10� Little�eld� R.J.� �Using the GLYPH concept<br />
to create user�de�nable display formats�� Proc.<br />
NCGA �83� pp. 697�706� 1983.<br />
�11� Mih<strong>al</strong>isin� T.� Gawlinski� E.� Timlin� J.� and<br />
Schwegler� J.� �Visu<strong>al</strong>izing multivariate functions�<br />
data� and distributions�� IEEE Computer Graph�<br />
ics and Applications� Vol. 11� pp. 28 � 37� 1991.<br />
�12� Tukey� J.W.� Fisherkeller� M.S.� Friedman� J.H.�<br />
�PRIM�9� an interactive multidimension<strong>al</strong> data<br />
display and an<strong>al</strong>ysis system�� in Dynamic Graph�<br />
ics for Statistics �W.S. Cleveland and M.E.<br />
McGill� eds.�� Wadsworth and Brooks� 1988.<br />
�13� Siegel� J.H.� Farrell� E.J.� Goldwyn� R.M.� Fried�<br />
man� H.P.� �The surgic<strong>al</strong> implication of physiologic<br />
patterns in myocardi<strong>al</strong> infarction shock�� Surgery�<br />
Vol. 72� pp. 126�141� 1972.<br />
�14� Smith� S.� Bergeron� R.D.� Grinstein� G.� �Stereo�<br />
phonic and surface sound generation for ex�<br />
ploratory data an<strong>al</strong>ysis�� Proc. CHI �90� Human<br />
Factors in Computer Systems� pp. 125�132� 1990.<br />
�15� Ward� M.O.� �N�dimension<strong>al</strong> brushes� gaining in�<br />
sights into relationships in N�D data�� submitted<br />
for publication� 1993.<br />
�16� Ward� M.O.� LeBlanc� J.T.� Tipnis� R.� �N�Land�<br />
a graphic<strong>al</strong> tool for exploring N�dimension<strong>al</strong> data��<br />
to be published in Proceedings of CG Internation<strong>al</strong><br />
�94� 1994.
Figure 1� The Detroit data using Scatterplots. Correlation between pairs of dimensions manifest themselves as<br />
linear structures.<br />
Figure 2� The Detroit data using the Star glyph representation. Key provides associations of dimensions with<br />
line orientation.
Figure 3� The Detroit data using the Par<strong>al</strong>lel Coordinates representation. Inverse correlations can be seen<br />
between the number of government workers versus the percent of cleared homicides� as well as between the<br />
percent of cleared homicides versus the number of homicides.<br />
Figure 4� Four�dimension<strong>al</strong> data set using dimension<strong>al</strong> stacking. The data consists of ore grades with three spati<strong>al</strong><br />
dimensions. Inner dimensions show ore grade and depth. Outer dimensions show longitude and latitude. Highest<br />
levels of ore grade are seen in the third to �fth sections horizont<strong>al</strong>ly and the sixth to eighth sections vertic<strong>al</strong>ly.
geƒi ƒ„…h‰X „��—�—� €�—��— „��˜����� †���—���—����<br />
ƒ��� iF €—���� ‚—�� ƒ—��—���<br />
€������� €�—��— €����� v—˜��—���� v—˜��—���� ��� †���������� —�� w�������<br />
€������� …���������D €�������D xt HVSSH ‚������ …���������D €��—�—�—�D xt HVVSS<br />
��—����d������F����F��� �—��—���d����—˜F�������F���<br />
e˜���—�<br />
y�� �� ��� ���� ����—����—� ������ �� �—����� ��E<br />
���� ����—�� �� ��� �������—����� �� ���˜����� ��—��E<br />
���� �˜������ �� �������E�—� ���—�—� �����������F<br />
€�—��— ���˜����� �� ���� �—�������� ���� — �������E<br />
�—� ����� �� ���� ��� �� ��� �������—���� —�� ���� ��E<br />
�������—���� �� ��� ��������� ���—�����F ‚���� ��E<br />
���������� �� —��������� —���� ���� ��� —���������<br />
—��—��� �� ���� �������—�� �������� ��� �—��<br />
���E�������� �—����� �����—����� —� ������—�� ����<br />
��� �������� �������—����� �� ��� ��������—F h��<br />
�� ��� �� ���������—� ��—�� ��—� @Q ��—��—�D P ��E<br />
�����A —�� ������ ������—� ��������D ����—���—���� ��<br />
���—� ��� ������������ ��� �����—���� �—�—F „��� �—E<br />
��� �������� ��� ����—���—���� ����� —�� �������� ����<br />
—�� ��—� ��� ������ �—� ˜��� �����—���D —���� ����<br />
��—� —� ˜� ��—���� —˜��� ���—�—� ���˜����� �������<br />
��� �������—� ˜������ ������D �����—���� —�� ����—���—E<br />
����F<br />
s����������<br />
e ��������� �—����—� �������� �� ��� ������ —��<br />
������—� ����������� �� �—����� ������ ������F<br />
€������ �—� �����������D —���� ’���—�—��4 —�� ���E<br />
����� ������ ������ ����� ���—�—˜�� �� ��� �����<br />
����� ������ �� ��—� —�� ����—�� ��� ���—�—� ��—��—<br />
���� ����—��� —� ������—����� ������ ��—� ��� ���F<br />
y�� �� ��� ���� ����—����—� ������ �� �—����� ������<br />
����—�� �� ��� �������—����� �� ���˜����� ��—������<br />
��������— �˜������ �� �������E�—� ���—�—��F „��� ��<br />
˜�—��� �� �� ��� ’���˜����� ��—������4 ���� —����<br />
�—������ —�� ������ �� ��—�� ��� �� ���� �—�����<br />
����F €�—��— ���˜����� �� ���� �—�������� ���� —<br />
��������—� ����� �� ���� ��� �� ��� �������—���� —��<br />
���� ���������—���� �� ��� ��������� ���—�����F s� —�E<br />
������D ����������—� ��—��������� �� ���—����� ��<br />
��� ��� ������ �� — ���—�—� —�� ���� �� ��� ��� ���<br />
��������� ���� ������—����� $ b IH ��†F „���D �����E<br />
�—� �����—���� ��—�� —� ������—�� ���� �� �—�� ˜��E<br />
��� �������—����� �� ��� ��—��— ��—������F e ���E<br />
������ ����� ��� ��—������ ����� ����� �����—��E<br />
���� �� ������ —�� �������� �������—����� �—� ��—�<br />
�� ���—��� �� ������ ����—���� �������D ˜��� ��<br />
���� ����� ����� ��� ���� —�� ������� �� — ��E<br />
���� ��—���F „� ���� ���D — ����� ���������—� @ ��<br />
���������—� ��—�� ��—�A ������—� ���������� �—���E<br />
�� �����—���� ��� ��� ����� ���—�—� ���˜����� �—�<br />
˜��� ���������‘I“F „�� ���������� ���—����� —�� —<br />
������ ��� �� ���—����� ������� ���� ��� †�—���E<br />
w—����� ���—����� ˜� ��—�� —���—���� ���� ��� ��� ��E<br />
��������D —�� ������� ���� ��� ���� —�� ��—� �—���<br />
�����—�� ��� �����˜��� ���—�—� ��—��—�‘PD Q“F „����<br />
�—���E�—�� �����—����� �� ������ �������� —� ���E<br />
��� ���—˜���� �� �—�— ���� ������� �� �—��� ����� ��E<br />
�������—� —��—�� �������� �� ����F †���—���—���� ����<br />
��—�� — ����—� ���� �� ����� ���� ��� ’�—�4 ������E<br />
�—� �������� �� ����� ������ ���—����� �� — ������ ��<br />
��������—� ����� ����—����� ��� �������—� ����������<br />
������F w��� ����—���—���� �� ���� ����� e†ƒ �� ƒqs<br />
i������� ���� ����—����� ������� —�� �������� @��<br />
�—��AF ƒ����� ��� Qh �—�— ���� �� �—����� �—��D ���E<br />
����—� ���������D —���—�����D �����—� �—�—D ��F —��<br />
—�� ���� �����—��� �� �—�� ����� ��� �� ��� �—��� —��<br />
������ �����—���� �—�—F<br />
g—��Eƒ���� ‚������<br />
q��������� ���—����� —�� —�—������ �� w—�����9�<br />
���—����� —�� x�����9� ���� �—� ������� ������ ��E<br />
��� �—�����E��E��� �����—���� ���������‘R“D ˜�� ����<br />
��������—�� �� ��—��—� —�� ������—� �—��� ����—���<br />
�������F „�� ���—����� —�� ������ ����� — ������E<br />
�—� �—�—������� ������ ���� ������� ��� ������˜��<br />
������˜����� ������� —���� �—����� ��—��������D ����<br />
���—��� ������� ��� ���˜�� �� �—������ ������ ��<br />
��� �����—����‘S“F „�� Qh ������—� ���������� �—�E<br />
���� �����—���� ���� � ������ �� — �—������� �—�—�E<br />
��� ������������D — IHPR ���� „������� w—�����<br />
g�����—���� g�������� w—���� S —� ��� e��—���<br />
g�������� v—˜��—����D v�� e�—��� x—����—� v—˜��—E<br />
����F i ���� —�� �—�—˜�� �—�����E��E��� —���������<br />
�—�� ˜��� ��������� ����� �—�—E�—�—���� �����—�����F
e ����—� ��� ���� — PST�PST�IPV ���� —�� V �������<br />
�—������ �� SIP ����� �� ��� gwESF g��������D �� ���<br />
gwES �� —�� ������� �� �����—���� — ���—�—� ���� —<br />
����� �—���� �� —�������—���� QHH ��� �����—���F ‡�<br />
�—�� �—� �������—˜�� ����� �������� ������—� ���<br />
������—���� ��—����� ������ �������˜����� �� ���—E<br />
�—� ��—��—�F ‚������ �� �� ��� �—��—��� �����—���<br />
˜—�������� ���� �������� �������� ˜� ����—� ������D<br />
—�� ���� ������—���� ���� ��� �������—� �—���—����<br />
�� ����� ������—� �����F „�� ������� ���˜����� ���E<br />
���� ���—��� ����—��� �� ��� ����—� ���� ��������‘I“<br />
—�� �—� ���� �����—� ��—����� —� ����� ����������—�<br />
���—���� ��—��������� ����� ˜��� ˜�—� ��������<br />
����������‘U“ —�� �� ��������‘V“F „��� �� ��� ���<br />
—�������� ˜������ ����������—� ��� ���—���� ��—E<br />
��������� —�� �—���E�—�� �������—� �����—����D —�� ��<br />
���� �����—����D ���� ������ ��� ������ ����� ��<br />
������ ���—����� @�� ����������D ���������D ���� � ���D<br />
��FAF p�� ���� ���˜���D ��� ������ �� —������ ���E<br />
�����—�� @�F�F �� �—����� ��� ������˜—�����AD ���<br />
���� ��� ���������� ���—���� �� ������D —�� ��� ���E<br />
����� —�� —������ —��—˜—�� @�F�F ��� ������� �—��<br />
—� ˜� ��������AF p����� I@—E�A ���� ������� ����<br />
��� Qh ������—� ���������� �����—���� �� —� ��� ���E<br />
���—���� ��—����� ������ ����—˜�����F p������ I@—E�A<br />
—�� Q@—E�A ���� ������—� —�� ������—� ����� �����E<br />
������ �� ��� ��������—�� �������—� @8A ��������—��� ��<br />
���� ������ ��� �������—� �—���—����F g���� ��—���<br />
—�� ����� �� p����� S @��� ���� ��—���AF e ����E<br />
��� ����—� �������� ����� ���� �����—� ����� �������E<br />
��—��� �� ���� —�� ���—��� ���� — ����—�� ��—�� ��E<br />
����� �� ��� ������—� �������� @eAF e� �������—������<br />
˜���� ������—��D ��� �������� ˜����� ���� ����E<br />
�—��� �� ��� �—��—� �������� @fEgAD ���� �—��� �����<br />
�����—��� ��������� ���������� ˜���� ����—˜��D —��<br />
— ��—������� �� ��� ���˜����� ��—����—�� ��—�� ����<br />
@hAF „������ Qh ����—���—���� �� �˜������ ��—� ���<br />
�—��—� �������� ˜����� ���� �����—��� ������ ���E<br />
����—� �—���—���� ���� ������ ���� —�—��F „� �—����<br />
�������� ���� � ��D — —���—���� �� ��� ������—� ����<br />
�� ������F „�� ��������—� ����—�—���� ��� ���� � ��<br />
�� ��—� ����� �� �������—� ������� �� ������ �� —��—E<br />
��� �—����—� ����—��D —�—� ���� ��� ������ ���� ���<br />
������ ������—���� ��—�����F<br />
e� —�������—� � ��D �������—��� �� �� ��� �����—�<br />
�����D �� ��� ���˜����� ����E�����—���� �� ���—� ���F<br />
„�� ’���—� �� ����4 ������� �� — �—��—� ������<br />
��� ���� �� ����—�� ������—��� —�� ������—���F „��<br />
���—� �� @— ������ �� ��� i�f �����AD �—� — ��������<br />
� �� �� ��� ���˜����� ������� ��� ��—� ��—������F<br />
p����� P@—E�A ���� ��� ������������ ������—� ����� ��<br />
8 ��������—��� �� ���� ������ ��� �������—� �—���—����<br />
���� ���—� �� � ���F s� ��� ���—�� ��—��D ��� �—��—�<br />
���—� �� ���� �����—���F ‡� ���� ��� ����—���—����<br />
�� ���� �������� ��� �����—� ���—���� ��������˜��<br />
��� ��� ��—������� �� ���� �—���� ������� ��—��F<br />
s� —������� �� ���˜—� �����—����� �� ��� ����� ���—E<br />
�—� ��—��— ������D �� �—�� ��������� — �����<br />
����� ���� �����—��� — ��—�� �—��—� —�� ������—� ����<br />
�� — �� ��˜� ������ �������F „��� ���—�� �� ��E<br />
��� �� �����—�� ��� ������� ��—��— ������ �����—��<br />
—�� ����� —����� ��� �����—�� ������‘T“F „�� �����E<br />
�—�� ������ �� —������ ���� ��� �—����� ��� �����D —�<br />
�� ��� ���˜�����D ���������� ��� �� — �—��� ���� �� ���<br />
��� ���� ��������F „���� ’ ���E����E���������4 ���E<br />
���—��� —�� �����������—� —�� ��� ����� ������� ����<br />
������ —���� ��� �—����� ��� �����D ���� Qh ����E<br />
—���—���� ˜����� �������—� �� ������������ ��� �������<br />
�� ��—� ��—�F p����� R@—EA ����� ��� ����� ���—�—�<br />
���˜—� �����—���� ���—��D ��� ��—� ��E��˜� ���—��D<br />
—�� ��� ��—� ��E��˜� ���—�� ������ ��� ���˜—� ��E<br />
�—�� �����������F<br />
p����� ‡���<br />
p����� ���� ���� ������ �������—���� ����<br />
������ ���—��� ��� —� —� �������� ������� �����<br />
���� — ��—���� ��������D —�� ��� � �� �� �—�����<br />
������˜—�����F ‡� ��—� �� �—�� ���—��� ��� �� ����—�E<br />
��—���� —�� ��—��� —���� �� ������� ��� �������—��E<br />
��� �� ��� �����—���� �—�—D ��� ��—���� ����� ����—E<br />
�������� �� �—�� ������� �� �� ��� ���—���� ˜������ ���<br />
�������� —�� 8 ���� ������ ��� ��—� ��—������F e�E<br />
����� —��— �� �������� �� �������� �—�� �—����� �����E<br />
—����� ���� �—� ˜� �—��� �����˜����� �� ��—������FF<br />
„� ˜����� �������—�� ���� ���—���� �� ��—� �� ���E<br />
�—���� ��� Qh ��� ���—����� —�� ��� �—����� ��—E<br />
��������F<br />
e�������������<br />
‡� ��—�� ���—˜��—���� tFgF g�������D ‡F‡F v��D iFtF †—E<br />
��� —�� xFtF —˜����F „��� ���� �� —� —� —���� �—�� �� ���<br />
�������� ���� x„€ ��������� ������� ��� r€gg s����—E<br />
����F g�������� �������� �������� ˜� ��� egvD vexv —��<br />
��� xi‚ƒgD vvxvF ƒ€ ��������� ˜� …ƒ hyi g����—� x�F<br />
hiEegHPEUTgryEQHUQF ‚ƒ �—� ��������� ˜� …ƒ hyi ��—��<br />
��F hiEpqHPEWQi‚PSIUWFeHHHF<br />
‚��������<br />
‘I“ ƒFiF €—����D ‡F‡F v�� —�� ‚FeF ƒ—�����D €���FD ‚��F v���F<br />
UI PHRP @IWWQAF<br />
‘P“ iFeF p����—� —�� vF g���D €���F p����� PS SHP @IWVPAF<br />
‘Q“ ‡F‡F v��D €���F p����� PT SST @IWVQAF<br />
‘R“ ‡F‡F v�� D tF g�����F €���F UPD PRQ @IWVUAF<br />
‘S“ ƒFiF €—���� —�� ‡F‡F v��D €���F p����� f S UU @IWWQAF<br />
‘T“ ƒFiF €—���� —�� ‡F‡F v��D €���F p����� f S UU @IWWQAF<br />
‘U“ ‚FtF p���D �� —�FD €���F ‚��F v���F UH QUQT @IWWQAF<br />
‘V“ iF w—���—�� —�� ‚F x—����—�D €���F ‚��F v���F UI IVRH<br />
@IWWQAF
p����� IX €�����—� ���� �� ��� ��������—�� �������—�<br />
��������—��� �� ���� ������ ��� �������—� �—���—���� ��<br />
— ���˜—� Qh ���������� �����—���� �� —� ��� ������—E<br />
���� ��—����� ������ ����—˜�����F<br />
p����� PX €�����—� ����� �� ��� ��������—�� �������—�<br />
��������—��� �� ���� ������ ��� �������—� �—���—����<br />
���� ��� �������� �� ��� ���—� �� � ���F
p����� QX „�����—� @ a HY %A ����� �� ��� ��������—��<br />
�������—� ��������—��� �� ���� ������ ��� �������—� �—�E<br />
��—���� �� — ���˜—� Qh ���������� �����—����F<br />
p����� RX g�����—����—� ���—��� ���� ��� �����—����<br />
���—�—� ��—��— ���˜����� —�� ��—������X @—A �����<br />
��� ����� ���—�—� ���˜—� ���—��D @˜A ����� ��� ��—�<br />
��E��˜� ���—��D —�� @A ����� ��� ��—� ��E��˜�<br />
���—�� ������ ��� ���˜—� ���—��F
Case Study: Visu<strong>al</strong>ization and Data An<strong>al</strong>ysis in Space and Atmospheric<br />
Science<br />
Abstract<br />
In this paper we show how SAVS, a tool for visu<strong>al</strong>ization<br />
and data an<strong>al</strong>ysis in space and atmospheric science,<br />
can be used to quickly and easily address problems<br />
that would previously have been far more laborious to<br />
solve. Based on the popular AVS package, SAVS presents<br />
the user with an environment tailored specific<strong>al</strong>ly<br />
for the physic<strong>al</strong> scientist. Thus there is minim<strong>al</strong><br />
"startup" time, and the scientist can immediately concentrate<br />
on his science problem. The SAVS concept readily<br />
gener<strong>al</strong>izes to many other fields of science and engineering.<br />
Overview<br />
Space and atmospheric scientists have long been<br />
faced with huge, continu<strong>al</strong>ly growing repositories of data<br />
from decades of spacecraft missions. The quantities of<br />
information involved are so enormous that tradition<strong>al</strong><br />
methods for data an<strong>al</strong>ysis and assimilation would quickly<br />
be overwhelmed. This situation is made <strong>al</strong>l the more<br />
critic<strong>al</strong> by unprecedented volumes of new data from<br />
modern, high-bandwidth experiments and by the<br />
widespread use of empiric<strong>al</strong> and large-sc<strong>al</strong>e computation<strong>al</strong><br />
methods for the synthesis of understanding across<br />
datasets and discipline boundaries. A new approach is<br />
clearly necessary.<br />
We are attempting to address this problem with<br />
SAVS (a Space and Atmospheric Visu<strong>al</strong>ization Science<br />
system). SAVS is a unique "pushbutton" environment<br />
A. Mankofsky, E.P. Szuszczewicz, and P. Blanchard<br />
Science Applications Internation<strong>al</strong> Corporation<br />
McLean, Virginia<br />
C. Goodrich, D. McNabb, and R. Kulkarni<br />
University of Maryland<br />
College Park, Maryland<br />
D. Kamins<br />
Advanced Visu<strong>al</strong> Systems<br />
W<strong>al</strong>tham, Massachusetts<br />
that mimics the logic<strong>al</strong> scientific process in data acquisition,<br />
reduction, and an<strong>al</strong>ysis without requiring a detailed<br />
understanding of the underlying software components; in<br />
effect, SAVS gives the physic<strong>al</strong> scientist access to highlevel<br />
function<strong>al</strong>ity, tailored to his particular needs, without<br />
requiring him to become a computer scientist as well<br />
[1]. SAVS provides (1) a customizable framework for<br />
accessing a powerful set of visu<strong>al</strong>ization tools, based on<br />
the popular AVS package, with hooks to PV-Wave and<br />
Khoros; (2) a set of mathematic<strong>al</strong> and statistic<strong>al</strong> an<strong>al</strong>ysis<br />
tools; (3) an extensible library of discipline-specific<br />
functions and models (providing, for example, satellite<br />
tracks and ionospheric parameters); and (4) capabilities<br />
for loc<strong>al</strong> and remote database access, including search,<br />
browse, and acquire functions.<br />
We begin this paper with a brief description of the<br />
SAVS architecture, its components, and its implementation;<br />
the focus is on the integration of visu<strong>al</strong>ization with<br />
mathematic<strong>al</strong> and statistic<strong>al</strong> models, advanced database<br />
techniques, and user interfaces for enabling enhanced<br />
acquisition, an<strong>al</strong>ysis, comparison, and understanding of<br />
both observation<strong>al</strong> and computation<strong>al</strong> data. Through the<br />
use of examples taken from current research in space<br />
science, we then demonstrate the applicability of the<br />
SAVS concept, with emphasis on the benefits of using an<br />
integrated visu<strong>al</strong>ization/data an<strong>al</strong>ysis tool. Fin<strong>al</strong>ly, we<br />
touch upon future directions for SAVS, paying particular<br />
attention to the extension of the SAVS paradigm beyond<br />
space and atmospheric science to other fields of science<br />
and engineering.
Visu<strong>al</strong>ization and methods<br />
The SAVS architecture recognizes that scientists and<br />
mission design engineers work routinely with data,<br />
theoretic<strong>al</strong> models, and orbits (including orbit<strong>al</strong> parameters,<br />
payload configuration, instrument fields-of-view,<br />
coordinated ground stations, etc.). At any given time<br />
they may work exclusively with one item, or with combinations<br />
of <strong>al</strong>l three. The most likely scenario involves<br />
an interactive, iterative combination of the three, filtered<br />
through a mathematic<strong>al</strong> interpreter and displayed through<br />
a broad set of visu<strong>al</strong>ization tools.<br />
SAVS is a "pushbutton" environment that mimics<br />
the thought processes of the scientist in data acquisition,<br />
reduction, and an<strong>al</strong>ysis. As such, SAVS has three entry<br />
concourses for daily activities: data, models, and experiment<br />
envelope. By selecting one of these entry points in<br />
the SAVS front end, the scientist begins a procedure<br />
utilizing SAVS-guided function<strong>al</strong>ity to exercise an<br />
unlimited number of loops in any given concourse or<br />
across concourses. The scientist can treat and overlay<br />
multiple model runs or datasets, and visu<strong>al</strong>ize the results<br />
in any number of formats.<br />
SAVS is based on the AVS visu<strong>al</strong>ization system, and<br />
<strong>al</strong>so makes use of numerous other modules and packages,<br />
both custom-written and public domain, to enable its<br />
distributed database access, physic<strong>al</strong> modeling,<br />
mathematic<strong>al</strong>, and statistic<strong>al</strong> function<strong>al</strong>ity. It supports a<br />
wide variety of standard data formats (HDF, CDF,<br />
netCDF, etc.), and provides a well-documented set of<br />
"hooks" so that users can easily include readers for other<br />
formats. The key point, for purposes of this paper, is that<br />
the familiar AVS user interface (most notably the<br />
network editor and its associated module libraries) is<br />
usu<strong>al</strong>ly hidden from the average SAVS user. Instead, the<br />
SAVS interface gives the user "pushbutton" entries into<br />
the three concourses described above, providing instant<br />
access to the wide variety of database, modeling,<br />
an<strong>al</strong>ysis, and visu<strong>al</strong>ization functions supported by the<br />
system. No knowledge of the methods, modules, and<br />
networks that actu<strong>al</strong>ly execute these functions is<br />
required. Thus SAVS is immediately accessible and useful<br />
to the scientist.<br />
Examples and discussion<br />
Mission planning<br />
We demonstrate the interactivity and extensibility of<br />
the SAVS concept with an application scenario that can<br />
be considered generic to any mission planning exercise,<br />
or indeed to any activity involving data reduction and<br />
an<strong>al</strong>ysis that requires (1) a number of models; (2)<br />
ground-based and spaceborne data; (3) in situ and remote<br />
sensing techniques; (4) perspectives on fluxtube-coupled<br />
domains; and (5) co-registration of satellite-borne and<br />
ground-based diagnostics.<br />
A typic<strong>al</strong> mission scenario is presented in Figure 1.<br />
This scenario has counterparts in sever<strong>al</strong> current NASA<br />
missions (e.g., CRRES, TIMED, ISTP) requiring the<br />
coordination of satellite passes with ground-based optic<strong>al</strong>,<br />
ionosonde, and radar diagnostics. The SAVS models<br />
concourse was used to generate the object in Figure 1a<br />
by overlaying (1) thermospheric winds (blue vectors) and<br />
oxygen densities (glob<strong>al</strong> color-coded surface) at 350 km<br />
using the WIND and MSIS library models; (2) auror<strong>al</strong><br />
ov<strong>al</strong> boundaries from the Feldstein library model; (3)<br />
<strong>al</strong>titude cut-planes of ionospheric densities from the IRI<br />
library model, in the latitudin<strong>al</strong> and longitudin<strong>al</strong> planes<br />
intersecting the coordinates of the Arecibo Observatory;<br />
and (4) geomagnetic field lines (in white) from the IGRF<br />
library model. The satellite trajectory was generated in<br />
the experiment envelope concourse using the CADRE-3<br />
library model.<br />
With button and di<strong>al</strong> controls, the user can (1) adjust<br />
the auror<strong>al</strong> ov<strong>al</strong> for any magnetic activity index or<br />
Univers<strong>al</strong> Time; (2) change the heights of the thermospheric<br />
wind and density c<strong>al</strong>culations; (3) vary the activity<br />
index A p , the solar F10.7 flux, and the day-of-year<br />
input drivers for WIND and MSIS; (4) <strong>al</strong>ter the year for<br />
the IGRF; (5) tune the month and sunspot number for the<br />
IRI; and (6) change the coordinates for the intersecting<br />
cut-planes (with interest, for example, in high latitude<br />
passes in conjunction with Sondrestrom radar operations<br />
in Greenland). The cut-planes could <strong>al</strong>so be in the<br />
magnetic E-W and N-S directions instead of being<br />
<strong>al</strong>igned with the geographic contours of latitude and longitude<br />
at the Arecibo Observatory.<br />
From the CADRE-3 orbit specifications the user can<br />
develop stack plots of any number of relevant parameters<br />
as a function of UT, latitude, longitude, MET, or LT.<br />
These parameters include SZA, MLAT, MLONG, MLT,<br />
L-shell v<strong>al</strong>ue, point of conjugacy, spacecraft velocity<br />
vector relative to the ambient magnetic field, height of<br />
the terminator relative to the satellite track, magnetic<br />
field v<strong>al</strong>ues or v<strong>al</strong>ues of its E-W or N-S components, and<br />
so on.<br />
The user can <strong>al</strong>so c<strong>al</strong>l up a 3D-to-1D module to<br />
interpolate model results <strong>al</strong>ong any segment of the satellite<br />
track. Through the data concourse, he can then<br />
compare the results with loc<strong>al</strong> or remote databases of<br />
<strong>al</strong>ong-track measurements.<br />
For co-registration with ground-based diagnostics,<br />
Figure 1b presents a zoomed-in perspective on the<br />
Arecibo site, including the projection of the groundbased<br />
HF radar beam up to an <strong>al</strong>titude of 400 km. That<br />
projection is developed and displayed with the SAVS<br />
"field-of-view" module, controllable by the user to
epresent any ground-based remote sensing diagnostics.<br />
The user need only input the coordinates of the ground<br />
site, the azimuth and elevation of the instrument's lineof-sight,<br />
and its beam width (or acceptance) h<strong>al</strong>f angles<br />
in the N-S and E-W directions.<br />
Inspection of Figure 1b shows that the satellite (the<br />
black sphere) at the given UT in its trajectory in not on a<br />
field line that connects to the region diagnosed by the<br />
ground-based radar. With animation and pause controls,<br />
the user can determine the exact time of the field line<br />
coupling and begin a number of SAVS-controlled<br />
operations. For example, the 3D-to-1D module can be<br />
used to interpolate ionospheric and thermospheric model<br />
densities, temperatures, and composition onto the<br />
connecting field line, and the model data used as input to<br />
c<strong>al</strong>culate fluxtube-integrated conductivities from the<br />
satellite to the region covered by the ground-based<br />
diagnostics. The module could <strong>al</strong>so be used to c<strong>al</strong>culate<br />
integrated densities or emissions <strong>al</strong>ong the field-of-view<br />
of the ground-based sensor. The field-of-view module<br />
can in turn be "attached" to the spacecraft to project and<br />
visu<strong>al</strong>ize the field-of-view of an on-board remote sensing<br />
device. In this case the animation and visu<strong>al</strong>ization<br />
products could focus on the determination of the time of<br />
intersection of the fields-of-view of the satellite and<br />
ground-based sensors.<br />
The scenarios are unlimited. Models can be tuned<br />
and retuned, and results visu<strong>al</strong>ized in simple stack plots<br />
of <strong>al</strong>ong-track correlations for comparisons with data.<br />
Visu<strong>al</strong>izations can include constant <strong>al</strong>titude surfaces of<br />
any geophysic<strong>al</strong> parameters; <strong>al</strong>ternately, the user can<br />
choose <strong>al</strong>titude cut-planes, isosurfaces, or isocontours.<br />
The "proper" visu<strong>al</strong>ization product is only determined by<br />
the perceptive and inquisitive scientific mind, with the<br />
freedom of the "pushbutton" operation of the SAVS system<br />
making the choices immediately available. One can<br />
only imagine how difficult this process would be without<br />
visu<strong>al</strong>ization tools (for example, requiring a mathematic<strong>al</strong><br />
an<strong>al</strong>ysis to determine the intersection of a particular<br />
flux tube with the field-of-view of a ground-based<br />
sensor), or if the scientist was required to become an<br />
AVS expert before he could an<strong>al</strong>yze his mission.<br />
Experiment<strong>al</strong> an<strong>al</strong>ysis<br />
As another example of the importance to the scientist<br />
of easily-accessible visu<strong>al</strong>ization and an<strong>al</strong>ysis tools,<br />
we consider a situation where the visu<strong>al</strong>ization products<br />
are not representations of data and model runs. Rather,<br />
they provide tests of model or <strong>al</strong>gorithmic integrity and<br />
time saving views of an experiment<strong>al</strong> scenario that facilitate<br />
determination of the shortest path in the process of<br />
data reduction and an<strong>al</strong>ysis. This is illustrated in a<br />
SAVS application to a rocket-borne chemic<strong>al</strong> release<br />
experiment in the NASA CRRES program that involved<br />
in situ and ground-based systems and aspects of coupled<br />
phenomena <strong>al</strong>ong geomagnetic field lines.<br />
Figure 2a shows a rocket trajectory <strong>al</strong>ong with an<br />
array of magnetic field vectors determined by the IGRF<br />
library model. The obvious discontinuity in the magnetic<br />
field representation immediately reve<strong>al</strong>ed a subtle<br />
problem in an interpolation module that might have gone<br />
undetected without this simple visu<strong>al</strong> aid.<br />
Figure 2b illustrates the application of SAVS<br />
visu<strong>al</strong>ization tools to help understand the actu<strong>al</strong><br />
configuration of the experiment. In the simplest<br />
description of the experiment scenario, a Ba/Li mixture<br />
in a se<strong>al</strong>ed canister was separated from the rocket's diagnostics<br />
payload, and the vaporized gases were released<br />
on the upleg portion of the trajectory at an <strong>al</strong>titude near<br />
180 km. The colored disk in the panel is a color-coded<br />
model depiction of the cloud's ion density in the plane<br />
perpendicular to the cloud's bulk velocity at a very early<br />
phase of the expansion process. The red line is the suborbit<strong>al</strong><br />
trajectory, and the long and short vectors are the<br />
magnetic field and payload velocities at the point of the<br />
release. The cone-shaped object is the projection of a<br />
ground-based HF heater beam intended to intercept the<br />
chemic<strong>al</strong> cloud at its ionospheric <strong>al</strong>titude, excite the<br />
electrons, and induce enhanced optic<strong>al</strong> emissions and<br />
plasma instability processes.<br />
The initi<strong>al</strong> process of understanding the actu<strong>al</strong> configuration<br />
of the experiment involved the following<br />
questions: (1) What were the magnitude and directions of<br />
the cloud's bulk velocity relative to the geomagnetic<br />
field? (2) How well was the chemic<strong>al</strong> release coupled<br />
<strong>al</strong>ong the magnetic field to the diagnostic payload? (3)<br />
How effectively did the heater beam intercept the cloud?<br />
(4) Was it possible to observe expanding cloud ions on<br />
the downleg portion of the trajectory?<br />
The first three questions were answered using the<br />
rotation and zooming tools in SAVS, with some of the<br />
image products presented in Figures 2c and 2d. The last<br />
question was answered with yet another rotation that<br />
projected an image perpendicular to the plane of the<br />
trajectory, with the downleg portion of the trajectory in<br />
the foreground. That image, presented in Figure 2c,<br />
shows that the magnetic field at the release site did<br />
indeed intersect the downleg trajectory. A simple hand<br />
sc<strong>al</strong>ing of <strong>al</strong>titude and range showed that the flux tube<br />
passing through the release missed the downleg<br />
trajectory by 13 km, however, a sufficiently great<br />
distance to minimize interest in searching the data for<br />
possible late-time ion signatures of the expansion process<br />
on the downleg trajectory.<br />
The entire exercise of answering the questions listed<br />
above required less than five minutes with SAVS.<br />
Without the visu<strong>al</strong>ization tools, the answers would have
equired the development of a number of mathematic<strong>al</strong><br />
<strong>al</strong>gorithms and a sequence of stack plots. That exercise<br />
could have taken sever<strong>al</strong> days. Once again, we see that<br />
visu<strong>al</strong>ization is a time saving and insightful element in<br />
the process of data reduction and an<strong>al</strong>ysis.<br />
The future<br />
The SAVS concept is designed for broad appe<strong>al</strong> and<br />
function<strong>al</strong>ity, since its architecture accommodates a gener<strong>al</strong><br />
scientific approach to data access, manipulation,<br />
an<strong>al</strong>ysis, and visu<strong>al</strong>ization. Every scientific discipline<br />
de<strong>al</strong>s with data, either in sc<strong>al</strong>ar, vector, or image format.<br />
Every discipline needs to develop, test, and apply empiric<strong>al</strong><br />
and first principle model descriptions of cause-effect<br />
relationships. Every science needs to de<strong>al</strong> with the spati<strong>al</strong><br />
and tempor<strong>al</strong> coordinates of datasets (gener<strong>al</strong>ly<br />
represented by a satellite's orbit<strong>al</strong> elements, payload<br />
configuration, and instrument fields-of-view in a space<br />
science application). And fin<strong>al</strong>ly, every scientific<br />
discipline requires a suite of mathematic<strong>al</strong> and statistic<strong>al</strong><br />
tools to handle data and prepare it for visu<strong>al</strong>ization. This<br />
is the generic system capability of SAVS, making it<br />
applicable to virtu<strong>al</strong>ly any scientific discipline.<br />
For a system such as SAVS to reach its full potenti<strong>al</strong><br />
there is the intrinsic need for scientists to open their<br />
minds to the broad spectrum of capabilities embedded in<br />
the visu<strong>al</strong>ization tools available today. Unfortunately,<br />
many scientists have been conditioned to regard data and<br />
model outputs as entities with inviolate properties that<br />
dictate the use of tradition<strong>al</strong> an<strong>al</strong>ysis techniques. This<br />
attitude must be abandoned for the full potenti<strong>al</strong> of visu<strong>al</strong>ization<br />
to be re<strong>al</strong>ized. Visu<strong>al</strong>ization is a rapidly developing<br />
field that holds great promise. But like any<br />
resource, it must be effectively mined and made accessible<br />
to its potenti<strong>al</strong> constituency.<br />
Acknowledgment<br />
This work was supported by the NASA Applied<br />
Information Systems Research Program (AISRP) under<br />
contract NAS5-32337.<br />
References<br />
[1] Szuszczewicz, E.P., A. Mankofsky, P. Blanchard, C.<br />
Goodrich, D. McNabb, and D. Kamins, "SAVS: A Space and<br />
Atmospheric Visu<strong>al</strong>ization Science System," in Visu<strong>al</strong>ization<br />
Techniques in Space and Atmospheric Sciences, E.P.<br />
Szuszczewicz and J. Bredekamp, eds., NASA Headquarters<br />
Publication, 1993 (and references therein).
A Case Study on Visu<strong>al</strong>ization for Boundary V<strong>al</strong>ue Problems<br />
G�abor Domokos Randy Pa�enroth<br />
Technic<strong>al</strong> University of Budapest University of Maryland<br />
Department of Strength of Materi<strong>al</strong>s Advanced Visu<strong>al</strong>ization Laboratory<br />
H�1521 Hungary College Park� MD� 20742<br />
tel� 011�36�1�1813798 tel� 301�405�4865<br />
fax� 011�36�1�1813798 fax� 301�314�9363<br />
e�mail� domokos�botond.me.bme.hu e�mail� redrod�avl.umd.edu<br />
Abstract<br />
In this paper we present a method� and a software<br />
based on this method� making highly inter�active visu�<br />
<strong>al</strong>ization possible for computation<strong>al</strong> results on nonlin�<br />
ear BVPs associated with ODEs. The program PCR<br />
relies partly on computer graphics tools and partly on<br />
re<strong>al</strong>�time computations� the combination of which not<br />
only helps the understanding of complex problems� it<br />
<strong>al</strong>so permits the reduction of stored data by orders of<br />
magnitude. The method has been implemented on PCs<br />
�running on DOS� and on the Application Visu<strong>al</strong>iza�<br />
tion System �AVS� for UNIX machines� this paper<br />
provides a brief introduction to the latter version be�<br />
sides describing the mathematic<strong>al</strong> background of the<br />
method.<br />
1 Introduction<br />
This paper is intended to describe a method� and<br />
a software based on this method� which may be very<br />
helpful when presenting� storing or trying to under�<br />
stand computation<strong>al</strong> results on nonlinear boundary�<br />
v<strong>al</strong>ue problems �BVPs� associated with ordinary dif�<br />
ferenti<strong>al</strong> equations �ODEs�. Such BVPs occur in var�<br />
ious �elds of applied mathematics� in mechanics� in<br />
particular in rod theory and <strong>al</strong>so in structur<strong>al</strong> engi�<br />
neering� <strong>al</strong>so in robotics� �nding optim<strong>al</strong> paths for a<br />
device. There are standard codes available �for exam�<br />
ple AUTO�Doedel 1986�� solving such BVPs� however�<br />
the problem is often that the huge data �les created<br />
by such a software are hard to store and even much<br />
harder to understand. The best tool to visu<strong>al</strong>ize such<br />
data are bifurcation diagrams which serve as �charts��<br />
interpreted in some parameter space. Such bifurcation<br />
diagrams can be extremely complicated� and relating<br />
them to the physic<strong>al</strong> behaviour of the system is a very<br />
hard task. Our method is based on the construction<br />
of a very speci<strong>al</strong> bifurcation diagram� which enables<br />
the user to identify instantaneously the physic<strong>al</strong> con�<br />
�gurations corresponding to the points of the diagram.<br />
In our software PCR this is re<strong>al</strong>ized simply by click�<br />
ing with the mouse on the desired point� in the adja�<br />
cent window the corresponding physic<strong>al</strong> con�guration<br />
would show up immediately. This kind of speci<strong>al</strong> di�<br />
agram <strong>al</strong>so helps to shrink the size of the stored data<br />
radic<strong>al</strong>ly� in some cases by sever<strong>al</strong> orders of magnitude.<br />
We will sketch the history of our research program<br />
in section 2� then outline brie�y the underlying deep�<br />
but well�known and non�technic<strong>al</strong> ideas from the the�<br />
ory of ODEs and dynamic<strong>al</strong> systems in Section 3.<br />
Athough these ideas might seem simple� it is non�<br />
trivi<strong>al</strong> to apply them to particular problems and even<br />
less so to build a code which re<strong>al</strong>izes them in an inter�<br />
active way. The code PCR has been implemented<br />
on Person<strong>al</strong> Computers running DOS� using Microsoft<br />
QuickBasic 4.5 and on UNIX workstations� using the<br />
Application Visu<strong>al</strong>ization System �AVS��1992�.<br />
2 Motivation and background<br />
This research was motivated by a project of Li and<br />
Maddocks �1994�� They constructed a mathematic<strong>al</strong><br />
model for DNA molecules �a homogeneous� elastic ring<br />
with circular cross section� and did extensive an<strong>al</strong>yt�<br />
ic<strong>al</strong> and numeric<strong>al</strong> studies on this model. The nu�<br />
meric<strong>al</strong> investigations were carried out with AUTO<br />
�Doedel� 1986�� a continuation code for BVPs associ�<br />
ated with ODEs. The data produced by AUTO ex�<br />
ceeded 1.5 Gbytes� <strong>al</strong>so� the produced bifurcation di�<br />
agrams were extremely di�cult to relate to the phys�<br />
ic<strong>al</strong> behavior of the ring. There were sever<strong>al</strong> conjec�<br />
tures related to the computation results� however� it<br />
was nearly impossible to check them �visu<strong>al</strong>ly�� due<br />
to the large amount of stored data and <strong>al</strong>so because<br />
points on the bifurcation diagram could not be iden�<br />
ti�ed with phyisic<strong>al</strong> con�gurations. At this stage we<br />
started to build a visu<strong>al</strong>ization tool which would per�
mit to reduce the size of the stored data and <strong>al</strong>so link<br />
the bifurcation diagram to the physic<strong>al</strong> con�gurations<br />
in an inter�active way. Our go<strong>al</strong> was to build a gen�<br />
er<strong>al</strong> visu<strong>al</strong>ization tool� adaptable to any BVP associ�<br />
ated with ODEs. We used ideas published earlier by<br />
Domokos �1994�. As a result� the package PCR was<br />
produced� running both on Person<strong>al</strong> Computers and<br />
<strong>al</strong>so on UNIX workstations. PCR helped to reduce<br />
the data size by a factor over 1000� it proved to be<br />
<strong>al</strong>so very helpful in an<strong>al</strong>yzing the dataset. We will<br />
indicate the application of PCR to the problem of Li<br />
and Maddocks �1994� in section 5.<br />
3 Mathematic<strong>al</strong> background� formula�<br />
tion of results<br />
Results in bifurcation problems are usu<strong>al</strong>ly pre�<br />
sented in the form of bifurcation diagrams. We are<br />
not aware of any gener<strong>al</strong> de�nition for �bifurcation di�<br />
agram�� in fact� depending on what purpose we have<br />
in mind� we may design rather di�erent kinds of bifur�<br />
cation diagrams. As examples we mention the widely<br />
applied method of using Fourier coe�cients as coor�<br />
dinates. Our present go<strong>al</strong> when designing bifurcation<br />
diagrams is threefold�<br />
1.� To create diagrams which are topologic<strong>al</strong>ly cor�<br />
rect� i.e. one point of the diagram corresponds to one<br />
solution of the BVP and vice versa� <strong>al</strong>so that the map�<br />
ping is continuous.<br />
2.� To create diagrams from which the physic<strong>al</strong> con�<br />
�gurations of the BVP can be easily reconstructed.<br />
3.� To minimize the amount of stored data.<br />
All three of the above criteria are met by the set of<br />
coordinates ��glob<strong>al</strong> coordinates�� to be described be�<br />
low.<br />
Glob<strong>al</strong> coordinates can be created for explicit ODEs<br />
satisfying the Lifschitz�condition� i.e. for ODEs which<br />
meet the requirements of the Uniqueness Theorem<br />
�Bieberbach� 1923�. Nearly <strong>al</strong>l applications in mechan�<br />
ics are �well�behaved� and f<strong>al</strong>l into this category.� For<br />
a rare exceptions see �Domokos 1993�.� For such well�<br />
behaved ODEs a semi�in�nite trajectory is completely<br />
and uniquely determined by the initi<strong>al</strong> conditions. For<br />
example� consider a linearly elastic cantilever beam�<br />
clamped at the left end and free at the right end sub�<br />
jected to the compressive force P �Fig.1�.<br />
The ODE describing the shape of the beam in terms<br />
of the slope � as a function of the arclength s was �rst<br />
described by Euler�<br />
� 00 � P sin��� � 0� �1�<br />
The trajectories of this equation are uniquely de�<br />
termined by the three sc<strong>al</strong>ars ��0�� � 0 �0� and P �the<br />
s=0<br />
deformed shape<br />
α( s)<br />
s=1<br />
trivi<strong>al</strong> shape<br />
Figure 1� The cantilever beam<br />
P<br />
α ’(0)<br />
Figure 2� Segment of the glob<strong>al</strong> bifurcation diagram<br />
for the cantilever beam.<br />
former being �true� initi<strong>al</strong> conditions� the latter one a<br />
parameter�. However� not <strong>al</strong>l trajectories are of inter�<br />
est for us� only those which meet the boundary condi�<br />
tions<br />
a� ��0� � 0<br />
b� � 0 �1� � 0<br />
P<br />
�2�<br />
Condition �2�a� eliminates one of the �variable� ini�<br />
ti<strong>al</strong> conditions as a constant� so <strong>al</strong>l trajectories which<br />
might meet the boundary conditions can be uniquely<br />
represented in the �� 0 �0�� P � plane. This plane has<br />
property 1�� i.e. one point of the plane corresponds to<br />
one trajectory and vice versa. The sc<strong>al</strong>ars � 0 �0� and<br />
P are the glob<strong>al</strong> coordinates for this BVP� the plane<br />
�space� spanned by them will be c<strong>al</strong>led the glob<strong>al</strong> rep�<br />
resentation space of the BVP. A �nite segment of the<br />
bifurcation diagram for the BVP �1�2� is illustrated in<br />
Fig.2 in the glob<strong>al</strong> representation space.<br />
Based on the example of the cantilever we can now<br />
de�ne the glob<strong>al</strong> coordinates of a two�point BVP as<br />
those �Cauchy�type� initi<strong>al</strong> conditions and parameters<br />
which are not �xed by the boundary conditions at the<br />
origin. The glob<strong>al</strong> representation space of the BVP<br />
is spanned by the glob<strong>al</strong> coordinates. �Domokos� 1994�<br />
The bifurcation diagram in the glob<strong>al</strong> representation<br />
space not only has the advantage that it is topologi�<br />
c<strong>al</strong>ly correct �Property 1��� it <strong>al</strong>so makes the recon�
M 0<br />
M 0<br />
"PARAMETER CURVE"<br />
CORRESPONDING<br />
PHYSICAL SHAPE<br />
P 0<br />
P<br />
POINT IDENTIFIED<br />
BY GRAPHICS TOOL<br />
P 0<br />
"REAL CURVE"<br />
α’(0)<br />
Figure 3� The double�window system of PCR<br />
struction of physic<strong>al</strong> shapes extremely simple �Prop�<br />
erty 2��. Take any point from the bifurcation diagram<br />
and add the remaining constant initi<strong>al</strong> condition �in<br />
out cantilever example� ��0� � 0� to obtain a com�<br />
plete set of initi<strong>al</strong> conditions. Running an IVP solver<br />
with these conditions regenerates the physic<strong>al</strong> shape<br />
instantly . This feature of the glob<strong>al</strong> bifurcation dia�<br />
gram dictates the basic idea of PCR� Have constantly<br />
two windows open on the screen. One window shows<br />
the bifurcation diagram �or a projection of it� and by<br />
some device we can locate points on this diagram. The<br />
other window instantly shows the corresponding phys�<br />
ic<strong>al</strong> shape. Such a con�guration is shown in Fig.3�<br />
This combination of graphics with re<strong>al</strong>�time com�<br />
puting is the key idea of PCR.<br />
If the dimension of the glob<strong>al</strong> representation space<br />
is more than 2 then we seemingly loose the topologic<strong>al</strong><br />
correctness since projection to the 2D s creen may<br />
result in spurious intersection points. However� such<br />
points may be eliminated� as pointed out in the next<br />
section. We remark that the bifurcation diagram in<br />
the glob<strong>al</strong> representation space requires minim<strong>al</strong> data<br />
storage� thus has property 3.<br />
4 Software implementation<br />
The software PCR was developed based on the<br />
above described method. PCR has two implementa�<br />
tions� a PC�DOS version� requiring 386DX�33 proces�<br />
sor and VGA graphic screen �or up�. A more sophisti�<br />
cated version is running on the Application Visu<strong>al</strong>iza�<br />
tion System �AVS� on UNIX workstations� this latter<br />
version o�ers better graphics and more �exibility. In<br />
this section we describe the main features character�<br />
istic for both versions.<br />
Our software is c<strong>al</strong>led PCR� which stands for�<br />
P arameter � Curve � Re<strong>al</strong>� The input for the soft�<br />
ware is an n�m matrix� n �number of rows� denoting<br />
the number of data points in the glob<strong>al</strong> representation<br />
space� m �number of columns� denoting the dimen�<br />
sions of this space. As described in section 2� each<br />
of the rows contains the set of initi<strong>al</strong> v<strong>al</strong>ues which<br />
are not set constant by the boundary�conditions at<br />
the origin. The integers m and n can be arbitrary.<br />
PCR <strong>al</strong>so needs an IVP solver routine for the speci�c<br />
BVP� there is an empty �slot� in the AVS network<br />
for that routine. After reading in the data �le� PCR<br />
opens up two graphic windows�according to the setup<br />
in Figure 2. A point on the parameter curve �bifur�<br />
cation diagram� can be selected by clicking with the<br />
mouse on the point. Given an n dimension<strong>al</strong> bifur�<br />
cation diagram� PCR <strong>al</strong>lows the user to choose any 3<br />
dimensions and display these. In higher dimension<strong>al</strong><br />
diagrams spurious intersection points may arise. PCR<br />
o�ers sever<strong>al</strong> tools to get rid of these points� In 4D<br />
the user may de�ne a �nonlinear� color map according<br />
to the 4th dimension. The user can <strong>al</strong>so de�ne a 2D<br />
subspace of the m�dimension<strong>al</strong> glob<strong>al</strong> representation<br />
space in which a rotation can be performed� removing<br />
the spurious intersection points.<br />
5 Summary<br />
In this paper we presented the theoretic<strong>al</strong> basis and<br />
description of the software PCR� intended for inter�<br />
active visu<strong>al</strong>ization of results on BVPs. This usage<br />
of the �glob<strong>al</strong> coordinates� de�ned in section 2� of�<br />
fers sever<strong>al</strong> advantages� It minimizes the size of the<br />
stored data� it provides a topologic<strong>al</strong>ly correct bifur�<br />
cation diagram and makes the re<strong>al</strong>�time reproduction<br />
of the physic<strong>al</strong> con�gurations possible. PCR o�ers a<br />
variety of inter�active tools to de<strong>al</strong> with the dataset<br />
in the glob<strong>al</strong> representation space. Its main feature is<br />
the simultaneous viewing of the bifurcation diagram<br />
and of the physic<strong>al</strong> con�guration corresponding to a<br />
user�de�ned point on this diagram. PCR <strong>al</strong>so o�ers<br />
sever<strong>al</strong> tools to understand higher�dimension<strong>al</strong> bifur�<br />
cation diagrams� including colorization and rotations<br />
in the higher dimension<strong>al</strong> space.<br />
The study of bifurcation diagrams with a tool like<br />
PCR might very often help reve<strong>al</strong>ing otherwise hidden<br />
features� such as connectivity of branches in the bifur�<br />
cation diagram� or� re<strong>al</strong>tionship between symmetries<br />
in the physic<strong>al</strong>� con�guration space and the glob<strong>al</strong> rep�<br />
resentation space� leading to deeper understanding of
the problem.<br />
In Fig. 5 we give an interesting example of appli�<br />
cation� torsion<strong>al</strong> buckling of a uniform� circular rod.<br />
PCR was running on data obtained by Li and Mad�<br />
docks �1994�. The glob<strong>al</strong> representation space is 4 di�<br />
mension<strong>al</strong> in this problem and is spanned by the initi<strong>al</strong><br />
moments M1� M2� M3 and the force F . Fig 4 shows the<br />
M1� M2� M3 projection of this diagram and one phys�<br />
ic<strong>al</strong> con�guration corresponding to the point identi�<br />
�ed on the bifurcation diagram. Without explaining<br />
it further� we would like to point out an interesting<br />
relationship between the bifurcation diagram and the<br />
physic<strong>al</strong> con�guration. The latter one is in unstressed<br />
state a circular ring� which has a continuous rotation<br />
symmetry group �c<strong>al</strong>led SO�2��. On the other hand�<br />
the bifurcation diagram reve<strong>al</strong>s an 8th order discrete<br />
symmetry group generated by the three re�ections to<br />
the coordinate planes �even apparent from this single<br />
picture�. How this two groups relate can be explored<br />
if one is able to investigate the phyisic<strong>al</strong> con�gurations<br />
corresponding to points which are mapped into each<br />
other by this discrete group. �This is c<strong>al</strong>led a group<br />
orbit.� PCR is optim<strong>al</strong>ly suited for such an investi�<br />
gation and� in fact� helped to explain the relationship<br />
between the two mentioned symmetry groups. We <strong>al</strong>so<br />
remark that in this problem PCR helped to reduce the<br />
size of the data �le by a factor of 100. We feel that<br />
problems of this complexity might be very hard to un�<br />
derstand without a tool like PCR.<br />
Acknowledgement<br />
The authors are happy to thank Professor John H.<br />
Maddocks for continuous encouragement and support<br />
during their work. This research was supported by the<br />
Dr Imre Kor�anyi Fellowship and the Hungarian Na�<br />
tion<strong>al</strong> Science Foundation grant No. F7690 �G.D.� and<br />
the ASSERT award from the Air Force O�ce of Scien�<br />
ti�c Research �R.C.P.�. The software PCR has been<br />
developed on hardware supplied from Digit<strong>al</strong> Equip�<br />
ment Corporation under a grant from the Scienti�c<br />
Innovators Program.<br />
References<br />
AVS� Inc. �1992�� AVS User�s Guide W<strong>al</strong>tham�<br />
Massechusetts<br />
Bieberbach� L. �1923�� Di�erenti<strong>al</strong>gleichungen<br />
Springer� Berlin<br />
Doedel� E. �1986�� AUTO 86 user manu<strong>al</strong> C<strong>al</strong>�<br />
tech�Dept. Applied Mathematics� Pasadena� C<strong>al</strong>�<br />
ifornia<br />
Domokos� G.� �1993�� Can strings<br />
buckle� AMD �Vol 167 �Recent development in<br />
stability� vibration and control of structur<strong>al</strong> sys�<br />
tems� ASME 1993� Applied Mechanics Division�<br />
ISBN 0�7918�1146�8� pp 167�174<br />
Domokos� G.� �1994�� Glob<strong>al</strong> Description of Elas�<br />
tic Bars ZAMM 74 �4� T289�T291<br />
Li� Y and Maddocks� J.H. �1994�� On<br />
The Computation of Spati<strong>al</strong> Equili bria of Elastic<br />
Rods Including E�ects of Self�Contact submit�<br />
ted for publication<br />
Figure 4� Bifuircation diagram and one physic<strong>al</strong> con�<br />
�guration of ring under torsion
Case Study: Severe Rainf<strong>al</strong>l Events in Northwestern Peru<br />
(Visu<strong>al</strong>ization of Scattered Meteorologic<strong>al</strong> Data)<br />
Lloyd A. Treinish<br />
IBM Thomas J. Watson Research Center, Yorktown Heights, NY<br />
lloydt@watson.ibm.com<br />
Abstract<br />
The ordinarily arid climate of coast<strong>al</strong> Peru is disturbed<br />
every few years by a phenomenon c<strong>al</strong>led El Niño, characterized<br />
by a warming in the Pacific Ocean. Severe rainstorms<br />
are one of the consequences of El Niño, which<br />
cause great damage. An examination of daily data from<br />
66 rainf<strong>al</strong>l stations in the Chiura-Piura region of northwestern<br />
Peru from late 1982 through mid-1983 (associated<br />
with an El Niño episode) yields information on the mesosc<strong>al</strong>e<br />
structure of these storms. These observation<strong>al</strong><br />
data are typic<strong>al</strong> of a class that are scattered at irregular locations<br />
in two dimensions. The use of continuous re<strong>al</strong>ization<br />
techniques for qu<strong>al</strong>itative visu<strong>al</strong>ization (e.g., surface<br />
deformation or contouring) requires an intermediate<br />
step to define a topologic<strong>al</strong> relationship between the locations<br />
of data to form a mesh structure. Sever<strong>al</strong> common<br />
methods are considered, and the results of their application<br />
to the study of the rainf<strong>al</strong>l events are an<strong>al</strong>yzed.<br />
Introduction<br />
The climate of coast<strong>al</strong> Peru and southwestern Ecuador<br />
is mainly controlled by the Humboldt current, a cold<br />
ocean current which travels northward <strong>al</strong>ong the coastline<br />
of Chile and Peru before dispersing near the equator. The<br />
current helps cause dry conditions to persist continuously<br />
<strong>al</strong>ong the Peruvian littor<strong>al</strong>, making the land strip between<br />
the Andes and the Pacific Ocean one of the most arid<br />
deserts in the world. Every few years this condition is disturbed<br />
by a phenomenon c<strong>al</strong>led El Niño, characterized by<br />
an ocean warming which appears off the coastlines of<br />
northwestern Peru and southwestern Ecuador. This warming<br />
modifies the Humboldt current destroying the persistent<br />
high pressure zone norm<strong>al</strong>ly induced by the<br />
Humboldt on the west side of the Andes, which in turn<br />
generates major changes in the loc<strong>al</strong> meteorology and<br />
climate [13]. Excessive and severe rainstorms are the<br />
most disastrous consequences of El Niño, and such storms<br />
can cause great damage to human life, property, crops, and<br />
anim<strong>al</strong> life. The rainf<strong>al</strong>l from such episodes causes the<br />
flooding of existing rivers, huaycos (mudslides), and the<br />
sudden creation of new rivers and lakes.<br />
The 1982-1983 El Niño has received wide attention<br />
for its severity [10]. In Peru <strong>al</strong>one, it was responsible for<br />
much loss of life, damage affecting over 80% of the<br />
highway system, railroad washouts, and materi<strong>al</strong> loss estimated<br />
in the billions of dollars. The heating of the ocean<br />
off the Peruvian coast during El Niño periods has <strong>al</strong>so<br />
caused the loss of much marine life. For example, the El<br />
Niño of 1972 virtu<strong>al</strong>ly destroyed the Peruvian anchovy<br />
fishing industry, which at that time represented a significant<br />
percentage of the world's protein supply with a catch<br />
of about 12 million tons per year [11]. Such destruction<br />
emphasizes the need to better understand the meteorologic<strong>al</strong><br />
forces unleashed by this powerful ocean-air interaction.<br />
Goldberg et <strong>al</strong> [6] have investigated the mesosc<strong>al</strong>e<br />
structure of severe rainf<strong>al</strong>l events during the 1982-1983<br />
period by examining daily data from 66 rainf<strong>al</strong>l stations in<br />
the Chiura-Piura region of northwestern Peru. Figure 1<br />
shows the location of this region, which was selected because<br />
it was most severely affected by the 1982-1983 El<br />
Niño and because the data were highly reliable and complete.<br />
Figure 1. Location of Peruvian Rainf<strong>al</strong>l Stations.<br />
These data support the study of rainf<strong>al</strong>l characteristics over<br />
this loc<strong>al</strong>ized region during El Niño and non-El Niño periods,<br />
as a function of elevation, geographic location, and<br />
time of year.<br />
Treatment of scattered data<br />
The data from the rainf<strong>al</strong>l stations are typic<strong>al</strong> of observation<strong>al</strong><br />
data that are scattered at irregular locations in<br />
two or three dimensions (i.e., data with no notion of connectivity<br />
or topology). Figure 2 is representative of a<br />
straightforward discrete re<strong>al</strong>ization of such data as a scatter<br />
plot to show the spati<strong>al</strong> distibution. Figure 3 illustrates<br />
the tempor<strong>al</strong> distribution for a single station.
Figure 2. Spati<strong>al</strong> Distribution of Peruvian Rainf<strong>al</strong>l<br />
Measurements on January 26, 1983.<br />
Although such techniques preserve the fidelity of the<br />
data, they fail to impart qu<strong>al</strong>itative information about the<br />
spati<strong>al</strong> characteristics of the measurements or the phenomena<br />
of which they represent discrete samples. Thus, the<br />
application of continuous re<strong>al</strong>ization techniques (e.g., surface<br />
deformation or contouring for two-dimension<strong>al</strong> data,<br />
volume rendering or surface extraction for three-dimension<strong>al</strong><br />
data) is necessary. An intermediate step of defining<br />
a topologic<strong>al</strong> relationship between the locations of data to<br />
form a mesh structure is required. Convention<strong>al</strong> continuous<br />
re<strong>al</strong>ization techniques can then be applied to such a<br />
mesh. There is a long history of mathematic<strong>al</strong> methods<br />
to create such meshes. Each method does change the data<br />
and their artifacts must be understood because they will<br />
carry through to the actu<strong>al</strong> visu<strong>al</strong>ization. This discussion<br />
is only meant as a very brief introduction to the topic.<br />
Nielson [8] summarizes many of the methods in use today<br />
and their relative advantages and disadvantages.<br />
Figure 3. Time History Plot of Rainf<strong>al</strong>l Measurements at Chulucanas, Peru with January 26, 1983<br />
Highlighted.<br />
The simplest and quickest approach is to create a regular<br />
grid from the point data by nearest neighbor meshing -find<br />
the nearest point to each cell in the resultant grid and<br />
assign that cell the point's v<strong>al</strong>ue as illustrated in Figure 4.<br />
Such a technique is v<strong>al</strong>uable because it preserves the origin<strong>al</strong><br />
data v<strong>al</strong>ues and distribution of a grid after a coordinate<br />
transformation may have taken place on a collection of<br />
points. Although computation<strong>al</strong>ly inexpensive, the results<br />
may not be very suitable for qu<strong>al</strong>itative display because of<br />
the preservation of the discrete spati<strong>al</strong> structure.<br />
Ungridded<br />
Points<br />
Gridded<br />
Figure 4. Nearest Neighbor Gridding.
An <strong>al</strong>ternate approach that preserves the origin<strong>al</strong> data<br />
v<strong>al</strong>ues involves imposing an unstructured grid dependent on<br />
the distribution of the scattered points. In two dimensions,<br />
this would be a method for triangulating a set of scattered<br />
points in a plane [2]. This technique first requires the<br />
Voronoi tesselation of the plane with a polygon<strong>al</strong> tile surrounding<br />
each of the scattered points. These tiles are such<br />
that the locus of <strong>al</strong>l points within a particular tile are closer<br />
to the scattered point associated with that tile than they are<br />
to any other points in the set. A triangulation can then be<br />
constructed which is the du<strong>al</strong> of the Voronoi tesselation<br />
(i.e., connecting a line between every pair of points whose<br />
tiles share edges). This is known as Delauney triangulation<br />
and is illustrated in Figure 5 as applied to the rainf<strong>al</strong>l<br />
stations.<br />
Figure 5. Delauney Triangulation of Rainf<strong>al</strong>l<br />
Stations.<br />
For a relatively random distribution of a sm<strong>al</strong>l number<br />
of points such as these rainf<strong>al</strong>l data, the application of continuous<br />
re<strong>al</strong>ization techniques to the triangulated mesh does<br />
not yield useful qu<strong>al</strong>itative results. Consider Figure 6, in<br />
which the mesh from Figure 5 is pseudo-colored by<br />
amount of rainf<strong>al</strong>l. The rendering process applies bilinear<br />
interpolation to the v<strong>al</strong>ue at each node to determine the<br />
color of each pixel in the image. Although the origin<strong>al</strong><br />
data are preserved, the sparseness of the points results in a<br />
pseudo-colored distribution that is difficult to interpret.<br />
A potenti<strong>al</strong>ly more appropriate method, and certainly<br />
one that is more accurate than nearest neighbor meshing,<br />
uses weighted averaging as illustrated in Figure 7. For any<br />
given cell in a grid, the weighted average of the n nearest<br />
v<strong>al</strong>ues in the origin<strong>al</strong> data distribution spati<strong>al</strong>ly nearest to<br />
that cell is chosen. A weighting factor, w i = f(d i), where d i<br />
is the distance between the cell and the ith (i = 1 , …, m)<br />
point in the origin<strong>al</strong> distribution, is applied to each of the<br />
n v<strong>al</strong>ues. Figure 7 illustrates the case where n = 3. A<br />
common weight is w = d -2. These are variants of Shepard's<br />
method [15]. For example, Renka [14] modified this approach<br />
with loc<strong>al</strong> adaptive surface fitting. Collectively,<br />
these methods are typic<strong>al</strong>ly O[nlog(n)] in cost.<br />
Intermediate in qu<strong>al</strong>ity and computation<strong>al</strong> expense would be<br />
using linear instead of weighted averaging.<br />
Ungridded<br />
Points<br />
Interpolator<br />
Gridded<br />
Figure 7. Weighted Average Gridding<br />
All methods in the aforementioned class do introduce<br />
<strong>al</strong>iasing or smoothing of the data to achieve a gridded structure.<br />
The form of the interpolation may <strong>al</strong>so impart artifacts<br />
on the results depending on the relative spati<strong>al</strong> variability<br />
of the origin<strong>al</strong> data vs. how close the interpolant<br />
function may be able to model that structure. Given a go<strong>al</strong><br />
of qu<strong>al</strong>itative visu<strong>al</strong>ization, such artifacts may be acceptable.<br />
Figure 8 shows a regular mesh with spacing of 0.04<br />
degree (of latitude and longitude), onto which the rainf<strong>al</strong>l<br />
data for January 26, 1983 has been gridded using d-2 weighting for n = 5. The mesh and the data locations have<br />
been similarly pseudo-colored. There is good, but NOT<br />
perfect correspondence between the origin<strong>al</strong> data v<strong>al</strong>ues and<br />
that of the interpolated grid, sufficient for qu<strong>al</strong>itative re<strong>al</strong>ization.<br />
From this grid isocontour lines of constant rainf<strong>al</strong>l<br />
every 25 mm and a pseudo-colored image are created as<br />
shown in Figures 9 and 10, respectively.<br />
Figure 9. Isocontour Lines of Rainf<strong>al</strong>l from<br />
Weighted Average Gridding of Stations.<br />
Implementation<br />
The techniques described herein have been developed<br />
with the IBM Visu<strong>al</strong>ization Data Explorer (DX), a gener<strong>al</strong>purpose<br />
software package for scientific data visu<strong>al</strong>ization<br />
and an<strong>al</strong>ysis. It employs a data-flow-driven client-server<br />
execution model and is currently available on Unix workstations<br />
from Sun, Silicon Graphics, Hewlett-Packard,<br />
IBM, DEC and Data Gener<strong>al</strong> [7]. DX provides tools for<br />
operating on both scattered and gridded data. The DX<br />
Connect module performs the Delauney triangulation used<br />
in Figures 5 and 6 while the Regrid module performs the<br />
weighted average interpolation used in Figures 8, 9 and 10.
The Regrid module provides independent control of the exponent<br />
of the weighting factor, the size of n and the radius<br />
of influence from each node of the grid within which to<br />
consider data points. In this case a radius of 0.36 degree (of<br />
latitude and longitude) was used. It should be noted that for<br />
each day of data, not <strong>al</strong>l stations have rainf<strong>al</strong>l measurements.<br />
This is NOT the same as a station reporting no<br />
rain. DX supports a notion of data inv<strong>al</strong>idity. Hence, for<br />
any given day, only those stations having measurement are<br />
considered by both the Connect and Regrid modules in creating<br />
gridded versions of the data. The choice of modules<br />
that support continuous re<strong>al</strong>ization is independent of the<br />
use of Connect or Regrid even though they result in different<br />
mesh structures because these DX operations are polymorphic.<br />
These tools were used to create a DX application<br />
that supports the study of the rainf<strong>al</strong>l data, which is shown<br />
in Figure 11.<br />
Results<br />
The detailed results of these an<strong>al</strong>yses are presented by<br />
Goldberg et <strong>al</strong> [6]. The data have shown that enhanced<br />
rainf<strong>al</strong>l during El Niño can be divided into two categories;<br />
first, a gener<strong>al</strong> increase in background levels over non-El<br />
Niño periods and second, sporadic bursts of intense rainf<strong>al</strong>l<br />
superimposed over the enhanced background levels (cf.,<br />
Figure 3). It is these sporadic bursts which were most responsible<br />
for the great damage during the 1982-1983 El<br />
Niño episode.<br />
The data further show that the severe storms (or bursts)<br />
often originate near the Andean foothills and may be induced<br />
by the interaction of rainbands moving inland from<br />
the coast with mountain downslope winds. This is best<br />
shown with a time sequence during such an event. Figures<br />
12 and 13 illustrate the distribution of rainf<strong>al</strong>l for January<br />
24-27, and May 19-22, 1983, respectively, when a severe<br />
series of storms took place. The gridding process described<br />
earlier is used to create a pseudo-colored mesh independently<br />
for each day. The mesh is deformed by the <strong>al</strong>titude<br />
at each node, which is determined from the same gridding<br />
process applied to the <strong>al</strong>titude of each station. This deformed<br />
surface gives a reasonable approximation of the topography<br />
in northwestern Peru, especi<strong>al</strong>ly given the<br />
paucity of high-resolution elevation data for this region.<br />
Conclusions and future work<br />
The characteristic topography near regions such as<br />
Chulucanas (roughly in the center, cf., Figures 3, 11, 12<br />
and 13), where such storms were observed to occur on a<br />
frequent basis, is ide<strong>al</strong> for the aforementioned interaction<br />
between the rainbands and the Andean foothills. The origin<br />
of the east-west rainbands near the north Peruvian coast is<br />
less clear but may be caused by low <strong>al</strong>titude wind surges,<br />
which are driven northward <strong>al</strong>ong the coast of Peru by a<br />
large and quasi-permanent high in the southeastern Pacific.<br />
Investigation of the applicability of other methods of<br />
gridding scattered data will be considered for these and similar,<br />
but larger sets of meteorologic<strong>al</strong> data [1], [3], [4], [5],<br />
[9], [12], [16] and [17].<br />
Acknowledgments<br />
The data are available courtesy of NASA/Goddard<br />
Space Flight Center, Greenbelt, Maryland.<br />
References<br />
[1] Alfeld, P. "Scattered Data Interpolation in Three or<br />
More Variables". Mathematic<strong>al</strong> Methods in Computer<br />
Aided Geometric Design, Academic Press, pp. 1-33,<br />
1989.<br />
[2] Agishtein and Migd<strong>al</strong>. "Smooth surface reconstruction<br />
from scattered data points". Computer Graphics<br />
(UK), 15, n. 1, pp. 29-39, 1991.<br />
[3] Akima, H. "A Method of Bivariate Interpolation and<br />
Smooth Surface Fitting for Irregularly Distributed Data<br />
Points". ACM Transactions on Mathematic<strong>al</strong><br />
Software, 4, 2, pp. 148-159, June 1978.<br />
[4] Hardy, R. L. "Multiquadric Equations of Topography<br />
and Other Irregular Surfaces". Journ<strong>al</strong> of Geophysic<strong>al</strong><br />
Research, 76, n. 8, pp. 1905-1915, March 10, 1971.<br />
[5] Gmelig-Meyling, R. H. J. and P. R. Pfluger. "Smooth<br />
Interpolation to scattered data by bivariate piecewise polynomi<strong>al</strong>s<br />
of odd degree". Computer Aided Geometric<br />
Design, 7, pp. 439-458, 1990.<br />
[6] Goldberg, R.A., G. Tisnado M. and R. A. Scofield.<br />
"Characteristics of Extreme Rainf<strong>al</strong>l Events in Northwestern<br />
Peru during the 1982-1983 El Niño Period". Journ<strong>al</strong> of<br />
Geophysic<strong>al</strong> Research, 92, C13, pp. 14225-14241,<br />
1987.<br />
[7] Lucas, B., G. D. Abram, N. S. Collins, D. A. Epstein,<br />
D. L. Gresh and K. P. McAuliffe. "An Architecture for a<br />
Scientific Visu<strong>al</strong>ization System". Proceedings IEEE<br />
Visu<strong>al</strong>ization '92, pp. 107-113, October 1992.<br />
[8] Nielson, G. M. "Scattered Data Modeling". IEEE<br />
Computer Graphics and Applications, 13, n. 1. pp.<br />
60-70, January 1993.<br />
[9] Perillo, G.M.E. and M. C. Piccolo. "An interpolation<br />
method for estuarine and oceanographic data". Computers<br />
and Geosciences, 17, n. 6, pp. 813-820, 1991.<br />
[10] Philander, S. G. H. "Anom<strong>al</strong>ous El Niño of 1982-<br />
1983". Nature, 305, p. 16, 1983.<br />
[11] Quinn, W. H., D. O. Zopf, K. S. Short and R. T. W.<br />
Kuo-Yang. "Historic<strong>al</strong> Trends and Statistics of the Southern<br />
Oscillation, El Niño, and Indonesian Droughts". Fishery<br />
Bulletin, 76, p. 663, 1978.<br />
[12] Ramstein, G. "An Interpolation Method for<br />
Stochastic Models". Proceedings Eurographics '90,<br />
pp. 353-365, 1990.<br />
[13] Rasmusson, E. M. "El Niño and Variations in<br />
Climate". American Scientist, 73, 168, 1985.<br />
[14] Renka, R. J. "Multivariate interpolation of large<br />
sets of scattered data". ACM Transactions on<br />
Mathematic<strong>al</strong> Software, 14, 2, pp. 139-148, June 1988.<br />
[15] Shepard, D. "A Two-dimension<strong>al</strong> interpolation function<br />
for irregularly-spaced data". Proceedings 23rd<br />
Nation<strong>al</strong> ACM Conference, pp. 517-524, 1968.<br />
[16] Smith, W. F. and P. Wessel. "Gridding with continuous<br />
curvature splines in tension". Geophysics, 3, pp. 293-<br />
305, 1990.<br />
[17] Yue-sheng, L. and G. Lü-tai. "Bivariate Polynomi<strong>al</strong><br />
Natur<strong>al</strong> Spline Interpolation to Scattered Data". Journ<strong>al</strong> of<br />
Computation<strong>al</strong> Mathematics, 8, n.2, pp. 135-146,<br />
1990.
Figure 6. Pseudo-Colored Rainf<strong>al</strong>l Distribution<br />
from Delauney Triangulation.<br />
Figure 10. Pseudo-Colored Rainf<strong>al</strong>l from<br />
Weighted Average Gridding of Stations.<br />
Figure 12. Rainf<strong>al</strong>l Distribution in Northwestern<br />
Peru on January 24-27, 1983.<br />
Figure 8. Pseudo-Colored Mesh from Weighted<br />
Averaging and Rainf<strong>al</strong>l Stations.<br />
Figure 11. User Interface of a DX-based<br />
Application for Studying Peruvian Rainf<strong>al</strong>l Data.<br />
Figure 13. Rainf<strong>al</strong>l Distribution in Northwestern<br />
Peru on May 19-22, 1983.
Appendix. Alphabetic<strong>al</strong> Listing of Rainf<strong>al</strong>l Stations and Coordinates.<br />
Name Number Latitude Longitude Altitude<br />
(°S) (°W) (m)<br />
ALTAMIZA 29 5.07 79.73 2600<br />
ANIA 17 4.85 79.48 2450<br />
ARANZA 16 4.85 79.58 1300<br />
ARDILLA 40 4.52 80.43 150<br />
ARENALES 8 4.92 79.85 3010<br />
ARRENDAMIENTOS 57 4.83 79.90 3010<br />
AUL 42 4.55 79.70 640<br />
AYABACA 2 4.63 79.72 2700<br />
BARRIOS 33 5.28 79.70 310<br />
BERNAL 36 5.47 80.73 32<br />
BIGOTE 34 5.33 79.78 200<br />
CANCHAQUE 35 5.37 79.60 1200<br />
CHALACO 25 5.03 79.80 2250<br />
CHIGNIA 60 5.60 79.70 360<br />
CHILACO 3 4.70 80.50 90<br />
CHULUCANAS 9 5.10 80.17 95<br />
CHUSIS 37 5.52 80.82 12<br />
CIRUELO 64 4.30 80.15 202<br />
CORPAC 15 5.20 80.62 49<br />
ESPINDOLA 49 4.63 79.50 2300<br />
FRIAS 20 4.93 79.93 1700<br />
HUANCABAMBA 68 5.23 79.43 1052<br />
HUAR HUAR 62 5.08 79.47 3150<br />
HUARA DE VERAS 47 4.58 79.57 1680<br />
HUARMACA 14 5.57 79.52 2100<br />
JILILI 46 4.58 79.80 1330<br />
LA ESPERANZA 7 4.92 81.07 12<br />
LA TINA 1 4.40 79.95 427<br />
LAGARTERA 54 4.73 80.07 307<br />
LAGUNA RAMON 59 5.55 80.67 9<br />
LAGUNA SECA 19 4.88 79.48 2450<br />
LANCONES 45 4.57 80.47 110<br />
LAS LOMAS 66 4.65 80.25 265<br />
Name Number Latitude Longitude Altitude<br />
(°S) (°W) (m)<br />
LOS ALISOS 21 4.97 79.53 2150<br />
MALLARES 6 4.85 80.73 45<br />
MIRAFLORES 11 5.17 80.62 30<br />
MONTEGRANDE 13 5.35 80.72 27<br />
MONTERO 48 4.63 79.83 1070<br />
MORROPON 10 5.18 79.98 140<br />
NANGAY DE MATALACAS 18 4.87 79.77 2100<br />
OLLEROS 53 4.70 79.65 1360<br />
PACAYPAMPA 23 5.00 79.67 1960<br />
PAITA 67 5.08 81.13 6<br />
PALOBLANCO 28 5.05 79.63 2800<br />
PALTASHACO 30 5.12 79.87 900<br />
PANANGA 43 4.55 80.88 450<br />
PARAJE GRANDE 65 4.63 79.92 1500<br />
PASAPAMPA 31 5.12 79.60 2410<br />
PICO DEL ORO 41 4.53 79.87 1325<br />
PIRGA 61 5.67 79.62 1510<br />
PUENTE INTERNACIONAL 63 4.38 79.95 408<br />
SAN JOAQUIN 32 5.13 80.35 100<br />
SAN MIGUEL 12 5.23 80.68 29<br />
SAN PEDRO 27 5.08 80.03 254<br />
SANTO DOMINGO 24 5.03 79.87 1475<br />
SAPILLICA 56 4.78 79.98 1446<br />
SAUSAL DE CULUCAN 4 4.75 79.77 980<br />
SICCHEZ 44 4.57 79.77 1435<br />
SUYO 39 4.50 80.00 250<br />
TACALPO 50 4.65 79.60 2010<br />
TALANEO 26 5.05 79.55 3430<br />
TAPAL 55 4.77 79.55 1890<br />
TEJEDORES 5 4.75 80.25 230<br />
TIPULCO 52 4.70 79.57 2600<br />
VADO GRANDE 38 4.45 79.60 900<br />
VIRREY 58 5.53 79.98 230
Please reference the following animation located in the MPG directory:<br />
RAINFALL.MPG 242-frame animation (November 1, 1982 through<br />
June 30, 1983) of the daily rainf<strong>al</strong>l distribution in<br />
northwestern Peru (MPEG-1).<br />
Copyright © 1994 by IBM Thomas J. Watson Research Center
Case Study: Visu<strong>al</strong>ization of Mesosc<strong>al</strong>e Flow Features in Ocean Basins<br />
Andreas Johannsen Robert Moorhead<br />
andreas@erc.msstate.edu rjm@erc.msstate.edu<br />
NSF <strong>Engineering</strong> Research Center for Computation<strong>al</strong> Field Simulation<br />
P.O. Box 6176, Mississippi State University, Mississippi State, MS 39762<br />
Abstract<br />
Environment<strong>al</strong> issues such as glob<strong>al</strong> warming are an<br />
active area of internation<strong>al</strong> research and concern today.<br />
This case study describes various visu<strong>al</strong>ization paradigms<br />
that have been developed and applied in an attempt to elucidate<br />
the information provided by environment<strong>al</strong> models and<br />
observations. The ultimate go<strong>al</strong> is to accurately measure the<br />
existence of any long term climatologic<strong>al</strong> change. The glob<strong>al</strong><br />
ocean is the starting point, since it is a major source and<br />
sink of heat within our glob<strong>al</strong> environment.<br />
Introduction<br />
The NSF <strong>Engineering</strong> Research Center (ERC) for<br />
Computation<strong>al</strong> Field Simulation at Mississippi State University<br />
was established in 1990 with the mission of mounting<br />
a concerted research program to provide U.S. industry<br />
with the capability for the computation<strong>al</strong> simulation of<br />
large–sc<strong>al</strong>e, geometric<strong>al</strong>ly–complex physic<strong>al</strong> field problems.<br />
For the Scientific Visu<strong>al</strong>ization Thrust of the ERC,<br />
oceanographic visu<strong>al</strong>ization has been a major area of research<br />
and development. An interactive acoustic visu<strong>al</strong>ization<br />
tool has been developed for the Nav<strong>al</strong> Oceanographic<br />
Office [4,6], which <strong>al</strong>lows an an<strong>al</strong>yst to visu<strong>al</strong>ize 3D ocean<br />
sound speed fields volumetric<strong>al</strong>ly to determine the location<br />
of subsurface oceanographic features. An eddy detection,<br />
extraction, tracking, and animation capability has been developed<br />
with the MSU Center for Air–Sea Technology<br />
[5,10,11].<br />
The present visu<strong>al</strong>ization focus on ocean data is part of<br />
the Acoustic Monitoring of Glob<strong>al</strong> Ocean Climate (AM-<br />
GOC) Program, which involves many of the major oceanographic<br />
researchers and centers in the United States, as well<br />
as many abroad, in an effort to measure ocean temperature<br />
using acoustic thermometry to provide direct evidence of<br />
the rate of glob<strong>al</strong> climate change. The 30–month pilot project<br />
is primarily focused in the Pacific Ocean.<br />
1<br />
Since oceans cover about three–quarters of the earth<br />
and are vast reservoirs of heat and carbon dioxide build–up<br />
from our industri<strong>al</strong>ized world, an accurate measure of ocean<br />
temperature on a glob<strong>al</strong> sc<strong>al</strong>e can provide direct evidence of<br />
the rate of glob<strong>al</strong> climate change caused. In fact, the glob<strong>al</strong><br />
ocean has been c<strong>al</strong>led the climatologic<strong>al</strong> flywheel.<br />
Within the AMGOC program, glob<strong>al</strong> climate models<br />
are being studied and refined. Data from these models aid<br />
in the prediction of glob<strong>al</strong> warming trends and the prediction<br />
of acoustic travel time trends, which are tested against measurements.<br />
Both long–range acoustic propagation and<br />
ocean climate models provide a better understanding of the<br />
effects of season<strong>al</strong> and other natur<strong>al</strong> variability of ocean<br />
temperatures.<br />
Sound speed in the ocean is a function of temperature,<br />
pressure, and s<strong>al</strong>inity. Glob<strong>al</strong> ocean warming of as little as<br />
3–5 millidegrees Celsius produces a sound speed increase of<br />
0.02 m/s. Over glob<strong>al</strong> paths (16,000 km) this results in a<br />
travel time reduction of 0.1–0.2 seconds. Thus even a miniscule<br />
glob<strong>al</strong> warming sign<strong>al</strong> can be detected by the decreased<br />
propagation time. However, this decrease in travel time<br />
must be detected against a background of travel time fluctuations<br />
caused by oceanographic variability arising from<br />
sources other than warming. Such fluctuations are largely<br />
due to mesosc<strong>al</strong>e, season<strong>al</strong>, and longer term variability. It<br />
is these oceanographic “noise” sources that the work described<br />
in this case study attempts to visu<strong>al</strong>ize effectively.<br />
As the AMGOC program evolves, the visu<strong>al</strong>ization system<br />
will <strong>al</strong>low the visu<strong>al</strong>ization of fluid flow and acoustic propagation<br />
within the same scene. This comprehensive visu<strong>al</strong>ization<br />
system will <strong>al</strong>low detection of computation<strong>al</strong> and experiment<strong>al</strong><br />
problems, discovery of unexpected physic<strong>al</strong><br />
phenomena and confirmation of the expected, and will provide<br />
an effective means of visu<strong>al</strong> communication among<br />
project participants and to the scientific and lay communities<br />
in gener<strong>al</strong>.<br />
The visu<strong>al</strong>ization system will include representations<br />
of ocean temperature fields, ocean current fields, ocean surface<br />
height, sound speed data, acoustic source and receiver
locations and structure, and acoustic propagation paths<br />
showing propagation losses, boundary interactions, and<br />
acoustic arriv<strong>al</strong> patterns. Effective representation of mesosc<strong>al</strong>e<br />
eddies, intern<strong>al</strong> waves, and other relevant ocean characteristics<br />
will be developed.<br />
This data visu<strong>al</strong>ization capability will include both experiment<strong>al</strong><br />
and computation<strong>al</strong> model data. Effective comparison<br />
of forward predictive modeling with resulting assimilated<br />
data will be included. The visu<strong>al</strong>ization system<br />
will be interactive, providing a glob<strong>al</strong> view and high resolution<br />
section<strong>al</strong> views under user control of both location and<br />
viewpoint. It will be possible to move about the targeted section<br />
for <strong>al</strong>ternate views or to move around geometric<strong>al</strong> features.<br />
The key elements of the visu<strong>al</strong>ization system have been<br />
the GUI, the data management, and the flow visu<strong>al</strong>ization <strong>al</strong>gorithms.<br />
The v<strong>al</strong>ue of the work is determined by the degree<br />
to which it <strong>al</strong>lows the users to explore their data and extract<br />
information. The ability to see contextu<strong>al</strong> information ––<br />
bathymetry, coastlines, location of acoustic sources and receivers,<br />
physic<strong>al</strong> extent labelling (latitude, longitude, and<br />
depth) –– is cruci<strong>al</strong>.<br />
Dataset<br />
The primary data set that has been visu<strong>al</strong>ized is the result<br />
of an ongoing simulation of the Pacific Ocean [2], the<br />
so–c<strong>al</strong>led NRL model. It covers the area from 109.125�E<br />
to 282�E and from 20�S to 62�N with a fixed latitude/longitude<br />
sampling of 0.125� x 0.17578125�, which results in a<br />
resolution of 989 x 657. The model has 6 isopycn<strong>al</strong><br />
(constant density) horizont<strong>al</strong> layers. Although the intern<strong>al</strong><br />
timestep of the model is 20 minutes, data is saved only every<br />
3.05 model days, which yields 120 samples per model year.<br />
The outputs of the simulation are layer thickness deviations,<br />
h, and the horizont<strong>al</strong> current, [u,v] T . This produces 3 GB of<br />
data per model year.<br />
Visu<strong>al</strong>ization System Issues<br />
For the design and implementation of the ocean model<br />
visu<strong>al</strong>ization software, an object–oriented approach has<br />
been adopted. Advantages of object–oriented programming<br />
are well–documented, e.g., [3]; in particular it facilitates<br />
stable extensions to large software systems. Extensibility is<br />
a major concern for the ocean model visu<strong>al</strong>ization software,<br />
as it is used by a wide variety of institutions within the AM-<br />
GOC program. Furthermore, the visu<strong>al</strong>ization paradigms<br />
found useful within the context of ocean modeling should be<br />
applicable to other fields. For example, the techniques developed<br />
for oceanographic flow visu<strong>al</strong>ization should <strong>al</strong>so be<br />
useful for hydrodynamic, meteorologic<strong>al</strong>, and aerodynamic<br />
flow visu<strong>al</strong>ization, necessitating extensions to computation<strong>al</strong><br />
grids other than the ones used for the AMGOC ocean<br />
models.<br />
2<br />
The inherent size of ocean models makes data handling<br />
an important part of the visu<strong>al</strong>ization system. For an initi<strong>al</strong><br />
implementation, data handling has been restricted to structured,<br />
four–dimension<strong>al</strong> grids. This provides enough flexibility<br />
for the model, while <strong>al</strong>lowing efficient data access.<br />
Access to raw model data is supplied by an IOStructuredGrid4D<br />
object. This object administers <strong>al</strong>l data files, it<br />
chooses appropriate readers for specific file formats and, in<br />
compliance with main memory size, makes an attempt to<br />
buffer data.<br />
Results from one ocean model experiment are typic<strong>al</strong>ly<br />
archived in sever<strong>al</strong> files to keep file sizes manageable. For<br />
example, the data for the Pacific Ocean from the NRL model<br />
is split into files which contain <strong>al</strong>l the output data for a quarter<br />
year. However, this partitioning should not be visible<br />
during the an<strong>al</strong>ysis of the data. Therefore, the visu<strong>al</strong>ization<br />
system provides the means to describe a Logic<strong>al</strong> Grid; the<br />
current implementation uses an ASCII file, since this is permanent,<br />
data–related information. Figure 1 shows part of the<br />
Logic<strong>al</strong> Grid File for the Pacific Ocean data set.<br />
\gridname history_1981–1993<br />
\dimension 0..1439 # Time i<br />
0..5 # Layer j<br />
0..656 # y k<br />
0..988 # x l<br />
\variable h float ‘Thickness anom<strong>al</strong>y’<br />
\variable u float ‘Transport velocity u’<br />
\variable v float ‘Transport velocity v’<br />
\filetype NRL/History/Hydro<br />
\pathname /leo7/hisdat/<br />
\filename h124y151.da i= 0.. 29 c=h,u,v<br />
\filename h124y151.db i= 30.. 59 c=h,u,v<br />
\filename h124y151.dc i= 60.. 89 c=h,u,v<br />
\filename h124y151.dd i= 90..119 c=h,u,v<br />
\pathname /leo1/hisdat/<br />
\filename h124y152.da i=120..149 c=h,u,v<br />
\filename h124y152.db i=150..179 c=h,u,v<br />
\filename h124y152.dc i=180..209 c=h,u,v<br />
# ...<br />
Figure 1. Extract from a Logic<strong>al</strong> Grid File<br />
The \dimension command provides a description of index<br />
ranges for the entire logic<strong>al</strong> grid. The data itself is described<br />
by \variable commands, each specifying the name<br />
of a data variable, its data type and its meaning (as a comment<br />
string). With this information available, each \filename<br />
command specifies the index subrange and the data<br />
variables stored in one particular file. Any continuous index<br />
subrange and any combination of variables is <strong>al</strong>lowed; the<br />
example given in Figure 1 shows only subranges in i and for<br />
<strong>al</strong>l files variables h, u, and v. The \pathname command is<br />
provided for convenience, <strong>al</strong>l following filenames are ap-
pended to the current pathname. The actu<strong>al</strong> access to data<br />
files is determined by their \filetype, which the IOStructuredGrid4D<br />
uses to choose specific readers.<br />
The IOStructuredGrid4D object provides data access<br />
through its method GetVertex (see Figure 2). In each of the<br />
four dimensions, an arbitrary index subrange (or the speci<strong>al</strong><br />
symbol fullRange) can be specified for any variable, <strong>al</strong>lowing<br />
flexible random access of any zero– to four–dimension<strong>al</strong><br />
data subset. This includes obvious choices like ‘‘one layer<br />
of h at a particular time’’ and less obvious, but potenti<strong>al</strong>ly<br />
useful ones like ‘‘one vertic<strong>al</strong> line of h for <strong>al</strong>l timesteps.’’<br />
Providing an easy–to–use but very gener<strong>al</strong> data interface<br />
like GetVertex encourages loc<strong>al</strong>ized data access, leading to<br />
improved system performance through a reduced number of<br />
actu<strong>al</strong> disk file accesses.<br />
IOStructuredGrid4D_GetVertex(<br />
Object *ptrSender,<br />
long iStart, iEnd,<br />
long jStart, jEnd,<br />
long kStart, kEnd,<br />
long lStart, lEnd,<br />
char *ptrVariableName,<br />
void **ptrptrData )<br />
Figure 2. Basic data access method<br />
The current implementation of IOStructuredGrid4D<br />
buffers rectangular subsets of layers, so–c<strong>al</strong>led tiles. The<br />
number of tile buffers can be tailored to the available main<br />
memory by using the method SetNoOfBuffers. Individu<strong>al</strong><br />
tiles are loaded with filetype–specific readers, which receive<br />
a filename, file–relative indices, and a variable name. This<br />
establishes a compact and clean interface and makes readers<br />
for new filetypes easy to add.<br />
The size of ocean model datasets usu<strong>al</strong>ly prohibits loc<strong>al</strong><br />
storage on a visu<strong>al</strong>ization computer. Data is stored on a file<br />
server and accessed through a network, which typic<strong>al</strong>ly<br />
presents a serious performance bottleneck. In order to address<br />
this problem, one filetype/reader combination in the<br />
visu<strong>al</strong>ization system uses a wavelet compression method<br />
[8,9]. Data files are compressed off–line, transmitted when<br />
accessed, and decompressed on the fly.<br />
Flow Visu<strong>al</strong>ization<br />
For visu<strong>al</strong>ization purposes, graphic<strong>al</strong> representations<br />
with suitable visu<strong>al</strong> attributes have to be derived from the<br />
ocean model data. The structure of layered ocean models<br />
suggests layer interfaces for graphic<strong>al</strong> representation. At<br />
any fixed time, each of the layer interfaces is defined by a<br />
height field, with height v<strong>al</strong>ues (or depth v<strong>al</strong>ues, rather) provided<br />
for each of the model’s latitude/longitude pairs.<br />
The geometric<strong>al</strong> shape of a layer interface can be visu<strong>al</strong>ized<br />
by an appropriate surface (interpolated or approxi-<br />
3<br />
mated), with visu<strong>al</strong> clues provided by a lighting model. Figure<br />
3 shows the layer interfaces for the six–layer NRL<br />
model. To avoid <strong>al</strong>iasing artifacts <strong>al</strong>ong the shoreline and<br />
for increased drawing performance, the land data has been<br />
masked for <strong>al</strong>l but the lowest layer interface.<br />
At any fixed time, the horizont<strong>al</strong> current in one layer is<br />
characterized by vectors [u,v] T on a latitude/longitude rectilinear<br />
grid. Visu<strong>al</strong>izations of steady (instantaneous) and unsteady<br />
(time dependent) flow tradition<strong>al</strong>ly use tufts or arrows<br />
to indicate flow directions at fixed and/or moving<br />
points, e.g., [7]. Figure 4 shows a 10x10 degree subsection<br />
of the uppermost two layers in the Pacific Ocean dataset,<br />
with an arrow anchored at each grid point. This is a useful<br />
technique and it has been used extensively, but for larger datasets,<br />
i.e., larger regions and/or finer grids, pictures tend to<br />
be overcrowded with arrows, making flow features practic<strong>al</strong>ly<br />
undetectable.<br />
For the visu<strong>al</strong>ization of horizont<strong>al</strong> flow within the layers<br />
of a layered ocean model, a technique termed colorwheel<br />
has been developed. The basic idea is to abandon any auxiliary<br />
graphic<strong>al</strong> objects like arrows, which might overcrowd<br />
or clutter the picture, and instead use color for representing<br />
flow direction. A circular color lookup table provides an individu<strong>al</strong><br />
color for <strong>al</strong>l directions; given a vector [u,v] T , it is<br />
straightforward to compute its direction in terms of an angle<br />
�, which is used to access the corresponding color in the<br />
table.<br />
Figure 5 shows the colorwheel technique applied to the<br />
uppermost layer in the Pacific Ocean model. In order to relate<br />
colors and directions, the colorwheel itself is reproduced<br />
on a planar surface with a fixed position relative to the<br />
layer; it follows <strong>al</strong>l transformations (e.g., rotations) of the<br />
layer in 3–space. For ease of computation and understanding,<br />
the colorwheel has been designed using the HSV color<br />
model, with the flow direction corresponding to Hue. In<br />
Figure 5, the other two channels, S and V, are set to a fixed<br />
v<strong>al</strong>ue of 1.0, i.e., full saturation and v<strong>al</strong>ue (lightness).<br />
For the detection of flow features, it is desirable to visu<strong>al</strong>ize<br />
not only vector directions, but <strong>al</strong>so vector lengths. Given<br />
a vector [u,v] T , this can be achieved by letting its direction<br />
determine the color and ‘‘sc<strong>al</strong>ing’’ that color according to<br />
the vector’s length. In the HSV color model, for example,<br />
the vector’s length can sc<strong>al</strong>e the saturation (S) and/or lightness<br />
(V) channels. Figures 6 and 7 illustrate logarithmic<br />
sc<strong>al</strong>ing of S and V. Prominent flow features include the<br />
equatori<strong>al</strong> (east–to–west) and equatori<strong>al</strong> counter (west–to–<br />
east) currents, the Kuroshio Current off Japan, and eddies,<br />
which, as circular flow, appear as a rotation of the colorwheel<br />
configuration. Clockwise and counter–clockwise eddies<br />
can be easily distinguished. A rotated view, Figure 8,<br />
clearly shows the rising of the uppermost layer interface between<br />
the equatori<strong>al</strong> and counter–equatori<strong>al</strong> currents. For a<br />
detailed an<strong>al</strong>ysis of flow features, the visu<strong>al</strong> representation
can be probed by pointing with the mouse and reporting the<br />
flow vector on the colorwheel legend.<br />
These initi<strong>al</strong> experiments with the colorwheel technique<br />
have shown its usefulness in visu<strong>al</strong>izing ocean model<br />
flow data. However, there is ample room for improvements<br />
and extensions. The HSV color model has been chosen for<br />
convenience of computation; other color models are being<br />
investigated. To facilitate the qu<strong>al</strong>itative interpretation of<br />
visu<strong>al</strong>izations, changes of perceived colors on the wheel<br />
should correspond directly to (angular) changes of vector<br />
direction. In addition, various configurations on the wheel<br />
seem to be useful, for example, concentrating the color gamut<br />
in a wedge of the colorwheel to increase the resolution of<br />
particular flow directions.<br />
Summary<br />
A large part of the task has been and continues to be<br />
gaining an understanding of the oceanographers’ and acousticians’<br />
knowledge, nomenclature, questions, and interests.<br />
The basic task of visu<strong>al</strong>izing ocean models and acoustic<br />
paths is not likely to change over the next few years. The focus<br />
will be on developing and integrating more tools (other<br />
vector/flow visu<strong>al</strong>ization techniques, tensor visu<strong>al</strong>ization<br />
for acoustic propagation, etc.) and extending the flexibility<br />
of the system (e.g., handling data on other grids structures,<br />
etc.). For example, coast<strong>al</strong> modelers with whom we <strong>al</strong>so collaborate<br />
are interested in applying the colorwheel technique<br />
to visu<strong>al</strong>ize flow in their problem domain, e.g., flow in tributaries<br />
and bays [1]<br />
Acknowledgements<br />
The work described herein is part of a larger project involving<br />
many people. Kelly Parmley Gaither developed the<br />
vector visu<strong>al</strong>ization routines which produced Figure 4, Scott<br />
Nations wrote much of the data management routines and<br />
GUI code, and Bernd Hamann provided much information<br />
on surface reconstruction and vector visu<strong>al</strong>ization paradigms.<br />
Their contributions are gratefully acknowledged.<br />
This work has been supported in part by ARPA and the<br />
Strategic Environment<strong>al</strong> Research and Development Program<br />
(SERDP).<br />
4<br />
References<br />
1 Lee Butler, Coast<strong>al</strong> <strong>Engineering</strong> Research Center, US Army<br />
Corps of Engineers, private communications, March 29,<br />
1994.<br />
2 H.E. Hurlburt, Alan J. W<strong>al</strong>lcraft, Ziv Sirkes and E. Joseph<br />
Metzger, “Modelling of the Glob<strong>al</strong> and Pacific Oceans: On<br />
the Path to Eddy–Resolving Ocean Prediction,” Oceanography,<br />
Vol. 5, No. 1, 1992, pp. 9–18.<br />
3 B. Meyer, Object Oriented Software Construction, Prentice–<br />
H<strong>al</strong>l, London, 1988.<br />
4 R.J. Moorhead, B. Hamann, and J. Lever, ”OVIRT – Oceanographic<br />
Visu<strong>al</strong>ization Interactive Research Tool,” Navy<br />
Scientific Visu<strong>al</strong>ization and Virtu<strong>al</strong> Re<strong>al</strong>ity Seminar, Bethesda,<br />
MD, June 1993.<br />
5 R.J. Moorhead and Z. Zhu, “Feature Extraction for Oceanographic<br />
Data Using A 3D Edge Operator,” IEEE Visu<strong>al</strong>ization<br />
’93, San Jose, CA, Oct. 1993.<br />
6 R.J. Moorhead, B. Hamann, C. Everitt, S. Jones, J. McAllister,<br />
and J. Barlow, “Oceanographic Visu<strong>al</strong>ization Interactive<br />
Research Tool (OVIRT),” SPIE Proc. 2178, SPIE/IS&T Electronic<br />
Imaging, San Jose, CA, February 6–10, 1994.<br />
7 Frits H. Post and Theo van W<strong>al</strong>sum, “Fluid Flow Visu<strong>al</strong>ization,”<br />
Focus on Scientific Visu<strong>al</strong>ization, H. Hagen, H. Müller,<br />
and G.M. Nielson (Eds.), Springer–Verlag, 1993.<br />
8 Hai Tao and Robert Moorhead, “Lossless Progressive Transmission<br />
of Scientific Data Using Biorthogon<strong>al</strong> Wavelet<br />
Transform,” IEEE Internation<strong>al</strong> Conference on Image Processing,<br />
Austin, TX, Nov. 1994.<br />
9 Hai Tao and Robert Moorhead, “Progressive Transmission of<br />
Scientific Data Using Biorthogon<strong>al</strong> Wavelet Transform,”<br />
IEEE Visu<strong>al</strong>ization ’94, Washington, D.C., Oct. 1994.<br />
10 Z. Zhu, R.J. Moorhead, H. Anand, and L.R. Raju, “Feature<br />
Extraction and Tracking in Oceanographic Visu<strong>al</strong>ization,”<br />
SPIE Proc. 2178, SPIE/IS&T Electronic Imaging, San Jose,<br />
CA, February 6–10, 1994.<br />
11 Z. Zhu and R.J. Moorhead, “Exploring Feature Detection<br />
Techniques for Time–Varying Volumetric Data,” IEEE Workshop<br />
on Visu<strong>al</strong>ization and Machine Vision, Seattle, WA, June<br />
24, 1994.
Fig. 3. Layer interfaces of the six-layer NRL<br />
ocean model<br />
Fig. 5. Flow visu<strong>al</strong>ization with the colorwheel on the<br />
uppermost layer interface<br />
Fig. 7. As Figure 6, top view<br />
Fig. 4. Flow visu<strong>al</strong>ization with arrows on the<br />
uppermost two layer interfaces<br />
Fig. 6. Flow visu<strong>al</strong>ization with the colorwheel, color<br />
intensity and saturation sc<strong>al</strong>ed by flow vector lengths<br />
Fig. 8. Flow visu<strong>al</strong>ization with the colorwheel, rotated view<br />
of the uppermost layer interface, height exaggerated
Case Study: Integrating Spati<strong>al</strong> Data Display with Virtu<strong>al</strong> Reconstruction<br />
Philip Peterson Brian Hayden F. David Fracchia<br />
School of Computing Science Dept. of Archaeology School of Computing Science<br />
Simon Fraser University, Burnaby, B.C. V5A 1S6 Canada<br />
Abstract<br />
In the process of archaeologic<strong>al</strong> excavation, a vast amount<br />
of data, much of it three-dimension<strong>al</strong> in nature, is<br />
recorded. In recent years, computer graphics techniques<br />
have been applied to the task of visu<strong>al</strong>izing such data. In<br />
particular, data visu<strong>al</strong>ization has been used to accomplish<br />
the virtu<strong>al</strong> reconstruction of site architecture and to enable<br />
the display of spati<strong>al</strong> data distributions using threedimension<strong>al</strong><br />
models of site terrain. In the case we present<br />
here, these two approaches are integrated in the modeling<br />
of a prehistoric pithouse. In order to better visu<strong>al</strong>ize<br />
artifact distributions in the context of site architecture,<br />
surface data is displayed as a layer in a virtu<strong>al</strong><br />
reconstruction viewable at interactive rates. This<br />
integration of data display with the architectur<strong>al</strong> model<br />
has proven v<strong>al</strong>uable in identifying correlations between<br />
distributions of different artifact categories and their<br />
spati<strong>al</strong> proximity to significant architectur<strong>al</strong> features.<br />
1. Introduction<br />
In studying the remains of prehistoric architecture, it is<br />
gener<strong>al</strong>ly of interest to identify how different areas of a<br />
structure were utilized. The answer to this question can be<br />
seen as an important step in the development of a theory of<br />
the soci<strong>al</strong> organization of the site’s former inhabitants.<br />
Under the assumption that certain artifacts have a<br />
strong association with a specific activity, by examining<br />
the spati<strong>al</strong> distribution within the site architecture of<br />
different artifact types, it is possible to formulate a<br />
hypothesis which identifies areas according to usage.<br />
However, in order to form a more complete understanding<br />
of dwelling organization, one must question why one area<br />
is associated with a particular usage pattern and not<br />
another.<br />
In the case presented here, we describe how, using<br />
computer graphics techniques, it is possible to incorporate<br />
the display of artifactu<strong>al</strong> data distributions into the<br />
structur<strong>al</strong> and environment<strong>al</strong> context of site architecture (in<br />
this case, a prehistoric pithouse). We have found that<br />
visu<strong>al</strong>izing excavation data in this manner can, in addition<br />
to being a v<strong>al</strong>uable aid in the identification of correlations<br />
between the spati<strong>al</strong> distribution of artifacts and significant<br />
site features, be a useful tool in identifying the implications<br />
of architectur<strong>al</strong> constraints on usage areas.<br />
1.1 Visu<strong>al</strong>ization in archaeology<br />
Computer graphics techniques are increasingly being<br />
used to visu<strong>al</strong>ize complex data in archaeologic<strong>al</strong><br />
investigation. In recent years, sever<strong>al</strong> projects involving<br />
the creation of detailed virtu<strong>al</strong> reconstructions of<br />
archaeologic<strong>al</strong> sites have been undertaken. In these<br />
applications, a three-dimension<strong>al</strong> computer graphics model<br />
of the site is constructed and viewed using standard<br />
modeling, rendering, and animation techniques.<br />
Some of the most well-known examples of virtu<strong>al</strong><br />
reconstruction have involved the application of solid<br />
modeling techniques (CSG) in the recreation of historic<strong>al</strong><br />
architecture. Initi<strong>al</strong>ly applied to the modeling of the temple<br />
precinct of Roman Bath, CSG techniques were later<br />
refined and applied to the more ambitious modeling of the<br />
Saxon Minster of Winchester using the WINSOM solid<br />
modeller [13]. A later project, the modeling of the Furness<br />
Abbey [5], expanded on the techniques pioneered in the<br />
earlier efforts and offered interactive viewing capabilities,<br />
<strong>al</strong>though at a fairly low degree of re<strong>al</strong>ism.<br />
Recent efforts in virtu<strong>al</strong> reconstruction have produced<br />
increasingly photore<strong>al</strong>istic results. A detailed model of the<br />
Dresden Frauenkirche, destroyed during the second world<br />
war, has been used to create a high resolution computer<br />
generated film [4]. Unlike most archaeologic<strong>al</strong> sites where<br />
the only source of data is the site itself, origin<strong>al</strong> plans and<br />
photographs of the architecture existed on which to base<br />
the model. One of the outstanding features of this<br />
reconstruction is the attention paid to the recreation of<br />
interior lighting and surface detail, evoking in the viewer a<br />
sense of the architectur<strong>al</strong> space. Attention to detail and<br />
accurate surface characteristics are <strong>al</strong>so evident in the<br />
virtu<strong>al</strong> reconstruction of the Visir tomb in Egypt [11]. In<br />
both of these cases, the visu<strong>al</strong>ization is not the ultimate<br />
go<strong>al</strong>, but is being used as part of the process leading to the<br />
eventu<strong>al</strong> physic<strong>al</strong> reconstruction of the site.<br />
Computer graphics techniques have <strong>al</strong>so been applied<br />
to the an<strong>al</strong>ysis of archaeologic<strong>al</strong> sites. From site survey<br />
data, a three-dimension<strong>al</strong> model of terrain can be
constructed [7]. Digit<strong>al</strong> terrain models (DTM) can then be<br />
used as a context in which to display spati<strong>al</strong> data such as<br />
artifact distributions [2]. This approach is fundament<strong>al</strong> to<br />
geographic information systems (GIS), and their<br />
applicability to archaeology has <strong>al</strong>so become evident,<br />
particularly when considering data at the site or intra-site<br />
level [9,10]. A related approach considers the problem of<br />
visu<strong>al</strong>izing spati<strong>al</strong> data throughout sever<strong>al</strong> noncontemporaneous<br />
layers [1]. In this early system, a data<br />
layer can be displayed in a plan view, or a cross-section<strong>al</strong><br />
view can be used to slice through multiple layers.<br />
The ability to visu<strong>al</strong>ly relate the distribution of data to<br />
surface characteristics has proven useful in the<br />
identification of spati<strong>al</strong> correlations. This technique can be<br />
extended to include less tangible features such as<br />
viewsheds and solar paths, While less physic<strong>al</strong> than<br />
surface characteristics, these environment<strong>al</strong> factors are<br />
nonetheless, sufficiently important. An<strong>al</strong>yses of these<br />
features have been applied in architecture [6,12], and have<br />
potenti<strong>al</strong> application in archaeology [8].<br />
2. Visu<strong>al</strong>ization<br />
The Keatley Creek site in British Columbia consists of<br />
over 100 cultur<strong>al</strong> depressions, sever<strong>al</strong> of which have been<br />
fully excavated since 1986. The majority of these<br />
depressions are the remains of residenti<strong>al</strong> dwellings that<br />
were occupied over 2000 years ago. The case we present<br />
here describes the virtu<strong>al</strong> reconstruction of one of the<br />
largest of these dwellings.<br />
Figure 1. Pithouse architecture.<br />
The type of dwellings associated with these cultur<strong>al</strong><br />
depressions are referred to as pithouses. Pithouse<br />
construction consists of an approximately circular<br />
subterranean floor with a raised earthen rim and a roughly<br />
conic<strong>al</strong> roof structure. The roof is constructed of log beams<br />
pinned to the rim and sloping inward towards the center of<br />
the pit. The inward sloping beams, supported by upright<br />
log posts are interlaced with joists and covered with wood<br />
thatching and dirt. At the apex of this roof structure is a<br />
centr<strong>al</strong> smoke-hole, which, in addition to serving as the<br />
source of light and ventilation, <strong>al</strong>so serves as the pithouse<br />
entrance. Ingress and egress from the smoke-hole is<br />
accomplished using a log ladder. The major structur<strong>al</strong><br />
components are illustrated in Figure 1.<br />
2.1 Virtu<strong>al</strong> reconstruction<br />
In constructing the model, the focus was on creating a<br />
visu<strong>al</strong> representation that conveyed the major structures,<br />
yet was simple enough to navigate at interactive rates on<br />
available hardware. Moreover, structur<strong>al</strong> features that were<br />
not necessary to convey the basic architectur<strong>al</strong> shape were<br />
intention<strong>al</strong>ly left out.<br />
The floor was reconstructed from survey data by<br />
fitting a non-uniform b-spline surface that interpolated<br />
known surface points. Beams and posts were modeled<br />
using cylindric<strong>al</strong> primitives, and the roof covering was<br />
constructed from simple polygon<strong>al</strong> patches (Plates 1 and<br />
2). A simple shading model with minim<strong>al</strong> texture mapping<br />
is used.<br />
In addition to the major structur<strong>al</strong> components of the<br />
pithouse, simple representations of significant interior<br />
features are <strong>al</strong>so included. The locations of hearths are<br />
indicated by the position of red spheres on the pithouse<br />
floor. Similarly, the positions of storage pits are denoted by<br />
black disks (Plate 3)<br />
The user can move in, out and around the model, in<br />
re<strong>al</strong> time, by steering a virtu<strong>al</strong> camera using a mouse or<br />
SpaceB<strong>al</strong>l. The standard display is in the first-person, and<br />
the interaction method used does not require the user to<br />
change focus away from the model. In addition, an<br />
orthographic overview of the floor can be displayed<br />
simultaneously. In this view, an arrow glyph is used to<br />
indicate position and orientation in the main view (Plate 5).<br />
2.2 Spati<strong>al</strong> data display<br />
The spati<strong>al</strong> distributions of a variety of artifacts can be<br />
displayed within the model. Distribution plots are layered<br />
on top of the pithouse floor using a model in which the<br />
greater the artifact density, the more the surface colour is<br />
modified (Plate 4). Multiple plots can be layered at once,<br />
using different colors, transparency or vertic<strong>al</strong><br />
displacements if desired.<br />
Most artifact data at this site was recorded as discrete<br />
counts within square regions. Therefore, spati<strong>al</strong> data is
plotted at this resolution, and no colour interpolation is<br />
used.<br />
2.3 Light availability<br />
A characteristic feature of pithouse architecture is the<br />
centr<strong>al</strong> smoke-hole. This opening at the apex of the roof<br />
structure is the only source of natur<strong>al</strong> light in the dwelling.<br />
Because of the limited availability of light, it is<br />
hypothesized that the usage of different areas of the house<br />
floor was subject, at least parti<strong>al</strong>ly, to the availability of<br />
working light.<br />
In order to approximate the directly lit areas of the<br />
house interior, a light source approximating the emission<br />
area of the smoke-hole is modeled. This light source<br />
illuminates the floor model so that areas of direct light can<br />
be easily seen. The solar path of the sun is c<strong>al</strong>culated for<br />
the site, and can be specified to correspond to a given date.<br />
The user can then interactively manipulate the light source<br />
through its apparent daily motion to see its relation to data<br />
distributions layered onto the floor surface (Plate 6). This<br />
method, while not a correct model of the actu<strong>al</strong> sunlight<br />
distribution, is a useful approximation for the purpose of<br />
data exploration.<br />
4. Results<br />
In the case presented here, we have used threedimension<strong>al</strong><br />
computer graphics techniques to integrate the<br />
display of spati<strong>al</strong> data into a model of a prehistoric<br />
pithouse. This has provided us with some v<strong>al</strong>uable insight<br />
into the implications that the architectur<strong>al</strong> structure of a<br />
pithouse can have on usage areas within the dwelling. By<br />
viewing artifact data in an approximation to its origin<strong>al</strong><br />
context, we were able to more readily identify potenti<strong>al</strong><br />
relationships between data distributions and the pithouse<br />
structure.<br />
Artifact data from the Keatley Creek excavation is<br />
probably the most detailed and comprehensive ever<br />
collected from a similar site [14]. Various hypotheses exist<br />
relating the spati<strong>al</strong> distribution of certain artifact types to<br />
areas of the pithouse floor. In order to visu<strong>al</strong>ize how<br />
particular data distributions relate to the site, distributions<br />
were layered onto the surface model of the floor (Plate 4).<br />
Distribution plots of this type are commonly displayed<br />
on two-dimension<strong>al</strong> site maps. Placing the data in the<br />
three-dimension<strong>al</strong> model has the advantage of making<br />
obvious any relation to surface slope. As can be seen in<br />
Plate 4, it is readily apparent when a high density of<br />
artifacts, in this case, debitage, are on a w<strong>al</strong>l slope<br />
(possibly indicating a storage area).<br />
While the an<strong>al</strong>ysis of spati<strong>al</strong> relationships between<br />
data and floor position has proved useful, we have found<br />
the most insightful information from this visu<strong>al</strong>ization<br />
comes as a result of considering that the structure imposes<br />
constraints on usage areas.<br />
In the orthographic projection shown in Plate 5, two<br />
different artifact distributions are displayed. One of the<br />
data sets is clearly more concentrated in the periphery than<br />
the other. The data set that is more centr<strong>al</strong> is likely related<br />
to its proximity to the hearths as it is commonly thought to<br />
be associated with food preparation. The outer data set,<br />
however, is associated with person<strong>al</strong> possessions. One<br />
possible reason for this peripher<strong>al</strong> distribution might be<br />
that sleeping areas were on the edge of the structure. While<br />
not identifiable in the two-dimension<strong>al</strong> plot, it is readily<br />
seen in Plates 3 and 6 that the ceiling height at the edge is<br />
quite low, and therefore, the edge could not have been<br />
useful for much else other than sleeping or storage.<br />
Another form of architectur<strong>al</strong> constraint inherent in the<br />
pithouse structure is the availability of working light. Since<br />
the only source of natur<strong>al</strong> light is the smoke-hole, we have<br />
approximated how much of the interior would be lit at a<br />
given time of day. In Plate 5, the distribution of the data set<br />
shown in blue (heavily-retouched scrapers), is more<br />
concentrated towards one end of the floor. By examining<br />
the same plot in Plate 6, it is readily apparent that this<br />
artifact is more dominant in the area lit by the midday sun.<br />
This would indicate that this artifact type is associated with<br />
work requiring some visu<strong>al</strong> acuity.<br />
5. Future work<br />
While the use of computer graphics as a visu<strong>al</strong>ization<br />
technique in archaeology is becoming more common, there<br />
are still many possibilities for further research. In<br />
particular, the case presented here can be expanded on in<br />
sever<strong>al</strong> ways. Our research up to this point has<br />
concentrated on creating a model of major structur<strong>al</strong><br />
features only. We have taken this approach for two<br />
reasons: First, it was necessary to minimize the complexity<br />
of the model in order to maintain interactivity on available<br />
hardware. Second, the structur<strong>al</strong> factors that we were most<br />
interested in testing the implications of (direct light<br />
availability and ceiling height), did not require significant<br />
structur<strong>al</strong> complexity. With access to faster hardware, more<br />
detailed features could be incorporated without sacrificing<br />
display speed, and as a result interactivity.<br />
While the simple lighting model implemented thus far<br />
has proven useful, the development of a more accurate<br />
model that accounts for light from hearths, in addition to<br />
natur<strong>al</strong> light, would provide a better basis for work area<br />
theories.<br />
A further enhancement to the model would be to<br />
implement it in a virtu<strong>al</strong> re<strong>al</strong>ity (VR) environment. In<br />
addition to providing the user with a sense of the
architectur<strong>al</strong> space, VR techniques have potenti<strong>al</strong> for<br />
integrating the display of data in the context of a model [3].<br />
Fin<strong>al</strong>ly, it would be of interest to integrate the<br />
visu<strong>al</strong>ization model with the underlying data such that it is<br />
no longer a passive display device only, but can be used to<br />
query data and perform statistic<strong>al</strong> functions.<br />
References<br />
[1] Norman I. Badler and Virginia R. Badler. Interaction with a<br />
color computer graphics system for archaeologic<strong>al</strong> sites. In<br />
Computer Graphics (Proceedings of SIGGRAPH ’78),<br />
pages 217–221, Atlanta, GA, August 1978.<br />
[2] W. A. Boismier and Paul Reilly. Expanding the role of<br />
computer graphics in the an<strong>al</strong>ysis of survey data. In C. L.<br />
N. Ruggles and S. P. Q. Rahtz, editors, Computer and<br />
Quantitative Methods in Archaeology 1987, BAR<br />
Internation<strong>al</strong> Series 393, pages 221–225, Oxford, 1988.<br />
British Archaeologic<strong>al</strong> Reports.<br />
[3] Steve Bryson and Creon Levit. The virtu<strong>al</strong> windtunnel: An<br />
environment for the exploration of three-dimension<strong>al</strong><br />
unsteady flows. In Proceedings of Visu<strong>al</strong>ization ’91, San<br />
Diego, CA, October 1991. IEEE.<br />
[4] Brian Collins. From ruins to re<strong>al</strong>ity—the Dresden<br />
Frauenkirche. IEEE Computer Graphics and Applications,<br />
pages 13–15, November 1993.<br />
[5] Ken Delooze and Jason Wood. Furness abbey survey<br />
project—the application of computer graphics and data<br />
visu<strong>al</strong>isation to reconstruction modelling of an historic<br />
monument. In Kris Lockyear and Sebastian Rahtz, editors,<br />
Computer and Quantitative Methods in Archaeology 1990,<br />
BAR Internation<strong>al</strong> Series, pages 141–148, Oxford, 1990.<br />
British Archaeologic<strong>al</strong> Reports.<br />
[6] Stephen M. Ervin. Visu<strong>al</strong>izing n-dimension<strong>al</strong> implications<br />
of two-dimension<strong>al</strong> design decisions. In Proceedings of<br />
Visu<strong>al</strong>ization ’92, Boston, MA, October 1992. IEEE.<br />
[7] T. M. Harris and G. R. Lock. Digit<strong>al</strong> terrain modelling and<br />
three-dimension<strong>al</strong> surface graphics for landscape and site<br />
an<strong>al</strong>ysis in archaeology and region<strong>al</strong> planning. In C. L. N.<br />
Ruggles and S. P. Q. Rahtz, editors, Computer and<br />
Quantitative Methods in Archaeology 1987, BAR<br />
Internation<strong>al</strong> Series 393, pages 161–172, Oxford, 1988.<br />
British Archaeologic<strong>al</strong> Reports.<br />
[8] Martin Kokonya. Data exploration in archaeology: New<br />
possibilities and ch<strong>al</strong>lenges. In Paul Reilly and Sebastian<br />
Rahtz, editors, Communication in Archaeology: a glob<strong>al</strong><br />
view of the impact of information technology, Volume<br />
One: Data Visu<strong>al</strong>isation, pages 49–64. 1990.<br />
[9] Kenneth L. Kvamme. Geographic information systems and<br />
archaeology. In Gary Lock and Jonathan Moffett, editors,<br />
Computer and Quantitative Methods in Archaeology 1991,<br />
BAR Internation<strong>al</strong> Series S577, pages 77–84, Oxford,<br />
1991. British Archaeologic<strong>al</strong> Reports.<br />
[10] Gary Lock and Trevor Harris. Visu<strong>al</strong>izing spati<strong>al</strong> data: the<br />
importance of geographic information systems. In Paul<br />
Reilly and Sebastian Rahtz, editors, Archaeology and the<br />
Information Age: a glob<strong>al</strong> perspective, chapter 9, pages 81–<br />
96. Routledge, 1992.<br />
[11] P. P<strong>al</strong>amidese, M. Betro, and G. Muccioli. The virtu<strong>al</strong><br />
restoration of the Visir tomb. In Proceedings of<br />
Visu<strong>al</strong>ization ’93, pages 420–423, San Jose, CA, October<br />
1993. IEEE.<br />
[12] Jon H. Pittman and Don<strong>al</strong>d P. Greenberg. An interactive<br />
environment for architectur<strong>al</strong> energy simulation. In<br />
Computer Graphics (Proceedings of SIGGRAPH ’82),<br />
pages 233–242, Boston, MA, July 1982.<br />
[13] P. Reilly. Data visu<strong>al</strong>ization in archaeology. IBM Systems<br />
Journ<strong>al</strong>, 28(4):569–579, 1989.<br />
[14] James G. Spafford. Artifact distributions on housepit floors<br />
and soci<strong>al</strong> organization in housepits at Keatley Creek.<br />
Master’s thesis, Simon Fraser University, Department of<br />
Archaeology, 1991.<br />
Acknowledgements<br />
This work was supported in part by a Natur<strong>al</strong> Sciences<br />
and <strong>Engineering</strong> Research Council (NSERC) post-graduate<br />
scholarship. Equipment, resources, and encouragement<br />
were provided by the faculty, statff, and students of the<br />
Graphics and MultiMedia Research Lab at Simon Fraser<br />
University.
Plate 1. Pithouse exterior<br />
Case Study: Integrating Spati<strong>al</strong> Data with a Virtu<strong>al</strong> Reconstruction<br />
Philip Peterson Brian Hayden F. David Fracchia<br />
VIS ’94
Plate 2. Pithouse interior.<br />
Case Study: Integrating Spati<strong>al</strong> Data with a Virtu<strong>al</strong> Reconstruction<br />
Philip Peterson Brian Hayden F. David Fracchia<br />
VIS ’94
Plate 3. Pithouse interior showing hearths,<br />
strorage pits and smoke−hole.<br />
Case Study: Integrating Spati<strong>al</strong> Data with a Virtu<strong>al</strong> Reconstruction<br />
Philip Peterson Brian Hayden F. David Fracchia<br />
VIS ’94
Plate 4. Spati<strong>al</strong> data layering.<br />
Case Study: Integrating Spati<strong>al</strong> Data with a Virtu<strong>al</strong> Reconstruction<br />
Philip Peterson Brian Hayden F. David Fracchia<br />
VIS ’94
Plate 5. Plan view of pithouse floor.<br />
Case Study: Integrating Spati<strong>al</strong> Data with a Virtu<strong>al</strong> Reconstruction<br />
Philip Peterson Brian Hayden F. David Fracchia<br />
VIS ’94
Plate 6. Spati<strong>al</strong> data layer with<br />
midday lighting model<br />
Case Study: Integrating Spati<strong>al</strong> Data with a Virtu<strong>al</strong> Reconstruction<br />
Philip Peterson Brian Hayden F. David Fracchia<br />
VIS ’94
Case Study: Observing a Volume Rendered Fetus within a Pregnant Patient<br />
Andrei State, David T. Chen, Chris Tector, Andrew Brandt, Hong Chen,<br />
Ryutarou Ohbuchi, Mike Bajura and Henry Fuchs<br />
Abstract<br />
Augmented re<strong>al</strong>ity systems with see-through headmounted<br />
displays have been used primarily for<br />
applications that are possible with today's computation<strong>al</strong><br />
capabilities. We explore possibilities for a particular<br />
application—in-place, re<strong>al</strong>-time 3D ultrasound<br />
visu<strong>al</strong>ization—without concern for such limitations. The<br />
question is not “How well could we currently visu<strong>al</strong>ize the<br />
fetus in re<strong>al</strong> time,” but “How well could we see the fetus<br />
if we had sufficient compute power?”<br />
Our video sequence shows a 3D fetus within a<br />
pregnant woman's abdomen—the way this would look to a<br />
HMD user. Technic<strong>al</strong> problems in making the sequence<br />
are discussed. This experience exposed limitations of<br />
current augmented re<strong>al</strong>ity systems; it may help define the<br />
capabilities of future systems needed for applications as<br />
demanding as re<strong>al</strong>-time medic<strong>al</strong> visu<strong>al</strong>ization.<br />
1 Introduction<br />
Interpreting 3D radiologic<strong>al</strong> data is difficult for nonexperts<br />
because understanding spati<strong>al</strong> relationships<br />
between patient and data requires ment<strong>al</strong> fusion of the<br />
two. Volume rendering has been useful for visu<strong>al</strong>ization<br />
but has typic<strong>al</strong>ly been viewed separately from the patient.<br />
Ide<strong>al</strong>ly one would like to see directly inside a patient.<br />
Ultrasound echography <strong>al</strong>lows dynamic live scanning and<br />
patient-doctor interaction; an augmented re<strong>al</strong>ity system<br />
displaying live ultrasound data in re<strong>al</strong> time and properly<br />
registered in 3D space within a scanned subject would be<br />
a powerful and intuitive tool; it could be used for needleguided<br />
biopsies, obstetrics, cardiology, etc.<br />
2 Previous work<br />
Many researchers have attempted visu<strong>al</strong>ization of 3D<br />
echography data [1, 2, 3, 4]; some have volume visu<strong>al</strong>ized<br />
data sets that were acquired as a series of hand-guided 2D<br />
echography slices with 6 DOF [5, 6]. Compared to<br />
University of North Carolina<br />
echography imaging by current state-of-the-art 2D<br />
scanners, such volume visu<strong>al</strong>izations promise to reduce<br />
the difficulty of ment<strong>al</strong>ly combining 2D echography slices<br />
into a coherent 3D volume.<br />
However, <strong>al</strong>most <strong>al</strong>l of these systems have used<br />
convention<strong>al</strong> stationary video monitors for presentation,<br />
so that a user must still ment<strong>al</strong>ly fuse 3D volume images<br />
on the monitor with the 3D volume of the patient.<br />
One system [7] tried to visu<strong>al</strong>ize live 2D echography<br />
images in-place within the patient using a see-through<br />
HMD system. While that system demonstrated the initi<strong>al</strong><br />
concept of “augmented re<strong>al</strong>ity,” it could show only a few<br />
image slices (no 3D volume) at a relatively low frame rate<br />
Those few ultrasound images appeared to be pasted in<br />
front of the patient’s body rather than fixed within it.<br />
3 Near-re<strong>al</strong>-time visu<strong>al</strong>ization system<br />
In January 1993 we attempted to improve upon [7]<br />
with a system designed to perform re<strong>al</strong>-time, in-place<br />
volume visu<strong>al</strong>ization of a live human subject. It contained<br />
two major re<strong>al</strong>-time features: a continuously updated and<br />
rendered volume, and an image compositor. The volume<br />
was updated from a series of 2D echography images<br />
acquired by a tracked ultrasound transducer. The image<br />
compositor combined each frame of the volume rendering<br />
with a live HMD video image of the patient (Plate 1).<br />
Unfortunately, due to the requirements of re<strong>al</strong>-time<br />
operation, the performance was seriously inadequate. The<br />
system's major shortcomings were:<br />
• the ultrasound acquisition rate was only 3 ultrasound<br />
frames per second, causing both tempor<strong>al</strong> and spati<strong>al</strong><br />
undersampling of the volume,<br />
• the reconstructed volume was crudely sampled (to<br />
100 x 100 x 100), and could not be updated at more<br />
than 1 ultrasound slice per second,<br />
• the volume was rendered at low resolution (65 x 81 rays<br />
cast) and interpolated to the display resolution of<br />
(512 x 640) to achieve 10 fps,<br />
• the tracking system resolution and accuracy were poor,<br />
with significant lag and noise in the data.<br />
As a result of these problems, the (interactive) volume
enderings displayed by this system were unrecognizable.<br />
The scans of a nearly full-term fetus did not reve<strong>al</strong><br />
human-like forms to any member of the research team<br />
other than the M.D. ultrasonographer.<br />
4 Hybrid re<strong>al</strong>-time / off-line system<br />
To answer the question “How much better would the<br />
visu<strong>al</strong>ization be if the re<strong>al</strong>-time computation<strong>al</strong> demands<br />
were met by the available resources,” this system was<br />
designed so that the most computation<strong>al</strong>ly expensive tasks<br />
(volume reconstruction and rendering) are done off-line.<br />
Figure 1 shows the steps involved in generating a<br />
video sequence that combines volume rendered<br />
echography data with HMD camera visu<strong>al</strong>s. The figure<br />
shows the dependency of various tasks on one another.<br />
The tasks can be grouped roughly into c<strong>al</strong>ibration tasks<br />
performed prior to scanning a subject, data acquisition<br />
tasks performed during the scan, and image generation<br />
tasks which are a post process.<br />
4.1 C<strong>al</strong>ibration<br />
C<strong>al</strong>ibration procedures compute<br />
sever<strong>al</strong> sets of parameters. One such set<br />
relates echography pixels to the<br />
transducer tracker origin; together with<br />
the transducer tracker position, it<br />
determines the location of the<br />
echography pixels in 3D world space.<br />
Similarly, the camera position and<br />
orientation relative to the HMD tracker<br />
origin must be determined; the optic<strong>al</strong><br />
distortion of the camera lens must be<br />
modeled so that the CG imagery can be<br />
made to match the camera images.<br />
Echography pixel to tracker<br />
c<strong>al</strong>ibration. This function (which is not<br />
necessarily linear in pixel space) is<br />
measured by imaging a point target (a<br />
4 mm bead obtained from GE medic<strong>al</strong><br />
systems and suspended at the tip of a pin<br />
in a water tank) at a known location<br />
relative to the transducer. Plate 2 shows<br />
the c<strong>al</strong>ibration setup for the ultrasound<br />
transducer. The transducer is attached to<br />
a precision translation stage which<br />
moves under computer control to chart<br />
out the point spread functions of the<br />
echography pixels (this function grows<br />
with distance from the transducer tip).<br />
The 2D transducer slice was measured to<br />
be rotated 2.3 degrees from the<br />
transducer's axis.<br />
OFF-LINE LIVE PRE-SCAN<br />
SCAN<br />
U/S scanner<br />
Echography pixel<br />
c<strong>al</strong>ibration<br />
U/S c<strong>al</strong>ibration<br />
parameters<br />
�������<br />
Sweep abdomen<br />
�������<br />
�����<br />
�����<br />
Digitizing stylus<br />
�����<br />
tracking data<br />
�����<br />
�����<br />
Define pit<br />
geometry<br />
�����<br />
Pit geometry data<br />
�����<br />
���<br />
���<br />
Data streams<br />
Transducer<br />
tracking data<br />
(w/ time code)<br />
Low-pass filter<br />
(fc=1Hz)<br />
Filtered transducer<br />
tracking data<br />
Tasks<br />
���Data and data sources<br />
Failed subprocess<br />
Camera c<strong>al</strong>ibration. Position and orientation of the<br />
HMD camera relative to the HMD tracking origin are<br />
determined by an iterative semi-automatic method. The<br />
optic<strong>al</strong> distortion of the lens is determined by imaging a<br />
grid pattern (Plate 2, inset). A circularly symmetric<br />
model based on a 5th degree polynomi<strong>al</strong> is used.<br />
Our optic<strong>al</strong> tracking system is described in [8]; the<br />
c<strong>al</strong>ibration methods used for it are described in [9].<br />
4.2 Re<strong>al</strong>-time acquisition<br />
Unburdened by visu<strong>al</strong>ization processing needs, this<br />
phase takes place in true re<strong>al</strong>-time. Both the ultrasound<br />
images and the HMD camera images are recorded at<br />
30 fps on Sony D2 digit<strong>al</strong> tape recorders. At the same<br />
time, tracking data for the ultrasound transducer and for<br />
the HMD is saved on a UNIX workstation which<br />
controls the D2 recorders. With each tracker record the<br />
time code of the corresponding video frame is stored for<br />
later synchronization, thus establishing correspondence<br />
between the tracking and video data streams.<br />
To create an illusion of the visu<strong>al</strong>ized volume<br />
“Emergency measures”<br />
C<strong>al</strong>ibrated tracker<br />
Acquire echography data stream<br />
Reconstruct<br />
Reconstructed<br />
volume<br />
Manu<strong>al</strong> editing<br />
Edited volume<br />
Pregnant patient<br />
Echography<br />
slices<br />
(digit<strong>al</strong> video)<br />
Render volume,<br />
pit, w/ distortion<br />
CG Element<br />
(digit<strong>al</strong> video)<br />
HMD<br />
tracking data<br />
(w/ time code)<br />
Low-pass filter<br />
(fc=6Hz)<br />
Composite<br />
Composited footage<br />
HMD with video camera<br />
Pos. / orientation<br />
c<strong>al</strong>ibration;<br />
Optic<strong>al</strong> distortion<br />
correction<br />
Acquire video data stream<br />
Filtered HMD<br />
tracking data<br />
Define pit<br />
geometry<br />
Pit geometry data<br />
Video c<strong>al</strong>ibration<br />
parameters<br />
HMD camera<br />
images<br />
(digit<strong>al</strong> video)<br />
Figure 1: Flow diagram for hybrid experiment combining<br />
re<strong>al</strong>-time acquisition with off-line visu<strong>al</strong>ization. The top<br />
row shows the “basic ingredients” of our system.
esiding inside the abdomen, a (polygon<strong>al</strong>) model of a<br />
“pit” must be created; the pit must conform to the shape<br />
of the abdomen and be placed at the correct position. To<br />
achieve this, the geometry of the abdomen is acquired by<br />
making a zig-zag sweep of the abdomen. The tip of the<br />
tracked transducer is used as a 3D digitizing stylus.<br />
4.3 Off-line image generation<br />
In this phase volume visu<strong>al</strong>ized echography images<br />
and the images captured by the HMD-mounted camera are<br />
combined into composite HMD viewpoint imagery. The<br />
major steps in generating the composite are:<br />
Tracking noise filtering. The tracking data we<br />
acquire fluctuates even if the tracked target remains<br />
stationary. Such noise causes misregistration between<br />
video and CG imagery. To reduce this effect, a noncaus<strong>al</strong><br />
low-pass filter without phase shift is used [10],<br />
with cut-off frequencies of 1 Hz for the transducer tracker<br />
and 6 Hz for the HMD tracker.<br />
Reconstruction. The echography pixels are<br />
positioned and resampled into a regularly gridded volume,<br />
using a simple approximation <strong>al</strong>gorithm based on a linear<br />
combination of Gaussian weighting functions which are<br />
translated and sc<strong>al</strong>ed to minimize artifacts [6, 11]. Size<br />
and shape of an echography pixel in world (or tracker)<br />
space are approximated by a point spread function which<br />
f<strong>al</strong>ls off away from the world space position as a nonspheric<strong>al</strong><br />
Gaussian. Since an image frame and its tracking<br />
information are related by the frame's time code,<br />
digitization of echography frames from video tape and<br />
volume reconstruction can take place automatic<strong>al</strong>ly on a<br />
workstation under program control.<br />
Visu<strong>al</strong>ization. A volume renderer vol2 [12] running<br />
on a graphics multicomputer Pixel-Planes 5 is used to<br />
render the reconstructed volume(s) from viewpoints<br />
matching those of the HMD-mounted camera. By<br />
modulating the direction of rays, the images are distorted<br />
based on the model described above; the polygon<strong>al</strong> pit,<br />
built using the data from the abdomen geometry sweep, is<br />
included in the rendering. The images are recorded in<br />
single-frame mode onto digit<strong>al</strong> video tape.<br />
Compositing. Camera and CG images are mixed by<br />
chroma-keying on a Sony video mixer. The mixer<br />
replaces blue background in the CG frames by HMD<br />
frames; the time codes recorded during HMD acquisition<br />
are used to ensure synchronization of the 2 elements.<br />
5 Live subject experiment and results<br />
In January 1994 we scanned two pregnant subjects<br />
with the hybrid system. Since the current tracking setup<br />
<strong>al</strong>lows only one target at a time, the abdomen sweep data,<br />
the ultrasound data (Plate 3, left) and the head camera<br />
data (Plate 4) had to be recorded in 3 successive passes.<br />
The patients had to remain motionless throughout the<br />
acquisition phase.<br />
From the acquired ultrasound imagery, we selected<br />
and digitized a short sequence of about 15 seconds, during<br />
which the ultrasonographer had made a continuous sweep<br />
(455 slices) of the fetus from the middle of the skull down<br />
to the bottom of the hip (Plate 3, right). The slices were<br />
reconstructed into a 165 x 165 x 150 volume with a<br />
resolution of 8.2 voxels/cm (or a voxel size of .122 cm 3 ),<br />
which is better than the highest resolution of the<br />
ultrasound machine/transducer combination.<br />
After reconstruction, objects such as uterus and<br />
placenta were edited out manu<strong>al</strong>ly using an editing mask<br />
with Gaussian f<strong>al</strong>l-off to avoid introducing artifacts in the<br />
volume. Fin<strong>al</strong>ly a sm<strong>al</strong>l 3D Gaussian filter (standard<br />
deviation 2 voxels) was applied to the volume.<br />
The abdomen geometry sweep had failed due to a<br />
minor technic<strong>al</strong> problem during the live scan; we derived<br />
abdomen geometry data by triangulating a number of<br />
sm<strong>al</strong>l structures visible on the skin of the abdomen in<br />
frames videographed from different viewpoints and<br />
extracted from the HMD video sequence.<br />
The reconstructed and edited volume (Plate 5) and<br />
the pit were rendered by vol2 with optic<strong>al</strong> distortion (Plate<br />
5, inset); the CG sequence was combined with the HMD<br />
camera sequence (Plate 6).<br />
6 Conclusion and future directions<br />
Many aspects of our experiment suffered from lack of<br />
immediate, re<strong>al</strong>-time 3D feedback. During HMD video<br />
acquisition, the HMD wearer could not re<strong>al</strong>ly see inside<br />
the patient; thus we unfortunately ended up looking at the<br />
patient from the “wrong” side and thus viewing the fetus<br />
from behind in the resulting composite video sequence.<br />
During echography acquisition, we were unable to gather<br />
enough echography slices to reconstruct a complete fetus<br />
due to lack of re<strong>al</strong>-time 3D feedback on the geometry of<br />
the scanned anatomy. Still, in separately generated<br />
images from viewpoints chosen more advantageously than<br />
those of the HMD camera during the HMD video<br />
acquisition, one can recognize more anatomic<strong>al</strong> features<br />
(Plate 5).<br />
What resources would be required to present an online<br />
visu<strong>al</strong>ization of comparable qu<strong>al</strong>ity in an augmentedre<strong>al</strong>ity<br />
system? We expect advances in volume rendering<br />
software and hardware to soon provide high-speed<br />
stereoscopic rendering of volumetric data sets (see for<br />
example [13]). As for reconstruction, our volume<br />
contained nearly 4 times as many voxels as the one used<br />
in the 1993 experiment. Since the latter was being<br />
reconstructed at a rate of about 1 Hz, we need an increase<br />
of 2 orders of magnitude in computation<strong>al</strong> speed for the
econstruction subsystem.<br />
We learned from the January 1993 experiment and<br />
others that, besides the image generation frame rate, short<br />
lag in both volume reconstruction and visu<strong>al</strong>ization is<br />
very important. Our hybrid system has avoided this<br />
problem through off-line processing. For an on-line re<strong>al</strong>time<br />
system, however, we need to design and implement<br />
hardware and <strong>al</strong>gorithms that provide not only high<br />
throughput but <strong>al</strong>so short lag. In addition, we need fast,<br />
minim<strong>al</strong>-lag, high-precision tracking.<br />
In the area of our application—visu<strong>al</strong>izing ultrasound<br />
as a “flashlight” into the body—we conclude that a step<br />
forward has been achieved. The sequence showing a fetus<br />
registered inside the pregnant subject provides a “brass<br />
standard” (if not a gold one) as a target for our next<br />
re<strong>al</strong>-time efforts. One way to acquire the high amounts of<br />
computing resources needed for such efforts is through<br />
the current research on high-bandwidth links between<br />
powerful computing stations, which hints at<br />
computation<strong>al</strong> capabilities that might be available in the<br />
next few years and are within the desired range of power.<br />
In gener<strong>al</strong>, complex visu<strong>al</strong>izations presented within<br />
augmented vision systems make greater application<br />
demands than either virtu<strong>al</strong> environments or scientific<br />
visu<strong>al</strong>ization individu<strong>al</strong>ly. Any closed virtu<strong>al</strong><br />
environment or scientific visu<strong>al</strong>ization system lacks the<br />
error-emphasizing cues that a combined system provides.<br />
An augmented re<strong>al</strong>ity application provides sufficient<br />
information to enable the user to easily notice registration<br />
errors, tracker lag, computation<strong>al</strong> errors, c<strong>al</strong>ibration errors<br />
and re<strong>al</strong> time delays which destroy the attempted illusion.<br />
Augmented systems or any virtu<strong>al</strong> re<strong>al</strong>ity system de<strong>al</strong>ing<br />
directly with the re<strong>al</strong> world will not be easy to create.<br />
Simple applications with little computation<strong>al</strong> demand,<br />
such as overlays for wiring guides or information<strong>al</strong><br />
pointers, will be able to get by, but applications with<br />
complex visu<strong>al</strong>ization go<strong>al</strong>s will be heavily burdened by<br />
the demands. Researchers should be sensitive to these<br />
issues and attempt to ev<strong>al</strong>uate carefully their impact in the<br />
intended application.<br />
7 Acknowledgments<br />
Jack Goldfeather provided mathematic<strong>al</strong> models for<br />
the echography c<strong>al</strong>ibration procedure. Gary Bishop wrote<br />
filtering software for the tracking data. Nancy Chescheir,<br />
M.D. and Vern Katz, M.D. were our ultrasonographers.<br />
Kathryn Y. Tesh and Eddie Saxe provided experiment<strong>al</strong><br />
assistance. Scott Shauf created an early version of figure<br />
1. We thank our anonymous subject for her patience.<br />
Funding was provided by ARPA (ISTO DABT<br />
63-92-C-0048 and ISTO DAEA 18-90-C-0044) and by<br />
CNRI / ARPA / NSF / BellSouth / GTE (NCR-8919038).<br />
8 References<br />
1. McCann, H.A., Sharp, J.S., Kinter, T.M., McEwan, C.N.,<br />
Barillot, C., and Greenleaf, J.F. “Multidimension<strong>al</strong><br />
Ultrasonic Imaging for Cardiology.” Proc. IEEE 76.9<br />
(1988): 1063-1073.<br />
2. L<strong>al</strong>ouche, R.C., Bickmore, D., Tessler, F., Mankovich, H.<br />
K., and Kangar<strong>al</strong>oo, H. “Three-dimension<strong>al</strong> reconstruction<br />
of ultrasound images.” SPIE’89, Medic<strong>al</strong> Imaging . SPIE,<br />
1989. 59-66.<br />
3. Pini, R., Monnini, E., Masotti, L., Novins, K. L.,<br />
Greenberg, D. P., Greppi, B., Cerofolini, M., and Devereux,<br />
R. B. “Echocardiographic Three-Dimension<strong>al</strong><br />
Visu<strong>al</strong>ization of the Heart.” 3D Imaging in Medicine. Ed.<br />
Fuchs, H. Höhne, K. H., and Pizer, S. M. NATO ASI<br />
Series. Travemünde, Germany: Springer-Verlag, 1990. F<br />
60: 263-274.<br />
4. Tomographic Technologies, GMBH. 4D Tomographic<br />
Ultrasound, A clinic<strong>al</strong> study. 1993.<br />
5. Ganapathy, U., and Kaufman, A. “3D acquisition and<br />
visu<strong>al</strong>ization of ultrasound data.” Visu<strong>al</strong>ization in<br />
Biomedic<strong>al</strong> Computing 1992. Chapel Hill, NC: SPIE, 1992.<br />
1808: 535-545.<br />
6. Ohbuchi, R., Chen, D., and Fuchs, H. “Increment<strong>al</strong> volume<br />
reconstruction and rendering for 3D ultrasound imaging.”<br />
Visu<strong>al</strong>ization in Biomedic<strong>al</strong> Computing 1992 . Chapel Hill,<br />
NC: SPIE, 1992. 1808: 312-323.<br />
7. Bajura, M., Fuchs, H., and Ohbuchi, R. “Merging Virtu<strong>al</strong><br />
Objects with the Re<strong>al</strong> World: Seeing Ultrasound Imagery<br />
within the Patient.” Computer Graphics (Proceedings of<br />
SIGGRAPH’92) 26.2 (1992): 203-210.<br />
8. Wang,, J., Chi, V., and Fuchs, H. “A Re<strong>al</strong>-Time Optic<strong>al</strong><br />
3D Tracker for Head-Mounted Display System.” Computer<br />
Graphics (Proceedings of 1990 Symposium on Interactive<br />
3D Graphics) 24.2 (1990): 205-215.<br />
9. Gottsch<strong>al</strong>k, S. “Autoc<strong>al</strong>ibration for Virtu<strong>al</strong> Environment<br />
Tracking Hardware.” Computer Graphics (Proceedings of<br />
SIGGRAPH’93) 27 (1993): 65-72.<br />
10. “Digit<strong>al</strong> Low-Pass Filter Without Phase Shift.” NASA Tech<br />
Briefs KSC-11471. John F. Kennedy Space Center, Florida.<br />
11. Ohbuchi, R. “Increment<strong>al</strong> Acquisition and Visu<strong>al</strong>ization of<br />
3D Ultrasound Images.” Doctor<strong>al</strong> dissertation. University<br />
of North Carolina at Chapel Hill, Computer Science<br />
Department, 1994.<br />
12. Neumann, U., State, A., Chen, H., Fuchs, H., Cullip, T. J.,<br />
Fang, Q., Lavoie, M., and Rhoades, J. “Interactive<br />
Multimod<strong>al</strong> Volume Visu<strong>al</strong>ization for a Distributed<br />
Radiation-Treatment Planning Simulator.” Technic<strong>al</strong><br />
Report TR94-040. University of North Carolina at Chapel<br />
Hill, Computer Science Department, 1994.<br />
13. Cullip, T. J., and Neumann, U. “Accelerating Volume<br />
Reconstruction With 3D Texture Hardware.” Technic<strong>al</strong><br />
Report TR93-027. University of North Carolina at Chapel<br />
Hill, Computer Science Department, 1994.
Please reference the following QuickTime movie located in the MOV<br />
directory:<br />
STATE1.MOV ( Macintosh only)<br />
Copyright © 1994 by University of North Carolina<br />
QuickTime is a trademark of Apple Computer, Inc.
New Techniques in the Design of He<strong>al</strong>thcare Facilities<br />
Tarek Alameldin Mardelle Shepley<br />
The Visu<strong>al</strong>ization Laboratory Department of Architecture<br />
Texas A�M University Texas A�M University<br />
College Station� TX 77843�3137 College Station� TX 77843�3137<br />
Abstract<br />
The recent advent of computer graphics techniques<br />
has helped to bridge the gap between architectur<strong>al</strong> con�<br />
cepts and actu<strong>al</strong> buildings. Closing this gap is espe�<br />
ci<strong>al</strong>ly critic<strong>al</strong> in he<strong>al</strong>thcare facilities. In this paper� we<br />
present new techniques to support the design decision<br />
process and apply them to the design of a neonat<strong>al</strong> in�<br />
tensive care unit. Two issues are addressed� ergono�<br />
metric accessibility and visu<strong>al</strong> supervision of spaces.<br />
These two issues can be investigated utilizing new tech�<br />
nologies that demonstrate that computers are more<br />
than a medium of communication in the �eld of ar�<br />
chitecture� the computer can make a signi�cant con�<br />
tribution as a proactive design tool.<br />
1 Overview<br />
This paper describes an interdisciplinary project<br />
between faculty of the Visu<strong>al</strong>ization Laboratory and<br />
the Department of Architecture at Texas A�M Uni�<br />
versity.<br />
The need to design appropriate environments is<br />
most keenly felt in the area of he<strong>al</strong>thcare facility ar�<br />
chitecture. The built environment can in�uence he<strong>al</strong>th<br />
outcomes by mitigating the impact of stressful envi�<br />
ronments �16� and supporting the processes required<br />
to provide a high level of patient care. In some cases�<br />
good facility design and appropriate space adjacencies<br />
may enhance the ability of medic<strong>al</strong> sta� to save lives.<br />
The key to good design of he<strong>al</strong>thcare facilities is<br />
accurate and thorough communication with the client<br />
during the design process. The tradition<strong>al</strong> techniques<br />
utilized by design profession<strong>al</strong>s to enhance interaction<br />
have included interviews and questionnaires� post�<br />
occupancy ev<strong>al</strong>uations� behavior<strong>al</strong> observation� gam�<br />
ing �tools that enable design team members partici�<br />
pate directly in the design process by manipulating<br />
game pieces that represent the elements of the envi�<br />
ronment� and full�sc<strong>al</strong>e mockups. Of these techniques�<br />
full�sc<strong>al</strong>e mockups provide the most veridic<strong>al</strong> informa�<br />
tion about the nature of an environment� <strong>al</strong>though<br />
they are expensive and time�consuming to build� and<br />
inappropriate for large components of the design.<br />
Unfortunately� none of these techniques� including<br />
mockups� provide su�cient information to enable ar�<br />
chitects to account for <strong>al</strong>l signi�cant implications of<br />
a proposed design. With the advent of virtu<strong>al</strong> re<strong>al</strong>�<br />
ity technology and computer graphics� however� a less<br />
cumbersome and more accurate <strong>al</strong>ternative to these<br />
techniques is available. Using such technology� the<br />
he<strong>al</strong>thcare client is empowered to participate directly<br />
in the design process and the architect is provided the<br />
opportunity to fully understand the implications of<br />
his�her design. A designer can test concepts about a<br />
space� a component of a building�s interior�exterior�<br />
or the use of a space by representing� an<strong>al</strong>yzing� and<br />
re�ning the design before it is adopted. Visu<strong>al</strong>ization<br />
makes it possible for designers to preview the results<br />
of their theories via pictures or animations.<br />
In this paper� which utilized drawings of a proposed<br />
intensive care nursery by The Design Partnership� Ar�<br />
chitects� the visu<strong>al</strong>ization construct demonstrates that<br />
the project team can experience the medic<strong>al</strong> setting<br />
before it is built� nurses and physicians can watch a<br />
sta� member in action� working within the environ�<br />
ment. Such opportunities <strong>al</strong>low administrators� sta�<br />
and designers to communicate more e�ciently during<br />
the design process. Addition<strong>al</strong>ly� by <strong>al</strong>lowing the de�<br />
sign team to pre�experience the space� controversi<strong>al</strong><br />
innovations can be tested without fear of failure.<br />
While the application in this project focused on<br />
interior space� the technology is <strong>al</strong>so intended to il�<br />
lustrate the implications of entire buildings and sites.<br />
Support during the design process can be given at a<br />
variety of environment<strong>al</strong> sc<strong>al</strong>es ranging from master<br />
planning to furniture and equipment design. Other as�<br />
pects of a potenti<strong>al</strong> project that can be studied include<br />
the adequacy of barrier�free design� the implications of<br />
spati<strong>al</strong> volumes and the e�ciency of way��nding �the<br />
ability to understand the layout of a building and ar�<br />
rive at a destination�. With regard to way��nding�
hospit<strong>al</strong>s are notoriously confusing to negotiate� and a<br />
whole speci<strong>al</strong>ty area in the design profession has been<br />
developed to enhance the cognitive clarity of a build�<br />
ing �journey�.<br />
Addition<strong>al</strong>ly� the technology can be used to ev<strong>al</strong>u�<br />
ate code compliance. This is often neglected in the<br />
early stages of the design process� but increasingly<br />
complex laws and profession<strong>al</strong> liabilities reinforce the<br />
importance of considering these factors throughout<br />
the development of a project. Our innovative tech�<br />
niques will enable architects to think about these fac�<br />
tors at the appropriate time.<br />
The architect can focus on particular aspects of a<br />
design by using separate programs that perform c<strong>al</strong>cu�<br />
lations on speci�c properties �14� 15�. In this paper� we<br />
used human �gure models within the 3D CAD mod�<br />
els in order to experience the spaces and the ergono�<br />
metric accessibility of di�erent objects in the environ�<br />
ment. The problem of accessibility cannot be easily<br />
understood by using tradition<strong>al</strong> representations.It is<br />
<strong>al</strong>so di�cult to imagine what a person can see in a<br />
space by using tradition<strong>al</strong> drawings and CAD system<br />
abstractions. For the neonat<strong>al</strong> intensive care unit de�<br />
sign� we were able to address ergonometric accessibil�<br />
ity and visu<strong>al</strong> supervision issues by integrating human<br />
�gure models into our geometric CAD models prior to<br />
construction. Our go<strong>al</strong> is to provide the design team<br />
with an understanding of the completed architecture<br />
design before it is built.<br />
2 Issues and Results<br />
In this section� two problems associated with the<br />
design of physic<strong>al</strong> environment and the results of our<br />
study are discussed.<br />
2.1 The Ergonometric Accessibility Issue<br />
In recent years� the architectur<strong>al</strong> community has<br />
placed an emphasis on ergonometric compatibility in<br />
workspace design. In response to this approach� we<br />
developed techniques utilizing redundant articulated<br />
chain physiology modeling �2� 3� 4� 1�. An articulated<br />
chain is a series of links connected with either revolute<br />
or prismatic joints such as a robotic manipulator or a<br />
human limb.<br />
The reachable workspace of an articulated chain is<br />
the volume or space encompassing <strong>al</strong>l points that a<br />
reference point P on the hand �or the end e�ector�<br />
traces as <strong>al</strong>l the joints move through their respective<br />
ranges of motion �11�. Re<strong>al</strong>istic human �gure models<br />
are based on anthropometric characteristics such as<br />
link �segment� dimensions and joint limits. Di�erent<br />
sized �percentile� human �gures are modeled as pa�<br />
rameterized anthropometric articulated chains. An ef�<br />
�cient system for 3D workspace visu<strong>al</strong>ization of redun�<br />
dant articulated chains is utilized in simulating task�<br />
oriented activities of di�erent size�percentile agents.<br />
Three�dimension<strong>al</strong> workspace visu<strong>al</strong>ization has ap�<br />
plications in a variety of �elds such as computer�<br />
aided design� human �gure modeling� ergonomic stud�<br />
ies� computer graphics and arti�ci<strong>al</strong> intelligence� and<br />
robotics. In computer�aided design� the three dimen�<br />
sion<strong>al</strong> workspace of a human limb or robotic manip�<br />
ulator can be used in the interior design of build�<br />
ings. Computer graphics human �gure modeling has<br />
been used in cockpit and car occupant studies� space<br />
station design� product safety studies� and mainte�<br />
nance assessment �7� 5� 9� 10�. An interactive system<br />
which assists the designer or a human factors engi�<br />
neer to graphic<strong>al</strong>ly simulate task�oriented activities of<br />
di�erent human agents has been under development<br />
�6� 12� 13�. In the ergonomic experiments� this sys�<br />
tem was used to study the e�ect of limb lengths and<br />
joint limits on the reach capabilities of di�erent size�<br />
percentile people. In addition� this system can <strong>al</strong>so<br />
be used to test design solutions for compliance with<br />
American Disabilities Act �ADA� experiments by cre�<br />
ating human models limited by speci�c physic<strong>al</strong> dis�<br />
abilities. Fin<strong>al</strong>ly� this system can be used in visu<strong>al</strong>iz�<br />
ing sequences of human movements in order to attain<br />
the optim<strong>al</strong> working environment.<br />
2.2 The Visu<strong>al</strong> Supervision Issue<br />
Tradition<strong>al</strong>ly� the design process has emphasized<br />
the two�dimension<strong>al</strong> relationship between spaces.<br />
Even with the support of models and perspective<br />
drawings� it is di�cult to precreate the visu<strong>al</strong> experi�<br />
ence of moving through a building. Utilizing the tech�<br />
nology developed in this paper� however� the architect<br />
and the client can visu<strong>al</strong>ize and experience what a hu�<br />
man can see inside the building during the early stages<br />
of the design process by attaching a camera to the<br />
eyes of the simulated human �gure. A selected �eld of<br />
view is displayed as a translucent pair of view cones�<br />
one for each eye �8�. Viewable objects are shadowed<br />
by the translucent cones which move with the eyes� as<br />
illustrated in Figure 3.<br />
2.3 Result Summary<br />
The information contained in this spati<strong>al</strong> visu<strong>al</strong>iza�<br />
tion enables architects and clients to v<strong>al</strong>idate design<br />
decisions. In this application� access to outlets and<br />
equipment as well as qu<strong>al</strong>ity of visu<strong>al</strong> supervision of<br />
the intensive care nursery and monitors was examined.<br />
Figure 1 illustrates an overview of a nursery bay<br />
looking toward an exterior window. This scene en�<br />
ables sta� to visu<strong>al</strong>ize the impact of windows on the
nursery environment. A view of baby station showing<br />
cabinet and isolette location is shown in Figure 2. The<br />
greater detail provided here <strong>al</strong>lows medic<strong>al</strong> sta� to un�<br />
derstand the sc<strong>al</strong>e of the workspace. Fin<strong>al</strong>ly� Figure 3<br />
illustrates the view from the infant�s vantage point in�<br />
side an isolette. Addressing the needs of both patients<br />
and sta� is essenti<strong>al</strong> for good he<strong>al</strong>th facility design.<br />
A video tape has been developed to describe these<br />
new visu<strong>al</strong>ization techniques as applied to he<strong>al</strong>thcare<br />
facilities design.<br />
3 Conclusions and Future Work<br />
The recent advent of computer graphics techniques<br />
has helped to bridge the gap between the conceptu<strong>al</strong><br />
and the actu<strong>al</strong> building. In this paper� we found that<br />
the following steps are necessary to re�ne the technol�<br />
ogy�<br />
� New fast�rendering <strong>al</strong>gorithms are needed to pro�<br />
duce more re<strong>al</strong>istic pictures in a shorter amount<br />
of time.<br />
� A simulation of the acoustic<strong>al</strong> environment should<br />
be integrated into the visu<strong>al</strong>ized environment to<br />
enhance the veridic<strong>al</strong>ity of the experience.<br />
� New visu<strong>al</strong>ization tools such as stereo glasses wll<br />
further enhance the 3D experience.<br />
� Multi�level systems need to be designed that will<br />
<strong>al</strong>low a trade�o� between time and qu<strong>al</strong>ity.<br />
While work remains to be done to complete the de�<br />
velopment of a virtu<strong>al</strong> re<strong>al</strong>ity technology that can<br />
be readily utilized by the average design profession<strong>al</strong>�<br />
the basic technology is <strong>al</strong>ready available. Ultimately�<br />
these computer techniques are likely to revolutionize<br />
the design process.<br />
Acknowledgments<br />
We wish to thank Karl Maples �the Visu<strong>al</strong>ization<br />
Laboratory�� Jean�Claude K<strong>al</strong>ache �the Architecture<br />
Department�� and David W<strong>al</strong>voord �the Computer<br />
Science Department� for their e�ort in developing the<br />
video associated with this paper.<br />
This research was supported in part by NSF Grants<br />
DUE�9254357� USE�925 1461� Research Enhancement<br />
Program� O�ce of the Associate Provost for Research<br />
and Graduate Studies� Texas A�M University� and<br />
College of Architecture Research Enchancement Pro�<br />
gram� Texas A� M University. Questions regarding<br />
this article can be directed to tarek�viz.tamu.edu.<br />
References<br />
�1� T. Alameldin. Three Dimension<strong>al</strong> Workspace<br />
Visu<strong>al</strong>ization for Redundant Articulated Chains.<br />
PhD thesis� University of Pennsylvania� 1991.<br />
�2� T. Alameldin� N. Badler� and T. Sobh. An Adap�<br />
tive and E�cient System for Computing the 3�D<br />
Reachable Workspace. In Proceedings of IEEE In�<br />
ternation<strong>al</strong> Conference on Systems <strong>Engineering</strong>�<br />
1990.<br />
�3� T. Alameldin� M. P<strong>al</strong>is� S. Rajasekaran� and<br />
N. Badler. On the Complexity of Computing<br />
Reachable Workspaces for Redundant Manipula�<br />
tors. In Proceedings of SPIE Intelligent Robots<br />
and Computer Vision IX� Algorithms and Tech�<br />
niques� 1990.<br />
�4� T. Alameldin and T. Sobh. A Hybrid System for<br />
Computing Reachable Workspaces. In Proceed�<br />
ings of SPIE Machine Vision Systems Integra�<br />
tion� 1990.<br />
�5� N. Badler. Articulated Figure Animation� Guest<br />
Editor�s Introduction. IEEE Computer Graphics<br />
and Applications� June 1987.<br />
�6� N. Badler. Arti�ci<strong>al</strong> Intelligence� Natur<strong>al</strong> Lan�<br />
guage� and Simulation for Human Animation. In<br />
N. Magnenat�Th<strong>al</strong>mann and D. Th<strong>al</strong>mann� ed�<br />
itors� State�of�the Art in Computer Animation�<br />
pages 19�31. Springer�Verlag �New York�� 1989.<br />
�7� N. Badler� K. Manoochehri� and G. W<strong>al</strong>ters.<br />
Articulated Figure Positioning by Multiple Con�<br />
straints. IEEE Computer Graphics and Applica�<br />
tions� 7�6��28�38� 1987.<br />
�8� N. Badler� C. Phillips� and editors B. Webber.<br />
Simulating Humans� Computer Graphics Anima�<br />
tion and Control. Oxford University Press� 1993.<br />
�9� M. Dooley. Anthropometric Modeling Programs �<br />
A Survey. IEEE Computer Graphics and Appli�<br />
cations� 2�9��17�25� November� 1982.<br />
�10� W. Fetter. A Progression of Human Figures Sim�<br />
ulated By Computer Graphics. IEEE Computer<br />
Graphics and Applications� 2�9��9�13� November�<br />
1982.<br />
�11� A. Kumar and K. W<strong>al</strong>dron. The Workspace of a<br />
Mechanic<strong>al</strong> Manipulator. ASME Journ<strong>al</strong> of Me�<br />
chanic<strong>al</strong> Design� 103�665�672� July 1981.
�12� P. Lee� S. Wei� J. Zhao� and N. Badler. Strength<br />
Guided Motion. Computer Graphics� pages 253�<br />
262� 1990.<br />
�13� C. Phillips� J. Zhao� and N. Badler. Interactive<br />
Re<strong>al</strong>�Time Articulated Figure Manipulation Us�<br />
ing Multiple Kinematic Constraints. Computer<br />
Graphics� 24�2��245�250� 1990.<br />
�14� G. Schmitt. Computer Graphics in Architecture.<br />
In N. Th<strong>al</strong>man and D. Th<strong>al</strong>man� editors� New<br />
Trends in Animation and Visu<strong>al</strong>ization� pages<br />
153�163. John Wiley � Sons� 1991.<br />
�15� G. Schmitt. Virtu<strong>al</strong> Re<strong>al</strong>ity in Architecture. In<br />
N. Th<strong>al</strong>man and D. Th<strong>al</strong>man� editors� Virtu<strong>al</strong><br />
Worlds and Multimedia� pages 85�97. John Wi�<br />
ley� 1993.<br />
�16� R. Ulrich. E�ects of Interior Design on Wellness�<br />
Theory and Recent Scienti�c Research. Journ<strong>al</strong><br />
of He<strong>al</strong>th Care Interior Design� 3�97�109� 1991.
Case Study: Visu<strong>al</strong>ization of an Electric Power Transmission System<br />
Pramod M. Mahadev Richard D. Christie<br />
pramod@u.washington.edu christie@ee.washington.edu<br />
Abstract<br />
Visu<strong>al</strong>ization techniques are applied to an electric<br />
power system transmission network to create a graphic<strong>al</strong><br />
picture of network power flows and voltages. A geographic<br />
data map is used. Apparent power flow is encoded<br />
as the width of an arrow, with direction from re<strong>al</strong><br />
power flow. Flows are superposed on flow limits. Contour<br />
plots and color coding failed for representing bus voltages.<br />
A two-color thermometer encoding worked well.<br />
The resulting visu<strong>al</strong>ization is a significant improvement<br />
over current user interface practice in the power industry.<br />
1. Introduction<br />
Electric power systems are operated by dispatchers located<br />
in a control center equipped with a process control<br />
computer system c<strong>al</strong>led an Energy Management System<br />
(EMS). [1] The EMS collects data from locations<br />
throughout the power system, <strong>al</strong>lows the dispatchers to<br />
control power system equipment in remote locations and<br />
executes an<strong>al</strong>ysis functions on the collected data. EMSs<br />
have a complex user interface based on CRT displays and<br />
keyboard and pointing device input.<br />
The power system itself is a large electric<strong>al</strong> network,<br />
with hundreds of buses (nodes) connected by hundreds of<br />
transmission lines and transformers (branches) operating<br />
in sinusoid<strong>al</strong> steady state. Existing CRT displays can<br />
show a few of the many collected and computed voltages<br />
and power flows in numeric<strong>al</strong> form placed on a sm<strong>al</strong>l<br />
portion of the complete circuit diagram.<br />
Because of the size of the power system, dispatchers<br />
can suffer severely from information overload in norm<strong>al</strong><br />
operation, and even more so, and more critic<strong>al</strong>ly, in<br />
casu<strong>al</strong>ties. The EMS user interface is therefore a logic<strong>al</strong><br />
candidate for the application of visu<strong>al</strong>ization techniques.<br />
2. The Visu<strong>al</strong>ization<br />
Department of Electric<strong>al</strong> <strong>Engineering</strong>, FT-10<br />
University of Washington<br />
Seattle, WA 98195<br />
(206) 543-9689 FAX: (206) 543-3842<br />
Principles for effective visu<strong>al</strong>ization [2], guidance<br />
found in Tufte [3,4] and from scientific visu<strong>al</strong>ization [5]<br />
are used to create an improved representation for power<br />
system operating state for use in the routine monitoring<br />
task, specific<strong>al</strong>ly the line power flows and bus voltage<br />
magnitudes of a power system. The objective of this representation<br />
is to give a glob<strong>al</strong> view of the line flows and<br />
bus voltages, to communicate information about proximity<br />
to limits, and to c<strong>al</strong>l attention to limit violations.<br />
A first principle is to show as much of the data as possible,<br />
ide<strong>al</strong>ly <strong>al</strong>l of it. A geographic data map of the entire<br />
power system is chosen as the most appropriate representation.<br />
There are two commonly used graphic<strong>al</strong> representations<br />
for the transmission system found in engineering<br />
drawings: geographic and orthogon<strong>al</strong>. The geographic<br />
representation shows the actu<strong>al</strong> routes of the lines between<br />
substations, while the orthogon<strong>al</strong> representation is<br />
more like a circuit diagram, with the lines laid out with<br />
right angle bends. Even in the orthogon<strong>al</strong> representation,<br />
the substations are arranged approximately by geography.<br />
Many dispatchers tend to discuss system state problems in<br />
conjunction with a geographic map. The major advantage<br />
of a geographic representation appears to be that it engages<br />
the natur<strong>al</strong> human ability to remember and to reason<br />
about geographic data. The direction of arriv<strong>al</strong> of<br />
transmission lines at substations may be an important<br />
visu<strong>al</strong> cue. For this reason, a representation is used that<br />
places the substations in their approximate locations, and<br />
connects them with straight line segments representing<br />
the transmission lines. The strict geographic layout is<br />
modified to show transformers as lines of some minimum<br />
length. They are an important part of the over<strong>al</strong>l system<br />
flow picture and of flow limitations, but would be invisible<br />
in a strict geographic representation.<br />
2.1 Line Flow Encoding<br />
Graphic<strong>al</strong> encodings work best when they are intuitive.<br />
It is easy to recognize such natur<strong>al</strong> encodings, but hard to<br />
devise them. For flow, Minard successfully encoded the
flow of wine exports as the width of paths. [3] The flow of<br />
power may be similarly encoded. The encoding of flow as<br />
width appears to be a useful natur<strong>al</strong> encoding related to<br />
the effect of water flow in a stream. As the amount of<br />
flow increases, the stream gets deeper and wider. When<br />
too much flow exists, it overflows its banks. This suggests<br />
encoding power flow as line width, and power flow limits<br />
<strong>al</strong>so as a width. Limits are colored gray, to set them further<br />
into the background, while a subdued brown color is<br />
used for flow.<br />
Because line flows and limits are commonly discussed<br />
in terms of apparent power (MVA), apparent power is<br />
encoded. However, apparent power has no direction, and<br />
direction of power flow is important to the dispatcher.<br />
Direction, encoded with an arrowhead, is taken from re<strong>al</strong><br />
power (MW) (Fig. 1). While it would be ide<strong>al</strong> to <strong>al</strong>so see<br />
reactive power flow (MVAR), an effective encoding for<br />
presenting both re<strong>al</strong> and reactive power on one display<br />
has not yet been developed. The nature of the monitoring<br />
task places a higher importance on the MVA and MW<br />
direction.<br />
Line flow and limits are encoded as actu<strong>al</strong> MVA, not as<br />
a percentage of limits, using the same sc<strong>al</strong>e for every line.<br />
The human eye can easily extract the approximate percentage<br />
loading from the representation of the actu<strong>al</strong> v<strong>al</strong>ues,<br />
while the actu<strong>al</strong> flow permits comparison with other<br />
overload problems in the system.<br />
Because an overload is a qu<strong>al</strong>itatively different state,<br />
the encoding should undergo a qu<strong>al</strong>itative change. This is<br />
done by changing the color of the arrow. Line flow limits<br />
are displayed as a hollow box inside the arrow. These<br />
visu<strong>al</strong> cues, in addition to the width of the line flow arrow,<br />
c<strong>al</strong>l attention to overloads (Fig. 2).<br />
Relatively few variations of line flow encoding were<br />
tried. Most involved getting rid of spontaneous chartjunk,<br />
such as arrows with heads a different color than the body.<br />
A few variations were significant. Shaded areas for limits<br />
proved easier to comprehend than the origin<strong>al</strong> idea of<br />
using an outline box. (Fig. 3)<br />
In theory, <strong>al</strong>l of the information about line flow and its<br />
limits is encoded in one h<strong>al</strong>f of the line. The other side is<br />
just redundant. Based on this reasoning, it was proposed<br />
to split the line in h<strong>al</strong>f lengthwise and display only one<br />
h<strong>al</strong>f. This way the same information would be displayed<br />
in h<strong>al</strong>f the space, improving information density. (Fig. 4)<br />
This reasoning proved entirely specious, when the encoding<br />
was applied to the glob<strong>al</strong> display. (Fig. 5) Human<br />
pattern recognition apparently prefers symmetry and has<br />
trouble with asymmetric<strong>al</strong> encoding in random orientations.<br />
Red was the first color chosen to indicate a limit violation.<br />
This would be a natur<strong>al</strong> encoding for the gener<strong>al</strong><br />
public, but power system dispatchers have a different redgreen<br />
encoding that can create confusion. In the power<br />
system world, closed switches and circuit breakers show a<br />
red light, to indicate that the equipment is energized, and<br />
therefore dangerous, while open devices show a green<br />
light to indicate safety. However, in norm<strong>al</strong> operation,<br />
most devices are closed, so to a dispatcher, red means OK<br />
and green means trouble! This crossed encoding was<br />
avoided by adopting a bright yellow color, which unambiguously<br />
means abnorm<strong>al</strong>ity or caution, to indicate<br />
overloads. This illustrates how speci<strong>al</strong> characteristics of a<br />
specific user group can influence the visu<strong>al</strong>ization.<br />
2.2 Bus Voltage Encoding<br />
A workable representation of bus voltage magnitude<br />
was more difficult to obtain. Bus voltages are not flows,<br />
but can be thought of as height measurements at various<br />
points in the power system. This led natur<strong>al</strong>ly to the idea<br />
of a contour plot, similar to a contour map of a mountainous<br />
region. (Fig. 7) Contour plots using contour lines, and<br />
the use of colors to identify contour regions, were tried.<br />
Neither representation seemed to provide a natur<strong>al</strong> encoding.<br />
It was difficult to distinguish between high points<br />
and low points, and difficult to identify limit violations.<br />
Areas of high or low voltage did not seem to have much<br />
physic<strong>al</strong> meaning because they were only vaguely associated<br />
with the buses. A three dimension<strong>al</strong> perspective view<br />
of the voltage contour surface, as used in [6], does make it<br />
easy to distinguish between highs and lows, but moves the<br />
voltage information even farther from the associated bus,<br />
and has unsatisfactory loss of detail for large systems.<br />
Furthermore, a clear display of <strong>al</strong>l v<strong>al</strong>ues in a re<strong>al</strong>istic<strong>al</strong>ly<br />
sized system will require some dynamic element, such as<br />
"nodding" of the entire display. This was felt to be unacceptable<br />
in an operation<strong>al</strong> environment. Contour mapping<br />
was discarded as an encoding technique for bus voltages.<br />
Perhaps the fundament<strong>al</strong> reason why contour plots of<br />
voltage fail is that they are not fiduci<strong>al</strong> representations of<br />
the relationships of the encoded data. In a power system,<br />
voltage only exists at the bus. The contour plot graphic<strong>al</strong>ly<br />
gives voltage v<strong>al</strong>ues for points between buses, where<br />
no voltage exists, and so misleads the user.<br />
The next iteration was to identify voltages at each bus<br />
in some way loc<strong>al</strong> to the bus. The progression of colors<br />
adopted was the progression from the natur<strong>al</strong> spectrum,<br />
Red, Orange, Yellow, etc. It was thought that most dispatchers<br />
would be familiar with this progression. Unfortunately,<br />
they are familiar with the acronym, ROYGBIV,<br />
and not with the colors themselves. It was not intuitively<br />
obvious to a user that yellow was a higher voltage than<br />
red. Even with a key, this was not a useful encoding. Gray
sc<strong>al</strong>e was <strong>al</strong>so tried, with disappointing results. Colorbased<br />
encoding of voltages was abandoned. In retrospect,<br />
an encoding based on visu<strong>al</strong> temperature (red-yellowwhite)<br />
might have been more successful.<br />
Next, a thermometer approach was tried. The first implementation<br />
used a pointer on a vertic<strong>al</strong> sc<strong>al</strong>e. (Fig. 6a)<br />
The pointer was effective at communicating individu<strong>al</strong><br />
bus voltages, but did not provide a glob<strong>al</strong> perspective.<br />
Users had to focus on each bus in turn to see the voltages.<br />
A colored bar, however, proved more visible. The bus<br />
symbol used was a hollow square. The bottom of the box<br />
represented the low voltage limit, and the top of the box<br />
the high voltage limit, typic<strong>al</strong>ly 0.95 and 1.05 per unit.<br />
The box was filled with a distinctive color from the bottom<br />
up, with the amount of fill proportion<strong>al</strong> to the bus<br />
voltage. (Fig. 6b) This <strong>al</strong>lowed easy identification of patterns<br />
of voltage in the power system by looking for concentrations<br />
of the fill color on the representation. However,<br />
only high voltage patterns could be seen. Low voltages<br />
which are usu<strong>al</strong>ly operation<strong>al</strong>ly more important,<br />
were not as visible.<br />
To improve task specificity, the box was then filled<br />
from the top down. (Fig. 6c) This made low voltages<br />
more visible, at the expense of high ones, but it was <strong>al</strong>so<br />
counter-intuitive. Humans seem to expect things to fill<br />
from the bottom up. In frustration, starting the bar at the<br />
midpoint of the outline box was tried. (Fig. 6d) This was<br />
a tot<strong>al</strong> failure, since high and low voltages had the same<br />
amount of color, so no glob<strong>al</strong> patterns could be seen,<br />
while extracting individu<strong>al</strong> voltages remained confusing.<br />
The encoding which fin<strong>al</strong>ly worked combines two approaches,<br />
filling the box from the bottom up with one<br />
color, and from the top down with a contrasting hue. The<br />
bus voltage v<strong>al</strong>ue is shown by the position of the dividing<br />
line between the two colors. (Fig. 6e) As bus voltage increases,<br />
the line moves up in the box until it exceeds the<br />
limit, where the color outside the limit changes to the<br />
violation color and the box is outlined to show that limits<br />
are being exceeded. (Fig. 6f) The colors chosen are blue<br />
and green, since they contrast with each other are not<br />
used elsewhere on the display.<br />
The combination of line flow and bus voltage representations<br />
has been implemented for the IEEE 118 bus test<br />
case (Fig. 8). The displays were implemented in X-<br />
Windows with X-Toolkit and Athena widgets. They have<br />
been run on both Sun Sparc and HP workstations. A Visu<strong>al</strong><br />
C++ implementation has <strong>al</strong>so been made.<br />
3. Assessment<br />
The developed visu<strong>al</strong>ization permits users to “see” the<br />
power system in a way that is completely new. Power<br />
system state can be taken in at a glance, rather than laboriously<br />
extracted from inspection of many different displays,<br />
after much user interface manipulation. Rapid<br />
identification of problems should permit corrective actions<br />
to be taken promptly enough to avert certain types of<br />
power system collapses. Fig. 9 shows multiple overloads<br />
and bus violations due to a significant load increase. All<br />
of the problems, and their relationships, are clear at a<br />
glance.<br />
The visu<strong>al</strong>ization <strong>al</strong>so makes power system operating<br />
conditions more accessible to non-technic<strong>al</strong> persons such<br />
as managers and regulators, and should improve the integration<br />
of technic<strong>al</strong> considerations into financi<strong>al</strong> and<br />
regulatory decisions.<br />
Potenti<strong>al</strong> future research directions include usability<br />
testing to obtain objective measures of the benefits of<br />
visu<strong>al</strong>ization, integration of visu<strong>al</strong>ization into the complex<br />
EMS user interface, application of visu<strong>al</strong>ization to<br />
addition<strong>al</strong> dispatcher tasks, and attention to the planning<br />
problem, which may include visu<strong>al</strong>ization of power system<br />
dynamics.<br />
4. Acknowledgments<br />
This work has been supported in part by the Nation<strong>al</strong><br />
Science Foundation under award number ECS-9058060.<br />
5. References<br />
[1] "Graphics Put Control Room in the Picture," Modern<br />
Power Systems, Vol. 12, No. 4, pp. 43-45, April<br />
1992.<br />
[2] Electric Power Research Institute, Visu<strong>al</strong>izing Power<br />
System Data, IEEE Transactions on Power Systems,<br />
Report TR-102984, EPRI, P<strong>al</strong>o Alto, C<strong>al</strong>ifornia,<br />
April 1994.<br />
[3] E.R. Tufte, The Visu<strong>al</strong> Display of Quantitative Information,<br />
Graphics Press, Cheshire, Connecticut,<br />
1983.<br />
[4] E.R. Tufte, Envisioning Information, Graphics Press,<br />
Cheshire, Connecticut, 1989.<br />
[5] G.M. Nielson and B. Shriver, Visu<strong>al</strong>ization in Scientific<br />
Computing, IEEE Computer Society Press,<br />
Los Alamitos, CA, 1990.<br />
[6] Electric Power Research Institute, Advanced Graphics<br />
for Power System Operation, Project Report<br />
RP4000-13, EPRI, P<strong>al</strong>o Alto, C<strong>al</strong>ifornia, August<br />
1993.
Figure 1 - Width Encoding of Line Flow<br />
Figure 2 - Overloaded Line Flow Encoding<br />
Figure 3 - Outline Box Encoding of Line Limits<br />
Figure 4 - Single Sided Line Flow Encoding<br />
Figure 5 - System Display With Single Side Flow<br />
a b c d e f<br />
Figure 6 - Bus Voltage Representations<br />
Figure 7 - Voltage Contour Map<br />
Figure 8 - IEEE 118 Bus Test Case<br />
Figure 9 - Multiple Violations
Case Study: Volume Rendering of Pool Fire Data<br />
H. E. Rushmeier and A. Hamins M.-Y. Choi<br />
CAML and BFRL School of Mech. Engr.<br />
NIST Univ. of Illinois at Chicago<br />
Gaithersburg, MD 20899-0001 Chicago, IL 60607-7022<br />
Abstract<br />
We describe how techniques from computer graphics are<br />
used to visu<strong>al</strong>ize pool fire data and compute radiative effects<br />
from pool fires. The basic tools are ray casting and accurate<br />
line integration using the RADCAL program. Example<br />
images in the visible and infrared band are shown which<br />
give qu<strong>al</strong>itative insights about the fire data. Examples<br />
are given of irradiation c<strong>al</strong>culations and novel methods to<br />
visu<strong>al</strong>ize the results of irradiation c<strong>al</strong>culations.<br />
1 Overview<br />
In a pool fire, a puddle or pool of liquid fuel is ignited<br />
and burns in the atmosphere. Understanding pool fires is<br />
important to devising methods to control the impact of hazardous<br />
situations resulting from spilled fuels. In this paper<br />
we consider techniques for visu<strong>al</strong>izing the data measured<br />
in pool fires, and for computing the radiative transfer from<br />
pool fires. Combustion is a ch<strong>al</strong>lenging example for development<br />
of visu<strong>al</strong>ization techniques. Fires are turbulent,<br />
non-steady, and multi-wavelength in emission. Fire data is<br />
an example of a class of visu<strong>al</strong>ization problems for which<br />
it is important to consider the radiative simulation used to<br />
generate visu<strong>al</strong>izations.<br />
We see objects as a result of the visible light they emit,<br />
transmit or reflect. All rendering methods in some way<br />
simulate the radiative transfer of light [4]. When visu<strong>al</strong>izing<br />
abstract representations of objects – such as molecular<br />
models – simple, heuristic rendering methods are useful.<br />
This is particularly true in volume visu<strong>al</strong>ization, in which<br />
a complete physic<strong>al</strong> simulation of light propagation can be<br />
extremely computation<strong>al</strong>ly demanding [5]. However, in<br />
some volumetric problems, radiative transfer is a critic<strong>al</strong><br />
part of the phenomenon being visu<strong>al</strong>ized. For these problems,<br />
using radiometric<strong>al</strong>ly accurate techniques to generate<br />
images of the data can provide useful insights.<br />
In the case of fire data, radiative transfer plays two important<br />
roles. First, data is obtained from fires by detecting<br />
radiation. Data is collected with probes inserted in the fire to<br />
measure radiative transfer over short distances. Qu<strong>al</strong>itative<br />
information about the fire is obtained by simply observing<br />
the luminosity of the flame. Second, a major quantity of interest<br />
is the radiation from the fire that reaches surrounding<br />
surfaces. For example, the flame can ignite adjacent pools<br />
of fuel by radiative heat transfer. Using the techniques to<br />
flame<br />
pan of fuel<br />
z<br />
grid of<br />
measurement<br />
locations<br />
Figure 1: Typic<strong>al</strong> locations for taking pool fire data.<br />
accurately image fire data, efficient c<strong>al</strong>culations can <strong>al</strong>so be<br />
made about the impact of the fire on its surroundings.<br />
In the particular experiments we consider in this paper,<br />
data were taken for a 10 cm diameter heptane pool fire,<br />
using a pair of opposed, water-cooled, nitrogen-purged,<br />
intrusive probes separated by 12 mm, which defined the<br />
optic<strong>al</strong> path. Figure 1 diagrams the fire and typic<strong>al</strong> measurement<br />
locations. Because the time averaged flame is<br />
cylindric<strong>al</strong>ly symmetric, data were taken only for varying<br />
radii r from the center of the pool and for height z above<br />
the pool. Loc<strong>al</strong> instantaneous temperature, soot volume<br />
fraction and CO2 concentrations were determined from<br />
radiation measurement in three wavelength regions (900,<br />
1000 and 4350 nm.) These data were used to estimate the<br />
concentrations of H2O and CO. Typic<strong>al</strong> data locations are<br />
shown in two-dimension<strong>al</strong> plots in Figure 2. Details of the<br />
experiment<strong>al</strong> procedure are given in [1]. These data were<br />
taken to examine various features of radiative transfer from<br />
the fire.<br />
In this paper we consider how visu<strong>al</strong>ization and graphic<strong>al</strong><br />
techniques can be used <strong>al</strong>ong with this data to answer<br />
the following questions:<br />
� How well do the measurements represent the actu<strong>al</strong><br />
data? The two-dimension<strong>al</strong> plots shown in Figure 2<br />
are difficult to relate to one another, and to the luminous<br />
flame observed in the laboratory.<br />
r
z<br />
r<br />
T, K<br />
1450<br />
300<br />
CO2, kPa<br />
3.6<br />
0<br />
soot<br />
(volume fraction)<br />
4.8x10⁻⁷ Figure 2: Typic<strong>al</strong> temperature, CO2 parti<strong>al</strong> pressure, and<br />
soot volume fraction data for a pool fire. The data are<br />
shown in two-dimension<strong>al</strong>, gray-sc<strong>al</strong>ed plots.<br />
� What is the importance of the radiation from the gases<br />
relative to the radiation from the soot? Usu<strong>al</strong>ly in the<br />
past only soot has been considered.<br />
� What is the radiative feedback to the fuel surface?<br />
How much heat does the flame contribute to the pool<br />
surface for vaporization?<br />
� What is the irradiation at points in the space around<br />
the fire? At what distance from the fire would other<br />
materi<strong>al</strong>s be ignited?<br />
2 Visu<strong>al</strong>ization<br />
The basic tool for imaging and computing radiative<br />
transfer is ray casting. Figure 3 diagrams casting a ray<br />
through the volume of data. Because data were only taken<br />
at varying r and z, the volume of data is a stack of cylindric<strong>al</strong><br />
rings. Rays are simply followed from the observer (or<br />
in the case of irradiation c<strong>al</strong>culations from the collector position)<br />
through the cylinder. For each ring encountered, the<br />
next pierce point is found. If the w<strong>al</strong>l of the ring is pierced,<br />
the r index is incremented (or decremented) to find the<br />
next ring encountered, else the z index is incremented or<br />
decremented.<br />
Once the complete travers<strong>al</strong> of the ray is found, a list is<br />
constructed of the ring segments that the ray passes through.<br />
For each segment distance, temperature, soot volume fraction<br />
and gas parti<strong>al</strong> pressure are collected. These data are<br />
passed to the routine RADCAL [2] for performing the line<br />
integration which gives intensity i�l� (energy per unit projected<br />
area, time and solid angle, referred to as radiance in<br />
the lighting and graphics literature) at the end of the ray<br />
path l. RADCAL accurately c<strong>al</strong>culates the radiation taking<br />
into account the detailed spectr<strong>al</strong> properties of CO2, H2O,<br />
CH4, CO, N2, O2 and soot. In [2], RADCAL is presented<br />
as an independent FORTRAN program (code is included<br />
in the publication), however it can readily be adapted to<br />
a c<strong>al</strong>lable subroutine. RADCAL ev<strong>al</strong>uates the following<br />
equations to obtain i�l�:<br />
0<br />
eye<br />
z<br />
Figure 3: Using the measured data, the fire is numeric<strong>al</strong>ly<br />
modelled as a stack of cylindric<strong>al</strong> rings, with uniform properties<br />
in each ring. To generate images or c<strong>al</strong>culate incident<br />
irradiation, rays are cast through the numeric<strong>al</strong> model and<br />
the points where the ray pierces each cylindric<strong>al</strong> ring are<br />
found.<br />
Z �� �l�<br />
0<br />
Z �2<br />
i�l� � i��l�d� (1)<br />
�1<br />
i��l� � i��we ��� �l� �<br />
ib���l � �exp�����l� � ���l � ���d���l � �<br />
�� �<br />
Z l<br />
0<br />
a��l � �dl �<br />
In the above equations � is wavelength, and �1 and �2<br />
are the limits of the wavelength band of interest for the<br />
c<strong>al</strong>culation. The band can be the entire infrared spectrum<br />
for irradiationc<strong>al</strong>culations, or narrow bands for the purpose<br />
of examining radiation in the visible, or other bands of<br />
interest. �� is the optic<strong>al</strong> thickness of the medium, which<br />
by definition is a function of the absorption coefficient a�<br />
<strong>al</strong>ong the path. i��w is the spectr<strong>al</strong> intensityat the beginning<br />
of the ray path. For the pool fire problem, this is taken to be<br />
the black body intensity at norm<strong>al</strong> room temperature (about<br />
300 K). ib���l � � is the blackbody intensity <strong>al</strong>ong the path.<br />
RADCAL considers only absorption and emission <strong>al</strong>ong<br />
the path – not scattering, since the effect of scattering is<br />
negligible for the problem of radiation in combustion products.<br />
RADCAL assumes loc<strong>al</strong> thermodynamic equilibrium<br />
(LTE), which is an accurate assumption for the radiative<br />
transfer of interest in therm<strong>al</strong> problems. It should be noted<br />
that non-LTE radiation, luminescence which occurs by excitation<br />
other than therm<strong>al</strong> agitation, is responsible for a<br />
significant amount of visible radiation in some types of<br />
flames. However visible radiation in most fires, such as the<br />
heptane pool fire considered in this paper, are dominated<br />
by LTE radiation from soot particles.<br />
r
Figure 4: See color plate at end.<br />
One way to ev<strong>al</strong>uate the measurements is to use a camera<br />
model which is sensitive to wavelengths throughoutthe<br />
infrared. Another way is to view the measured data in the<br />
same manner as the fire is physic<strong>al</strong>ly observed. The luminous<br />
flame is imaged by computing radiances in the visible<br />
band and performing appropriate perceptu<strong>al</strong> transformations<br />
to produce a true color image. This would be done<br />
most accurately by using RADCAL to c<strong>al</strong>culate spectr<strong>al</strong> intensities<br />
in the range of 400 nm to 700 nm, convolvingthese<br />
intensities with the CIE X���, Y ��� and Z��� functions<br />
for the human visu<strong>al</strong> system, and converting from XY Z<br />
coordinates to RGB using measured monitor characteristics<br />
(e.g. see [3]). Because the radiated spectrum from the<br />
soot is relatively smooth, to generate images rapidly, we<br />
sampled the spectrum at the peaks of the X� Y� Z curves<br />
only to estimate the ratios X : Y : Z. The sample spectr<strong>al</strong><br />
intensities are in units of watts per meter squared-steradian.<br />
These intensities must be sc<strong>al</strong>ed to CRT display v<strong>al</strong>ues in<br />
the range 0-255. Again, to generate images rapidly, the<br />
results were displayed by simply sc<strong>al</strong>ing the average luminance<br />
v<strong>al</strong>ue to 128 in the fin<strong>al</strong> image.<br />
3 Discussion<br />
Figure 4 shows time-averaged images of a pool fire. For<br />
purposes of comparison, Fig. 4a is the average of 30 images<br />
grabbed from video tape of the actu<strong>al</strong> pool fire. An<br />
unc<strong>al</strong>ibrated video camera was used, and the flame colors<br />
in the video are quite desaturated compared to the colors<br />
observed directly in the laboratory. Figure 4b shows a synthetic<br />
image generated from measured data. Two thousand<br />
measurements were taken at each spati<strong>al</strong> location. Figure<br />
4b was generated using the average of <strong>al</strong>l 2000 v<strong>al</strong>ues<br />
at each location. As expected, the synthetic image shows<br />
that the spacing of the measurements doesn’t represent the<br />
geometric detail of the flame. However, the measurements<br />
are adequate to capture the necking in of the flame near the<br />
fuel surface, and broadening further above the surface.<br />
Figures 4c and d illustrate the difference between radiation<br />
from time averaged measurements, and time averaged<br />
images from a time series of measurements. The image in<br />
Fig. 4c as generated using the average of 30 measurements<br />
at each location. The image in Fig. 4d was generated by<br />
averaging 30 images, each generated by using just one of<br />
the 30 measurements at each location. Because intensity<br />
v<strong>al</strong>ues must be clipped for each image, the image in 4d<br />
is desaturated in a similar manner as the averaged video<br />
image in 4a. A comparison of Figs. 4c and d shows that<br />
there is a substanti<strong>al</strong> difference between the radiation from<br />
averaged data and the average radiation. This indicates<br />
that just as spati<strong>al</strong>ly detailed data is needed, rather than<br />
data averaged over the volume, tempor<strong>al</strong>ly detailed rather<br />
than time-averaged data is needed to accurately estimate<br />
radiation transfer from the flame.<br />
Note that in <strong>al</strong>l of the synthetic images in Fig. 4 no<br />
numeric<strong>al</strong> legend is shown. This is because these are visu<strong>al</strong><br />
simulations, not pseudo-colored displays.<br />
Intensity,<br />
W/m 2 str<br />
3600<br />
0<br />
gas + soot soot only<br />
Figure 5: Infrared images of radiation from soot and gas,<br />
versus soot <strong>al</strong>one.<br />
Insight into the relative importance of soot versus gas<br />
radiation can be gained by imaging the fire using a synthetic<br />
camera which includes wavelengths through the entire infrared<br />
range. Figure 5 shows the resulting image when temperatures,<br />
soot volume fraction. and gas parti<strong>al</strong> pressure<br />
data are given to RADCAL (on the right), versus the image<br />
which results when temperatures and soot volume fraction<br />
data only are used. A comparison of the figures shows that<br />
the gases are responsible for a significant amount of radiation.<br />
A numeric<strong>al</strong> legend is shown on these images, since<br />
the gray shades are assigned based on the tot<strong>al</strong> intensity<br />
visible at each pixel, not on perceptu<strong>al</strong> principles.<br />
The same ray casting and line integration techniques<br />
used to generate images can be used to compute irradiance<br />
on surfaces around the fire. For example, the radiative<br />
feedback per unit area, q00�r� to a point on the pool surface<br />
at radius r is given by:<br />
q00�r� �<br />
Z 2�<br />
0<br />
Z ��2<br />
i��� ��cos���d�d� (2)<br />
0<br />
The angles � and � are respectively the polar and azimuth<strong>al</strong><br />
angles of a coordinate system based on the pool<br />
surface. The intensity i��� �� is the incident intensity from<br />
direction ��� ��. i��� �� is found by casting in a ray in the<br />
direction ��� �� and computing i�l� for that direction, as in<br />
Eq. 1. The integr<strong>al</strong> can be ev<strong>al</strong>uated using a Monte Carlo<br />
method, summing up the results of casting rays in a large<br />
number of randomly chosen directions. Figure 6 shows<br />
typic<strong>al</strong> results for the fire data given in Figure 2. Figure 6<br />
<strong>al</strong>so shows sm<strong>al</strong>l, wide angle images (136 degree field of<br />
view) generated from each of the points for which q00�r�<br />
was c<strong>al</strong>culated. These images demonstrate that the f<strong>al</strong>l off<br />
in irradiation is primarily due to the decreasing solid angle<br />
subtended by the hot products of combustion. (Note, these<br />
results are only shown as examples of the c<strong>al</strong>culations. Details<br />
of numeric<strong>al</strong> results for tot<strong>al</strong> radiative feed back to the<br />
pool fire can be found in [1]).<br />
The incident flux q00 at other surfaces around the fire is<br />
<strong>al</strong>so of interest, to study the potenti<strong>al</strong> for ignition of other
3000<br />
Irradiation , W/m2<br />
1500<br />
0.00 0.05<br />
radius, m<br />
Figure 6: Irradiation of the pool surface by the hot combustion<br />
products. The sm<strong>al</strong>l images show a wide angle view<br />
image of the view of the combustion products at the various<br />
radi<strong>al</strong> positions looking upward from the pool surface.<br />
materi<strong>al</strong>s. The incident flux is a function of position in the<br />
volume around the fire, and orientation relative to the fire.<br />
To estimate the flux in the space around the fire, Eq. 2 was<br />
ev<strong>al</strong>uated for a grid of points in the space around the fire,<br />
with a surface norm<strong>al</strong> vector oriented towards the center of<br />
the fire to estimate the maximum flux. Because the fire data<br />
is rotation<strong>al</strong>ly symmetric, the results can be diagrammed in<br />
two dimensions as shown in Figure 7. However, this does<br />
not give a good sense of the meaning of the data to a casu<strong>al</strong><br />
observer – it doesn’t communicate that the irradiation is<br />
spread through space and that it applies to surfaces oriented<br />
towards the fire. In Figure 8, a volumetric rendition of<br />
the irradiation data is shown. A collection of spheres are<br />
colored according to the maximum incident flux at that<br />
location. A simple lighting heuristic is used to highlight<br />
the sphere in the direction of the fire, to emphasize the role<br />
of orientation in the flux c<strong>al</strong>culation.<br />
4 Summary and Future Work<br />
We have shown how techniques from computer graphics<br />
can be used to gain insight into data from pool fires. Visible<br />
images generated using measured data demonstrated<br />
how well the measurements represented the fire. Images<br />
generated over the entire infrared spectrum demonstrated<br />
the relative importance of gas versus soot emission. The<br />
same ray casting that was used to generate images was used<br />
to c<strong>al</strong>culate irradiation from the fire. Graphic<strong>al</strong> techniques<br />
were further used to illustrate the results of the irradiation<br />
c<strong>al</strong>culations.<br />
The data in the examples given in this paper were obtained<br />
using an immersive probe. Such a probe has the<br />
disadvantage that the entire temperature and emissivity distributioncannot<br />
be obtained simultaneously. An <strong>al</strong>ternative<br />
approach for obtaining fire data is imaging, and applying<br />
techniques from tomography. A potenti<strong>al</strong> future role for<br />
synthetic images of fire data may be in the design of such<br />
imaging systems.<br />
0.5<br />
z,m<br />
0.4<br />
0.3<br />
0.2<br />
0.1<br />
1500<br />
1200<br />
900<br />
600 W/m2<br />
0.1 0.2 0.3 0.4 0.5r,m<br />
Figure 7: Two-dimension<strong>al</strong> plot of contours of constant<br />
irradiation for points around the pool fire.<br />
References<br />
Figure 8: See color plate at end.<br />
[1] M.Y. Choi, A. Hamins, H. Rushmeier and T. Kashiwagi.<br />
Simultaneous optic<strong>al</strong> measurement of soot volume<br />
fraction, temperature and CO2 in heptane pool<br />
fire. To appear in The Proceedings of the 25 th Symposium<br />
(Int’l) on Combustion .<br />
[2] W.L. Grosshandler. RADCAL: A narrow-band model<br />
for radiation c<strong>al</strong>culations in a combustion environment.<br />
NIST Technic<strong>al</strong> Note 1402. Nation<strong>al</strong> Institute<br />
of Standards and Technology, April 1993.<br />
[3] R. H<strong>al</strong>l. Illumination and Color in Computer Generated<br />
Imagery. Springer-Verlag, 1989.<br />
[4] J.T. Kajiya. The rendering equation. In Computer<br />
Graphics (SIGGRAPH ’86 Proceedings), pages 143-<br />
150. ACM SIGGRAPH, 1986.<br />
[5] H.E. Rushmeier and K.E. Torrance. The zon<strong>al</strong> method<br />
for c<strong>al</strong>culating light intensities in the presence of a<br />
participating medium. In Computer Graphics (SIG-<br />
GRAPH ’87 Proceedings), pages 293-302. ACM SIG-<br />
GRAPH, 1987.
0.5m<br />
volume of<br />
measured data<br />
0.5 m<br />
W/m2<br />
3200<br />
500<br />
Figure 4:<br />
a. (upper left) Average of<br />
30 video frames of pool<br />
fire.<br />
b. (upper right) Synthetic<br />
image generated using<br />
data averaged from 2000<br />
time samples.<br />
c. (lower left) Synthetic<br />
image generated using data<br />
averaged from 30 time<br />
samples.<br />
d. (lower right) Synthetic<br />
image generated by averaging<br />
images of 30 time samples.<br />
Figure 8:<br />
Three dimension<strong>al</strong><br />
representation of irradiation<br />
in the volume of space<br />
surrounding the pool fire.<br />
The color of each sphere<br />
is determined by the<br />
maximum irradiation at<br />
that point. The shading<br />
of each sphere is determined<br />
by the direction to the<br />
center of the fire.
Case Study� Visu<strong>al</strong>ization of Volcanic Ash Clouds<br />
Mitchell Roth Rick Guritz<br />
Arctic Region Supercomputing Center Alaska Synthetic Aperture Radar Facility<br />
University of Alaska University of Alaska<br />
Fairbanks� AK 99775�6020 Fairbanks� AK 99775<br />
Abstract<br />
Ash clouds resulting from volcanic eruptions are a<br />
serious hazard to aviation safety. In Alaska <strong>al</strong>one�<br />
there are over 40 active volcanoes whose eruptions<br />
may a�ect more than 40�000 �ights using the great cir�<br />
cle polar routes each year. The clouds are especi<strong>al</strong>ly<br />
problematic because they are invisible to radar and<br />
nearly impossible to distinquish from weather clouds.<br />
The Arctic Region Supercomputing Center and the<br />
Alaska Volcano Observatory have collaborated to de�<br />
velop a system for predicting and visu<strong>al</strong>izing the move�<br />
ment of volcanic ash clouds when an eruption occurs.<br />
The output from the model is combined with a dig�<br />
t<strong>al</strong> elevation model to produce a re<strong>al</strong>istic view of the<br />
ash cloud which may be examined interactively from<br />
any desired point of view at any time during the pre�<br />
diction period. This paper describes the visu<strong>al</strong>ization<br />
techniques employed in the system and includes a video<br />
animation of the 1989 Mount Redoubt eruption which<br />
caused complete engine failure on a 747 passenger jet.<br />
1 Introduction<br />
Alaska is situated on the northern boundary of the<br />
Paci�c Rim. Home to the highest mountains in North<br />
America� the mountain ranges of Alaska contain over<br />
40 active volcanoes� shown in red in Figure 1. In the<br />
past 200 years most of Alaska�s volcanoes have erupted<br />
at least once. Alaska is a polar crossroads where air�<br />
craft traverse the great circle airways between Asia�<br />
Europe and North America� as shown in white in Fig�<br />
ure 1. Volcanic eruptions in Alaska and the resulting<br />
airborne ash clouds pose a signi�cant hazard to more<br />
than 40�000 transpolar �ights each year.<br />
The ash clouds created by volcanic eruptions are<br />
invisible to radar and are often conce<strong>al</strong>ed by weather<br />
clouds. This paper describes a system developed by<br />
the Alaska Volcano Observatory and the Arctic Region<br />
Supercomputing Center for predicting the movement<br />
of ash clouds. Using meteorologic<strong>al</strong> and geophysic<strong>al</strong><br />
data from volcanic eruptions� a supercomputer model<br />
provides predictions of ash cloud movements for up<br />
to 72 hours. The AVS visu<strong>al</strong>ization system is used to<br />
control the execution of the ash cloud model and to<br />
display the model output in three dimension<strong>al</strong> form<br />
showing the location of the ash cloud over a digit<strong>al</strong><br />
terrain model.<br />
Figure 1� Active volcanoes and air routes in Alaska.<br />
Eruptions of Mount Redoubt on the morning of De�<br />
cember 15� 1989� sent ash particles more than 40�000<br />
feet into the atmosphere. On the same day� a Boeing<br />
747 passenger jet experienced complete engine failure<br />
when it penetrated the ash cloud. The ash cloud pre�<br />
diction system was used to simulate this eruption and<br />
to produce an animated �yby of Mount Redoubt dur�<br />
ing a 12 hour period of the December 15 eruptions<br />
including the encounter of the jetliner with the ash<br />
cloud. The animation combines the motion of the<br />
viewer with the time evolution of the ash cloud above<br />
a digit<strong>al</strong> terrain model.<br />
The visu<strong>al</strong>ization of the aircraft encounter with the<br />
ash cloud can be used to test the accuracy of the ash<br />
plume model. The aircraft position was known ac�<br />
curately in three dimensions at the time of the en�<br />
counter and can be compared with the position of the<br />
ash cloud produced by the model. Satellite imagery is<br />
<strong>al</strong>so used to assess the accuracy of the model by com�
paring the observed horizont<strong>al</strong> extent of the ash cloud<br />
with the visu<strong>al</strong>ization produced from the model data.<br />
2 Ash Plume Model<br />
The ash cloud visu<strong>al</strong>ization is based on the out�<br />
put of a model developed by Hiroshi Tanaka of the<br />
Geophysic<strong>al</strong> Institute of the University of Alaska and<br />
Tsukuba University� Japan. Using meteorologic<strong>al</strong><br />
data and eruption parameters for input� the model<br />
predicts the density of volcanic ash particles in the at�<br />
mosphere as a function of time. The three dimension<strong>al</strong><br />
Lagrangian form of the di�usion equation is employed<br />
to model particle di�usion� taking into account the<br />
size distribution of the ash particles and gravitation<strong>al</strong><br />
settling described by Stokes� law. Details of the model<br />
are given in �2� 3�.<br />
The meteorologic<strong>al</strong> data required are winds in the<br />
upper atmosphere. These are obtained from UCAR<br />
Unidata in NetCDF format. Unidata winds are inter�<br />
polated to observed conditions on 12 hour interv<strong>al</strong>s.<br />
Glob<strong>al</strong> circulation models are used to provide up to<br />
72 hour predictions at 6 hour interv<strong>al</strong>s.<br />
The eruption parameters for the model include the<br />
geographic<strong>al</strong> location of the volcano� the time and du�<br />
ration of the event� <strong>al</strong>titude of the plume� particle den�<br />
sity� and particle density distribution.<br />
The raw output from the model for each time step<br />
consists of a list of particles with an �x�y�z� coordinate<br />
for each particle. An AVS module reads the particle<br />
data and increments the particle counts for the cells<br />
formed by an array indexed over �x�y�z�. We chose a<br />
resolution of 150x150x50 for the particle density array�<br />
which equ<strong>al</strong>s 1.1 million data points at each solution<br />
point in time. For the video animation� we ran the<br />
model with a time step of 5 minutes. For 13 hours<br />
of simulated time� the model produced 162 plumes�<br />
amounting to approximately 730 MB of integer v<strong>al</strong>ued<br />
volume data.<br />
3 Ash Cloud Visu<strong>al</strong>ization<br />
The ash cloud is rendered as an isosurface with a<br />
brown color approximating volcanic ash. The render�<br />
ing obtained through this technique gives the viewer a<br />
visu<strong>al</strong> e�ect showing the boundaries of the ash cloud.<br />
Details of the cloud shape are highlighted through<br />
lighting e�ects and� when viewed on a computer work�<br />
station� the resulting geometry can be manipulated<br />
interactively to view the ash cloud from any desired<br />
direction.<br />
At any point in time� the particle densities in<br />
the ash cloud are represented by the v<strong>al</strong>ues in a<br />
150x150x50 element integer array. The limits of the<br />
cloud may be observed using the isosurface module<br />
in the AVS network shown in Figure 2 with the iso�<br />
surface level set equ<strong>al</strong> to 1.<br />
Figure 2� AVS network to generate plume isosurface.<br />
As the cloud disperses� the particle concentrations<br />
in the array decrease and holes and isolated cells be�<br />
gin to appear in the isosurface around the edges of<br />
the plume where the density is between zero and one<br />
particle. These e�ects are especi<strong>al</strong>ly noticeable in a<br />
time animation of the plume evolution. To create a<br />
more uniform cloud for the video animation� without<br />
increasing the over<strong>al</strong>l particle counts� the density ar�<br />
ray was low pass �ltered by an inverse square kernel<br />
before creating the isosurface. An example of a �ltered<br />
plume created by this technique is shown in Figure 3.<br />
Figure 3� Ash cloud visu<strong>al</strong>ized as an isosurface.<br />
4 Plume Animation<br />
The plume model must use time steps of 5 minutes<br />
or greater due to limitations of the model. Plumes<br />
that are generated at 5 minute interv<strong>al</strong>s may be dis�<br />
played to create a �ip chart animation of the time<br />
evolution of the cloud. However� the changes in the<br />
plume over a 5 minute interv<strong>al</strong> can be fairly dramatic<br />
and shorter time interv<strong>al</strong>s are required to create the
e�ect of a smoothly evolving cloud. To accomplish<br />
this without generating addition<strong>al</strong> plume volumes we<br />
interpolate between successive plume volumes. Using<br />
the �eld math module� we implemented linear inter�<br />
polation between plume volumes in the network shown<br />
in Figure 4.<br />
Figure 4� AVS plume interpolation network.<br />
The linear interpolation formula is�<br />
P �t� � P i � �P i�1 � P i�t� 0 � t � 1� �1�<br />
where P i is the plume volume at model time step i<br />
and t is time. The di�erence term in �1� is formed in<br />
the upper �eld math module. The lower �eld math<br />
module sums its inputs. Norm<strong>al</strong>ly� a separate module<br />
would be required to perform the multiplication by t.<br />
However� it is possible to multiply the output port of<br />
a �eld math module by a constant v<strong>al</strong>ue when the<br />
network is executed from a CLI script and this is the<br />
approach we used to create the video animation of the<br />
eruption. If it is desired to set the interpolation pa�<br />
rameter interactively� it is necessary to insert a third<br />
�eld math module to perform the multiplication on<br />
the output of the upper module. This can be an ex�<br />
tremely e�ective device for producing smooth time an�<br />
imation of discrete data sets in conjunction with the<br />
AVS Animator module.<br />
One addition<strong>al</strong> animation e�ect was introduced to<br />
improve the appearance of the plume at the beginning<br />
of the eruption. The plume model assumes that the<br />
plume reaches the speci�ed eruption height instanta�<br />
neously. Thus� the plume model for the �rst time step<br />
produces a cylindric<strong>al</strong> isosurface of uniform particle<br />
densities above the site of the eruption. To create the<br />
appearance of a cloud initi<strong>al</strong>ly rising from the ground�<br />
we de�ned an arti�ci<strong>al</strong> plume for time 0. The time 0<br />
plume isosurface consists of an inverted cone of nega�<br />
tive plume densities centered over the eruption coordi�<br />
nates. The top of the plume volume contains the most<br />
negative density v<strong>al</strong>ues. When this plume volume is<br />
interpolated with the model plume from time step 1�<br />
the resulting plume rises from the ground and reaches<br />
the full eruption height at t � 1.<br />
5 Terrain Visu<strong>al</strong>ization<br />
The geographic<strong>al</strong> region for this visu<strong>al</strong>ization study<br />
is an area in southcentr<strong>al</strong> Alaska which lies between<br />
141 � � 160 � west longitude and 60 � � 67 � north lati�<br />
tude. The corners of the region de�ne a Cartesian co�<br />
ordinate system and the extents of the volcano plume<br />
data must be adjusted to obtain the correct registra�<br />
tion of the plume data in relation to the terrain.<br />
The terrain features are based on topographic data<br />
obtained from the US Geologic<strong>al</strong> Survey with a grid<br />
spacing of approximately 90 meters. This grid was<br />
much too large to process at the origin<strong>al</strong> resolution<br />
and was downsized to a 1426x1051 element array of<br />
terrain elevations� which corresponds to a grid size of<br />
approximately 1�2 mile. As shown in Figure 5� the<br />
terrain data were read in AVS �eld data format and<br />
were converted to a geometry using the �eld to mesh<br />
module.<br />
Figure 5� AVS terrain network.<br />
We <strong>al</strong>so included a downsize module ahead of �eld<br />
to mesh because even the 1426x1051 terrain exceeded<br />
available memory on <strong>al</strong>l but our largest machines. For<br />
prototyping and animation design� we typic<strong>al</strong>ly down�<br />
sized by factors of 2 to 4 in order to speed up the<br />
terrain rendering.<br />
The colors of the terrain are set in the generate<br />
colormap module according to elevation of the ter�<br />
rain and were chosen to approximate ground cover<br />
during the f<strong>al</strong>l season in Alaska. The vertic<strong>al</strong> sc<strong>al</strong>e<br />
of the terrain was exaggerated by a factor of 60 to<br />
better emphasize the topography.
The resulting terrain is shown Figure 6 with labels<br />
that were added using image processing techniques.<br />
Features in the study area include Mount Redoubt�<br />
Mount McKinley� the Alaska Range� Cook Inlet and<br />
the cities of Anchorage� Fairbanks and V<strong>al</strong>dez.<br />
Figure 6� Terrain visu<strong>al</strong>ization of study area.<br />
To create the glob<strong>al</strong> zoom sequence in the introduc�<br />
tion to the video animation� this image was used as a<br />
texture map that was overlaid onto a lower resolution<br />
terrain model for the entire state of Alaska. This tech�<br />
nique <strong>al</strong>so <strong>al</strong>lowed the study area to be highlighted in<br />
such a way as to create a smooth transition into the<br />
animation sequence.<br />
6 Flight Path Visu<strong>al</strong>ization<br />
The �ight path of the jetliner in the animation was<br />
produced by applying the tube module to a polyline<br />
geometry produced by the read geom module. The<br />
animation of the tube was performed by a simple pro�<br />
gram which takes as its input a time dependent cubic<br />
spline. The program ev<strong>al</strong>uates the spline at speci�ed<br />
points to create a polyline geometry for read geom.<br />
Each new point added to the polyline causes a new<br />
segment of the �ight path to be generated. Four sep�<br />
arate tube modules were employed to <strong>al</strong>low the �ight<br />
path segments to be colored green� red� yellow� and<br />
green during the engine failure and restart sequence.<br />
The path of the jetliner is based on �ight recorder<br />
data obtained from the Feder<strong>al</strong> Aviation Administra�<br />
tion. The �ight path was modeled using three dimen�<br />
sion<strong>al</strong> time dependent cubic splines. The technique<br />
for deriving and manipulating the spline functions is<br />
so powerful that we created a new module c<strong>al</strong>led the<br />
Spline Animator for this purpose. The details of<br />
this module are described in �1�. A similar technique<br />
is used to control the camera motion required for the<br />
�yby in the video animation.<br />
By combining the jetliner �ight path with the ani�<br />
mation of the ash plume described earlier� a simulated<br />
encounter of the jet with the ash cloud can be studied<br />
in an animated sequence. The resulting simulation<br />
provides v<strong>al</strong>uable information about the accuracy of<br />
the plume model. Because ash plumes are invisible to<br />
radar and may be hidden from satellites by weather<br />
clouds� it is often very di�cult to determine the ex�<br />
act position and extent of an ash cloud from direct<br />
observations. However� when a jetliner penetrates an<br />
ash cloud� the e�ects are immediate and unmistakable<br />
and the aircraft position is usu<strong>al</strong>ly known rather ac�<br />
curately. This was the case during the December 15<br />
encounter.<br />
By comparing the intersection point of the jetliner<br />
�ight path with the plume model to the point of inter�<br />
section with the actu<strong>al</strong> plume� one can determine if the<br />
leading edge of the plume model is in the correct posi�<br />
tion. Both the plume model and the �ight path must<br />
be correctly co�registered to the terrain data in order<br />
to perform such a test. Using standard transforma�<br />
tions between latitude�longitude and x�y coordinates<br />
for the terrain� we c<strong>al</strong>culated the appropriate coor�<br />
dinate transformations for the plume model and jet<br />
�ight path. The �rst time the animation was run we<br />
were quite amazed to observe the �ight path turn red�<br />
denoting engine failure� at precisely the point where<br />
the �ight path encountered the leading edge of the<br />
modeled plume. Apparently this was one of those rare<br />
times when we got everything right. The fact that the<br />
aircraft position is well known at <strong>al</strong>l times� and that it<br />
encounters the ash cloud at the correct time and place<br />
lends strong support for the correctness of the model.<br />
Figure 7 shows a frame from the video animation at<br />
the time when the jetliner landed in Anchorage. The<br />
Figure 7� Flight path of jetliner through ash cloud.
Figure 8� AVHRR image taken at 1�27pm.<br />
ash cloud in this image is drifting from left to right<br />
and away from the viewer.<br />
7 Satellite Image Comparison<br />
Ash clouds can often be detected in AVHRR satel�<br />
lite images. For the December 15 events� only one<br />
image recorded at 1�27pm AST was available. At the<br />
time of this image most of the study area was blan�<br />
keted by clouds. Nevertheless� certain atmospheric<br />
features become visible when the image is subjected<br />
to enhancement� as shown in Figure 8. A north�south<br />
front<strong>al</strong> system is moving northeasterly from the left<br />
side of the image. To the left of the front� the sky<br />
is gener<strong>al</strong>ly clear and surface features are visible. To<br />
the right of the front� the sky is completely overcast<br />
and no surface features are visible. One prominent<br />
cloud feature is a mountain wave created by Mount<br />
McKinley. This shows up as a long plume moving in<br />
a north�northeasterly direction from Mount McKinley<br />
and is consistent with upper <strong>al</strong>titude winds on this<br />
date.<br />
The satellite image was enhanced in a manner<br />
which causes ash clouds to appear black. There is<br />
clearly a dark plume extending from Mount Redoubt<br />
near the lower edge of the image to the northeast and<br />
ending in the vicinity of Anchorage. The size of this<br />
plume indicates that it is less than an hour old. Thus�<br />
it could not be the source of the plume which the jet<br />
encountered approximately 2 hours before this image<br />
was taken.<br />
There are addition<strong>al</strong> black areas in the upper right<br />
quadrant of the image which are believed to have origi�<br />
nated with the 10�15am eruption. These are the clouds<br />
which the jet is believed to have penetrated approx�<br />
imately 2 hours before this image was taken. The<br />
image has been annotated with the jetliner �ight path<br />
entering in the top center of the image and proceeding<br />
Figure 9� Simulated ash cloud at 1�30pm.<br />
from top to bottom in the center of the image. The<br />
ash cloud encounter occurred at the point where the<br />
�ight path reverses course to the north and east. How�<br />
ever� the satellite image does not show any ash clouds<br />
remaining in the vicinity of the �ight path by the time<br />
of this image.<br />
When the satellite image is compared with the<br />
plume model for the same time period� shown at ap�<br />
proximately the same sc<strong>al</strong>e in Figure 9� a di�erence in<br />
the size of the ash cloud is readily apparent. While the<br />
leading edge of the simulated plume stretching to the<br />
northeast is located in approximately the same posi�<br />
tion as the dark clouds in the satellite image� the cloud<br />
from the simulated plume is much longer. The length<br />
of the simulated plume is controlled by the duration<br />
of the eruption� which was 40 minutes.<br />
Two explanations for the di�erences have been pro�<br />
posed. The �rst is that the length of the eruption was<br />
determined from seismic data. Seismicity does not<br />
necessarily imply the emission of ash and therefore the<br />
actu<strong>al</strong> ash emission time may have been less than 40<br />
minutes. The second possibility is that the trailing end<br />
of the ash cloud may be invisible in the satellite image<br />
due to cloud cover. It is worth noting that the ash<br />
cloud signatures in this satellite image are extremely<br />
weak compared to cloudless images. In studies of the<br />
few other eruptions where clear images were available�<br />
the ash clouds are unmistakable in the satellite image<br />
and the model showed excellent agreement with the<br />
satellite data.<br />
8 Conclusions<br />
An ash plume modeling and prediction system has<br />
been developed using AVS for visu<strong>al</strong>ization and a Cray<br />
supercomputer for model computations. A simulation<br />
of the December 15 encounter with ash clouds from
Mount Redoubt by a jetliner provides strong support<br />
for the accuracy of the model. Although the satel�<br />
lite data for this event are relatively limited� agree�<br />
ment of the model with satellite data for other events<br />
is very good. The animated visu<strong>al</strong>ization of the erup�<br />
tion which was produced using AVS demonstrates that<br />
AVS is an extremely e�ective tool for developing vi�<br />
su<strong>al</strong>izations and animations. The Spline Animator<br />
module was developed to perform �ybys and may be<br />
used to construct animated curves or �ight paths in<br />
3D.<br />
9 Acknowledgments<br />
The eruption visu<strong>al</strong>ization of Mount Redoubt Vol�<br />
cano was produced in a collaborative e�ort by the Uni�<br />
versity of Alaska Geophysic<strong>al</strong> Institute and the Arctic<br />
Region Supercomputing Center. Speci<strong>al</strong> thanks are<br />
due Ken Dean of the Alaska Volcano Observatory and<br />
to Mark Astley and Greg Johnson of ARSC.<br />
This project was supported by the Strategic En�<br />
vironment<strong>al</strong> Research and Development Program<br />
�SERDP� under the sponsorship of the Army Corps<br />
of Engineers Waterways Experiment Station.<br />
References<br />
�1� Astley� M. and M. Roth� �Spline Animator�<br />
Smooth Camera Motion for AVS Animations��<br />
AVS �94 Conference Proceedings� Boston� Mas�<br />
sachusetts� May 1994� pg 142�151.<br />
�2� Tanaka� H.� �Development of a Prediction<br />
Scheme for the Volcanic Ash F<strong>al</strong>l from Redoubt<br />
Volcano�� First Internation<strong>al</strong> Symposium on Vol�<br />
canic Ash and Aviation Safety� Seattle� Washing�<br />
ton� July 1991� U. S. Geologic<strong>al</strong> Survey Circular<br />
165� 58 pp.<br />
�3� Tanaka� H.� K.G. Dean� and S. Akasofu� �Predic�<br />
tion of the Movement of Volcanic Ash Clouds��<br />
submitted to EOS Transactions� Am. Geophys.<br />
Union� Dec. 1992.
Introduction<br />
Ch<strong>al</strong>lenges and Opportunities in Visu<strong>al</strong>ization for<br />
NASA's EOS Mission to Planet Earth<br />
Visu<strong>al</strong>ization will be vit<strong>al</strong> to the success of the NASA<br />
EOS Mission to Planet Earth (MTPE), which will gather,<br />
generate, and distribute an unprecedented volume of data<br />
for the purpose of glob<strong>al</strong> change research and<br />
environment<strong>al</strong> policy decisions. No other planned or past<br />
mission will influenced such a large, diverse scientific<br />
community, consisting of atmospheric scientists,<br />
oceanographers, geologists, ecologists, environment<strong>al</strong><br />
scientists, climatologist, computer modelers, and soci<strong>al</strong><br />
scientists. This influence will extend well beyond those<br />
individu<strong>al</strong>s and institutions presently involved in the<br />
mission planning, resulting in a very large potenti<strong>al</strong> client<br />
community with a high demand for new and innovative<br />
visu<strong>al</strong>ization tools.<br />
The needs for visu<strong>al</strong>ization tools within EOS extend<br />
beyond post-processing of generated data, into areas of<br />
qu<strong>al</strong>ity control and data v<strong>al</strong>idation, database query and<br />
browse, mission planning, <strong>al</strong>gorithm development and<br />
testing, processing pipeline control, and data integration.<br />
Requirements for visu<strong>al</strong>ization within the EOS mission<br />
will greatly ch<strong>al</strong>lenge existing and future visu<strong>al</strong>ization<br />
technology. In addition, tradition<strong>al</strong> boundaries between<br />
visu<strong>al</strong>ization, an<strong>al</strong>ysis, and data management will need to<br />
be dissolved. Appropriate advancements in scientific<br />
visu<strong>al</strong>ization will require greater interaction between<br />
Mike Botts, Chair<br />
The University of Alabama in Huntsville<br />
Jon D. Dykstra<br />
Intergraph Corporation<br />
Lee S. Elson<br />
Jet Propulsion Laboratory<br />
Steven J. Goodman<br />
NASA Marsh<strong>al</strong>l Space Flight Center<br />
Meemong Lee<br />
Jet Propulsion Laboratory<br />
scientists and software developers than there has been in<br />
the past.<br />
This panel will focus on the ch<strong>al</strong>lenges and opportunities<br />
for visu<strong>al</strong>ization with regard to the Mission to Planet<br />
Earth. Directions presently being taken within NASA to<br />
fund and assist development of new tools will <strong>al</strong>so be<br />
discussed. The panel session will be designed to hopefully<br />
spark innovative ideas for meeting present and future<br />
needs within EOS and the gener<strong>al</strong> scientific visu<strong>al</strong>ization<br />
community. The panel consist of a mix of earth scientists<br />
and computer scientists who have a strong interest in<br />
advancing visu<strong>al</strong>ization technology and are involved in<br />
various aspects of EOS.<br />
Panel Statements:<br />
Mike Botts<br />
Visu<strong>al</strong>ization within the EOS era will provide significant<br />
ch<strong>al</strong>lenges to present and future tool development, but will<br />
<strong>al</strong>so provide an abundance of opportunities for innovated<br />
ideas and markets. Many of these ch<strong>al</strong>lenges stem from<br />
requirements to handle large and abundant data files, to<br />
integrate disparate data sets from many types of sensors,<br />
to incorporate more science intelligence and data-specific<br />
knowledge into tools, to <strong>al</strong>low expanded an<strong>al</strong>ytic<strong>al</strong><br />
capabilities within visu<strong>al</strong>ization tools, and to account for
the movement toward more "softcopy" capabilities rather<br />
than post-processing on pre-generated data sets.<br />
Capabilities for extending gener<strong>al</strong> visu<strong>al</strong>ization tools to<br />
incorporate science or data-specific needs must continue<br />
to advance beyond that presently available. NASA MTPE<br />
is moving toward efforts to modularize and encapsulate<br />
such expert knowledge into both the data formats and tool<br />
development. Thus, data files will become more complex<br />
but more intelligent than at present and will gener<strong>al</strong>ly<br />
require EOS-supplied API's to fully understand. In<br />
addition, expert processing and an<strong>al</strong>ysis <strong>al</strong>gorithms will<br />
be available from the science community; it will be<br />
important to standardize on the presentation of these<br />
<strong>al</strong>gorithms such that they could easily be incorporated into<br />
visu<strong>al</strong>ization and an<strong>al</strong>ysis tools. Visu<strong>al</strong>ization tools which<br />
not only <strong>al</strong>lows access to EOS data, but which can<br />
maximize on the use of the ancillary information that will<br />
be provided, will be the tools most popular within the very<br />
large community which will use EOS data.<br />
The ability to use lower-level data (i.e. sensor data that<br />
has not been mapped and preprocessed) is an increasingly<br />
important need within the earth science community and is<br />
a requirement not being well met by present tools.<br />
Efforts, such as the Interuse Experiment, are underway<br />
which should <strong>al</strong>low easier incorporation of advanced<br />
capabilities for geolocating, mapping, integrating, and<br />
processing of lower level data within visu<strong>al</strong>ization tools.<br />
These are initi<strong>al</strong> efforts toward a more "softcopy"<br />
approach to data, in which higher level data products are<br />
processed as needed within tools rather than precomputed,<br />
stored, and distributed as inflexible data sets.<br />
Jon Dykstra<br />
Satellites within the nation<strong>al</strong> and internation<strong>al</strong> EOS<br />
family will be generating a wide spectrum of data set<br />
volumes and geometry. Clearly, in order to promote and<br />
encourage the use of these data by the largest number of<br />
end-users, it will be necessary to: 1) facilitate the process<br />
of data search and acquisition, 2) provide the data in an<br />
appropriate geometry and, 3) format the data in an<br />
optim<strong>al</strong> manner for viewing and processing.<br />
These ch<strong>al</strong>lenges, especi<strong>al</strong>ly the one of format, are<br />
particularly acute when de<strong>al</strong>ing with high volume data<br />
sets, e.g. high spati<strong>al</strong> resolution data or mosaics of<br />
multiple EOS data sets. The commerci<strong>al</strong> photogrammetry<br />
and image processing industry has developed sever<strong>al</strong><br />
formatting techniques for de<strong>al</strong>ing efficiently with large (><br />
50 megabytes to over a Gigabyte) images. These<br />
techniques include image tiling, data compression and<br />
extensive use of image overviews. In order to best meet<br />
the EOS customer's needs, the issue of optimum data<br />
format ought to be thought through. The more conducive<br />
the EOS image format is to the end user's application, the<br />
more efficiently and effectively the data will be used.<br />
Lee Elson<br />
Visu<strong>al</strong>ization in the EOS era (end of the century and<br />
beyond) will have to satisfy emerging technic<strong>al</strong>, soci<strong>al</strong>,<br />
and scientific needs. Perhaps the most common element<br />
in these requirements is data availability and access.<br />
Visu<strong>al</strong>ization tools will be forced to accept data from a<br />
wide variety of sources and locations. An obvious result<br />
of this trend is the need for standardization: tools must<br />
converge on community-wide practices which become defacto<br />
standards. This process must proceed by consensus<br />
rather than by extern<strong>al</strong>ly imposed edicts. Examples of<br />
problems inherent in this process will be discussed.<br />
Scientific research in the coming decades is likely to move<br />
strongly in the direction of making results available to and<br />
understandable by the public and policy makers. Not only<br />
is this a politic<strong>al</strong> necessity, but it is benefici<strong>al</strong> to the<br />
intellectu<strong>al</strong> he<strong>al</strong>th of humanity. For this and other<br />
reasons, it is important that visu<strong>al</strong>ization tools<br />
accommodate lower end platforms. Specific examples,<br />
such as the use of X for display, can be cited.<br />
Exchange of information between scientists is undergoing<br />
rapid evolution. Visu<strong>al</strong>ization tools are playing a centr<strong>al</strong><br />
role in this change and must continue to do so. For<br />
example, the standard print media (e.g. journ<strong>al</strong>s) is<br />
loosing ground to desktop multimedia tools. The day may<br />
not be far off when I will be able to "publish" a refereed<br />
paper which contains hyperlinks in the references section,<br />
animations for some of the "figures", costs a few dollars<br />
instead of the $5000 that I paid for my last publication,<br />
and will take a few weeks from submission to distribution<br />
instead of 6 months to a year.<br />
Steve Goodman<br />
The integration of multiple data sets from different<br />
satellite sensors, ground stations, numeric<strong>al</strong> models is<br />
becoming increasingly important for research and data<br />
v<strong>al</strong>idation. In our particular case, superposition of<br />
satellite sensor data with cloud volume data and groundbased<br />
data is important for interpreting the space data<br />
which show only the cloud top structure and integrated<br />
radiance information, but no vertic<strong>al</strong> structure. The ability<br />
to show model retriev<strong>al</strong> data side by side with radar and<br />
in-situ observations would be helpful for v<strong>al</strong>idating such
models. However, in addition to simply viewing multiple<br />
data sets together, comparative an<strong>al</strong>ysis and data fusion<br />
capabilities within the tools are vit<strong>al</strong> to meeting many<br />
scientific needs. For instance, some <strong>al</strong>gorithms use cloud<br />
models combined with constraints from satellite data to<br />
get vertic<strong>al</strong> profiles of cloud liquid water, ice etc.<br />
The ability to locate data within a time and physic<strong>al</strong> space<br />
domain is critic<strong>al</strong> for the scientist. Working in x-y-z<br />
space, rather than latitude-longitude-<strong>al</strong>titude space for<br />
instance, is very inhibitive to the the scientist. Many<br />
visu<strong>al</strong>ization tools are incapable of tieing data down into<br />
physic<strong>al</strong> space which has meaning to a scientist,<br />
particularly if the data is gridded using spati<strong>al</strong> transforms,<br />
such as map projections. Accurate and complete<br />
geolocation of data within visu<strong>al</strong>ization tools, similar to<br />
that available in many GIS systems, is particularly<br />
important for meeting the research needs of the EOS<br />
scientist. Addition<strong>al</strong>ly, the element of time needs to have<br />
more meaning than simply a driver of animation.<br />
Adequate parsing and transformation of time domains is<br />
important, as is the ability to an<strong>al</strong>yze tempor<strong>al</strong> sequences<br />
within visu<strong>al</strong>ization and an<strong>al</strong>ysis tools. Furthermore,<br />
unlike typic<strong>al</strong> animations which presently assume that <strong>al</strong>l<br />
pixels within a given time slice were sampled at the same<br />
time, the sampling of time in orbit<strong>al</strong> swath data is<br />
continuous with each pixel having it own sampling time.<br />
This is particularly important for our research into highly<br />
transient phenomena, such as thunderstorm growth and<br />
decay, cloud electrification and lightning.<br />
There is a strong need to more closely tie visu<strong>al</strong>ization<br />
and an<strong>al</strong>ysis within the same tool. Tools must <strong>al</strong>low the<br />
scientist to work with re<strong>al</strong> v<strong>al</strong>ues, in floating point or twobyte<br />
integers for example, instead of 8-bit numbers<br />
between 0 and 255. Tools should <strong>al</strong>low for the<br />
recognition and proper handling of "missing data" and<br />
"bad data" flags. Also, Instead of serving as simply a<br />
viewing tool after processing and an<strong>al</strong>ysis is complete,<br />
visu<strong>al</strong>ization should serve the function of providing the<br />
scientist with insight into the data and thus interactively<br />
driving much an<strong>al</strong>ysis. This requires a simple path back<br />
and forth between the visu<strong>al</strong> and an<strong>al</strong>ytic<strong>al</strong> domains, as<br />
well as integration of the more powerful visu<strong>al</strong>ization<br />
techniques with the more fundament<strong>al</strong> visu<strong>al</strong>ization<br />
techniques such as data plots and graphs. Fin<strong>al</strong>ly, a closer<br />
interaction between scientists and tool developers is<br />
needed to <strong>al</strong>low scientist the ability to take advantage of<br />
the latest computing technology, while assuring that re<strong>al</strong><br />
science needs are being met by the visu<strong>al</strong>ization<br />
community.<br />
Meemong Lee<br />
Visu<strong>al</strong>ization is a graphic<strong>al</strong> representation technology<br />
which relies on the highly advanced human vision system<br />
for grasping multi-dimension<strong>al</strong> complex phenomena from<br />
the visu<strong>al</strong> queues (color, shape, perspective geometry, and<br />
tempor<strong>al</strong> sequence). The ability to transform a large<br />
amount of incomprehensible data or complicated<br />
mathematic<strong>al</strong> models into intuitive graphic<strong>al</strong> forms has<br />
greatly expedited the information processing and has<br />
provided an interactively manipulatible data space (virtu<strong>al</strong><br />
re<strong>al</strong>ity).<br />
Visu<strong>al</strong>ization plays an important role in every aspect of<br />
NASA mission cycle: mission planning, instrument<br />
design, operation monitoring, data base access, science<br />
processing and sharing the mission objective with the<br />
public. Though EOS doesn't require visu<strong>al</strong>ization<br />
technology unique to itself, it must actively participate in<br />
advancing the visu<strong>al</strong>ization technology as a whole so that<br />
it can utilize the technology for advancing the mission<br />
data utilization, science product generation, and sharing<br />
the science with the world.<br />
Technology that will be essenti<strong>al</strong> in EOS includes<br />
capabilities for 1. presenting a large volume of data from<br />
various instruments and their derived products in a<br />
comprehensible and inter-usable form, 2. enabling<br />
comprehensive an<strong>al</strong>ysis of the observations in connection<br />
with the over-<strong>al</strong>l mission environment including<br />
observation dynamics, payload characteristics, and various<br />
other aspects that are related to the resulting observation.<br />
3. providing an integrated virtu<strong>al</strong> observation platform<br />
where the inter-dependencies between different<br />
observations as well as the tempor<strong>al</strong> and spati<strong>al</strong><br />
relationship of an observation can be intuitively<br />
appreciated, and 4. sharing the achieved science with<br />
other discipline scientists and public to ensure meeting the<br />
mission objectives.<br />
Panel Participants<br />
Dr. Mike Botts is form<strong>al</strong>ly educated in the fields of<br />
Geology, Planetary Sciences, Image Processing/Remote<br />
Sensing, and Geotechnic<strong>al</strong> <strong>Engineering</strong>. For the last six<br />
years, Dr. Botts has speci<strong>al</strong>ized in the use and<br />
development of scientific visu<strong>al</strong>ization tools within the<br />
Earth sciences. As a Senior Research Scientist within the<br />
Earth System Science Laboratory (ESSL) at the University<br />
of Alabama in Huntsville (UAH), he has worked on-site at<br />
NASA Marsh<strong>al</strong>l Space Flight Center within the Earth<br />
Science and Applications Division (ESAD), assisting<br />
Earth scientists in meeting their visu<strong>al</strong>ization and an<strong>al</strong>ysis
needs through a combination of in-house development and<br />
off-the-shelf software. In 1992, for a period of six<br />
months, Dr. Botts served on temporary assignment at<br />
NASA Headquarters, ev<strong>al</strong>uating the state of scientific<br />
visu<strong>al</strong>ization for NASA's EOS Mission. His report to<br />
NASA Headquarters entitled "The State of Scientific<br />
Visu<strong>al</strong>ization with Regard to the NASA EOS Mission to<br />
Planet Earth" established many of the guidelines for<br />
visu<strong>al</strong>ization requirements for NASA EOS. He is<br />
presently PI on an EOS/Pathfinder grant ("The Interuse<br />
Experiment") from NASA Headquarters, designed to<br />
improve the interdisciplinary and multi-sensor integration<br />
of NASA EOS and Pathfinder data sets within<br />
visu<strong>al</strong>ization and an<strong>al</strong>ysis tools.<br />
Dr. Jon Dykstra received his degrees in Geologic Remote<br />
Sensing and is currently the Executive Manager of<br />
Intergraph's Imaging Systems (a component of<br />
Intergraph's Mapping Sciences Division). In this capacity<br />
he is responsible for the development of Intergraph's<br />
commerci<strong>al</strong> image processing and photogrammetric<br />
application software. Dr. Dykstra initiated the design and<br />
development of Intergraph's commerci<strong>al</strong> image processing<br />
software in 1987 and has managed its continuing<br />
evolution since that time. By design, the imaging<br />
software is fully integrated into Intergraph's digit<strong>al</strong><br />
mapping and Geographic Information Systems. Dr.<br />
Dykstra has managed the groups responsible for the<br />
integration of digit<strong>al</strong> image processing techniques with<br />
those of classic<strong>al</strong> photogrammetry. The resulting digit<strong>al</strong><br />
stereo photogrammetric products are being used both with<br />
the government and commerci<strong>al</strong> sector for stereographic<br />
exploitation of a wide variety of digit<strong>al</strong> imagery. Before<br />
coming to Intergraph, Dr. Dykstra served for two years as<br />
the Senior Applications Scientist at the Earth Observation<br />
Satellite Corporation (EOSAT). Prior to EOSAT, he<br />
spent seven years as a satellite imaging speci<strong>al</strong>ist for Earth<br />
Satellite Corporation (EarthSat).<br />
Dr. Lee Elson is currently a Research Scientist in the<br />
Earth and Space Sciences Division at the Jet Propulsion<br />
Laboratory. His most recent activities have centered on<br />
the study of ozone depletion in the middle atmosphere<br />
using data from the Upper Atmosphere Research Satellite.<br />
He is a co-investigator on the Microwave Limb Sounder<br />
(MLS) experiment and is an active member of a UARS<br />
Theoretic<strong>al</strong> Investigation Team. He is <strong>al</strong>so involved with<br />
planning efforts for the EOS version of the MLS<br />
scheduled to fly on the Chemistry platform. Other<br />
activities have centered around the development of<br />
visu<strong>al</strong>ization tools. In particular, he has been an active<br />
user of the LinkWinds package developed by A. Jacobson<br />
at JPL.<br />
Dr. Steve Goodman is an atmospheric scientist within the<br />
Earth Science and Application Division at NASA<br />
Marsh<strong>al</strong>l Space Flight Center (MSFC). His present<br />
scientific research interests are in region<strong>al</strong> and glob<strong>al</strong><br />
studies of the hydrologic cycle, with speci<strong>al</strong> emphasis on<br />
process studies and interannu<strong>al</strong> variability. He serves as<br />
both an instrument investigator and interdisciplinary<br />
scientist supported by the NASA Earth Observing System<br />
(EOS) program. Dr. Goodman is the team leader for<br />
science <strong>al</strong>gorithm development and mission operations for<br />
the OTD and TRMM-LIS sensors. Dr. Goodman is <strong>al</strong>so<br />
interested in methods of intelligent data base searching<br />
through large, distributed environment<strong>al</strong> data bases,<br />
visu<strong>al</strong>ization for satellite and radar meteorology,<br />
<strong>al</strong>gorithm optimization, data fusion, and adaptive<br />
forecasting methods.<br />
Dr. Meemong Lee is the Technic<strong>al</strong> Group Supervisor of<br />
the Image An<strong>al</strong>ysis Systems group at JPL, which is<br />
primarily involved in scientific information processing<br />
and visu<strong>al</strong>ization, concurrent and distributed data<br />
processing, and re<strong>al</strong>-time data processing for on-board<br />
spacecraft applications. Dr. Lee received degrees in<br />
electric<strong>al</strong> engineering and computer science. She has<br />
been actively involved in the development of systems for<br />
an<strong>al</strong>yzing seismic data, speech, image, and multi-spectr<strong>al</strong><br />
data for 12 years, and has been the PI on various<br />
<strong>al</strong>gorithm development tasks including Automatic<br />
Currency Inspection, Markov Random Field Model based<br />
Texture Classification, Automatic Sea-ice Motion<br />
Tracking, and Multi-resolution Pyramid based Image<br />
Registration. She directed the development of various<br />
par<strong>al</strong>lel data processing software systems including the<br />
SPectr<strong>al</strong> data An<strong>al</strong>ysis Manager (SPAM), the Concurrent<br />
Image Processing Executive (CIPE), the Hubble space<br />
telescope PSF model generation and verification, and a<br />
par<strong>al</strong>lel DEM extraction <strong>al</strong>gorithm for Magellan project<br />
(Shape). Dr. Lee is currently involved in developing a<br />
systolic dataflow system for an end-to-end Instrument<br />
Simulation Subsystem development task for JPL Flight<br />
System Testbed, as well as the development of tools for<br />
integrating EOS data under the Interuse Experiment.
Visu<strong>al</strong>ization in Medicine:<br />
VIRTUAL Re<strong>al</strong>ity or ACTUAL Re<strong>al</strong>ity ?<br />
Christian Roux Co-Chair<br />
Jean Louis Coatrieux Co-Chair<br />
1. Departement Image et Traitement de l'Information, Ecole Nation<strong>al</strong>e Superieure des<br />
Telecommunications de Bretagne. BP 832, 29285 Brest Cedex. France<br />
2. Laboratoire deTraitement du Sign<strong>al</strong> et de l'Image, Universite de Rennes I, Campus de Beaulieu<br />
35042 Rennes Cedex. France<br />
Panelists<br />
Jean-Louis Dillenseger, University of Rennes I, France<br />
Elliot K. Fishman, Johns Hopkins School of Medicine, U.S.A.<br />
Murray Loew, George Washington University, U.S.A.<br />
Hans-Peter Meinzer, German Cancer Center Heidelberg, Germany<br />
Justin D. Pearlman, Harvard Medic<strong>al</strong> School, U.S.A.<br />
Abstract<br />
This panel will discuss and debate the role played by 3D visu<strong>al</strong>ization in Medicine as a set of methods and<br />
techniques for displaying 3D spati<strong>al</strong> information related to the anatomy and the physiology of the human<br />
body.<br />
1. Introduction<br />
3D medic<strong>al</strong> imaging is now more than twenty years old. It is still an extremely active field with numerous<br />
theoretic<strong>al</strong>, technologic<strong>al</strong> and clinic<strong>al</strong> issues. One of the most critic<strong>al</strong> issues is visu<strong>al</strong>ization. Efficacious<br />
visu<strong>al</strong>ization of medic<strong>al</strong> objects is indeed of utmost importance for the physicians who an<strong>al</strong>yze the<br />
anatomic<strong>al</strong> structures, their spati<strong>al</strong> relationships and their physiology.<br />
3D visu<strong>al</strong>ization in the medic<strong>al</strong> field is unique with respect to many other domains because it has to<br />
handle large volume data which may come from multiple imaging systems and <strong>al</strong>so from sources other<br />
than imaging mod<strong>al</strong>ities. This is why it is so complex and still needs a lots of work. When reviewing the<br />
literature of the domain [1] one re<strong>al</strong>izes very quickly that they are many ways to "see the unseen" [2].<br />
This panel will present some approaches to 3D visu<strong>al</strong>ization in Medicine and debate its effectiveness. The<br />
panelists will be asked to answer the question: Visu<strong>al</strong>ization in Medicine, Virtu<strong>al</strong> Re<strong>al</strong>ity or Actu<strong>al</strong><br />
Re<strong>al</strong>ity ? To this end, sever<strong>al</strong> <strong>al</strong>ternatives will be considered:<br />
• Aesthetics vs re<strong>al</strong>ism<br />
• Models vs actu<strong>al</strong> v<strong>al</strong>ues<br />
• Surface rendering vs volume rendering<br />
• Technology for the future vs <strong>al</strong>ready available technology<br />
•Other topics will be addressed in the panel: What is the need for display devices ? In which way do the<br />
practitioners actu<strong>al</strong>ly use 3D visu<strong>al</strong>ization ? How can the medic<strong>al</strong> efficacy of the various ways of<br />
producing 3D displays be ev<strong>al</strong>uated ?<br />
The panelists will fin<strong>al</strong>ly try to point out the main limitations in this domain and to bring out some new<br />
ch<strong>al</strong>lenges for the future.
2. Visu<strong>al</strong>ization in Medicine: What Can Be Learned from Epilepsy Research ? (Jean-Louis Dillenseger)<br />
The capability to display and manipulate three-dimension<strong>al</strong> medic<strong>al</strong> images is now widely recognized as<br />
fundament<strong>al</strong> in clinic<strong>al</strong> practice. Sever<strong>al</strong> frameworks have been designed in the last two decades from<br />
surface representations to volume rendering. Some hot debates on the right or the best way to visu<strong>al</strong>ize<br />
datasets have taken place where more emphasis has been put recently on re<strong>al</strong>istic and quantitative features<br />
rather than on aesthetic images. Here I would like to address another view : what can be learned from<br />
application-oriented approaches? I will do it by using the epilepsy research field.<br />
First, I will try to present this complex application in simple words to facilitate the understanding of each<br />
stage and to identify the multiple roles that visu<strong>al</strong>ization can play. Second, the specific problems to be<br />
solved will be examined in depth. They cover the clinic<strong>al</strong> needs and constraints, as well as the<br />
methodologic<strong>al</strong> aspects. Raw and transformed data, multimod<strong>al</strong> sources (model, sign<strong>al</strong>, images),<br />
point/surface/volume based display, direct and inverse problems related to epileptic focus loc<strong>al</strong>ization will<br />
be an<strong>al</strong>yzed. Third, according to bottom-up and top-down views, inspired from knowledge based<br />
methods, speci<strong>al</strong>ization and gener<strong>al</strong>ization cues will be discussed.<br />
3. 3D Clinic<strong>al</strong> Imaging in Radiology: Current Applications, Future Needs. (Elliot K. Fishman)<br />
Radiologic imaging requires far more than the detection of a lesion or description of its potenti<strong>al</strong> etiology.<br />
The radiologist in 1990s must present the abnorm<strong>al</strong>ity detected in a form that referring physician can use<br />
for patient management. Unless information is provided in a form that can effect patient outcome, the<br />
study will have little v<strong>al</strong>ue in the over<strong>al</strong>l scheme of things.<br />
Recent advances in radiology have resulted in the ability to create highly accurate three-dimension<strong>al</strong><br />
volumes for visu<strong>al</strong>ization. This is especi<strong>al</strong>ly true with the recent introduction of Spir<strong>al</strong> CT scanning<br />
which <strong>al</strong>lows acquisition of large data volume in single breath-holds. The role of three-dimension<strong>al</strong><br />
visu<strong>al</strong>ization in a wide range of clinic<strong>al</strong> applications including that of oncology, the gastrointestin<strong>al</strong> tract<br />
and orthopedics will be addressed. Specific advantages of volume visu<strong>al</strong>ization in terms of therapeutic<br />
management and understanding of treatment options will be presented. Potenti<strong>al</strong> directions for threedimension<strong>al</strong><br />
imaging and current deficiencies in system renderings and display will be addressed as well.<br />
4. 3D Visu<strong>al</strong>ization in medicine: virtu<strong>al</strong> re<strong>al</strong>ity or actu<strong>al</strong> re<strong>al</strong>ity? (Murray Loew)<br />
Visu<strong>al</strong>ization in medicine must extend to the representation of data that arise from sources other than<br />
imaging mod<strong>al</strong>ities. Clinicians need better and more quantitative ways to understand the vast array of<br />
information that confronts them when they are making diagnoses or prescribing treatments.<br />
Our familiarity with the three-dimension<strong>al</strong> world provides an intuition that can be used to help us<br />
navigate among and understand inclines, ridges, and points of inflection in the data space, and thus to<br />
develop further an understanding of the sensitivities of dependence of certain quantities on others. This<br />
should be especi<strong>al</strong>ly helpful in medic<strong>al</strong> decision-making (b<strong>al</strong>ancing costs against benefits, each with its<br />
respective probability), where sharp optima are unusu<strong>al</strong> and opinion often plays a major role. And in<br />
diagnosis there would be the opportunity, for example, to examine graphic<strong>al</strong>ly the contributions of various<br />
measurements to an over<strong>al</strong>l estimate of the patient's state.<br />
We discuss some issues in 3-D display for data visu<strong>al</strong>ization, and how they relate to the go<strong>al</strong>s of providing<br />
a useful view of even higher dimension<strong>al</strong>ity, and of developing a more-quantitative intuition among<br />
practitioners.
5. 3D Visu<strong>al</strong>ization in Medicine (Hans-Peter Meinzer)<br />
Now that virtu<strong>al</strong> re<strong>al</strong>ity is very popular in many fields from engineering to entertainment many people<br />
<strong>al</strong>so look into medic<strong>al</strong> applications. There have been attempts of 3D visu<strong>al</strong>ization in medicine, most of<br />
them follow the vector based approaches of the VR world. The main sources of medic<strong>al</strong> 3D data are CT<br />
and MR images. They are pixel (or voxel) volume data which are therefore translated into vector based<br />
surface descriptions. This step is highly critic<strong>al</strong> as there are usu<strong>al</strong>ly no clear surfaces in a body. The better<br />
approach is a voxel based 3D volume visu<strong>al</strong>ization <strong>al</strong>gorithm omitting the critic<strong>al</strong> step of surface<br />
identification.<br />
Volume based 3D visu<strong>al</strong>ization can show objects like clouds, flames or densities (of any origin). This<br />
<strong>al</strong>lows a view on semitransparent objects that may incorporate further objects. It <strong>al</strong>so can show spati<strong>al</strong><br />
textur<strong>al</strong> information, which is often of high interest. Even surfaces are better displayed, if they surface is<br />
not highly polished and completely smooth. Textur<strong>al</strong> information on surfaces (i.e. if the Mandelbrot<br />
dimension of a surface is much higher than 2) is f<strong>al</strong>sely suppressed by 3D surface visu<strong>al</strong>ization but<br />
correctly shown by 3D volume renderers, as they can show `re<strong>al</strong>' volumes. In this aspect a massively<br />
textured 2D surface can be considered as a 3D volume object.<br />
The problem of the volume renderers today is that they are too slow. Every image still takes a few<br />
minutes on any non par<strong>al</strong>lel hardware while we would need 10 images per second. The vector based<br />
renderers run <strong>al</strong>ready in re<strong>al</strong> time and they are embedded in nice 3D input and output man-machine<br />
interfaces. Unfortunately it shows to be very difficult to integrate the vector based <strong>al</strong>gorithms into the<br />
volume renderers and vice versa. Fast par<strong>al</strong>lel hardware can and will solve the time bottleneck and within<br />
the next very few years VR in medicine will become actu<strong>al</strong> re<strong>al</strong>ity if the segmentation and classification<br />
problem can be overcome.<br />
While the step of 3D data visu<strong>al</strong>ization is not anymore a research problem but an engineering one, the<br />
problem of object identification remains basic research. Before we can show an organ or a tissue we must<br />
first identify it in the volume data. Here we have the sign<strong>al</strong>-to-symbol gap between the enormous amount<br />
of numeric data and the symbolic description of a (medic<strong>al</strong>) scenario. The keywords are e.g.: AI, neur<strong>al</strong><br />
nets, topologic<strong>al</strong> maps, cognitive textures, active contours and topologic<strong>al</strong> morphology. The truth is, that<br />
we do not understand how man interprets images and therefore there is no <strong>al</strong>gorithm. This is the re<strong>al</strong><br />
drawback on the way to virtu<strong>al</strong> re<strong>al</strong>ity in medicine.<br />
6. 3D Visu<strong>al</strong>ization in medicine: virtu<strong>al</strong> re<strong>al</strong>ity or actu<strong>al</strong> re<strong>al</strong>ity? (Justin D. Pearlman)<br />
Advances in data acquisition now routinely collect 3D data sets documenting anatomic and physiologic<br />
status changes inside the body. The primary limitation is no longer the ability to acquire the data but now<br />
is the ability to extract and understand the useful information content. In the re<strong>al</strong> world, we use a dozen<br />
mechanisms to appreciate 3D relationships. In the computer world, 3D image data is commonly presented<br />
using only one or two depth cues, often relying on a flat 2D computer screen to visu<strong>al</strong>ize the "3D"<br />
information, by extensive use of models of lighting, shading, surface orientation, texture, reflection,<br />
connectivity and vector interpolation. Although the end results can "look very re<strong>al</strong>istic" and are "easy to<br />
manipulate" they in fact contain very little of the information in the origin<strong>al</strong> 3D data set.<br />
Virtu<strong>al</strong> re<strong>al</strong>ity supplies our senses with a satisfying simulation that mimics what we might encounter in<br />
the re<strong>al</strong> world, using made-up data. Actu<strong>al</strong> re<strong>al</strong>ity supplies to our senses information about the re<strong>al</strong> world,<br />
not made up. To a large extent, derived surface models using vector graphics present a virtu<strong>al</strong> re<strong>al</strong>ity,<br />
even if the models are based in part on actu<strong>al</strong> 3D data. Much more of the information bandwidth<br />
presented comes from the modeling than from actu<strong>al</strong> data. For medic<strong>al</strong> decision making, I contend that<br />
"looking re<strong>al</strong>istic" is much less important than conveying useful information. In fact, the vector models
commonly suppress information about data qu<strong>al</strong>ity, so confidence in the data is difficult to assess except<br />
when there are gross errors such as in 3D surface modeling from CT of the head, showing teeth through<br />
the lips because of the effect of the bone sign<strong>al</strong> on the intensity gradient used to derive the "surface<br />
norm<strong>al</strong>."<br />
There are <strong>al</strong>ternatives that come much closer to presentation of actu<strong>al</strong> re<strong>al</strong>ity. CUBE software* provides<br />
exploration and composite rendering of the entire actu<strong>al</strong> 3D data set at interactive speeds on standard<br />
hardware at the full depth of the acquired data. The tool provides 3D object recognition and interactive<br />
editing to remove uninformative and obstructive elements, but it presents actu<strong>al</strong> v<strong>al</strong>ues, not models, to the<br />
viewer. Applied to 3D MRI of the chest, a 3D map of the heart and of the coronary artery supply to the<br />
heart is produced, non-invasively. Obstructing objects not of interest, such as chest w<strong>al</strong>l and other blood<br />
pools, are removed. The surgery is performed at interactive speed on the computer using a simple pointand-click,<br />
rather than on the patient. The results may be viewed interactively, and they may be exported<br />
to volumetric holograms (VOXEL) to rebuild the structures of interest as a 3D sculpture of light.<br />
*Dr. Pearlman has commerci<strong>al</strong> interest in CUBE<br />
The panelists<br />
Jean-Louis Coatrieux<br />
Jean-Louis Coatrieux received the Electric<strong>al</strong> <strong>Engineering</strong> degree from the Grenoble Institute in 1970, and<br />
the Third Cycle and the State Doctorate degrees from the University of Rennes I in 1973 and 1983,<br />
respectively. He previously served as an Assistant Professor at the Technologic<strong>al</strong> Institute of Rennes and<br />
he became Director of Research (INSERM) in 1986. In addition, he presently is a lecturer at the Ecole<br />
Nation<strong>al</strong>e Superieure des Telecommunications de Bretagne. His research interests include sign<strong>al</strong> and<br />
image processing, knowledge based-techniques and the fusion of data and models in medic<strong>al</strong> applications.<br />
Jean-Louis Dillenseger<br />
Jean-Louis Dillenseger is Maitre de Conference at the University Institute of Technology of Rennes,<br />
France. He is with the Laboratoire de Traitement du Sign<strong>al</strong> et de l'Image at the University of Rennes I.<br />
His research is mainly devoted to 3D and multivariate medic<strong>al</strong> visu<strong>al</strong>ization and 3D positioning in<br />
multimod<strong>al</strong> imaging. He works on ray tracing and volume rendering techniques on anatomic<strong>al</strong> datasets<br />
(MRI, CT,...) and <strong>al</strong>so on function<strong>al</strong> sign<strong>al</strong>s mapping on morphologic<strong>al</strong> data. The application field of his<br />
research includes cardiology and neurology. He received a Mechanic<strong>al</strong>, Electronic <strong>Engineering</strong> degree in<br />
1988 from E.N.I.B., Brest, France, and a Ph.D. degree in biomedic<strong>al</strong> science from the University of Tours,<br />
France, in 1992.<br />
Elliot K. Fishman<br />
Elliot K. Fishman is currently Professor of Radiology and Oncology at the Johns Hopkins School of<br />
Medicine in B<strong>al</strong>timore. He is <strong>al</strong>so Director of Body CT and Abdomin<strong>al</strong> Imaging in the Department of<br />
Radiology. Dr. Fishman's interests include optimizing imaging techniques for diagnosis and therapy<br />
planning as well as applications of computer-based imaging particularly in terms of three-dimension<strong>al</strong><br />
visu<strong>al</strong>ization for optimizing diagnosis and management. His specific areas of interest include that of<br />
musculoskelet<strong>al</strong> 3D imaging and oncologic applications.<br />
Murray Loew<br />
Murray Loew received the Ph.D. in electric<strong>al</strong> engineering from Purdue University in 1972, and then in<br />
industry continued his work in pattern recognition and applications. At GWU since 1978, he has taught<br />
and conducted research in pattern recognition, image processing and computer vision, and medic<strong>al</strong><br />
engineering. Some recent topics are: probabilistic modeling of x-ray images and determination of their<br />
information-theoretic properties; development and comparison of diffusion-based, and robust chain-codebased<br />
descriptors of shape; and data compression and qu<strong>al</strong>ity measurement for medic<strong>al</strong> images. He was a<br />
founder (in 1987) and is co-director of the university's Institute for Medic<strong>al</strong> Imaging and Image An<strong>al</strong>ysis.
Hans-Peter Meinzer<br />
Hans-Peter Meinzer is a scientist at the German Cancer Research Center in Heidelberg since 1974. Since<br />
1983 he directs a research team speci<strong>al</strong>izing in the 3D visu<strong>al</strong>ization of 3D tomographies. The team<br />
developed a ray tracing <strong>al</strong>gorithm for medic<strong>al</strong> 3D data cubes. In this context he works on neur<strong>al</strong> nets, AI,<br />
human perception, cognitive texture an<strong>al</strong>ysis, morphology, and par<strong>al</strong>lel computing concepts. His speci<strong>al</strong><br />
interest lies in modeling and simulating tissues and tissue kinetics.<br />
After studying physics and economics at Karlsruhe University and obtaining an MS in 1973, Meinzer<br />
received a doctorate from Heidelberg University in medic<strong>al</strong> computer science (1983) and his habilitation<br />
(1987). He is associate professor at the Heidelberg University on medic<strong>al</strong> computer science and a member<br />
of the Gesellschaft fuer Informatik (GI) and theGesellschaft fuer Medizinische Dokumentation und<br />
Statistik (GMDS). He received the Ernst-Derra award from the German Society of Heart Surgeons (1992)<br />
and the Olympus award from the German Society for Pattern Recognition (1993).<br />
Justin D. Pearlman<br />
Justin D. Pearlman MD ME PhD is an Associate Professor of Medicine at Harvard Medic<strong>al</strong> School with a<br />
joint appointment at M.I.T. in the He<strong>al</strong>th Sciences Technology program. He is board certified in Intern<strong>al</strong><br />
Medicine and in Cardiology, and holds a full-time appointment in Radiology. He received his Masters<br />
degree studying computer architecture and visu<strong>al</strong>ization, and received his PhD in Biomedic<strong>al</strong><br />
<strong>Engineering</strong>, by detecting and visu<strong>al</strong>izing chemic<strong>al</strong> changes within the w<strong>al</strong>l of human arteries by<br />
magnetic resonance and multidimension<strong>al</strong> an<strong>al</strong>ysis. He is Director, Magnetic Resonance Imaging<br />
Technologies and Computing at Boston's Beth Israel Hospit<strong>al</strong>, where he performs research on<br />
multidimension<strong>al</strong> imaging of cardiovascular disease, with a focus on new magnetic resonance imaging<br />
techniques for visu<strong>al</strong>ization of early atheromatous disease in the coronary and other arteries.<br />
Christian Roux<br />
Christian Roux is Professor of Image Processing and Pattern Recognition at the Ecole Nation<strong>al</strong>e<br />
Superieure des Telecommunications de Bretagne in Brest, France. He leads the Image and Information<br />
Science department where he is currently conducting research programs on image reconstruction, an<strong>al</strong>ysis<br />
and interpretation. He is an Associate Editor of the IEEE Transactions on Medic<strong>al</strong> Imaging and Director<br />
of the Brest University's Institute for Medic<strong>al</strong> Information Processing.<br />
References<br />
[1] G.T. Herman "3D Display: A Survey from Theory to Applications" Proc. IEEE Satellite Symposium<br />
on 3D Advanced Image Processing in Medicine Ch. Roux, G.T. Herman, R. Collorec (Eds), Rennesfrance,<br />
November 1992<br />
[2] B.H. McCormick, T.A. Defanti, M.D. Brown, "Visu<strong>al</strong>ization in Scientific Computing", Computer<br />
Graphics, Vol. 21, No. 6, 1987.<br />
[3] T. Todd Elvins, "A Survey of Algorithms for Volume Visu<strong>al</strong>ization", Computer Graphics, Vol. 26,<br />
No. 3, 1992.
Visu<strong>al</strong>ization and Geographic Information<br />
System Integration:<br />
What are the needs & requirements, if any ?<br />
Chair:<br />
Theresa Marie Rhyne, (Martin Marietta/U.S. EPA Vis. Ctr.)<br />
Panelists:<br />
William Ivey, (SAS Institute Inc.)<br />
Loey Knapp, (IBM & University of Colorado)<br />
Peter Kochevar, (DEC/ San Diego Supercomputer Center)<br />
Tom Mace, (Scientific Computing Branch, U.S. EPA)<br />
Introduction:<br />
Historic<strong>al</strong>ly, a geographic information system (GIS) has been<br />
defined as a combination of a database management system and a<br />
graphic display system which is tied to the process of spati<strong>al</strong><br />
an<strong>al</strong>ysis. GIS environments <strong>al</strong>so permit building maps in re<strong>al</strong> time<br />
and examining the impacts of changes to the map interactively.<br />
Visu<strong>al</strong>ization embraces both image understanding and image<br />
synthesis. It is a methodology for interpreting image data entered<br />
into a computer and for generating images from multi-dimension<strong>al</strong><br />
data sets. Visu<strong>al</strong>ization research and development has focused on<br />
issues and techniques pertaining to image rendering and not<br />
necessarily on mapping these capabilities to specific geographic<strong>al</strong><br />
problem areas. On the other hand, GIS environments have not<br />
readily applied visu<strong>al</strong>ization methodologies.<br />
This panel addresses the needs and requirements of integrating<br />
visu<strong>al</strong>ization and GIS technologies. There are three levels of<br />
integration methods: rudimentary, operation<strong>al</strong> and function<strong>al</strong>. The<br />
rudimentary approach uses the minimum amount of data sharing<br />
and exchange between these two technologies. The operation<strong>al</strong><br />
level attempts to provide consistency of the data while removing<br />
redundancies between the two technologies. The function<strong>al</strong> form<br />
attempts to provide transparent communication between these
espective software environments. At this level, the user only needs<br />
to request information and the integrated system retrieves or<br />
generates the information depending upon the request. This panel<br />
examines the role and impact of these three levels integration.<br />
Stepping further into the future, the panel <strong>al</strong>so questions the longterm<br />
surviv<strong>al</strong> of these separate disciplines.<br />
Position Statements:<br />
Theresa Marie Rhyne, Martin Marietta/U.S. EPA<br />
Visu<strong>al</strong>ization and GIS methodologies are frequently used to<br />
examine earth and environment<strong>al</strong> sciences data. Interestingly<br />
enough, both of these disciplines developed and have often been<br />
implemented in par<strong>al</strong>lel to each other. At the U.S. Environment<strong>al</strong><br />
Protection Agency, there are separate organization<strong>al</strong> units which<br />
provide hardware and software support for these functions.<br />
Visu<strong>al</strong>ization is primarily associated with the computation<strong>al</strong><br />
modeling efforts of the EPA's supercomputer and data obtained from<br />
satellite remote sensing systems. GIS environments have been<br />
inst<strong>al</strong>led in EPA Research Laboratory, Program and Region<strong>al</strong> Offices<br />
to collect, an<strong>al</strong>yze, and display large volumes of spati<strong>al</strong>ly referenced<br />
data pertaining to remote sensing,. geographic, cultur<strong>al</strong>, politic<strong>al</strong>,<br />
environment<strong>al</strong>, and statistic<strong>al</strong> arenas.<br />
Often the hardware configurations optimized to support GIS<br />
are not compatible with visu<strong>al</strong>ization methodologies. Frequently,<br />
visu<strong>al</strong>ization software has been customized to encompass standard<br />
cartographic and spati<strong>al</strong> display capabilities of GIS environments.<br />
The transfer of visu<strong>al</strong>ization technology to EPA region<strong>al</strong> offices and<br />
State environment<strong>al</strong> protection agencies has both budgetary and<br />
staff support constraints which could benefit from effective<br />
integration of Visu<strong>al</strong>ization and GIS disciplines.<br />
Perhaps Robertson and Abel articulated these concerns in the<br />
IEEE CG&A discussion on Graphics and Environment<strong>al</strong> Decision<br />
Making: "Why are these fields so slow to exchange ideas ?? There are<br />
plausible reasons. To us, the most likely reason is the relative<br />
immaturity of both fields, particularly in the integration of their
technologies into usable systems that address difficult re<strong>al</strong>-world<br />
problems. " (1).<br />
Effective environment<strong>al</strong> decision making for regulatory<br />
purposes is a re<strong>al</strong> world problem faced on a daily basis at the glob<strong>al</strong>,<br />
nation<strong>al</strong>, state and loc<strong>al</strong> levels. The integration of visu<strong>al</strong>ization and<br />
GIS methodologies can facilitate this decision making process and<br />
minimize economic constraints associated with the purchase,<br />
training, support and maintenance of redundant closed systems.<br />
(1) Robertson, Philip K. and David J. Abel 1993, Graphics and<br />
Environment<strong>al</strong> Decision Making, IEEE Computer Graphics and<br />
Applications, Vol. 13, No. 2, pp. 25 - 27.<br />
William Ivey: SAS Institute, Inc.<br />
Of the levels of GIS integration, the function<strong>al</strong> level holds the<br />
most promise for effectively applying scientific visu<strong>al</strong>ization<br />
techniques to geographic data. At this level, the geographic data is<br />
<strong>al</strong>ready stored in a format that is native to the visu<strong>al</strong>ization system,<br />
thus requiring no extraordinary user or system intervention to<br />
interact with the data when performing visu<strong>al</strong>izations. This is not to<br />
say that there is no data transformation taking place between the<br />
GIS and visu<strong>al</strong>ization environment, there is. The data structures<br />
that support GIS and visu<strong>al</strong>ization are designed to be most efficient<br />
for those purposes so some transformation is necessary.<br />
This level of integration still offers many advantages. One is<br />
the ability to generate visu<strong>al</strong>izations much faster since the data does<br />
not have to be converted from a non-native format. This is<br />
especi<strong>al</strong>ly important for animations where a smooth transition<br />
between time steps yields a more effective visu<strong>al</strong>ization. Another<br />
advantage is the link to the GIS data base. With this link, spati<strong>al</strong> or<br />
logic<strong>al</strong> queries can to be made to the GIS <strong>al</strong>lowing for subsets or<br />
different spati<strong>al</strong> attributes to be visu<strong>al</strong>ized easier. A third advantage<br />
is the link to other system function<strong>al</strong>ities. In the case of the SAS<br />
system, statistic<strong>al</strong> procedures could be used to perform an<strong>al</strong>ysis on<br />
attributes and attribute combinations. Visu<strong>al</strong>izing the results of<br />
these an<strong>al</strong>yses could be the most effective way to understand
complex attribute relationships. A fourth advantage is that attribute<br />
or spati<strong>al</strong> resolution need not be compromised. With a direct link to<br />
the GIS database, no filtering is necessary so the visu<strong>al</strong>ization can<br />
take place using <strong>al</strong>l the data available. And this is what visu<strong>al</strong>ization<br />
excels at, making sense out of extremely large amounts of<br />
information.<br />
Examples of visu<strong>al</strong>izations that make use of these advantages<br />
are numerous. In the case of faster is better, consider the following<br />
scenario. Suppose that landuse changes are being discussed at a<br />
town meeting. Historic<strong>al</strong> landuse patterns in digit<strong>al</strong> format for each<br />
of the past five years is available. A model, built into the GIS, that<br />
predicts future landuse patterns based on trends, zoning regulations,<br />
and demographics is <strong>al</strong>so available. Preparing an animation<br />
showing landuse changes using the historic<strong>al</strong> data is a simple task<br />
and is prepared beforehand. The model, however, adds a new<br />
wrinkle. Town commissioners want to use the model to look into the<br />
future and see if they are making the right decisions. Function<strong>al</strong><br />
integration makes this possible by <strong>al</strong>lowing modeling scenarios to be<br />
executed in the GIS and the time steps to be animated using the<br />
visu<strong>al</strong>ization system.<br />
Loey Knapp: IBM & University of Colorado<br />
Environment<strong>al</strong> applications have three notable characteristics<br />
which must influence the direction of supporting software tools.<br />
First, the amount of data is increasing dramatic<strong>al</strong>ly, posing<br />
performance and an<strong>al</strong>ysis problems. Second, the data are complex<br />
and heterogeneous representing multiple formats, sc<strong>al</strong>es,<br />
resolutions, and dimensions. Fin<strong>al</strong>ly, a wide range of personnel<br />
must interact with the data as solutions to environment<strong>al</strong> problems<br />
increasingly involve interdisciplinary teams.<br />
The current software infrastructure for such applications does<br />
not adequately address these three characteristics, making<br />
enhancements and extensions to current products mandatory. One<br />
extension which is gathering force and interest is the integration of<br />
geographic information systems (GIS) and scientific visu<strong>al</strong>ization<br />
systems (SVS).
GISs are now used extensively in the an<strong>al</strong>ysis of<br />
environment<strong>al</strong> data due to their capability to manage, manipulate,<br />
and display spati<strong>al</strong> data but there are sever<strong>al</strong> significant problems<br />
with GISs in the environment described above. First, GISs handle<br />
only two-dimension<strong>al</strong> data; second, displays are gener<strong>al</strong>ly limited to<br />
spati<strong>al</strong> views of the data; and third, the capability to support user<br />
interaction where the data is negligible. SVSs present a different set<br />
of strengths and weaknesses. Where GISs provide strong support<br />
for an<strong>al</strong>ytic<strong>al</strong> functions, SVSs provide the capabilities to visu<strong>al</strong>ly<br />
interact with the data using a variety of sophisticated techniques.<br />
These systems can support n-dimension<strong>al</strong> data, providing the<br />
infrastructure to generate two and three-dimension<strong>al</strong> spati<strong>al</strong> views,<br />
animations of time series, and graphic<strong>al</strong> or statistic<strong>al</strong> plots.<br />
However, the lack of an<strong>al</strong>ytic<strong>al</strong> operations such as neighborhood<br />
an<strong>al</strong>ysis in three dimensions or queries across time series limit the<br />
capabilities of these tools. Bringing the an<strong>al</strong>ytic<strong>al</strong> strengths of GISs<br />
together with the visu<strong>al</strong>ization strengths of SVSs would provide a<br />
more robust set of software tools for environment<strong>al</strong> applications.<br />
Three levels of GIS-SVS integration have been identified:<br />
rudimentary, operation<strong>al</strong>, and function<strong>al</strong>. At a rudimentary level<br />
data can be passed from a GIS to a SVS or vice versa, often saving<br />
extensive reformatting time. The main issues with this level of<br />
integration is redundant data, sequenti<strong>al</strong> processing, du<strong>al</strong> system<br />
interface, and the lack of new function<strong>al</strong>ity relative to an<strong>al</strong>ysis of ndimension<strong>al</strong><br />
data. An operation<strong>al</strong> level of integration, which <strong>al</strong>lows<br />
re<strong>al</strong>-time data passing removes the data redundancy issue but<br />
introduces a potenti<strong>al</strong> performance problem, depending on the size<br />
of the data set and available compute power. Integration at a<br />
function<strong>al</strong> level holds the most potenti<strong>al</strong> for iterative and interactive<br />
an<strong>al</strong>ysis and visu<strong>al</strong>ization. Such a system would extend the visu<strong>al</strong><br />
programming concepts of SVSs to include GIS functions, extend GIS<br />
an<strong>al</strong>ytic<strong>al</strong> operations to three and four dimensions, and provide a<br />
single interface to environment<strong>al</strong> scientists.<br />
While a function<strong>al</strong> level of integration should clearly be the<br />
ultimate go<strong>al</strong>, there are significant barriers to implementation.<br />
Software remains proprietary and a tight level of integration implies<br />
levels of cooperation difficult to achieve across companies. The cost
of multiple software packages can <strong>al</strong>so be exorbitant, requiring a<br />
cooperative cost agreement between the vendors. These factors can<br />
be overcome but will require users in the environment<strong>al</strong> community<br />
to play a strong role in demanding and helping design tools which<br />
provide the requisite infrastructure for their applications.<br />
References:<br />
Buttenfield, Barbara P. and John H. Ganter, 1990.<br />
Visu<strong>al</strong>ization and GIS: What Should We See? What Might We Miss?<br />
Proceedings of the 4th Internation<strong>al</strong> Symposium on Data Handling,<br />
July 1990, Zurich, Switzerland.<br />
Campbell, Craig S., and Stephen L. Egbert, 1990. Animated<br />
Cartography, Thirty Years of Scratching the Surface,<br />
Cartographica, Vol. 27, No. 2, pp. 64-81.<br />
DiBiase, David, et <strong>al</strong>, in press. Animation and the Role of Map<br />
Design in Scientific Visu<strong>al</strong>ization, submitted to Cartography and<br />
GIS.<br />
DiBiase, David, 1990. Visu<strong>al</strong>ization in the Earth Sciences,<br />
Earth and Miner<strong>al</strong> Sciences, Vol. 59, No. 2, pp. 13-18.<br />
MacEachren, Alan M. and David DiBiase, 1991. Animated<br />
Maps of Aggregate Data: Conceptu<strong>al</strong> and Practic<strong>al</strong> Problems,<br />
Cartography and Geographic Information Systems, Vol. 28, No. 4,<br />
pp. 221-229.<br />
Monmonier, Mark, 1992. Summary Graphics for Integrated<br />
Visu<strong>al</strong>ization in Dynamic Cartography, Cartography and<br />
Geographic Information Systems, Vol. 19, No. 1, pp. 23-36.<br />
Treinish, Lloyd A., 1990. The Visu<strong>al</strong>ization Software Needs of<br />
Scientists, NCGA'90 Conference Proceedings, Vol. 1, pp. 6-15.<br />
Treinish, Lloyd A., and C. Goettsche, 1991. Correlative<br />
Visu<strong>al</strong>ization Techniques for Multidimension<strong>al</strong> Data, IBM Journ<strong>al</strong> of<br />
Research and Development, Vol. 25, No. 1/2, pp. 184-304.
Weibel, Robert, and Barbara P. Buttenfield, 1992.<br />
Improvements of GIS Graphics for An<strong>al</strong>ysis and Decision-Making,<br />
Internation<strong>al</strong> Journ<strong>al</strong> of Geographic Information Systems, Vol. 6,<br />
No. 3 pp. 223-245.<br />
Peter Kochevar: Seqouia2000-San Diego Supercomputer Center<br />
Wherefore GIS ??<br />
The development of data visu<strong>al</strong>ization systems is progressing<br />
in a way that makes the whole issue of integration of visu<strong>al</strong>ization<br />
and GIS a moot point. Future systems will be based on a very broad<br />
definition of what data visu<strong>al</strong>ization is, a means to help transform<br />
data into human understanding. With this broader definition, data<br />
visu<strong>al</strong>ization will no longer be looked upon as simply an act of<br />
information presentation but rather as a bi-direction<strong>al</strong> process that<br />
takes into account interaction with end-users.<br />
Furthermore, future visu<strong>al</strong>ization systems will de<strong>al</strong> with<br />
"data" in the most gener<strong>al</strong> sense as any digit<strong>al</strong> encoding of<br />
representations of things, measurements, concepts, and relations,<br />
that may be re<strong>al</strong> or imagined. These data may be of the relation<strong>al</strong><br />
variety that tradition<strong>al</strong>ly has not been within the re<strong>al</strong>m of<br />
visu<strong>al</strong>ization systems. Relation<strong>al</strong> data is tabular in nature and may<br />
represent such information as sensor measurements, meta-data<br />
(data describing data), stock prices, airline schedules, telephone<br />
directory listings, etc. Alternately, data may be non-relation<strong>al</strong> in<br />
character where geometric and topologic<strong>al</strong> relationships exist<br />
between data elements as is frequently the case with scientific data.<br />
Non-relation<strong>al</strong> data may consist of images, digit<strong>al</strong> maps, polygon<strong>al</strong><br />
terrain models, gridded output from simulation programs,<br />
CAD/CAM models, etc. Furthermore, any kind of data may vary in<br />
time thus forming data streams of which two or more may be<br />
synchronized during visu<strong>al</strong>ization as would be the case, say, with<br />
video data.<br />
Effective data visu<strong>al</strong>ization requires close coordination with<br />
data sources whether they be scientific instruments, sensors,<br />
computer simulations, or database management systems (DBMSs).
DBMSs are of particular interest because with them, data can be<br />
stored in a way that makes their subsequent use not only possible but<br />
efficient. They offer the capability to search for data based on<br />
content rather than solely by name, something that is cruci<strong>al</strong> to<br />
enhancing understanding. This act of browsing is an important<br />
interactive visu<strong>al</strong>ization function and as such, data visu<strong>al</strong>ization<br />
systems can be thought of as port<strong>al</strong>s into databases. They are the far<br />
more sophisticated an<strong>al</strong>og of the presentation subsystems that list<br />
the tuples resulting from queries in relation<strong>al</strong> DBMSs. The results of<br />
such queries are data that must be effectively visu<strong>al</strong>ized just like<br />
scientific data is now.<br />
So, wherefore GIS? GIS will cease to be a field unto its own-it<br />
will be completely subsumed by gener<strong>al</strong>, interactive data<br />
visu<strong>al</strong>ization systems. GIS data is simply that in which data<br />
components are arrayed in latitude and longitude. When structuring<br />
an appropriate visu<strong>al</strong>ization, this fact should be utilized just as<br />
knowledge of chemistry is exploited when structuring molecular<br />
visu<strong>al</strong>izations, say. As with any visu<strong>al</strong>ization, the structure of the<br />
data and its meaning must be taken into account when fashioning a<br />
s<strong>al</strong>ient visu<strong>al</strong>ization. In this regard, there is nothing speci<strong>al</strong> about<br />
GIS.<br />
Nonetheless, in building next-generation data visu<strong>al</strong>ization<br />
systems, much can be learned from the GIS community. There is a<br />
long tradition of handling spati<strong>al</strong>, non-relation<strong>al</strong> data that can be<br />
exploited. To support the manipulation of such data, the GIS<br />
community has developed sophisticated data models, e.g. SAIF, that<br />
should be studied by the visu<strong>al</strong>ization community. Fin<strong>al</strong>ly, the GIS<br />
community has more experience in using DBMSs than practitioners<br />
of visu<strong>al</strong>ization and that experience needs to be tapped.<br />
Dr. Thomas H. Mace: USEPA Nation<strong>al</strong> Data Processing Division<br />
Visu<strong>al</strong>ization and GIS are not necessarily mutu<strong>al</strong>ly exclusive.<br />
The difference may be more one of emphasis than substance. GIS<br />
functions include data formatting, management, an<strong>al</strong>ysis, and<br />
display (or visu<strong>al</strong>ization). The power of GIS lies in its ability to assist<br />
in spati<strong>al</strong> an<strong>al</strong>ysis. The other tools exist to support that function.
The map, whether in paper form or more ephemer<strong>al</strong>, video, form is a<br />
visu<strong>al</strong>ization of some aspect of data, re<strong>al</strong> or imagined, which<br />
conforms to the mapmakers model of the topology of the subject.<br />
Spati<strong>al</strong> an<strong>al</strong>ysis is not a new discipline. In the past, spati<strong>al</strong><br />
an<strong>al</strong>ysis was performed using visu<strong>al</strong>izations of spati<strong>al</strong> relationships<br />
on paper with sc<strong>al</strong>es ranging from sub-atomic to cosmic. We now<br />
use imaging systems and <strong>al</strong>gorithms as our scribes. The tool is<br />
essenti<strong>al</strong>ly the same when one is looking at the geography of<br />
anemone colonies on a rock or the geography of world politic<strong>al</strong><br />
events. We have developed the use of process science to attempt to<br />
describe our world and predict consequences. Process science<br />
requires both tempor<strong>al</strong> and spati<strong>al</strong> contiguity to determine cause and<br />
effect. (Otherwise, you have action at a distance--magic.) One<br />
needs both historic<strong>al</strong> and geographic<strong>al</strong> tools. GISs are the tools of<br />
geography. Visu<strong>al</strong>ization is as necessary to geography as<br />
mathematics is to physics. We humans need to see our logic.<br />
Cartographers have long known that the map is not only a tool for<br />
getting from here to there (still a process), but a way of organizing<br />
knowledge to make it understandable. Some of this is even evident<br />
in pictograms and petroglyphs left centuries ago in our southwestern<br />
desert. Euclidean space is gener<strong>al</strong>ly used, but not required in <strong>al</strong>l<br />
instances. All that is required for spati<strong>al</strong> an<strong>al</strong>ysis is a space-time<br />
model and a subject. The advent of computers has only changed the<br />
speed at which we can render our an<strong>al</strong>yses.<br />
It seems that since visu<strong>al</strong>ization must be an integr<strong>al</strong> part of<br />
spati<strong>al</strong> an<strong>al</strong>ysis, and spati<strong>al</strong> an<strong>al</strong>ysis is the reason for GIS, why <strong>al</strong>l<br />
the fuss? Part of the problem may be vocabulary. The term<br />
"visu<strong>al</strong>ization" may mean one thing to geographers and quite<br />
another to computer scientists. I suspect, however, that the "devil is<br />
in the details". Software for contemporary GIS is still based on<br />
Euclidean representations of re<strong>al</strong>ity projected onto a flat surface.<br />
The typic<strong>al</strong> map. As far as I know, there are no commerci<strong>al</strong> GIS<br />
packages that possess data management structures that de<strong>al</strong> with 3,<br />
4, or n-dimension<strong>al</strong> space. Virtu<strong>al</strong> re<strong>al</strong>ity packages and<br />
photogrammetric workstations visu<strong>al</strong>ize in 3 dimensions and some<br />
"visu<strong>al</strong>izations" use animations to de<strong>al</strong> with model output that<br />
varies over time. This seems to be the arena in which integration can<br />
occur nearly immediately.
For the long term, integration needs to happen in <strong>al</strong>l the<br />
aspects of spati<strong>al</strong>/tempor<strong>al</strong> an<strong>al</strong>ysis. CAD/CAM and AM/FM need<br />
to be seamless with statistics, GIS, modeling, remote and in situ<br />
monitoring, visu<strong>al</strong>ization, gener<strong>al</strong>ization, and other tools that are<br />
now discrete functions of speci<strong>al</strong>ized communities. We need to be<br />
able to work in a networked, collaborative, interdisciplinary<br />
community, with common tools to apply the scientific method to the<br />
highly complex and interrelated environment<strong>al</strong> problems facing us.<br />
We need to see our logic to predict our future. Integration of GIS<br />
and visu<strong>al</strong>ization software seems to be an interesting and useful<br />
place to start.<br />
Biographic<strong>al</strong> Info. of Panelists:<br />
Theresa Marie Rhyne: Martin Marietta/U.S. EPA<br />
Theresa Marie Rhyne is currently a Lead Visu<strong>al</strong>ization<br />
Researcher for the U.S. EPA's High Performance Computing and<br />
Communications Initiatives and employed by Martin Marietta<br />
Technic<strong>al</strong> Services. From 1990 - 1992, she was the technic<strong>al</strong> leader of<br />
the U.S. EPA Scientific Visu<strong>al</strong>ization Center and was responsible for<br />
building the Center since its founding in 1990.<br />
William Ivey: SAS Institute, Inc.<br />
William Ivey has been involved with the development of GIS<br />
applications since 1988. The first applications he developed were<br />
while employed by Computer Sciences Corporation under contract<br />
to the US EPA. These applications used ARC/INFO and were for the<br />
an<strong>al</strong>ysis and visu<strong>al</strong>ization of modeling results from gridded<br />
atmospheric pollution models. Subsequently, he was employed by<br />
the MCNC/North Carolina Supercomputing Center. There he<br />
developed an interface between ARC/INFO and the Application<br />
Visu<strong>al</strong>ization System(AVS). Currently, William is a systems<br />
developer at SAS Institute and is working on the development of the<br />
first SAS GIS product as well as investigating the integration of this<br />
product with Spectraview, the SAS visu<strong>al</strong>ization product.
Loey Knapp: IBM & University of Colorado<br />
Loey Knapp is a PhD candidate in Geography at the University<br />
of Colorado and works for IBM as a research an<strong>al</strong>yst in<br />
visu<strong>al</strong>ization. For the last two years she has been working with the<br />
U.S. Geologic<strong>al</strong> Survey examining the benefits of enhancing GIS<br />
with scientific visu<strong>al</strong>ization techniques for hydrologic applications.<br />
She is currently the project manager of the IBM-ESRI effort to<br />
integrate IBM's Data Explorer with ESRI's ARC/INFO.<br />
Peter Kochevar: DEC/San Diego Supercomputer Center<br />
Peter Kochevar received a BS in Mathematics from the<br />
University of Michigan and an MS in Mathematics from the<br />
University of Utah. Peter <strong>al</strong>so holds MS and Phd degrees in<br />
Computer Science from Cornell University where he was a member<br />
of the Program of Computer Graphics. Peter worked for a number<br />
of years for the Boeing Commerci<strong>al</strong> Airplane Company in Seattle,<br />
Washington where he helped develop a computer-aided airplane<br />
design system. Since 1990, Peter has been employed by the Digit<strong>al</strong><br />
Equipment Corporation. Currently, he is a visiting scientist at the<br />
San Diego Supercomputer Center where he heads up the data<br />
visu<strong>al</strong>ization research efforts of the Sequoia 2000 Project.<br />
Dr. Tom H. Mace: USEPA Scientific Computing Branch<br />
Tom Mace leads EPA's Nation<strong>al</strong> Data Processing Divsion<br />
efforts to develop and support infrastructure for the use of<br />
advanced information science and technology. He is the Agency's<br />
representative to interagency panels on Landsat and advanced<br />
sensor development, liaison to the NASA EOS Program, the Lead<br />
Contact to the Interagency Working Group on Data Management<br />
for Glob<strong>al</strong> Change and Chair of its Access Subgroup, Project Officer<br />
on cooperative agreements with the Consortium for Internation<strong>al</strong><br />
Earth Science Information Network, and technic<strong>al</strong> expert to EPA's<br />
Office of Internation<strong>al</strong> Activities on the development of monitoring<br />
and information systems in Russia and Eastern Europe.
Visu<strong>al</strong>izing Data: Is Virtu<strong>al</strong> Re<strong>al</strong>ity the Key?<br />
Abstract<br />
A visu<strong>al</strong>ization go<strong>al</strong> is to simplify the an<strong>al</strong>ysis of<br />
large-quantity, numeric<strong>al</strong> data by rendering the data as<br />
an image that can be intuitively manipulated. The<br />
question this controversi<strong>al</strong> panel addresses is whether or<br />
not virtu<strong>al</strong> re<strong>al</strong>ity techniques are the cure-<strong>al</strong>l to the<br />
dilemma of visu<strong>al</strong>izing increasing amounts of data.<br />
This panel determines the usefulness of techniques<br />
available today and in the near future that will ease the<br />
problem of visu<strong>al</strong>izing complex data. In regards to<br />
visu<strong>al</strong>ization, the panel members will discuss<br />
characteristics of virtu<strong>al</strong> re<strong>al</strong>ity systems, data in threedimension<strong>al</strong><br />
environments, augmented re<strong>al</strong>ity, and<br />
virtu<strong>al</strong> re<strong>al</strong>ity market opportunities.<br />
Position Statement by Tom Erickson:<br />
Virtu<strong>al</strong> Re<strong>al</strong>ity as a Medium for Data<br />
Visu<strong>al</strong>ization<br />
I approach virtu<strong>al</strong> re<strong>al</strong>ity (VR) and visu<strong>al</strong>ization<br />
from a design perspective. That is, I focus on<br />
understanding what sort of support people need to<br />
accomplish a given task, and on the ways in which<br />
technologies can provide that support. Thus I will t<strong>al</strong>k<br />
Linda M. Stone, Chair<br />
LORAL Space & Range Systems<br />
lstone@srs.lor<strong>al</strong>.com<br />
Thomas Erickson<br />
Apple Computer, Inc.<br />
thomas@apple.com<br />
Benjamin B. Bederson<br />
University of New Mexico<br />
bederson@cs.unm.edu<br />
Peter Rothman<br />
Avatar Partners<br />
avatarp@well.sf.ca.us<br />
Raymond Muzzy<br />
LORAL Rolm Computer Systems<br />
phone: 408-423-ROLM<br />
about both the charac-teristics of VR systems, and the<br />
nature of visu<strong>al</strong>ization.<br />
1. Virtu<strong>al</strong> Re<strong>al</strong>ity<br />
I see VRs as having three important characteristics:<br />
First, VRs exhibit high interactivity - there is a tight<br />
coupling between the user's actions and the feedback<br />
generated by those actions. Second, they support<br />
embodiment: some sort of representation of the user is in<br />
the same spati<strong>al</strong> framework as the data. Third, the VR<br />
representation is spati<strong>al</strong> in nature; virtu<strong>al</strong> objects are<br />
situated in a spati<strong>al</strong> framework. Note that my definition<br />
makes no mention of the technologies such as the gloves<br />
and head-mounted displays with which VR has become<br />
popularly associated. It <strong>al</strong>so embraces MUDs (AKA<br />
multi-user text-based virtu<strong>al</strong> re<strong>al</strong>ities), systems which use<br />
text to represent users, objects, and the spati<strong>al</strong><br />
environment in a purely metaphoric<strong>al</strong> manner.<br />
2 . Some Characteristics of Visu<strong>al</strong>ization<br />
The aim of visu<strong>al</strong>ization is to represent a data set in<br />
a way that makes it perceptible, and thus able to engage<br />
our vaunted ability to recognize patterns. Thus, in my
view, 'visu<strong>al</strong>ization' is multi-sensory: it <strong>al</strong>so includes<br />
sonic and haptic representations of data. Second,<br />
visu<strong>al</strong>ization is entwined with manipulation. We don't<br />
just want to look at data, we want to move around it,<br />
twist it, shake it, change its color mapping, expand it,<br />
rotate it, shrink it, or slice and dice it. Fin<strong>al</strong>ly,<br />
visu<strong>al</strong>ization is often a collaborative activity. It may be<br />
employed in group problem solving, or in a teaching<br />
situation; thus, the degree to which a visu<strong>al</strong>ization<br />
environment can support human-human interaction may<br />
be critic<strong>al</strong>.<br />
3. Supporting Visu<strong>al</strong>ization<br />
Visu<strong>al</strong>ization is more of a technique than a task.<br />
That is, people don't usu<strong>al</strong>ly visu<strong>al</strong>ize data just for the<br />
hell of it. They may be trying to solve a problem, test a<br />
theory, understand a data set, or communicate their<br />
understanding to others. These differing go<strong>al</strong>s have an<br />
impact on how visu<strong>al</strong>ization should be supported, and<br />
make it difficult to discuss the problem at a gener<strong>al</strong><br />
level. If you're designing a knife, it makes a difference<br />
whether the users are surgeons or butchers; simply<br />
designing something with a sharp edge able to cut flesh<br />
will not result in a tool that is equ<strong>al</strong> to <strong>al</strong>l tasks.<br />
Nevertheless, I will at least take a few stabs at ways in<br />
which VR is well suited to support visu<strong>al</strong>ization in<br />
gener<strong>al</strong>.<br />
I will explore two directions. First, <strong>al</strong>l three<br />
characteristics of VR -- high interactivity, spati<strong>al</strong>ity, and<br />
embodiment -- support very natur<strong>al</strong> ways of<br />
manipulating the data, so that attention can be focused<br />
on the data rather than on the interaction. For example,<br />
the ability to 'grab' a data set at two points (rather than<br />
the single point manipulation supported by most mouse<br />
based systems), provides natur<strong>al</strong> ways of stretching,<br />
shrinking and rotating a data set. Second, because VR<br />
systems represent both data and users within a spati<strong>al</strong><br />
framework, they provide support for the collaborative<br />
component of visu<strong>al</strong>ization. The on-going use of MUDs<br />
provide striking illustrations of the ability of even<br />
metaphoric<strong>al</strong> spati<strong>al</strong> environments to <strong>al</strong>low groups to<br />
save state, communicate, and otherwise structure their<br />
interactions.<br />
Position Statement for Peter Rothman:<br />
Virtu<strong>al</strong> Re<strong>al</strong>ity for Multi-Dimension<strong>al</strong><br />
Environments<br />
Historic<strong>al</strong>ly, data visu<strong>al</strong>ization has relied on two<br />
dimension<strong>al</strong> and three dimension<strong>al</strong> perspective<br />
techniques to enable researchers to visu<strong>al</strong>ize complex<br />
multi-dimension<strong>al</strong> data. Virtu<strong>al</strong> re<strong>al</strong>ity technology<br />
presents a revolutionary ability to visu<strong>al</strong>ize data in a true<br />
three dimension<strong>al</strong> environment.<br />
Using virtu<strong>al</strong> re<strong>al</strong>ity technology, users are able<br />
to immerse themselves in their data. This data can<br />
dynamic<strong>al</strong>ly change in re<strong>al</strong>-time or be derived from<br />
previously recorded data sets. Data with<br />
dimension<strong>al</strong>ities higher than three can be visu<strong>al</strong>ized by<br />
using multiple characteristics of the virtu<strong>al</strong> objects.<br />
Examples include:<br />
Size (e.g. large, medium, sm<strong>al</strong>l)<br />
Shape (e.g. triangle, square, pentagon)<br />
Color (e.g. red, purple, blue)<br />
Texture (photographic images can be "painted"<br />
onto objects)<br />
Position (X, Y, and Z)<br />
Orientation (roll, pitch, yaw)<br />
Behavior (spinning, bouncing, blinking,<br />
breathing, etc.)<br />
Sound (chiming, singing, buzzing, etc.)<br />
By making use of the inherent abilities of<br />
people to visu<strong>al</strong>ize and navigate three dimension<strong>al</strong><br />
spaces, virtu<strong>al</strong> re<strong>al</strong>ity technology enables researchers to<br />
gain new insights into the structure of complex data<br />
streams.<br />
As an example of the power of virtu<strong>al</strong> re<strong>al</strong>ity<br />
technologies for data visu<strong>al</strong>ization, the presenter will<br />
demonstrate an example of the use of virtu<strong>al</strong> re<strong>al</strong>ity for<br />
data visu<strong>al</strong>ization in the financi<strong>al</strong> market.<br />
Position Statement for Ben Bederson: Audio<br />
Augmented Re<strong>al</strong>ity<br />
For many types of information retriev<strong>al</strong>, soci<strong>al</strong><br />
interaction is critic<strong>al</strong> to the experience. For instance,<br />
why do people go to live music concerts instead of<br />
listening to the CD? Partly because of the different kind<br />
of sound, but I believe it is <strong>al</strong>so largely due to the soci<strong>al</strong><br />
experience of being in an auditorium with the rest of the<br />
audience. This identifies one area where I do not think<br />
Virtu<strong>al</strong> Re<strong>al</strong>ity will be successful. I believe that one of<br />
the biggest ch<strong>al</strong>lenges for today's technic<strong>al</strong> designers is<br />
to develop ways that computers can improve<br />
communication and interaction among people.<br />
There are <strong>al</strong>so times when it is appropriate to<br />
provide information without replacing the world for<br />
practic<strong>al</strong> reasons. For instance, when giving traffic<br />
directions while driving, a typic<strong>al</strong> approach is to put<br />
video on the dashboard with a map application, or to<br />
supply a printed piece of paper with directions. Both of<br />
these situations are potenti<strong>al</strong>ly dangerous because they
overload the visu<strong>al</strong> channel by replacing it, at least<br />
temporarily.<br />
One approach to these ch<strong>al</strong>lenges is to use<br />
"Augmented Re<strong>al</strong>ity" - this is, to superimpose computer<br />
generated data on top of the re<strong>al</strong> world, as the person<br />
moves within it. A number of groups are beginning to<br />
experiment with this notion, notably Steve Feiner at<br />
Columbia. My work is different in that it replaces the<br />
video augmentation that Feiner uses with audio. As you<br />
interact with the world, you are provided with relevant<br />
audio annotations which give you extra information<br />
about the current situation without interrupting what you<br />
are doing. This works by using a different and largely<br />
unused communication channel.<br />
For a practic<strong>al</strong> application based on this idea, it<br />
may be necessary for the entire computer system to be<br />
carried around, and for the computer system to know<br />
where it is in the environment. To gener<strong>al</strong>ize this<br />
research question, I have begun to ask "What happens<br />
when a computer that you carry knows where it is?"<br />
We have been applying these concepts by<br />
creating an automated tour guide for museums. The<br />
system will automatic<strong>al</strong>ly describe pieces in the museum<br />
as they are approached. One advantage of this method<br />
over tradition<strong>al</strong> taped tours is that people will have the<br />
choice to choose what they want to see, in what order,<br />
and for how long. We currently have a prototype<br />
demonstrating this technology. This concept could <strong>al</strong>so<br />
be applied to the above mentioned traffic direction<br />
problem so that the driver automatic<strong>al</strong>ly gets verb<strong>al</strong><br />
traffic commands such as "turn right at the light" in situ.<br />
I believe that Virtu<strong>al</strong> Re<strong>al</strong>ity may be appropriate<br />
for certain kinds of information visu<strong>al</strong>ization, such as<br />
architectur<strong>al</strong> w<strong>al</strong>kthroughs - which can not be done any<br />
other way. However, it may not be able to replace other<br />
kinds of information retriev<strong>al</strong>, such as museum tours. I<br />
believe that this is due to the soci<strong>al</strong> aspect of the<br />
information retriev<strong>al</strong> process. Virtu<strong>al</strong> Re<strong>al</strong>ity takes<br />
people away from people. It replaces the natur<strong>al</strong><br />
environment with a virtu<strong>al</strong> one - and the society inherent<br />
in the natur<strong>al</strong> one. Soci<strong>al</strong> situations in our physic<strong>al</strong><br />
world are important in our education<strong>al</strong>, entertaining, and<br />
creative experiences. It is one thing to replace soci<strong>al</strong><br />
situations with technology, but the re<strong>al</strong> ch<strong>al</strong>lenge is to<br />
use technology to enhance rather than "replace" them.<br />
Position Statement for Raymond Muzzy:<br />
A Marketing Perspective<br />
Extensive customer interest <strong>al</strong>ready exists in VR<br />
and expectations are high. It has attained considerable<br />
"hype" in the technic<strong>al</strong> and business press. In this<br />
regard, there exists a similarity to AI in it's early stages<br />
of development. In fact, the an<strong>al</strong>ogy to AI is very good<br />
since it can provide some insights into possible outcomes<br />
for VR in terms of marketplace expectations and future<br />
re<strong>al</strong>ities. AI has taken time to develop its market niches<br />
and products that meet customer needs and a similar<br />
process will <strong>al</strong>so occur for VR. Leveraging the AI<br />
experience should make the VR transition more efficient.<br />
The "re<strong>al</strong> data visu<strong>al</strong>ization needs" of an<br />
application will be the critic<strong>al</strong> drivers that determine the<br />
degree to which VR will re<strong>al</strong>ize its full potenti<strong>al</strong>. VR<br />
can add a new dimension to interpretation of information<br />
and provide insights that would otherwise be missed such<br />
as scientific interpretation of data. It <strong>al</strong>so provides a<br />
method of presenting results so it can be more readily<br />
understood by others such as in engineering design and<br />
manufacturing. VR can add utility to applications like<br />
training through its interactive attributes which would<br />
improve the learning experience. All these areas<br />
represent "v<strong>al</strong>ue added" contributions that VR could<br />
make to visu<strong>al</strong>izing data.<br />
The "v<strong>al</strong>ue added" contribution needs to be<br />
separated from the other aspects of VR hype which only<br />
result in increased costs of doing business and <strong>al</strong>so<br />
contribute to a potenti<strong>al</strong> negative view of the "re<strong>al</strong> v<strong>al</strong>ue"<br />
of VR. This is where the an<strong>al</strong>ogy to AI is very important<br />
since the excessive initi<strong>al</strong> AI "hype" did impact the time<br />
required to re<strong>al</strong>ize its full potenti<strong>al</strong>.<br />
A large number of convention<strong>al</strong> techniques and<br />
products are capable of satisfying the bulk of the users<br />
"re<strong>al</strong> needs". But there still exists a select and growing<br />
market where VR will be the key because it provides<br />
"v<strong>al</strong>ue added" function<strong>al</strong>ity. "Focus" will therefore be<br />
the key to exploring market opportunities for VR.<br />
Current technology drivers for the market will be<br />
discussed.<br />
========================================<br />
Biographies of the Panelists<br />
Linda M. Stone is a computing systems researcher<br />
for the Advanced Technology Program at LORAL Space &<br />
Range Systems in Sunnyv<strong>al</strong>e, CA. She researches upcoming<br />
technologies for potenti<strong>al</strong> infusion into the Air Force Satellite<br />
Control Network. Her interests include virtu<strong>al</strong> re<strong>al</strong>ity,<br />
computer graphics, and software engineering techniques.<br />
Earlier, she supported remote satellite tracking stations as a<br />
human-machine interface software developer. Linda earned<br />
her B.S. in electronic engineering from C<strong>al</strong>ifornia Polytechnic<br />
State University in 1990, and will be receiving her M.S. in<br />
engineering management/computer engineering from Santa<br />
Clara University in 1995. She is a member of ACM and IEEE.<br />
Thomas Erickson is an interaction an<strong>al</strong>yst and<br />
designer in Apple Computer's User Experience Architect's<br />
Office in Cupertino, CA. His background is in cognitive<br />
psychology. He has experience as a programmer and writer,<br />
and today practices a mixture of design and (rough)<br />
ethnography. His responsibilities at Apple include designing<br />
interfaces for future technologies and applications, and
developing strategies for future products. Among his current<br />
research interests are understanding what makes re<strong>al</strong> world<br />
environments rich and inviting places (or impoverished and<br />
forbidding places), and applying that understanding to the<br />
design of human-computer interfaces, intelligent devices, and<br />
to physic<strong>al</strong> environments with embedded computation<strong>al</strong><br />
technology. Tom has published a variety of papers describing<br />
particular design projects, and discussing design process. He<br />
has a bachelor's degree and master's degree in psychology from<br />
University of C<strong>al</strong>ifornia-San Diego.<br />
Peter Rothman is the managing partner and one of<br />
the founders of Avatar Partners in Boulder Creek, CA. His<br />
areas of expertise include computer graphics, object-oriented<br />
programming, multiple target tracking, artifici<strong>al</strong> neur<strong>al</strong><br />
networks, and pattern recognition. Peter is currently<br />
performing research on object oriented programming for<br />
computer graphics applications and advanced pattern<br />
recognition systems. Peter has lectured at numerous<br />
universities, conferences, and seminars. He is a frequent<br />
contributor to AI Expert magazine, and is in the process of<br />
publishing three books. He is the host of the WELL's virtu<strong>al</strong><br />
re<strong>al</strong>ity conference, and influenti<strong>al</strong> electronic conference on<br />
virtu<strong>al</strong> re<strong>al</strong>ity technology. He has a bachelor's degree in<br />
mathematics from University of C<strong>al</strong>ifornia-Santa Cruz, and a<br />
master's degree in computer engineering from University of<br />
Southern C<strong>al</strong>ifornia.<br />
Benjamin B. Bederson is currently an Assistant<br />
Professor of Computer Science at the University of New<br />
Mexico in Albuquerque. Before that, he was a research<br />
scientist at Bellcore in Morristown, NJ. There, he developed<br />
the Pad++ system for exploring zooming graphic<strong>al</strong> user<br />
interfaces. Ben is <strong>al</strong>so a visiting research scientist at the New<br />
York University's Media Research Lab. This is where he<br />
developed the Audio Augmented Re<strong>al</strong>ity system for automated<br />
tour guides. Ben has published a variety of articles,<br />
conference papers, technic<strong>al</strong> reports, and patents. He earned<br />
his B.S. in computer science from Rensselaer Polytechnic<br />
Institute in 1986, and his M.S. and Ph.D. in computer science<br />
fro New York University in 1989 and 1992, respectively. Ben<br />
is a member of ACM and IEEE.<br />
Raymond Muzzy is Vice President of Business<br />
Development at LORAL Rolm Computer Systems (LRCS) in<br />
San Jose, CA. He is responsible for future business<br />
development plans and marketing at LRCS, which is<br />
expanding its business focus to produce powerful design<br />
software and integrated systems for military digit<strong>al</strong> sign<strong>al</strong><br />
processing applications. Ray has been active in a number of<br />
industri<strong>al</strong> groups and led an Electronic Industry Association 10<br />
year forecast of the Synthetic Environments Marketplace. He<br />
has a B.S. in engineering from University of C<strong>al</strong>ifornia-<br />
Berkeley, a M.S. and an engineer's degree in<br />
aeronautics/astronautics from Stanford, and a M.B.A. from<br />
Santa Clara University.<br />
Selected References<br />
[1] Bederson, B. B., G. Davenport, A. Druin and P.<br />
Maes. Immersive Environments: A Physic<strong>al</strong> Approach to<br />
Multimedia Experience. Panel at IEEE Internation<strong>al</strong><br />
Conference on Multimedia Computing and Systems, 1994.<br />
[2] Bernd, Hamann. Visu<strong>al</strong>ization and Modeling<br />
Contours of Trivariate Functions. Ph.D., Thesis, Arizona State<br />
University, Tempe, AZ., 1991.<br />
[3] Bolt, R. A. Put-That-There: Voice and Gesture at<br />
the Graphics Interface, Proceedings of ACM SIGGRAPH,<br />
14 (3) pp. 262-270, 1980.<br />
[4] Brooks, F. B. Grasping Re<strong>al</strong>ity Through Illusion-<br />
Interactive Graphics Serving Science. CHI '88 Proceedings:<br />
Human Factors in Computing Systems, p. 1, (New York:<br />
ACM Press, 1988).<br />
[5] Bruckman, A. & M. Resnick. Virtu<strong>al</strong><br />
Profession<strong>al</strong> Community: Results from the MediaMOO<br />
Project. Presented at the Third Internation<strong>al</strong> Conference on<br />
Cyberspace, May 1993. (Available via anonymous FTP from<br />
media-lab.mit.edu: /pub/MediaMOO/Papers/MediaMOO<br />
3cyber-conf.)<br />
[6] Communications of the ACM, Speci<strong>al</strong> Issue on<br />
Augmented Environments, 36 (7), July 1993.<br />
[7] Cox, D. Interactive Computer-Assisted RGB<br />
Editor (ICARE). Proceedings for the Symposium on Sm<strong>al</strong>l<br />
Computers in the Arts, pp. 40-45, October 1987.<br />
[8] Cox, D. IUsing the Suupercomputer to Visu<strong>al</strong>ize<br />
Higher Dimensions: An Artist's Contribution to Scientific<br />
Visu<strong>al</strong>ization. Leonardo: Journ<strong>al</strong> of Art, Science and<br />
Technology, 21, pp. 233-242, 1988.<br />
[9] Curtis, P. Mudding: Soci<strong>al</strong> Phenomena in Text-<br />
Based Virtu<strong>al</strong> Re<strong>al</strong>ities. Proceedings of DIAC '92. Available<br />
via anonymous FTP from parcftp.xerox.com, pub/MOO/papers<br />
/DIAC92.<br />
[10] Davenport, G., et. <strong>al</strong>. Presentation of Immersive<br />
Environments Research, MIT Media Laboratory, Cambridge,<br />
MA, December 1992.<br />
[11] Druin, A. Noobie: The Anim<strong>al</strong> Design<br />
Playstation. Proceedings of ACM SIGCHI, 20 (1), pp. 45-53,<br />
1988.<br />
[12] Druin, A. and K. Perlin. Immersive<br />
Environments: A Physic<strong>al</strong> Approach to the Computer<br />
Interface. Proceedings of SIGCHI, 1994.<br />
[13] Ellis, S. Pictori<strong>al</strong> Communication: Pictures and<br />
the Synthetic Universe. Pictori<strong>al</strong> Communication. (London:<br />
Taylor and Francis, 1991).<br />
[14] Ellson, R. and D. Cox. Visu<strong>al</strong>ization of Injection<br />
Molding. Simulation, 51 (5), pp. 184-188, 1988.<br />
[15] Erickson, T. From Interface to Interplace: The<br />
Spati<strong>al</strong> Environment as a Medium for Interaction. Proceedings<br />
of the European Conference on Spati<strong>al</strong> Information<br />
Theory, (Heidelberg: Springer-Verlag, 1993).<br />
[16] Erickson, T. Artifici<strong>al</strong> Re<strong>al</strong>ity and the<br />
Visu<strong>al</strong>ization of Data. Virtu<strong>al</strong> Re<strong>al</strong>ity Applications (ed. A.<br />
Wexelblat). (Academic Press, 1993).<br />
[17] Fairchild, K. et. <strong>al</strong>. Dynamic FishEye<br />
Information Visu<strong>al</strong>izations. Virtu<strong>al</strong> Re<strong>al</strong>ity Systems. (London:<br />
Earnshaw, Gigante, and Jones, 1993).<br />
[18] Gaver, W. W., R. B. Smith & T. O'Shea.<br />
Effective Sounds in Complex Simulations: The ARKola<br />
Simulation. CHI '91 Proceedings: Human Factors in<br />
Computing Systems, p. 85, (New York: ACM Press, 1991).<br />
[19] Hirose, Michitaka. Visu<strong>al</strong>ization Tool<br />
Applications of Artifici<strong>al</strong> Re<strong>al</strong>ity. Proceedings of<br />
Internation<strong>al</strong> Symposium on Artifici<strong>al</strong> Re<strong>al</strong>ity and<br />
Telexistence, Tokyo, July 1991.<br />
[20] Krueger, M. W. Artifici<strong>al</strong> Re<strong>al</strong>ity II. Addison-<br />
Wesley, 1991.<br />
[21] Mercurio, P. J. & T. Erickson. Interactive<br />
Scientific Visu<strong>al</strong>ization: An Assessment of a Virtu<strong>al</strong> Re<strong>al</strong>ity<br />
Environ-ment. Human-Computer Interaction: Interact '90,<br />
(eds., D. Diaper, D. Gilmore, G. Cockton, B. Shackel), p. 741,<br />
(New York: Elsevier Science Publishing Company, 1990).<br />
[22] Zdepski, M. and G. Goldman. Re<strong>al</strong>ity and<br />
Virtu<strong>al</strong> Re<strong>al</strong>ity. Association for Computer Aided Design in<br />
Architecture, Los Angeles, CA., October 1991.
1 Introduction<br />
V<strong>al</strong>idation� Veri�cation and Ev<strong>al</strong>uation<br />
Chair� Sam Uselton� CSC�NASA Ames<br />
Panelists�<br />
Geo� Dorn� Arco Exploration and Production Technology<br />
Charbel Farhat� Univ. of Colorado<br />
Michael Vannier� Washington University School of Medicine<br />
Kim Esbensen� SINTEF<br />
Al Globus� CSC�NASA Ames<br />
The �How to Lie with Visu<strong>al</strong>ization� sessions of the<br />
last couple of years have been interesting and enter�<br />
taining� but it is time to take this discussion further.<br />
Research and development in the �eld of scienti�c vi�<br />
su<strong>al</strong>ization must be concerned with tools scientists can<br />
use to produce good visu<strong>al</strong>izations. The next question<br />
to address in improving visu<strong>al</strong>ization as a discipline<br />
might be �How to tell good tools from bad�� However�<br />
a better question is �How to select the most appropri�<br />
ate and useful tools for a particular job�� Scientists<br />
re<strong>al</strong>ly need support in selecting the �right� tools and<br />
verifying their qu<strong>al</strong>ity.<br />
Most scienti�c visu<strong>al</strong>izations are exploratory rather<br />
than expository� produced by scientists in the course<br />
of exploring their own data. These visu<strong>al</strong>izations<br />
are usu<strong>al</strong>ly done by scientists without the support of<br />
graphics or visu<strong>al</strong>ization speci<strong>al</strong>ists who might be con�<br />
sulted for making expository visu<strong>al</strong>izations. Minor<br />
errors in a visu<strong>al</strong>ization are easily overlooked. The<br />
consequences of such errors range from increased time<br />
required to gain the desired understanding to a com�<br />
pletely incorrect understanding. The more innovative<br />
and unusu<strong>al</strong> the application� the less likely such an er�<br />
ror will be detected. This vulnerability is due to the<br />
absence of experience with �how things ought to look�<br />
which is inherent in research.<br />
A �bug� usu<strong>al</strong>ly refers to software doing something<br />
di�erent than the programmer intended. Comprehen�<br />
sive testing� especi<strong>al</strong>ly for software intended for use<br />
in innovative environments� is hard. Descriptions and<br />
summaries of the tests we have done are often not<br />
available to the users. A di�erent source of visu<strong>al</strong>iza�<br />
tion errors is software that does something di�erent<br />
than what the scientist thinks it does. The particu�<br />
lar methods used to compute v<strong>al</strong>ues in the process of<br />
creating visu<strong>al</strong>izations are important to the scientists�<br />
but vendors are understandably reluctant to reve<strong>al</strong> <strong>al</strong>l<br />
the intern<strong>al</strong>s of their products. Is there a workable<br />
compromise�<br />
Another vulnerability of visu<strong>al</strong>ization users is in the<br />
choice of a technique which is less e�ective than oth�<br />
ers equ<strong>al</strong>ly available. Visu<strong>al</strong>ization researchers and<br />
developers should give users the information required<br />
to make good decisions about competing visu<strong>al</strong>ization<br />
techniques. What information is needed� What will<br />
it take to gather and distribute it� How should it be<br />
tied to visu<strong>al</strong>ization software�<br />
This panel is composed of four scientists who use<br />
visu<strong>al</strong>ization extensively in their diverse speci<strong>al</strong>ties�<br />
and a �fth whose expertise is speci�c<strong>al</strong>ly in visu<strong>al</strong>�<br />
ization software. Each of the four application scien�<br />
tists has a unique perspective on current problems and<br />
what could be done better. The �fth member of the<br />
panel has put signi�cant e�ort into designing test data<br />
and test procedures for use in a research environment.<br />
Their opinions make an interesting starting point for<br />
improving our discipline.<br />
2 Position Statement� Geo� Dorn<br />
In oil and gas exploration and production� visu�<br />
<strong>al</strong>ization is becoming increasingly important to solv�<br />
ing problems in data processing� interpretation� and<br />
modeling. Our problems are characterized by large<br />
data volumes �an average processed 3�D seismic vol�<br />
ume may contain 2 billion points�. We interpret this<br />
data to guide drilling a 1 foot diameter well to a depth<br />
of 12�000 feet� where an position<strong>al</strong> error of 100 to 300<br />
feet later<strong>al</strong>ly can be the di�erence between a good well<br />
and a dry hole. At a cost that ranges from sever<strong>al</strong> hun�<br />
dred thousand to about ten million dollars per well�<br />
we need to be accurate and precise.<br />
When we speak of v<strong>al</strong>idating� verifying and ev<strong>al</strong>u�<br />
ating a visu<strong>al</strong>ization application� we�re t<strong>al</strong>king about<br />
answering a basic set of questions�
1. What does it do�<br />
2. How does it do it�<br />
3. What are its advantages�<br />
3. When is it useful �technic<strong>al</strong>ly��<br />
4. When is it appropriate �economic<strong>al</strong>ly��<br />
5. How does it �t with other applications�<br />
With our intern<strong>al</strong> development� answers to what it<br />
does and how it does it are straightforward � we know<br />
the <strong>al</strong>gorithms because we design them. We try to get<br />
the answers to the remaining questions through proto�<br />
typing� involving experienced users as early as possi�<br />
ble� and testing with both �eld and model data. Model<br />
data has the advantage of exact knowledge� �eld data<br />
is necessary because a model is never as complex as<br />
the re<strong>al</strong> world.<br />
What we need and want with outside development<br />
are answers to the same �ve questions. We need to<br />
know what an application does and �to perhaps a<br />
lesser extent� how it does it. We need to know some�<br />
thing about the <strong>al</strong>gorithms that are operating on the<br />
data because we are responsible for properly intepret�<br />
ing that data. Comparisons between various appli�<br />
cations from di�erent developers on a standard set of<br />
data would help us answer the questions about the rel�<br />
ative advantages of various applications� the circum�<br />
stances under which they are useful� and how the ap�<br />
plication �ts with other software tools we use. The<br />
question of economics is probably only answerable by<br />
the user and the user�s management.<br />
Experience with some extern<strong>al</strong>ly developed visu<strong>al</strong>�<br />
ization applications suggests that too little attention<br />
is placed on the potenti<strong>al</strong> suite of other applications<br />
that your clients use in their work. The visu<strong>al</strong>ization<br />
application by itself will rarely if ever be the complete<br />
answer to a client�s problem. In order to be used ef�<br />
fectively and e�ciently� you need to be able to easily<br />
pass data between the visu<strong>al</strong>ization application and<br />
the rest of the tools being used to solve the problem.<br />
In this same vein� it is important to provide a means<br />
by which the user�developer can tie proprietary an<strong>al</strong>�<br />
ysis techniques to your visu<strong>al</strong>ization application. The<br />
point here is that we need both to visu<strong>al</strong>ize and to<br />
use � interpret� interact with � the data. It�s not good<br />
enough just to put up a pretty picture.<br />
What we don�t need is more �ashy demos.<br />
3 Position Statement� Charbel Farhat<br />
In the context of our research� Coupled Field Prob�<br />
lems are continuous mechanic<strong>al</strong> or non�mechanic<strong>al</strong><br />
systems mathematic<strong>al</strong>ly modeled by parti<strong>al</strong> di�eren�<br />
ti<strong>al</strong> equations that are coupled at the system in�<br />
terfaces by non�homogeneous boundary conditions.<br />
Some generic examples follow.<br />
�1� A structure is submerged in a gas� �uid or<br />
solid medium. �Speci�c application examples would<br />
be an aircraft� submarine or buried silo.� The prob�<br />
lem components are the structure and the extern<strong>al</strong><br />
�uid medium.<br />
�2� A superconducting medium operates in a<br />
therm<strong>al</strong>�electromagnetic �eld. The problem compo�<br />
nents are the full�space electromagnetic �eld� the ther�<br />
m<strong>al</strong> �eld and the superconductor viewed as a materi<strong>al</strong><br />
medium.<br />
�3� Thermomechanic<strong>al</strong> extrusion of a met<strong>al</strong> or plas�<br />
tic in a fabrication process. The problem components<br />
are the therm<strong>al</strong> �eld� the moving materi<strong>al</strong>� and the<br />
constraining medium.<br />
�4� A structure interacting with an active control<br />
system of mechanic<strong>al</strong> or embedded piezoelectric actu�<br />
ators. The problem components are the �exible struc�<br />
ture� the control system� and the sensor�control de�<br />
vices.<br />
All above examples involve a mechanic<strong>al</strong> system as<br />
one of the problem components� which interacts with<br />
other mechanic<strong>al</strong>� therm<strong>al</strong> or electromagnetic compo�<br />
nents. The interaction is two�way in the sense that<br />
in principle it is necessary to solve simultaneously for<br />
the state of <strong>al</strong>l components. The interaction domains<br />
may have di�erent dimension<strong>al</strong>ity� a surface in �1��<br />
the mechanic<strong>al</strong> volume in �2�� volume and surfaces in<br />
�3�� and a discrete set �actuator locations� in �4�.<br />
Visu<strong>al</strong>izing the solutions of Coupled Field Problems<br />
is <strong>al</strong>most as ch<strong>al</strong>lenging as computing them. Indeed�<br />
commerci<strong>al</strong> visu<strong>al</strong>ization software is split between�<br />
a� structured grids<br />
b� unstructured grids<br />
c� CFD �the famous or infamous Q �le�<br />
d� structur<strong>al</strong> mechanics<br />
e� �nite element��nite volume<br />
f� �nite di�erence<br />
g� etc ...<br />
It is out of the question for an engineer to use a<br />
separate visu<strong>al</strong>ization package for each �eld because�<br />
a� this is unmanageable<br />
b� it is <strong>al</strong>so unattractive<br />
c� most importantly� the results for each �eld should<br />
be visu<strong>al</strong>ized simultaneously in order to understand<br />
the physics of the coupling phenomena.<br />
This illustrates the need for scienti�c visu<strong>al</strong>ization<br />
paradigms that are either independent or encapsulate<br />
structure�unstructured concepts� �nite element��nite<br />
di�erence schemes� distinct physic<strong>al</strong> and mathemati�<br />
c<strong>al</strong> �elds� sc<strong>al</strong>ar�vector�and tensor variables.
4 Position Statement� Michael Van�<br />
nier<br />
Visu<strong>al</strong>ization is centr<strong>al</strong> to diagnostic radiology.<br />
Imaging mod<strong>al</strong>ities� such as radiography� computed<br />
tomography �CT�� scintigraphy� magnetic resonance<br />
imaging �MRI�� positron emission tomography �PET�<br />
and others generate data sets which are viewed sub�<br />
jectively by experts to generate text�based reports and<br />
satisfy clinic<strong>al</strong> consultation requests. Diagnostic per�<br />
formance in medic<strong>al</strong> imaging is measured using many<br />
methods� most important among these is Receiver Op�<br />
erating Characteristic or ROC an<strong>al</strong>ysis. This method<br />
provides a means to measure the diagnostic process<br />
at di�erent threshold settings in observer�based rated<br />
response experiments.<br />
ROC methods require knowledge of diagnostic<br />
truth. In gener<strong>al</strong>� truth is established by independent<br />
means �not the images themselves or simply consensus<br />
of experts�. Application of ROC an<strong>al</strong>ysis has shown<br />
that diagnostic performance and user preference for a<br />
certain type of image are not necessarily the same. In<br />
other words� simple visu<strong>al</strong>ization of results and sub�<br />
jective impressions can be misleading. The accuracy<br />
and precision of a diagnostic imaging test measured<br />
with ROC methods determine the ability of the test<br />
to discriminate an abnorm<strong>al</strong> individu<strong>al</strong> from a norm<strong>al</strong><br />
population or to measure changes within an individu<strong>al</strong><br />
over time.<br />
The veri�cation of diagnostic medic<strong>al</strong> imaging<br />
methods and procedures is done in a staged fash�<br />
ion� beginning with mathematic<strong>al</strong>ly simulated data�<br />
followed by physic<strong>al</strong> test objects �c<strong>al</strong>led phantoms��<br />
cadavers� anim<strong>al</strong>s� and ultimately human volunteers.<br />
The interpretation of medic<strong>al</strong> images requires knowl�<br />
edge of norms � usu<strong>al</strong>ly obtained by study of reference<br />
populations and observation of norm<strong>al</strong> variation. The<br />
de�nition of �norm<strong>al</strong>� is often di�cult� due to limi�<br />
tations in our ability to adequately characterize and<br />
sample su�cient representative cases and account for<br />
their variation.<br />
Ev<strong>al</strong>uation of medic<strong>al</strong> imaging systems and proce�<br />
dures is both formative and summative. Process ev<strong>al</strong>�<br />
uation is done based on cost or safety criteria. Out�<br />
come ev<strong>al</strong>uation is done based on morbidity� mort<strong>al</strong>ity<br />
�surviv<strong>al</strong>�� and qu<strong>al</strong>ity of life criteria. Mandatory as�<br />
sessments of medic<strong>al</strong> imaging devices and accessories<br />
including software and pharmaceutic<strong>al</strong>s on the basis<br />
of safety and e�cacy are arbitrated by the FDA.<br />
Over<strong>al</strong>l� medic<strong>al</strong> imaging system visu<strong>al</strong>ization soft�<br />
ware v<strong>al</strong>idation� veri�cation and ev<strong>al</strong>uation is per�<br />
formed in a well established framework. Presently�<br />
multicenter� multiobserver and multimod<strong>al</strong>ity tri�<br />
<strong>al</strong>s of imaging systems are being developed to for�<br />
m<strong>al</strong>ly assess imaging technology before adoption for<br />
widespread use or reimbursement by third party pay�<br />
ers.<br />
5 Position Statement� Kim Esbensen<br />
Scientists often have data which has no prede�ned<br />
geometric or spati<strong>al</strong> interpretation. Visu<strong>al</strong>ization is<br />
v<strong>al</strong>uable for these types of data too however.<br />
Exploratory visu<strong>al</strong>ization of complex� multivariate<br />
data without an inherent spati<strong>al</strong> geometry is a speci�c<br />
and important aspect of �standard� multivariate data<br />
an<strong>al</strong>ysis. Some form of projective geometry is often<br />
invoked� e.g. one of the powerful �bilinear� projec�<br />
tion methods� princip<strong>al</strong> component an<strong>al</strong>ysis� parti<strong>al</strong><br />
least squares regression etc. With these methods it<br />
is possible to gain v<strong>al</strong>uable insight into the underly�<br />
ing covariance data structures� while simultaneously<br />
screening o� error components in the origin<strong>al</strong> data.<br />
All an<strong>al</strong>ysis in this regimen has hitherto been carried<br />
out on the basis of the familiar Cartesian coordinate<br />
system. Recently a novel approach based on a set<br />
of par<strong>al</strong>lel coordinate axes in the 2�D plane <strong>al</strong>lows a<br />
completely di�erent visu<strong>al</strong>ization avenue� the Par<strong>al</strong>lel<br />
Coordinates �PC� approach.<br />
Amongst other attributes the PC approach <strong>al</strong>lows<br />
for simultaneous display of a virtu<strong>al</strong>ly unlimited num�<br />
ber of variables without the characteristic projection<br />
bias which is <strong>al</strong>ways accompanying bilinear methods.<br />
This approach has been hailed as superior in many<br />
ways to the tradition<strong>al</strong> regimen� especi<strong>al</strong>ly for process<br />
monitoring and control. This new visu<strong>al</strong>ization tech�<br />
nique is speci�c<strong>al</strong>ly o�ered not simply as an <strong>al</strong>terna�<br />
tive way to presenting the same data as the tradition<strong>al</strong><br />
techniques� but is said to <strong>al</strong>low completely new types<br />
of insights and to reve<strong>al</strong> covariance relationships in a<br />
fashion more easily grasped by the uninitiated user.<br />
Illustrating complex process data relationships�<br />
necessarily multivariate� by both the standard multi�<br />
variate data an<strong>al</strong>ytic<strong>al</strong> approach and the Par<strong>al</strong>lel Co�<br />
ordinates methodology thus comprises an illustrative<br />
case study on how developers might go about present�<br />
ing evidence on the use and merits of a new visu<strong>al</strong>iza�<br />
tion technique. Because the tradition<strong>al</strong> multivariate<br />
methods are very well known and ev<strong>al</strong>uated� it will<br />
su�ce to ev<strong>al</strong>uate the PC approach on representative<br />
data sets which have <strong>al</strong>ready been succesfully an<strong>al</strong>�<br />
ysed� and understood in this regimen. In order to<br />
familiarize oneself with the new technique� one might<br />
at �rst use model� or simulated� data� some examples<br />
of this avenue will be presented. For more re<strong>al</strong>istic<br />
Veri�cation� V<strong>al</strong>idation and Ev<strong>al</strong>uation however� one<br />
is strongly advised to employ well�chosen re<strong>al</strong>�world
data� process chemic<strong>al</strong> data from a Norwegian py�<br />
romet<strong>al</strong>lurgic<strong>al</strong> smelter plant �more than 25 raw ma�<br />
teri<strong>al</strong>s and s<strong>al</strong>ient process variables for a complete one<br />
year operation� serve as such a comparison vehicle.<br />
The results from this comparison speaks volumes<br />
of the ACTUAL merits of the new vs. the older tech�<br />
niques in gener<strong>al</strong>� and of the speci�c PC attributes<br />
that REALLY represents new types of insights in par�<br />
ticular � and which are indeed nothing but old wine<br />
in new bottles. There would appear to exist a DU�<br />
ALITY between the Cartesian and the Par<strong>al</strong>lel Coor�<br />
dinate approaches. For example� the ordering of vari�<br />
ables in the Par<strong>al</strong>lel Coordinates approach is a critic<strong>al</strong><br />
issue. The number of permutations of <strong>al</strong>ternative or�<br />
derings of variables is often quite staggering. However�<br />
the ordering issue can be reduced signi�cantly� often<br />
completely eliminated� by using an initi<strong>al</strong> multivari�<br />
ate data an<strong>al</strong>ysis. This standard covariance structure<br />
delineation provides important clues for the optim<strong>al</strong><br />
par<strong>al</strong>lel coordinate ordering which furthermore can be<br />
obtained simultaneously with outlier�screening.<br />
Neither is the old regimen obsolete� nor is the PC<br />
approach a new panacea ready to substitute the for�<br />
mer. Rather� the scienti�c visu<strong>al</strong>ization of complex<br />
non�geometric<strong>al</strong> data has found a viable new comple�<br />
mentary du<strong>al</strong>. Gener<strong>al</strong>isations from this intercompar�<br />
ison will be furthered for the speci�c purposes of this<br />
panel.<br />
6 Position Statement� Al Globus<br />
I want to make two points� 1. visu<strong>al</strong>ization software<br />
needs rigorous veri�cation in the form of much better<br />
testing and� 2. experiments with human subjects are<br />
essenti<strong>al</strong> to scienti�c<strong>al</strong>ly v<strong>al</strong>idate and ev<strong>al</strong>uate visu<strong>al</strong>�<br />
ization techniques.<br />
Veri�cation � does the software do what the devel�<br />
oper thinks it does�<br />
I�ve found much visu<strong>al</strong>ization software to be pretty<br />
buggy. Crashes and mysterious behavior are common.<br />
Only when I�ve used a package for some time and know<br />
it quite well can I get reliable results. What�s a devel�<br />
oper to do�<br />
I�ve tried a few things not speci�c to visu<strong>al</strong>ization�<br />
adding a �static test��� to each C�� class� �hand sim�<br />
ulating� by single stepping through the code using a<br />
visu<strong>al</strong> debugger watching <strong>al</strong>l loc<strong>al</strong> variables and ob�<br />
ject members update� and building a random widget<br />
tweaker. I�ve <strong>al</strong>so tried developing a test set genera�<br />
tor for unsteady �ows. The �rst two are pretty obvi�<br />
ous and fairly standard� <strong>al</strong>though �apparently� rarely<br />
done. The last two merit some discussion.<br />
A random widget tweaker keeps a list of <strong>al</strong>l of the<br />
user input widgets. In overnight runs� the tweaker re�<br />
peatedly chooses a widget at random and sends it the<br />
tweak message. The tweak message changes the v<strong>al</strong>ue<br />
of a widget �e.g.� slider position� at random. This tech�<br />
nique simulates a monkey at the keyboard and mouse.<br />
It e�ectively �nds crash and burn bugs.<br />
Building a good test set generator is an interesting<br />
problem. First of <strong>al</strong>l� unsteady data sets can be very<br />
large� so distributing the source to a test set generator<br />
saves a lot of network bandwidth. Output size can be<br />
a parameter to the code so that sm<strong>al</strong>l data sets can<br />
be generated for debugging and larger sets �that just<br />
�t currently available disk space� generated to inves�<br />
tigate program performance. Test sets should reve<strong>al</strong><br />
common and subtle bugs and de�ciencies that gener�<br />
ate incorrect pictures. For example� circular stream�<br />
lines will stress some particle tracing codes.<br />
V<strong>al</strong>idation � does the visu<strong>al</strong>ization accurately� and<br />
e�ectively� represent the data�<br />
Many visu<strong>al</strong>ization programmers come from the<br />
computer graphics community� as I do. This commu�<br />
nity v<strong>al</strong>ues pretty pictures� which are not necessarily<br />
correct or informative. In many cases� visu<strong>al</strong>izations<br />
are accepted if they look �more or less right�. Some�<br />
times a user is c<strong>al</strong>led in to glance at the visu<strong>al</strong>ization<br />
and make a few comments. This is mediocre science�<br />
at best.<br />
We claim that visu<strong>al</strong>ization increases human un�<br />
derstanding. This can only be proven by experiments<br />
with human subjects. As far as I know� no such exper�<br />
iments have ever been conducted. Such experiments<br />
are di�cult to design and so require collaboration with<br />
psychologists and�or human factors experts.<br />
Ev<strong>al</strong>uation � is thing A better than thing B�<br />
When is one visu<strong>al</strong>ization techniques better than<br />
another� We can �ame or run experiments. For ex�<br />
ample� two groups of subjects are given a data set<br />
and asked to �nd important features. Each group is<br />
given a di�erent visu<strong>al</strong>ization tool �e.g.� isosurfaces vs.<br />
sc<strong>al</strong>ar mapped cut planes�. Time to completion and<br />
correct results are measured.<br />
7 Panelists�<br />
7.1 Geo�rey Dorn<br />
Geo�rey Dorn received his B.S. in Astrophysics<br />
�1973� and his M.S. in Geophysics �1978� from the<br />
University of New Mexico� and Ph.D. in Exploration<br />
Geophysics �1980� from the University of C<strong>al</strong>ifornia�<br />
Berkeley. He has held positions in acquisition and in�<br />
terpretation research in ARCO Oil and Gas Co. since<br />
1980� including four years as director of interactive<br />
interpretation techniques research. He is currently<br />
a Research Advisor at ARCO. His interests include<br />
3�D seismic interpretation� interactive interpretation
techniques and system design� 3D visu<strong>al</strong>ization tech�<br />
niques� and reservoir geophysics. Geo� is a member<br />
of the Society of Exploration Geophysicists �SEG� Re�<br />
search Committee. He was gener<strong>al</strong> chairman of the<br />
1993 SEG Research Workshop on 3�D Seismology and<br />
has co�chaired SEG workshops on Scienti�c Visu<strong>al</strong>iza�<br />
tion� Emerging Workstation Technology� and Seismic<br />
Stratigraphy.<br />
7.2 Charbel Farhat<br />
Charbel Farhat is Associate Professor of Aerospace<br />
<strong>Engineering</strong> at the University of Colorado at Boulder.<br />
He holds a Ph.D. in Computation<strong>al</strong> Mechanics from<br />
the University of C<strong>al</strong>ifornia� Berkeley �1987�. He is<br />
the recipient of sever<strong>al</strong> prestigious awards including<br />
the Presidenti<strong>al</strong> Young Investigator Award �Nation<strong>al</strong><br />
Science Foundation� 1989�1994�� the Arch T. Colwell<br />
Merit Award �1993�� a TRW fellowship �1989�92�� the<br />
CRAY Research Award �1990�91�� and the PACER<br />
Award �Control Data Corporation� 1987�89�. Profes�<br />
sor Farhat has been an AGARD lecturer on compu�<br />
tation<strong>al</strong> mechanics at sever<strong>al</strong> distinguished European<br />
institutions. He is the author of over 50 journ<strong>al</strong> papers<br />
on computation<strong>al</strong> mechanics and par<strong>al</strong>lel processing.<br />
His interest in computer graphics has recently led him<br />
to develop TOP�DOMDEC� an object�oriented inter�<br />
active �nite element pre� and post�processor.<br />
7.3 Michael Vannier<br />
Mike Vannier is a diagnostic radiologist �M.D.� and<br />
researcher in medic<strong>al</strong> imaging. He worked for NASA<br />
as a contractor employee in the 1970�s and completed<br />
a diagnostic radiology residency at the M<strong>al</strong>linckrodt<br />
Institute of Radiology� Washington University School<br />
of Medicine in St. Louis� Mo. in 1982. In 1988� he<br />
was visiting scientist in Materi<strong>al</strong>s Science and Engi�<br />
neering at Argonne Nation<strong>al</strong> Laboratory. Presently�<br />
he is professor of radiology at Washington University.<br />
He has extensive experience with the development and<br />
application of 3�D visu<strong>al</strong>ization methods in diagnos�<br />
tic imaging� especi<strong>al</strong>ly for craniofaci<strong>al</strong> deformities. He<br />
serves as Editor�in�Chief of the IEEE Transactions on<br />
Medic<strong>al</strong> Imaging� and on the editori<strong>al</strong> board of Radiol�<br />
ogy� Investigative Radiology� Diagnostic Imaging� and<br />
others. He is the chair �for 1994�5� of the NIH study<br />
section at the Nation<strong>al</strong> Library of Medicine concerned<br />
with the initi<strong>al</strong> review of medic<strong>al</strong> informatics projects.<br />
7.4 Kim H. Esbensen<br />
Kim H. Esbensen� Ph.D. �Technic<strong>al</strong> University<br />
of Denmark� Copenhagen� 1979�� is a senior scien�<br />
tist with the Foundation for Scienti�c and Indus�<br />
tri<strong>al</strong> Research �SINTEF�� Oslo� Norway� where he is<br />
in charge of research� development and applications<br />
within chemometrics� multivariate image an<strong>al</strong>ysis and<br />
acoustic sensing and imaging. He <strong>al</strong>so holds posi�<br />
tions with the University of Oslo� Telemark Engineer�<br />
ing University� Norway and Universite Lav<strong>al</strong>� Quebec�<br />
Canada. Previously he spent eight years as a research<br />
scientist at the Norwegian Computing Center� Oslo.<br />
Honors include the 1979 University of Copenhagen Sil�<br />
ver Med<strong>al</strong>� he has held a Roy<strong>al</strong> Danish Academy of Sci�<br />
ence fellowship. He is a member of the Chemometrics<br />
Society� American Geophysic<strong>al</strong> Union� Norwegian Sta�<br />
tistic<strong>al</strong> Society� Meteoritic<strong>al</strong> Society and the Planetary<br />
Society. His involvement with visu<strong>al</strong>ization includes<br />
extensive experience in multivariate data an<strong>al</strong>ysis and<br />
multivariate image an<strong>al</strong>ysis� both in applications and<br />
in development of methodology. He is a co�developer<br />
of the MIA �Multivariate Image An<strong>al</strong>ysis� approach�<br />
now embodied in the ERDAS image an<strong>al</strong>ysis system.<br />
His current research interests focus on exploring the<br />
du<strong>al</strong>ity between �Cartesian� multivariate data an<strong>al</strong>y�<br />
sis and the new Par<strong>al</strong>lel Coordinates approach.<br />
7.5 Al Globus<br />
Al Globus is a senior computer scientist with Com�<br />
puter Sciences Corporation at NASA Ames Research<br />
Center. His research interests include scienti�c visu�<br />
<strong>al</strong>ization� space colonization� and computer network<br />
enhanced education. Globus received a B.A. degree in<br />
information science from the University of C<strong>al</strong>ifornia<br />
at Santa Cruz in 1979 following a previous life as a<br />
musician. He is a member of the IEEE Computer So�<br />
ciety and the American Institute of Aeronautics and<br />
Astronautics.<br />
7.6 Samuel P. Uselton<br />
Sam Uselton is a researcher in visu<strong>al</strong>ization and<br />
computer graphics. He is a senior computer scientist<br />
with Computer Sciences Corp. �CSC� working in the<br />
Applied Research Branch of the NAS Systems Divi�<br />
sion at NASA Ames Research Center. He received his<br />
BA in Math and Economics in 1973 from the Univer�<br />
sity of Texas �Austin�� and his MS in 1976 and PhD in<br />
1981� both in Computer Science� from the University<br />
of Texas at D<strong>al</strong>las. Sam has been working in com�<br />
puter graphics and scienti�c visu<strong>al</strong>ization since 1976.<br />
He has worked with scientists in �elds as diverse as<br />
medicine� oil exploration and production� and compu�<br />
tation<strong>al</strong> �uid dynamics. He at the University of Tulsa<br />
and the University of Houston for a tot<strong>al</strong> of ten years.<br />
He is a member of hte IEEE Computer Society� the<br />
ACM� and SIGGRAPH. His current research projects<br />
are in direct volume rendering� re<strong>al</strong>istic image synthe�<br />
sis and uses of par<strong>al</strong>lel and distributed computing for<br />
visu<strong>al</strong>ization.
This article was unavailable at the time of CD-ROM publication.


![JavaScript API [callas Intranet] - Adobe Acrobat Engineering](https://img.yumpu.com/12380587/1/184x260/javascript-api-callas-intranet-adobe-acrobat-engineering.jpg?quality=85)