0739 v1.2 Duolink Brochure - final - Eurogentec
0739 v1.2 Duolink Brochure - final - Eurogentec
0739 v1.2 Duolink Brochure - final - Eurogentec

You also want an ePaper? Increase the reach of your titles
YUMPU automatically turns print PDFs into web optimized ePapers that Google loves.
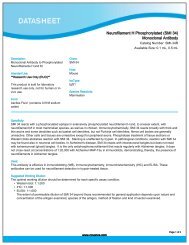
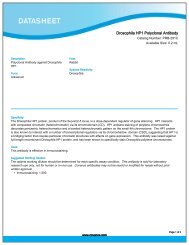
6. DIFFERENTIATE BETWEEN SUB-POPULATIONS OF CELLS<br />
Evaluate phosphorylation levels. Discrete fluorescent signals reveal phosphorylation of PDGF<br />
receptors.<br />
Unstimulated control<br />
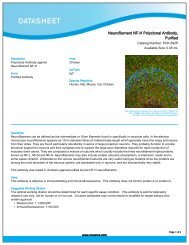
PLA SIGNALS (SIGNALS/CELL)<br />
50<br />
45<br />
40<br />
35<br />
30<br />
25<br />
20<br />
15<br />
10<br />
5<br />
0<br />
NON STIMULATED STIMULATED<br />
Fig 8. Dedicated <strong>Duolink</strong> ImageTool<br />
generates accurate data.<br />
BB (PDGF ligand)-stimulated cells<br />
Fig 7. Red: phosphorylated PDGF<br />
receptors.<br />
Blue: Hoechst stained nuclei.<br />
“… allows visualization of the cellular<br />
compartment (nucleus, cytoplasm, etc) in which<br />
protein-protein interactions take place.“<br />
Mark Wade, PhD,<br />
Gene Expression Laboratory (Wahl Lab),<br />
The Salk Institute, San Diego, USA<br />
<strong>Duolink</strong> – Protein interactions<br />
7