Patterns of Urban and Rural Population Growth - Development
Patterns of Urban and Rural Population Growth - Development
Patterns of Urban and Rural Population Growth - Development

Create successful ePaper yourself
Turn your PDF publications into a flip-book with our unique Google optimized e-Paper software.
UNITED NATIONS<br />
PATTERNS OF URBAN<br />
AND RURAL<br />
POPULATION GROWTH
Department <strong>of</strong> International Economic <strong>and</strong> Social Affairs<br />
POPULATION STUDIES, No. 68<br />
PATTERNS OF URBAN<br />
AND RURAL<br />
POPULATION GROWTH<br />
UNITED NATIONS<br />
New York, 1980<br />
ST/ESA/SER.A/68
NOTE<br />
The designations employed <strong>and</strong> the presentation <strong>of</strong> the material in this publication<br />
do not imply the expression <strong>of</strong> any opinion whatsoever on the part <strong>of</strong> the<br />
Secretariat <strong>of</strong> the United Nations concerning the legal status <strong>of</strong> any country, territory,<br />
city or area or <strong>of</strong> its authorities, or concerning the delimitation <strong>of</strong> its frontiers or<br />
boundaries.<br />
The designations "developed" <strong>and</strong> "developing" economies are intended for<br />
statistical convenience <strong>and</strong> do not necessarily express a judgement about the stage<br />
reached by a particular country or area in the development process.<br />
The term "country" as used in the text <strong>of</strong> this publication also refers, as appropriate,<br />
to territories or areas.<br />
Symbols <strong>of</strong> United Nations documents are composed <strong>of</strong> capital letters combined<br />
with figures. Mention <strong>of</strong> such a symbol indicates a reference to a United Nations<br />
document.<br />
The printing <strong>of</strong> this volume was made possible by a publications grant<br />
from the United Nations Fund for <strong>Population</strong> Activities<br />
ST/ESA/SER.A/68<br />
UNITED NATIONS PUBLICATION<br />
Sales No. E.79XIII.9<br />
Price: $U.S. 13.00
CONTENTS<br />
Explanatory notes " viii<br />
Chapter<br />
I. HISTORICAL BACKGROUND OF URBANIZATION. . . . . . . . . . . . . . . . . . . . . . . . 1<br />
A. New forms <strong>of</strong> urban organization. . . . . . . . . . . . . . . . . . . . . . . . . . . . . . 3<br />
B. Brief quantitative review <strong>of</strong> historical growth <strong>of</strong> cities . . . . . . . . . . . . . . 5<br />
II. ESTIMATES AND PROJECTIONS OF URBAN AND RURAL POPULATIONS. . . . . . 9<br />
A. <strong>Urban</strong> population . . . . . . . . . . . . . . . . . . . . . . . . . . . . . . . . . . . . . . . . . 11<br />
B. <strong>Rural</strong> population . . . . . . . . . . . . . . . . . . . . . . . . . . . . . . . . . . . . . . . . . . 13<br />
C. Relative size <strong>of</strong> urban <strong>and</strong> rural populations. . . . . . . . . . . . . . . . . . . . . 15<br />
D. Relationship between urban <strong>and</strong> industrial populations . . . . . . . . . . . . 17<br />
III. COMPONENTS OF URBAN AND RURAL POPULATION CHANGE. . . . . . . . . . . .. 20<br />
A. Methods <strong>of</strong> procedure . . . . . . . . . . . . . . . . . . . . . . . . . . . . . . . . . . . . . . 20<br />
B. Evaluating the technique . . . . . . . . . . . . . . . . . . . . . . . . . . . . . . . . . . . . 21<br />
C. Sources <strong>of</strong> urban growth . . . . . . . . . . . . . . . . . . . . . . . . . . . . . . . . . . .. 22<br />
D. Sources <strong>of</strong> rural population change. . . . . . . . . . . . . . . . . . . . . . . . . . . . 27<br />
E. Factors associated with national rates <strong>of</strong> net rural-urban migration. . . . 30<br />
F. Components <strong>of</strong> urbanization . . . . . . . . . . . . . . . . . . . . . . . . . . . . . . . .. 33<br />
G. Sensitivity <strong>of</strong> results to mortality assumptions ..... . . . . . . . . . . . . . . 34<br />
IV. PATTERNS OF GROWTH AMONG CITIES " 38<br />
A. Factors associated with recent growth <strong>of</strong> individual cities . . . . . . . . . . . 40<br />
B. Estimates <strong>and</strong> projections <strong>of</strong> city population . . . . . . . . . . . . . . . . . . . . . 44<br />
C. <strong>Growth</strong> trends in various size classes . . . . . . . . . . . . . . . . . . . . . . . . . . . 47<br />
D. Size distributions <strong>of</strong> cities . . . . . . . . . . . . . . . . . . . . . . . . . . . . . . . . . . . 54<br />
V. OCCUPATIONAL CHARACTERISTICS OF URBAN AND RURAL LABOUR FORCES 59<br />
A. Dynamics <strong>of</strong> labour force composition . . . . . . . . . . . . . . . . . . . . . . 61<br />
B. Concepts <strong>and</strong> definitions . . . . . . . . . . . . . . . . . . . . . . . . . . . . . . . . . . . . 64<br />
C. Data 67<br />
D. Degree <strong>of</strong> urbanization in occupations . . . . . . . . . . . . . . . . . . . . 68<br />
E. Labour force structures <strong>of</strong> urban <strong>and</strong> rural areas in relation to developmental<br />
level . . . . . . . . . . . . . . . . . . . . . . . . . . . . . . . . . . . . . . . . . . . . . . 68<br />
F. Relative rise <strong>of</strong> urban services . . . . . . . . . . . . . . . . . . . . . . . . . . . . . . . . 71<br />
G. Trends in occupation/residence relations .. . . . . . . . . . . . . . . . . . . . . . 73<br />
H. Regional <strong>and</strong> temporal factors in labour force structure. . . . . . . . . . . . . 77<br />
I. Synthetic time trends . . . . . . . . . . . . . . . . . . . . . . . . . . . . . . . . . . . . . . . 80<br />
VI. OCCUPATIONS OF WOMEN IN THE URBAN AND RURAL LABOUR FORCE. . . . . . 82<br />
A Female labour force participation <strong>and</strong> economic development . . . . . . . . 84<br />
B. Feminization <strong>of</strong> occupations in relation to developmental level . . . . . . . 86<br />
C. Trends in feminization <strong>of</strong> occupations . . . . . . . . . . . . . . . . . . . . . . . . . 88<br />
D. Regional variations in feminization <strong>of</strong> occupations. . . . . . . . . . . . . . . . 91<br />
E. Discussion............................................... 92<br />
v<br />
Page
Page<br />
19. Regression equation predicting city growth rates in most recent intercensal<br />
period for cities with over 100,000 population at beginning <strong>of</strong> period . . . . . . . 43<br />
20. <strong>Population</strong>, number <strong>of</strong> cities <strong>and</strong> percentage <strong>of</strong> urban population in particular<br />
size class or above, world, more developed <strong>and</strong> less developed regions, <strong>and</strong><br />
major areas, 1950-1975 48<br />
21. Fraction <strong>of</strong> population growth to various sizes <strong>of</strong> city categories attributable<br />
to graduation, major areas, 1970-1975 . . . . .. . . . . . . .. . . . . . . . . . . . . ... . 53<br />
22. <strong>Population</strong> <strong>and</strong> number <strong>of</strong> cities in a particular size class, major areas, 1975-<br />
2000 55<br />
23. Thirty largest agglomerations in the world, ranked by size, 1950-2000 . . . . . . 58<br />
24. Comparison <strong>of</strong> labour force distribution by occupation <strong>and</strong> by industry . . . . . . 66<br />
25. Average proportion urban in various occupations classified by level <strong>of</strong> development<br />
<strong>of</strong> country . . . . . . . . . . . . . . . . . . . . . . . . . . . . . . . . . . . . . . . . . . . . . . . . 68<br />
26. Percentage composition <strong>of</strong> urban <strong>and</strong> rural labour force, by sector <strong>of</strong> economic<br />
activity <strong>and</strong> level <strong>of</strong> development ... . . . . . . . . . . . . . . . . . . . . . . . . . . . . . . . 69<br />
27. Components <strong>of</strong> change in occupational distributions between highest <strong>and</strong> lowest<br />
levels <strong>of</strong> development . . . . . . . . . . . . . . . . . . . . . . . . . . . . . . . . . . . . . . . . . . . . 71<br />
28. Percentage composition <strong>of</strong> urban labour force, by sector <strong>of</strong> economic activity,<br />
countries with at least two observations. . . . . . . . . . . . . . . . . . . . . . . . . . . . . . 74<br />
29. Percentage composition <strong>of</strong> rural labour force, by sector <strong>of</strong> economic activity,<br />
countries with at least two observations . . . . . . . . . . . . . . . . . . . . . . . . . . . . . . 75<br />
30. Proportion urban, by sector <strong>of</strong> economic activity, countries with at least two<br />
observations 77<br />
31. Regional deviations in labour force structure, controlling percentage <strong>of</strong> total<br />
labour force in agriculture <strong>and</strong> date <strong>of</strong> observation . . . . . . . . . . . . . . . . . . . . . . 79<br />
32. Variations in urbanization <strong>of</strong> occupations, major areas. . . . . . . . . . . . . . . . . . 80<br />
33. Changes over time in labour force structure, controlling percentage <strong>of</strong> total<br />
labour force in agriculture <strong>and</strong> regions from which observations derive . . . . . . 80<br />
34. Time trends in urbanization <strong>of</strong> occupations . . . . . . . . . . . . . . . . . . . . . . . . . . . 81<br />
35. Average percentage <strong>of</strong> specified occupations in urban <strong>and</strong> rural areas occupied<br />
by females among countries classified by level <strong>of</strong> development . . . . . . . . . . . . 87<br />
36. Percentage female <strong>of</strong> occupations in urban areas, countries with at least two<br />
observations . . . . . . . . . . . . . . . . . . . . . . . . . . . . . . . . . . . . . . . . . . . . . . . . . . . 88<br />
37. Percentage female <strong>of</strong> occupations in rural areas, countries with at least two<br />
observations . . . . . . . . . . . . . . . . . . . . . . . . . . . . . . . . . . . . . . . . . . . . . . . . . . . 89<br />
38. Variations in feminization <strong>of</strong> occupations, major areas. . . . . . . . . . . . . . . . . . 91<br />
39. Average household size, rural <strong>and</strong> urban populations, according to recent<br />
national censuses ..... . . . . . . . . . . . . . . . . . . . . . . . . . . . . . . . . . . . . . . . . . . 98<br />
40. Number <strong>of</strong> non-nuclear relatives <strong>and</strong> <strong>of</strong> non-relatives per household, selected<br />
national censuses . . . . . . . . . . . . . . . . . . . . . . . . . . . . . . . . . . . . . . . . . . . . . .. 101<br />
41. Summary <strong>of</strong> urban <strong>and</strong> rural measures concerning marital status <strong>of</strong> either sex<br />
<strong>and</strong> urban/rural differences in these measures . . . . . . . . . . . . . . . . . . . . . . . .. 105<br />
42. Summary <strong>of</strong> women-to-men ratios <strong>of</strong> each marital status, urban <strong>and</strong> rural areas,<br />
<strong>and</strong> urban/rural ratios <strong>of</strong> those ratios . . . . . . . . . . . . . . . . . . . . . . . . . . . . . .. 107<br />
43. Average percentage urban, by age <strong>and</strong> sex, for total sample, more developed<br />
<strong>and</strong> less developed regions, <strong>and</strong> major areas . . . . . . . . . . . . . . . . . . . . . . . . .. 110<br />
44. International time series <strong>of</strong> urban sex ratios . . . . . . . . . . . . . . . . . . . . . . . . . .. 114<br />
45. International time series <strong>of</strong> rural sex ratios . . . . . . . . . . . . . . . . . . . . . . . . . .. 115<br />
46. Average sex ratios at various ages, urban areas, based on data recorded in<br />
1965-1975 117<br />
47. Average sex ratios at various ages, rural areas, based on data recorded in 1965-<br />
1975 117<br />
48. <strong>Urban</strong> <strong>and</strong> city population, major areas, regions <strong>and</strong> countries, 1950-2000 . .. 125<br />
49. <strong>Rural</strong> population, major areas, regions <strong>and</strong> countries, 1950-2000 . . . . . . . . .. 155<br />
50. Percentage urban, major areas, regions <strong>and</strong> countries, 1950-2000 . . . . . . . . .. 159<br />
51. Occupational composition <strong>of</strong> urban <strong>and</strong> rural labour force, by country . . . . .. 163<br />
52. Percentage urban in various occupations, by country. . . . . . . . . . . . . . . . . . .. 168<br />
53. Percentage female in various occupations, rural <strong>and</strong> urban areas, by country.. 171<br />
vii
Explanatory notes<br />
The following symbols have been used in the tables throughout the report:<br />
Three dots (...) indicate that data are not available or are not separately reported;<br />
A dash (-) indicates that the amount is nil or negligible;<br />
A blank in a table indicates that the item is not applicable;<br />
A minus sign (-) indicates a deficit or decrease, except as indicated;<br />
A full stop (.) is used to indicate decimals;<br />
A slash U) indicates a crop year or financial year, e.g., 1970171.<br />
Use <strong>of</strong> a hyphen (-) between dates representing years, e.g., 1971-1973, signifies the full<br />
period involved, including the beginning <strong>and</strong> end years.<br />
Details <strong>and</strong> percentages in tables do not necessarily add to totals, because <strong>of</strong> rounding.<br />
Reference to "tons" indicates metric tons, <strong>and</strong> to "dollars" ($) United States dollars, unless<br />
otherwise stated.<br />
ix
I. mSTORICAL BACKGROUND OF URBANIZADON<br />
The world <strong>of</strong> humans has undergone three great<br />
changes in the pattern <strong>and</strong> organization <strong>of</strong> settlements,<br />
two <strong>of</strong> them revolutionary. The first great revolution was<br />
the transition from hunting <strong>and</strong> fishing to agriculture,<br />
<strong>and</strong> it occurred in the Neolithic Age. Previously, homeless<br />
b<strong>and</strong>s <strong>of</strong> hunters <strong>and</strong> gatherers settled down in<br />
units <strong>and</strong> then in groups <strong>of</strong> dwellings, erected to last<br />
longer than a mere season; <strong>and</strong> even today one can<br />
refer to those groups as "villages". This beginning <strong>of</strong><br />
rural settlement, superseding a condition <strong>of</strong> no settlement<br />
at all, was associated with a comparatively large<br />
population increase. Prior to that time, humans, as a<br />
whole, could at most have numbered onlya few million;<br />
but with the adoption <strong>of</strong> settled agriculture the human<br />
population soon reached many dozens <strong>of</strong> millions.<br />
The second great change--a transition rather than a<br />
revolution-was the emergence<strong>of</strong> what, even by modem<br />
st<strong>and</strong>ards, can be designated as "cities". It is now generally<br />
agreed that this development occurred first in<br />
the region <strong>of</strong> Mesopotamia (currently Iraq) soon after<br />
3500 B.C. The seed <strong>of</strong> the urban idea was then gradually<br />
carried to other parts, notably to the Nile Valley<br />
(Egypt), the Indus Valley (Pakistan); <strong>and</strong>, subsequently,<br />
the Hoang-ho Valley (China). The urban development<br />
in the western hemisphere (Mexico, Peru) at<br />
a later date was perhaps independently inspired by an<br />
indigenous achievement, because <strong>of</strong> the separation by<br />
oceans. The origin <strong>of</strong> the city was related to the gradual<br />
discovery that more organized social bodies could carry<br />
progress in material welfare to a distinctly more advanced<br />
level. To bring organization to a level beyond<br />
that attainable with the limited capacity for memory by<br />
the human individual, there was a need for recordkeeping,<br />
a system <strong>of</strong> writing or at least some substitute<br />
(e.g., the many-coloured knotted strings, or quipus,<br />
which served as records among the Peruvian Incas).<br />
Because history also depends upon writing, history itself<br />
begins with the establishment <strong>of</strong> cities. In that phase <strong>of</strong><br />
historical evolution, down to the beginning <strong>of</strong> the nineteenth<br />
century (i.e., less than 200 years ago)-cities<br />
were organizing factors effective in large bodies <strong>of</strong><br />
society, such as kingdoms <strong>and</strong> empires, although only<br />
small fractions <strong>of</strong> the combined society could be contained<br />
in the cities themselves.<br />
Humans have become increasingly conscious <strong>of</strong> their<br />
ability to induce change, <strong>and</strong> this self-knowledge has<br />
been applied more <strong>and</strong> more systematically. Therefore,<br />
human-induced changes, at first very slow, have had a<br />
way <strong>of</strong> accelerating. The historical phase <strong>of</strong> "cityorganized"<br />
civilization referred to above lasted some<br />
5,000 years. Currently, the world is in a new revolutionary<br />
phase <strong>of</strong> human settlement pattern which became<br />
conspicuous less than 200 years ago. This new<br />
revolution is associated with the modem revolutions<br />
<strong>of</strong> philosophy, science, technology <strong>and</strong> power-usingmachinery.<br />
The new material instruments available to humans<br />
facilitate the absorption by cities <strong>of</strong> substantial<br />
1<br />
proportions, even majorities, <strong>of</strong> the populations in many<br />
countries. The new technical means, <strong>and</strong> a further enhancement<br />
<strong>of</strong> organization, have also facilitated the sustenance<br />
<strong>of</strong> thous<strong>and</strong>s <strong>of</strong> millions <strong>of</strong> people in place <strong>of</strong><br />
the hundreds <strong>of</strong> millions populating the world up to<br />
200 years ago.<br />
But even within the past 200 years-<strong>and</strong> especially<br />
within the past few decades-a further mutation inthe<br />
conditions <strong>of</strong> human settlement has occurred, which<br />
makes it necessary to distinguish an "early modem"<br />
from a "recent modem" period. Modem technology has<br />
not been a one-time accomplishment; it is a developing<br />
system <strong>of</strong> ever-increasing powers. Along with these factors,<br />
there has also occurred an alteration in political<br />
concepts <strong>and</strong> established political facts. Roughly speaking,<br />
from around 1800 to around 1950, much <strong>of</strong> the<br />
world was subject to the rule or tutelage <strong>of</strong> privileged<br />
political powers, many but not all situated in Europe.<br />
The eXfloitative relationship that existed between regions<br />
0 greatly unequal economic <strong>and</strong> social development<br />
stimulated the rise <strong>of</strong> urban populations in some<br />
parts <strong>of</strong> the world <strong>and</strong> elsewhere kept it in narrower<br />
bounds. It also brought with it the seeds <strong>of</strong> explosive<br />
population growth. This quite new, or "late modern",<br />
phase also finds support in technological systems far<br />
more advanced than those which generally characterized<br />
the "early modem" period.<br />
A review <strong>of</strong> this history, <strong>and</strong> in particular <strong>of</strong> the most<br />
recent historical trends, must acknowledge that cities<br />
have changed simultaneously in their quantitative <strong>and</strong><br />
their qualitative aspects. The concept <strong>of</strong> "city" must be<br />
very broad to encompass the great variety <strong>of</strong> forms in<br />
which cities have appeared in history <strong>and</strong> currently appear.<br />
The current phase <strong>of</strong> urbanization, quite conceivably,<br />
may culminate in new settlement types which<br />
will have to be described as "post-urban".<br />
Numerous descriptive criteria can be used to set cities<br />
apart from settlements <strong>of</strong> the rural type. No catalogue<br />
<strong>of</strong> possible descriptions, however, will result in a unique<br />
definition <strong>of</strong> all cities, valid throughout time <strong>and</strong> space.<br />
Principal occupations, physical arrangements, social<br />
structures <strong>and</strong> other features <strong>of</strong> the population <strong>and</strong> its<br />
environment can vary widely between historical <strong>and</strong><br />
modem cities, as well as among cities in countries <strong>of</strong><br />
different levels <strong>and</strong> forms <strong>of</strong> economic <strong>and</strong> social development.<br />
In order to find a single feature that can identify<br />
all cities, it is necessary to rise to a higher level<br />
<strong>of</strong> abstraction. What really distinguishes any city from<br />
other inhabited places is the evidence <strong>of</strong> a population<br />
involved in a great variety <strong>of</strong> activities <strong>and</strong> functions.<br />
The functions can be <strong>of</strong> diverse orientation-social,<br />
cultural, industrial, commercial, religious, artistic, educational,<br />
military, political, or administrative--to mention<br />
several that occasionally become rather salient. Not<br />
all these functions need to be present in anyone city<br />
to make it a city. What does set cities apart is rather
spot, that amount depending in part upon the radius<br />
over which existing means <strong>of</strong> transport could be operated<br />
with efficiency. At times <strong>of</strong> political fragmentation, or<br />
when feudal lords laid their first claim on the yields<br />
<strong>of</strong> harvests-as in mediaeval Europe-fiscal <strong>and</strong> political<br />
obstacles limited the distance <strong>of</strong> shipments. Though the<br />
means <strong>of</strong> transport were not lacking, cities at such times<br />
remained <strong>of</strong> more limited scope. By contrast, Rome in<br />
ancient times had enjoyed uncontested access to all the<br />
shores <strong>of</strong> the Mediterranean Sea. Ancient Constantinople<br />
was situated at a point <strong>of</strong> convergence through which<br />
many long-distance transports by l<strong>and</strong> <strong>and</strong> by sea were<br />
bound to pass. In historical China, Egypt <strong>and</strong> Iraq, the<br />
combination <strong>of</strong> very intensive forms <strong>of</strong> agriculture with<br />
intricate networks <strong>of</strong> navigable canals also facilitated the<br />
massive provisioning <strong>of</strong> cities with vital needs <strong>and</strong> so<br />
permitted them to attain considerable size."<br />
One <strong>of</strong> the factors that give modern cities a different<br />
imprint, configuration <strong>and</strong> possible size than were known<br />
in history is the modern development <strong>of</strong> mechanized<br />
transport <strong>and</strong> means <strong>of</strong> instant long-distance communication.<br />
Transoceanic shipping in large bulk became<br />
increasingly possible in recent centuries; thus, for a time<br />
seaports flourished. Railways constructed in the nineteenth<br />
century renewed the prominence <strong>of</strong> those inl<strong>and</strong><br />
cities where the lines converged <strong>and</strong> <strong>of</strong> numerous points<br />
<strong>of</strong> trans-shipment where cargo was transferred from one<br />
transport vehicle to another. Among the eventual consequences<br />
were the numerous large <strong>and</strong> rapidly growing<br />
"industrial" cities <strong>of</strong> fairly recent history. But it is<br />
necessary to emphasize that changes did not end there,<br />
<strong>and</strong> further urban developments are now being witnessed<br />
which go far beyond the possibilities <strong>of</strong> the age <strong>of</strong> the<br />
railways. More recent transformations have resulted<br />
from the new means <strong>of</strong> transport by road <strong>and</strong> by air,<br />
which have intensified the direct influence <strong>of</strong> cities into<br />
extended zones within their immediate reach <strong>and</strong> have<br />
accelerated the contacts which can now be made among<br />
nearly all the major cities <strong>of</strong> the world. Co-ordinated<br />
action between points <strong>of</strong> departure <strong>and</strong> arrival <strong>of</strong> passengers<br />
<strong>and</strong> goods has been greatly facilitated by the<br />
telegraph <strong>and</strong> the telephone, adding to the efficiency <strong>and</strong><br />
capacity <strong>of</strong> voluminous transport. Perhaps a planetary<br />
system <strong>of</strong> closely interrelated cities will eventually<br />
emerge <strong>and</strong>, with time, imbue humanity with a new<br />
sense <strong>of</strong> unity <strong>and</strong> identity, assuming that administrative<br />
capabilities also become equal to the corresponding immense<br />
tasks."<br />
Although advances in transportation were a necessary<br />
condition for the organization <strong>of</strong> mankind into cities, the<br />
basic motivating force in recent urbanization is the advantages<br />
enjoyed by urban areas in the production <strong>and</strong><br />
exchange <strong>of</strong> most non-agricultural goods, combined with<br />
changes in economic structure that have emphasized the<br />
relative importance <strong>of</strong> those goods. The urban advantages,<br />
<strong>of</strong>ten described under the rubric <strong>of</strong> "economies<br />
<strong>of</strong> agglomeration", are dealt with in chapter IV. In<br />
addition to these natural advantages, urban areas <strong>of</strong>ten<br />
enjoy, as in the past, disproportionate political power<br />
5 Rhoads Murphy, Sho.nghai: Key to Modern China (Cambridge,<br />
Massachusetts, Harvard University Press, 1953).<br />
6 Doxiadis envisages the emergence <strong>of</strong> a world-wide urban<br />
system <strong>of</strong> immense complexity in a form describable as "ecumenopolis".<br />
Constantinos A. Doxiadis, Ekistics; An Introduction<br />
to the Science <strong>of</strong> Human Settlements (New York, Oxford University<br />
Press, 1968), pp. 215-220 <strong>and</strong> 376-380.<br />
3<br />
which acts to accelerate growth. For the individual, the<br />
urban advantages, whether earned or conferred, manifest<br />
themselves primarily in higher wages. Average urban<br />
incomes are higher than rural in virtually every country<br />
where the differences have been investigated.' The differences<br />
are the principal motive for migrating from<br />
rural to urban areas." In turn, the net migration from<br />
rural to urban areas is principally responsible for the<br />
growing fractions living in urban areas, as is demonstrated<br />
in chapter III. There is evidence that, for the<br />
most part, migrants' expectations <strong>of</strong> economic betterment<br />
are realized." Nevertheless, many Governments<br />
have expressed concern about the consequences <strong>of</strong> ruralurban<br />
migration for sending <strong>and</strong> receiving areas. Of the<br />
156 Governments responding in 1976 to a survey conducted<br />
by the United Nations, (75 per cent) expressed<br />
a preference either to decelerate (64 per cent) or reverse<br />
the direction <strong>of</strong> (11 per cent) their main internal migration<br />
patterns, principal among which are rural-urban<br />
flows." A number <strong>of</strong> Governments have enacted programmes<br />
with this intent."<br />
A. NEW FORMS OF URBAN ORGANIZATION<br />
Within many countries, urban developments attain an<br />
almost regional scale through a widening diffusion <strong>of</strong> the<br />
urban phenomenon in space. Again, new means <strong>of</strong> transport<br />
(some <strong>of</strong> them subterranean) <strong>and</strong> the almost ubiquitous<br />
telephone play a decisive role. At least in the<br />
technologically advanced countries, it is no longer necessary<br />
for all specialized urban functions to be carried out<br />
within closest proximity to one another nor for the persons<br />
engaged therein to reside at very shortdistances from<br />
their places <strong>of</strong> work. The consequence is an increased<br />
7 For an African summary, see Derek Byerlee, "<strong>Rural</strong>-urban<br />
migration in Africa: theory, policy, <strong>and</strong> research implications",<br />
International Migration ReVIew, vol. 8, No. 4 (Winter 1974)<br />
pp. 543-566. Other international data are cited in Koichi Mera,<br />
"On the urban agglomeration <strong>and</strong> economic efficiency", Economic<br />
<strong>Development</strong> <strong>and</strong> Cultural Change, vol. 21, No.2 (January<br />
1973, pp. 309-324. International survey data on income,<br />
many using a rural-urban distinction, may be found in Shail<br />
Jain, Size Distribution <strong>of</strong> Income: A Compilation <strong>of</strong> Data<br />
(World Bank, Washington, D.C., 1975).<br />
8 See reviews in J. Gaude, "Causes <strong>and</strong> repercussions <strong>of</strong> rural<br />
migration in developing countries: a critical analysis", World<br />
Employment Programme Working Paper WEP/IO-6/WPIO,<br />
Geneva, International Labour Office, October 1976; Lorene<br />
Y. L. Yap, "The attraction <strong>of</strong> cities", Journal <strong>of</strong> <strong>Development</strong><br />
Economics, vol. 4 (1977), pp. 239-264; Sally Findley, Planning<br />
for Internal Migration: A Review <strong>of</strong> Issues <strong>and</strong> Policies in<br />
Developing Countries (Washington, D.C., Bureau <strong>of</strong> the Census,<br />
1977).<br />
9 Oded Stark, "<strong>Rural</strong>-to-urban migration <strong>and</strong> some economic<br />
issues: a review utilizing findings <strong>of</strong> surveys <strong>and</strong> empirical<br />
studies covering the 1965-1975 period", World Employment<br />
Programme Working Paper WEPI2-211WP38, Geneva, International<br />
Labour Office, May 1976; S. Findley, op. cit. pp. 24-27.<br />
10 Government responses to the United Nations survey,<br />
"Third <strong>Population</strong> Inquiry Among Governments: <strong>Population</strong><br />
Policy in the Context <strong>of</strong> <strong>Development</strong> in 1976", reported in<br />
Concise Report on The World <strong>Population</strong> Situation in 1977:<br />
New Beginnings <strong>and</strong> Uncertain Ends (United Nations publication,<br />
Sales No. E.78.XIII.9), p. 93, table 32.<br />
11 Reviews <strong>of</strong> certain programmes may be found in Niles M.<br />
Hansen, ed., Public Policy <strong>and</strong> Regional Economic <strong>Development</strong>.<br />
The Experience <strong>of</strong> Nine Western Countries (Cambridge,<br />
Massachusetts, Ballinger. 1974); Brian J. L. Berry, The Human<br />
Consequences <strong>of</strong> <strong>Urban</strong>ization: Divergent Paths in the <strong>Urban</strong><br />
Experience <strong>of</strong> the Twentieth Century (London, Macmillan,<br />
1973); <strong>and</strong> Frederick C. Turner, "The rush to cities in Latin<br />
America: government policies have more effect than we recognize",<br />
Habitat, vol, 2, No. 1/2 (1977), pp. 189-203.
Because metropolitan areas consist <strong>of</strong> both urbanized<br />
<strong>and</strong> non-urbanized territory <strong>and</strong> other cities <strong>of</strong> varied<br />
size can be found outside the metropolitan areas, it is,<br />
perhaps, the proper time to substitute for the old "urban/<br />
rural" dichotomy a fourfold scheme distinguishing urbanized<br />
<strong>and</strong> rural territories both inside <strong>and</strong> outside<br />
metropolitan areas."<br />
B. BRIEF QUANTITATIVE REVIEW OF HISTORICAL<br />
GROWTH OF CITIES<br />
The most thorough research on the growth <strong>of</strong> cities<br />
by size. throughout historical time <strong>and</strong> for the entire<br />
world is probably that <strong>of</strong> Ch<strong>and</strong>ler <strong>and</strong> Fox. 18 From their<br />
work it is possible to tabulate rather comprehensively the<br />
historical record <strong>of</strong> city growth (see tables 1 <strong>and</strong> 2). This<br />
seemingly systematic presentation, however, should not<br />
lead to a mistaken view that the historical knowledge <strong>of</strong><br />
city populations can ever be so accurate. These writers, in<br />
fact, make it very clear that for the greatest part <strong>of</strong> historical<br />
time only circumstantial evidence can be found<br />
<strong>and</strong> that the individual estimates based thereon are to a<br />
large extent only assessments <strong>of</strong> plausible orders <strong>of</strong> magnitude.<br />
Their-estimates do not agree closely with those <strong>of</strong><br />
other informed analysts. Assuming that the estimates are<br />
not affected by any systematic bias, however, somewhat<br />
greater confidence can be placed in combined aggregates<br />
because <strong>of</strong> the presumable partial compensation <strong>of</strong> errors<br />
among individual figures.<br />
17 This tentative conclusion is arrived at in Demographic<br />
Yearbook, 1972 (United Nations publication, Sales No.<br />
E/F.73.xm.l), "Statistical definitions <strong>of</strong> urban population <strong>and</strong><br />
their uses in applied demography".<br />
18 Tertius Ch<strong>and</strong>ler <strong>and</strong> Gerald Fox, 3000 Years <strong>of</strong> <strong>Urban</strong><br />
<strong>Growth</strong> (New York <strong>and</strong> London, Academic Press, 1974).<br />
In their endeavour to make all estimates comparable,<br />
in time as well as internationally, Ch<strong>and</strong>ler <strong>and</strong> Fox had<br />
as their goal the estimation <strong>of</strong> the populations <strong>of</strong> agglomerations.<br />
In many instances, that effort implied the inclusion<br />
<strong>of</strong> the population <strong>of</strong> suburbs immediately adjacent<br />
to municipal administrative territory. In much <strong>of</strong> East<br />
Asia, on the other h<strong>and</strong>, municipal administration <strong>of</strong>ten<br />
extends far beyond the limits <strong>of</strong> the city itself <strong>and</strong> can<br />
therefore include a large rural population, a circumstance<br />
that has caused much exaggeration <strong>of</strong> city sizes in<br />
China <strong>and</strong> Japan; in these instances, the authors endeavoured<br />
to estimate city populations within narrower,<br />
or strictly "urban", limits.<br />
The earliest cities discovered by archaeologists existed<br />
in the area currently called Western South Asia, notably<br />
those in Mesopotamia for which historical records also<br />
could be found." Though numerous, the early Mesopotamian<br />
cities were at first quite small <strong>and</strong> remained<br />
small owing to rivalries among them which kept the<br />
territory politically fragmented. In Egypt, the rise <strong>of</strong> the<br />
earliest cities came somewhat later; but because <strong>of</strong> the<br />
political unity <strong>of</strong> Egypt, the national capital soon reached<br />
a larger size. It is estimated that the first city to surpass<br />
100,000 inhabitants was Thebes, in Egypt, <strong>and</strong> that the<br />
event may have occurred about 1360 B.C. 20 Some time<br />
19 The division <strong>of</strong> functions necessary to endow an inhabited<br />
locality with "urban" features presupposes some administrative<br />
capabilities which, in tum, depend upon written records or some<br />
equivalent. Hence, the earliest records found can be taken as<br />
a symptom that true cities had come into existence. This was<br />
the case first in Mesopotamia (i.e., Iraq) soon after 3500 B.C.<br />
<strong>Population</strong> sizes between 5,000 <strong>and</strong> 25,000 inhabitants have been<br />
suggested for these earliest cities. See G. Sjoberg, op, cit., pp.<br />
27-37.<br />
20 T. Ch<strong>and</strong>ler <strong>and</strong> G. Fox, op, cit.<br />
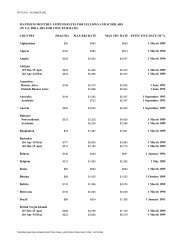
TABLE 1. NUMBER OFCITIES IN11IE WORLD ABOVE GIVEN SIZE LIMITS, 1360 B.C.-A.D. 1925<br />
Cities with population over:<br />
Largest city In<br />
Date 100000 200000 500000 1000000 2000000 5000000 world<br />
B.C.<br />
1360 ......... . I Thebes (Egypt)..<br />
650 .......... 3 Nineveh (lraq)b<br />
430 .......... 12 2 Babylon (Iraq)»<br />
200 .......... 14 4 Patna (India)d<br />
100 .......... 16 6 2 Rome (Italy)<br />
A.D.<br />
361 .......... 12 6 Constantinople-<br />
622 .......... 8 5 1 Constantinople-<br />
800 .......... 14 6 2 Changan (China)!<br />
1000 ........... 17 5 Cordoba (Spain)<br />
1200 .......... 24 5 Hangchow (China)<br />
1400 .......... 23 9 Nanking (China)<br />
1500 .......... 23 11 2 Peking (China)<br />
1600 .......... 37 15 3 Peking (China)<br />
1700 .......... 41 20 7 Istanbul (Turkey)<br />
1800 .......... 65 24 6 1 Peking (China)<br />
1850 .......... 110g 44 11 3 1 London (United Kingdom)<br />
1875 .......... 165g 73 17 6 2 London (United Kingdom)<br />
1900 .......... 301 148 43 16 4 1 London (United Kingdom)<br />
1925 .......... 450g 213 91 31 10 3 New York (United States <strong>of</strong> America)<br />
SoURCE: Tertius Ch<strong>and</strong>ler <strong>and</strong> Gerald Fox, 3000 Years <strong>of</strong> d Previously known as Pataliputra.<br />
<strong>Urban</strong> <strong>Growth</strong> (New York <strong>and</strong> London, Academic Press, 1974). e Currently known as Istanbul.<br />
a Near present Luxor. r Currently known as Sian.<br />
bNear present Mosul. g Partial extrapolation from data in source.<br />
• Near present Baghdad.<br />
5
SOURCE: Tertius Ch<strong>and</strong>ler <strong>and</strong> Gerald Fox, 3000 Years <strong>of</strong> <strong>Urban</strong> <strong>Growth</strong> (New York<br />
<strong>and</strong> London, Academic Press, 1974).<br />
a Asia other than China, Democratic People's Republic <strong>of</strong> Korea, Japan, Republic <strong>of</strong> Korea<br />
<strong>and</strong> Turkey.<br />
b China, Democratic People's Republic <strong>of</strong> Korea, Japan <strong>and</strong> Republic <strong>of</strong> Korea.<br />
c Including Turkey <strong>and</strong> Union <strong>of</strong> Soviet Socialist Republics.<br />
d Northern America <strong>and</strong> Latin America combined.<br />
thereafter, conquest <strong>and</strong> political consolidation caused<br />
Mesopotamian cities (Babylon, Nineveh) again to surpass<br />
those <strong>of</strong> Egypt. But the evidence on which population<br />
estimates can be based has remained so scanty that<br />
none <strong>of</strong> these developments can be traced with any<br />
accuracy.<br />
By the fifth century B.C., the geographical extent <strong>of</strong><br />
city civilization was already more.ample. Aside from<br />
Babylon, cities with over 100,000 inhabitants also existed<br />
in Persia, Greece, Egypt, India <strong>and</strong> China. The<br />
most notable urban developments then shifted from<br />
Babylon through Persia to India, <strong>and</strong> there is some likelihood<br />
that under the Empire <strong>of</strong> King Asoka (269-232<br />
B.C.) India had at least one city larger than any that had<br />
existed in the world before.<br />
About the tum <strong>of</strong> the Christian era, with the Roman<br />
Empire in the west <strong>and</strong> the Han Dynasty in China, resources<br />
could be organized on a scale that permitted the<br />
growth <strong>of</strong> even larger cities. By the year A.D. 100, Rome<br />
may have reached 650,000 inhabitants; <strong>and</strong> it is possible<br />
that Loyang, in China, was then <strong>of</strong> comparable size.<br />
But these empires again declined <strong>and</strong> in the ensuing<br />
disorganization city sizes were greatly reduced. It is to<br />
be noted, however, that the eastern Roman, or Byzantine,<br />
Empire persisted for many subsequent centuries,<br />
making Constantinople (currently Istanbul) the leading<br />
city <strong>of</strong> the world over a rather extensive time period. But<br />
it was not until after the tum <strong>of</strong> the second millennium<br />
that the numbers <strong>and</strong> sizes <strong>of</strong> cities in the world again<br />
approximated those <strong>of</strong> the classical empires which had<br />
existed almost a thous<strong>and</strong> years previously.<br />
Europe continued for a long time in a state <strong>of</strong> political<br />
fragmentation which gave only limited scope to the sus-<br />
6<br />
tenance or growth <strong>of</strong> cities. The dominant element in<br />
European society was the feudal aristocrats residing in<br />
castles outside the cities. Though numerous, the European<br />
cities remained quite small. Between A.D. 900 <strong>and</strong><br />
1500, the population <strong>of</strong> Rome probably never exceeded<br />
40,000; <strong>and</strong> 10 1377, it may have fallen as low as 17,000<br />
inhabitants. By contrast, in China, centralized administration<br />
became highly effective again under the Tang<br />
Dynasty (A.D. 618-907), <strong>and</strong> once more under the subsequent<br />
Sung Dynasty (A.D. 960-1279). The spread <strong>of</strong><br />
Islam over wide areas in Western South Asia <strong>and</strong> Northern<br />
Africa was also associated with, for the time, considerable<br />
urbanization. As suggested by Ch<strong>and</strong>ler <strong>and</strong><br />
Fox, the first city to surpass 1 million inhabitants was<br />
Changan (currently Sian) in China, before the year 763,<br />
when it was sacked; <strong>and</strong> the second city to reach such<br />
size temporarily was Baghdad, in the tenth century, again<br />
followed by a decline. Thereafter, no other city reached<br />
1 million in population until late in the eighteenth century<br />
when Peking grew so large <strong>and</strong> was shortly surpassed<br />
by London.<br />
Actually, for most <strong>of</strong> the time between the years 800<br />
<strong>and</strong> 1800, China remained almost unsurpassed in the<br />
number <strong>and</strong> sizes <strong>of</strong> its cities. Only some individual cities<br />
within the culture sphere <strong>of</strong> Islam temporarily surpassed<br />
the chief city <strong>of</strong> China, as was the case <strong>of</strong> Baghdad<br />
around A.D. 900, C6rdoba in Spain about 1000, Cairo<br />
about 1350; <strong>and</strong> either Delhi or Agra in India late in the<br />
seventeenth century under the rule <strong>of</strong> the Moguls. The<br />
career <strong>of</strong> Constantinople was somewhat varied. It remained<br />
among the world's largest cities up to 1200,<br />
though it had already declined by that time. By 1453,<br />
when the Turks conquered it, it had shrunk to 40,000 or
•<br />
the currently developed regions. These regions held some<br />
40 per cent <strong>of</strong> the world urban population in 1800, a<br />
percentage that rose to 71.2 in 1925.<br />
As is shown in chapter II, this percentage has receded<br />
substantially from the high-water mark reached in 1925.<br />
During the past several decades, the weight <strong>of</strong> the world<br />
urban <strong>and</strong> rural populations has shifted rapidly towards<br />
the less developed regions. It has been argued that these<br />
rapid changes reflect fundamental changes in the nature<br />
<strong>of</strong> urbanization <strong>and</strong> <strong>of</strong> urban <strong>and</strong> rural growth in developing<br />
countries. The present publication is focused on<br />
this most recent period. Its major purpose is to describe<br />
as accurately as possible the levels, trends <strong>and</strong> mechanisms<br />
<strong>of</strong> urban <strong>and</strong> rural growth since 1950, including<br />
growth differences among cities within the urban pool.<br />
It also attempts to interpret this record in light <strong>of</strong> broadly<br />
sketched demographic, economic <strong>and</strong> political features.<br />
. Chapter II provides new estimates <strong>of</strong> urban <strong>and</strong> rural<br />
growth since 1950, with projections to the year 2000.<br />
The revisions include the introduction <strong>of</strong> new data <strong>and</strong><br />
the adoption <strong>of</strong> a new projection methodology. Consideration<br />
is given to the pace <strong>of</strong> urbanization <strong>and</strong> to the<br />
relation between urban <strong>and</strong> industrial populations.<br />
Chapter III presents new estimates <strong>of</strong> the components<br />
<strong>of</strong> change in urban <strong>and</strong> rural populations for those countries<br />
which can supply an adequate basis for making<br />
such estimates. It also includes an analysis <strong>of</strong> factors<br />
quantitatively associated with rural-urban net migration<br />
rates in developing countries.<br />
8<br />
Chapter IV examines patterns <strong>of</strong> growth among more<br />
than 1,000 cities with over 100,000 population. Among<br />
the factors considered as influences on city growth are<br />
city size, national population growth, national economic<br />
growth <strong>and</strong> the political status <strong>of</strong> a city. The chapter also<br />
examines the size distribution <strong>of</strong> cities in major world<br />
regions.<br />
Chapters V <strong>and</strong> VI present the first large-scale consideration<br />
<strong>of</strong> the occupational structures <strong>of</strong> urban <strong>and</strong><br />
rural populations <strong>and</strong> how those structures change in the<br />
course <strong>of</strong> urbanization <strong>and</strong> development. It also attempts<br />
to identify <strong>and</strong> interpret regional differences in occupational<br />
structures. Chapter VI explicitly addresses the<br />
occupational roles <strong>of</strong> women in urban <strong>and</strong> rural populations.<br />
Chapter VII examines the family in urban <strong>and</strong> rural<br />
areas with a view towards identifying the differences in<br />
family form <strong>and</strong> structure that are associated with residence.<br />
Household size <strong>and</strong> complexity, <strong>and</strong> the distribution<br />
<strong>of</strong> marital statuses are among the features <strong>of</strong> family<br />
life considered. <strong>Rural</strong>/urban differences in the age <strong>and</strong><br />
sex composition <strong>of</strong> populations in major areas <strong>and</strong> regions<br />
are discussed in chapter VIII. Thus, the last four<br />
chapters serve to indicate some major social differences<br />
entailed by urban as opposed to rural residence. In so<br />
doing, they help to reaffirm the importance <strong>of</strong> the urban/<br />
rural distinction maintained in the rest <strong>of</strong> the report <strong>and</strong><br />
the value <strong>of</strong> demographic accounts that distinguish between<br />
the two sectors.<br />
A
Secretariat, the last-observed urban/rural growth difference<br />
was modified linearly during each five years <strong>of</strong> the<br />
projection period so that by the year 2000 the urban/<br />
rural growth difference for each country was 0.0275. 5<br />
For both theoretical <strong>and</strong> empirical reasons, it was considered<br />
desirable to modify the procedure for the present<br />
volume. As is demonstrated in chapter III, the overwhelmingly<br />
important source <strong>of</strong> difference betweenurban<br />
<strong>and</strong> rural growth rates is net rural-urban migration. As<br />
the urban proportion increases, it therefore becomes<br />
more <strong>and</strong> more difficult to maintain a particular urban/<br />
rural growth difference because the pool <strong>of</strong> potential<br />
migrants to urban areas declines as a fraction <strong>of</strong> the<br />
urban population, while the pool <strong>of</strong> potential migrants to<br />
rural areas increases as a fraction <strong>of</strong> the rural population.<br />
Therefore, it is reasonable to expect the urban/rural<br />
growth difference to decline as the urban proportion<br />
rises. An explicit model" has been developed which<br />
5 "Trends <strong>and</strong> prospects in urban <strong>and</strong> rural population,<br />
1950-2000, as assessed In 1973-1974"(ESA/PIWP.54).<br />
6 <strong>Urban</strong> <strong>and</strong> rural populations form a system <strong>of</strong> two sectors,<br />
each <strong>of</strong> which is subject to change in size as a result <strong>of</strong> 'natural<br />
increase, out-migration to the other sector <strong>and</strong> in-migration<br />
from the other sector. The natural way to represent such a<br />
system <strong>of</strong> growth <strong>and</strong> exchange is by differential equations.<br />
Given below is one set <strong>of</strong> differential equations based on fairly<br />
reasonable assumptions that yields a formula well-suited to the<br />
projection <strong>of</strong> urban proportions.<br />
Let U(t),R(t) =size <strong>of</strong> urban <strong>and</strong> rurual populations at time t.<br />
By definition, in a closed population the rate <strong>of</strong> change in absolute<br />
numbers for U(t) <strong>and</strong> R(t) must be:<br />
dU(t) - NIu(t) U(t) - OMu(t) U(t) + (1)<br />
dt - OMR(t) R(t)<br />
dR(t) - NIR(t) R(t) + OMu(t) U(t) <br />
dt - OMR(t) R(t)<br />
where NIu(t), NIR(t) = rates <strong>of</strong> natural increase in urban <strong>and</strong><br />
rural populations at time t;<br />
OMu(t), OMR(t)=gross rates <strong>of</strong> out-migration from urban<br />
<strong>and</strong> rural populations at time t.<br />
In order to use these identities to model or to predict changes<br />
in proportion urban, it is necessary to make assumptions about<br />
the functional forms <strong>of</strong> rates <strong>of</strong> natural increase <strong>and</strong> <strong>of</strong> outmigration.<br />
One should first assume that rates <strong>of</strong> natural increase<br />
in urban <strong>and</strong> rural areas are constant over time (but not necessarily<br />
equal) <strong>and</strong> that rates <strong>of</strong> out-migration are also constant:<br />
Nlc=K OMu=j<br />
NIR= I OMR=m<br />
In this case,<br />
dUet) = KU(t) _ jU(t) + mR(t)<br />
dt<br />
dR(t) = IR(t) + jU(t) - mR(t)<br />
dt<br />
The proportionate growth rates <strong>of</strong> urban <strong>and</strong> rural areas will<br />
then be:<br />
dUet) /U(t) - K _j+ BQ2<br />
dt - m U(t)<br />
dR(t) / R(t) _ I _ +. U(t)<br />
dt - m 1 R(t)<br />
<strong>and</strong> the urban/rural growth difference will be:<br />
R(t) U(t)<br />
URGD(t) = (K - j) - (1 - m) + m U(t) - j R(t) (2)<br />
This last expression shows that the urban/rural growth difference<br />
will decline as the ratio <strong>of</strong> urban-to-rural population increases.<br />
The only instance where such a decline would not occur<br />
is when there is no communication between the sectors, Le.,<br />
where rates <strong>of</strong> out-migration from both sectors (m <strong>and</strong> j) are<br />
zero. With constant rates <strong>of</strong> natural increase <strong>and</strong> <strong>of</strong> outmigration,<br />
the rural/urban growth rate difference must decline<br />
10<br />
demonstrates why such tendencies should be expected<br />
<strong>and</strong> furthermore shows that they would be expected<br />
even when migration between urban <strong>and</strong> rural areas follows<br />
a gravity model in which rates <strong>of</strong> migration to the<br />
other sector are a function <strong>of</strong> the relative size <strong>of</strong> the<br />
other sector.<br />
Empirically, it is not difficultto demonstrate that such<br />
tendencies have prevailed in the recent past. The urban/<br />
rural growth difference between the two most recent<br />
observations (typically, between the 1960 <strong>and</strong> 1970<br />
round <strong>of</strong> censuses) has been computed for the 110 countries<br />
with over 2 million in population. The mean urban/<br />
rural growth difference for populations that fall into a<br />
particular category <strong>of</strong> the initial urban proportion is<br />
as follows:<br />
Range <strong>of</strong><br />
InitIal urban<br />
proportion<br />
Number<br />
<strong>of</strong> countries<br />
Mean urban/rural<br />
growth difference<br />
between two most<br />
recent observations<br />
0-0.2499 49 0.03947<br />
0.2500-0.4999 34 0.03490<br />
0.5000-0.7499 16 0.02760<br />
0.7500-1.0000 11 0.01985<br />
It is clear that the urban/rural growth differences tend<br />
to decline as the initial urban proportion increases. The<br />
coefficient <strong>of</strong> correlation between the two variables for<br />
these 110 countries is -0.280. Hence, it was considered<br />
desirable to incorporate this relationship into the urban<br />
projections. This incorporation was accomplished by<br />
first regressing the urban/rural growth difference on the<br />
initial proportion urban for these 110 countries. The resulting<br />
equation is:<br />
URGDH = 0.044177 - 0.028274<br />
• initial proportion urban<br />
According to this equation, when a country is 10 per<br />
cent urban, the expected urban/rural growth difference<br />
is 0.04135; when it is 90 per cent urban, the expected<br />
urban/rural growth difference is only 0.01873. Few<br />
as the urban proportion rises. As shown in the text, such a tendency<br />
has in fact been observed cross-sectionally.<br />
The model just described can be made somewhat more realistic<br />
by introducing a gravity model <strong>of</strong> migration. Suppose, for<br />
example, that the probability <strong>of</strong> moving from one sector to the<br />
other is a linear function <strong>of</strong> the proportion <strong>of</strong> the total population<br />
that is located in that other sector:<br />
R(t)<br />
OM[lt) = j + q (R(t) + u(t)<br />
U(t)
countries have actually achieved these expected values,<br />
<strong>and</strong> it was considered desirable also to allow local conditions,<br />
as reflected in actual urban/rural growth differences,<br />
to be reflected in the projection period. These two<br />
considerations led to a procedure in which the most recently<br />
observed urban/rural growth difference for a<br />
country was allowed to approach the hypothetical values<br />
more <strong>and</strong> more closely during the projection period.' In<br />
particular, a set <strong>of</strong> linear weights were employed:<br />
Projection<br />
pertod<br />
Weight given to<br />
most recently observed<br />
urban/rural growth dlDerence<br />
URGD<br />
Weight given<br />
to URGD"<br />
1975·1980 0.8 0.2<br />
1980-1985 0.6 0.4<br />
1985-1990 0.4 0.6<br />
1990·1995 0.2 0.8<br />
1995-2000 0.0 1.0<br />
Thus, by the period 1995-2000, the urban/rural growth<br />
difference used in the projection was simply the URGDH<br />
computed from the regression equation just presented,<br />
7 These hypothetical values are recomputed for each fiveyear<br />
projection period based on the actual urban proportion<br />
that was projected for the beginning <strong>of</strong> that period.<br />
using as the "initial proportion urban" the actual value<br />
derived <strong>and</strong> presented for 1995.<br />
Because the data failed to reveal a tendency for negative<br />
urban/rural growth differences to emerge at high<br />
levels <strong>of</strong> the proportion urban, the procedure continues<br />
to imply that the urban proportion would eventually<br />
reach unity if projected far enough into the future. But<br />
the rate at which this limit is approached is much slower<br />
than under past procedures. On the other h<strong>and</strong>, for populations<br />
below 59 per cent urban, the speed <strong>of</strong> urbanization<br />
willbe somewhat greater than under past procedures.<br />
As a final step, both the estimated <strong>and</strong> the projected<br />
proportions urban are applied to United Nations estimates<br />
<strong>and</strong> projections <strong>of</strong> total national population for<br />
the years 1950, 1955 ... 2000. 8<br />
A. URBAN POPULATION<br />
The estimated <strong>and</strong> projected urban population for<br />
each country may be found in table 48 (see annex II).<br />
Table 4 given below presents the urban figures for the<br />
8 World <strong>Population</strong> Prospects as Assessed in 1973 (United<br />
Nations publication, Sales No. E.76.XIJI.4).<br />
TABLE 4. URBAN POPULATION, MAJOR AREAS AND REGIONS, 1950-2000<br />
(Thous<strong>and</strong>s)<br />
1950 1960 1970 1975 1980 1990 2000<br />
World total 724 147 1012084 I 354357 1 560860 1 806 809 2422293 3208028<br />
More developed<br />
regions .... " .... 448929 572 730 702876 767302 834401 969226 I 092470<br />
Less developed<br />
regions .......... 275218 439354 651481 793558 972 408 1453067 2 115558<br />
Africa ............ 31818 49506 80373 103032 132951 219202 345757<br />
Eastern Africa .... 3403 5821 10675 15109 21303 40345 70535<br />
Middle Africa .. " 3827 5751 10 176 13 437 17598 29130 45235<br />
Northern Africa .. 12698 19570 31344 39391 49557 76960 111 914<br />
Southern Africa .. 5338 7592 10650 12481 14959 21958 32560<br />
Western Africa ... 6552 10772 17528 22614 29534 50809 85513<br />
Latin America ...... 67511 106599 162355 198366 240592 343304 466234<br />
Caribbean ....... 5604 7731 11098 13 184 15653 21645 28760<br />
Middle America .. 14245 22744 36102 45123 56275 85804 124610<br />
Temperate South<br />
America ....... 16475 22419 28090 31060 34157 40292 45741<br />
Tropical South<br />
America ....... 31 187 53705 87065 108999 134507 195563 267 123<br />
Northern America ... 106019 133281 159493 170501 183281 212393 239199<br />
East Asia .......... 112812 194734 265 153 308943 359457 476462 622441<br />
China ........... 61393 121716 166710 195355 230652 320393 443213<br />
Japan ........... 41977 58712 74386 83424 91970 104668 114 128<br />
Other East Asia ... 9442 14306 24057 30164 36835 51401 65100<br />
South Asia ......... 104883 146902 217290 265568 329760 515685 790685<br />
Eastern South Asia 25694 38014 56640 69234 85863 134525 207672<br />
Middle South Asia 74096 99794 143 883 173993 214900 335677 517642<br />
Western South Asia 5093 9094 16767 22341 28997 45483 65371<br />
Europe ............ 222603 266032 318374 343504 369286 423291 476953<br />
Eastern Europe ... 36708 46323 54828 59785 65028 75405 85688<br />
Northern Europe .. 53866 58191 65273 68305 71276 76889 82119<br />
Southern Europe .. 53763 68433 88095 99134 111 141 137641 165002<br />
Western Europe ... 78266 93085 110178 116280 121841 133356 144144<br />
Oceania ........... 7736 10443 13 675 15630 17 829 22590 27145<br />
USSR ............. 70765 104587 137644 155316 173653 209366 239614<br />
11
world, its major geographical regions <strong>and</strong> its more <strong>and</strong><br />
less developed regions between 1950 <strong>and</strong> 2000. 9 The<br />
urban population <strong>of</strong> the world is estimated to have increased<br />
by 207 million in the short period between 1970<br />
<strong>and</strong> 1975, or at an annual rate <strong>of</strong> 41 million per annum.<br />
Of this growth, 31 per cent occurred in more developed<br />
regions <strong>and</strong> 69 per cent in less developed regions. The<br />
more rapid urban accretion in less developed regions had<br />
brought the urban populations <strong>of</strong> the two groups <strong>of</strong> countries<br />
into approximate parity by 1975, when 49.2 per<br />
cent <strong>of</strong> the world urban population lived in more developed<br />
regions. <strong>Urban</strong> growth between 1970 <strong>and</strong> 1975<br />
was distributed very widely among the less developed<br />
regions. Africa is estimated to have gained 23 million<br />
urbanites; Latin America, 36 million; East Asia (excluding<br />
Japan), 35 million; <strong>and</strong> South Asia, 48 million.<br />
By the year 2000, the majority-nearly two thirds<br />
(65.9 per centj-s-<strong>of</strong> the world urban population is projected<br />
to reside in the less developed regions. In fact, the<br />
projected gain <strong>of</strong> 1,320 million in the urban population<br />
in these areas between 1975 <strong>and</strong> 2000 is nearly double<br />
the total urban population <strong>of</strong> the more developed regions<br />
in 1975 (768 million). Although the urban population<br />
<strong>of</strong> the more developed regions is anticipated to grow by<br />
42 per cent in the last quarter <strong>of</strong> this century, the projected<br />
growth in Africa is 336 per cent; in Latin America,<br />
235 per cent; in East Asia (excluding Japan), 225<br />
per cent; <strong>and</strong> in South Asia, 298 per cent. In 1975,<br />
Europe still had a larger urban population, 344 million,<br />
than any other region in the world. But by the year 2000,<br />
its anticipated urban population <strong>of</strong> 477 million is expected<br />
to be far eclipsed by that <strong>of</strong> South Asia (791<br />
million) <strong>and</strong> East Asia (622 million), <strong>and</strong> to be virtually<br />
matched by that <strong>of</strong> Latin America (466 million). The<br />
urban population in Africa is expected to surpass that <strong>of</strong><br />
Northern America somewhere around 1990. It is clear<br />
that the less developed regions must prepare for an unprecedented<br />
magnitude <strong>of</strong> urban increment during this<br />
quarter <strong>of</strong> a century.<br />
Between 1950 <strong>and</strong> 2000, it is anticipated that the urban<br />
population <strong>of</strong> less developed regions will grow by a<br />
factor <strong>of</strong> 7.7: that is, 10.9 in Africa; 6.9 in Latin America;<br />
7.2 in East Asia (excluding Japan); <strong>and</strong> 7.5 in South<br />
Asia. In contrast, the urban population <strong>of</strong> the more<br />
developed regions is expected to grow by a factor <strong>of</strong> only<br />
2.4 during this period. The anticipated growth <strong>of</strong> 2,480<br />
million in the world urban population between 1950 <strong>and</strong><br />
9 For convenience, the largest regional groupings used below<br />
for dealing with trends are the categories <strong>of</strong> "less developed"<br />
<strong>and</strong> "more developed" as established by the <strong>Population</strong> Divlsion<br />
<strong>of</strong> the Department <strong>of</strong> International Economic <strong>and</strong> Social Affairs<br />
<strong>of</strong> the United Nations Secretariat, on the basis <strong>of</strong> demographic<br />
criteria. The former category includes all countries <strong>and</strong> other<br />
territories <strong>of</strong> Africa, Asia (excluding Japan), Latin America <strong>and</strong><br />
Oceania (excluding Australia <strong>and</strong> New Zeal<strong>and</strong>). The latter category<br />
includes all <strong>of</strong> Europe, the Union <strong>of</strong> Soviet Socialist Republics,<br />
Northern America <strong>and</strong> the countries just cited as being<br />
outside the "less developed" classification. Within these two<br />
broadest groupings, there are eight "major areas" subdivided<br />
into 24 geographical regions, which are used at numerous points<br />
in the text <strong>and</strong> tables.<br />
In Latin America, the countries <strong>of</strong> Temperate South America,<br />
which were formerly in the "more developed" category, are<br />
currently in the "less developed" category.<br />
In most chapters <strong>of</strong> this publication, data are based on the<br />
inclusion <strong>of</strong> Cyprus, Israel <strong>and</strong> Turkey in the region <strong>of</strong> Southern<br />
Europe because such classifications were used when those data<br />
were prepared; those countries are currently included in the<br />
region <strong>of</strong> Western South Asia.<br />
12<br />
2000 is expected to be distributed as follows: 74 per<br />
cent in less developed regions (13 in Africa, 16 in Latin<br />
America, 18 in East Asia (excluding Japan) <strong>and</strong> 28 in<br />
South Asia); <strong>and</strong> 26 per cent in more developed regions<br />
(10 in Europe, 7 in the USSR, 5 in North America, 3 in<br />
Japan <strong>and</strong> 1 in Oceania). Many features <strong>of</strong> urban life,<br />
such as housing construction <strong>and</strong> recruitment <strong>of</strong> public<br />
employees, are primarily functions <strong>of</strong> urban growth<br />
rather than <strong>of</strong> urban size. It is clear that the management<br />
<strong>of</strong> these functions in the last half <strong>of</strong> this century<br />
will be much more difficult for the developing regions<br />
than it will be-<strong>and</strong> probably has ever been-for the<br />
developed regions. The anticipated gain in the world<br />
urban population between 1975 <strong>and</strong> 2000 (1,650 million)<br />
is almost exactly double the estimated gain between<br />
1950 <strong>and</strong> 1975 (837 million).<br />
Table 5 presents the average annual growth rates (continuously<br />
compounded) <strong>of</strong> urban areas in major world<br />
regions. Although Latin America <strong>and</strong> East Asia appear<br />
to have experienced the most rapid urban growth in the<br />
1950s, they have been replaced since that time by Africa.<br />
In the period 1970-1975, urban areas in Africa are<br />
estimated to have grown at an annual rate <strong>of</strong> 4.97 per<br />
cent. Eastern, Western <strong>and</strong> Middle Africa each had<br />
annual urban growth exceeding 5.0 per cent during this<br />
period. Such rapid growth is facilitated by the fact that<br />
urban proportions in Africa have been quite small, so.<br />
that any particular absolute level <strong>of</strong> urban growth makes<br />
a large proportionate contribution to the urban population.<br />
According to the projections, the rate <strong>of</strong> urban<br />
growth in Africa should peak in the period <strong>of</strong> 1975<br />
1980 <strong>and</strong> then taper <strong>of</strong>f rather slowly, while maintaining<br />
its greater speed in relation to other major regions.<br />
South Asia also appears to be in the midst <strong>of</strong> a continuously<br />
rising urban growth rate, which is anticipated<br />
to continue through the decade <strong>of</strong> the 1980s <strong>and</strong> then to<br />
taper <strong>of</strong>f. <strong>Urban</strong> proportions in this area are also quite<br />
low <strong>and</strong> provide a basis for explosive urban growth.<br />
Latin America, East Asia, Europe, Oceania <strong>and</strong> the<br />
Soviet Union all appear to be experiencing continuous<br />
declines in the rate <strong>of</strong> urban growth, which are projected<br />
to continue for the rest <strong>of</strong> the century. These declines<br />
are attributable in part to a slackening pace <strong>of</strong> urbanization<br />
<strong>and</strong> in part to reduced rates <strong>of</strong> national population<br />
growth.<br />
From 1960 to the end <strong>of</strong> the century, urban growth<br />
rates for the world as a whole are expected to remain<br />
virtually level at a rate <strong>of</strong> 2.8-2.9 per cent. This constancy<br />
occurs despite continuous declines in the rates for<br />
the more developed regions, which contained over half<br />
<strong>of</strong> the world urban population in 1960. It is largely a<br />
product <strong>of</strong> a rapid shift <strong>of</strong> the world urban population<br />
towards less developed regions, where urban populations<br />
are growing more rapidly. This compositional shift<br />
towards rapidly growing areas is sufficient to <strong>of</strong>fset the<br />
declining urban growth in a major component area.<br />
The bulk <strong>of</strong> the difference in urban growth rates between<br />
the more developed <strong>and</strong> less developed regions is<br />
not attributable to differences in rates <strong>of</strong> urbanization<br />
(i.e., the growth rate <strong>of</strong> the urban proportion). Instead, it<br />
is attributable primarily to more rapid population growth<br />
rates in the less developed regions. One informative<br />
exercise that illustrates the importance <strong>of</strong> population<br />
growth for urban growth is simply to correlate the two<br />
growth rates across countries. For 108 <strong>of</strong> the 110 coun-
TABLE 5. AVERAGE ANNUAL GROWTH RATES OF URBAN AREAS IN MAJOR AREAS AND REGIONS,<br />
1950-2000<br />
(Percentage)<br />
1950-1960 1960-1970 1970-1975 1975-1980 1980-1990 1990-2000<br />
World total ........................ 3.35 2.91 2.84 2.93 2.93 2.81<br />
More developed regions .............. 2.44 2.05 1.75 1.68 LSO 1.20<br />
Less developed regions .............. 4.68 3.94 3.95 4.06 4.02 3.76<br />
Africa ............................• 4.42 4.85 4.97 5.10 5.00 4.56<br />
Eastern Africa .................... 5.37 6.06 6.95 6.87 6.39 5.59<br />
Middle Africa .................... 4.07 5.71 5.56 5.40 5.04 4.40<br />
Northern Africa ................... 4.33 4.71 4.57 4.59 4.40 3.74<br />
Southern Africa .................. 3.52 3.38 3.17 3.62 3.84 3.94<br />
Western Africa ................... 4.97 4.87 5.10 5.34 5.43 5.21<br />
Latin America ...................... 4.57 4.21 4.01 3.86 3.56 3.06<br />
Caribbean ....................... 3.22 3.62 3.44 3.43 3.24 2.84<br />
Middle America .................. 4.68 4.62 4.46 4.42 4.22 3.73<br />
Temperate South America .......... 3.08 2.26 2.01 1.90 1.65 1.27<br />
Tropical South America ............ 5.44 4.83 4.49 4.21 3.74 3.12<br />
Northern America .................. 2.29 1.80 1.33 1.45 1.47 1.19<br />
East Asia .......................... 5.46 3.09 3.06 3.03 2.82 .2.67<br />
China ........................... 6.84 3.15 3.17 3.32 3.29 3.25<br />
Japan ........................... 3.36 2.37 2.29 1.95 1.29 0.87<br />
Other East Asia ................... 4.16 5.20 4.52 4.00 3.33 2.36<br />
South Asia ......................... 3.37 3.91 4.01 4.33 4.47 4.27<br />
Eastern South Asia ................ 3.92 3.99 4.02 4.31 4.49 4.34<br />
Middle South Asia ................ 2.98 3.66 3.80 4.22 4.46 4.33<br />
Western South Asia ............... 5.80 6.12 5.74 5.22 4.50 3.63<br />
Europe ........................... . 1.78 1.80 LS2 1.45 1.36 1.19<br />
Eastern Europe ................... 2.33 1.69 1.73 1.68 1.48 1.28<br />
Northern Europe ................. 0.77 1.15 0.91 0.85 0.76 0.66<br />
Southern Europe .................. 2.41 2.53 2.36 2.29 2.14 1.81<br />
Western Europe .................. 1.73 1.69 1.08 0.93 0.90 0.78<br />
Oceania ........................... 3.00 2.70 2.67 2.63 2.37 1.84<br />
USSR ............................. 3.91 2.75 2.42 2.23 1.87 1.35<br />
tries with over 2 million population, the growth rate <strong>of</strong><br />
the urban <strong>and</strong> total populations between the two most<br />
recent censuses are correlated at 0.819. 10 In contrast,<br />
the correlations between urban growth rates <strong>and</strong> the<br />
initial proportion urban, the initial level <strong>of</strong> gross national<br />
product per capita, the growth rate <strong>of</strong> gross domestic<br />
product per capita <strong>and</strong> a set <strong>of</strong> regional indicators are all<br />
below 0.550 in absolute value. As a single perdictor <strong>of</strong><br />
urban growth in a country, the rate <strong>of</strong> population growth<br />
serves quite adequately.<br />
B. RURAL POPULATION<br />
The estimated <strong>and</strong> projected size <strong>of</strong> the world rural<br />
population is shown for major areas <strong>and</strong> regions in<br />
table 6 <strong>and</strong> for countries in table 49 (annex 10. The rural<br />
gain for the world as a whole between 1970 <strong>and</strong> 1975 is<br />
estimated to be 151 million, or 56 million less than the<br />
gain for urban areas. However, in the less developed<br />
regions, the rural gain <strong>of</strong> 165 million is actually 17 per<br />
cent higher than the urban gain for these same countries.<br />
·10 Two countries were omitted from the group <strong>of</strong> 110 because<br />
other types <strong>of</strong> data were not available for them which would<br />
permit the computation <strong>of</strong> equivalent correlation coefficients for<br />
other variables.<br />
13<br />
The rural gain for the world as a whole is diminished as<br />
a result <strong>of</strong> a slow rural decline in the more developed<br />
regions, estimated to amount to 14 million.<br />
The demographic present <strong>and</strong> future <strong>of</strong> rural populations<br />
lies preponderantly in the less developed regions.<br />
These areas contained 85 per cent the world rural population<br />
in 1975 <strong>and</strong> are projected to contain 90 per cent by<br />
the end <strong>of</strong> the century. Both East Asia (excluding Japan)<br />
<strong>and</strong> South Asia had larger rural populations in 1975 than<br />
did all the more developed regions combined. The projected<br />
increment in the rural population in South Asia<br />
alone between 1975 <strong>and</strong> 2000 exceeds the total 1975<br />
rural population <strong>of</strong> the more developed regions. The<br />
projected rural gains in the last quarter <strong>of</strong> the twentieth<br />
century are not nearly so evenly distributed among less<br />
developed regions as are the urban increments. South<br />
Asia is projected to gain 457 million rural residents;<br />
Africa, 170 million; East Asia (excluding Japan), 59<br />
million; <strong>and</strong> Latin America, only 28 million. In percentage<br />
terms, the rural population <strong>of</strong> South Asia is expected<br />
to grow by 49, Africa by 57, East Asia (excludingJapan)<br />
by 9 <strong>and</strong> Latin America by 22 per cent. Although these<br />
percentages are much lower than the percentage expansion<br />
<strong>of</strong> urban areas, it must be remembered that they<br />
are typically being applied to a much larger base. The
TABLE 8. PROPORTIONS OF POPULATION LMNG IN URBAN AREAS OF MAJOR AREAS AND REGIONS,<br />
1950-2000<br />
(Percentage)<br />
1950 1960 1970 1975 1980 1990 2000<br />
World total ................ 28.95 33.89 37.51 39.34 41.31 45.88 51.29<br />
More developed regions ...... 52.54 58.73 64.68 67.49 70.15 74.87 78.75<br />
Less developed regions ....... 16.71 21.85 25.82 28.03 30.53 36.46 43.46<br />
Africa ....................... 14.54 18.15 22.85 25.67 28.85 35.70 42.49<br />
Eastern Africa ............ 5.50 7.54 10.69 13.20 16.14 22.72 29.41<br />
Middle Africa ............ 14.57 18.10 25.16 29.66 34.37 43.65 51.56<br />
Northern Africa .......... 24.51 29.77 36.61 40.12 43.83 51.39 58.34<br />
Southern Africa .......... 37.27 41.70 43.76 44.81 46.49 51.43 57.90<br />
Western Africa ........... 10.15 13.48 17.27 19.58 22.29 28.65 35.92<br />
Latin America ............... 41.18 49.45 57.37 61.21 64.74 70.70 75.21<br />
Caribbean ....................... 0 33.51 38.22 45.08 48.62 52.15 58.74 64.62<br />
Middle America ..........<br />
Temperate South America ..<br />
39.75<br />
64.77<br />
46.71<br />
72.74<br />
53.88<br />
77.87<br />
57.37<br />
80.16<br />
60.75<br />
82.18<br />
66.95<br />
85.45<br />
72.17<br />
87.83<br />
Tropical South America .... 36.29 46.36 56.05 60.70 64.85 71.52 76.17<br />
Northern America .......... 63.84 67.09 70.45 71.99 73.66 77.20 80.76<br />
East Asia .................. 16.72 24.71 28.61 30.70 33.05 38.63 45.43<br />
China ................... 11.00 18.60 21.60 23.29 25.41 31.07 38.61<br />
Japan ................... 50.20 62.40 71.30 75.08 78.24 82.93 85.86<br />
Other East Asia .......... 28.61 36.31 47.46 53.43 . 58.85 67.51 73.03<br />
South Asia ................. 15.65 17.80 20.45 22.02 23.95 29.10 36.13<br />
Eastern South Asia ........ 14.83 17.52 20.02 21.38 23.15 28.10 35.10<br />
Middle South Asia ........ 15.59 17.19 19.40 20.77 22.53 27.48 34.48<br />
Western South Asia ....... 23.38 32.52 44.48 50.45 55.75 63.49 68.50<br />
Europe .................... 53.70 58.42 63.94 66.45 68.83 73.25 77.11<br />
Eastern Europe ........... 41.48 47.90 53.26 56.26 59.31 65.23 70.56<br />
Northern Europe ................ 74.32 76.73 81.28 83.32 85.12 87.95 89.92<br />
Southern Europe .......... 41.01 46.15 52.90 56.25 59.41 65.26 70.31<br />
Western Europe ................. 63.92 69.20 74.38 76.25 78.08 81.36 84.27<br />
Oceania ............................... 61.24 66.22 70.77 73.35 75.93 80.37 82.97<br />
USSR ..................... 39.30 48.80 56.70 60.90 64.77 71.28 76.06<br />
(in the. sense <strong>of</strong> urban/rural growth differences) much<br />
less rapidly than either the more developed or the less<br />
developed regions because differentials in demographic<br />
growth rates between the two groups giverapidly increasing<br />
weight to the less urbanized group. If the anticipated<br />
demographic growth actually materializes, however, this<br />
disparity will begin to disappear as the less developed<br />
regions come to constitute an ever-larger fraction <strong>of</strong><br />
both urban <strong>and</strong> rural populations.<br />
The ranking ordering <strong>of</strong> major areas by their urban<br />
proportions is not expected to change substantially during<br />
the rest <strong>of</strong> this century. In 1975, the least urban area<br />
was South Asia (22.0 per cent), followed by Africa<br />
(25.7), East Asia (30.7), the USSR (60.9), Latin America<br />
(61.2), Europe (66.4), Northern America (72.0) <strong>and</strong><br />
Oceania (73.4). Although the general ordering <strong>of</strong> major<br />
areas is expected to stay much the same for the rest <strong>of</strong><br />
the century, the range is expected to be reduced by 7<br />
percentage points as urban proportions grow more<br />
rapidly in developingthan in developed regions.<br />
Table 8 indicates that the urban percentage in less<br />
developed regions rose from 16.7 to 28.0 during the<br />
period 1950-1975. It is interesting to investigate whether<br />
the indicated pace <strong>of</strong> urbanization is faster or slower<br />
than that which characterized the currently developed<br />
16<br />
countries when they traversed the same range. According<br />
to estimates presented in table 3, regions that are<br />
currently more developed were 17.2 per cent urban in<br />
Figure I. Time path <strong>of</strong> percentage orban In the world, more<br />
developed regions <strong>and</strong> less developed regions, 1950·2000<br />
PeroInUgi urbln<br />
100<br />
90-<br />
90-<br />
••••••<br />
70 _ More developed regionI ••••••<br />
80- .<br />
150 i,!I ......-<br />
I<br />
I<br />
1180<br />
I<br />
I<br />
1870<br />
.......... .-.<br />
...- .<br />
I I<br />
1871 l_<br />
v-<br />
I<br />
I<br />
1890<br />
I<br />
-<br />
2000
TABLE 9. REGIONAL RELATIONSHIP BETWEEN URBANIZATION OF POPULATION AND<br />
INDUSTRIALIZATION OF THE LABOUR FORCE<br />
1950 1970<br />
Percentage Percentage Percentage Percentage Change,<br />
0/ labour 0/ population Ratio, 0/ labour 0/ population Ratio, 1950-1970<br />
force in living in (1)/(2) force In living In (4)/(5) (ratio,<br />
MaJor area Industry urban areas x 100 industry urban areas x 100 (6)/(3»<br />
<strong>and</strong> region (1) (2) (3) (4) (5) (6) (7)<br />
World a .............. 18.81 34.os 55.24 24.17 41.84 57.77 1.045<br />
Africa<br />
Eastern Africa ...... 3.66 5.50 66.54 6.32 10.69 59.12 0.888<br />
Middle Africa ...... 5.87 14.57 40.29 9.54 25.16 37.92 0.941<br />
Northern Africa ..... 10.44 24.51 42.59 15.75 36.61 43.02 1.010<br />
Southern Africa ..... 24.56 37.27 65.90 26.35 43.76 60.21 0.914<br />
Western Africa ...... 6.10 10.15 60.10 11.30 17.27 65.43 1.089<br />
Latin America<br />
Caribbean .......... 16.67 33.15 49.75 21.10 45.08 46.81 0.941<br />
Middle America ..... 16.04 39.75 40.35 21.36 53.88 39.64 0.982<br />
Temperate South<br />
America ......... 31.06 64.77 47.95 31.12 77.87 39.96 0.833<br />
Tropical South<br />
America ......... 16.22 36.29 44.70 19.59 56.05 34.95 0.782<br />
Northern America ..... 36.54 63.84 57.24 34.19 70.45 48.53 0.848<br />
East Asia»<br />
Japan .............. 23.62 50.20 47.05 34.48 71.30 48.36 1.028<br />
Other East Asia ..... 13.30 28.61 46.49 25.37 47.46 53.46 1.150<br />
South Asia<br />
Eastern South Asia .. 7.15 14.83 48.21 10.06 20.02 50.25 1.042<br />
Middle South Asia ... 8.15 15.59 52.28 13.04 19.40 67.21 1.286<br />
Western South Asia .. 13.40 23.38 57.32 18.40 44.48 41.37 0.722<br />
Europe<br />
Eastern Europe ..... 26.73 41.48 64.44 37.59 53.26 70.58 1.095<br />
Northern Europe .... 44.77 74.32 60.24 42.65 81.28 52.47 0.871<br />
Southern Europe .... 21.50 41.01 52.43 31.00 52.90 58.60 1.118<br />
Western Europe ..... 39.74 63.92 62.17 44.49 74.38 59.81 0.962<br />
Oceania .............. 31.17 61.24 50.90 30.38 70.77 42.93 0.843<br />
USSR ••••••••<br />
0°•••••• 21.62<br />
39.30 55.01 37.65 56.70 66.40 1.207<br />
SOURCES: For columns (1) <strong>and</strong> (4), International Labour Office, Labour Force Estimates<br />
<strong>and</strong> Projections: 1950-2000, vol. V., World Summary (Geneva, 1977). Figures for Western<br />
South Asia <strong>and</strong> Southern Europe have been adjusted to conform to the definition <strong>of</strong> those areas<br />
that includes Cyprus, Israel <strong>and</strong> Turkey in Southern Europe by use <strong>of</strong> vol. I, Asia. For columns<br />
(2) <strong>and</strong> (5), data taken from table 8 <strong>of</strong> the present report.<br />
a Excluding China.<br />
resources by reducing urban populations, with their high<br />
consumption requirements, in relation to the industrial<br />
labour force.> The results are consistent with this <strong>and</strong><br />
with other explanations. The fact that Southern Europe<br />
reveals the same tendency, but without consistent antiurban<br />
policies, suggests that other forces may be at<br />
work. All three regions were late-comers to industrialization<br />
<strong>and</strong> it may be the case that a certain acquired<br />
momentum for industrial expansion was reflected during<br />
this period. In any case, Eastern Europe <strong>and</strong> the USSR<br />
had higher industrial fractions than Northern America,<br />
Oceania, Japan or Temperate South America in 1970,<br />
despite urban percentages that were 15-20 points lower;<br />
(c) All four regions <strong>of</strong> Latin America had declines<br />
in the industryfurban ratio during the period, <strong>and</strong> all<br />
14 Gur Ofer, "Industrial structure, urbanization, <strong>and</strong> the<br />
growth strategy <strong>of</strong> socialist countries", Quarterly Journal <strong>of</strong><br />
Economics, vol. X, No.2 (May 1976), pp. 219-244.<br />
18<br />
four began the period with a ratio below the world<br />
average <strong>and</strong> in fact below one half. If over-urbanization<br />
is operationally defined in terms <strong>of</strong> "normal" urban<br />
industry ratios, then the process continues to characterize<br />
Latin America. As is shown in chapter V, what distinguishes<br />
Latin America is not so much an unusual<br />
occupational structure in cities as a deficiency <strong>of</strong> nonagricultural<br />
occupations in rural areas. Non-agricultural<br />
occupations are unusually highly urbanized in Latin<br />
America;<br />
(d) South Asia <strong>and</strong> East Asia generally experienced<br />
increases in the industryfurban ratio between 1950 <strong>and</strong><br />
1970. Thus, the over-urbanization process, first described<br />
with reference to countries in this region, seems<br />
not to have been exacerbated during those two decades.<br />
The fact that these regions are so populous basically<br />
accounts for the rise that occurred in the ratio for the<br />
world (excluding China) during the period.
Figure n. Relatiombip between percentage urban <strong>and</strong><br />
percentage <strong>of</strong> labour force In Industry. 1950 <strong>and</strong> 1970 a<br />
"'"*,.<strong>of</strong><br />
I..., fOf'Cl in indultry<br />
45<br />
40<br />
36<br />
30<br />
26<br />
20<br />
Regional key<br />
1. Eastern Africa 12. Other East Asia<br />
2. Middle Africa (excluding China)<br />
3. Northern Africa 13. Eastern South Asia<br />
4. Southern Africa 14. Middle South Asia<br />
5. Western Africa 15. Western South Asia<br />
6. Caribbean 16. Eastern Europe<br />
7. Middle America 17. Northern Europe<br />
8. Temperate South America 18. Southern Europe<br />
9. Tropical South America 19. Western Europe<br />
10. Northern America 20. Oceania<br />
11. Japan 21. USSR<br />
a Lines connect observations for 1950 <strong>and</strong> 1970 in a particular<br />
region.<br />
19<br />
Although the relationships between urban <strong>and</strong> industrial<br />
populations at the national level are doubtless more<br />
disparate than those described here. the regional results<br />
would appear to focus attention on Latin America as<br />
the main arena in which urban growth is outpacing industrial<br />
growth. This process is also occurring in some<br />
<strong>of</strong> the most developed regions, but there it would appear<br />
to be a normal part <strong>of</strong> the continuing transition to a<br />
post-industrial <strong>and</strong> service-dominated economy.<br />
The apparent absence <strong>of</strong> widespread disruption in<br />
urban/industry relations since 1950 is not evidence that<br />
contemporary relations are no different from those in<br />
currently developed countries at an earlier time. It is<br />
estimated that 21.6 per cent <strong>of</strong> the labourforce <strong>of</strong> the<br />
currently developed countries was engaged in industry<br />
in 1900, at a time when the urban percentage in the region<br />
is estimated at 27.3 (from table 3),15 Clearly, the<br />
typical 1:2 ratio did not prevail at that time. But neither<br />
does it prevail today in that region. It might be appropriate<br />
to view the early industrializing phase in currently<br />
developed countries as more anomalous than the experience<br />
in contemporary developing countries, particularly<br />
when descriptions <strong>of</strong> the pre-industrial city as a<br />
mainly administrative, political <strong>and</strong> service. centre<br />
are recalled."<br />
15 Paul Bairoch <strong>and</strong> J.-M. Limbor, "Changes in the industrial<br />
distribution <strong>of</strong> the world labour force, by region, 1880-1960",<br />
International Labour Review, vol. 98, No. 4 (October 1968),<br />
p.319.<br />
16 G. Sjoberg, op. cit., p. S.
use <strong>of</strong> the Hungarian <strong>Population</strong> Register.' The technique<br />
works quite well in this case, producing an error<br />
<strong>of</strong> only 4.8 per cent in total estimated intercensal migrants.<br />
The error if life-table, as opposed to intercensal,<br />
survival rates were used was 7.3 per cent, <strong>and</strong> other<br />
indirect techniques produced errors <strong>of</strong> 8.3 <strong>and</strong> 14.6 per<br />
cent. Thus, the intercensal survival approach compares<br />
favourably with other techniques.<br />
The results derived herein can also be compared with<br />
a completely independent set <strong>of</strong> data, registered birth<br />
<strong>and</strong> death rates classified by urban/rural residence. For<br />
nine countries where the technique has been applied,<br />
rates <strong>of</strong> rural <strong>and</strong> urban natural increase can be calculated<br />
around mid-period <strong>and</strong> compared with the rates<br />
<strong>of</strong> natural increase derived through the intercensal survival<br />
procedure. Results <strong>of</strong> this comparison are shown<br />
in table to.<br />
TABLE to. COMPARISON OF ESTIMATED RATES OF NATURAL IN<br />
CREASE IN URBAN AND RURAL AREAS DERIVED FROM INTERCENSAL<br />
SURVIVAL TECHNIQUE AND FROM VITAL REGISTRATION<br />
Rate <strong>of</strong> natural increase<br />
Country Period <strong>Urban</strong> <strong>Rural</strong><br />
Latin America<br />
Asia<br />
Mexico .•...... 1960-1970& 32.8 34.2<br />
1960-1970 b 34.1 33.9<br />
1965 0 35.8 36.0<br />
Panama ....... 1960-1970& 25.8 33.8<br />
1960-1970 b 27.5 32.5<br />
1965 0 28.8 32.8<br />
Ecuador ....... 1962-1974& 31.1 34.4<br />
1962-1974 b 32.2 33.8<br />
1968° 26.1 30.5<br />
India .......... 1961-1971& 20.1 22.5<br />
1961-1971 b 23.6 21.7<br />
1964-1965 o ,d 22.3 20.6<br />
Japan ......... 1965-1975& 14.6 8.8<br />
1970° 13.6 6.9<br />
Europe<br />
Finl<strong>and</strong> ........ 1960-1970& 4.6 2.5<br />
1966 0 10.3 5.1<br />
Hungary ....... 1963-1970& 1.6 4.8<br />
1967 0 3.8 4.7<br />
Norway ........ 1960-1970& 6.7 8.9<br />
1965° 7.0 9.2<br />
Pol<strong>and</strong> ........ 1960-1970& 8.8 12.2<br />
1965 0 8.0 11.9<br />
a Assuming that intercensa1 survival rates are the same for<br />
rural <strong>and</strong> urban residents.<br />
b Assuming that rural mortality exceeds urban mortality by<br />
50 per cent at each age.<br />
o Vital registration figures derived from United Nations,<br />
Demographic Yearbooks, primarily 1974 (table 24) <strong>and</strong> 1975<br />
(table 21).<br />
d Death rates are for 1971.<br />
• Kalman Tekse, ''The measurement <strong>of</strong> rural-urban migration",<br />
in Sidney Goldstein <strong>and</strong> David Sly, eds., The Measurement<br />
<strong>of</strong> <strong>Urban</strong>ization <strong>and</strong> Projection <strong>of</strong>' <strong>Urban</strong> <strong>Population</strong>, International<br />
Union for the Scientific Study <strong>of</strong> <strong>Population</strong> Committee<br />
on <strong>Urban</strong>ization <strong>and</strong> <strong>Population</strong>, Redistribution working paper<br />
No.2 (Dolhain, Belgium, Ordina Editions, 1975).<br />
22<br />
The strongest test occurs in the five more developed<br />
countries, where registration data are most reliable. In<br />
these countries, the table shows that both the level <strong>of</strong><br />
natural increase <strong>and</strong> the rural/urban differences in it are<br />
rather accurately' reflected in the intercensal survival<br />
results. Japan <strong>and</strong> Pol<strong>and</strong>, with pronounced (but opposite)<br />
urban/rural differences in natural increase <strong>and</strong> with<br />
little international migration, provide particularly strong<br />
validation <strong>of</strong> the procedure. In Finl<strong>and</strong>, derived rates <strong>of</strong><br />
natural increase are lower than registration figures, undoubtedly<br />
because <strong>of</strong> net international emigration. Such<br />
a disparity is not problematical; it simply reflects the<br />
fact that, even at the level <strong>of</strong> the national aggregate, rates<br />
<strong>of</strong> natural increase exceed rates <strong>of</strong> population growth<br />
because <strong>of</strong> emigration.<br />
In the four less developed countries, the technique<br />
provides good estimates <strong>of</strong> levels <strong>of</strong> natural increase<br />
(although net out-migration is suggested for Mexico<br />
<strong>and</strong> in-migration for Ecuador) <strong>and</strong> successfully predicts<br />
relatively little difference between rates in urban <strong>and</strong><br />
rural areas.<br />
The derived estimates <strong>of</strong> rural <strong>and</strong> urban natural increase<br />
might be compared to a naive model in which<br />
net movement between rural <strong>and</strong> urban areas is assumed<br />
to be equal to zero. In this case, the estimate <strong>of</strong> natural<br />
increase would simply be the urban <strong>and</strong> rural growth<br />
rates themselves. In most <strong>of</strong> the developing countries, the<br />
urban growth rate exceeds the rural by about 30-50 per<br />
1,000, obviously an extremely unrealistic difference for<br />
rates <strong>of</strong> natural increase between the two areas. The<br />
estimates <strong>of</strong> migration produced by the present procedure<br />
in all cases moves the rates <strong>of</strong> rural <strong>and</strong> urban<br />
natural increase to a much more plausible range. Since<br />
these rates are the last values to be estimated in a long<br />
series, their plausibility gives some assurance that preceding<br />
calculations are reasonably reliable.<br />
C. SOURCES OF URBAN GROWTH<br />
As documented in chapter II, rural <strong>and</strong> urban populations<br />
alike are growing throughout most <strong>of</strong> the world.<br />
Attention is now turned to those countries which can<br />
supply information on the sources <strong>of</strong> this growth. It<br />
should be stated that the populations included in this<br />
analysis were checked for intercensal comparability <strong>of</strong><br />
urban definitions, <strong>and</strong> only results for those which passed<br />
the test are presented here. Unfortunately, results for<br />
Costa Rica, Honduras, the Libyan Arab Jamahiriya,<br />
Namibia, Nicaragua (1963-1971) <strong>and</strong> the United Republic<br />
<strong>of</strong> Tanzania had to be discarded because <strong>of</strong> changing<br />
definitions. Also, in the case <strong>of</strong> Costa Rica, there was<br />
inconsistent application <strong>of</strong> the same definition. The estimates<br />
presented in this chapter will serve to update <strong>and</strong><br />
exp<strong>and</strong> previous estimates (ESA/P/WP.46) made by<br />
the United Nations Secretariat.<br />
In each country <strong>and</strong> period under review, the urban<br />
population is growing. The contribution <strong>of</strong> internal migration<br />
to that growth can be seen in columns 3 <strong>and</strong> 4<br />
<strong>of</strong> table II. This table relies upon the assumption that<br />
urban <strong>and</strong> rural age-specific survival rates are equal in<br />
developed countries. For developing countries, it uses<br />
the average <strong>of</strong> results produced by this assumption <strong>and</strong><br />
by the assumption that rural age-specific mortality exceeds<br />
urban by 50 per cent. The procedure thus amounts<br />
to assuming that rural age-specific mortality exceeds<br />
urban by 25 per cent or that life expectancy at birth is<br />
about five years greater in urban areas. Section G <strong>of</strong>
this chapter shows that the results for developing countries<br />
are not very sensitive to the assumption about<br />
mortality.<br />
European countries in particular, <strong>and</strong> the more developed<br />
countries in general, show the highest proportionate<br />
contribution <strong>of</strong> migration/reclassification to urban<br />
growth." An average <strong>of</strong> two thirds <strong>of</strong> recent urban<br />
growth in European countries has resulted from this<br />
source. The figure is similar for the USSR. Only in the<br />
countries <strong>of</strong> oversea western European settlement in<br />
Northern America <strong>and</strong> Oceania is the proportion lower,<br />
with the growth contribution <strong>of</strong> migration in Canada, the<br />
United States <strong>of</strong> America <strong>and</strong> Australia in the range <strong>of</strong><br />
20-35 per cent. The unusual position <strong>of</strong> these countries<br />
partially reflects their retention <strong>of</strong> relatively high rates<br />
<strong>of</strong> urban natural increase. It should be re-emphasized<br />
that, for many European countries in particular, natural<br />
increase as measured in table II contains a substantial<br />
amount <strong>of</strong> international migration. Natural increase is<br />
almost certainly inflated by international migration in<br />
France, Luxembourg, Sweden <strong>and</strong> Switzerl<strong>and</strong>, while it<br />
is deflated in Finl<strong>and</strong>, Greece, Irel<strong>and</strong> <strong>and</strong> Spain."<br />
In contrast, the bulk <strong>of</strong> urban growth in the less developed<br />
countries is attributable to the natural increase<br />
<strong>of</strong> urban populations. Considering only the most recent<br />
observation for a country, an average <strong>of</strong> 60.7 per cent<br />
<strong>of</strong> growth is attributable to this source, compared with<br />
only 39.3 per cent for migration. These figures are<br />
nearly reversed for the more developed countries (40.2<br />
<strong>and</strong> 59.8 per cent). Much <strong>of</strong> this disparity between the<br />
groups <strong>of</strong> countries is attributable to the much higher<br />
rates <strong>of</strong> urban natural increase in the less developed<br />
countries, particularly those in Latin America <strong>and</strong> in<br />
Western South Asia. From the foot <strong>of</strong> table 11, it can<br />
be seen that the average urban growth rate <strong>of</strong> the 29<br />
developing countries is 0.04324, which exceeds the average<br />
urban growth rate <strong>of</strong> the 20 developed countries by<br />
0.01851. Of this difference, 0.01558 (or 0.02533<br />
0.00975) is attributable to differences in average rates<br />
<strong>of</strong> natural increase. This represents 84.2 per cent <strong>of</strong> the<br />
difference in urban growth rates between the two groups<br />
f tri 0 I 158 (0.01792-0.01498).<br />
o coun nes. n y . per cent 0.01851 IS<br />
attributable to higher rates <strong>of</strong> urban in-migration in the<br />
developing countries.<br />
Thus, despite the much larger pool <strong>of</strong> potential ruralurban<br />
migrants in the less developed countries, their<br />
rate <strong>of</strong> urban in-migration scarcely differs from that <strong>of</strong><br />
the more developed countries. <strong>Urban</strong> growth is typically<br />
much faster, by 75 per cent on average (0.04324/<br />
0.02473), but the preponderance <strong>of</strong> the difference is<br />
caused by more rapid rates <strong>of</strong> urban natural increase in<br />
the less developed regions. It is fair to conclude that the<br />
causes <strong>of</strong> rapid urban growth in developing countries are<br />
inextricably interwoven with the causes <strong>of</strong> rapid natural<br />
increase.<br />
The estimated proportion <strong>of</strong> urban growth in developing<br />
countries attributable to net rural-urban migration<br />
5 Hereinafter, this source <strong>of</strong> growth is referred to simply as<br />
"migration".<br />
6 For an alternative treatment that places international migra- .<br />
tion in the migration component, see Economir; Survey <strong>of</strong><br />
Europe in 1977, part 11, Labour Supply <strong>and</strong> Migration in Europe:<br />
Demographic Dimensions 1950-1975 <strong>and</strong> Prospects (United<br />
Nations publication, Sales No. E.78.n.E.20).<br />
23<br />
represents a slight downward movement in relation to<br />
the estimates pertaining to 1960 that were presented in<br />
a previous working paper (ESA/P/WP.46). In table 3<br />
<strong>of</strong> that source, population transfers were estimated to<br />
have accounted for 49.1 per cent <strong>of</strong> urban growth in the<br />
less developed countries. Without China, however, the<br />
estimate was 42.2 per cent; <strong>and</strong> China does not appear<br />
among the countries listed in table 11. The question<br />
arises whether the slight downward revision is a reflection<br />
<strong>of</strong> real trends because most <strong>of</strong> the present data<br />
pertain to the period after 1960, or whether it reflects<br />
differences in methods <strong>of</strong> procedure or an unrepresentative<br />
sample <strong>of</strong> countries. There are some reasons to<br />
expect that the fraction <strong>of</strong> urban growth represented by<br />
net internal migration should decline somewhat as the<br />
urban proportion rises, as the number <strong>of</strong> potential inmigrants<br />
per urban dweller must decline in the process.<br />
One way <strong>of</strong> answering the question is to examine countries<br />
where the intercensal survival procedure could be<br />
applied twice, in order to see whether trends exist when<br />
comparable procedures are used. There are 11 less developed<br />
countries given in table 11 which can provide<br />
two temporally adjacent estimates. Of these, five show<br />
absolute changes in the percentage contribution <strong>of</strong> net<br />
migration to urban growth <strong>of</strong> less than 3 per cent in<br />
either direction: Chile; EI Salvador; India; Sri Lanka;<br />
<strong>and</strong> Turkey. Four show a decline greater than 3 per<br />
cent: Brazil (4.7); Ecuador (8.0); Venezuela (8.9);<br />
<strong>and</strong> South Africa (17.0). Two show a rise <strong>of</strong> 4 per cent<br />
or more: Panama (4.0); <strong>and</strong> Dominican Republic (4.7).<br />
There is no striking tendency for change in this group<br />
<strong>of</strong> countries, but the hint <strong>of</strong> a general downturn is maintained.<br />
It appears most judicious to conclude that the<br />
proportionate contribution <strong>of</strong> migration to urban growth<br />
in the less developed countries has been relatively stable<br />
but with a slight tendency, on average, for decline.<br />
Net rural-urban migration is estimated to account for<br />
more than half <strong>of</strong> urban growth during the most recent<br />
period in only five specimen less developed countries:<br />
Puerto Rico (64.2); Turkey (61.9); Republic <strong>of</strong> Korea<br />
(60.5); Bangladesh (55.4); <strong>and</strong> Argentina (1947-1960,<br />
50.8). This list is striking for the over-representation <strong>of</strong><br />
countries with unusually rapid economic growth.' Where<br />
economic growth is slower-that is, in the majority <strong>of</strong><br />
the less developed countries-it is suggested that the<br />
large majority <strong>of</strong> urban growth, perhaps some two thirds,<br />
is a result <strong>of</strong> the natural increase <strong>of</strong> urban populations<br />
themselves. It should, however, be stressed that Africa is<br />
poorly represented among the countries examined in<br />
this chapter. As the continent with the most rapid rate<br />
<strong>of</strong> urban growth, it can be expected that Africa has a<br />
larger than average fraction <strong>of</strong> that growth attributable<br />
to net migration. A review <strong>of</strong> the sparse evidence available<br />
on components <strong>of</strong> urban growth in Africa indicates<br />
that migration appears to account for only a small fraction<br />
<strong>of</strong> urban growth in Ghana, but suggests that it accounts<br />
for slightly more than half in Nigeria. 8<br />
7 The exception is Bangladesh, where international migration<br />
<strong>and</strong> population upheavals were considerable <strong>and</strong> where the very<br />
low initial urban proportion <strong>of</strong> 5.2 per cent gives a very unstable<br />
base.<br />
8 Ita I. Ekanem, "The dynamics <strong>of</strong> urban growth: a case<br />
study <strong>of</strong> medium-sized towns <strong>of</strong> Nigeria", contributed paper<br />
presented at the International Union for the Scientific Study <strong>of</strong><br />
<strong>Population</strong> Conference on Economic <strong>and</strong> Demographic Change:<br />
Issues for the 19808. Helsinki, Finl<strong>and</strong>, 28 August-l September<br />
1978.
TABLE 12. SOURCES OF INTERCENSAL GROWTH OF RURAL POPULATIONS<br />
Estimated <strong>Rural</strong><br />
annual rate out-migration<br />
Annual 01 rural <strong>and</strong> reclassitntercensal<br />
Estimated population ficatlon as a<br />
population annual loss Irom Internal percentage 01<br />
growth rate rural rate migration natural<br />
Major area 01 rural 01 natural <strong>and</strong> reclassl- Increase<br />
or region Intercensal areas Increase ficatton (3)<br />
<strong>and</strong> country period (I) (2) (3) (4) - (2) X 100<br />
Africa<br />
Ghana ............. 1960-1970 0.01631 0.02340 0.00710 30.3<br />
Morocco ........... 1960-1971 0.01603 0.02436 0.00832 34.2<br />
South Africa ........ 1951-1960 0.01664 0.02884 0.01221 42.3<br />
1960-1970 0.03027 0.03815 0.00787 20.6<br />
Northern America-<br />
Canada ............ 1951-1961 0.00287 0.02833 0.02546 89.9<br />
1961-1971 -0.00712 0.01791 0.02502 139.7<br />
Dominican Republic . 1950-1960 0.02667 0.03655 0.00988 27.0<br />
1960-1970 0.01350 0.02901 0.01552 53.5<br />
El Salvador ......... 1950-1961 0.02471 0.02928 0.00457 15.6<br />
1961-1971 0.03245 0.03765 0.00520 13.8<br />
Guatemala .......... 1964-1973 0.01853 0.02408 0.00555 23.0<br />
Mexico ............ 1960-1970 0.01543 0.03471 0.01928 55.5<br />
Nicaragua .......... 1950-1963 0.02155 0.02930 0.00775 26.5<br />
Panama ............ 1950-1960 0.03000 0.03908 0.00908 23.2<br />
1960-1970 0.01845 0.03245 0.01400 43.1<br />
Puerto Rico ........• 1960-1970 -0.01438 0.01423 0.02860 201.0<br />
United States <strong>of</strong><br />
America ......... 1950-1960 -0.00090 0.01823 0.01913 104.9<br />
1960-1970 -0.00028 0.01276 0.01304 102.2<br />
South America<br />
Argentina .......... 1947-1960 -0.00901 0.02353 0.03254 138.3<br />
Brazil ............. 1950-1960 0.01269 0.03211 0.01942 60.5<br />
1960-1970 0.00862 0.03131 0.02269 72.5<br />
Chile .............. 1952-1960 -0.00035 0.02655 0.02690 101.3<br />
1960-1970 -0.01157 0.01721 0.02878 167.2<br />
Colombia .......... 1951-1964 0.01609 0.03383 0.01773 52.4<br />
Ecuador ........... 1950-1962 0.01884 0.02765 0.00881 31.9<br />
1962-1974 0.02555 0.03410 0.00855 25.1<br />
Paraguay ........... 1962-1972 0.02348 0.02984 0.00636 21.3<br />
Peru ............... 1961-1972 0.00453 0.02896 0.02443 84.4<br />
Uruguay ............. 1963-1975 0.00313 0.00567 0.00254 44.8<br />
Venezuela .......... 1950-1961 0.00518 0.04190 0.03672 87.6<br />
1961-1971 0.00020 0.03452 0.03473 100.6<br />
Asia<br />
Bangladesh ......... 1961-1974 0.02310 0.02597 0.00288 11.1<br />
India .............. 1951-1961 0.01854 0.02047 0.00193 9.4<br />
1961-1971 0.01971 0.02215 0.00244 11.0<br />
Indonesia ........... 1961·1971 0.01786 0.02046 0.00260 12.7<br />
Iran ............... 1956-1966 0.01617 0.02819 0.01201 42.6<br />
Iraq ............... 1957-1965 -0.00101 0.02528 0.02629 104.0<br />
Japan .............. 1955-1965 -0.02178 0.00888 0.03066 345.3<br />
1965-1975 -0.01507 0.00943 0.02449 259.7<br />
Nepal .............. 1961-1971 0.02037 0.02085 0.00048 2.3<br />
Republic <strong>of</strong> Korea ... 1960-1970 0.00293 0.02357 0.02065 87.6<br />
Sri Lanka .......... 1953-1963 0.02097 0.02600 0.00503 19.3<br />
1963-1971 0.01758 0.02309 0.00551 23.9<br />
Syrian Arab Republic . 1960-1970 0.02130 0.03186 0.Q1055 33.1<br />
Turkey ............. 1955-1960 0.01845 0.03029 0.01184 39.1<br />
1960-1970 0.01142 0.02730 0.01589 58.2<br />
Europe<br />
Austria ............ 1961-1971 0.00144 0.01006 0.00862 85.7<br />
Bulgaria ............ 1956-1965 -0.01535 0.00789 0.02324 294.6<br />
Finl<strong>and</strong> ............ 1950-1960 0.00038 0.01102 0.01064 96.6<br />
1960-1970 -0.01858 0.00247 0.02105 852.2<br />
France ............. 1962-1968 -0.02296 0.00859 0.03155 367.3<br />
Greece ............. 1961-1971 -0.01489 0.00528 0.02017 382.0<br />
Hungary ........... 1960-1970 -0.00574 0.00466 0.01040 223.2<br />
Irel<strong>and</strong> ............ 1961-1971 -0.00655 0.00183 0.00838 457.9<br />
Luxembourg ...•.... 1960-1970 -0.01033 0.00642 0.01674 260.7<br />
28
On average, the countries <strong>of</strong> Latin America have had<br />
faster net movement out <strong>of</strong> rural areas than those <strong>of</strong><br />
Africa or Asia." The effects <strong>of</strong> this tendency on rural<br />
growth are partially <strong>of</strong>fset by the typically higher rates<br />
<strong>of</strong> rural natural increase in Latin American populations.<br />
However, there remains enormous intraregional disparity<br />
in rural out-migration rates. In Middle America, such<br />
countries as EI Salvador <strong>and</strong> Guatemala, have low rates,<br />
similar to those in Bangladesh, India <strong>and</strong> Sri Lanka;<br />
whereas Brazil, Chile <strong>and</strong> Colombia have rates many<br />
times higher, placing them in a group with Iraq <strong>and</strong><br />
Turkey. Obviously, there are factors at work to promote<br />
or inhibit migration which cut across regional boundaries.<br />
The following section attempts to indicate certain<br />
<strong>of</strong> these influences.<br />
E. FACTORS ASSOCIATED WITH NATIONAL RATES<br />
OF NET RURAL-URBAN MIGRATION<br />
The estimates presented in table 12, although undoubtedly<br />
subject to measurement error as described<br />
above, probably represent the most accurate internationally<br />
comparable set <strong>of</strong> rural-urban migration rates that<br />
has been assembled. Therefore, it is useful to examine<br />
the relationship between estimated levels <strong>of</strong> migration<br />
<strong>and</strong> other socio-economic variables in order to identify<br />
more clearly the contexts most conducive to rapid or slow<br />
rural-urban migration. For reasons described above, the<br />
examination is limited to the less developed countries,<br />
where the issues are most salient.<br />
Factors influencing the probabilities <strong>of</strong> a person's migration<br />
from a rural area to an urban area have been<br />
investigated in literally thous<strong>and</strong>s <strong>of</strong> studies, <strong>and</strong> many<br />
useful generalizations have emerged." Comparative<br />
studies <strong>of</strong> factors influencing the national volume <strong>of</strong><br />
rural-urban migration, on the other h<strong>and</strong>, are quite uncommon.<br />
Undoubtedly, the causes <strong>of</strong> migration to urban<br />
areas are manifold <strong>and</strong> vary in type <strong>and</strong> intensity from<br />
population to population. But it appears reasonable to<br />
propose that three basic conditions are implicated in the<br />
global process <strong>and</strong> account in the main for the movement<br />
that has occurred in the past century:<br />
(1) Rising levels <strong>of</strong> personal income;<br />
(2) Income-inelastic dem<strong>and</strong> for agricultural products:<br />
the tendency for increases in income to be<br />
disproportionately directed towards expenditure on<br />
non-agricultural products;<br />
(3) Greater efficiency <strong>of</strong> urban as opposed to rural<br />
configurations in production <strong>and</strong> consumption <strong>of</strong> nonagricultural<br />
products. Their efficiency depends in a complex<br />
way upon transportation technology, which must be<br />
good enough to allow exchange between urban <strong>and</strong> rural<br />
areas but not so good as to render location irrelevant to<br />
production <strong>and</strong> consumption.<br />
29 Although only three observations are available in Africa,<br />
they all fall within the 0.005-0.010 range which is cited as typical<br />
in African countries. Derek Byerlee <strong>and</strong> others, "<strong>Rural</strong> employment<br />
in Tropical Africa: summary <strong>of</strong> findings", African<br />
<strong>Rural</strong> Economy Working Paper, No. 20, East Lansing, Michigan,<br />
Michigan State University, Department <strong>of</strong> Agricultural Economics,<br />
February 1977,p. 114 (mimeographed).<br />
80 For recent reviews, see Lorene, Y. L. Yap, "The attraction<br />
<strong>of</strong> cities", Journal <strong>of</strong> <strong>Development</strong> Economics, vol. IV (1977),<br />
pp. 239-264; <strong>and</strong> M. P. Todaro: Internal Migration in Developing<br />
Countries (Geneva, International Labour Office, 1976),chap.<br />
S.<br />
30<br />
These three conditions are by themselves sufficient to<br />
account for increasing proportions living <strong>and</strong> working in<br />
dense, urban-type settlements, once a mechanism <strong>of</strong> factor<br />
mobility is introduced to allow workers <strong>and</strong> firms to<br />
locate in areas <strong>of</strong> higher productivity. There can be no<br />
doubt about the empirical validity <strong>of</strong> each <strong>of</strong> the three<br />
conditions. Incomes have risen in most areas <strong>of</strong> the<br />
world (<strong>and</strong> where they have not, or have risen very<br />
slowly, urbanization has also been very slow). Where<br />
it has been measured carefully, income elasticity <strong>of</strong> dem<strong>and</strong><br />
for food has commonly fallen well short <strong>of</strong> unity,<br />
although in very poor populations it can still be quite<br />
high." Economies <strong>of</strong> scale <strong>and</strong> <strong>of</strong> agglomeration are<br />
obvious in the production <strong>of</strong> virtually all goods <strong>and</strong> services;<br />
although there are disagreements about the point<br />
at which agglomerative diseconomies may set in, as reflected<br />
in chapter IV, there is little question that the<br />
point or points are well beyond the population size required<br />
for a locality to be classified as urban." Service<br />
aspects <strong>of</strong> these economies are <strong>of</strong>ten referred to as the<br />
"bright lights" syndrome <strong>and</strong> inappropriately assigned<br />
to non-economic, even irrational, factors.<br />
These economic transformations <strong>and</strong> relations can be<br />
viewed as the basic engine <strong>of</strong> urbanization. But a wide<br />
variety <strong>of</strong> additional factors will modify the rate at which<br />
this engine proceeds to its destination. Among the most<br />
important <strong>of</strong> these factors are the following:<br />
(a) Unbalanced technological change. Given a certain<br />
rate <strong>of</strong> technological <strong>and</strong> productivity growth in nonagricultural<br />
activities, the faster is productivity growth<br />
in agricultural activities the faster in general will be<br />
movement out <strong>of</strong> the agricultural sector;"<br />
(b) International economic relations. Concentration<br />
<strong>of</strong> exports in one sector <strong>and</strong> <strong>of</strong> imports in another can<br />
attenuate or promote the. internal structural transformations<br />
that typically produce urbanization. Irel<strong>and</strong> is<br />
sometimes cited as an example <strong>of</strong> slow urbanization attributable<br />
to concentration <strong>of</strong> production in agricultural<br />
exports;<br />
(c) <strong>Population</strong> growth rates. High rates <strong>of</strong> natural increase<br />
in rural <strong>and</strong> urban areas can change relationships<br />
among factors <strong>of</strong> production. It appears to be commonly<br />
assumed that diminishing returns to labour are more<br />
prominent in rural than in urban areas because <strong>of</strong> limited<br />
supplies <strong>of</strong> l<strong>and</strong>. In this case, more rapid rates <strong>of</strong> natural<br />
increase, even though equal in rural <strong>and</strong> urban areas,<br />
would depress rural incomes more than urban <strong>and</strong> lead<br />
to accelerated urbanization;<br />
31 For international documentation, see Food <strong>and</strong> Agriculture<br />
Organization <strong>of</strong> the United Nations, Income Elasticities <strong>of</strong> Dem<strong>and</strong><br />
for Agricultural Products (Rome, 1972), in particular, pp.<br />
98-109.<br />
82 Recent contributions to the literature on agglomerative<br />
economies are David Segal, "Are there returns to scale in city<br />
size?", Review <strong>of</strong> Economics <strong>and</strong> Statistics, vol. 58, No.3 (August<br />
1976), pp. 339-350; Leo Sveikauskas, "The productivity <strong>of</strong><br />
cities", Quarterly Journal <strong>of</strong> Economics, vol. 89, No.3 (August<br />
1975), pp. 393-413; Koichi Mera, "On the urban agglomeration<br />
<strong>and</strong> economic efficiency", Economic <strong>Development</strong> <strong>and</strong> Cultural<br />
Change, vol. 21, No.2 (January 1973),pp. 309-324.<br />
83 This issue is obviously quite complex, involving price as<br />
well as income elasticities. A recent review concludes that productivity<br />
gains in the production <strong>of</strong> food-stuffs will accelerate<br />
rural-urban migration. J. Gaude, "Causes <strong>and</strong> repercussions <strong>of</strong><br />
rural migration in developing countries: a critical analysis",<br />
World Employment Programme Research Working Paper,<br />
WEP/10-6/WP10, Geneva, International Labour Office, 1976.
(d) Institutional arrangements governing relations<br />
among factors <strong>of</strong> production. A l<strong>and</strong> tenure system that<br />
reduces the absorptive capacity <strong>of</strong> rural areas may accentuate<br />
the response to population growth cited above .<br />
in (c). So may financial systems that make capital formation<br />
easier in urban than in rural areas. The exclusionary<br />
l<strong>and</strong> tenure system in much <strong>of</strong> Latin America is <strong>of</strong>ten<br />
cited as an important factor in its rapid rural-urban migration.s-<br />
In a more general sense, price <strong>and</strong> tax distortions<br />
that discriminate against rural areas are<br />
pervasive <strong>and</strong> probably foster migration towards urban<br />
areas. A reverse situation is said to exist in Eastern<br />
Europe, where Governments are argued to have pursued<br />
an anti-urban policy in order to economize on resources<br />
available for investment;"<br />
(e) Biases in government services. It is clear that<br />
health <strong>and</strong> educational expenditures in the less developed<br />
countries are directed towards urban areas disproportionately<br />
to urban population size. 36 It is not always so<br />
clear that this pattern should be termed a bias, since it<br />
may reflect the greater cost-effectiveness <strong>of</strong> urban expenditures<br />
in these as well as in other services. That is,<br />
the tendency may reflect agglomerative economies. To<br />
the extent that true bias creeps in, however, urbanization<br />
is independently accelerated;<br />
(f) Inertia. Since physical movement is required, ruralurban<br />
migration will be more impeded the greater the<br />
attachments to place <strong>of</strong> birth or current residence. Such<br />
factors are said to have slowed rural-urban migration in<br />
India <strong>and</strong> elsewhere." These factors are no doubt powerful,<br />
although they may affect the nature <strong>of</strong> rural-urban<br />
migration (short-term, family in stages, high turnover)<br />
more than its long-term volume;<br />
(g) Government policies on migration. Governments<br />
in China, Indonesia, Paraguay, South Africa <strong>and</strong> elsewhere<br />
have actively attempted to reduce the volume <strong>of</strong><br />
net rural-urban migration. To the extent that these policies<br />
are successful in deflecting the course <strong>of</strong> events,<br />
rural-urban migration will be slowed.<br />
Many other factors also condition the flow <strong>of</strong> population<br />
from rural to urban areas. This section is not directed<br />
to identifying <strong>and</strong> interpreting the role <strong>of</strong> each <strong>of</strong><br />
these factors. Instead, the aim is more modest: to show<br />
that there are regularities <strong>and</strong> patterns in rates <strong>of</strong> ruralurban<br />
migration in the less developed countries; <strong>and</strong> in<br />
particular that the rate <strong>of</strong> migration is closely associated<br />
with readily measured economic indices.<br />
34 For some empirical evidence, see R. P. Shaw, "L<strong>and</strong> tenure<br />
<strong>and</strong> the rural exodus in Latin America", Economic <strong>Development</strong><br />
<strong>and</strong> Cultural Change, vol. 23, No.1 (October 1974), pp. 123-132.<br />
35 Gur Ofer, "Industrial structure, urbanization, <strong>and</strong> the<br />
growth strategy <strong>of</strong> Socialist countries", Quarterly Journal <strong>of</strong><br />
Economics, vol. X, No.2 (May 1976), pp. 219-244.<br />
36 Michael Lipton, Why Poor People Stay Poor: <strong>Urban</strong> Bias<br />
in World <strong>Development</strong> (Cambridge, Massachusetts, Harvard<br />
University Press, 1977).<br />
37 Donald J. Bogue <strong>and</strong> K. C. Zachariah, "<strong>Urban</strong>ization <strong>and</strong><br />
migration in India", in Roy Turner, ed./ Indids <strong>Urban</strong> Future<br />
(Berkeley, California, University <strong>of</strong> California Press, 1962), p.<br />
29. On the other h<strong>and</strong>, the existence <strong>of</strong> a "traditionally" nomadic<br />
class without permanent attachment to the soil may have facilitated<br />
migration towards urban areas in Brazil. Thomas Lynn<br />
Smith, Brazil: People <strong>and</strong> Institutions (Baton Rouge, Louisiana<br />
State University Press, 1946), p, 297.<br />
31<br />
Bearing in mind these considerations, one should expect<br />
migration rates to be higher where economic growth<br />
is more rapid. There are certainly instances at the country<br />
level which support such an expectation. In the Republic<br />
<strong>of</strong> Korea, three censuses <strong>of</strong> relatively high quality taken<br />
in the decade 1960-1970 showed that "rural-urban migration<br />
was greatly intensified during the 1966-1970<br />
period as the economy <strong>of</strong> Korea grew at an unprecedented<br />
rate".38 Because <strong>of</strong> the inertia factor <strong>and</strong><br />
imperfect information, it is unreasonable to expect instantaneous<br />
adjustment to economic growth <strong>and</strong> to<br />
accompanying changes in the structure <strong>of</strong> dem<strong>and</strong>.<br />
Therefore, one might also expect migration rates to be<br />
higher in countries at higher levels <strong>of</strong> economic performance,<br />
where the accumulated volume <strong>of</strong> unaccomplished<br />
but desirable movement is greater. Another<br />
reason for expecting a positive effect <strong>of</strong> income level on<br />
migration rates is that income elasticities <strong>of</strong> dem<strong>and</strong> for<br />
agricultural products typically decline with income level.<br />
First to be examined are the zero-order correlations<br />
between rural net out-migration rates <strong>and</strong> a variety <strong>of</strong><br />
indicators <strong>of</strong> factors that may be influencing them. 39<br />
Table 13 shows that initial income levels <strong>and</strong> income<br />
growth performance during the period <strong>of</strong> observation<br />
both have strong positive associations with the rate <strong>of</strong><br />
net rural-urban migration. Rather than belabouring these<br />
associations, attention is now turned to results <strong>of</strong> multiple<br />
regression analysis based on ordinary least-squares techniques.<br />
Regression results are shown in table 14. Because<br />
no one model specification is clearly superior to<br />
others, a wide variety <strong>of</strong> regressions forms were estimated,<br />
not alI <strong>of</strong> which are presented. Results are most<br />
efficiently summarized by discussing categories <strong>of</strong> variables.<br />
TABLE 13. COEFFICIENTS OF ZERO-ORDER CORRELATION BE<br />
TWEEN RURAL NET OUT-MIGRATION RATES AND VARIOUS<br />
INDICATORS<br />
Independent variable<br />
(N =29)<br />
Co"elatlon coefficient<br />
<strong>Growth</strong> rate, gross domestic product per capita 0.356<br />
Initial gross national product per capita . . . . . . . . . . . . . . 0.611<br />
Absolute growth in gross domestic product per capita . . 0.548<br />
Innial proportion urban 0.576<br />
<strong>Rural</strong> rate <strong>of</strong> natural increase . . . . . . . . . . . . . . . . . . . . . . 0.085<br />
<strong>Growth</strong> rate, total agricultural production -0.084<br />
<strong>Growth</strong> rate, agricultural production per rural resident. 0.466<br />
Asia categorical variable -0.283<br />
Africa categorical variable -0.204<br />
38 E.-Y. Yu, loco cit.<br />
39 Data on initial proportion urban <strong>and</strong> the rate <strong>of</strong> rural natural<br />
increase were produced in the course <strong>of</strong> the present study.<br />
Data on initial gross national product per capita were drawn<br />
from World Bank, World Table IV (Washington, D.C., January<br />
1971), expressed in terms <strong>of</strong> 1964 dollars <strong>and</strong> interpolated where<br />
necessary. Data on the growth rate <strong>of</strong> gross domestic product<br />
per capita <strong>and</strong> <strong>of</strong> agricultural production were taken from World<br />
Bank, World Tables 1976 (Baltimore, Maryl<strong>and</strong>, Johns Hopkins<br />
Press), "Comparative economic Data", table 1. Interpolation was<br />
again used where deemed essential. The growth rate <strong>of</strong> agricultural<br />
production per rural resident was derived by subtracting<br />
the rural population growth rate from the apicultural growth<br />
rate. All variables refer to the intercensal period or, where preceded<br />
by the word "initial", to the first year <strong>of</strong> that period.
tural productivity increases out-migration by about 2 per<br />
1,000. This result would appear to provide some support<br />
for Gaude's conclusion that agricultural productivity<br />
gain, the focus <strong>of</strong> many rural development programmes,<br />
will speed rural-urban migration. However, it should<br />
be mentioned that there is a possibly serious ratiocorrelation<br />
problem with the result. Out-migration rates,<br />
the dependent variable, also figure into the independent<br />
variable, as they are a component <strong>of</strong> rural population<br />
change. Errors in measuring rural growth will tend to<br />
produce a spurious positive correlation among the variables.<br />
It is useful to take note that zero-order correlations<br />
between out-migration <strong>and</strong> the agricultural productivity<br />
variable are not unusually large, suggesting that<br />
'such spuriousness is not an overpowering problem; the<br />
importance <strong>of</strong> the productivity variable emerges primarily<br />
in the regression analysis. The simple growth rate<br />
<strong>of</strong> agricultural production, a variable uncontaminated<br />
by the ratio-correlation problem, falls far short <strong>of</strong> achieving<br />
statistical or substantive significance.<br />
fVatural increase<br />
The gross association between rates <strong>of</strong> rural natural<br />
increase <strong>and</strong> rates <strong>of</strong> out-migration is very weak (table<br />
13). However, when income factors are controlled, natural<br />
increase emerges as a relatively consistent predictor<br />
<strong>of</strong> out-migration, with its coefficient typically falling just<br />
short <strong>of</strong> its st<strong>and</strong>ard error. The results suggest that perhaps<br />
a fifth <strong>of</strong> incremental rural natural increase is being<br />
"drained <strong>of</strong>f" to urban areas. Such a result should be<br />
carefully distinguished from the gross empirical comparison<br />
<strong>of</strong> rural rates <strong>of</strong> natural increase (averaging 26.7<br />
per 1,000 in the sample) <strong>and</strong> rates <strong>of</strong> net out-migration<br />
(averaging 13.7). Metaphorically speaking, half <strong>of</strong> natural<br />
increase is being "drained <strong>of</strong>f". But the more interesting<br />
question is how much additional migration a unit<br />
increment in natural increase would be expected to produce;<br />
the equations suggest, albeit in a very preliminary<br />
<strong>and</strong> tentative way, that the answer is on the order <strong>of</strong><br />
0.2 unit. Furthermore, it should be remembered that<br />
some <strong>of</strong> the measured influence <strong>of</strong> natural increase probably<br />
reflects .reclassification instead <strong>of</strong> actual movement.<br />
<strong>Rural</strong> places are more likely to be annexed by<br />
urban areas, or to pass an urban-defining boundary,<br />
when natural increase is high than when it is low."<br />
These results therefore appear to support the widespread<br />
supposition that high rates <strong>of</strong> natural increase in<br />
rural areas contribute to the flight to cities. At the same<br />
time, however, they indicate that demographic solutions<br />
to problems <strong>of</strong> rapid rural-urban migration are only<br />
partial. According to the equations, a massive reduction<br />
<strong>of</strong> rural natural increase from 30 to 20 per 1,000 would<br />
slow migration by only 2 per 1,000, or by some 15 per<br />
cent <strong>of</strong> its average value for the sample as a whole.<br />
Obviously, the effects could be larger where diminishing<br />
returns to rural labour are unusually strong or where<br />
institutional arrangements interfere with rural labour absorption.<br />
Furthermore, second-order effects operating<br />
through rural income <strong>and</strong> agricultural productivity are<br />
ignored in the calculation.<br />
41 On the other h<strong>and</strong>, errors in measuring net migration will<br />
bias downward the measured influence<strong>of</strong> natural increase, which<br />
is derived by subtracting net migration from rural growth.<br />
The fact that the association is positive is some indication that<br />
the migration measurement given here is reasonably reliable.<br />
A negative association would also be produced by the tendency<br />
for out-migration to hollow out the age structure in rural areas.<br />
33<br />
Initial proportion urban<br />
It is sometimes argued that urbanization is, in effect, a<br />
self-perpetuating social diffusion process where "messages'<br />
are transmitted from urban to rural residents <strong>and</strong><br />
where rural residents respond by adopting the innovation<br />
described, i.e., an urban residence. The prevalence<br />
<strong>of</strong> urban-rural links within families <strong>and</strong> neighbourhoods<br />
gives some plausibility to this argument. In support <strong>of</strong><br />
this argument, the simple correlation between the proportion<br />
urban <strong>and</strong> the rate <strong>of</strong> migration is strong <strong>and</strong><br />
positive. But the influence <strong>of</strong> the urban proportion largely<br />
disappears when the initial income level is controlled.<br />
The implication <strong>of</strong> the partial coefficients is that when<br />
the urban percentage increases by 10 :percentage points,<br />
the rate <strong>of</strong> net rural-urban migration increases by from<br />
0.7 to 1.7 per 1,000 rural residents. The results are thus<br />
not inconsistent with the notion that rural-urban migration<br />
is a cumulative <strong>and</strong> partially self-perpetuating<br />
process. The initial state <strong>of</strong> the system does appear to influence<br />
migration during a period apart from other events<br />
<strong>of</strong> that period. But they do suggest that the initial income<br />
level may be a better indicator <strong>of</strong> the state <strong>of</strong> the system<br />
<strong>and</strong> the content <strong>of</strong> urbanizing "messages" than is the<br />
initial proportion urban itself.<br />
. Major areas<br />
The following major areas are recognized in the<br />
analysis: Africa; East Asia; South Asia; <strong>and</strong> Latin<br />
America. So few countries <strong>of</strong> Africa are represented,<br />
however, that no generalizations about that major area<br />
should be drawn. The results suggest that countries <strong>of</strong><br />
Asia have a rural out-migration rate that is slightly<br />
higher, by 1-3 per 1,000, than the rate for countries <strong>of</strong><br />
Latin America, once other measured differences between<br />
the regions are accounted for. Regional differences,<br />
however, are far from having statistical significance.<br />
In Latin America, the countries have higher crude<br />
rates <strong>of</strong> out-migration than those in Asia. But the results<br />
suggest that these differences are wholly explicable in<br />
terms <strong>of</strong> other variables, particularly the higher average<br />
income levels, income growth rates <strong>and</strong> rates <strong>of</strong> rural<br />
natural increase in Latin America. The slightly higher<br />
out-migration rate in Asia that is implied once these<br />
differences are controlled may reflect the activity <strong>of</strong><br />
such important unmeasured variables as rural density.<br />
In conclusion, the net flow <strong>of</strong> migrants from rural<br />
areas in developing countries appears to be fairly closely<br />
related to the level <strong>and</strong> rate <strong>of</strong> economic development<br />
<strong>of</strong> a country, contrary to the chaotic <strong>and</strong> unstructured<br />
appearance that is sometimes suggested at a national<br />
level. Residential shifts thus appear to play a highly<br />
integrated role in the process <strong>of</strong> economic <strong>and</strong> social<br />
development. There are also suggestions that higher<br />
rates <strong>of</strong> rural natural increase <strong>and</strong> <strong>of</strong> agricultural productivity<br />
growth, <strong>and</strong> a higher initial urban proportion<br />
accelerate net migration from rural areas. Since urban<br />
natural increase has been identified as the principal<br />
source <strong>of</strong> urban growth, the suggested importance <strong>of</strong><br />
rural natural increase for migration towards urban areas<br />
re-emphasizes the importance <strong>of</strong> population growth as<br />
a factor in urban increase.<br />
F. COMPONENTS OF URBANIZATION<br />
<strong>Urban</strong>ization is conventionally defined as the process<br />
<strong>of</strong> growth in the urban proportion, rather than in the
urban population per se. Neglecting the role <strong>of</strong> international<br />
migration, the urban proportion can grow either<br />
through urban excess in rates <strong>of</strong> natural increase or as<br />
a result <strong>of</strong> positive net migration (<strong>and</strong> reclassification <strong>of</strong><br />
places) from ruralto urban areas. The urban population<br />
can be growing primarily from natural increase; but if<br />
the rate <strong>of</strong> natural increase is equally high in rural areas,<br />
urbanization would not occur unless population transfers<br />
were occurring.<br />
If urbanization is defined as the growth <strong>of</strong> the urban<br />
proportion, then the appropriate measure <strong>of</strong> the rate<br />
<strong>of</strong> urbanization is the difference between the growth<br />
rates <strong>of</strong> the urban population <strong>and</strong> <strong>of</strong> the national population.<br />
To demonstrate this result, define the urban<br />
proportion at time 1 as:<br />
_ U(/) U(t + n)<br />
UP(t) - P(/) <strong>and</strong> at 1 + n as P(I + n) .<br />
The growth rate <strong>of</strong> the urban proportion will be, by<br />
definition,<br />
I [UP(t+n)]<br />
n UP(t) _<br />
roe =<br />
n<br />
I [u(t+n). p(t+n)]<br />
n U(t) P(t)<br />
n<br />
= rc - re ,<br />
or the difference between urban <strong>and</strong> total population<br />
growth rates in the interval from 1 to 1 + n.<br />
Having defined the rate <strong>of</strong> urbanization, it is convenient<br />
to examine the role <strong>of</strong> net migration in the process<br />
<strong>of</strong> urbanization by computing the ratio <strong>of</strong> urban net<br />
migration to the rate <strong>of</strong> urbanization:<br />
NMI' NM u<br />
= -:-:-::-:---:-"""':":'-:-:----:ru-rp<br />
NM c' + (Nl» - rp)'<br />
where Nl« = urban rate <strong>of</strong> natural increase;<br />
NMu = urban rate <strong>of</strong> net migration.<br />
When this ratio is equal to unity, all <strong>of</strong> the growth in<br />
the urban proportion is attributable to net migration;<br />
urban natural increase equals the national population<br />
growth rate" <strong>and</strong> in the absence <strong>of</strong> migration the urban<br />
proportion would be constant. When it exceeds unity,<br />
urban natural increase falls short <strong>of</strong> the national population<br />
growth rate; <strong>and</strong>, in the absence <strong>of</strong> net migration<br />
to urban areas, the urban proportion would decline.<br />
Lastly, when this ratio falls short <strong>of</strong> unity, net migration<br />
is contributing only the indicated proportion <strong>of</strong> urbanization;<br />
the remainder is contributed by an excess <strong>of</strong><br />
urban natural increase over the national population<br />
growth rate.<br />
As shown in table 15, the proportion <strong>of</strong> urbanization<br />
that is attributable to net rural-urban migration is very<br />
close to unity in practically all populations where urbanization<br />
is rapid enough to form a stable basis for judgement.<br />
The mean <strong>of</strong> the ratio for developing countries<br />
is 1.028 <strong>and</strong> for developed it is 1.014. The fact that<br />
these averages slightly exceed unity implies that urban<br />
rates <strong>of</strong> natural increase typically fall slightly short <strong>of</strong><br />
the rate <strong>of</strong> national population growth. But the disparity<br />
is quite small <strong>and</strong> there are many instances where the<br />
urban rate <strong>of</strong> natural increase exceeds the national<br />
growth rate. In most cases, these differences reflect lower<br />
urban than rural mortality <strong>and</strong> urban age structures that<br />
34<br />
are more middle-heavy <strong>and</strong> hence conducive to population<br />
growth. The age distributional differences are in<br />
turn attributable primarily to a past history <strong>of</strong> ruralurban<br />
migration.<br />
The conclusion is quite obvious. In virtually all populations,<br />
urbanization occurs primarily because <strong>of</strong> net<br />
rural-urban migration. Without such migration, the<br />
urban proportion would typically be steady or show a<br />
slight tendency for slow decline. Although the major<br />
source <strong>of</strong> urban growth in most populations is natural<br />
increase, this factor typically plays an insignificant role<br />
in urbanization because it is counterbalanced by rural<br />
natural increase. The principal sources <strong>of</strong> urban growth<br />
<strong>and</strong> <strong>of</strong> urbanization are quite different; <strong>and</strong> for this<br />
reason alone, it is important to maintain a conceptual<br />
distinction between the two processes.<br />
G. SENSITIVITY OF RESULTS TO<br />
MORTALITY ASSUMPTIONS<br />
The main assumption underlying the calculations in<br />
this chapter concerns the degree to which intercensal<br />
survival rates for the total population are applicable to<br />
the urban population. In more developed countries, it is<br />
safe to assume that the two sets <strong>of</strong> rates will be very<br />
similar, because urban/rural mortality differences appear<br />
to be very minor <strong>and</strong> the bulk <strong>of</strong> the population is<br />
urban." In less developed countries, it appears that rural<br />
mortality typically exceeds urban by a fairly substantial<br />
amount, but it is not possible to identify a particular<br />
relationship that will be applicable in al1 situations."<br />
In such a case, the appropriate strategy is to make a<br />
particular assumption <strong>and</strong> demonstrate how sensitive the<br />
results are to that assumption.<br />
The procedure used here is to perform all calculations<br />
for the less developed countries twice, once assuming<br />
that urban <strong>and</strong> rural mortality rates by age are equal,<br />
<strong>and</strong> once assuming that rural rates exceed urban by<br />
50 per cent. These assumptions are believed to bound<br />
the true relationship in the large majority <strong>of</strong> countries.v<br />
The results presented in this chapter use the average<br />
<strong>of</strong> results <strong>of</strong> these two procedures. Thus, the two initial<br />
calculations will differ from the final estimate by the<br />
same absolute amount. Table 16 displays these differences<br />
for each country for both urban natural increase<br />
(or migration) <strong>and</strong> for rural. Since the urban growth rate<br />
is unaffected by the assumption, the changes produced<br />
in estimated natural increase will be equal (but opposite<br />
in sign) to those produced in estimated migration. The<br />
assumption that rural mortality exceeds urban produces<br />
in all cases reduced estimates <strong>of</strong> rural-urban migration,<br />
since more <strong>of</strong> the urban residents found at the second<br />
census are assumed to be survivors <strong>of</strong> those present at<br />
the first census. Reduced migration will in turn result<br />
in higher estimated urban natural increase <strong>and</strong> lower<br />
estimated rural natural increase.<br />
42 Evelyn Kitagawa <strong>and</strong> Philip Hauser, Differential Mortality<br />
in the United States (Cambridge, Massachusetts, Harvard University<br />
Press, 1973), chap. 7; Nathan Keyfitz <strong>and</strong> Wilhelm<br />
Flieger, <strong>Population</strong>: Facts <strong>and</strong> Methods oj Demography (San<br />
Francisco, W. H. Freeman <strong>and</strong> Co., 1971), chap. 17.<br />
43 Recent Levels <strong>and</strong> Trends in Mortality, forthcoming United<br />
Nations publication.<br />
44 For the range <strong>of</strong> mortality that characterizes most <strong>of</strong> the<br />
developing countries studied herein, a 50 per cent difference<br />
in age-specific mortality roughly corresponds to a difference<br />
<strong>of</strong> 10 years in life expectancy at birth.
Malor area<br />
or region<br />
<strong>and</strong> country<br />
TABLE 15. RATES OF URBANIZATION AND CONTRIBUTION OF NET RURAL-URBAN<br />
MIGRATION TO URBANIZATION<br />
Africa<br />
Ghana .<br />
Morocco .<br />
South Africa .<br />
Northern America><br />
Canada .<br />
Dominican Republic .<br />
EI Salvador .<br />
Guatemala .<br />
Mexico .<br />
Nicaragua .<br />
Panama ..<br />
Puerto Rico .<br />
United States <strong>of</strong> America .<br />
South America<br />
Argentina .<br />
Brazil , .<br />
Chile .<br />
Colombia .<br />
Ecuador .<br />
Paraguay .<br />
Peru .<br />
Uruguay .<br />
Venezuela .<br />
Asia<br />
Bangladesh .<br />
India .<br />
Indonesia .<br />
Iran .<br />
Iraq .<br />
Japan .<br />
Nepal .<br />
Republic <strong>of</strong> Korea .<br />
Sri Lanka ..<br />
Syrian Arab Republic .<br />
Turkey .<br />
Europe<br />
Austria " .<br />
Bulgaria .<br />
Finl<strong>and</strong> .<br />
France .<br />
Greece .<br />
Hungary .<br />
Irel<strong>and</strong> .<br />
Luxembourg .<br />
Norway .<br />
Intercensal<br />
period<br />
1960-1970<br />
1960-1971<br />
1951-1960<br />
1960-1970<br />
1951-1961<br />
1961-1971<br />
1950-1960<br />
1960-1970<br />
1950-1961<br />
1961-1971<br />
1964-1973<br />
1960-1970<br />
1950-1963<br />
1950-1960<br />
1960-1970<br />
1960-1970<br />
1950-1960<br />
1960-1970<br />
1947-1960<br />
1950-1960<br />
1960-1970<br />
1952-1960<br />
1960-1970<br />
1951-1964<br />
1950-1962<br />
1962-1974<br />
1962-1972<br />
1961-1972<br />
1963-1975<br />
1950-1961<br />
1961-1971<br />
1961-1974<br />
1951-1961<br />
1961-1971<br />
1961-1971<br />
1956-1966<br />
1957-1965<br />
1955-1965<br />
1965-1975<br />
1961-1971<br />
1960-1970<br />
1953-1963<br />
1963-1971<br />
1960-1970<br />
1955-1960<br />
1960-1970<br />
1961-1971<br />
1956-1965<br />
1950-1960<br />
1960-1970<br />
1962-1968<br />
1961-1971<br />
1960-1970<br />
1961-1971<br />
1960-1970<br />
1950-1960<br />
1960-1970<br />
35<br />
Annual rate <strong>of</strong><br />
urbanization<br />
(urban growth)<br />
rate minus<br />
national<br />
growth rate)<br />
0.02263<br />
0.01691<br />
0.01024<br />
0.00209<br />
0.01228<br />
0.00886<br />
0.02399<br />
0.02899<br />
0.00516<br />
0.00260<br />
0.00742<br />
0.01522<br />
0.01214<br />
0.00797<br />
0.01454<br />
0.02745<br />
0.00906<br />
0.00505<br />
0.01206<br />
0.02435<br />
0.01880<br />
0.01449<br />
0.Q1141<br />
0.02076<br />
0.01957<br />
0.01187<br />
0.00491<br />
0.02078<br />
0.00073<br />
0.02208<br />
0.01265<br />
0.04009<br />
0.01016<br />
0.01005<br />
0.01637<br />
0.02174<br />
0.03467<br />
0.01897<br />
0.Q1085<br />
0.01238<br />
0.03910<br />
0.02116<br />
0.02001<br />
0.01639<br />
0.03110<br />
0.03048<br />
0.00363<br />
0.03610<br />
0.01784<br />
0.02724<br />
0.01705<br />
0.02076<br />
0.01256<br />
0.01247<br />
0.00952<br />
0.00027<br />
0.02788<br />
Proportionate<br />
contribution 0/<br />
rural-urban net<br />
mlgral/on to<br />
urbanization<br />
(urban rate <strong>of</strong><br />
net in-migration<br />
<strong>and</strong> reclassification<br />
divided by rat'<br />
<strong>of</strong> urbanization<br />
0.875<br />
0.899<br />
1.462<br />
a<br />
1.062<br />
1.038<br />
1.081<br />
0.966<br />
1.470<br />
a<br />
1.652<br />
1.023<br />
1.022<br />
1.698<br />
1.237<br />
0.977<br />
1.035<br />
1.015<br />
1.224<br />
1.101<br />
1.124<br />
1.015<br />
0.963<br />
0.958<br />
0.918<br />
1.119<br />
a<br />
0.986<br />
a<br />
1.021<br />
1.006<br />
0.914<br />
0.914<br />
1.032<br />
0.816<br />
0.993<br />
0.851<br />
0.970<br />
0.867<br />
0.998<br />
0.967<br />
1.129<br />
1.042<br />
0.937<br />
1.169<br />
1.128<br />
a<br />
0.955<br />
1.082<br />
0.954<br />
0.923<br />
1.038<br />
1.122<br />
0.693<br />
0.930<br />
a<br />
1.043
Major area<br />
or region<br />
<strong>and</strong> country<br />
Pol<strong>and</strong> .<br />
Romania .<br />
Spain .<br />
Sweden .<br />
Switzerl<strong>and</strong> .<br />
Oceania<br />
Australia .<br />
New Zeal<strong>and</strong> .<br />
USSR<br />
Mean, last observation<br />
TABLE 15. (continued)<br />
Intercensal<br />
period<br />
1960-1970<br />
1956-1966<br />
1950-1960<br />
1960-1970<br />
1960·1970<br />
1961-1971<br />
1951-1961<br />
1959-1970<br />
Annual rate <strong>of</strong><br />
urbanization<br />
(urban growth)<br />
rate minus<br />
national<br />
growth rate)<br />
0.00787<br />
0.01991<br />
0.01536<br />
0.01123<br />
0.01165<br />
0.00432<br />
0.01420<br />
0.01468<br />
Proportionate<br />
contribution <strong>of</strong><br />
rural-urban net<br />
migration to<br />
urbanization<br />
(urban rate <strong>of</strong><br />
net In-migration<br />
<strong>and</strong> reclassification<br />
divided by rate<br />
<strong>of</strong> urbanization<br />
1.211<br />
1.114<br />
1.004<br />
0.824<br />
1.109<br />
a<br />
1.259<br />
1.161<br />
Developing countries (N = 25) 1.028<br />
Developed countries (N = 18) 1.014<br />
a Rate <strong>of</strong> urbanization less than 0.005, giving an unstable base for calculating proportion<br />
attributable to net migration.<br />
b Including the following countries <strong>of</strong> Latin America: Dominican Republic; EI Salvador;<br />
Guatemala; Mexico; Nicaragua; <strong>and</strong> Puerto Rico.<br />
TABLE 16. SENSITIVITY OF ESTIMATED RURAL-URBAN MIGRATION TO MORTALITY ASSUMPTIONS<br />
Country<br />
Africa<br />
Ghana .<br />
Morocco .<br />
South Africa .<br />
Latin America<br />
Argentina .<br />
Brazil .<br />
Chile .<br />
Colombia .<br />
Dominican Republic .<br />
Ecuador .<br />
EI Salvador .<br />
Guatemala ..<br />
Mexico ............•..•..<br />
Nicaragua .<br />
Panama .<br />
Paraguay .<br />
Peru .<br />
Puerto Rico .<br />
Uruguay .<br />
Venezuela .<br />
Asia<br />
Bangladesh .<br />
India .<br />
Indonesia .<br />
Iran ..<br />
Iraq .<br />
Nepal .<br />
Republic <strong>of</strong> Korea .<br />
Sri Lanka .<br />
Syrian Arab Republic .<br />
Turkey .<br />
Mean .<br />
Maximum error Maximum error<br />
from mortality from mortality<br />
assumption If assumption If<br />
rural age- rural agespecific<br />
specific<br />
mortality mortality<br />
Estimated urban exceeds urban Estimated rural exceeds urban<br />
In-migration rate by anywhere out-migration rate by anywhere<br />
(per 1 000 urban from 0 to 50 (per 1 000 rural from 0 to 50<br />
residents) per cent residents) per cent<br />
(1) (2) (3) (4)<br />
19.88 2.51 7.10 0.90<br />
15.19 1.91 8.32 0.93<br />
8.75 0.25 7.87 0.22<br />
14.75 0.40 32.54 0.88<br />
21.14 0.71 22.69 0.77<br />
10.99 0.92 17.21 2.41<br />
19.89 0.71 17.73 0.64<br />
28.00 1.53 15.52 0.85<br />
13.29 0.46 8.55 0.30<br />
8.10 0.65 5.20 0.42<br />
10.17 2.09 5.55 1.14<br />
15.55 0.66 19.28 0.82<br />
12.41 1.68 7.77 1.05<br />
17.97 0.83 14.00 0.68<br />
10.91 1.39 6.36 0.81<br />
20.48 0.91 24.43 1.09<br />
26.82 1.49 28.60 1.59<br />
0.54 0.51 2.54 2.44<br />
12.73 0.29 34.73 0.79<br />
36.65 2.24 2.88 0.18<br />
10.38 1.81 2.44 0.43<br />
13.34 2.43 2.60 0.47<br />
21.58 1.72 12.01 0.96<br />
29.49 1.45 25.28 1.25<br />
12.35 2.19 0.48 0.06<br />
37.82 1.01 20.65 0.55<br />
20.85 1.14 5.51 0.30<br />
15.36 1.34 10.55 0.92<br />
34.35 1.17 15.89 0.54<br />
1.25 0.84<br />
36
IV. PATTERNS OF GROWTH AMONG CITIES<br />
As agriculture declines as a fraction <strong>of</strong> national product<br />
or labour force, workers <strong>and</strong> industries become increasingly<br />
"footloose." Dependence <strong>of</strong> production upon<br />
proximity to natural resources is replaced by dependence<br />
upon a vast array <strong>of</strong> factors, such as physical <strong>and</strong> human<br />
capital, proximity to suppliers <strong>and</strong> consumers <strong>of</strong> products;<br />
availability <strong>of</strong> credit, transportation <strong>and</strong> insurance;<br />
<strong>and</strong> access to a stable <strong>and</strong> diversified labour supply. As<br />
the human <strong>and</strong> organizational factors <strong>of</strong> production become<br />
more important to the success <strong>of</strong> any enterprise,<br />
it is not surprising that economic activities become increasingly<br />
concentrated in areas where such factors are<br />
relatively abundant <strong>and</strong> diversified, i.e., in relatively<br />
dense agglomerations.<br />
Although it is not difficult to underst<strong>and</strong> why populations<br />
become more concentrated, there are no persuasive<br />
arguments to predict whether <strong>and</strong> when the process <strong>of</strong><br />
concentration should end. If the advantages <strong>of</strong> agglomeration<br />
were sufficiently strong, one would predict that<br />
virtually all <strong>of</strong> the population <strong>of</strong> a country would come<br />
together on a tiny fraction <strong>of</strong> its l<strong>and</strong> area. Such extreme<br />
concentrations are not observed except in unusual physical<br />
settings, but the large-scale release <strong>of</strong> labour from<br />
the l<strong>and</strong> is a recent enough event in human history that<br />
earlier dispersion patterns still influence observed<br />
distributions.<br />
The advantages <strong>and</strong> disadvantages <strong>of</strong> larger size undoubtedly<br />
vary from place to place. In one city, topography<br />
may prevent expansion or make it extremely<br />
costly; while in another, expansion may just make it<br />
economically feasible to form certain transportation<br />
linkages with other communities. A multiplicity <strong>of</strong> factors<br />
influence the desirability <strong>of</strong> added growth.' Nevertheless,<br />
there are probably some advantages <strong>and</strong> disadvantages<br />
<strong>of</strong> size that apply to many different places. These factors<br />
have been the subject <strong>of</strong> investigation from several<br />
points <strong>of</strong> view. Perhaps the most central concept in these<br />
analyses has been that <strong>of</strong> agglomerative economies:<br />
economies <strong>of</strong> operation that are external to a firm but<br />
result from the previous presence <strong>of</strong> other firms <strong>and</strong> <strong>of</strong><br />
social infrastructure.s Such economies need to be carefully<br />
distinguished from economies <strong>of</strong> scale in one firm's<br />
operation, where productive efficiency is seen as a function<br />
<strong>of</strong> the size <strong>of</strong> that firm's operation. In the case <strong>of</strong><br />
agglomerative economies, a firm's efficiency <strong>of</strong> operation<br />
is viewed as a function <strong>of</strong> the size <strong>and</strong> number <strong>of</strong> other<br />
firms in the immediate area. For example, a firm beginning<br />
operation in a large metropolis generally has access<br />
1 For a detailed evaluation <strong>of</strong> growth advantages <strong>and</strong> disadvantages<br />
in one city, see Richard A. Appelbaum <strong>and</strong> others,<br />
The Effects <strong>of</strong> <strong>Urban</strong> <strong>Growth</strong>: A <strong>Population</strong> Impact Analysis<br />
(New York, Praeger, 1976).<br />
2 Niles M. Hansen, "Systems approaches to human settlements",<br />
Research memor<strong>and</strong>um RM-76-7, Laxenburg, Austria,<br />
International Institute for Applied Systems Analysis, January<br />
1976.<br />
38<br />
to a skilled labour force, banking <strong>and</strong> credit facilities,<br />
transportation <strong>and</strong> storage facilities, networks <strong>of</strong> buyers<br />
<strong>and</strong> sellers <strong>of</strong> intermediate goods or raw materials <strong>and</strong><br />
a large local market <strong>of</strong> consumers. All <strong>of</strong> these advantages<br />
are external to the firm in the sense that they are<br />
not produced by expansion <strong>of</strong> the firm itself but by the<br />
expansion <strong>of</strong> the metropolis. In one source, "localization<br />
economies" which arise from intra-industry clustering<br />
(e.g., availability <strong>of</strong> a labour force skilled in the specialties<br />
required in one industry) are distinguished from<br />
"urbanization economies" which result from interindustry<br />
clustering." The author also describes consumer<br />
agglomerative economies, which add variety <strong>and</strong> reduce<br />
the cost <strong>of</strong> consumer goods; <strong>and</strong> social agglomerative<br />
economies, which reflect efficiencies in providing public<br />
services to a larger population. Naturally, diseconomies<br />
<strong>of</strong> agglomeration may also occur within each <strong>of</strong><br />
these types.<br />
Most <strong>of</strong> the empirical research that has investigated<br />
agglomerative economies has focused on those involving<br />
businesses in developed countries, particularly the<br />
United States <strong>of</strong> America. Three separate studies conclude<br />
that large cities in the United States have higher<br />
productivity in manufacturing industries. In an examination<br />
<strong>of</strong> cross-sectional data for 1967,4 the conclusion is<br />
reached that a doubling <strong>of</strong> city size is associated with a<br />
6 per cent increase in labour productivity: the partial<br />
effect <strong>of</strong> population size on productivity was positive in<br />
aU 14 industries <strong>and</strong> significant at the 95 per cent confidence<br />
level in 11 <strong>of</strong> the 14. It has been calculated that<br />
cities larger than 2 million had 8 per cent higher returns<br />
to capital <strong>and</strong> labour than smaller cities." Another report"<br />
distinguishes localization <strong>and</strong> urbanization economies<br />
<strong>and</strong> finds the former to be positive <strong>and</strong> significant in 5<br />
<strong>of</strong> 19 industries <strong>and</strong> the latter significant in 12 <strong>of</strong> 19.<br />
Several studies are also available for other developed<br />
countries. An examination <strong>of</strong> Swedish cross-sectional<br />
data for 1965, 1967 <strong>and</strong> 1968 7 also concludes that<br />
labour productivity is higher in metropolitan <strong>and</strong> denser<br />
regions. Although differences in capital/labour ratios<br />
are the principal explanation for interregional differences<br />
in labour productivity, population density, as<br />
measured by the number <strong>of</strong> inhabitants within a 30kilometre<br />
radius, also makes a significant contribution.<br />
3 Gerald A. Carlino, Economies <strong>of</strong> Scale in Manufacturing<br />
Location (Leiden, Martinus Niih<strong>of</strong>f, 1978), chap. 2.<br />
4 Leo Sveikauskas, "The productivity <strong>of</strong> cities", Quarterly<br />
Journal <strong>of</strong> Economics, vol. 89, No.3 (August 1975),pp. 393-413.<br />
5 David Segal, "Are there returns to scale in city size?", Review<br />
<strong>of</strong> Economies <strong>and</strong> Statistics, vol. 58, No.3 (August 1976),<br />
pp. 339-350.<br />
6 G. Carlino, op, cit.<br />
7 Yngve Aberg, "Regional productivity differences in Swedish<br />
manufacturing". Regional <strong>and</strong> <strong>Urban</strong> Economies, vol. ill, No.<br />
2 (1973), pp. 131-156.
TABLE 17. AVERAGE ANNUAL CITY GROWTH RATES BElWEEN THE lWO MOST RECENT CENSUSES AS<br />
AFUNCTION OF SIZE OFCITY AT FIRST CENSUS, MAJOR AREAS<br />
More Less<br />
Size class <strong>of</strong> city developed developed Latin Northern East South<br />
(thous<strong>and</strong>s) World regions regions Africa America America Asia Asia Europe Oceania USSR<br />
4 000 or more ........ 0.02724 0.01555 0.03893 0.02659 0.04552 0.01700 0.03580 0.02947 0.00970 0.00848<br />
Number <strong>of</strong> cities .... 20 10 10 1 4 3 5 2 4 1<br />
2000-3999 ........... 0.02355 0.01823 0.03196 0.01913 0.01731 0.04662 0.01745 0.02356 0.01005<br />
Number <strong>of</strong> cities .... 31 19 12 6 6 6 10 2 1<br />
1000-1999 ........... 0.02052 0.01178 0.03079 0.02609 0.03731 0.01529 0.02315 0.03550 0.00739 0.02138<br />
Number <strong>of</strong> cities .... 74 40 34 3 8 9 17 9 22 6<br />
500-999 .............. 0.02540 0.02127 0.03200 0.03422 0.04382 0.02702 0.02180 0.03798 0.01496 0.02473 0.02405<br />
Number <strong>of</strong> cities .... 143 88 55 6 12 24 23 15 37 3 23<br />
250-499 .............. 0.02706 0.01814 0.03806 0.04452 0.03902 0.02421 0.03668 0.03396 0.01091 0.03189 0.02394<br />
Number <strong>of</strong> cities .... 288 159 129 20 20 35 48 50 73 2 40<br />
100-249 .............. 0.02902 0.02229 0.03949 0.04701 0.03596 0.02024 0.03607 0.03698 0.01906 0.01415 0.02715<br />
Number <strong>of</strong> cities .... 782 476 306 53 66 96 102 134 203 7 121<br />
All cities ............. 0.02759 0.02063 0.03768 0.04448 0.03782 0.02163 0.03293 0.03649 0.01603 0.02029 0.02574<br />
Number <strong>of</strong> cities .... 1338 792 546 83 110 173 201 216 349 14 192<br />
reviewed, those in the range <strong>of</strong> 100,000-250,000 inhabitants.<br />
Although by no means universal among<br />
regions, this tendency is also observed in Africa, Europe<br />
<strong>and</strong> the USSR; <strong>and</strong>, with slight modification, in East<br />
Asia. To the extent that growth reflects the advantage <strong>of</strong><br />
cities, the growth tendencies can perhaps be viewed as<br />
supportive <strong>of</strong> the position that the marginal advantages<br />
<strong>of</strong> city growth are largest in the range <strong>of</strong> 100,000<br />
250,000. However, it is also possible that annexation <strong>of</strong><br />
territory tends to occur more frequently at this range<br />
<strong>of</strong> city sizes <strong>and</strong> that the fairly modest growth differences<br />
simplyreflect the differentialimpact <strong>of</strong> this factor.<br />
For the world, the more developed regions <strong>and</strong> the<br />
less developed regions, the slowest growing cities are<br />
those in the range <strong>of</strong> from 1 million to 2 million. This<br />
pattern also occurs within Africa, Northern America <strong>and</strong><br />
E\Jrope; <strong>and</strong>, in slightlymodified form, in Latin America.<br />
It is difficult to identify the factors that may be responsible<br />
for the slow-down that occurs in this range. It may<br />
be that urban growth is dominated by two sets <strong>of</strong> factors,<br />
one <strong>of</strong> which (e.g., agglomeration economies to firms or<br />
achievement <strong>of</strong> political influence) shows a continued<br />
positive relation to city size <strong>and</strong> the other <strong>of</strong> which (e.g.,<br />
social agglomerative economies in public services or<br />
annexation tendencies) is negatively related to size in<br />
the range considered. The previous review <strong>of</strong> studies on<br />
these factors is not inconsistent with such an interpretation.<br />
The net effect <strong>of</strong> these two forces could be to produce<br />
a minimum growth rate in the middle <strong>of</strong> the urban<br />
size distribution. Only 74 cities fell into this class <strong>and</strong><br />
over-interpretation <strong>of</strong> their growth rates should be<br />
avoided; nevertheless, the next two lowest average<br />
growth rates for the world <strong>and</strong> for the less developed<br />
regions occur in the adjacent size classes, giving some<br />
additional credibility to the designation <strong>of</strong> from 1 million<br />
to 2 million as a minimum.<br />
Interesting regional differences appear in table 17.<br />
Latin America, with an exception in the range between<br />
1 million <strong>and</strong> 2 million, has a steadily upward-sloping<br />
relationship between city size <strong>and</strong> city growth rates; on<br />
average, the larger the city the faster its growth. Africa<br />
<strong>and</strong> the USSR, on the other h<strong>and</strong>, show an inverse relationship<br />
between city size <strong>and</strong> city growth rates. It is thus<br />
41<br />
also reasonable to view the over-all distribution <strong>of</strong><br />
growth rates by size as reflecting the mixture <strong>of</strong> these<br />
two patterns, with relationships between size <strong>and</strong> growth<br />
in other regions being much less distinct <strong>and</strong> thus imparting<br />
less contour to the aggregated distribution. As is<br />
demonstrated below, the size distributions <strong>of</strong> cities between<br />
Latin America, on the one h<strong>and</strong>, <strong>and</strong> Africa <strong>and</strong><br />
the USSR, on the other, are also quite distinct from<br />
each other, with Latin America showing a distribution<br />
more heavily weighted towards large cities. Thus, the<br />
patterns depicted in table 17 appear to be part <strong>of</strong> a more<br />
permanent set <strong>of</strong> differences in the climate for city<br />
growth between the regions.<br />
The largest divergence between city growth rates in<br />
more developed <strong>and</strong> less developed regions occurs<br />
among the "giant" cities, those over 4 million in size.<br />
The 10 "giants" in the more developed regions are<br />
growing more slowly than the average city in that region;<br />
in the less developed regions, the 10 "giants" exceed the<br />
average growth rate <strong>and</strong>, in fact, rank second in terms <strong>of</strong><br />
average growth. This divergence undoubtedly reflects a<br />
different role for primate cities in the two groups <strong>of</strong> regions<br />
<strong>and</strong> the unique historical influences on the very<br />
large cities in developing countries, including a history<br />
<strong>of</strong> colonial penetration <strong>and</strong> '. distortions in patterns <strong>of</strong><br />
government expenditure." M may also reflect quite<br />
different intensities <strong>of</strong> the economies <strong>of</strong> agglomeration<br />
that are operating in the two regions. The principal gains<br />
from agglomeration, <strong>of</strong> course, result from increased<br />
proximity to people <strong>and</strong> resources required in production;<br />
physical proximity is less important where good<br />
transportation systems facilitate contact." Thus, the<br />
gains from agglomerating may be substantially less in<br />
the more developed regions which have, in general, developed<br />
superior transportation systems.<br />
The relatively slow recent growth <strong>of</strong> very large cities<br />
in more developed countries has been noted in Japan,<br />
Italy, Norway, Sweden, the United States <strong>and</strong> else-<br />
30 World Bank, <strong>Urban</strong>ization: Janet Abu-Lughod <strong>and</strong> Richard<br />
Hay, Jr., eds., Third World <strong>Urban</strong>ization, (Chicago, Maaroufa<br />
Press, 1977); <strong>and</strong> Joseph Gugler <strong>and</strong> William G.· Flanagan,<br />
<strong>Urban</strong>ization <strong>and</strong> Social Change in West Africa (Cambridge,<br />
Cambridge University Press, 1978).<br />
81 N. M. Hansen, op. cit.
where." Many factors have been invoked to account for<br />
this "turn-round". In addition to continued improvements<br />
in transportation <strong>and</strong> communication that may<br />
have reduced the economies <strong>of</strong> agglomerating into very<br />
dense aggregates, other factors that have been suggested<br />
are increases in government transfer payments as a fraction<br />
<strong>of</strong> national product that may have allowed larger<br />
fractions <strong>of</strong> the population to locate in smaller areas<br />
without economic sacrifice; economic recession, which<br />
may have inhibited the formation <strong>of</strong> new firms that tend<br />
to locate disproportionately in large cities; high income<br />
elasticities <strong>of</strong> dem<strong>and</strong> for out-door recreational opportunities<br />
that may have led increasing factions to locate<br />
outside a metropolis; <strong>and</strong> governmental deconcentration<br />
policies." Separating out these <strong>and</strong> other influences will<br />
prove very difficult <strong>and</strong> can scarcely begin until the 1980<br />
round <strong>of</strong> censuses provides more data on the types <strong>of</strong><br />
cities involved in the tum-round <strong>and</strong> on its breadth<br />
<strong>and</strong> continuity.<br />
In addition to the average growth rates in a class <strong>of</strong><br />
cities, some interest is attached to the variance in growth<br />
rates. High variance implies unpredictability, which entails<br />
uncertainty <strong>and</strong> difficulty in urban planning. It has<br />
been suggested that large size imparts a form <strong>of</strong> inertia<br />
to city growth rates." Large cities are typically more<br />
diversified industrially, <strong>and</strong> particularly so with respect<br />
to the export industries that transmit impulses <strong>of</strong> change<br />
to the local economy. This diversification should serve<br />
to cushion large cities against sudden growth or decline<br />
associated with the fortunes <strong>of</strong> a particular industry.<br />
The recent growth patterns <strong>of</strong> the 1,338 cities with over<br />
100,000 population provides striking confirmation <strong>of</strong><br />
the hypothesis cited above:<br />
Size class <strong>of</strong> city More developed<br />
(thous<strong>and</strong>s) regions<br />
4.000 0.00996<br />
2,000-3,999 0.01583<br />
1,000-1,999 0.01160<br />
500-999 0.01350<br />
250-499 0.01345<br />
100-249 0.02041<br />
St<strong>and</strong>ard deviation <strong>of</strong> city growth rates<br />
Less developed<br />
regions<br />
0.01290<br />
0.01610<br />
0.01656<br />
0.02091<br />
0.02344<br />
0.02625<br />
In both groups <strong>of</strong> countries, the st<strong>and</strong>ard deviation <strong>of</strong><br />
city growth rates is highest for the smallest group <strong>of</strong><br />
82 Shunichi Inoue, "New stage <strong>of</strong> economic development <strong>and</strong><br />
metropolitan growth in Japan"; <strong>and</strong> Antonio Golini, "Present<br />
interrelations between migration <strong>and</strong> urbanization: the Italian<br />
case", papers presented at the Conference <strong>of</strong> the Committee on<br />
<strong>Urban</strong>ization <strong>and</strong> <strong>Population</strong> Redistribution <strong>of</strong> the International<br />
Union for the Scientific Study <strong>of</strong> <strong>Population</strong>, Bellagio, Italy,<br />
30 June-4 July 1978; John M. Wardwell, "Metropolitanization<br />
in developed countries: have the limits been reached?", paper<br />
presented at the International Union for the Scientific Study <strong>of</strong><br />
<strong>Population</strong>, Conference on Economic <strong>and</strong> <strong>Population</strong> Change:<br />
Issues for the 1980s, Helsinki, 28 August-I September 1978;<br />
D. R. Vining <strong>and</strong> T. Kontuly, "Increasing returns to city size<br />
in the face <strong>of</strong> an impending decline in the sizes <strong>of</strong> large cities:<br />
which is the bogus fact?", Environment <strong>and</strong> Planning, vol, 9,<br />
No. 1 (1977), pp. 59-62.<br />
83 The effect <strong>of</strong> government policies is reviewed in Niles M.<br />
Hansen, ed., Public Policy <strong>and</strong> Regional Economic <strong>Development</strong>:<br />
The Experience 01 Nine Western Countries (Cambridge,<br />
Mass., Ballinger Press, 1974). On some <strong>of</strong> the other influences,<br />
see J. Wardwell, op, cit.<br />
8f Wilbur Thompson, "Internal <strong>and</strong> external factors in the<br />
development <strong>of</strong> urban economies", in H. S. Perl<strong>of</strong>f <strong>and</strong> L.<br />
Wingo, Jr., eds., Issues in <strong>Urban</strong> Bconomics, pp. 43-80.<br />
42<br />
cities <strong>and</strong> lowest, less than half the size, for the largest.<br />
This pattern appears to be the first demonstration on an<br />
international level that the variability in city growth<br />
rates is systematically associated with city size.<br />
There are compelling reasons to argue that the<br />
dominant influence on the level <strong>of</strong> city growth rates is<br />
not city size but rather the population growth rate <strong>of</strong> the<br />
country in which the city is located. This relationship<br />
is brought out clearly in table 18. Without exception,<br />
cities in a particular size class experience more rapid<br />
average growth as the national population growth rate<br />
increases in increments <strong>of</strong> 1 per cent. All the categories<br />
in which average city growth rates exceed 4.5 per cent<br />
per annum occur among the group <strong>of</strong> nations in which<br />
national growth rates exceed 3 per cent. Undoubtedly,<br />
the difference in national growth rates accounts for the<br />
bulk <strong>of</strong> the difference between city growth rates in the<br />
less developed <strong>and</strong> the more developed regions. Within<br />
a particular category <strong>of</strong> national growth rates, the relationship<br />
between city size <strong>and</strong> city growth rates remains<br />
relatively flat, with a slight tapering <strong>of</strong>f <strong>of</strong> city growth as<br />
size increases among the slow-growing countries <strong>and</strong><br />
the emergence <strong>of</strong> a U-shaped curve as national growth<br />
rates increase.<br />
The importance <strong>of</strong> national population growth rates<br />
for the growth <strong>of</strong> individual cities is confirmed by regression<br />
analysis. <strong>Growth</strong> rates in 1,322 <strong>of</strong> the 1,338 cities<br />
represented in tables 17 <strong>and</strong> 18 were compared with a<br />
variety <strong>of</strong> demographic <strong>and</strong> economic indicators pertaining<br />
to the initial census date or to the intercensal<br />
period." By far the strongest correlate <strong>of</strong> the intercensal<br />
growth rate <strong>of</strong> a city is the intercensal population growth<br />
rate <strong>of</strong> the country in which the city is located. The<br />
zero-order correlation coefficient between the two variables<br />
is + 0.499. Coefficients <strong>of</strong>·variables examined in<br />
the regression analysis are shown in table 19. Regressions<br />
were calculated on the basis <strong>of</strong> two data sets, one<br />
<strong>of</strong> which included <strong>and</strong> the other <strong>of</strong> which excluded the<br />
110 Chinese cities, for which growth patterns are quite<br />
obscure. Because results did not differ appreciably, only<br />
the results that included Chinese cities are discussed.<br />
The coefficient <strong>of</strong> the national population growth rate<br />
is 0.966 (or 1.002 excluding Chinese cities), carrying the<br />
reasonable implication that a 1 per cent increase in<br />
national population growth rates produces, on average,<br />
a 1 per cent increase in growth rates for large cities in<br />
that country. That this single demographic factor dominates<br />
all others in explanatory power is indicated by the<br />
extraordinarily high F-value for this variable. It is also<br />
indicated by the fact that, <strong>of</strong> the 30.6 per cent <strong>of</strong> total<br />
variance in growth rates explained by the equation, fully<br />
81 per cent ( (0.499)2/0.306) is accounted for by population<br />
growth rates alone.<br />
Other demographic <strong>and</strong> economic variables appear<br />
to operate on city growth rates in predictable ways. As<br />
described above, there is a slight but significanttendency<br />
for larger cities to grow more slowly." For example, a<br />
city <strong>of</strong> 3 million, ceteris paribus, is expected to grow at<br />
35 Cities in countries with less than 2 million population were<br />
dropped from the data set, as were cities in two countries for<br />
which economic information was unavailable.<br />
86 Although the relationships in tables 17 <strong>and</strong> 18 are U-shaped,<br />
there are relatively few cities in the upper size range where the<br />
downward slope is reversed. As a result, non-linear terms that<br />
would reflect this reversal were insignificant when added to<br />
the equation.
city because <strong>of</strong> high. frequencies <strong>of</strong> transport <strong>and</strong><br />
communlcatton."<br />
For the present purposes, the <strong>Population</strong> Division has<br />
endeavoured, to the extent possible, to use data or estimates<br />
approximating the concept <strong>of</strong> agglomeration. This<br />
goal could not be achieved in every instance, as for many<br />
countries data on administrative city areas only are available.<br />
Even these data can be quite adequate in many<br />
countries where local administrative changes occur with<br />
sufficient frequency so that it can be assumed that city<br />
boundaries tend to be widened in conformity with the<br />
expansion <strong>of</strong> the growing agglomerations. In many other<br />
countries, however, the local administrative limits are<br />
more rigid, so that this does not usually happen. For a<br />
number <strong>of</strong> countries, two types <strong>of</strong> data were found,<br />
namely, for administrative <strong>and</strong> for metropolitan areas;<br />
in these instances, the metropolitan data were usually<br />
preferred because they may differ from the agglomeration<br />
to a lesser extent than the administrative data, even<br />
though the size <strong>of</strong> the agglomeration may thereby be<br />
somewhat exaggerated. For these <strong>and</strong> other reasons, it<br />
cannot be claimed that strictly comparable population<br />
estimates have been achieved for all cities; hence, comparisons<br />
<strong>of</strong> their population sizes <strong>and</strong> trends should be<br />
made with all the necessary reservations.<br />
Beginning with 1955, the successive annual issues <strong>of</strong><br />
the United Nations Demographic Yearbook contain<br />
tables showing the population <strong>of</strong> all cities with at least<br />
100,000 inhabitants according to the most recent <strong>of</strong>ficial<br />
data or estimates. The data consists <strong>of</strong> most census results<br />
obtained between 1950 <strong>and</strong> recent dates, in addition<br />
to various other estimates. They comprise both "city<br />
proper" data (i.e., cities within administrative limits)<br />
<strong>and</strong> "agglomeration" data. In many instances, however,<br />
the latter data had not been supplied; <strong>and</strong> in some other<br />
instances, data more properly definable as "metropolitan<br />
region" had been substituted. Therefore, additional research<br />
had to be done to broaden the basis for more<br />
comparable estimation <strong>of</strong> city populations in terms <strong>of</strong><br />
agglomerations. Furthermore, an attempt was made to<br />
record, from national census publications, population<br />
figures for cities below but approaching the 100,000 limit<br />
at the most recent date <strong>of</strong> concrete estimate. These cities<br />
are treated in the same way as all others for purposes <strong>of</strong><br />
estimation <strong>and</strong> projection, although the printing <strong>of</strong> their<br />
population size was suppressed until such time as it exceeded<br />
100,000.<br />
The lower limit <strong>of</strong> 100,000 for presentation <strong>and</strong><br />
analysis <strong>of</strong> data was observed for all countries except<br />
China. Unfortunately, because <strong>of</strong> sparse data <strong>and</strong> the<br />
large number <strong>of</strong> cities for which rather speculative estimates<br />
are required, cities in China enter the data base<br />
<strong>and</strong> analysis only if their estimated population in 1970<br />
reached 200,000. The country-specific figures, presented<br />
in annex II (table 48), will enable the reader to extract<br />
Chinese figures from published totals where desired.<br />
Dates for which concrete city-specificpopulation estimates<br />
are available may be assumed to be the same as<br />
those for which urban <strong>and</strong> rural estimates are available,<br />
as presented in annex I. In a few instances, data from<br />
88 For a further discussion <strong>of</strong> these concepts <strong>and</strong> their suitability<br />
for various purposes t see "Statistical definitions <strong>of</strong> urban<br />
population <strong>and</strong> their uses m applied demography", in Demographic<br />
Yearbook 1972. (United Nations publication, Sales No.<br />
E/F.73.XIII.l).<br />
45<br />
municipal censuses were used; but in these' cases the results<br />
were processed by interpolation or extrapolation to<br />
the dates <strong>of</strong> rural <strong>and</strong> urban estimates presented in annex<br />
I before entering the computerized data base.<br />
For purposes <strong>of</strong> presentation, concrete city population<br />
estimates were processed into the same sequence <strong>of</strong> dates<br />
as urban <strong>and</strong> rural estimates: 1950, 1955 ... 2000. The<br />
procedure used for estimation during the period 1950<br />
1975 was identical, with one exception, to that used for<br />
the urban population as described in chapter II. The exception<br />
is that the growth rate <strong>of</strong> a city minus the growth<br />
rate <strong>of</strong> the rest <strong>of</strong> the country was used in formulae in<br />
place <strong>of</strong> the urban/rural growth difference. For example,<br />
for purposes <strong>of</strong> interpolation between two concrete estimates,<br />
the difference in growth rates between the city<br />
<strong>and</strong> the rest <strong>of</strong> the country (rural areas plus other urban<br />
areas) was assumed to remain constant during the period.<br />
However, since the size <strong>of</strong> a particular city was not<br />
always recorded when the population was less than<br />
100,000, there are instances when a city has only one<br />
concrete estimate in the data base. In these cases, the city<br />
is forward- <strong>and</strong> back-projected by substituting the<br />
urban/rural growth difference in the appropriate period<br />
for the (unavailable) city/non-city growth difference.<br />
Projection <strong>of</strong> city populations is fraught with hazards.<br />
It is a commonplace observation in the social <strong>and</strong> physical<br />
sciences that the behaviour <strong>of</strong> large aggregates is<br />
more predictable <strong>and</strong> regular than that <strong>of</strong> the individual<br />
elements which constitute the aggregate. This dictum<br />
surely applies to urban aggregates <strong>and</strong> the individual<br />
places that comprise them. A city may experience sudden<br />
growth or decline from a huge number <strong>of</strong> local<br />
factors, some <strong>of</strong> which may become continuing features<br />
<strong>of</strong> the environment <strong>and</strong> others <strong>of</strong> which may be transitory.<br />
There are more than 1,600 cities in the data set,<br />
<strong>and</strong> it is obviously impossible to predict precisely the<br />
demographic future <strong>of</strong> most <strong>of</strong> them. City projections<br />
are presented because they serve to illustrate on a global<br />
basis the consequences <strong>of</strong> recent demographic trends if<br />
they were to be extended into the future. In most cases,<br />
national <strong>and</strong> local planners will have access to more detailed<br />
information about a particular place <strong>and</strong> could<br />
supply more reliable information about its prospects.<br />
The method used for projecting city populations is<br />
similar to that used for urban populations. The city<br />
growth rate for 1970-1975 as derived through the<br />
method described above was successively modified during<br />
the projection period to approach linearly an expected<br />
value that is based on the size <strong>of</strong> the city <strong>and</strong> on<br />
the urban growth rate for the country. The relationship<br />
between the city-urban growth rate difference <strong>and</strong> the<br />
city size was computed on the basis <strong>of</strong> the most recent<br />
two observations for cities over 100,000 in the 110<br />
largest countries. Although the correlation between the<br />
city growth rate <strong>and</strong> the log <strong>of</strong> city size was only -0.083,<br />
incorporating the implied relationship serves to dampen<br />
the growth <strong>of</strong> the largest cities in a realistic manner. The<br />
expected value <strong>of</strong> the city-urban growth difference, which<br />
is progressively approached during the projection period,<br />
is computed as:<br />
(City growth rate - urban growth rate)<br />
= 0.024516-0.0019364 In (city size).<br />
Again, this hypothetical value is weighted at 0.2 for the<br />
period 1975-1980,0.4 for 1980-1985, <strong>and</strong> so on up to
= 3 131 X 0.049074<br />
, 1.049074<br />
= 146.46.<br />
To project Dublin <strong>and</strong> Cork to 1980, first calculate their<br />
estimated growth rates 1970-1975 by:<br />
1 (poPulation 1975.5<br />
n Po ulation 1970.5<br />
5<br />
These are the 1970-1975 growth rates used in the formula<br />
for projecting the cities. For the period 1975-1980,<br />
this growth rate is weighted at 0.8 <strong>and</strong> the hypothetical<br />
growth rate, computed according to the following formula,<br />
is weighted at 0.2.<br />
Hypothetical city growth rate = urban growth rate<br />
+ 0.24516 - 0.0019364 In(city size)<br />
The projected urban growth rate for 1975-1980, from<br />
the data given above, is In(l905/1713)/5= 0.021247.<br />
The city size <strong>of</strong> Dublin in 1975 is 835,480. So the hypothetical<br />
city growth rate for Dublin is:<br />
0.021247 + 0.024516 - 0.0019364(13.6358)<br />
= 0.019359.<br />
Thus, the growth rate for Dublin used in the projection<br />
from 1975 to 1980 is:<br />
0.8(.016583) + 0.2(.019359) = 0.017138.<br />
The projected population <strong>of</strong> Dublin in 1980 is:<br />
Dublin (1980) = Dublin (1975) e 5(0.017138)<br />
= 835.48 X 1.08947<br />
= 910.23<br />
This is the number appearing in the output for Dublin in<br />
1980. In order to project Dublin from 1980 to 1985, it<br />
is necessary to substitute new values for the urban growth<br />
rate (1980-1985 replaces 1975-1980) <strong>and</strong> for the size <strong>of</strong><br />
the city (1980 replaces 1975), <strong>and</strong> to change the weights<br />
assigned to the 1970-1975 growth rate <strong>and</strong> to the hypothetical<br />
growth rate from (0.8, 0.2) to (0.6, 0.4). The<br />
complete formula for the growth rate <strong>of</strong> Dublin used for<br />
projection in 1980-1985 is:<br />
0.6(0.016583) + 0.4(0.020915 + 0.024516 <br />
0.0019364 X 13.721) = 0.0174945<br />
Dublin (1985) = 910,230 e 5(0.0174945) = 993,436.<br />
The city size <strong>of</strong> Cork in 1975 is 146.46. So the hypothetical<br />
city growth rate for Cork is:<br />
0.021247 + 0.024516 - 0.0019364(11.8945)<br />
= 0.0227305.<br />
Thus, the growth rate for Cork used in the projection<br />
from 1975 to 1980 is:<br />
0.8(0.0186515) + 0.2(0.0227305) = 0.019467.<br />
The projected population <strong>of</strong> Cork in 1980 is:<br />
Cork (1980) = Cork (1975) e 5 (0.019467)<br />
= 161,433.<br />
For the growth rate <strong>of</strong> Cork used for projection in 1980<br />
1985 is:<br />
47<br />
0.6(0.0186515) + 0.4(0.020915 + 0.024516<br />
0.0019364 X 11.9892) = 0.0200770<br />
Cork (1985) = Cork (1980) e 5 (0.0200770)<br />
= 179.48.<br />
In order to determine whether the ex post facto adjustment<br />
<strong>of</strong> city growth rates is necessary for 1975-1980,<br />
it is necessary to calculate the growth rate <strong>of</strong> the aggregate<br />
<strong>of</strong> Dublin <strong>and</strong> Cork for 1975-1980. The sum <strong>of</strong><br />
the populations <strong>of</strong> these cities in 1975 was 981,940; <strong>and</strong><br />
in 1980, it is 1,071,663. The growth rate <strong>of</strong> the aggregate<br />
is thus 0.01749, which is less than the projected<br />
urban growth rate for the period <strong>of</strong> 0.021247, so that<br />
the constraint on city growth rates does not become operative.<br />
If the cities had been projected at first to grow<br />
at an aggregate rate <strong>of</strong> 0.025 during the period 1975<br />
1980, it would have been necessary to modify downwards<br />
each <strong>of</strong> their projected growth rates between<br />
1975-1980 by:<br />
(0.025 _ 0.021247) Dublin (1975) + Cork (1975)<br />
<strong>Urban</strong> (1975)<br />
( 981,940 )<br />
or by 0.003753 1,713,000 = 0.002151.<br />
C. GROWTH TRENDS IN VARIOUS SIZE CLASSES<br />
Estimates <strong>and</strong> projections <strong>of</strong> the population <strong>of</strong> each<br />
city in the data base are presented in table 48 (annex II).<br />
In table 20, the estimates are processed into regional<br />
summaries <strong>of</strong> the cumulative population above certain<br />
size thresholds. The figures are not extended beyond<br />
1975 because cities not contained in the data base will<br />
be surpassing the various minimum thresholds as the<br />
century progresses. Rather than make guesses regarding<br />
their identity, number <strong>and</strong> size, projections shown below<br />
focus on the population in categories not likely to be appreciably<br />
affected by the debut <strong>of</strong> new cities.<br />
Despite the weak relationships described above between<br />
city size <strong>and</strong> city growth rates, it is very clear from<br />
table 20 that the class <strong>of</strong> largest cities is growing much<br />
more rapidly than smaller classes. Cities with a population<br />
<strong>of</strong> over 4 million grew by 30 per cent in the short<br />
space <strong>of</strong> time between 1970 <strong>and</strong> 1975, or at an annual<br />
rate <strong>of</strong> 5.27 per cent. During the same period, cities with<br />
a population between 2 million <strong>and</strong> 4 million grew by<br />
16 per cent, those between 1 million <strong>and</strong> 2 million by 13<br />
per cent, between 500,000 <strong>and</strong> 1 million by 24 per cent,<br />
<strong>and</strong> between 250,000 <strong>and</strong> 500,000 by 17 per cent. The<br />
largest class <strong>of</strong> cities is growing most rapidly simply because<br />
graduation <strong>of</strong> cities occurs into that class, but no<br />
graduation occurs out <strong>of</strong> it. The 5.27 per cent growth<br />
rate <strong>of</strong> the class <strong>of</strong> cities above 4 million is in sharp contrast<br />
to the average annual intercensal growth rate <strong>of</strong><br />
2.72 per cent for cities that began their last intercensal<br />
period with more than 4 million population.<br />
By dealing with cumulative numbers above various<br />
sizes, a series <strong>of</strong> open-ended categories, out <strong>of</strong> which no<br />
graduation occurs, can be generated. While the population<br />
<strong>of</strong> places larger than 4 million grew by 30 per cent<br />
between 1970 <strong>and</strong> 1975, that in places with more than 2<br />
million population grew by 25 per cent; <strong>of</strong> 1 million, by<br />
21 per cent; <strong>of</strong> 500,000, by 22 per cent; <strong>and</strong> <strong>of</strong> 250,000,<br />
by 21 per cent. The equivalent series in less developed<br />
regions shows considerably more rapid growth: 55 per<br />
cent for the cities with more than 4 million population,
TABLB 20. POPULAnON, NUMBBll OF CInES AND PBRCBNTAGB OF URBAN POPULAnON IN PARnC-<br />
ULAR SIZE CLASS OR ABOVE, WORLD, MORE DBVELOPBD AND LBSS DBVELOPBD REGIONS, AND<br />
MAJOR AREAS, 1950·1975<br />
(<strong>Population</strong> in thous<strong>and</strong>s)<br />
SI:. class <strong>of</strong> dty<br />
(thous<strong>and</strong>s) 19'0 1955 1960 196' 1970 197'<br />
World<br />
4000+<br />
<strong>Population</strong> .......... 71133 89699 125380 156128 189790 241809<br />
Number <strong>of</strong> cities .... 11 13 18 21 24 30<br />
Percentage urban .... 9.82 10.56 12.39 13.30 14.01 15.49<br />
2000+<br />
<strong>Population</strong> .......... 121710 146641 198531 250568 298801 375153<br />
Number <strong>of</strong> cities .... 30 33 46 57 63 78<br />
Percentage urban .... 16.81 17.27 19.62 21.35 22.06 24.04<br />
1000+<br />
<strong>Population</strong> .......... 186830 234529 294639 360338 433 100 525389<br />
Number <strong>of</strong> cities .... 77 95 115 138 159 185<br />
Percentage urban .... 25.80 27.62 29.11 30.70 31.98 33.66<br />
500+<br />
<strong>Population</strong> .......... 254735 314634 388822 470192 562713 685719<br />
Number <strong>of</strong> cities .... 176 213 250 297 345 412<br />
Percentage urban .... 35.18 37.06 38.42 40.06 41.55 43.93<br />
250+<br />
<strong>Population</strong> .......... 320823 388833 480471 577150 693011 837818<br />
Number <strong>of</strong> cities .... 371 431 516 610 726 853<br />
Percentage urban .... 44.30 45.80 47.47 49.17 51.17 53.68<br />
100+<br />
<strong>Population</strong> .......... 408004 492897 597220 709438 833058 971656-<br />
Number <strong>of</strong> cities .... 953 1121 1277 1462 1615 1655-<br />
Percentage urban .... 56.34 58.05 59.01 60.44 61.51 62.25 a<br />
More developed regions<br />
4000+<br />
<strong>Population</strong> .......... 55655 72175 82937 100 183 108250 121235<br />
Number <strong>of</strong> cities .... 8 10 10 12 12 13<br />
Percentage urban .... 12.40 14.25 14.48 15.66 15.40 15.80<br />
2000+<br />
<strong>Population</strong> .......... 85694 98907 125 588 151000 168448 193721<br />
Number <strong>of</strong> cities .... 19 20 26 32 34 39<br />
Percentage urban .... 19.09 19.53 21.93 23.60 23.97 25.25<br />
1000+<br />
<strong>Population</strong> .......... 124485 151 192 181 193 212368 239168 271153<br />
Number <strong>of</strong> cities .... 46 56 65 77 85 95<br />
Percentage urban .... 27.73 29.85 31.64 33.20 34.03 35.34<br />
500+<br />
<strong>Population</strong> .......... 166599 198958 237972 276775 312257 351071<br />
Number <strong>of</strong> cities .... 107 127 147 170 188 205<br />
Percentage urban .... 37.11 39.28 41.55 43.26 44.43 45.75<br />
250+<br />
<strong>Population</strong> .......... 208471 244238 290648 335400 380899 432942<br />
Number <strong>of</strong> cities .... 230 259 299 342 392 443<br />
Percentage urban .... 46.44 48.23 50.75 52.43 54.19 56.42<br />
100+<br />
<strong>Population</strong> .......... 259628 306591 360706 413 228 461 635 510 228 a<br />
Number <strong>of</strong> cities .... 575 678 759 846 904 907 a<br />
Percentage urban .... 57.83 60.54 62.98 64.59 65.68 66.50&<br />
48
TABLE 20. (continued)<br />
(<strong>Population</strong> in thous<strong>and</strong>s)<br />
Size class <strong>of</strong> city<br />
(thous<strong>and</strong>s) 1950 1955 1960 1965 1970 1975<br />
Less developed regions<br />
4000+<br />
<strong>Population</strong> .......... 15478 17524 42443 55945 81540 120574<br />
Number <strong>of</strong> cities .... 3 3 8 9 12 17<br />
Percentage urban .... 5.62 5.11 9.66 10.48 12.52 15.19<br />
2000+<br />
<strong>Population</strong> .......... 36016 47734 72 943 99568 130353 181432<br />
Number <strong>of</strong> cities .... 11 13 20 25 29 39<br />
Percentage urban .... 13.09 13.93 16.60 18.65 20.01 22.86<br />
1000+<br />
<strong>Population</strong> .......... 62345 83337 113 446 147970 193932 254236<br />
Number <strong>of</strong> cities .... 31 39 50 61 74 90<br />
Percentage urban .... 22.65 24.32 ·25.82 27.71 29.77 32.04<br />
500+<br />
<strong>Population</strong> .......... 88 136 115676 150850 193417 250456 334648<br />
Number <strong>of</strong> cities .... 69 86 103 127 157 207<br />
Percentage urban .... 32.02 33.76 34.33 36.22 38.44 42.17<br />
250+<br />
<strong>Population</strong> .......... 112352 144595 189823 241750 312112 404876<br />
Number <strong>of</strong> cities .... 141 172 217 268 334 410<br />
Percentage urban .... 40.82 42.20 43.21 45.27 47.91 51.02<br />
100+<br />
<strong>Population</strong> .......... 148376 186306 236514 296210 371423 461428&<br />
Number <strong>of</strong> cities .... 378 443 518 616 711 748&<br />
Percentage urban .... 53.91 54.38 53.83 55.47 57.01 58.15&<br />
A. Africa<br />
4000+<br />
<strong>Population</strong> ..........<br />
Number <strong>of</strong> cities ....<br />
Percentage urban ....<br />
4608<br />
1<br />
7.35<br />
5480<br />
1<br />
6.82<br />
6415<br />
1<br />
6.23<br />
2000+<br />
<strong>Population</strong> .......... 2466 3027 3725 4608 7519 10937<br />
Number <strong>of</strong> cities .... 1 1 1 1 2 3<br />
Percentage urban .... 7.75 7.65 7.52 7.3$ 9.36 10.62<br />
1000+<br />
<strong>Population</strong> .......... 3503 5293 7482 8918 15415 23130<br />
Number <strong>of</strong> cities .... 2 3 4 4 8 12<br />
Percentage urban .... 11.01 13.38 15.11 14.22 19.18 22.45<br />
500+<br />
<strong>Population</strong> .......... 6853 10 278 12842 16935 22924 36932<br />
Number <strong>of</strong> cities .... 7 11 12 15 19 33<br />
Percentage urban .... 21.54 25.98 25.94 27.01 28.52 35.85<br />
250+<br />
<strong>Population</strong> .......... 9989 12959 17 116 24706 35431 50983<br />
Number <strong>of</strong> cities .... 16 20 25 40 56 74<br />
Percentage urban .... 31.39 32.76 34.57 39.41 44.08 49.48<br />
100+<br />
<strong>Population</strong> .......... 15130 19988 26949 35355 46399 60955&<br />
Number <strong>of</strong> cities .... 50 67 88 107 122 133&<br />
Percentage urban .... 47.55 50.52 54.44 56.39 57.73 59.16 a<br />
B. Latin America<br />
4000+<br />
<strong>Population</strong> .......... 5251 6074 20969 26098 32567 44837<br />
Number <strong>of</strong> cities .... 1 1 4 4 4 5<br />
Percentage urban .... 7.78 7.15 19.67 19.75 20.06 22.60<br />
2000+<br />
<strong>Population</strong> .......... 13 638 16946 20969 30757 43277 61113<br />
Number <strong>of</strong> cities .... 4 4 4 6 8 11<br />
Percentage urban .... 20.20 19.95 19.67 23.27 26.66 30.81<br />
49
TABLJ! 20. (continued)<br />
(<strong>Population</strong> in thous<strong>and</strong>s)<br />
Sit_ cwa 01city<br />
(thous<strong>and</strong>,) 1950 1955 1960 1965 1970 1975<br />
D. East Asia (continued)<br />
500+<br />
<strong>Population</strong> .......... 47310 59494 79167 91651 110 874 135766<br />
Number <strong>of</strong> cities .... 34 37 48 50 60 74<br />
Percentage urban .... 41.94 41.06 40.65 40.37 41.82 43.95<br />
250+<br />
<strong>Population</strong> .......... 53334 68554 90655 108270 131690 158534<br />
Number <strong>of</strong> cities .... 53 63 84 98 121 141<br />
Percentage urban .... 47.28 47.31 46.55 47.69 49.67 51.31<br />
100+<br />
<strong>Population</strong> .......... 67360 85619 106454 125465 146886 171 272 a<br />
Number <strong>of</strong> cities .... 147 173 181 202 213 214 a<br />
Percentage urban .... 59.71 59.09 54.67 55.27 55.40 55.44&<br />
E. South Asia<br />
4000+<br />
<strong>Population</strong> .......... 4446 4945 9560 11 016 17172 37776<br />
Number <strong>of</strong> cities .... 1 1 2 2 3 7<br />
Percentage urban .... 4.24 4.03 6.51 6.19 7.90 14.22<br />
2000+<br />
<strong>Population</strong> .......... 7347 10517 20990 30058 39442 58205<br />
Number <strong>of</strong> cities .... 2 3 7 9 10 14<br />
Percentage urban .... 7.00 8.57 14.29 16.88 18.15 21.92<br />
1000+<br />
<strong>Population</strong> .......... 19360 25962 33267 45191 58837 75321<br />
Number <strong>of</strong> cities .... 11 14 16 20 23 25<br />
Percentage urban .... 18.46 21.15 22.65 25.37 27.08 28.36<br />
500+<br />
<strong>Population</strong> .......... 26621 32622 40753 56863 75880 103018<br />
Number <strong>of</strong> cities .... 21 23 26 39 50 65<br />
Percentage urban .... 25.38 26.58 27.74 31.93 34.92 38.79<br />
250+<br />
<strong>Population</strong> .......... 36649 45423 57845 75312 96460 127503<br />
Number <strong>of</strong> cities .... 52 61 74 92 107 135<br />
Percentage urban .... 34.94 37.01 39.38 42.29 44.39 48.01<br />
100+<br />
<strong>Population</strong> .......... 50694 61871 76411 96609 122854 154574a<br />
Number <strong>of</strong> cities .... 147 171 198 236 281 303a<br />
Percentage urban .... 48.33 50.41 52.01 54.24 56.54 58.21 a<br />
F. Europe<br />
4000+<br />
<strong>Population</strong> .......... 22747 28479 31 179 33058 33988 35033<br />
Number <strong>of</strong> cities .... 3 4 4 4 4 4<br />
Percentage urban .... 10.22 11.73 11.72 11.27 10.68 10.20<br />
2000+<br />
<strong>Population</strong> .......... 36359 40745 53059 58711 64215 72 335<br />
Number <strong>of</strong> cities .... 8 9 13 14 15 17<br />
Percentage urban .... 16.33 16.78 19.94 20.01 20.17 21.06<br />
1000+<br />
<strong>Population</strong> .......... 61784 71819 80301 88875 97765 106714<br />
Number <strong>of</strong> cities .... 25 30 32 35 39 42<br />
Percentage urban .... 27.76 29.58 30.18 30.29 30.71 31.07<br />
500+<br />
<strong>Population</strong> .......... 85075 94163 106789 117704 127781 137294<br />
Number <strong>of</strong> cities .... 58 63 71 76 82 85<br />
Percentage urban .... 38.22 38.78 40.14 40.11 40.14 39.97<br />
51
TABLB 20. (continued)<br />
(<strong>Population</strong> in thous<strong>and</strong>s)<br />
Size clil8s 01 city<br />
(thous<strong>and</strong>s) 1950 1955 1960 1965 1970 1975<br />
E. Europe (continued)<br />
250+<br />
<strong>Population</strong> .......... 106269 117091 130779 144227 158529 172 946<br />
Number <strong>of</strong> cities .... 121 130 142 154 174 189<br />
Percentage urban .... 47.74 48.22 49.16 49.15 49.79 50.35<br />
100+<br />
<strong>Population</strong> .......... 131077 145 181 161497 178739 193724 208126 a<br />
Number <strong>of</strong> cities .... 289 320 344 374 397 401 a<br />
Percentage urban .... 58.88 59.79 60.71 60.91 60.85 60.59 a<br />
4000+<br />
<strong>Population</strong> ..........<br />
Number <strong>of</strong> cities ....<br />
Percentage urban ....<br />
G. Oceania<br />
2000+<br />
<strong>Population</strong> .......... 2141 4487 5021 5614<br />
Number <strong>of</strong> cities .... 1 2 2 2<br />
Percentage urban .... 20.50 37.43 36.72 35.92<br />
1000+<br />
<strong>Population</strong> .......... 3136 3564 4021 4487 5021 5614<br />
Number <strong>of</strong> cities .... 2 2 2 2 2 2<br />
Percentage urban .... 40.54 39.52 38.50 37.43 36.72 35.92<br />
500+<br />
<strong>Population</strong> .......... 3 136 4079 5 191 6442 7865 8911<br />
Number <strong>of</strong> cities .... 2 3 4 5 6 6<br />
Percentage urban .... 40.54 45.23 49.71 53.74 57.51 57.01<br />
250+<br />
<strong>Population</strong> .......... 4538 5256 6055 7180 8137 9468<br />
Number <strong>of</strong> cities .... 6 6 6 7 7 8<br />
Percentage urban '.... 58.66 58.28 57.98 59.89 59.50 60.58<br />
100+<br />
<strong>Population</strong> ,......... 5105 5968 6955 8142 9317 10779 a<br />
Number <strong>of</strong> cities .... 10 11 12 14 15 17 a<br />
Percentage urban .... 65.99 66.18 66.60 67.92 68.13 68.96 a<br />
H. Union oj Soviet Socialist Republics<br />
4000+<br />
<strong>Population</strong> .......... 4841 5535 6285 6810 7105 11588<br />
Number <strong>of</strong> cities .... 1 1 1 1 1 2<br />
Percentage urban .... 6.84 6.43 6.01 5.63 5.16 7.46<br />
2000+<br />
<strong>Population</strong> .......... 7464 8559 9747 10593 11083 11588<br />
Number <strong>of</strong> cities .... 2 2 2 2 2 2<br />
Percentage urban .... 10.55 9.94 9.32 8.75 8.05 7.46<br />
1000+<br />
<strong>Population</strong> .......... 7464 8559 12954 17696 21105 24930<br />
Number <strong>of</strong> cities .... 2 2 5 8 10 12<br />
Percentage urban .... 10.55 9.94 12.39 14.62 15.33 16.05<br />
500+<br />
<strong>Population</strong> .......... 14353 21779 27300 34254 39192 45842<br />
Number <strong>of</strong> cities .... 13 22 25 31 34 39<br />
Percentage urban .... 20.28 25.29 26.10 28.31 28.47 29.52<br />
250+<br />
<strong>Population</strong> .......... 23064 30003 39529 48001 56047 67724<br />
Number <strong>of</strong> cities .... 38 47 61 71 82 101<br />
Percentage urban .... 32.59 34.84 37.80 39.67 40.72 43.60<br />
52
poor transportation systems <strong>and</strong> also the dominance <strong>of</strong><br />
the primary sector, it is difficultfor the poorest countries<br />
to achieve a great concentration <strong>of</strong> activity <strong>and</strong> labour<br />
force in one or a few cities. This reasoning is consistent<br />
with the position <strong>of</strong> Africa, as well as that <strong>of</strong> Latin<br />
America <strong>and</strong> East Asia, shown in figure IV. It would<br />
not explain the location <strong>of</strong> the USSR, where restricted<br />
definitions <strong>of</strong> the area <strong>of</strong> specific cities may account for<br />
the bottom-heavy urban hierarchy. It is also possible that<br />
policies dating from the 1930s to discourage the growth<br />
<strong>of</strong> the largest cities have had a major effect on the size<br />
distribution within the Soviet Union." In any case, it is<br />
evident from table 17 that differences between Latin<br />
America <strong>and</strong> Africa/USSR in their city size distributions<br />
were reinforced during the most recent intercensal period.<br />
Table 22 presents regional projections <strong>of</strong> the number<br />
<strong>and</strong> population <strong>of</strong> cities in various categories to the end<br />
<strong>of</strong> the century. Because cities generally enter the data<br />
base only if they have achieved 100,000 in population,<br />
it is certain that the number <strong>and</strong> population <strong>of</strong> cities<br />
above this size is increasingly deficient after 1970. Consequently,<br />
figures for the category 100,000-250,000 are<br />
not shown beyond that date, nor are cities <strong>of</strong> 250,000<br />
500,000 in 1990 <strong>and</strong> beyond, nor cities <strong>of</strong> 500,000-1<br />
million in 2000. It is, <strong>of</strong> course, possible to graduate the<br />
urban distribution at subsequent points by some variant<br />
<strong>of</strong> the rank-size rule. In exchange for this loss <strong>of</strong> comprehensiveness<br />
that this procedure would provide, the<br />
present procedure has the virtue <strong>of</strong> allowing identification<br />
<strong>of</strong> each <strong>of</strong> the cities in a size class at subsequent<br />
points.<br />
46 <strong>Urban</strong>ization in the Second United Nations <strong>Development</strong><br />
Decade (United Nations publication, Sales No. E.70.IV.15),<br />
p.27.<br />
TABLE 22. POPULATION AND NUMBER OF CITIES IN A PARTICULAR<br />
SIZE CLASS, MAJOR AREAS, 1975-2000<br />
(<strong>Population</strong> in thous<strong>and</strong>s)<br />
Size class (thous<strong>and</strong>s)<br />
<strong>Urban</strong> population .<br />
4000+ .<br />
Number <strong>of</strong> cities .<br />
2000-3999 .<br />
Number <strong>of</strong> cities .<br />
1000-1999 ..<br />
Number <strong>of</strong> cities .<br />
500-999 .<br />
Number <strong>of</strong> cities .<br />
250-499 .<br />
Number <strong>of</strong> cities .<br />
1975<br />
World<br />
1560859<br />
241809<br />
30<br />
133344<br />
48<br />
150236<br />
107<br />
160330<br />
227<br />
152099<br />
441<br />
According to the data in Table 22, there will be an<br />
enormous expansion in the number <strong>and</strong> population <strong>of</strong><br />
cities <strong>of</strong> 1 million or more for the rest <strong>of</strong> the twentieth<br />
century. Whereas there were 185 cities larger than 1 million<br />
in 1975, there are expected to be 439 by the end<br />
<strong>of</strong> the century. The combined population in such places<br />
is expected to grow by 260 per cent in the last quarter<br />
<strong>of</strong> this century, or at an annual rate <strong>of</strong> 3.82 per cent.<br />
In contrast, the total urban population is expected to<br />
grow by 206 per cent. Again, it must be mentioned that<br />
the principal source <strong>of</strong> disparity between the two figures<br />
is the graduation <strong>of</strong> places into the million-plus category.<br />
Without the increment <strong>of</strong> 254 million attributable to this<br />
source, million-plus cities would grow by 211 per cent,<br />
almost identical to the urban growth factor.<br />
The number <strong>and</strong> population <strong>of</strong> cities with more than<br />
4 million population will grow at even more rapid a rate.<br />
Beginning at 30 in 1975, these cities are expected to<br />
number 86 by the year 2000, <strong>and</strong> their combined populations<br />
are expected to increase by 307 per cent. Such<br />
accretion will be even more rapid in the less developed<br />
regions. In 1975, there were slightly fewer persons in<br />
cities larger than 4 million in the less developed regions<br />
than in the more developed regions. However, by 2000,<br />
both the number <strong>and</strong> population <strong>of</strong> cities in this category<br />
among the less developed regions is expected to be well<br />
over twice that <strong>of</strong> the more developed regions. By 2000,<br />
it is expected that 71 per cent <strong>of</strong> the cities with more<br />
than 4 million inhabitants, <strong>and</strong> an equivalent percentage<br />
<strong>of</strong> the population in these cities, will be located in the<br />
less developed regions.<br />
The identity <strong>of</strong> the largest cities in the world at various<br />
1980<br />
1806808<br />
311462<br />
38<br />
154711<br />
58<br />
186838<br />
139<br />
176552<br />
255<br />
172 302<br />
497<br />
More developed regions<br />
<strong>Urban</strong> population 767301 834400<br />
4000+ 121 235 141 610<br />
Number <strong>of</strong> cities 13 16<br />
2 000-3 999 72 486 72 658<br />
Number <strong>of</strong> cities 26 27<br />
1000-1999 17 432 99370<br />
Number <strong>of</strong> cities 56 74<br />
500-999 79918 79763<br />
Number <strong>of</strong> cities 110 116<br />
250-499 81871 89710<br />
Number <strong>of</strong> cities 238 259<br />
<strong>Urban</strong> population .<br />
4000+ .<br />
Number <strong>of</strong> cities .<br />
Less developed ;'egions<br />
793 558 792 408<br />
120574 169852<br />
17 22<br />
55<br />
1990<br />
2422292<br />
465 112<br />
52<br />
242957<br />
86<br />
275583<br />
204<br />
222687<br />
327<br />
969225<br />
170610<br />
19<br />
99006<br />
36<br />
118906<br />
89<br />
98330<br />
149<br />
1453067<br />
294502<br />
33<br />
2000<br />
3208027<br />
742323<br />
86<br />
279835<br />
105<br />
344519<br />
248<br />
1092 469<br />
207272<br />
25<br />
96451<br />
36<br />
131 119<br />
94<br />
2115558<br />
535051<br />
61
TABLE 22. (Continued)<br />
Size class (thous<strong>and</strong>s) 197$ 1980 1990 2000<br />
Less developed regions (continued)<br />
2 000-3 999 60 858 82 053<br />
Number <strong>of</strong> cities 22 31<br />
1 000-1 999 72 804 87 468<br />
Number <strong>of</strong> cities ......•... 51 65<br />
500-999 80412 96789<br />
Number <strong>of</strong> cities 117 139<br />
250-499 70 228 82 592<br />
Number <strong>of</strong> cities 203 238<br />
<strong>Urban</strong> population .<br />
4000+ ................•..•<br />
Number <strong>of</strong> cities .<br />
2000-3999 .<br />
Number <strong>of</strong> cities .<br />
1000-1999 .<br />
Number <strong>of</strong> cities .<br />
500-999 .<br />
Number <strong>of</strong> cities .<br />
250-499 .<br />
Number <strong>of</strong> cities .<br />
<strong>Urban</strong> population .<br />
4000+ .<br />
Number <strong>of</strong> cities .<br />
2000-3999 .<br />
Number <strong>of</strong> cities .<br />
1000-1999 ................•<br />
Number <strong>of</strong> cities .<br />
500-999 .<br />
Number <strong>of</strong> cities .<br />
250·499 .<br />
Number <strong>of</strong> cities .<br />
<strong>Urban</strong> population .<br />
4000+ .<br />
Number <strong>of</strong> cities .<br />
2000-3999 .<br />
Number <strong>of</strong> cities .<br />
1000-1999 .<br />
Number <strong>of</strong> cities .<br />
500-999 ..........•.........<br />
Number <strong>of</strong> cities .<br />
250-499 .<br />
Number <strong>of</strong> cities .<br />
<strong>Urban</strong> population .<br />
4000+ .<br />
Number <strong>of</strong> cities .<br />
2000-3999 .<br />
Number <strong>of</strong> cities .<br />
1000-1999 ..<br />
Number <strong>of</strong> cities .<br />
500-999 .<br />
Number <strong>of</strong> cities .<br />
250-499 ..<br />
Number <strong>of</strong> cities .<br />
<strong>Urban</strong> population .<br />
4000+ .<br />
Number <strong>of</strong> cities .<br />
2000-3999 .<br />
Number <strong>of</strong> cities .<br />
1000-1999 ..<br />
Number <strong>of</strong> cities .<br />
A. Africa<br />
103032<br />
6415<br />
1<br />
4522<br />
2<br />
12193<br />
9<br />
13 802<br />
21<br />
14051<br />
41<br />
132951<br />
7464<br />
1<br />
10522<br />
4<br />
18499<br />
14<br />
17747<br />
26<br />
15300<br />
44<br />
B. Latin America<br />
198 366 240 592<br />
44837 59485<br />
5 6<br />
16276 26643<br />
6 10<br />
16476 15173<br />
11 11<br />
15431 17 574<br />
22 25<br />
13794 20508<br />
41 61<br />
C. Northern America<br />
170501 183281<br />
48297 54189<br />
5 6<br />
27560 27262<br />
10 10<br />
25560 33097<br />
18 23<br />
23 519 25 129<br />
33 37<br />
18910 17367<br />
54 50<br />
D. East Asia<br />
308 943 359 457<br />
57863 71072<br />
6 7<br />
21 641 25066<br />
8 9<br />
31170 35772<br />
23 26<br />
25092 29844<br />
37 42<br />
22768 25973<br />
67 72<br />
E. South Asia<br />
265568<br />
37776<br />
7<br />
20429<br />
7<br />
17116<br />
11<br />
56<br />
329760<br />
61372<br />
10<br />
21957<br />
9<br />
22550<br />
17<br />
143951<br />
50<br />
156677<br />
115<br />
124357<br />
178<br />
219202<br />
19703<br />
3<br />
32808<br />
12<br />
30852<br />
22<br />
22538<br />
32<br />
343304<br />
102998<br />
10<br />
34033<br />
11<br />
27136<br />
21<br />
26024<br />
38<br />
212393<br />
63328<br />
7<br />
47300<br />
17<br />
33807<br />
26<br />
23742<br />
36<br />
476462<br />
103095<br />
10<br />
35265<br />
13<br />
52910<br />
38<br />
37644<br />
53<br />
515685<br />
102764<br />
12<br />
46271<br />
16<br />
50050<br />
37<br />
183384<br />
69<br />
213400<br />
154<br />
345757<br />
67982<br />
11<br />
45953<br />
17<br />
40685<br />
29<br />
466234<br />
165323<br />
17<br />
22226<br />
8<br />
44609<br />
32<br />
239 199<br />
80544<br />
10<br />
43877<br />
16<br />
34659<br />
25<br />
622441<br />
142175<br />
14<br />
55607<br />
22<br />
63772<br />
46<br />
790685<br />
194852<br />
21<br />
64290<br />
24<br />
69021<br />
50
TABLE 22. (Continued)<br />
Site class (thous<strong>and</strong>s) 1975 1980 1990 2000<br />
E.<br />
500-999 .<br />
Number <strong>of</strong> cities .<br />
250-499 .<br />
Number <strong>of</strong> cities .<br />
<strong>Urban</strong> population .<br />
4000+ .<br />
Number <strong>of</strong> cities .<br />
2000-3999 .<br />
Number <strong>of</strong> cities .<br />
1000-1999 .<br />
Number <strong>of</strong> cities .<br />
500-999 .<br />
Number <strong>of</strong> cities .<br />
250-499 .<br />
Number <strong>of</strong> cities .<br />
<strong>Urban</strong> population .<br />
4000+ ..<br />
Number <strong>of</strong> cities .<br />
2000-3999 .<br />
Number <strong>of</strong> cities .<br />
1000-1999 ..<br />
Number <strong>of</strong> cities .<br />
500-999 .<br />
Number <strong>of</strong> cities .<br />
250-499 .<br />
Number <strong>of</strong> cities .<br />
South Asia (continued)<br />
27697 33565<br />
40 49<br />
24485 28139<br />
70 83<br />
F. Europe<br />
343503 369285<br />
35033 45713<br />
4 6<br />
37302 34897<br />
13 13<br />
34379 36516<br />
25 27<br />
30580 31888<br />
43 46<br />
35652 40507<br />
104 117<br />
G. Oceania<br />
15630 17 829<br />
5614 6176<br />
2 2<br />
1009<br />
1<br />
3297 2747<br />
4 3<br />
557 954<br />
2 3<br />
H. Union <strong>of</strong> Soviet Socialist Republics<br />
<strong>Urban</strong> population 155316 173653<br />
4000+ 11 588 12167<br />
Number <strong>of</strong> cities 2 2<br />
2000-3999 2188<br />
Number <strong>of</strong> cities I<br />
1000-1999 13 342 24222<br />
Number <strong>of</strong> cities 10 20<br />
500-999 20912 18058<br />
Number <strong>of</strong> cities , . .. 27 27<br />
250-499 21 882 23 554<br />
Number <strong>of</strong> cities 62 67<br />
points from 1950 to 2000 is shown in table 23. It is<br />
worth repeating that the rankings depend upon the relative<br />
inclusiveness <strong>of</strong> city boundaries <strong>and</strong> therefore do<br />
not necessarily correspond to the rankings that would<br />
obtain if uniform criteria could be applied in establishing<br />
city boundaries.<br />
The list <strong>of</strong> largest cities reflects the same redistribution<br />
towards the less developed regions during the course<br />
<strong>of</strong> the century that is evident in other aspects <strong>of</strong> urban<br />
growth. In 1950, 11 <strong>of</strong> the 15 largest cities were located<br />
in more developed regions. By 1975, 8 <strong>of</strong> 15 were in the<br />
more developed regions; <strong>and</strong> in 2000, it is expected that<br />
only 3 <strong>of</strong> the 15 will be located in the more developed<br />
regions-Tokyo, New York <strong>and</strong> Los Angeles.<br />
In 2000, there are expected to be 25 cities larger than<br />
10 million in population, compared with only seven in<br />
1975. Mexico City is projected to be the world's largest<br />
city in 2000, with an estimated population <strong>of</strong> 31.0<br />
million. This position is based on a rapid rate <strong>of</strong> national<br />
population growth, a rapid rate <strong>of</strong> urbanization <strong>and</strong> a<br />
57<br />
41791<br />
61<br />
423290<br />
59854 8<br />
35016<br />
13<br />
41517<br />
30<br />
44129<br />
65<br />
22590<br />
7248 2<br />
4655 4<br />
1176<br />
2<br />
209366<br />
13 370<br />
2<br />
5016 2<br />
34656<br />
26<br />
25643<br />
40<br />
476952<br />
72872<br />
10<br />
36133<br />
14<br />
46413<br />
34<br />
27145<br />
4194 1<br />
3888<br />
1<br />
5345 4<br />
239614<br />
14381<br />
2<br />
7861<br />
3<br />
40015<br />
28<br />
rapid increase at Mexico City in relation to the total<br />
urban population. Whether such size can actually be<br />
attained is, <strong>of</strong> course, questionable. It has been noted,<br />
for example, that population growth at Mexico City<br />
threatens to destroy tree cover that is necessary to prevent<br />
erosion <strong>and</strong> flooding." Water-supply also appears<br />
to be a potentially constraining factor in this case. Natural<br />
or social limits to growth could be encountered well<br />
before a size <strong>of</strong> 31 million is reached, or <strong>of</strong> 26 million<br />
for Sao Paulo, <strong>and</strong> so on down the line. These projected<br />
figures are obtained despite the fact that the projection<br />
procedure has incorporated a negative relationship between<br />
city size <strong>and</strong> city growth rates, as discussed above.<br />
However, the relationship is necessarily based on an extrapolation<br />
<strong>of</strong> tendencies observed among smaller cities,<br />
<strong>and</strong> the relationship could be quite different in the range<br />
41 Report <strong>of</strong> Habitat: United Nations Conference on Human<br />
Settlements, Vancouver, .31 May.ll June 1976 (United Nations<br />
publication, Sales No. E.76.IV.7), "Recommendations for national<br />
action", item 10 <strong>of</strong> provisional agenda.
<strong>of</strong> city population sizes to be approached in the rest <strong>of</strong><br />
this century. The basic point to be stressed is that the<br />
world is entering uncharted territory at the upper end <strong>of</strong><br />
its city size distribution. By 2000, there are expected to<br />
be six cities larger than any city in 1975. Projecting into<br />
this range is an act <strong>of</strong> faith that past growth patterns can<br />
be continued without radical alteration as unprecedented<br />
city sizes are approached.<br />
TABLE 23. THIRTY LARGEST AGGLOMERATIONS IN THE WORLD, RANKED BY SIZE. 1950-2000<br />
(<strong>Population</strong> in millions)<br />
Rank 1950 <strong>Population</strong> 1975 <strong>Population</strong> 1990 <strong>Population</strong> 2000 <strong>Population</strong><br />
1. New York/northeastern<br />
New Jersey 12.3<br />
2. London 10.4<br />
3. Rhein/Ruhr 6.9<br />
4. Tokyo/Yokohama 6.7<br />
5. Shanghai 5.8<br />
6. Paris 5.5<br />
7. Greater Buenos<br />
Aires........... 5.3<br />
8. Chicago/northwestern<br />
Indiana .. 4.9<br />
9. Moscow.......... 4.8<br />
10. Calcutta.......... 4.4<br />
11. Los Angeles/<br />
Long Beach 4.0<br />
12. Osaka/Kobe 3.8<br />
13. Milan............ 3.6<br />
14. Mexico City 3.0<br />
15. Philadelphia/<br />
New Jersey . . . . .. 2.9<br />
16. Rio de Janeiro 2.9<br />
17. Greater Bombay 2.9<br />
18. Detroit (Michigan) . . 2.8<br />
19. Naples 2.8<br />
20. Leningrad 2.6<br />
21. Manchester 2.5<br />
22. Birmingham 2.5<br />
23. Sao Paulo 2.5<br />
24. Cairo/Giza/<br />
Imbaba 2.5<br />
25. Tientsin 2.4<br />
26. Boston<br />
(Massachusetts) .. 2.2<br />
27. Shenyang<br />
(Mukden) 2.2<br />
28. Peking........... 2.2<br />
29. Berlin [West] 2.2<br />
30. San Francisco/<br />
Oakl<strong>and</strong> 2.0<br />
New York/north-eastern<br />
New Jersey 19.8<br />
Tokyo/Yokohama 17.7<br />
Mexico City 11.9<br />
Shanghai 11.6<br />
Los Angeles/Long Beach 10.8<br />
Sao Paulo 10.7<br />
London 10.4<br />
Greater Buenos Aires.. 9.3<br />
Rhein/Ruhr 9.3<br />
Paris 9.2<br />
Rio de Janeiro. . . . . . .. 8.9<br />
Peking 8.7<br />
Osaka/Kobe 8.6<br />
Chicago/northwestern<br />
Indiana. . . .. 8.1<br />
Calcutta 7.8<br />
Moscow 7.4<br />
Greater Bombay 7.0<br />
Seoul 6.8<br />
Cairo/Giza/Imbaba 6.4<br />
Milan............... 6.1<br />
Jakarta 5.7<br />
Philadelphia/New Jersey 4.8<br />
Detroit (Michigan) .... 4.8<br />
Manila.............. 4.5<br />
Delhi 4.4<br />
Tientsin<br />
Teheran<br />
4.4<br />
4.3<br />
Leningrad 4.2<br />
Madras.............. 4.1<br />
Bogota.............. 4.0<br />
58<br />
TokyolYokohama .... 23.4<br />
Mexico City . . . . . . . . .. 22.9<br />
New York/northeastern<br />
New Jersey .. 21.8<br />
Sao Paulo 19.9<br />
Shanghai 17.7<br />
Peking 15.3<br />
Rio de Janeiro. . . . . . .. 14.7<br />
Los Angeles/Long Beach 13.3<br />
Greater Bombay 12.0<br />
Calcutta 11.9<br />
Seoul 11.8<br />
Greater Buenos Aires .. 11.4<br />
Jakarta 11.4<br />
Paris 10.9<br />
Osaka/Kobe 10.7<br />
Cairo/Giza/Imbaba 10.0<br />
London 10.0<br />
Rhein/Ruhr 9.3<br />
Bogota 8.9<br />
Chicago/northwestern<br />
Indiana . . . .. 8.9<br />
Madras 8.8<br />
Manila.............. 8.6<br />
Moscow............. 8.5<br />
Teheran 8.3<br />
Istanbul 8.3<br />
Baghdad 8.2<br />
Delhi 8.1<br />
Karachi 7.9<br />
Bangkok/Thonburi 7.5<br />
Milan............... 7.4<br />
Mexico City . . .. .. . 31.0<br />
Sao Paulo 25.8<br />
Tokyo/Yokohama .... 24.2<br />
New York/northeastern<br />
New Jersey .. 22.8<br />
Shanghai 22.7<br />
Peking 19.9<br />
Rio de Janeiro " 19.0<br />
Greater Bombay 17.1<br />
Calcutta 16.7<br />
Jakarta 16.6<br />
Seoul 14.2<br />
Los Angeles/Long Beach 14.2<br />
Cairo/Giza/Imbaba .. , 13.1<br />
Madras 12.9<br />
Manila 12.3<br />
Greater Buenos Aires.. 12.1<br />
Bangkok/Thonburi 11.9<br />
Karachi 11.8<br />
Delhi 11.7<br />
Bogota 11.7<br />
Paris 11.3<br />
Teheran 11.3<br />
Istanbul 11.2<br />
Baghdad 11.1<br />
Osaka/Kobe 11.1<br />
London 9.9<br />
Dacca............... 9.7<br />
Chicago/northwestern<br />
Indiana 9.4<br />
Rhein/Ruhr 9.2<br />
Moscow 9.1
V. OCCUPATIONAL CHARACTERISTICS OF URBAN<br />
AND RURAL LABOUR FORCES<br />
From an ecological point <strong>of</strong> view, the study <strong>of</strong> urbanization<br />
can be regarded as a study <strong>of</strong> the spatial organization<br />
<strong>of</strong> human residence <strong>and</strong> activities, most importantly<br />
labour force activities. The visible differentiation <strong>of</strong> territory<br />
between urban <strong>and</strong> rural is actually a physical<br />
manifestation <strong>of</strong> the functional differentiation <strong>of</strong> economic<br />
activities. In a rural village economy, peasant<br />
exchanges product with peasant in the village marketplace.'<br />
There are few full-time non-agricultural specialists.<br />
This is not to say that non-agricultural activities are<br />
not performed. It is rather that these activities-<strong>of</strong>ten<br />
involving the preparation <strong>of</strong> clothing, tools, furniture<br />
etc.-are more <strong>of</strong>ten performed by the peasants themselves,<br />
in their own homes or on a highly local basis."<br />
The emergence <strong>of</strong> non-agricultural industries in modernized<br />
countries is related not so much to the inherent<br />
nature <strong>of</strong> the activities performed by the industries as<br />
to the fact that the work is pursued at locations which<br />
are spatially removed from farms.<br />
Even in a small-town economy where some specialization<br />
in non-agricultural activities exists, the seller <strong>of</strong> a<br />
product is quite <strong>of</strong>ten also its producer, <strong>and</strong> the exchange<br />
is made directly between producer <strong>and</strong> consumer on a<br />
face-to-face basis. The extent <strong>of</strong> the market for most<br />
products is only a local trade area accessible to consumers<br />
in less than one day's travel. There are some<br />
non-agricultural specialists but the division <strong>of</strong> labour is<br />
not carried very far. A consumable product may be<br />
produced by a single person working alone. Some specialization<br />
existed even in antiquity; but still the names<br />
<strong>of</strong> many <strong>of</strong> the pre-industrial occupations <strong>of</strong>ten suggested<br />
whole products or group <strong>of</strong> products-baker,<br />
cobbler, butcher, tanner, winer, miller <strong>and</strong> the various<br />
types <strong>of</strong> smiths.S Occupations in industrial societies more<br />
<strong>of</strong>ten carry the name <strong>of</strong> a specialized activity not associated<br />
with a total product, for example, welder, lathe<br />
operator, crane operator, quality control chemist, typist,<br />
computer programmer, medical technician, script writer<br />
or engineer. These specialized workers must perform in<br />
combination with many other specialists in order to provide<br />
a total product or service.'<br />
1 N. S. B. Gras, An Introduction to Economic History (New<br />
York, Harper <strong>and</strong> Brothers, 1922), p. lOS.<br />
S In a study <strong>of</strong> rural employment in tropical Africa, it was<br />
found that non-farm activities, such as trading, tailoring <strong>and</strong><br />
blacksmithing, were indeed important claimants on the time <strong>of</strong><br />
farmers <strong>and</strong> their family. The proportion <strong>of</strong> male inputs devoted<br />
to non-farm activities varied considerably from about 11 per cent<br />
in Sierra Leone to 47 per cent in the north <strong>of</strong> Nigeria, in part<br />
because <strong>of</strong> a variation m the length <strong>of</strong> the dry season when most<br />
non-farm activity tends to be concentrated. Derek Byerlee <strong>and</strong><br />
others "<strong>Rural</strong> employment in tropical Africa," African <strong>Rural</strong><br />
Employment Economy Working Paper, No. 20, Michigan State<br />
Umversity, East Lansing, Michigan, Department <strong>of</strong> Agricultural<br />
Economics, February 1977, p. 157 (mimeographed).<br />
II See, for example, the discussion by Gordon V. Childe in<br />
What Happened in History (New York, Penguin Book Co., Inc.,<br />
1946), pp. 87-88.<br />
4 As recently as 1775, when Adam Smith wrote his textbook,<br />
59<br />
•<br />
It has been suggested that multiplicity <strong>of</strong> functions is<br />
perhaps the essence <strong>of</strong> the difference between urban<br />
<strong>and</strong> rural places, <strong>and</strong> this is said to be the fundamental<br />
factor giving rise to the greater size <strong>and</strong> density <strong>of</strong> the<br />
urban places upon which so many statistical definitions<br />
are based." For if a large variety <strong>of</strong> finely divided <strong>and</strong><br />
interdependent tasks are to be performed <strong>and</strong> coordinated,<br />
they must usually be performed by large<br />
numbers <strong>of</strong> persons working within a small enough space<br />
for sufficient interaction to occur at less than prohibitive<br />
cost. Agriculture, however, cannot be spatially concentrated<br />
to a similar extent, either locally or regionally,<br />
because <strong>of</strong> l<strong>and</strong> <strong>and</strong> climatic requirements. In countries<br />
where village settlement has been historically prevalent<br />
among agricultural workers, the smaller cities may still<br />
contain a significant proportion <strong>of</strong> population engaged<br />
in agriculture. In no country, however, are agricultural<br />
workers prevalent in large cities, except where the boundaries<br />
<strong>of</strong> the cities are delineated in such a way that<br />
much peripheral l<strong>and</strong> under cultivation is included within<br />
the city limits for administrative purposes.<br />
The spatial dispersal <strong>of</strong> agriculture Prohibits an extreme<br />
degree <strong>of</strong> specialization or bureaucratization, <strong>and</strong><br />
as a result the percentage <strong>of</strong> workers in non-agricultural<br />
pursuits has <strong>of</strong>ten been considered an index <strong>of</strong> modernization.<br />
It is true that agriculture in modernized countries<br />
is more rationally organized than agriculture elsewhere,<br />
<strong>and</strong> the differences between agricultural <strong>and</strong> urban<br />
life are greatly reduced. However, problems dictated<br />
by spatial imperatives cannot be entirely eliminated.<br />
Consumer services such as fire brigades <strong>and</strong> police forces,<br />
public transportation, education <strong>and</strong> medical services are<br />
especially difficult to organize in a spatially dispersed<br />
rural environment. This is, perhaps, why the occupation<br />
<strong>of</strong> farming has traditionally been learned at home rather<br />
than in formally organized educational institutions.<br />
Moreover, public expectations with regard to the quality<br />
<strong>and</strong> quantity <strong>of</strong> consumer services provided on a local<br />
basis are rising rapidly because <strong>of</strong> technical advances<br />
achieved in the major cities.<br />
The growth <strong>of</strong> transportation <strong>and</strong> communications has<br />
facilitated the non-local organization <strong>of</strong> work activities.<br />
Organization implies contact. Although transportation<br />
has increased opportunities for direct face-to-face contacts,<br />
the telephone <strong>and</strong> other forms <strong>of</strong> electronic transmission<br />
have increasingly provided the means for exchange<br />
<strong>of</strong> information without face-to-face contact, thus<br />
the idea <strong>of</strong> the division <strong>of</strong> labour <strong>and</strong> its advantages appear to<br />
have been so little recognized that considerable explanation was<br />
required. It was in this regard that he <strong>of</strong>fered hIS famous example<br />
<strong>of</strong> the pin factory in which 10 men working together<br />
with a division <strong>of</strong> labour could produce approximately 48,000<br />
pins per day while a single man working alone might not be able<br />
to produce even one pm in a day. Adam Smith, The Wealth<br />
<strong>of</strong> Nations, book I, chap. I.<br />
5 Demographic Yearbook, 1972 (United Nations publication,<br />
Sales No. E/F.73.XIll.I).
exp<strong>and</strong>ing greatly the-possible scale <strong>and</strong> complexity <strong>of</strong><br />
non-local organization. Detailed co-ordination <strong>of</strong> activities<br />
occurring at widely distant locations gradually<br />
became a reality as networks <strong>of</strong> telecommunications<br />
rapidly spread to even the most remote localities. The<br />
widespread dispersal <strong>of</strong> telecommunications minimized<br />
the necessity for spatial structuring <strong>of</strong> settlements, since<br />
activities in remote localities, or even in ships at sea,<br />
could be co-ordinated <strong>and</strong> brought within the scope <strong>of</strong><br />
modem enterprise organization.<br />
Transportation development has been an extremely<br />
important factor both in the growth <strong>of</strong> cities <strong>and</strong> in the<br />
arrangement <strong>of</strong> their internal structure. The proliferation<br />
<strong>of</strong> railways in Europe <strong>and</strong> Northern America during the<br />
second half <strong>of</strong> the nineteenth century is said to have<br />
been largely responsible for the increased concentration<br />
<strong>of</strong> population <strong>and</strong> employment in large cities. The larger<br />
cities gained at the expense <strong>of</strong> smaller, <strong>and</strong> the smaller<br />
cities became increasingly dependent upon the largest<br />
city in the vicinity. This development was largely due to<br />
the geometry <strong>of</strong> railways. An evenly dispersed square<br />
grid system <strong>of</strong> railways which would give more equal<br />
advantage to all geographical locations is too costly.<br />
Instead, the railways were constructed in wagon-wheel<br />
configurations centred around a single metropolis which<br />
tended to grow at the expense <strong>of</strong> other surrounding<br />
cities. These outer cities were then wedded to the central<br />
city with "b<strong>and</strong>s <strong>of</strong> steel","<br />
At the same time that railways were concentrating<br />
ever more population <strong>and</strong> employment in large cities,<br />
power elevators were being introduced into large cities<br />
to facilitate spatial concentration in the third dimension<br />
through vertical transportation. As early as the 1860s,<br />
visitors were impressed by the elevators <strong>of</strong> New York City<br />
hotels. At first, these devices were hydraulic <strong>and</strong> were<br />
limited to a height <strong>of</strong> 18 or 20 storeys. To be liberated<br />
from this ceiling in height, architecture needed the electric<br />
elevator, which was introduced in the late 1880s.<br />
The electric elevator, together with the development <strong>of</strong><br />
cast-iron <strong>and</strong> steel-skeleton construction frames, made<br />
possible the construction <strong>of</strong> skyscrapers. The first very<br />
high structure <strong>of</strong> cast-iron <strong>and</strong> steel was completed in<br />
1889 in Paris: the Eiffel Tower, rising to almost 1,000<br />
feet above the ground, as high as the Empire State Building<br />
constructed in New York City half a century later.<br />
As skyscrapers began to proliferate in large city business<br />
districts, <strong>of</strong>fice types <strong>of</strong> employment began to locate in<br />
these areas <strong>and</strong> there developed an <strong>of</strong>fice industry.' In<br />
contrast to older types <strong>of</strong> urban service employment<br />
which were heavily weighted with personal service occupations,<br />
the service employment located in skyscrapers<br />
<strong>of</strong>ten comprises business services <strong>of</strong>fered to the largest<br />
<strong>of</strong> modern national <strong>and</strong> multinational bureaucracies.<br />
Much <strong>of</strong>fice industry in larger cities today is actually<br />
basic economic activity in the sense that much <strong>of</strong> the<br />
6 Adna Ferris Weber, The <strong>Growth</strong> oj Cities in the Nineteenth<br />
Century, 2nd ed. (Ithaca, New York, Cornell University Press,<br />
1963), pp. 200·202. This work was originally published in 1899<br />
for Columbia University (by the Macmillan Company, New<br />
York), as volume XI <strong>of</strong> Studies in History, Economics <strong>and</strong><br />
Public Law.<br />
7 Jean Gottmann, "The skyscraper amid the sprawl", in Jean<br />
Gottmann <strong>and</strong> Robert A. Harper, OOs., Metropolis on the Move<br />
(New York, John Wiley <strong>and</strong> Sons, 1967) pp. 127-138. See also<br />
Homer Hoyt, According to Hoyt (Washington, D.C., Homer<br />
Hoyt Associates 1970), p. 46; <strong>and</strong> the discussion <strong>of</strong> vertical<br />
expansion in R: D. McKenzie, The Metropolitan Community<br />
(New York, Russell <strong>and</strong> Russell, 1933; 1967 ed.), p. 221-225.<br />
60<br />
service output is non-locally consumed. As smaller firms<br />
are integrated into larger conglomerates, managements<br />
are consolidated <strong>and</strong> this process <strong>of</strong>ten results in reductions<br />
in local staff <strong>and</strong> increases in headquarters staff<br />
which require central location."<br />
For reasons that are still not clearly understood, it<br />
appears that the initial stages <strong>of</strong> industrial development<br />
<strong>of</strong> the old industrial countries, such as Engl<strong>and</strong>, France<br />
<strong>and</strong> the United States <strong>of</strong> America, occurred at lower<br />
levels <strong>of</strong> urbanization than comparable industrial development<br />
in the more recently developed economies, such<br />
as Japan <strong>and</strong> the Soviet Union." The currently less<br />
developed countries, which are only at early stages <strong>of</strong><br />
development, are experiencing even higher levels <strong>of</strong><br />
urbanization at low levels <strong>of</strong> development. These countries<br />
are sometimes referred to as "over-urbanized" in<br />
relation to degree <strong>of</strong> economic development.'?<br />
In a previous United Nations study," a comparison<br />
was made between an urbanization indicator (the percentage<br />
<strong>of</strong> population in urban areas) <strong>and</strong> an economic<br />
indicator (the percentage <strong>of</strong> gross domestic product derived<br />
from agriculture) in Sweden at each decade after<br />
1870, with values <strong>of</strong> the same two indicators around<br />
1960 for 14 less developed countries. In 12 <strong>of</strong> the 14<br />
countries, the economic indicator lagged behind the level<br />
<strong>of</strong> urbanization. In India, for example, the level <strong>of</strong> urbanization<br />
around 1960 was roughly equivalent to the urbanization<br />
level <strong>of</strong> Sweden during the first decade <strong>of</strong> this<br />
century, but the economic indicator for India was some<br />
30 years behind, being equivalent to Sweden during the<br />
1870s. In Brazil, Morocco <strong>and</strong> Mexico, the economic<br />
indicator was some 35-40 years behind the urbanization<br />
level. It is elsewhere argued," similarly, that Asia, which<br />
was about 13 per cent urban in 1950, was overurbanized<br />
in relation to its level <strong>of</strong> economic development<br />
since its proportion <strong>of</strong> non-agricultural labour force<br />
(30 per cent) was low in relation to that <strong>of</strong> the United<br />
States (1850s), France (1860s), Germany (1880s) <strong>and</strong><br />
Canada (1890s) which had approximately 55 per cent<br />
<strong>of</strong> their labour force engaged in non-agricultural occupations<br />
at the time when they were at the 1950 level <strong>of</strong><br />
urbanization in Asla.><br />
One could speculate that perhaps technological ad-<br />
8 Edgar M. Hoover, An Introduction to Regional Economics<br />
(New York, Alfred A. Knopf, 1971), pp. 332, 346 <strong>and</strong> 348.<br />
9 Economic Commission for Asia <strong>and</strong> the Far East Secretariat,<br />
"Economic causes <strong>and</strong> implications <strong>of</strong> urbanization in the recent<br />
experience <strong>of</strong> countries in Asia <strong>and</strong> the Far East", in Philip M.<br />
Hauser, ed., <strong>Urban</strong>ization in Asia <strong>and</strong> the Far East (Calcutta,<br />
UNESCO, 1957), p. 133.<br />
10 See, for example, ibid.; <strong>and</strong> Kingsley Davis <strong>and</strong> Hilda Hertz<br />
Golden, in P. H. Hauser, ed. op. cit. For a critique <strong>of</strong> this<br />
concept, see N. V. Sovani, "The analysis <strong>of</strong> 'over-urbanization' ",<br />
Economic <strong>Development</strong> <strong>and</strong> Cultural Change, vol. 12, No. 2<br />
(January 1964), pp. 322-30.<br />
11 "<strong>Urban</strong>ization <strong>and</strong> economic <strong>and</strong> social change", prepared<br />
by the <strong>Population</strong> Division <strong>of</strong> the United Nations Secretariat in<br />
collaboration with Sidney Goldstein, International Social <strong>Development</strong><br />
Review, No.1 (United Nations publication, Sales No.<br />
E.68.VI.l), p. 27 <strong>and</strong> fig. VI.<br />
12 Bert F. Hoselitz, "<strong>Urban</strong>ization <strong>and</strong> economic growth in<br />
Asia", Economic <strong>Development</strong> <strong>and</strong> Cultural Change, vol. 6<br />
(October 1957), p. 44.<br />
13 In a study <strong>of</strong> economic <strong>and</strong> urbanization variables related<br />
to development, Hazel Moir concludes that neither urbanization<br />
level nor relationships between urbanization level <strong>and</strong> the industrial<br />
structure <strong>of</strong> the labour force have any effect on subsequent<br />
levels <strong>of</strong> economic development. See her "Dynamic relationships<br />
between labor force structure, urbanization, <strong>and</strong> development",<br />
Economic <strong>Development</strong> <strong>and</strong> Cultural Change, vol. 26,<br />
No. 1 (October 1977),p. 40.
secondary <strong>and</strong> tertiary sectors. Early consumer budget<br />
studies demonstrated that poor families spend a larger<br />
proportion <strong>of</strong> their income on food than do more affluent<br />
families. Likewise, a larger proportion <strong>of</strong> the labour<br />
force <strong>of</strong> poorer countries is engaged in agriculture than<br />
in rich countries. The human capacity to eat is more<br />
limited than the capacity to exp<strong>and</strong> incomes. Appetites<br />
for food are relatively easily satiated as incomes rise."<br />
After food, it appears that needs for other material goods<br />
are next to be met when sufficient income is available.<br />
It is believed, however, that even the desires for material<br />
goods can approach satiation at high levels <strong>of</strong> income.<br />
After all, there are storage limitations for tangible goods,<br />
particularly in urban areas where modem populations<br />
tend increasingly to live. Thus, at high levels <strong>of</strong> income<br />
it is believed that tastes will tum increasingly to the<br />
intangible services <strong>of</strong> the tertiary sector <strong>and</strong> increasing<br />
proportions <strong>of</strong> labour force will become engaged in this<br />
sector."<br />
The second type <strong>of</strong> consideration that has led to<br />
development models <strong>of</strong> the Clark-Fisher type relates to<br />
the technology <strong>of</strong> supply. The earliest labour-displacing<br />
technological developments were those <strong>of</strong> the agricultural<br />
revolution which released much labour force from<br />
the l<strong>and</strong> to live in the cities <strong>and</strong> resulted in a commercialized<br />
agriculture to feed the growing city populations.<br />
A substantial proportion <strong>of</strong> the displaced agricultural<br />
labour force became absorbed in manufacturing in the<br />
cities. Eventually, however, industrial technology has<br />
been increasingly automated to the point where the labour<br />
force is again being displaced <strong>and</strong> the relative proportion<br />
<strong>of</strong> the labour force in services is rising.<br />
Essentially, however, these two types <strong>of</strong> considerations<br />
have been merely mutually reinforcing aspects <strong>of</strong> a single<br />
historical process. In the modem sense, an increase in<br />
national income is an improvement in labour-saving<br />
technology which permits a greater output per capita<br />
from existing resources. Technological advances, however,<br />
tend to occur first in activities for which there is<br />
greatest dem<strong>and</strong>. The essence <strong>of</strong> technological advancement<br />
is not discovery but implementation. Historical<br />
records are full <strong>of</strong> antecedents to modem machines<br />
.which were never implemented. Implementation usually<br />
occurs in response to dem<strong>and</strong>." This is perhaps why<br />
technological improvements occurred first in agriculture,<br />
later in manufacturing <strong>and</strong> only recently in services.<br />
25 Adam Smith put it this way: "The desire <strong>of</strong> food is limited<br />
in every man by the narrow capacity <strong>of</strong> the human stomach;<br />
but the desire <strong>of</strong> conveniences <strong>and</strong> ornaments <strong>of</strong> building, dress,<br />
equipage, <strong>and</strong> household furniture seems to have no limit or<br />
certain boundary." Op. cit., book I, chap. XI, part II.<br />
26 Early economists believed that only agricultural activity<br />
was "productive". Given the low levels <strong>of</strong> income prevailing<br />
in those days, such an evaluation was probably relevant since<br />
food is the most urgent human necessity <strong>and</strong> at low levels <strong>of</strong><br />
income many other items are unnecessary luxuries. Later in the<br />
development <strong>of</strong> economic thought, it was admitted that manufacturing<br />
activities could be "productive" <strong>and</strong> today it is<br />
generally admitted that services can also be productive.<br />
21 This is not to deny that there are individual instances in<br />
which technological break-throughs appear to have precipitated<br />
increased dem<strong>and</strong>. Such a circumstance can occur in the case<br />
<strong>of</strong> a price-elastic product, i.e., a product in which sales are<br />
highly responsive to price changes. The most outst<strong>and</strong>ing examples<br />
have been new products, such as calculators <strong>and</strong> television,<br />
at early stages <strong>of</strong> development. Technological advances in these<br />
products resulted in substantial price reductions which stimulated<br />
increased dem<strong>and</strong> as well as employment in these industries.<br />
In the long run, however, one can expect that once a maximum<br />
level <strong>of</strong> dem<strong>and</strong> has been met, further labour-saving technological<br />
advances will result in labour displacement.<br />
62<br />
But each time a technological advance is implemented,<br />
a new increment <strong>of</strong> income is thereby generated <strong>and</strong> with<br />
it further dem<strong>and</strong> which eventually absorbs the labour<br />
displaced by labour-saving technology-unless, <strong>of</strong><br />
course, some market imperfection intervenes.<br />
At its initial stages <strong>of</strong> invention, mechanized industrial<br />
technology was labour-intensive, rather than capitalintensive<br />
as it is today. Moreover, the work involved<br />
was mainly manual, rather. than mechanical. Workers<br />
were actually referred to as "h<strong>and</strong>s". According to the<br />
description <strong>of</strong> Adam Smith, a contemporary <strong>of</strong> prenineteenth<br />
century economic development writing in<br />
1775, much <strong>of</strong> the economic benefit <strong>of</strong> that day was<br />
derived more from the mere division <strong>of</strong> human labour<br />
rather than from the application <strong>of</strong> the very simple<br />
machines <strong>of</strong> the day. According to Smith, it was mere<br />
specialization within the group context <strong>of</strong> a common<br />
workhouse that brought with it invention <strong>of</strong> more powerful<br />
technology. Persons specialized in a specific, repetitive<br />
activity tend to notice opportunities for slight improvements<br />
in technology which can have large pay-<strong>of</strong>fs<br />
in increased output, even in the short run. 28 He notes<br />
that a large proportion <strong>of</strong> the simple machines utilized<br />
at that time in manufactures where labour was most<br />
subdivided were originally the inventions <strong>of</strong> the workmen<br />
themselves.w<br />
By the time Weber wrote at the end <strong>of</strong> the nineteenth<br />
century, more than a century after Smith, conditions in<br />
the more developed countries had changed remarkably,<br />
though they were still antiquated by the most modem<br />
st<strong>and</strong>ards. Industry had become significantlyless labourintensive<br />
<strong>and</strong> sufficient capital had been accumulated so<br />
that these countries could enjoy full employment within<br />
the context <strong>of</strong> a somewhat capital-intensive technology<br />
<strong>of</strong> manufacture. By comparison with current st<strong>and</strong>ards,<br />
the more developed countries at that time could be said<br />
to have been at a middle level <strong>of</strong> development. Yet even<br />
then, Weber (writing in 1899) was led to the observation<br />
that "manufacturing in a country where it has reached<br />
a stage <strong>of</strong> self-sufficiency employs a constant or even<br />
declining proportion <strong>of</strong> the population".30 This conclusion<br />
was derived from statistical evidence concerning the<br />
pattern <strong>of</strong> employment in Europe during the last half<br />
<strong>of</strong> the nineteenth century. By 1933, the advanced countries<br />
were described as then on the "threshold" <strong>of</strong> a<br />
28 Here it is only necessary to quote Adam Smith's own al.'ooryphal<br />
account <strong>of</strong> the process by which such a specialized<br />
worker made an important technological discovery:<br />
"In the earliest fire-engines (steam engines), a boy was constantly<br />
employed to 0een <strong>and</strong> shut alternately the communication<br />
between the boiler <strong>and</strong> the cylinder, according as the<br />
piston either ascended or descended. One <strong>of</strong> those boys, who<br />
loved to play with his companions, observed that, by tying a<br />
string from the h<strong>and</strong>le <strong>of</strong> the valve which opened this communication<br />
to another part <strong>of</strong> the machine, the valve would<br />
open <strong>and</strong> shut without his assistance, <strong>and</strong> leave him at liberty<br />
to divert himself with his play-fellows. One <strong>of</strong> the greatest<br />
improvements that has been made upon this machine, since<br />
it was first invented, was in this manner the discovery <strong>of</strong> a<br />
boy who wanted to save his own labour."<br />
Op, cit., book I, chap. I.<br />
29 Ibid.<br />
30 A. F. Weber, op. cit., p. 228. It has been observed that in<br />
Great Britain, the ratio <strong>of</strong> numbers enga¥ed in manufacturing<br />
to the entire working population (excluding those engaged in<br />
agriculture <strong>and</strong> mining) rose to a maximum in 1851 <strong>and</strong> declined<br />
thereafter despite the need <strong>of</strong> the country to produce<br />
manufactured goods for exportation in exchange for its imports<br />
<strong>of</strong> food <strong>and</strong> raw materials. See Colin Clark, "The economic<br />
functions <strong>of</strong> a city in relation to its size", Econometrica, vol. 13,<br />
No.2 (April 1945), p, 98.
tertiary stage <strong>of</strong> economy in which the problems <strong>of</strong> production<br />
in manufacturing had been solved <strong>and</strong> there<br />
would be opportunity to devote an increasing amount <strong>of</strong><br />
effort to services."<br />
It was concluded from an analysis <strong>of</strong> long-term time<br />
series data for developed countries ranging from pretwentieth<br />
century to mid-twentieth century that in most<br />
countries the relative rise in the share <strong>of</strong>. the industry<br />
sector in labour force was significantly smaller than the<br />
relative rise in its share in total product," reflecting undoubtedly<br />
increasingly labour-saving technology in this<br />
sector. Conversely in the service sector, he noted rising<br />
shares in labour force <strong>and</strong> constant or declining shares<br />
in countrywide product.<br />
Colin Clark provides abundant time-series data for<br />
the developed countries in support <strong>of</strong> his view that in<br />
the course <strong>of</strong> past economic development industrial employment<br />
has displaced agricultural employment <strong>and</strong><br />
service employment, in tum, has continuously displaced<br />
industrial employment.3S In examining similar time series<br />
for less developed countries in which these data are available,<br />
however, Sabolo reaches the conclusion that the<br />
process Clark observed in the currently more developed<br />
countries has only partial relevance to conditions in the<br />
less developed countries." In these latter countries, the<br />
secondary, or manufacturing, sector has not been as important<br />
as a middle phase in economic development in<br />
the past because <strong>of</strong> the low levels<strong>of</strong> investment in manufacturing<br />
industry, <strong>and</strong> it will not playas large a part in<br />
the present or future because contemporary industrial<br />
technology is now capital-intensive rather than labourintensive,<br />
as it was in the past. At the time in the past<br />
whenmanufacturing technologywas stilllabour-intensive<br />
the less developed countries were still primarily agricultural,<br />
with little investment in secondary activitiesexcept<br />
for h<strong>and</strong>icrafts. Even at the beginning <strong>of</strong> the twentieth<br />
century, a larger proportion <strong>of</strong> the labour force was<br />
absorbed by the tertiary sector than the secondary sector<br />
in almost all <strong>of</strong> the developing countries considered.85<br />
Moreover, a very high negative correlation has been observed<br />
at the beginning <strong>of</strong> the century, between shares<br />
<strong>of</strong> employment in the primary <strong>and</strong> tertiary sector, which<br />
implies that it was mainly from the primary to the ter-<br />
31 A. G. B. Fisher, loco cit., p. 380. For a list <strong>of</strong> advanced<br />
countries currently containing more than 50 \,er cent <strong>of</strong> their<br />
labour force in service employments, see David H. Freedman,<br />
"Employment perspectives in industrialized market economy<br />
countries", International Labour Review, vol. 117, No. I, p. 8.<br />
32 Simon Kuznets, Modern Economic <strong>Growth</strong>: Rate, Structure<br />
<strong>and</strong> Spread (New Haven, Connecticut, Yale University Press,<br />
1966), pp. 110 <strong>and</strong> 146-149.<br />
33 C. Clark, The Conditions <strong>of</strong> Economic Progress.<br />
34 Yves Sabolo, The Service Industries (Geneva, International<br />
Labour Office, 1975). pp. 16-18. See also W. Paul Strassman,<br />
"Construction productivity <strong>and</strong> employment in developing countries",<br />
International Labour Review, vol. 101, No.5 (May 1970),<br />
p, 521; <strong>and</strong> Paul Bairoch, <strong>Urban</strong> Unemployment in Developing<br />
Countries (Geneva, International Labour Office, 1973), pp, 11-13.<br />
35 According to Bairoch, fully 20 per cent <strong>of</strong> the labour force<br />
in the less developed countries was engaged in services in 1970<br />
as against only 13 per cent in industry. Op, cit., p, 11. Statistics<br />
documenting the deficiency in manufacturing industry in South<br />
Asia are provided in Gunnar Myrdal, Asian Drama (New York,<br />
Pantheon, 1968), vol. I, p. 505. Turnham has assembled some<br />
data which tend to indicate that nineteenth-century industry in<br />
the currently more developed countries was more important in<br />
relation to services than it is in the less developed countries <strong>of</strong><br />
the twentieth century. David Turnham, The Employment Problem<br />
in Less Developed Countries: A Review <strong>of</strong> Evidence, <strong>Development</strong><br />
Centre Studies, Employment Series No. 1 (paris,<br />
Organization for Economic Co-operation <strong>and</strong> <strong>Development</strong>,<br />
1971).<br />
63<br />
tiary sector that transfers <strong>of</strong> employment occurred"<br />
Inspection <strong>of</strong> more recent data indicates that although<br />
the share <strong>of</strong> employment in the primary sector bas<br />
shrunk significantly, the secondary sector has shownlittle<br />
capacity to absorb the growth in non-primary labour<br />
force in most <strong>of</strong> the less developed countries. The share<br />
<strong>of</strong> secondary employment in total employment has increased<br />
by only 4-5 per cent in most <strong>of</strong> these countries,<br />
while the share <strong>of</strong> the tertiary sector has become very<br />
important, varying between 30 <strong>and</strong> 50 per cent." Implicit<br />
in the transfers from primary to tertiary employment<br />
is heavy rural-to-urban migration, as service<br />
employments are mainly available in the cities.<br />
The shortfall <strong>of</strong> industrial employment in Latin<br />
America has been demonstrated in relation to several<br />
<strong>of</strong> the more developed countries at past dates when they<br />
were at similar levels <strong>of</strong> non-agricultural employment.88<br />
In 1969, when agricultural labour force represented 42<br />
per cent <strong>of</strong> the total labour force <strong>of</strong> Latin America, only<br />
31 per cent <strong>of</strong> its non-agricultural labour force was engaged<br />
in industry. By contrast, when the percentage <strong>of</strong><br />
agricultural employment stood at 42 per cent in some <strong>of</strong><br />
the more developed countries the percentage <strong>of</strong> nonagricultural<br />
employment in industry was as follows:<br />
United States (1890) 48 per cent; France (1921) 57<br />
per cent; Sweden (1924) 60 per cent; Italy (1950) 52<br />
per cent.<br />
A comparative study <strong>of</strong> recent time trends in 15 Latin<br />
American countries also finds that the middle stage <strong>of</strong><br />
high secondary type employment was apparently being<br />
bypassed." In contrast, there appeared to be a strong<br />
movement <strong>of</strong> employment from the primary sector into<br />
the tertiary sector. For the group <strong>of</strong> countries as a<br />
whole, almost the entire decline in primary employment<br />
(5.9 percentage points) was taken up in increased tertiary<br />
employment (4.2 percentage points). The secondary<br />
sector showed little change, on average, with about<br />
half the countries increasing <strong>and</strong> half decreasing." Inspection<br />
<strong>of</strong> the same trend data for males <strong>and</strong> females<br />
listed separately, however, revealed that males were<br />
experiencing increases in seco-ndary employment in most<br />
<strong>of</strong> the countries, as the Clark-Fisher hypothesis predicts.<br />
The net shift <strong>of</strong> total labour force into tertiary employments<br />
appeared to be heavily influenced by increases in<br />
female employment in the tertiary sector. Thus, in addition<br />
to the two types <strong>of</strong> considerations relating to the<br />
Clark-Fisher hypothesis which were discussed earlier<br />
(income elasticity <strong>of</strong> dem<strong>and</strong> <strong>and</strong> labour-displacing<br />
technology) the sex composition <strong>of</strong> the labour <strong>of</strong>fered<br />
may, itself, be a factor influencing the composition <strong>of</strong><br />
the total employed labour force."<br />
Whatever may have been the past sequence <strong>of</strong> development<br />
in the more developed <strong>and</strong> the less developed<br />
countries, it is clear that future expansion <strong>of</strong> employment<br />
is likely to include increasing proportions <strong>of</strong><br />
services. At least in the more developed countries, one<br />
36 Sabolo, op, cit., pp. 15-23.<br />
37 Ibid.<br />
36 Raul Prebisch, Change <strong>and</strong> <strong>Development</strong>-Latin Americus<br />
Great Task, report submitted to the Inter-American <strong>Development</strong><br />
Bank (New York, Praeger, 1971), p. 33.<br />
39 J. R. Ramos, op. cit.<br />
40 This pattern <strong>of</strong> development without a secondary stage was<br />
confirmed in a long-run time series dating back to 1920 <strong>and</strong><br />
earlier for five countries <strong>of</strong> Latin America. J. R. Ramos, op, cit.<br />
41 Further discussion <strong>of</strong> female participation in services is<br />
contained in chapter VI, which is devoted to women in the labour<br />
force.
great variety <strong>of</strong> economic activities, ranging from pr<strong>of</strong>essional<br />
pursuits dem<strong>and</strong>ing high skill <strong>and</strong> large investment<br />
in training to domestic service <strong>and</strong> other unskilled<br />
personal services; from activities with large capital investment,<br />
such as residential housing, to those requiring<br />
no material capital; from pursuits closely connected with<br />
the private market, such as trade, banking <strong>and</strong> related<br />
financial <strong>and</strong> business services, to government activities,<br />
including defence, in which market considerations are<br />
limited.51 The service industries have been called a<br />
"promiscuous ensemble".52<br />
The question <strong>of</strong> service versus industrial employment<br />
has usually been formulated in previous studies in terms<br />
<strong>of</strong> the industry classification<strong>of</strong> economic activities. There<br />
have been relatively few international studies <strong>of</strong> occupations."<br />
An effort has been made in the present study to<br />
approach the question <strong>of</strong> agricultural, service <strong>and</strong> industrial<br />
employment using occupational data. For this<br />
purpose, a three-way classification <strong>of</strong> occupations into<br />
agriculture, industry <strong>and</strong> services similar to the industrial<br />
scheme <strong>of</strong> classification has been made. The general<br />
criterion <strong>of</strong> tangible versus intangible individual output<br />
has been used to distinguish between industrial occupations<br />
<strong>and</strong> service occupations among the major International<br />
Labour Organisation (ILO) categories <strong>of</strong><br />
occupations as shown in the list below.54 An exception<br />
had to be made in the case <strong>of</strong> transportation equipment<br />
operators, who produce a non-material output <strong>and</strong><br />
would thus qualify as a service category according to the<br />
classification scheme used here, but who in the ILO<br />
classification are grouped with the industry type <strong>of</strong> oc-<br />
bia University Press, 1968), pp. 14-15. As Fuchs observes, even<br />
within the work <strong>of</strong> a single author, variations in definition are<br />
evident. Kuznets included transportation, communications <strong>and</strong><br />
public utilities in the service sector in much <strong>of</strong> his early work,<br />
but excluded them in a later study. Compare Simon Kuznets,<br />
"Quantitative aspects <strong>of</strong> the economic growth <strong>of</strong> nations; III,<br />
Industrial distribution <strong>of</strong> income <strong>and</strong> labor force by states,<br />
United States 1919-21 to 1955", Economic <strong>Development</strong> <strong>and</strong><br />
Cultural Change, vol. 6, No. 4 (July 1958), with his Modern<br />
Economic <strong>Growth</strong>.<br />
51 This discussion was drawn directly from S. Kuznets, Modern<br />
Economic <strong>Growth</strong>, p. 143. Kuznets continues: "They [the<br />
services] have one basic feature in common: none <strong>of</strong> the activi-.<br />
ties represents in any significant way the production <strong>of</strong> commodities;<br />
each renders a product that is intangible <strong>and</strong> not easily<br />
embodied in a lasting <strong>and</strong> measurable form". (Brackets added).<br />
52 George J. Stigler. Trends in Employment in the Service<br />
Industries (Princeton. New Jersey, Princeton University Press<br />
National Bureau <strong>of</strong> Economic Research, 1956), p. 166.<br />
53 Existing comparative international studies <strong>of</strong> occupations<br />
include the following: "The world's working population: its distribution<br />
by status <strong>and</strong> occupation", International Labour Review,<br />
vol. LXXIV, No.2 (August 1956), pp. 174-192; Abdelmegid<br />
M. Farrag, "The occupational structure <strong>of</strong> the labour<br />
force: patterns <strong>and</strong> trends in selected countries", <strong>Population</strong><br />
Studies, vol. XVIII, No.1 (July 1964), pp, 17-34; <strong>and</strong> idem, "The<br />
value <strong>of</strong> occupation-industry data for forecasting purposes",<br />
International Labour Review, vol. 95, No.4 (April 1967), pp.<br />
327-353.<br />
54 The present classification <strong>of</strong> service occupations resembles<br />
the category <strong>of</strong> "tertiary occupations" described by Manuel<br />
Diegues Junior to include-in addition to traditional servicestransport,<br />
sales, banking, educational <strong>and</strong> health services. See<br />
his "<strong>Urban</strong> employment in Brazil", International Labour Review,<br />
vol. 93, No.6 (June 1966), p. 645. A variety <strong>of</strong> service categories<br />
are mentioned in Bhalla's comparative study <strong>of</strong> services in two<br />
countries, including commerce, government, business, recreation,<br />
banking <strong>and</strong> financial, personal domestic, education, health <strong>and</strong><br />
pr<strong>of</strong>essional. A. S. Bhalla, "The role <strong>of</strong> services in employment<br />
expansion", International Labour Review, vol. 101, No.5 (May<br />
1970), pp. 519-539.<br />
65<br />
cupations." 'thus, the present category <strong>of</strong> "industry"<br />
comprises both those who produce goods <strong>and</strong> those who<br />
move goods. The occupational classification used in the<br />
present study is based on the 1968 revised International<br />
St<strong>and</strong>ard Classification <strong>of</strong> Occupations (ISCO)56 as<br />
follows:<br />
Agriculture<br />
(a) Major group 6: agricultural, animal husb<strong>and</strong>ry<br />
<strong>and</strong> forestry workers, fishermen <strong>and</strong> hunters;<br />
Industry<br />
(a) Major group 7/8/9: production <strong>and</strong> related<br />
workers, transport equipment operators <strong>and</strong> labourers<br />
(including miners, quarrymen, well drillers <strong>and</strong> related<br />
workers);<br />
Services<br />
(a) Pr<strong>of</strong>essional <strong>and</strong> administrative<br />
(i) Major group 0/1: pr<strong>of</strong>essional, technical<br />
<strong>and</strong> related workers;<br />
(ii) Major group 2: administrative <strong>and</strong> managerial"<br />
workers;<br />
(b) Clerical <strong>and</strong> sales<br />
(i) Major group 3: clerical <strong>and</strong> related workers;<br />
(ii): Major group 4: sales workers;"<br />
(c) Traditional services<br />
(i) Major group 5: service workers;<br />
Other <strong>and</strong> unknown59<br />
(a) Major group X: workers not classifiable by<br />
occupation;<br />
(b) Armed forces: members <strong>of</strong> the armed forces.<br />
In this study, the service sector is further broken<br />
down into three categories which serve to distinguish<br />
broadly the relative modernization <strong>of</strong>. the service categories.<br />
The pr<strong>of</strong>essional <strong>and</strong> managerial group is composed<br />
for the most part <strong>of</strong> the most modern occupations<br />
55 Although most types <strong>of</strong> transportation equipment operators<br />
are grouped with industry type occupations (major group 7/8/9)<br />
in the International Labour Organisation scheme, the following<br />
are grouped with pr<strong>of</strong>essional, technical <strong>and</strong> related workers<br />
(major group 011): aircraft pilots, navigators <strong>and</strong> fiight engineers;<br />
ships' deck <strong>of</strong>ficers <strong>and</strong> pilots; ships' engineers. Other<br />
transportation workers, such as railway station masters, transport<br />
<strong>and</strong> communications supervisors <strong>and</strong> transport conductors, are<br />
classified as clerical workers (major group 3). In the previous<br />
ISCO (1958), all transportation workers were combined in a<br />
single classification entitled "Workers in transport <strong>and</strong> communi.<br />
cation occupations".<br />
56 For a listing <strong>of</strong> the occupations included in each major<br />
groups, see International Labour Office, International St<strong>and</strong>ard<br />
Classification <strong>of</strong> Occupations, pp. 25-33.<br />
57 The category <strong>of</strong> administrative <strong>and</strong> managerial workers is<br />
rather narrowly defined <strong>and</strong> appears to include primarily public<br />
employees rather than managers in private industry. An attempt<br />
is made to exclude supervisory personnel in charge <strong>of</strong> a group<br />
<strong>of</strong> workers who are all in the same pr<strong>of</strong>ession, In such cases, the<br />
supervisor is classified according to the category <strong>of</strong> occupation<br />
which he supervises <strong>and</strong> not with major group 2. Examples include<br />
farm managers, who are classified with agricultural workers<br />
in major group 6; <strong>and</strong> chief chemists or senior hospital<br />
physicians, who are classified in major group 0 as pr<strong>of</strong>essional.<br />
58 The category <strong>of</strong> sales worker appears to pertain mostly to<br />
workers within retail or wholesale establishments. It is not clear<br />
whether this category would also include workers in the marketing<br />
branch <strong>of</strong> a production establishment.<br />
59 In the tables given in chapter V <strong>and</strong> VI, this category is<br />
listed as simply "unknown" since the unknown component is<br />
believed to be the largest in most countries.
which require extensive formal training in advanced<br />
technical disciplines. The second group, the sales <strong>and</strong><br />
clerical occupations, usually require some degree <strong>of</strong><br />
literacy <strong>and</strong> formal education, although sales occupations<br />
may include a considerable proportion <strong>of</strong> peddlers<br />
<strong>and</strong> street vendors, who do not require formal education.<br />
The third category <strong>of</strong> traditional service occupations do<br />
not typically require a modem education. Included in<br />
this category are such occupations as innkeepers, maids,<br />
caretakers, cooks, waiters, launderers, hairdressers, firemen<br />
<strong>and</strong> policemen.<br />
The three-way occupational classification <strong>of</strong> workers<br />
by agriculture, industry <strong>and</strong> services used in the present<br />
study differs in principle from the similar three-way industrial<br />
classification <strong>of</strong> workers used in previous<br />
studies. Workers are classified according to what they<br />
actually do as individuals in the yroduction process<br />
rather than according to the output 0 the establishments<br />
in which they work. Industrial establishments, for example,<br />
typically employ many non-production types <strong>of</strong><br />
personnel who are chiefly service personnel. These persons<br />
would include such familiar occupations as typist,<br />
bookkeeper, lawyer, engineer, personnel <strong>and</strong> administrative<br />
staff, <strong>and</strong> sales <strong>and</strong> marketing staff. These are<br />
occupations in which relatively less automation has occurred<br />
than has in the fabrication <strong>and</strong> assembly <strong>of</strong><br />
material goods. Labour force response to technical<br />
change, therefore, is not reflected entirely in establishment<br />
output by industry classification but also in the<br />
intra-establishment deployment <strong>of</strong> labour resources by<br />
occupations. Thus, the industry classification, although<br />
it answers certain critical output questions in this regard,<br />
may tend to understate the expansion <strong>of</strong> actual employment<br />
in service occupations. However, the reverse is<br />
probably not the case. There would probably be few instances<br />
<strong>of</strong> persons in industrial occupations who are<br />
engagedin serviceestablishments, since tangible products<br />
used by service establishments are normally not produced<br />
within service establishments by their own employees<br />
but rather procured through exchange in the<br />
market-place <strong>and</strong> physical shipment from place <strong>of</strong> manufacture<br />
to place <strong>of</strong> use.<br />
Because industrial <strong>and</strong> occupational classifications<br />
are <strong>of</strong>ten used to address the same issues without explicit<br />
attention being given to their differences, it is useful to<br />
examine the extent <strong>of</strong> their correspondence. This question<br />
can best be addressed by applying both classification<br />
systems to the same set <strong>of</strong> data. Of the populations<br />
providing data for this chapter, 18 were also'included in<br />
an earlier study conducted by the <strong>Population</strong> Division."<br />
This study used the st<strong>and</strong>ard ILO industrial classification<br />
(ISIC) to group workers into agricultural, industrial<br />
<strong>and</strong> services activities. The resulting industrial distribution<br />
<strong>of</strong> the labour force is compared with the occupational<br />
distributions used herein in table 24. The<br />
percentages in a particular. sector according to the two<br />
classifications are plotted in figures V-VII.61 It is evident<br />
60 "Agriculture. industry <strong>and</strong> services in the urban <strong>and</strong> rural<br />
labour force". (ESA/P/WP.57).<br />
61 In the occupational distribution, persons with unknown occupations<br />
are added to service workers; in the industrial distribution.<br />
they are prorated.<br />
TABLE 24. COMPARISON OF LABOUR FORCE DISTRIBUTION BY OCCUPATION AND BY INDUSTRY<br />
(Percentage)<br />
Proportion <strong>of</strong><br />
Proportion <strong>of</strong> total labour total labour<br />
Proportion <strong>of</strong> total labour<br />
force In agriculture force In Industry force In services<br />
By occupation<br />
By By By By By +<br />
Country Year Industry occupation Industry occupation Industry UnknIJwn Unknown<br />
Africa<br />
Algeria 1966 51.8 45.9 17.4 21.1 30.8 20.0 33.1<br />
Asia<br />
India 1961 72.3 72.9 11.7 15.9 16.0 11.0 11.2<br />
Indonesia 1971 63.2 59.6 9.7 11.8 27.1 22.7 28.7<br />
Iran 1956 56.3 55.5 20.1 22.6 23.6 18.2 21.8<br />
Japan 1960 32.8 32.6 29.7 32.7 37.5 34.2 34.7<br />
1965 24.6 24.5 32.6 34.9 42.8 40.0 40.5<br />
1970 19.3 19.2 34.7 36.5 46.0 43.8 44.3<br />
Sri Lanka 1953 52.9 51.3 12.7 16.3 34.4 30.3 32.4<br />
Turkey 1960 74.9 78.0 9.8 12.4 15.3 9.6 9.6<br />
Latin America<br />
Nicaragua 1963 59.6 58.9 16.2 18.9 24.2 21.9 22.2<br />
Northern America<br />
United States<br />
<strong>of</strong> America 1950<br />
1960<br />
1970<br />
12.4<br />
6.7<br />
3.7<br />
11.9<br />
6.7<br />
3.0<br />
35.1<br />
35.4<br />
34.4<br />
39.7<br />
35.6<br />
35.0<br />
52.5<br />
57.8<br />
61.9<br />
47.0<br />
52.8<br />
58.0<br />
48.3<br />
57.7<br />
62.0<br />
Europe<br />
Greece 1961 53.9 53.7 19.2 22.1 26.9 20.4 24.1<br />
Portugal 1960 43.6 43.4 28.9 31.4 27.5 24.2 25.3<br />
Romania 1956 69.6 68.7 16.7 16.3 13.7 14.9 14.9<br />
1966 57.1 55.4 24.6 25.9 18.2 18.7 18.7<br />
Spain 1960 39.7 39.5 28.7 31.5 31.6 23.9 28.9<br />
Source: "Agriculture, industry <strong>and</strong> services in the urban <strong>and</strong> rural labour force" (ESA/<br />
P IWP.57), Annex II.<br />
66
that the two classification systems yield highly comparable<br />
figures, particularly for the agricultural labour<br />
force. The industrial labour force according to ISIC<br />
tends to fall a few percentage points short <strong>of</strong> that produced<br />
by ISCO. The situation is reversed for the service<br />
sector. Some <strong>of</strong> these disparities are attributable to the<br />
different treatment <strong>of</strong> transportation equipment operators,<br />
who are grouped with industry in the occupational<br />
classification <strong>and</strong> with services in the industrial classification.<br />
But the small discrepancies should not obscure<br />
the fact that the distributions produced by the independent<br />
application <strong>of</strong> two alternative classificationsystems<br />
are extremely highly correlated. Generalizations about<br />
the three sectors that are reached in this chapter would<br />
certainly be applicable in the main to an analysis based<br />
on the industrial classification.<br />
Flgure v. Comparison <strong>of</strong> percentage <strong>of</strong> total labour force In<br />
agriculture by Industrial <strong>and</strong> occupational classUicatioDS<br />
70<br />
10<br />
10<br />
30<br />
20<br />
10<br />
30<br />
10<br />
C. DATA<br />
The data used in this study are taken primarily from<br />
national census publications, with occasional reliance<br />
on sample surveys. Data were utilized only when an<br />
urban/rural occupational breakdown by sex was available.<br />
Occasionally, requisite information was extracted<br />
from various issues <strong>of</strong> the Demographic Yearbook; <strong>and</strong><br />
the information base was also supplemented by a special<br />
national inquiry undertaken for purposes <strong>of</strong> this study<br />
by the United Nations Statistical Office. In searching<br />
through census publications, an attempt was made to<br />
ensure broad geographical representation <strong>of</strong> the populations<br />
included. This attempt was largely successful,<br />
with the notable exception <strong>of</strong> sub-Saharan Africa, where<br />
only a h<strong>and</strong>ful <strong>of</strong> populations provided any data, some<br />
<strong>of</strong> whichhad to be excluded for various reasons.<br />
A variety <strong>of</strong> criteria were applied to a set <strong>of</strong> data before<br />
it was admitted into the final set <strong>and</strong> analysed. The<br />
occupational classification used had to permit the construction<br />
<strong>of</strong> categories approximately comparable to<br />
those employed in the 1968 revision <strong>of</strong> the International<br />
Classification <strong>of</strong> Occupations. This criterion led to<br />
numerous exclusions, particularly in Eastern Europe.<br />
The urban definition used also had to be roughly comparable<br />
to international norms. Comparability in this<br />
respect was judged largely on the basis <strong>of</strong> a scatter-gram<br />
10<br />
70<br />
10<br />
67<br />
-_.-<br />
Flgure VI. Comparison <strong>of</strong> perceaC8ge <strong>of</strong> labour force In<br />
industry by industrial <strong>and</strong> o«apatlooaJ clasllfteatloDs<br />
-"'01<br />
-"'induIlIy<br />
36<br />
311<br />
26,<br />
20<br />
16<br />
10<br />
,-<br />
BriL_<br />
, ......<br />
10<br />
16<br />
" .<br />
,eeo.-<br />
e __ eAllOria<br />
N<br />
20<br />
26<br />
311<br />
36<br />
,",-01<br />
40-- -"'---<br />
FIgure VB. Comparison <strong>of</strong> percentage <strong>of</strong> labour force In<br />
services by industria) <strong>and</strong> occupational clasllficatioDS<br />
relating the urban proportion to the agricultural proportion<br />
<strong>of</strong> the labour force. Thus, Engl<strong>and</strong> <strong>and</strong> Wales<br />
(using conurbations) <strong>and</strong> Luxembourg (using the capital<br />
city only) were excluded from the final set <strong>of</strong> countries<br />
analysed. Lastly, a data set was excluded if the labour<br />
force consisted ·<strong>of</strong> more than 15.0 per cent <strong>of</strong> persons<br />
with unknown occupations. •<br />
The data utilized in this study are presented in Annex<br />
III (tables 51-53). Three features <strong>of</strong> the labour force <strong>of</strong><br />
a country are shown: the occupational composition <strong>of</strong><br />
the total, urban <strong>and</strong> rural sectors (table 51); the proportion<br />
<strong>of</strong> each occupation residing in urban areas (table<br />
52); <strong>and</strong> the sex composition <strong>of</strong> occupations in the total,<br />
urban <strong>and</strong> rural labour forces (table 53). It should be<br />
mentioned that urban/rural distinctions apply to place<br />
<strong>of</strong> residence rather than to place <strong>of</strong> work, <strong>and</strong> that commuting<br />
patterns may result in different patterns by place<br />
<strong>of</strong> work than by place <strong>of</strong> residence.<br />
Occupational data in the tables given below are shown<br />
for agriculture, industry <strong>and</strong> services, classified by five
levels <strong>of</strong> development as measured by the percentage<br />
<strong>of</strong> total labour force in agriculture, ranging from 65 per<br />
cent or more at the lowest level <strong>of</strong> development to 15<br />
per cent or less at the highest level. Throughout the<br />
chapter, the urban <strong>and</strong> rural categories refer to the place<br />
<strong>of</strong> residence <strong>of</strong> employed persons rather than to their<br />
place <strong>of</strong> employment.<br />
D. DEGREE OF URBANIZATION IN OCCUPATIONS<br />
Table 25 describes the urban/rural residence composition<br />
<strong>of</strong> the various categories <strong>of</strong> occupations by<br />
means <strong>of</strong> the proportion urban in each occupation at<br />
each <strong>of</strong> the five levels <strong>of</strong> development. In order to have<br />
enough observations to form a stable basis <strong>of</strong> comparison,<br />
countries that could supply data at several dates<br />
were allowed to be represented more than once. In this<br />
sense, this <strong>and</strong> many subsequent tables pool crosssectional<br />
<strong>and</strong> time-series data. As expected, the agricultural<br />
category tends to be overwhelmingly rural<br />
throughout the range <strong>of</strong> countries examined. On the<br />
other h<strong>and</strong>, industry <strong>and</strong> service pursuits tend to be<br />
urban even in the least developed countries, despite the<br />
importance <strong>of</strong> rural home h<strong>and</strong>icraft <strong>and</strong> agricultural<br />
services therein. All <strong>of</strong> the occupations, including agriculture,<br />
become increasingly urbanized at progressively<br />
higher levels <strong>of</strong> development. Industry <strong>and</strong> services are<br />
about one half urban at the lowest level <strong>of</strong> development<br />
<strong>and</strong> roughly three fourths or more urban at the highest<br />
level, though the pr<strong>of</strong>essional <strong>and</strong> managerial occupations<br />
<strong>and</strong> the sales <strong>and</strong> clerical occupations become<br />
somewhat more urbanized than do manufacturing (i.e.,<br />
industry) <strong>and</strong> traditional service occupations. In agriculture,<br />
the degree <strong>of</strong> urbanization rises from about 4 per<br />
cent urban at the lowest level <strong>of</strong> development to about<br />
15 per cent at the next to the highest level. At the very<br />
highest level <strong>of</strong> development, a slightly reduced level <strong>of</strong><br />
urbanization occurs, which is discussed below. In sum,<br />
all <strong>of</strong> the major occupational groups tend to become<br />
more highly urbanized as development proceeds. In the<br />
case <strong>of</strong> industry <strong>and</strong> services, this tendency reinforces a<br />
pre-existing urban dominance; in the case <strong>of</strong> agriculture,<br />
it removes only a small part <strong>of</strong> a pre-existing rural<br />
dominance.<br />
E. LABOUR FORCE STRUCTURES OF URBAN AND RURAL<br />
AREAS IN RELATION TO DEVELOPMENTAL LEVEL<br />
Table 26 is designed to show the percentage composition<br />
<strong>of</strong> total labour force at each <strong>of</strong> the five levels <strong>of</strong><br />
development in both urban <strong>and</strong> rural areas. In the<br />
present definition <strong>of</strong> development, the percentage in<br />
agriculture necessarily declines as. development proceeds.<br />
The decline in agriculture occurs within both<br />
rural <strong>and</strong> urban areas. The decline is especially marked<br />
in rural areas, where the percentage in agriculture is reduced<br />
from an average <strong>of</strong> 87 to an average <strong>of</strong> 27 in the<br />
course <strong>of</strong> development. Obviously, the identification <strong>of</strong><br />
rural areas with agricultural activities becomes less <strong>and</strong><br />
less appropriate as economic development proceeds.<br />
This "de-agriculturalization" <strong>of</strong> rural areas occurs even<br />
though the vast preponderance <strong>of</strong> agricultural activities<br />
continues to occur in rural areas. In urban areas, the percentage<br />
<strong>of</strong> agricultural employment at the three lowest<br />
levels <strong>of</strong> development-from 12 to 18 per cent-is<br />
reduced to less than 5 per cent at the two highest levels.<br />
It is likely that at lower levels <strong>of</strong> development, many<br />
smaller urban places are not highly differentiated from<br />
rural areas. This is particularly likely in areas where the<br />
traditional form <strong>of</strong> rural settlement has been village<br />
clusters rather than dispersed individual l<strong>and</strong>holdings,<br />
<strong>and</strong> where the agricultural labour force commutes to<br />
fields in the vicinity. Such clusters may frequently be<br />
classified as urban rather than rural because they can<br />
attain considerable size. Also, a considerable proportion<br />
<strong>of</strong> the urban labour force in less developed areas may<br />
produce a significant amount <strong>of</strong> food supply in backyards<br />
or kitchen gardens. Such labour force may be<br />
classified as agricultural if enumerated at a time when<br />
they are retired or otherwise unemployed in urban<br />
occupations."<br />
In the urban areas, manufacturing remains remarkably<br />
constant at an average <strong>of</strong> a little more than a third<br />
<strong>of</strong> the labour force at all levels <strong>of</strong> development. This is<br />
62 Also, over-bounding <strong>of</strong> urban areas may result in the classification<br />
<strong>of</strong> some farm l<strong>and</strong> as urban. However, this can happen<br />
at any level <strong>of</strong> development <strong>and</strong> thus would not necessarily influence<br />
the trends shown here.<br />
TABLE 25. AVERAGE PROPORTION URBAN IN VARIOUS OCCUPATIONS CLASSIFIED BY LEVEL OF<br />
DEVELOPMENT OF COUNTRY<br />
Percentage <strong>of</strong> total Pr<strong>of</strong>essional Clerical<br />
labour force in Number <strong>of</strong> <strong>and</strong> adminis- <strong>and</strong> sales Traditional<br />
agriculture observations Agriculture Industry trative services services services Unknown<br />
65.0 or mores .... 14 3.8 50.0 51.2 57.0 59.0 33.7<br />
50.0-64.9 b ....... 13 5.7 53.7 59.7 64.9 60.9 51.3<br />
35.0-49.9 c ....... 14 13.2 60.1 74.0 75.3 70.8 53.4<br />
15.0-34.9 d ....... 9 14.5 67.2 77.3 78.1 74.8 59.1<br />
15.0 or Iess- ..... 9 13.0 72.1 82.2 84.5 78.0 72.5<br />
S N = 14: Bolivia, 1963; Central African Empire, 1960; Guinea, 1955; India, 1961;<br />
Morocco, 1951; Romania, 1956; Sarawak, 1970: Sudan, 1956; Thail<strong>and</strong>, 1970, 1954; Turkey,<br />
1970, 1960, 1950; United Republic <strong>of</strong> Tanzania, 1967.<br />
b N = 13: Bulgaria, 1956; Ecuador, 1962; Guatemala, 1973; Greece, 1961; Indonesia,<br />
1971; Iran, 1956; Morocco, 1971, 1960; Nicaragua, 1963; Romania, 1966; Sabah, 1970; Sri<br />
Lanka, 1970, 1953.<br />
c N = 14: Algeria, 1966; Costa Rica, 1973, 1963; Cyprus, 1960; Ecuador, 1974: Greece,<br />
1971' Libyan Arab Jamahiriya, 1964; Nicaragua, 1971; Peninsular Malaysia, 1970; Peru, 1972,<br />
1961; Portugal, 1960; Spain, 1960; Tunisia, 1966.<br />
d N =9: Chile, 1970; Hungary, 1970; Israel, 1961; Japan, 1970, 1965, 1960; Puerto Rico,<br />
1960; United States <strong>of</strong> America, 1940; Venezuela, 1961.<br />
• N = 9: Canada, 1971, 1961; Puerto Rico, 1970; Scotl<strong>and</strong>, 1961; Sweden, 1970, 1960;<br />
United States <strong>of</strong> America, 1970, 1960, 1950.<br />
68
TABLE 26. PERCENTAGE COMPOSITION OF URBAN AND RURAL LABOUR FORCE, BY SECTOR OF<br />
ECONOMIC ACTIVITY AND LEVEL OF DEVELOPMENT<br />
Total Services<br />
(sum <strong>of</strong> (sum <strong>of</strong> Pr<strong>of</strong>essional ClerIcal Service-to-<br />
Percentage <strong>of</strong> total cols. 2, 3, cols. 5. 6 <strong>and</strong> administra- <strong>and</strong> sales TradItIonal Industry<br />
labour force 4 <strong>and</strong> 8) Agriculture Industry <strong>and</strong> 7) tlve services services services Unknown ratio<br />
In agriculture (1) (2) (3) (4) (5) (6) (7) (8) (9)<br />
Total<br />
65.0 or more ......... 100.0 77.3 9.7 9.6 2.9 4.0 2.7 3.6 99<br />
50.0-64.9 .o ....... .o.o.o.o • 100.0 55.7 19.5 21.2 5.0 9.0 7.2 3.7 109<br />
35.0-49.9 ••••••• .o •••• 100.0 42.5 25.7 25.9 5.7 11.6 8.6 5.9 101<br />
15.0-34.9 ••• .o ••• .o.o • .o • 100.0 23.1 34.7 39.6 11.6 18.4 9.6 2.5 114<br />
15.0 or less .......... 100.0 8.4 38.4 50.1 17.1 22.2 10.8 3.2 130<br />
<strong>Urban</strong><br />
65.0 or more ......... 100.0 18.2 34.2 39.6 10.6 17.3 11.7 8.0 115<br />
50.0-64.9 •• .o • .o • .o •• .o.o • 100.0 10.5 36.3 47.2 10.5 21.2 15.5 6.0 130<br />
35.0-49.9 •••••• .o ••• .o • 100.0 12.0 35.6 45.5 10.1 21.0 14.4 6.9 128<br />
15.0-34.9 •••••• .o.o.o • .o • 100.0 4.7 39.6 52.8 15.2 25.3 12.3 2.8 133<br />
15.0 or less .......... 100.0 1.4 38.2 57.2 19.6 26.0 11.6 3.3 150<br />
<strong>Rural</strong><br />
65.0 or more ......... 100.0 87.1 5.4 4.7 1.4 2.0 1.3 2.7 87<br />
50.0-64.9 .o ••••• .o • .o.o •• 100.0 74.3 12.1 11.0 2.7 4.4 3.9 2.6 91<br />
35.0-49.9 •• .o.o.o • .o.o.o • .o • 100.0 65.9 17.7 11.3 2.3 4.7 4.3 5.0 64<br />
15.0-34.9 • .o ••• .o ••• .o •• 100.0 49.8 26.8 21.4 6.2 9.3 5.9 2.0 80<br />
15.0 or less .......... 100.0 26.9 38.4 31.6 10.7 12.4 8.5 3.1 82<br />
not to say that manufacturing has always represented<br />
the same fraction <strong>of</strong> urban employment. It may well be<br />
the case that manufacturing was a more important component<br />
<strong>of</strong> the urban labour force at earlier dates in the<br />
currently developed countries. But, for recent years, the<br />
level <strong>of</strong> development attained by a country appears to<br />
have little bearing on the dependence <strong>of</strong> its urban labour<br />
force upon manufacturing.<br />
Structural differences with regard to manufacturing<br />
have occurred mostly in the rural areas. Whereas manufacturing<br />
comprises only about 5 per cent <strong>of</strong> the rural<br />
labour force at the lowest level <strong>of</strong> development, this<br />
proportion is increased at each higher level <strong>of</strong> development<br />
until it reaches 38 per cent at the highest level. It is<br />
interesting to take note that at this level <strong>of</strong> development<br />
the percentage <strong>of</strong> manufacturing in the urban labour<br />
force is also 38 per cent. Although manufacturing remains<br />
a decidedly urban activity in the sense that three<br />
quarters <strong>of</strong> it is contained in urban areas at the highest<br />
level <strong>of</strong> development, as shown in table 25, it is approximately<br />
equally prominent in both urban <strong>and</strong> rural labour<br />
forces at this level.<br />
Total services rise progressively with the level <strong>of</strong> development<br />
in both urban <strong>and</strong> rural areas, though they<br />
remain considerably more important in urban than in<br />
rural areas. Whereas rural services are almost nonexistent<br />
in the least developed group, st<strong>and</strong>ing at only<br />
about 5 per cent <strong>of</strong> the labour force, rural services in<br />
the most developed group <strong>of</strong> countries represent almost<br />
a third <strong>of</strong> the rural labour force. Such a level <strong>of</strong> service<br />
participation is not far below the urban level at the<br />
lowest level <strong>of</strong> development. Each <strong>of</strong> the three categories<br />
<strong>of</strong> services tends to increase in rural areas from virtually<br />
zero to roughly 10 per cent <strong>of</strong> the labour force. In urban<br />
areas, sales <strong>and</strong> service workers tend to increase fairly<br />
steadily with development from 17 per cent at the lowest<br />
level <strong>of</strong> development to 26 per cent at the highest level.<br />
The traditional services increase somewhat at the very<br />
lowest levels <strong>of</strong> development but thereafter tend to decline<br />
steadily with development until the percentage <strong>of</strong><br />
69<br />
traditional services at the highest level <strong>of</strong> development<br />
approximately equals that <strong>of</strong> the lowest level. Perhaps<br />
the increase in traditional services in the urban areas <strong>of</strong><br />
countries at intermediate levels <strong>of</strong> development represents<br />
urban residents who are otherwise unemployed but<br />
who can find at least partial or temporary employment<br />
in these occupations. It has been suggested that the<br />
countries which are currently in the process <strong>of</strong> modernization<br />
appear to experience a certain lag between the<br />
onset <strong>of</strong> massive population urbanization <strong>and</strong> the absorption<br />
<strong>of</strong> the inflated urban labour force into modem<br />
types <strong>of</strong> employment. Once the urban economy becomes<br />
better organized, much <strong>of</strong> the surplus underemployed<br />
labour in this category <strong>of</strong> occupations can presumably<br />
find more productive employment elsewhere, <strong>and</strong> the<br />
structural importance <strong>of</strong> the traditional services in the<br />
urban labour force can recede to its previous level.<br />
Pr<strong>of</strong>essional <strong>and</strong> managerial services do not show any<br />
increase in importance in urban areas until a country<br />
reaches the two highest levels <strong>of</strong> development. At this<br />
point, these services show considerable change, increasing<br />
from 10 to 15 per cent <strong>and</strong> ultimately to 20 per cent<br />
<strong>of</strong> total urban labour force.<br />
The increasingly non-agricultural nature <strong>of</strong> rural activities<br />
undoubtedly reflects in large part differences in<br />
transportation systems. The increasingly widespread<br />
ownership <strong>of</strong> motor-cars in rural areas, combined with<br />
vastly exp<strong>and</strong>ed rural highway networks, has permitted<br />
functions to be spatially distributed in a new way which<br />
is neither urban nor rural in character. As we observed<br />
earlier, smaller urban places at lower levels <strong>of</strong> development<br />
are sometimes difficultto distinguish from clustered<br />
rural settlements because a substantial proportion <strong>of</strong> the<br />
labour force are engaged, on a full- or part-time basis, in<br />
agriculture. At the other end <strong>of</strong> the scale, in the most developed<br />
areas, certain rural areas are now sometimes<br />
difficult to classify because they contain so much dispersed<br />
non-agricultural activity. Highways traversing<br />
largely open agricultural fields are at intervals lined with<br />
factories surrounded by spacious lawns <strong>and</strong> parking
vices tend to decline in urban areas at later stages <strong>of</strong><br />
development in relation to the other classes <strong>of</strong> services.<br />
In urban areas, the unknown category is also believed<br />
to be largely composed <strong>of</strong> traditional service employments.<br />
Moreover, both traditional services <strong>and</strong> the unknown<br />
category show a similar downward trend in urban<br />
areas with level <strong>of</strong> development. If the urban unknown<br />
category is added to the urban traditional service<br />
category, this combination occupies fully one fifth <strong>of</strong><br />
the labour force in the three lower categories <strong>of</strong> development.<br />
The volume <strong>of</strong> traditional service employment<br />
in the urban areas <strong>of</strong> the less developed countries<br />
may actually be closer to one fourth <strong>of</strong> the urban labour<br />
force, since a substantial proportion <strong>of</strong> the sales workers<br />
listed separately in the category <strong>of</strong> urban clerical <strong>and</strong><br />
sales workers may be simply street peddlers with only<br />
a marginal, intermittent livelihood rather than modem,<br />
literate sales employees with full-time occupations.<br />
Table 26 indicates that clerical <strong>and</strong> sales services<br />
begin to assume an increasing share <strong>of</strong> the urban labour<br />
force structure at an early stage in development. These<br />
services are largely brought forth as a by-product <strong>of</strong><br />
development itself <strong>and</strong> a concomitant increasing scale<br />
<strong>of</strong> enterprise. Clerical services are record-keeping skills.<br />
The need for these services multiplies as enterprises<br />
increase .in size <strong>and</strong> the limited number <strong>of</strong> face-to-face<br />
relationships based on memory which characterize very<br />
small business undertakings are replaced by almost limitless<br />
numbers <strong>of</strong> paper relationships based on written<br />
records <strong>and</strong> files.<br />
Selling emerges as a specialized full-time occupation<br />
when the scale <strong>of</strong> output becomes too large for workers<br />
specialized in production to do the marketing <strong>of</strong><br />
their own output themselves. Where small-scale h<strong>and</strong>icraft<br />
production prevails, inventories are small <strong>and</strong><br />
selling occupies relatively much less time <strong>and</strong> effort<br />
than production. Even where specialized urban merchants<br />
exist, inventory acquisition is problematical, as<br />
a single seller must procure inventory from a multiplicity<br />
<strong>of</strong> small-scale producers. With increasing development<br />
<strong>and</strong> automation, the inventory <strong>of</strong> a single manufacturing<br />
enterprise can be considerable, requiring the<br />
services<strong>of</strong> large full-time marketing staffs. Inventory distribution,<br />
rather than inventory acquisition, becomes relatively<br />
more problematical. The scale <strong>of</strong> markets must<br />
be increased from merely local to regional <strong>and</strong> national,<br />
<strong>and</strong> even international. In such a context, the service <strong>of</strong><br />
selling assumes increasing importance in relation to<br />
production.<br />
As shown in table 26, urban pr<strong>of</strong>essional <strong>and</strong> administrative<br />
services do not begin to increase in importance<br />
as a component <strong>of</strong> urban labour force structure until<br />
relativelyhigh levels<strong>of</strong> development have been achieved.<br />
At low levels <strong>of</strong> development, administrative expertise<br />
is mainly governmental <strong>and</strong> even this use is loose <strong>and</strong><br />
limited. Economic activities are, in general, on too<br />
small a scale to require systematic, pr<strong>of</strong>essional administration.<br />
With development <strong>and</strong> the growth in scale <strong>of</strong><br />
enterprise, however, considerable capabilities in management<br />
<strong>and</strong> administration are necessary to co-ordinate<br />
successfully the productive activities <strong>of</strong> business organizations.<br />
Moreover, the larger scale <strong>of</strong> extended territorial<br />
markets brings with it a need for ever more<br />
detailed <strong>and</strong> comprehensive government administration<br />
to ensure orderly <strong>and</strong> secure conditions for the organization<br />
<strong>of</strong> production <strong>and</strong> exchange.<br />
72<br />
Needless to say, the complex technology in use at<br />
high levels <strong>of</strong> development brings with it an increasing<br />
need for pr<strong>of</strong>essional <strong>and</strong> technical services. Although<br />
certain <strong>of</strong> these services are rendered to individuals,<br />
especially medical <strong>and</strong> educational services, an increasing<br />
proportion is enterprise-oriented, providing not only<br />
scientific <strong>and</strong> engineering services to businesses but<br />
legal, accounting, marketing <strong>and</strong> other services essential<br />
to the rationalization <strong>of</strong> business procedures.<br />
In addition to the proliferation <strong>of</strong> business services,<br />
there is an extension <strong>and</strong> upgrading <strong>of</strong> personal services<br />
at higher levels <strong>of</strong> development. As needs for material<br />
goods, both agricultural <strong>and</strong> manufactured, are increasingly<br />
satiated, consumer dem<strong>and</strong> is increasingly directed<br />
towards services. Educational services increase both because<br />
<strong>of</strong> their value .for increasing earning potential<br />
<strong>and</strong> their attractiveness as objects <strong>of</strong> personal consumption.<br />
Health services increase as people are increasingly<br />
able to afford good health <strong>and</strong> as demographic changes<br />
increase the fraction <strong>of</strong> the population at ages where<br />
chronic health impairments are most prevalent. Institutional<br />
care <strong>of</strong> the elderly is another service which<br />
appears destined to become a major factor, as low<br />
birth rates combine with low mortality rates to augment<br />
the proportion <strong>of</strong> elderly, while the rapid drift<br />
<strong>of</strong> women from the home to the labour force has drastically<br />
reduced the potential for care <strong>of</strong> the elderly in<br />
family homes. Recreation <strong>and</strong> travel also are apparently<br />
destined to increase dramatically. In a crowded world,<br />
where accumulation <strong>of</strong> tangible goods is necessarily<br />
limited by spatial restrictions, the consumption <strong>of</strong> intangible<br />
services is likely to assume relatively greater<br />
importance.<br />
As discussed earlier, there is considerable concern in<br />
the less developed countries that industry, distorted by<br />
labour-saving technology imported from the more developed<br />
countries, will be unable to absorb a growing<br />
urban labour force which is currently unemployed or<br />
underemployed in marginally productive services. It is<br />
probably true that the less developed economies <strong>of</strong> today<br />
will not experience as high a relative level <strong>of</strong> industrial<br />
employment as the currently developed countries did<br />
at comparable levels <strong>of</strong> development when industrial<br />
technology was labour-intensive. However, along with<br />
the labour-saving industrial technology, the currently<br />
less developed countries also inherit a labour-absorptive<br />
service technology which has been remarkably improved<br />
in quality." Though a large proportion <strong>of</strong> the labour<br />
force in the less developed countries will remain in<br />
service types <strong>of</strong> employment, there is opportunity to<br />
upgrade these workers through education <strong>and</strong> training.<br />
To the extent that workers can be absorbed into the<br />
business type <strong>of</strong> services, they may enhance even further<br />
the productivity <strong>of</strong> industrial production <strong>and</strong> distribution.<br />
To the extent that they are absorbed into<br />
modern, more productive types <strong>of</strong> consumer-oriented<br />
services. they will contribute directly to improved quality<br />
<strong>of</strong> life. 74<br />
73 Approximately two thirds <strong>of</strong> the value <strong>of</strong> health services in<br />
the United States <strong>of</strong> America represents labour input. Somewhat<br />
less than one sixth represents input <strong>of</strong> physical capital <strong>and</strong> the<br />
remainder represents goods <strong>and</strong> services purchased from other<br />
industries. Victor R. Fuchs, ''The contribution <strong>of</strong> health services<br />
to the American economy", Milbank Memorial Fund Quarterly,<br />
vol. XLIV, No.4 (October 1966):part 2, p. 71.<br />
14 Relative productivity in service activities is difficultto measure.<br />
Measurement difficulties arise in part because <strong>of</strong> the in-
It was concluded from an international study <strong>of</strong> manufacturing<br />
<strong>and</strong> tertiary employment that the bulk <strong>of</strong> the<br />
new employment in newly developing countries will<br />
probably be found in the tertiary sector rather than in<br />
manufacturing." The report emphasizes, however, that<br />
it is, nevertheless, the manufacturing sector which is<br />
likely to be the "dynamic force" in generating new<br />
employment. The reasoning is that this development<br />
will occur through an "employment multiplier effect"<br />
in which the additional product generated by a highly<br />
productive manufacturing sector results in an increase<br />
in the effective dem<strong>and</strong> for the goods <strong>and</strong> services <strong>of</strong><br />
the other sectors <strong>and</strong> thus permits an increase in employment<br />
in these other sectors. According to this view,<br />
the possible losses in manufacturing employment due<br />
to labour-saving technology can be more than <strong>of</strong>fset<br />
by the increases thus generated in the tertiary sector.<br />
G. TRENDS IN OCCUPATION/RESIDENCE RELATIONS<br />
In this section, a comparison is made between the<br />
relations just described (developed from data for 39<br />
countries at 59 dates) <strong>and</strong> actual time-series data for<br />
a more limited sample <strong>of</strong> 16 countries at 36 dates. Such<br />
a comparison indicates whether recent history in selected<br />
countries supports the inferences drawn above<br />
from the pooled cross-sectional <strong>and</strong> time-series data<br />
or whether newly emergent trends can be observed.<br />
Countries are ordered in the time-series tables which<br />
follow by level <strong>of</strong> development (i.e., by percentage <strong>of</strong><br />
total labour force in agriculture) at the most recent<br />
date, beginning with the least agricultural country, the<br />
United States <strong>of</strong> America. For expositional convenience,<br />
countries are also grouped into two discrete<br />
categories: the less agricultural, those with less than 35<br />
per cent <strong>of</strong> total labour force in agriculture; <strong>and</strong> the<br />
more agricultural, which contain more than 35 per cent<br />
<strong>of</strong> total labour force in agriculture. This cut-<strong>of</strong>f point<br />
corresponds to the dividing line between the two highest<br />
<strong>and</strong> the three lowest development categories in the<br />
cross-sectional tables. The urban category <strong>of</strong> Engl<strong>and</strong><br />
<strong>and</strong> Wales in the time-series tables pertains only to<br />
conurbations." It has been included here because the<br />
sample <strong>of</strong> time trends for more developed countries is<br />
tangibility <strong>of</strong> service output which in general does not result in<br />
comparable physical units <strong>of</strong> output which can be easily counted.<br />
Service productivity will <strong>of</strong>ten be reflected in differences in quality<br />
<strong>of</strong> output rather than quantity. Another difficulty arises from<br />
the circumstance that much <strong>of</strong> the technological unprovement<br />
in the services is not a matter <strong>of</strong> improved physical equipment<br />
but is rather "labour-embodied". If, for example, newly trained<br />
physicians,after receivingthe same amount <strong>of</strong> schooling as their<br />
predecessors, know more about disease <strong>and</strong> are more effective<br />
10 treating SIck people, one should attribute the increase in output<br />
to labour-embodied technological change. Even more difficult<br />
to measure is the extent to which technological improvement in<br />
services is actually "consumer-embodied".To continue the medical<br />
illustration, the quality <strong>of</strong> the medical history the patient is<br />
able to give in the physician's <strong>of</strong>fice may influence significantly<br />
the productivity <strong>of</strong> the physician. Productivity in banking is<br />
affected by whether the clerk or the customer makes out the<br />
deposit slip-<strong>and</strong> whether it is made out correctly. This element,<br />
in tum, is likely to be a function <strong>of</strong> the education <strong>of</strong> the customer,<br />
among other factors. V. R. Fuchs, The Service Economy,<br />
pp. 194-199, provides an interesting discussion <strong>of</strong> such factors.<br />
75 W. Galenson,loc. cit.<br />
76 Engl<strong>and</strong> <strong>and</strong> Wales was not included in the pooled timeseries<br />
cross-sectional analysis because conurbations are clearly<br />
under-bound in relation to st<strong>and</strong>ard urban definitions. However,<br />
there is no reason to discard its data on trends.<br />
73<br />
very small, <strong>and</strong> the time trends for Engl<strong>and</strong> <strong>and</strong> Wales<br />
thus defined appear to be fairly consistent with those<br />
<strong>of</strong> the other time series for more developed countries.<br />
Agriculture<br />
Tables 28 <strong>and</strong> 29 reveal that virtually all <strong>of</strong> the<br />
countries with trend data are becoming less agricultural<br />
in both rural <strong>and</strong> urban areas. These trends clearly support<br />
the previous pooled-data analysis. <strong>Urban</strong> areas <strong>of</strong><br />
the less agricultural countries are already so low in<br />
agricultural employment (less than 3 per cent <strong>of</strong> the<br />
urban labour force) that only limited further declines<br />
can be achieved per decade. More substantial decade<br />
declines <strong>of</strong> 2-5 percentage points are still being achieved<br />
in the urban areas <strong>of</strong> the less developed countries, where<br />
the percentage <strong>of</strong> agricultural employment in individual<br />
countries can still be as high as 15 per cent. In the rural<br />
areas, substantial declines in percentage <strong>of</strong> agricultural<br />
employment are being achieved in both the more developed<br />
<strong>and</strong> the less developed countries. In the pooleddata<br />
analysis, the percentage <strong>of</strong> rural labour force in agriculture<br />
declined from an average <strong>of</strong> almost 90 per cent in<br />
the lowest development class to an average <strong>of</strong> about one<br />
fourth in the most developed class. Time-series data from<br />
the United States, the longest time series, indicates, however,<br />
that the floor which can be reached in rural agricultural<br />
employment may be much lower than one fourth.<br />
During the three decades shown here, agricultural employment<br />
declined in the United States from almost one<br />
half to about 10 per cent <strong>of</strong> the rural labour force. Such<br />
limited rural agricultural employment is all the more<br />
noteworthy when it is remembered that the United<br />
States is a major food exporter.<br />
Industry <strong>and</strong> services<br />
It was observed in the cross-sectional table that the<br />
average percentage <strong>of</strong> industrial employment in urban<br />
areas is remarkably similar in the more developed <strong>and</strong><br />
the less developed countries, on average remaining at<br />
somewhat more than one third <strong>of</strong> the urban labour<br />
force. The time trends reveal, however, that in the<br />
urban areas <strong>of</strong> the less agricultural countries there has<br />
been an almost universal downward trend in percentage<br />
<strong>of</strong> industrial employment, except in Sweden, which<br />
changed very little. The relative declines in industrial<br />
employment in the urban areas <strong>of</strong> more developed countries<br />
has been accompanied by relative increases in service<br />
employments. As shown in the last column <strong>of</strong><br />
table 28, the urban service-to-industry ratio among the<br />
more developed countries has risen in every country<br />
except Sweden. As observed earlier, the rise <strong>of</strong> service<br />
employment in relation to industrial employment has<br />
long been anticipated in the more developed countries.<br />
The direction <strong>of</strong> change in percentage <strong>of</strong> industrial<br />
employment in the urban areas <strong>of</strong> more agricultural<br />
countries is less consistent. Of the 10 countries, three<br />
increased (Greece, Sri Lanka <strong>and</strong> Romania), four decreased<br />
(Ecuador, Nicaragua, Morocco <strong>and</strong> Turkey)<br />
<strong>and</strong> three remained about the same (Costa Rica, Peru<br />
<strong>and</strong> Thail<strong>and</strong>). Thus the pooled-data results, suggesting<br />
little systematic change in urban industrial employment<br />
with development, are supported by trends in these<br />
countries. Meanwhile, urban service employment has<br />
increased in a clear majority <strong>of</strong> these countries (7 out<br />
<strong>of</strong> 10), while decreasing in only Romania <strong>and</strong> Sri Lanka,<br />
<strong>and</strong> remaining virtually unchanged in Morocco. The
TABLE 28. PERCENTAGE COMPOSmON OF URBAN LABOUR FORCE, BY SECfOR OFECONOMIC<br />
ACTIVITY, COUNTRIES WITH AT LEAST TWO OBSERVATIONS<br />
(Percentage points)<br />
Total Services Clerical Service-<br />
(sum oj (sum oj Pr<strong>of</strong>esstonal <strong>and</strong> tocols.2,<br />
cols.B, <strong>and</strong> admlnls- sales Traditional Industry<br />
3,4 <strong>and</strong> 8) Agriculture Industry 6 <strong>and</strong> 7) trative services services services Unknown ratio<br />
Country Date (l) (2) (3) (4) (5) (6) (7) (8) (9)<br />
Less agricultural countries-<br />
Canada ................. 1961 100.0 1.5 38.3 57.6 20.6 23.5 13.5 2.6 150<br />
1971 100.0 1.6 28.8 59.4 18.9 28.6 11.9 10.3 206<br />
Japan ........... , ••.•.• 1960 100.0 2.4 42.9 53.9 10.9 32.8 10.2 0.7 126<br />
1965 100.0 2.0 40.9 56.4 11.7 34.6 10.1 0.7 138<br />
1970 100.0 1.8 39.6 58.1 14.0 34.0 10.1 0.6 147<br />
Puerto Rico ......•..•••. 1960 100.0 3.0 37.8 58.2 18.7 25.2 14.3 1.0 154<br />
1970 100.0 1.3 36.6 59.0 23.8 23.9 11.3 3.1 161<br />
Sweden ..... , ........... 1960 100.0 1.9 40.6 56.9 19.6 26.1 11.2 0.6 140<br />
1970 100.0 1.9 41.0 56.3 23.7 22.3 10.3 0.7 137<br />
United Kingdom<br />
Engl<strong>and</strong> <strong>and</strong> Wales ....• 1951 100.0 0.8 50.5 47.1 9.5 26.9 10.7 1.6 93<br />
1961 100.0 0.7 44.7 52.5 11.3 30.3 10.9 2.1 117<br />
United States <strong>of</strong> America •. 1940 100.0 0.8 41.5 57.0 14.1 27.7 15.2 0.8 137<br />
1950 100.0 0.8 41.9 56.2 17.8 26.5 11.9 1.1 134<br />
1960 100.0 1.1 34.9 58.6 17.6 28.7 12.3 5.4 168<br />
1970 100.0 0.6 32.6 62.5 24.2 26.9 11.4 4.3 192<br />
More agricultural countries»<br />
Costa Rica ..........•..• 1963 100.0 6.8 31.5 55.6 13.0 25.1 17.5 6.0 177<br />
1973 100.0 5.1 31.8 57.9 17.2 23.2 17.5 5.2 182<br />
Ecuador ................ 1962 100.0 10.6 37.9 43.3 7.4 21.0 14.9 8.1 114<br />
1974 100.0 7.5 33.9 48.4 11.9 22.4 14.1 10.1 143<br />
Greece ................. 1961 100.0 8.7 42.6 41.8 8.3 21.6 11.9 6.8 98<br />
1971 100.0 5.6 44.9 46.1 10.5 25.0 10.6 3.4 103<br />
Morocco ........•.••••• 1960 100.0 5.3 36.5 43.5 6.7 19.2 17.6 14.7 119<br />
1971 100.0 4.7 34.8 43.4 8.4 17.3 17.7 17.2 125<br />
Nicaragua ..............• 1963 100.0 16.3 38.9 44.4 6.4 21.4 16.6 0.5 114<br />
1971 100.0 11.3 36.8 48.9 10.9 20.6 17.4 3.1 133<br />
Peru ................... 1961 100.0 18.1 31.0 43.7 8.3 20.2 15.2 7.3 141<br />
1972 100.0 15.3 31.2 45.9 11.9 21.6 12.4 7.6 147<br />
Romania ................ 1956 100.0 16.5 41.4 42.0 20.8 12.4 8.8 0.1 101<br />
1966 100.0 14.6 46.3 39.0 20.5 10.8 7.7 0.1 84<br />
Sri Lanka ............•.• 1953<br />
1970<br />
100.0<br />
100.0<br />
5.9<br />
8.8<br />
24.1<br />
38.2<br />
66.3<br />
52.8<br />
9.7<br />
12.2<br />
26.1<br />
26.5<br />
30.5<br />
14.1<br />
3.7<br />
0.2<br />
275<br />
138<br />
Thail<strong>and</strong> ............•... 1954<br />
1970<br />
100.0<br />
100.0<br />
12.2<br />
7.9<br />
31.3<br />
31.0<br />
49.8<br />
60.6<br />
9.1<br />
14.9<br />
30.5<br />
30.8<br />
10.2<br />
14.9<br />
6.7<br />
0.5<br />
159<br />
196<br />
Turkey ................. 1950 100.0 22.8 38.0 32.9 15.7 10.9 6.3 6.2 87<br />
1960 100.0 19.0 44.5 36.5 15.8 9.8 10.9 0.0 82<br />
1970 100.0 11.3 23.5 36.7 10.2 16.2 10.3 28.6 156<br />
a Countries with less than 35 per cent <strong>of</strong> labour force in agriculture.<br />
b Countries with more than 35 per cent <strong>of</strong> labour force in agriculture.<br />
net effect <strong>of</strong> these various changes in the less developed stantial increases in percentage <strong>of</strong> industrial employcountries<br />
on the service-to-industry ratio has been to ment were registered in three countries (Japan, Puerto<br />
increase it in every countrl except two: Romania <strong>and</strong> Rico <strong>and</strong> the United States); comparatively modest de-<br />
Sri Lanka. The rising tren in urban service-to-industry clines occurred in two countries (Engl<strong>and</strong> <strong>and</strong> Wales,<br />
ratio in both the less developed <strong>and</strong> the more developed <strong>and</strong> Sweden); <strong>and</strong> one country changed very little<br />
countries tends to confirm the cross-sectional tendency (Canada). Meanwhile, rural services increased in all<br />
described previously. <strong>of</strong> the more developed countries except Sweden (which<br />
The situation with regard to industry in the rural was similarly an exception in urban areas) <strong>and</strong> serviceareas<br />
<strong>of</strong> the more developed countries is mixed. Sub- to-industry ratios increased in all but two <strong>of</strong> the more<br />
74
TABLE 29. PERCENTAGE COMPOSmON OF RURAL LABOUR FORCE, BY SECTOR OF ECONOMIC<br />
ACTIVITY, COUNTRIES WITH AT LEAST TWO OBSERVATIONS<br />
(Percentage points)<br />
Total Services Service-<br />
(sum <strong>of</strong> (sum <strong>of</strong> Pr<strong>of</strong>essional Clerical tocols.2,<br />
oote s, <strong>and</strong> adminis- <strong>and</strong> sales Traditional Industry<br />
3, 4 <strong>and</strong> 8) A,rlculture Industry 6 <strong>and</strong> 7) trative services services services Unknown ratio<br />
Country Date (1) (2) (3) (4) (5) (6) (7) (8) (9)<br />
Less agricultural countries-<br />
Canada ................• 1961 100.0 40.5 29.8 27.3 11.0 7.3 9.0 2.5 92<br />
1971 100.0 27.5 29.2 32.1 9.9 13.4 8.8 11.1 110<br />
Japan .............•.... 1960 100.0 54.2 25.4 20.1 4.6 12.6 2.9 0.4 79<br />
1965 100.0 45.0 29.5 25.2 5.8 15.7 3.7 0.3 85<br />
1970 100.0 38.0 33.3 28.4 6.8 17.3 4.3 0.4 85<br />
Puerto Rico ............. 1960 100.0 43.9 32.5 22.0 5.4 8.7 7.9 1.7 68<br />
1970 100.0 19.2 49.0 29.6 8.8 10.3 10.5 2.1 60<br />
Sweden ................. 1960 100.0 27.3 41.6 30.4 10.1 12.5 7.8 0.7 73<br />
1970 100.0 38.0 38.9 22.7 9.1 7.5 6.1 0.4 58<br />
United Kingdom<br />
Engl<strong>and</strong> <strong>and</strong> Wales ....• 1951 100.0 8.4 48.6 38.4 8.3 20.0 10.1 4.7 79<br />
1961 100.0 5.9 45.5 44.9 11.0 23.8 10.0 3.7 99<br />
United States <strong>of</strong> America .. 1940 100.0 45.6 28.1 25.5 7.6 10.1 7.8 0.8 91<br />
1950 100.0 35.9 35.1 27.3 9.5 11.5 6.3 1.7 78<br />
1960 100.0 21.9 37.5 36.9 11.2 16.5 9.2 3.6 98<br />
1970 100.0 10.8 42.5 43.8 17.5 16.6 9.7 2.9 103<br />
More agricultural countries»<br />
Costa Rica ..........•... 1963 100.0 70.9 11.6 13.2 2.7 5.6 4.9 4.3 114<br />
1973 100.0 58.8 18.2 16.9 3.4 6.4 7.1 6.0 93<br />
Ecuador ................ 1962 100.0 80.7 11.7 6.4 1.2 2.7 2.5 1.1 55<br />
1974 100.0 73.6 14.2 7.8 2.1 3.8 1.9 4.4 55<br />
Greece ...... , ... '" .... 1961 100.0 80.2 10.1 9.6 1.8 3.3 2.6 1.9 95<br />
1971 100.0 72.5 15.2 11.3 2.5 5.2 3.6 1.0 74<br />
Morocco ........•...••. 1960 100.0 79.9 6.5 7.1 2.1 2.7 2.3 6.5 109<br />
1971 100.0 76.9 10.7 8.5 2.6 2.8 3.1 4.0 79<br />
Nicaragua ............. " 1963 100.0 87.2 5.7 7.1 0.5 2.2 4.4 0.1 125<br />
1971 100.0 80.0 8.5 9.0 1.3 2.7 5.0 2.4 106<br />
Peru ..•...............• 1961 100.0 79.9 10.9 6.8 1.2 2.9 2.7 2.4 62<br />
1972 100.0 81.2 9.8 5.5 1.6 2.3 1.6 3.5 56<br />
Romania ............... , 1956 100.0 87.0 7.5 5.4 2.7 1.6 1.1 0.0 72<br />
1966 100.0 77.4 14.8 7.7 3.5 2.1 2.1 0.0 52<br />
Sri Lanka ............... 1953 100.0 59.6 14.9 23.8 3.9 8.1 11.8 1.8 160<br />
1970 100.0 58.7 21.9 19.2 4.8 8.3 6.1 0.2 88<br />
Thail<strong>and</strong> ................ 1954 100.0 92.6 2.6 4.5 1.1 2.8 0.6 0.4 173<br />
1970 100.0 89.4 5.1 5.5 1.2 3.1 1.2 0.1 108<br />
Turkey ..............•.. 1950 100.0 92.6 4.0 2.5 1.4 0.8 0.3 0.9 63<br />
1960 100.0 91.6 5.0 3.4 1.5 0.9 1.0 0.0 68<br />
1970 100.0 86.0 4.0 5.2 2.2 1.6 1.4 4.7 130<br />
a Countries with less than 35 per cent <strong>of</strong> labour force in agriculture.<br />
b Countries with more than 35 per cent <strong>of</strong> labour force in agriculture.<br />
developed countries (Puerto Rico <strong>and</strong> Sweden). veloped countries is clearly downward. The downward<br />
The percentage <strong>of</strong> both industry <strong>and</strong> services rose trend in rural service-to-industry ratios in the less develin<br />
a majority <strong>of</strong> the rural areas <strong>of</strong> the less developed oped countries, <strong>and</strong> the upward trend in the more decountries.<br />
This is the pattern <strong>of</strong> change that would have veloped, suggests a V-shaped relationship, which is<br />
been anticipated on the basis <strong>of</strong> the cross-sectional anal- again supported by the pooled analysis presented<br />
ysis, which showed systematically higher percentages previouslyin table 26.<br />
<strong>of</strong> both industry <strong>and</strong> services in rural areas at each It remains to discuss the structure <strong>of</strong> the several<br />
higher level<strong>of</strong> development.The direction <strong>of</strong> the service- service occupations. From the cross-sectional analysis<br />
to-industry ratio in rural areas <strong>of</strong> most <strong>of</strong> the less de- it was observed that the level <strong>of</strong> urban traditional ser-<br />
75
vices in the next to the lowest category was conspicuously<br />
higher than the level at the lowest level <strong>of</strong> development.<br />
This finding was interpreted as evidence that<br />
urban migrants were seeking part-time or temporary<br />
employment in marginal traditional services because<br />
<strong>of</strong> the lack <strong>of</strong> more productive employment at the initial<br />
stages <strong>of</strong> development. At each successively higher level<br />
<strong>of</strong> development thereafter, the percentage <strong>of</strong> traditional<br />
services in urban areas was reduced, until at the highest<br />
level <strong>of</strong> development the level <strong>of</strong> traditional urban services<br />
was again approximately equal to that <strong>of</strong> the lowest<br />
level. Presumably, at higher levels <strong>of</strong> development<br />
more productive types <strong>of</strong> employment are organized<br />
in urban areas, which tend to draw <strong>of</strong>f traditional workers<br />
until at the highest level <strong>of</strong> development some minimum<br />
number remain. The time-series data tend to confirm<br />
what has been concluded from the cross-section.<br />
It is fortunate that the time-series sample contains at<br />
least two countries (Thail<strong>and</strong> <strong>and</strong> Turkey) in the highest<br />
agricultural category since many such countries are<br />
new in census-taking. As would have been predicted<br />
from the cross-sectional analysis, these two countries<br />
are the only two in the time-series sample which showed<br />
significant increases in urban traditional services. At<br />
other levels <strong>of</strong> development, all countries showed downward<br />
movement in urban traditional services or little<br />
change.<br />
The cross-sectional analysis shows a steady upward<br />
trend in rural traditional services from the least developed<br />
to the most developed. This trend cannot be<br />
confirmed or denied in the particular sample <strong>of</strong> time<br />
series at h<strong>and</strong>. In both the more developed <strong>and</strong> the less<br />
developed groups <strong>of</strong> countries, the pattern <strong>of</strong> change<br />
in the rural areas is very mixed, with some countries<br />
increasing in percentage <strong>of</strong> traditional services while<br />
others are decreasing. Also, according to the crosssectional<br />
analysis, the percentage <strong>of</strong> clerical <strong>and</strong> sales<br />
workers increases with the level <strong>of</strong> development in both<br />
urban <strong>and</strong> rural areas. This trend is not very well illustrated<br />
in the sample <strong>of</strong> time series, except perhaps in<br />
the rural areas <strong>of</strong> the more developed countries, where<br />
Sweden is the only exception to the upward trend.<br />
An irregular increase in urban pr<strong>of</strong>essional <strong>and</strong> administrative<br />
workers is described in the pooled-data<br />
analysis. The percentage <strong>of</strong> such workers was shown<br />
to remain relatively constant at the three lowest levels <strong>of</strong><br />
development <strong>and</strong> thereafter to increase substantially at<br />
the two highest levels <strong>of</strong> development. In the time series,<br />
almost all countries in both the more developed <strong>and</strong> the<br />
less developed categories show increases in urban pr<strong>of</strong>essional<br />
<strong>and</strong> administrativeworkers, excludingRomania<br />
<strong>and</strong> Turkey, which are relatively low in the developmental<br />
scale, <strong>and</strong> Canada. In rural areas, the percentage<br />
<strong>of</strong> pr<strong>of</strong>essional <strong>and</strong> technical workers was shown to increase<br />
substantially in the pooled-data analysis as between<br />
low <strong>and</strong> higher levels <strong>of</strong> development. This is<br />
emphatically confirmed in the time series where most<br />
countries showed substantial increases over time. (Canada<br />
is again an exception, together with Sweden.)<br />
Ideally, the trend data could be used to make some<br />
judgement about the role <strong>of</strong> urban population growth<br />
in the changing structure <strong>of</strong> the urban labour force.<br />
It is <strong>of</strong>ten argued that the urban service sector in developing<br />
countries is inflated because <strong>of</strong> large increases in<br />
labour supply resulting from urban population growth.<br />
Because entry requirements in service jobs are typically<br />
less stringent than in industrial jobs, it is alleged that<br />
76<br />
the increment in labour supply will tend to be absorbed<br />
disproportionately into the service sector. These arguments<br />
have been reviewed <strong>and</strong> found unconvincing."<br />
Furthermore, the author examines a "natural experiment"<br />
in Colombia, where rural disturbances led to a<br />
rapid labour flow to Bogota. The influx <strong>of</strong> workers,<br />
however, did not appear to depress the size <strong>of</strong> the<br />
manufacturing sector nor to inflate that <strong>of</strong> services.<br />
Instead, it is argued that the distribution <strong>of</strong> workers<br />
among sectors is determined primarily by dem<strong>and</strong> factors<br />
related to income growth <strong>and</strong> government policy.<br />
Another report" also questions the prevailing model,<br />
particularly the assumption that the service sector plays<br />
a predominant role as a point <strong>of</strong> entry into the labour<br />
force for migrants to urban areas.<br />
An inference about the relation between urban growth<br />
<strong>and</strong> service employment based on the present data is<br />
hazardous. Few trend observations are available <strong>and</strong><br />
occupational changes tend to be small <strong>and</strong> hence could<br />
easily be produced by a change in classification systems<br />
or in their application. Furthermore, the range <strong>of</strong> urban<br />
growth rates among the less developed countries providing<br />
trend data is very narrow. Of the nine countries<br />
<strong>of</strong> Africa, Asia (excluding Japan) <strong>and</strong> Latin America<br />
listed in table 28, seven have average annual urban<br />
intercensal growth rates in the range <strong>of</strong> 0.0410-0.0453.<br />
Only Thail<strong>and</strong> (0.0393) <strong>and</strong> Turkey (0.0555) lie outside<br />
<strong>of</strong> this narrow range. Interestingly, despite its slower<br />
urban growth, Thail<strong>and</strong> exhibits the largest gain in the<br />
relative size <strong>of</strong> the urban service sector <strong>of</strong> any developing<br />
country. By the classical hypothesis, one might have<br />
expected its gain to be smallest. Perhaps more pertinent<br />
is the general absence <strong>of</strong> relative growth in the urban<br />
service sector in the less developed countries during<br />
intercensal periods when urban populations typically<br />
grew by a factor <strong>of</strong> 50-60 per cent. If urban population<br />
growth were a powerful factor in increasing the size <strong>of</strong><br />
the service sector, such amounts <strong>of</strong> growth should have<br />
left a visible imprint. Net <strong>of</strong> pr<strong>of</strong>essional <strong>and</strong> administrative<br />
services, intercensal growth in the urban service<br />
sector in more agricultural countries was more than<br />
1 percentage point only in Thail<strong>and</strong> <strong>and</strong> Turkey. The<br />
sector fell by more than 1 percentage point in Costa<br />
Rica, Morocco, Peru, Puerto Rico <strong>and</strong> Sri Lanka. These<br />
results are consistent with the positions cited above <strong>and</strong><br />
fail to buttress what appears to be the conventional<br />
position.<br />
Table 30 shows time trends for the relative urbanization<br />
(i.e., proportion urban) <strong>of</strong> the various sectors<br />
<strong>of</strong> economic activity. These trends correspond to the<br />
cross-sectional trends given in table 25. The pooleddata<br />
analysis showed increasing urbanization in all<br />
sectors <strong>of</strong> economic activity in the course <strong>of</strong> development.<br />
The only exception was in agriculture, which<br />
showed slightly lower urbanization at the highest level<br />
<strong>of</strong> development than at the next highest level. This<br />
slight reversal in the trend towards greater urbanization<br />
<strong>of</strong> agriculture at higher levels <strong>of</strong> development was not<br />
upheld in the time trends. All countries except one, at<br />
all levels <strong>of</strong> development including the highest, showed<br />
increasing urbanization <strong>of</strong> agriculture over time. The<br />
77 Alan T. Udall, "The effect <strong>of</strong> rapid increase in labor supply<br />
on service employment in developing countries", Economic <strong>Development</strong><br />
<strong>and</strong> Cultural Change, vol, 24, No.4 (July 1976), pp.<br />
765-785.<br />
78 Dipak Mazumdar, ''The urban informal sector", World <strong>Development</strong><br />
(August 1976), pp. 655-679.
Occupational<br />
category<br />
TABLE 32. VAlUATIONS IN URBANIZATION OF OCCUPATIONS, MAJOR AREAS<br />
(Percentage points)<br />
Agriculture .<br />
Industry .<br />
Pr<strong>of</strong>essional/technical ..........•<br />
Clerical/sales .<br />
Traditional services .<br />
Occupation unknown .<br />
Adjusted deviation from mean in percentage 0/ particular<br />
occupations whose members reside in urban areas in:<br />
Latin<br />
America<br />
(N - 14)<br />
1.075<br />
9.218<br />
14.297<br />
8.731<br />
8.712<br />
8.148<br />
areas, rather than the labour force among six different<br />
occupations.<br />
The urbanization <strong>of</strong> agriculture does not show any<br />
interesting regional variation. In each region, the fraction<br />
<strong>of</strong> agriculturalists who live in urban areas is about<br />
as expected, after taking account <strong>of</strong> respective developmental<br />
levels. What is provocative about the table is the<br />
enormous regional variation in the urbanization <strong>of</strong> other<br />
occupations among the less developed countries. In Latin<br />
America, the countries have an 8-14 percentage point<br />
higher representation <strong>of</strong> each <strong>of</strong> the non-agricultural<br />
occupations in urban areas than expected, while countries<br />
in Asia have a deficit <strong>of</strong> 6-10 points, <strong>and</strong> those in<br />
Africa, a deficit <strong>of</strong> 3-11. When compared directly with<br />
countries in Asia, those in Latin America have an urban<br />
excess in non-agricultural occupations <strong>of</strong> 16-24 percentage<br />
points. That the discrepancies in Latin America<br />
are not simplyattributable to higher developmental levels<br />
is indicated both by the fact that developmental level is<br />
controlled in the comparison <strong>and</strong> also by the fact that<br />
the more developed countries as a group show no sizable<br />
urban surplus in non-agricultural occupations.<br />
Since the countries <strong>of</strong> Asia <strong>and</strong> Africa are relatively<br />
similar (below urban expectations largely because Latin<br />
America has inflated such expectations), it seems reasonable<br />
to view Latin America as the anomalous case.<br />
This result reinforces the earlier findingthat rural areas<br />
in Latin America have an unusually high prevalence <strong>of</strong><br />
agricultural occupations. Those pursuing non-agricultural<br />
occupations in Latin America are over-represented<br />
in urban areas, leaving rural areas to be, in unusual<br />
degree, agricultural enclaves. The spatial division <strong>of</strong><br />
East <strong>and</strong> Europe <strong>and</strong><br />
South Asia Africa Northern America<br />
(N - 18) (N - 10) (N -17)<br />
-1.189 2.713 -1.224<br />
-8.915 -3.252 3.763<br />
-9.412 -11.067 4.703<br />
-7.373 -4.956 3.534<br />
-7.537 -2.684 2.386<br />
-6.358 -8.594 5.079<br />
labour thus appears to be more specialized in Latin<br />
America than elsewhere. The regional differences cannot<br />
be explained away by differences in statistical treatment<br />
<strong>of</strong> farm wives. As is shown in chapter VI, rural<br />
women are unusually prominent in non-agricultural<br />
activities in Latin America <strong>and</strong> deficient in agricultural<br />
activities. Latin America has a high urban proportion in<br />
relation to its non-agricultural population, <strong>and</strong> the urban<br />
surplus extends to each major non-agricultural occupation,<br />
though not to agriculture itself.<br />
I. SYNTHETIC TIME TRENDS<br />
The data on labour force structures can be examined<br />
for time trends as well as for regional differences. That<br />
is, one can ask whether the occupational structures <strong>of</strong><br />
total, urban <strong>and</strong> rural labour forces have been similar<br />
in recent years to their structures <strong>of</strong> earlier years, controlling<br />
for the total percentage in agriculture <strong>and</strong> for the<br />
regions from which observations are derived. Once<br />
again, this analysis is made by constructing a categorical<br />
variable, in this case representing whether observations<br />
were recorded in the 1970 round <strong>of</strong> censuses (value = 1)<br />
or earlier (value = 0). Table 33 shows the results <strong>of</strong><br />
this procedure.<br />
The main result <strong>of</strong> this procedure is that labour force<br />
structures (the distribution <strong>of</strong> rural <strong>and</strong> urban occupations<br />
as a function <strong>of</strong> the percentage in agriculture) show<br />
a considerable stability over time. In only one <strong>of</strong> the 17<br />
instances shown in table 33 do observations for 1970<br />
differ from the adjusted mean by more than 2 percentage<br />
points. The exception is suggestive, however. Manufacturing<br />
occupations in urban areas are 4 percentage<br />
TABLE 33. CHANGES OVER TIME IN LABOUR FORCE STRUCTURE, CONTROLLING PERCENTAGE OF<br />
TOTAL LABOUR FORCE IN AGRICULTURE AND REGIONS FROM WHICH OBSERVATIONS DERIVE<br />
(Percentage points)<br />
Adjusted deviation /rom the mean In:<br />
Total labour force <strong>Urban</strong> labour force <strong>Rural</strong> labour force<br />
1970 Earlier 1970 Earlier 1970 Earlier<br />
census than census than census than<br />
Occupational round 1970 round 1970 round 1970<br />
category (N - 21) (N - 38) (N - 21) (N - 38) (N - 21) (N - 38)<br />
Agriculture ........• O.OOOa O.OOOa -1.070 0.591 -0.163 0.090<br />
Industry ........... -1.607 0.888 -2.554 1.411 -0.440 0.243<br />
Pr<strong>of</strong>essional/technical 0.308 -0.170 0.507 -0.280 -0.017 0.009<br />
Clerical/ sales .... ... 0.281 -0.155 1.249 -0.690 0.046 -0.025<br />
Traditional services . -0.335 0.185 0.001 -0.001 -0.476 0.263<br />
Occupation unknown . 1.353 -0.748 1.868 -1.032 1.047 -0.579<br />
a Because the percentage in agriculture <strong>of</strong> the total labour force is controlled, periods<br />
cannot deviate from the adjusted mean in this category.<br />
80
mechanization in Europe, according to Marx," was immediately<br />
responsible for increased employment <strong>of</strong><br />
women <strong>and</strong> even children in urban factories, since it<br />
reduced the amount <strong>of</strong> muscular power required for<br />
production. There was also a training factor. Craft skills<br />
<strong>of</strong>ten had to be learned through apprenticeship, which<br />
was unavailable to women. When these occupations<br />
were mechanized into factory work, the skills required<br />
were simple enough to be learned quickly without apprenticeship<br />
<strong>and</strong> thus became available to women, except<br />
where male-dominated unions conspired to keep<br />
them out."<br />
It is difficult to assess the net impact <strong>of</strong> mechanized<br />
technology on the economic activities <strong>of</strong> women since<br />
women also produced textile products at home with<br />
h<strong>and</strong> technology for sale in the market, both before <strong>and</strong><br />
after the introduction <strong>of</strong> mechanized technology. The<br />
process by which women transfer from household work<br />
to paid employment" is not basically different from that<br />
which has previously transferred most men from subsistence<br />
household economy to paid employment outside<br />
the household. Those households in which the husb<strong>and</strong><br />
alone obtains income outside the household are in<br />
this sense partially subsistence households." In the midnineteenth<br />
century, when Marx wrote, the market system<br />
was not as yet able to organize a significant portion <strong>of</strong><br />
women's household work, <strong>and</strong> thus he was perhaps correct<br />
in his attitude that the additional employment <strong>of</strong><br />
wivesin factories was a type <strong>of</strong> enslavement."<br />
8 Karl Marx, Capital, vol. I, part IV, section 3, "The proximate<br />
effects <strong>of</strong> machinery on the workman". See also Dorothy<br />
Atkinson, "Marx <strong>and</strong> the vanishing housewife", Wall Street Journal,<br />
25 June 1976; <strong>and</strong> Ross Davies, Women <strong>and</strong> Work (London,<br />
Hutchinson, 1975), chap. 3, "The industrial revolution".<br />
9 Paula M. Hudis, Amy L. Miller <strong>and</strong> David Snyder, "Changes<br />
in the structure <strong>of</strong> work <strong>and</strong> the sexual composition <strong>of</strong> occupations:<br />
1870-1900", paper prepared for presentation at the 73rd<br />
Annual Meeting <strong>of</strong> the American Sociological Association, San<br />
Francisco, 4·8 September 1978,pp. 21-25.<br />
10 The transfer <strong>of</strong> women to non-household work has perhaps<br />
gone furthest in the Union <strong>of</strong> Soviet Socialist Republics, where<br />
about 90 per c.ent <strong>of</strong> women are employed in the national economy<br />
or are studying without holding a job. V. Nikolayeva<br />
Tereshkova, "Zhenskii vopros v sovremennoe obshchestvennoi<br />
zhizni".<br />
11 In Peter A. Morrison <strong>and</strong> Judith P. Wheeler, Working<br />
Women <strong>and</strong> "Woman's Work": A Demographic Perspective on<br />
the Breakdown oj Sex Roles, R<strong>and</strong> paper series P-5669 (Santa<br />
Monica, California, the R<strong>and</strong> Corporation, 1976), pp. 4-5, housework<br />
is described as the "last great cottage industry".<br />
12 K. Marx, op, cit. A study <strong>of</strong> the female labour force during<br />
the industrial revolution concludes, on the basis <strong>of</strong> available<br />
statistical evidence, that the fears prevalent at the time <strong>of</strong> the<br />
disastrous consequences <strong>of</strong> the factory system on the home life<br />
<strong>of</strong> the working classes rested on an exaggerated idea <strong>of</strong> the extent<br />
<strong>of</strong> the labour force particip'ation <strong>of</strong> married women. The<br />
statistical evidence that was available suggests that few married<br />
women were employed at the time. Ivy Pinchbeck, Women<br />
Workers <strong>and</strong> the Industrial Revolution, 1750-1850 (London,<br />
George Routledge, 1930),pp. 197-199.<br />
There was additionally, <strong>of</strong> course, the fact that the female<br />
contemporaries <strong>of</strong> Marx bore more children than do modem<br />
women in the European countries which Marx was describing<br />
<strong>and</strong> were thus even more burdened by family responsibilities<br />
than modern women. The issue <strong>of</strong> family size versus employment<br />
<strong>of</strong> women is complex. On the one h<strong>and</strong>, the presence <strong>of</strong><br />
children obviously imposes an extra work burden on wives which<br />
<strong>of</strong>ten discourages them from seeking work outside the household.<br />
On the other h<strong>and</strong>, the presence <strong>of</strong> children, particularly<br />
adolescent children, can sometimes create a need for extra cash<br />
income to educate them which can push a married woman into<br />
the labour force. There is also the consideration, <strong>of</strong>ten expressed,<br />
that it may be the very presence <strong>of</strong> job oJ?POrtunities for women<br />
which motivates them to limit their family size, rather than the<br />
scarcity <strong>of</strong> children which motivates them to seek jobs. In the<br />
83<br />
In general, the concept <strong>of</strong> economic activity remains<br />
more ambiguous for females than for males because <strong>of</strong><br />
the important <strong>and</strong> multifaceted role women continue to<br />
play in household production. Women in less developed<br />
countries, especially in Africa, <strong>of</strong>ten function as sellers<br />
in traditional market-places, <strong>and</strong> as such they receive a<br />
cash payment for produce sold; however, the individual<br />
stalls <strong>of</strong> traditional markets are managed by family members<br />
<strong>and</strong> much <strong>of</strong> the produce sold is produced within<br />
the household economy. Similarly, women in Latin<br />
America <strong>of</strong>ten find paid employment as domestics in<br />
urban areas. This, again, is a form <strong>of</strong> household organization<br />
<strong>of</strong> labour, albeit not the household <strong>of</strong> the domestic<br />
servant herself, <strong>and</strong> as such this type <strong>of</strong> employment<br />
may be more appropriately included in the traditional<br />
category <strong>of</strong> household activity."<br />
As married women are increasingly entering the nonhousehold<br />
labour force on a career basis, many activities,<br />
such as child care <strong>and</strong> care <strong>of</strong> the sick <strong>and</strong> the elderly,<br />
are being organized in non-household institutions. Thus,<br />
they are paid for in cash <strong>and</strong> become "economic" activities.<br />
In the more developed countries, a myriad <strong>of</strong> power<br />
appliances are provided by industry for sale to the household<br />
in order to replace partially the work <strong>of</strong> women.<br />
Clothing is infrequently manufactured within the household,<br />
except as a hobby. Food production is for some<br />
becoming more <strong>of</strong> a hobby rather than a time-consuming<br />
necessity, as food-processing work has been increasingly<br />
absorbed by industrial <strong>and</strong> commercial establishments.<br />
Household services are now available commercially,<br />
such as laundry <strong>and</strong> child care <strong>and</strong> institutional care <strong>of</strong><br />
the elderly.> Today in the less developed countries, the<br />
United States <strong>of</strong> America, for example, the labour force participation<br />
rates <strong>of</strong> mothers have risen steadily in recent years, apparently<br />
as a result <strong>of</strong> increased employment opportunities.<br />
United States Department <strong>of</strong> Labor, Employment St<strong>and</strong>ards Administration,<br />
Women's Bureau; <strong>and</strong> Japanese Ministry <strong>of</strong> Labor,<br />
Women's <strong>and</strong> Minors' Bureau, The Role <strong>and</strong> Status <strong>of</strong> Women<br />
Workers in the United States <strong>and</strong> Japan (Washington, D.C.,<br />
Government Printing Office, 1976), p, 3.<br />
13 Women <strong>of</strong>ten participate in remunerative labour within the<br />
household, such as farming or taking in boarders or sewing. In<br />
a recent study <strong>of</strong> women in the United States <strong>of</strong> America, it was<br />
estimated that the percentage <strong>of</strong> women engaged in remunerative<br />
labour has not changed since 1930, merely the location <strong>of</strong><br />
women's labour. What is new about women's gainful work in<br />
the United States is that much <strong>of</strong> it is now located outside the<br />
household. Another concomitant change is the increasing tendency<br />
<strong>of</strong> women to work full time in remunerative employment<br />
as there are fewer opportunities for part-time labour outside the<br />
household. Joann Vanek, ''Variations in a sixty hour week",<br />
Ekistics, vol. 40, No. 236 (July 1975), p. 38.<br />
14 A certain countertrend must be admitted here. It <strong>of</strong>ten happens<br />
that a certain amount <strong>of</strong> labour is pushed back by industry<br />
into the household. Increasingly, furniture, toys <strong>and</strong> other items<br />
require final assembly in the home. Sometimes "do-it-yourself"<br />
kits are sold in which pre-made parts are <strong>of</strong>fered for sale <strong>and</strong><br />
the entire operation or assembly <strong>and</strong> finishing is performed by<br />
the household. Consumers in modern stores <strong>of</strong>ten provide much<br />
<strong>of</strong> the labour <strong>of</strong> retailin$ themselves in the form <strong>of</strong> "self-service".<br />
The increasing availability <strong>of</strong> household machinery may also<br />
call forth certain house <strong>and</strong> garden production which could not<br />
otherwise have been contemplated. This <strong>and</strong> other interesting<br />
considerations concerning the relative efficiencies <strong>of</strong> household<br />
production as opposed to non-household production are discussed<br />
by Scott Bums in Home Inc. (Garden City, New York,<br />
Doubleday, 1975). An interesting discussion <strong>of</strong> the impact <strong>of</strong><br />
electric <strong>and</strong> safety razors on the barber-shop industry is contained<br />
in Victor R. Fuchs <strong>and</strong> Jean Alex<strong>and</strong>er Wilburn, Productivity<br />
Differences Within the Service Sector, National Bureau<br />
<strong>of</strong> Economic Research, Occasional Paper No. 102 (New York,<br />
Columbia University Press, 1967), p. 75. Prior to this technological<br />
innovation, men spent considerable time <strong>and</strong> money in barber<br />
shops getting shaves, trims <strong>and</strong> shampoos, When the new
TABLE 35. AVERAGE PERCENTAGE OF SPECIFIED OCCUPATIONS IN URBAN AND RURAL AREAS<br />
OCCUPIED BY FEMALES AMONG COUNTRIES CLASSIFIED BY LEVEL OF DEVELOPMENT<br />
P,rcentage 01 total Prolesslonal Clerical<br />
labour lorceln <strong>and</strong> administra- <strong>and</strong> sales Traditional<br />
agrlcultur, Agrlcultur, Induslry live services services services Unknown<br />
Total<br />
65.0 or more ....•..... 44.9 16.5 17.0 19.6 31.5 33.7<br />
50.0-64.9 ............. 24.0 18.6 28.8 23.4 42.9 26.2<br />
35.0-49.9 ............ , 13.4 13.5 30.9 21.4 47.4 17.3<br />
15.0-34.9 ............. 26.0 19.8 34.3 37.4 60.4 17.1<br />
15.0 or less ........... 10.2 15.0 33.9 54.3 58.0 28.8<br />
<strong>Urban</strong><br />
65.0 or more .......... 30.6 12.2 18.9 19.6 32.6 31.2<br />
50.0-64.9 ............. 16.1 15.6 30.7 25.1 46.7 23.5<br />
35.0-49.9 ............. 10.1 12.8 32.2 23.1 50.2 17.2<br />
15.0-34.9 ............. 20.2 20.0 33.6 38.3 60.2 17.0<br />
15.0 or less ........... 9.3 15.8 33.3 54.8 56.6 28.6<br />
<strong>Rural</strong><br />
65.0 or more .......... 45.3 20.4 15.1 18.7 28.5 33.1<br />
50.0-64.9 .............. 24.2 20.5 26.3 18.6 37.4 27.5<br />
35.0-49.9 ............. 13.9 15.6 27.9 15.7 41.1 18.6<br />
15.0-34.9 ............. 26.4 19.9 36.6 32.5 62.6 17.3<br />
15.0 or less ••••••• 0 ••• 10.5 12.6 38.0 51.5 63.1 29.9<br />
comparability from one country to another than in other<br />
aspects <strong>of</strong> labour force classification.<br />
Table 35 shows the average percentage <strong>of</strong> jobs in<br />
each occupational category which are held by females<br />
in rural <strong>and</strong> urban areas for countries classified by development<br />
level. At the lowest level <strong>of</strong> development,<br />
almost half <strong>of</strong> agricultural jobs in the rural areas are<br />
held by females, <strong>and</strong> females hold almost a third <strong>of</strong><br />
urban agricultural jobs. At all levels <strong>of</strong> development,<br />
the female share <strong>of</strong> agricultural employment is somewhat<br />
higher in rural areas than in urban areas, perhaps<br />
due to the fact that spatial isolation in rural areas may<br />
prevent some females from combining non-household<br />
employment with family obligations. The urban/rural<br />
differences in this regard are largest in countries at the<br />
lower levels <strong>of</strong> development, where rural isolation is<br />
more problematical, than in the more developed countries,<br />
where rural isolation has been largely overcome by<br />
motor-car transport. In both urban <strong>and</strong> rural areas, the<br />
share <strong>of</strong> females in agriculture declines at progressively<br />
higher levels <strong>of</strong> development, until at the highest level<br />
<strong>of</strong> development the female share averages roughly 10<br />
per cent in both the urban <strong>and</strong> the rural agricultural<br />
labour force. In an important sense, this finding contradicts<br />
a prevailing impression, illustrated above, that<br />
development <strong>and</strong> increased mechanization bring with<br />
them an increasing role for women in agriculture.<br />
Although the share <strong>of</strong> females in industry <strong>of</strong> the rural<br />
areas is irregularly related to development level, it can<br />
at least be said that the share <strong>of</strong> females in the most developed<br />
category is considerably less than in the other<br />
categories, perhaps reflecting the disappearance <strong>of</strong> rural<br />
home h<strong>and</strong>icraft industries, which were <strong>of</strong>ten the job<br />
<strong>of</strong> women, in the more developed countries. Thus, not<br />
surprisingly, at low levels <strong>of</strong> development the female<br />
share in industry is higher in the rural areas than in<br />
urban areas, while the reverse is true at the higher levels.<br />
There is no discernible trend in female share <strong>of</strong> urban<br />
industry by level <strong>of</strong> development. One might presume<br />
that female participation in industrial activities outside<br />
the household is more a matter <strong>of</strong> custom <strong>and</strong> cultural<br />
practice within the various regions than <strong>of</strong> degree <strong>of</strong><br />
modernization. Evidently, the relatively static role <strong>of</strong><br />
87<br />
manufacturing in developmental changes in the urban<br />
labour force that was documented in chapter V extends<br />
to females <strong>and</strong> males alike.<br />
In contrast to industry <strong>and</strong> agriculture, persistent increases<br />
are registered at successively higher levels <strong>of</strong><br />
development in the female share <strong>of</strong> each <strong>of</strong> the tertiary<br />
categories in both urban <strong>and</strong> rural areas. Since the output<br />
<strong>of</strong> these jobs is usually non-material, they do not require<br />
an extraordinary amount <strong>of</strong> physical strength. As<br />
the pattern <strong>of</strong> development is similar in tertiary activities<br />
<strong>of</strong> the urban <strong>and</strong> rural areas, only the average pattern<br />
for both areas combined is discussed here. The most<br />
feminine <strong>of</strong> the tertiary categories is the category <strong>of</strong> traditional<br />
services. Even at the lowest level <strong>of</strong> development,<br />
this category is almost one third female. At the<br />
higher levels <strong>of</strong> development, the female share exceeds<br />
one half. Included in this category are many domestic<br />
servants, waitresses, <strong>and</strong> hotel maids who utilize fundamentally<br />
housekeeping skills in their work. Although<br />
domestic service was once an important source <strong>of</strong> female<br />
employment in the developed countries, it is now rapidly<br />
vanishing. However, females remain important in serving<br />
<strong>and</strong> housekeeping duties in non-household institutions.<br />
Domestic service can be an important source <strong>of</strong><br />
female employment in areas where non-household employment<br />
<strong>of</strong> females is not as yet well organized. It is<br />
currently an important avenue <strong>of</strong> mobility in Latin<br />
America, where rural girls are <strong>of</strong>ten taken into urban<br />
households as paid servants.<br />
The second most feminine <strong>of</strong> the tertiary employment<br />
categories is the clerical <strong>and</strong> sales category. At the lowest<br />
level <strong>of</strong> development the share <strong>of</strong> females in these employments<br />
is a distinct minority; the female share averages<br />
only 20 per cent. However, at the highest level <strong>of</strong><br />
development, the females become a majority in these<br />
employments (54 per cent). In the pr<strong>of</strong>essional <strong>and</strong> administrative<br />
category, the female share at the lowest<br />
level is only 17 per cent. Although the female share does<br />
not achieve a majority in this category as it does in the<br />
other tertiary categories at high levels <strong>of</strong> development,<br />
still the female share <strong>of</strong> one third in the highest development<br />
category is double the female share at the lowest<br />
level <strong>of</strong> development. It is noteworthy, however, that
TABLE 36. PERCENTAGE FEMALE OF OCCUPATIONS IN URBAN AREAS, COUNTRIES WITII<br />
AT LEAST TWO OBSERVATIONS<br />
Pr<strong>of</strong>essional Clerical<br />
<strong>and</strong> admlnlstra- <strong>and</strong> sales Traditional<br />
Country Date Agriculture Industry tlve services services services Unknown<br />
Less agricultural countries»<br />
Canada .............. 1961 4.9 12.6 26.7 53.0 49.7 26.5<br />
1971 10.2 12.6 38.6 54.5 44.8 38.2<br />
Japan ................ 1960 33.2 23.9 24.2 38.5 65.1 3.7<br />
1965 37.3 25.1 24.3 43.6 62.5 5.0<br />
1970 39.9 25.4 23.4 45.8 59.7 5.0<br />
Puerto Rico ........... 1960 2.2 21.1 35.5 36.5 56.1 45.6<br />
1970 3.4 22.5 35.5 47.2 38.0 55.0<br />
Sweden .............. 1960 9.4 14.5 33.3 57.4 72.3 4.5<br />
1970 12.6 16.0 38.9 62.3 71.3 10.0<br />
United Kingdom<br />
Engl<strong>and</strong> <strong>and</strong> Wales .. 1951 8.6 22.5 31.3 48.7 69.2 22.6<br />
1961 9.3 19.7 30.3 53.0 66.1 37.2<br />
United States <strong>of</strong> America 1940 6.6 15.7 31.8 37.0 56.4 36.2<br />
1950 11.1 16.6 26.8 49.1 55.1 37.5<br />
1960 7.8 14.8 31.6 51.1 59.7 38.2<br />
1970 17.5 17.7 31.4 63.7 53.7 33.3<br />
More agricultural countries»<br />
Costa Rica ........... 1963 2.8 14.0 48.1 25.7 72.8 11.7<br />
1973 2.2 12.6 41.8 30.6 68.4 16.2<br />
Ecuador .............. 1962 4.8 15.8 44.2 25.6 68.3 13.5<br />
1974 3.4 11.9 38.7 32.6 68.1 16.3<br />
Greece ............... 1961 25.2 19.0 28.8 20.7 45.3 38.2<br />
1971 23.1 15.2 32.0 28.5 41.3 11.4<br />
Morocco .......•..... 1960 4.1 15.4 21.5 11.6 32.0 3.5<br />
1971 10.8 15.9 20.2 14.1 39.7 23.2<br />
Nicaragua ............ 1963 3.5 19.3 48.6 44.4 82.8 22.9<br />
1971 3.4 16.3 37.2 47.3 80.1 31.8<br />
Peru ................ 1961 11.2 13.5 35.1 30.4 59.9 14.3<br />
1972 7.3 10.6 32.5 32.8 57.0 27.6<br />
Romania ............• 1956 51.8 19.6 32.8 39.9 55.5 54.7<br />
1966 59.7 22.5 41.9 53.3 61.2 43.2<br />
Sri Lanka ............ 1953 14.1 7.1 22.0 6.7 24.2 39.2<br />
1970 9.7 13.5 27.5 12.6 34.7 0.0<br />
Thail<strong>and</strong> ............. 1954 44.9 21.6 30.2 36.8 45.2 1.5<br />
1970 41.8 27.4 29.7 47.3 56.0 35.3<br />
Turkey ..........•..•. 1950 29.6 8.6 11.1 9.0 12.6 45.4<br />
1960 7.6 6.9 16.3 1.3 10.1 0.0<br />
1970 17.6 12.9 22.2 12.9 9.4 4.6<br />
a Less than 35 per cent <strong>of</strong> labour force in agriculture.<br />
b More than 35 per cent <strong>of</strong> labour force in agriculture.<br />
much <strong>of</strong> this increase is achieved between the lowest <strong>and</strong> countries, moreover, the selection <strong>of</strong> technical pr<strong>of</strong>esthe<br />
next lowest level <strong>of</strong> development. Increases in fem- sions open to women is increasing rapidly.<br />
inization at higher levels <strong>of</strong> development are modest.<br />
Two pr<strong>of</strong>essions in the pr<strong>of</strong>essional category-teaching C. TRENDS IN FEMINIZATION OF OCCUPATIONS<br />
<strong>and</strong> nursing-are probably important sources <strong>of</strong> female<br />
employment at all levels <strong>of</strong> development, since the care As before, a comparison is made between the pooled<br />
<strong>of</strong> the young <strong>and</strong> the ill involve some degree <strong>of</strong> tradi- data (table 35) <strong>and</strong> the time-trend data for individual<br />
tional female household skills. At higher levels <strong>of</strong> de- countries (tables 36 <strong>and</strong> 37). Table 35 shows that the<br />
velopment, however, both <strong>of</strong> these pr<strong>of</strong>essions rely average percentage particibation <strong>of</strong> females in agriculincreasingly<br />
on technical skill learned in formal institu- ture tends to decline, in oth urban <strong>and</strong> rural areas,<br />
tions outside the household. In the more developed though irregularly, as level <strong>of</strong> development increases. In-<br />
88
TABLB 37. PERCENTAGB FEMALB OF OCCUPATIONS IN RURAL AREAS, COUNTRIBS WITH<br />
AT LEASTTWO OBSERVATIONS<br />
Pr<strong>of</strong>essional Clerical<br />
<strong>and</strong> adminlstra- <strong>and</strong> sales Traditional<br />
Country Date A.griculture 1ndustr" tlve services services services Unknown<br />
Less agricultural countries»<br />
Canada .............. 1961 10.5 6.8 36.3 51.0 50.0 24.4<br />
1971 19.6 8.3 49.1 52.3 53.1 35.8<br />
Japan .....•...•..•.•• 1960 52.3 27.1 27.2 40.8 62.4 2.8<br />
1965 52.1 27.5 27.6 44.1 62.6 3.3<br />
1970 53.7 29.2 27.7 47.4 61.7 1.9<br />
Puerto Rico ........... 1960 1.7 21.3 32.5 20.8 53.5 51.0<br />
1970 2.1 22.9 37.1 34.8 37.7 60.5<br />
Sweden .............. 1960 8.3 9.8 33.2 54.2 79.7 4.7<br />
1970 21.5 9.9 47.9 57.2 76.8 6.0<br />
United Kingdom<br />
Engl<strong>and</strong> <strong>and</strong> Wales " 1951 9.1 15.6 34.4 46.5 70.4 21.0<br />
1961 9.4 14.1 31.2 50.9 68.3 34.8<br />
United States <strong>of</strong> 1940 5.7 9.3 36.9 28.3 62.9 34.1<br />
America ........... 1950 8.3 11.3 30.9 43.7 64.8 39.0<br />
1960 8.6 13.8 35.9 49.2 70.5 35.1<br />
1970 8.2 18.8 32.7 64.5 62.2 52.9<br />
More agricultural countries»<br />
Costa Rica ........... 1963 1.6 12.8 44.0 13.1 62.9 5.0<br />
1973 1.5 10.5 38.8 18.0 57.5 12.5<br />
Ecuador .............. 1962 7.8 35.0 43.1 18.4 68.8 6.9<br />
1974 4.6 21.5 35.2 19.2 56.2 11.2<br />
Greece .......•.....•. 1961 40.9 20.5 28.7 12.0 25.4 42.4<br />
1971 37.3 13.2 30.3 17.7 26.6 20.8<br />
Morocco ............. 1960 7.7 19.1 2.3 2.6 32.3 3.1<br />
1971 11.2 14.9 2.9 2.2 33.2 15.5<br />
Nicaragua ............ 1963 4.3 23.9 55.3 55.9 89.5 55.3<br />
1971 3.2 13.8 40.9 34.5 70.3 31.9<br />
Peru •••••••••••••• '0 1961 14.5 30.3 36.3 25.9 60.4 15.6<br />
1972 9.0 29.3 23.3 27.9 51.7 24.9<br />
Romania ..........••• 1956 54.3 9.7 29.8 19.6 34.1 35.7<br />
1966 58.5 6.9 41.5 25.0 31.5 41.6<br />
Sri Lanka ............ 1953 28.0 25.7 25.1 11.1 22.0 50.3<br />
1970 27.3 19.1 28.7 7.7 27.8 0.0<br />
Thail<strong>and</strong> ............. 1954 51.3 28.4 17.6 48.1 44.1 0.1<br />
1970 49.8 30.7 26.1 56.7 38.2 40.1<br />
Turkey ...•........... 1950 50.9 20.7 5.2 5.9 8.2 44.8<br />
1960 51.8 15.7 6.8 1.5 3.5 0.0<br />
1970 52.5 31.7 23.3 4.8 6.0 12.3<br />
a Less than 35f':,r cent <strong>of</strong> labour force in agriculture.<br />
b More than 3 per cent <strong>of</strong> labour force in agriculture.<br />
spection <strong>of</strong> individual countries in tables 36 <strong>and</strong> 37, <strong>of</strong>ten does not require great physical strength for many<br />
however, reveals that declining feminization in agricul- <strong>of</strong> the tasks involved. Early mechanization <strong>of</strong> agriculture<br />
ture occurs predominantly in the less developed coun- <strong>of</strong>ten involves the use <strong>of</strong> fairly erode machinery which is<br />
tries. All six <strong>of</strong> the more developed countries listed difficult for females to operate <strong>and</strong> this may be a factor<br />
registered increases in agricultural feminization over in their declining participation in the agricultural sector<br />
time in both urban <strong>and</strong> rural areas. These divergent <strong>of</strong> the less developed countries. As discussed previously,<br />
patterns in female share <strong>of</strong> agricultural employment be- however, the field technology in the more developed<br />
tween the more developed <strong>and</strong> the less developed coun- countries which was once very difficult for females to<br />
tries are perhaps related to the factor <strong>of</strong> physical strength. manage has now been improved <strong>and</strong> automated to the<br />
Non-mechanized agriculture typically requires a lot <strong>of</strong> point where females are more able to operate the necesh<strong>and</strong><br />
digging <strong>and</strong> picking, which is time-consuming but sary machinery.<br />
89
VD. THE FAMILY IN RURAL AND URBAN SETIINGS<br />
This chapter examines relations between an important<br />
social process, urbanization, <strong>and</strong> a major social institution,<br />
the family. In particular, it focuses on similarities<br />
<strong>and</strong> differences between families in rural <strong>and</strong> urban<br />
settings. The topic is difficult because <strong>of</strong> the conceptual<br />
confusion surrounding the word "family", because <strong>of</strong><br />
the wide variety <strong>of</strong> family forms in different societies<br />
<strong>and</strong> because <strong>of</strong> the relative absence <strong>of</strong> data as comparable<br />
<strong>and</strong> precise as are found in other fields <strong>of</strong><br />
demography.<br />
In societies undergoing modernization, families are<br />
faced with basic changes in role structure, in decisionmaking<br />
patterns, in the socialization <strong>of</strong> the young <strong>and</strong><br />
in the ways in which the family relates to increasingly<br />
complex non-family organizations. For example, in<br />
some rural societies the family functions as a complete<br />
productive unit, working the l<strong>and</strong> <strong>and</strong> educating <strong>of</strong>fspring<br />
to assume the same tasks. In urban areas, adults<br />
typically take jobs in organizations outside the family<br />
<strong>and</strong> children attend school <strong>and</strong> are socialized to roles<br />
that can be quite different from those <strong>of</strong> their parents.<br />
<strong>Urban</strong>ization is associated with a greater distinction between<br />
the home <strong>and</strong> the work-place <strong>and</strong> with the transfer<br />
<strong>of</strong> functions previously within the province <strong>of</strong> the<br />
family to other institutions. It is <strong>of</strong>ten associated with<br />
increased economic activity for women outside the<br />
home, which is likely to be associated with changed<br />
roles within the family.<br />
Families in transitional <strong>and</strong> modern societies are reported'<br />
to be affected by three fundamental. processes:<br />
the assumption <strong>of</strong> roles outside the family by all members;<br />
the involvement <strong>of</strong> persons outside the family in<br />
the socialization process <strong>and</strong> in social control <strong>of</strong> members;<br />
<strong>and</strong> the increased need for families to develop<br />
competencies to meet the requirements <strong>of</strong> their external<br />
participation <strong>and</strong> to choose among various forms <strong>of</strong><br />
external participation. The basic fact <strong>of</strong> modem urban<br />
life is that family members are faced with many alternatives<br />
for meeting the contingencies <strong>of</strong> life. They must<br />
continually make choices with respect to jobs, schools<br />
<strong>and</strong> housing. The development <strong>of</strong> competence to make<br />
the best choices is one <strong>of</strong> the new dem<strong>and</strong>s or functions<br />
<strong>of</strong> the family.<br />
Families differ in their ability to adapt to modernization.<br />
Very little is known about which types <strong>of</strong> families<br />
or kinship arrangements facilitate adaptation even in a<br />
single cultural setting. This chapter attempts to summarize<br />
some <strong>of</strong> what is known about the types <strong>of</strong> families<br />
<strong>and</strong> kinship groups in a variety <strong>of</strong> settings <strong>and</strong><br />
to suggest how they are affected by <strong>and</strong> in tum affect<br />
the urbanization process.<br />
Although the family may be viewed as "a powerful<br />
1 Marvin B. Sussman, "Family systems in the seventies: analyses,<br />
policies <strong>and</strong> programs", Annals, No. 396 (1971), pp. 40<br />
56. See also "Adaptive, directive <strong>and</strong> integrative behavior", Family<br />
Process,vol. 7 (1968), Pl'. 224-24'.<br />
93<br />
agent <strong>of</strong> social change", it is also influenced by change.'<br />
Major societal changes, planned or unplanned, are usually<br />
accompanied by adjustments in family type <strong>and</strong><br />
function. <strong>Urban</strong>ization <strong>and</strong> industrialization have produced<br />
many benefits for families <strong>and</strong> societies. Yet the<br />
nature <strong>and</strong> pace <strong>of</strong> urbanization also exert pressures on<br />
the family. As family function <strong>and</strong> structure change in<br />
response to urbanization, an underst<strong>and</strong>ing <strong>of</strong> the nature<br />
<strong>of</strong> such changes is imperative both for social planning<br />
<strong>and</strong> for the development <strong>of</strong> social science. This chapter<br />
describes the structure <strong>and</strong> functions <strong>of</strong> the family in rural<br />
<strong>and</strong> urban settings <strong>and</strong> discusses changes that typically<br />
or <strong>of</strong>ten occur during the process <strong>of</strong> urbanization.<br />
A. BASIC CONCEPTS<br />
The word "family" is ambiguous; it has many different<br />
meanings in everyday <strong>and</strong> scientific usage. This<br />
attempt at clarification does not resolve the ambiguity.<br />
The most that can be done is to review some <strong>of</strong> the<br />
main human groups commonly discussed under the<br />
heading "family" <strong>and</strong> to indicate which concepts are<br />
stressed in this chapter.<br />
It should be emphasized that this is not an idle exercise<br />
in semantics, because some <strong>of</strong> the more important<br />
generalization about the "family in urban <strong>and</strong> rural<br />
settings" may be valid or invalid depending upon what<br />
is meant by "family". Does urbanization involve the<br />
breakdown or destruction <strong>of</strong> the family? Are "extended<br />
families" more common in urban or rural societies;<br />
among the rich or the poor? Is the "family" likely to<br />
disappear in post-industrial societies? The answers to<br />
these questions depend in part upon what is meant by<br />
the word "family' . Thus, in order to discuss changes<br />
in family structure <strong>and</strong> function, it is necessary to work<br />
from a clear definition. Although there is no universally<br />
accepted definition <strong>of</strong> the family, one that is widely used<br />
is as follows:<br />
"A family is (1) a set <strong>of</strong> persons related to each<br />
other by blood, marriage or adoption, <strong>and</strong> constituting<br />
a social system whose structure is specified by familial<br />
positions <strong>and</strong> (2) whose basic societal function is<br />
replacement."8<br />
This definition is more comprehensive than some common<br />
definitions which limit the term "family" to residential<br />
groups, for example, that which defines the family<br />
as "those related persons who live together within a<br />
household, usually with common eating as the criterion<br />
<strong>of</strong> co-living".' For census purposes, the definition recommended<br />
by the United Nations is:<br />
2 Report <strong>of</strong> the United Nations World <strong>Population</strong> Conference,<br />
1974, Bucharest, 19"30 August 1974 (United Nations publication,<br />
Sales No. E.75.XIII.3).<br />
8 Robert F. Winch, The Modern Family, 3rd ed. (New York,<br />
Holt, Rinehart <strong>and</strong> Winston, 1971), p, 26.<br />
4 Irene B. Taeuber, "Change <strong>and</strong> transition in family structures",<br />
in Arthur B. Campbell <strong>and</strong> others, eds., The Family in<br />
Transition. Fogarty International Center, Proceedings No. 3<br />
(Bethesda, Maryl<strong>and</strong>, National Institute <strong>of</strong> Health, 1971), p. 18.
"The family is defined as those members <strong>of</strong> the<br />
household ... who are related, to a specific degree,<br />
through blood, adoption or marriage. The degree <strong>of</strong><br />
relationship used in determining the limits <strong>of</strong> the family<br />
is dependent upon the uses to which the data are<br />
to be put <strong>and</strong> so cannot be precisely set for worldwide<br />
use.""<br />
When st<strong>and</strong>ing by itself, without qualifiers, the word<br />
"family" may be taken to refer to a group <strong>of</strong> relatives, a<br />
kinship group. The existence <strong>of</strong> kinship relationships is<br />
largely a matter <strong>of</strong> objective fact; but individuals, groups<br />
<strong>and</strong> societies differ in their recognition <strong>of</strong> kin (second<br />
<strong>and</strong> third cousins may be virtually unknown to one<br />
another) or in the meaning <strong>and</strong> importance <strong>of</strong> kin (an<br />
uncle may be someone who is visited occasionally <strong>and</strong><br />
with whom emotional ties are weak, or he may be someone<br />
with whom the niece or nephew has close emotional<br />
ties <strong>and</strong> strong, well-defined mutual obligations). Thus,<br />
families differ quantitatively in the number <strong>of</strong> kin recognized<br />
<strong>and</strong> qualitatively in terms <strong>of</strong> the kinds <strong>of</strong> ties<br />
among kin, whether a kin relationship involves emotional<br />
closeness or distance, frequent or infrequent interaction,<br />
strong or weak obligations <strong>of</strong> support, loyalty<br />
<strong>and</strong> so forth. The concept <strong>of</strong> family used in this chapter<br />
focuses on the rights <strong>and</strong> duties associated with membership<br />
in the group as well as on the functions <strong>of</strong> the<br />
group. As such, the family is one <strong>of</strong> several substructures<br />
or institutions necessary to perform necessary social<br />
functions.<br />
B. FAMILY TYPES AND FORMS<br />
The family is the social unit through which a society<br />
replaces itself. The family has primary responsibility<br />
for the reproduction <strong>and</strong> care <strong>of</strong> children nearly everywhere.<br />
Even in those societies where alternatives to family<br />
responsibility for nurturing the next generation exist,<br />
they are not widespread, e.g., the kibbutz in Israel,<br />
which involve only a small fraction <strong>of</strong> the total population<br />
<strong>of</strong> Israel. These basic functions <strong>of</strong> reproduction <strong>and</strong><br />
nurture are associated with numerous other functions<br />
<strong>and</strong> together lead to a variety <strong>of</strong> family types which<br />
differ from one society to another, <strong>and</strong> in different sectors<br />
<strong>of</strong> the same society.<br />
In a study <strong>of</strong> comparative family structure, a key<br />
distinction is that between the nuclear family <strong>and</strong> the<br />
extended family. The nuclear family is the group typically<br />
consisting <strong>of</strong> husb<strong>and</strong>, wife <strong>and</strong> their children.<br />
In terms <strong>of</strong> kinship, it is the group <strong>of</strong> persons each <strong>of</strong><br />
whom is related to every other by one <strong>of</strong> three relationships:<br />
husb<strong>and</strong>-wife; parent-child; sibling-sibling. 6 A<br />
group in which one <strong>of</strong> the spouses is missing <strong>of</strong>ten is<br />
considered a variant form <strong>of</strong> the nuclear family, sometimes<br />
referred to by such terms as "one-parent" or<br />
"incomplete" (nuclear) family.<br />
The extended family is a group containing persons, at<br />
least some <strong>of</strong> whom are related by other, more distant<br />
relationships, such as gr<strong>and</strong>parent <strong>and</strong> gr<strong>and</strong>child, uncle<br />
<strong>and</strong> niece/nephew, brother-in-law <strong>and</strong> brother-in-law,<br />
cousin <strong>and</strong> cousin. By this definition, the typical person<br />
in any society "has" or "belongs to" an extended fam-<br />
5 Principles <strong>and</strong> Recommendations for the 1970 <strong>Population</strong><br />
Censuses (United Nations publication, Sales No. E.67.XVII.3),<br />
p.20.<br />
6 Paul Bohannan, "An alternate residence classification", in<br />
Paul Bohannan <strong>and</strong> John Middleton, eds., Marriage, Family <strong>and</strong><br />
Residence (New York, The Natural History Press, 1968).<br />
94<br />
ily, because he or she has a variety <strong>of</strong> kin other than<br />
siblings, spouse, parent or children. But societies differ<br />
greatly in the extent to which an extended family is recognized<br />
as an important social <strong>and</strong> economic group in<br />
its own right, whether it st<strong>and</strong>s apart <strong>and</strong> has important<br />
social, economic <strong>and</strong> psychological functions. Another<br />
way <strong>of</strong> describing this dimension <strong>of</strong> family structure is<br />
in terms <strong>of</strong> whether the nuclear family or some form <strong>of</strong><br />
the extended family tends to take precedence in social<br />
organization. In some societies, the nuclear family st<strong>and</strong>s<br />
relatively self-sufficient <strong>and</strong> independent <strong>of</strong> wider kinship<br />
units (though these ties never disappear entirely);<br />
in others, the nuclear family is deeply embedded in a<br />
larger extended family (though almost never disappearing<br />
as a recognizable entity).<br />
Another important point about the extended family<br />
is that it can take many different forms. A nuclear family<br />
always contains the same set <strong>of</strong> kin. But different<br />
extended families can be described by naming different<br />
sets <strong>of</strong> relatives. For example, there is the extended family<br />
consisting <strong>of</strong> an elderly male, his spouse, his male<br />
descendants in the direct line (sons, gr<strong>and</strong>sons etc.) <strong>and</strong><br />
their spouses <strong>and</strong> unmarried children-<strong>of</strong>ten called the<br />
"patriarchal family". Or there is an extended family consisting<br />
<strong>of</strong> two brothers, their spouses <strong>and</strong> children-in<br />
effect, two nuclear families in the same generation combined-<strong>of</strong>ten<br />
called a "joint family". Much has been<br />
written on types <strong>of</strong> extended families, but no st<strong>and</strong>ard<br />
system <strong>of</strong> classification <strong>and</strong> terminology exists.<br />
Members <strong>of</strong> kinship groups are bound by a system<br />
<strong>of</strong> mutual aid. This network <strong>of</strong> rights <strong>and</strong> obligations<br />
encompasses such functions as care <strong>of</strong> the children <strong>and</strong><br />
support <strong>of</strong> the aged. In traditional societies, the primary<br />
obligation was that <strong>of</strong> children to their parents. Parents<br />
could expect to be taken care <strong>of</strong> when they could no<br />
longer work. The reverse appears to be true in modern<br />
societies where parents must provide care <strong>and</strong> especially<br />
education for their children <strong>and</strong> rely on a variety <strong>of</strong><br />
social security programmes for care <strong>of</strong> aged parents.<br />
In transitional societies, adults <strong>of</strong>ten face a double obligation<br />
<strong>of</strong> providing for both parents <strong>and</strong> children, <strong>and</strong><br />
the stress associated with such obligations affects all<br />
family members.<br />
Families <strong>and</strong> households<br />
A household refers to a group <strong>of</strong> individuals who live<br />
together. "Living together" in turn is defined as sharing<br />
the same house or other dwelling unit, or having a<br />
common domestic budget <strong>and</strong> eating most or, at least,<br />
the principal meals together. The criterion for membership<br />
is co-residence. "A household or domestic group ...<br />
is made up <strong>of</strong> people who live in the same house or<br />
compound.... It is a spatial, or 'local group' ". 7<br />
Definitions <strong>of</strong> household make no reference to kinship.<br />
Thus, the members <strong>of</strong> a household mayor may<br />
not be related to one another. And a group <strong>of</strong> totally<br />
unrelated persons (in the kinship sense) living together<br />
constitute a household. In fact, in most times <strong>and</strong> places,<br />
most households contain families, that is, groups <strong>of</strong><br />
related persons living together in the same dwelling, <strong>and</strong><br />
this fact has given rise to enormous confusion. A recent<br />
United Nations study states that the concepts <strong>of</strong> "household"<br />
<strong>and</strong> "family" are <strong>of</strong>ten confused because <strong>of</strong> their<br />
close relationship to each other <strong>and</strong> because unambigu-<br />
7 Ibid., p. 318.
A comparative study" covering roughly a 50-year<br />
period in the west, sub-Saharan Africa, India, China <strong>and</strong><br />
Japan demonstrates change in family structure with industrialization<br />
but takes note that the nature <strong>of</strong> the relationship<br />
is not clear. The concept <strong>of</strong> polar types <strong>of</strong><br />
families was also challenged more than 25 years ago by<br />
the work <strong>of</strong> HSU 16 on the traditional Chinese family, <strong>and</strong><br />
again a decade ago in a series <strong>of</strong> papers by Levy <strong>and</strong><br />
Burch." Levy's argument, that because <strong>of</strong> economic<br />
<strong>and</strong> demographic factors the extended family could not<br />
become the predominant form in any society, was substantiated<br />
empirically by Burch <strong>and</strong> by a United Nations<br />
study <strong>of</strong> households."<br />
This section is less concerned with documenting the<br />
existence <strong>of</strong> differential family size in urban/industrial<br />
areas <strong>and</strong> rural!agricultural areas than with identifying<br />
other differences which explain, in part, the differences<br />
in family type, size <strong>and</strong> function in rural <strong>and</strong> urban settings.<br />
These differences are described below, not necessarily<br />
in order <strong>of</strong> importance, <strong>and</strong> without attention to<br />
the complex interactions among them. Some demographic<br />
influences are given special attention, not because<br />
they are the most important, but because <strong>of</strong> the<br />
nature <strong>of</strong> this work <strong>and</strong> the fact that they have been<br />
relatively overlooked in previous work.<br />
<strong>Rural</strong> high fertility<br />
Agrarian societies have typically been characterized<br />
by high fertility. A direct consequence <strong>of</strong> this high fertility<br />
is that the typical member <strong>of</strong> a rural society is apt<br />
to have at any age a larger number <strong>of</strong> close kin than is<br />
the typical member <strong>of</strong> a highly urbanized, low-fertility<br />
society. This is true with respect to all categories <strong>of</strong> kin,<br />
except for ascendants in the direct line. That is, no<br />
matter what the level <strong>of</strong> fertility, a given person has only<br />
two parents, four gr<strong>and</strong>parents etc. When fertility is<br />
high, that person has more children <strong>and</strong> gr<strong>and</strong>children,<br />
more siblings, more cousins, more aunts <strong>and</strong> uncles,<br />
more nieces <strong>and</strong> nephews. This point is more or less<br />
obvious, but has not been sufficiently appreciated until<br />
recently due to the absence <strong>of</strong> calculations which could<br />
show the size <strong>of</strong> the effect <strong>of</strong> fertility on numbers <strong>of</strong> kin<br />
<strong>and</strong> due to an emphasis in the literature on the contrary<br />
effects <strong>of</strong> mortality."<br />
15 William J. Goode, "The family as an element in the world<br />
revolution", in Peter Rose, The Study <strong>of</strong> Society (New York,<br />
R<strong>and</strong>om House, 1967), ,-,p. 528-538 (reprint <strong>of</strong> the material originally<br />
published by Institute <strong>of</strong> Life Insurance); <strong>and</strong> William J.<br />
Goode, World Revolution <strong>and</strong> Family <strong>Patterns</strong> (New York, The<br />
Free Press <strong>of</strong> Glencoe, 1963).<br />
16 Francis L. K. Hsu, ''The myth <strong>of</strong> Chinese family size",<br />
American Journal <strong>of</strong> Sociology. vol. 48 (March, 1943), pp. 555<br />
572.<br />
17 Marion J. Levy, Jr., "Aspects <strong>of</strong> the analysis <strong>of</strong> family<br />
structure" in Ansley J. Coale <strong>and</strong> others, Aspects <strong>of</strong> the Analysis<br />
oj Family Structure (Princeton, New Jersey, Princeton University<br />
Press, 1965), pp. 1-63; see also Thomas K. Burch, "The size<br />
<strong>and</strong> structure <strong>of</strong> families: a comparative analysis <strong>of</strong> census data",<br />
American Sociological Review, vol. 32, No. 3 (1967), pp. 347<br />
363.<br />
18 Manual VII. Methods <strong>of</strong> Projecting Households <strong>and</strong> Families.<br />
19 Relevant formulae <strong>and</strong> data have been given in recent articles<br />
by Goodman, Keyfitz <strong>and</strong> Pullum, in which they calculate<br />
the number <strong>of</strong> kin a person has at various ages for stable populations<br />
under different fertility <strong>and</strong> mortality regimes. L. Goodman,<br />
N. Keyfitz <strong>and</strong> T. Pullum, "Family formation <strong>and</strong> the<br />
frequency <strong>of</strong> various kinship relationships", Theoretical <strong>Population</strong><br />
Biology, vol. 5 (1974), pp. 1-27. See also "Family formation<br />
<strong>and</strong> the frequency <strong>of</strong> vanous kinship relationships: addendum",<br />
96<br />
Levy," among others, has suggested that high mortality<br />
prevented the attainment <strong>of</strong> large, complex households<br />
in pre-modem societies. This statement clearly is true<br />
in so far as it involves the simultaneous survival <strong>of</strong> three<br />
or more persons in a direct line <strong>of</strong> descent, or <strong>of</strong> other<br />
specific combinations <strong>of</strong> kin. The probability <strong>of</strong> the<br />
survival <strong>of</strong> a gr<strong>and</strong>father, or <strong>of</strong> a father, son <strong>and</strong> gr<strong>and</strong>son<br />
being alive simultaneously under conditions <strong>of</strong> high<br />
mortality is small indeed. Thus, certain types <strong>of</strong> family<br />
households, such as the classic patriarchal family <strong>of</strong><br />
China, are precluded as a modal form. What the results<br />
<strong>of</strong> Goodman, Keyfitz <strong>and</strong> Pullum make clear, however,<br />
is that under most demographic regimes (the exception<br />
would be low fertility <strong>and</strong> high mortality) any given person<br />
is likely to have a large number <strong>of</strong> surviving kin <strong>of</strong><br />
various types with whom he could reside. Thus, various<br />
complex residential family forms or household forms<br />
have been possible, demographically speaking, in most<br />
societies past <strong>and</strong> present.<br />
Residential stability <strong>and</strong> compact settlement<br />
Meaningful comparisons among societies as to degree<br />
<strong>of</strong> residential mobility or migration are difficult to make<br />
in precise quantitative terms. But for pre-modern<br />
societies that have passed the hunting-gathering or<br />
nomadic stage to reach that <strong>of</strong> settled agriculture, the<br />
degree <strong>of</strong> spatial mobility is typically less than in modern<br />
urban societies." Movement that does occur more <strong>of</strong>ten<br />
is a collective rather than an individual matter, involving<br />
movement <strong>of</strong> a family or even several families from a<br />
local community. An individual is more likely to live in<br />
close proximity to his kin during most <strong>of</strong> his lifetime. In<br />
addition, local communities tend to be small <strong>and</strong> compact,<br />
so that frequent, even daily contact with kin was<br />
not only possible but likely. In a modem metropolis,<br />
kin may live at a considerable distance from one another<br />
<strong>and</strong> have little occasion to see one another in. their daily<br />
round <strong>of</strong> activities, so that interaction with one's kin<br />
may require a special effort.<br />
Occupational homogeneity<br />
Another feature <strong>of</strong> agrarian societies which promotes<br />
kinship solidarity is the fact that most members <strong>of</strong> such<br />
societies pursue the same or very closely related occupations.<br />
In a word, most people are farmers, This situation<br />
ties them to the l<strong>and</strong>, to which they may have rights<br />
<strong>of</strong> ownership or use, a fact which reinforces the residential<br />
stability noted above. Often, rights to l<strong>and</strong> are<br />
held jointly by a kinship group, or at least children anticipate<br />
ownership through inheritance because their occupational<br />
future too depends upon l<strong>and</strong>. Further, prior to<br />
the increased population growth rates that accompany<br />
early stages <strong>of</strong> modernization, the problem <strong>of</strong> excess<br />
numbers <strong>of</strong> heirs does not arise, so that sons are not<br />
driven to seek new l<strong>and</strong>s or new occupations elsewhere.<br />
Lastly, if most members <strong>of</strong> a kinship group are agriculturists,<br />
it is natural for them to tum to one another<br />
for help <strong>and</strong> advice; <strong>and</strong> economic collaboration among<br />
Theoretical <strong>Population</strong> Biology, vol. 6, No. 3 (December 1975),<br />
pp. 376-381.<br />
20 M. J. Levy, Jr., loco cit.<br />
21 The Determinants <strong>and</strong> Consequences <strong>of</strong> <strong>Population</strong> Trends,<br />
vol. I (United Nations publication, Sales No. E.71.XIII.5), p.I71;<br />
<strong>and</strong> K. C. Zachariah, A Historical Study <strong>of</strong> Internal Migration<br />
in the Indian Sub-continent, 1901-1931 (New York, Asia Publishing<br />
House, 1964).
kin is the rule rather than the exception. This situation<br />
contrasts with that in urban societies, where an extensive<br />
division <strong>of</strong> labour results in kin commonly being in<br />
different <strong>and</strong> unrelated occupations." Even mutual underst<strong>and</strong>ing<br />
<strong>of</strong> one another's work becomes difficult,<br />
much less extensive mutual help. Collaboration among<br />
kin in economic production disappears in the typical<br />
case, remaining primarily in the case <strong>of</strong> small, familyheld<br />
businesses.<br />
Lack <strong>of</strong> institutional alternatives<br />
Reliance on kin or kin-based institutions is great in<br />
agrarian societies partially for the simple reasons that<br />
institutional alternatives are less common. There are few<br />
if any hospitals or schools or banks. Needs must be filled<br />
in the community at large, which usually means first <strong>and</strong><br />
foremost by kin. These may be viewed as informal arrangements.<br />
In fact, however, in agrarian societies, they<br />
are likely to be very formal, in the sense <strong>of</strong> being<br />
routine <strong>and</strong> matters <strong>of</strong> strict obligation, according to<br />
prevailing social norms."<br />
Poverty<br />
Pre-modern agrarian societies tend to be "poor"<br />
societies in terms <strong>of</strong> per capita income. Life is close to<br />
the margin <strong>of</strong> subsistence, <strong>and</strong> the chances <strong>of</strong> catastrophe<br />
are high (crop failure, fire, sickness, death, flood). For<br />
the average individual or small family group, the prospects<br />
for a totally self-reliant life are slight indeed.<br />
Coupled with the absence <strong>of</strong> specialized "helping" institutions<br />
mentioned above, this means that one must<br />
<strong>of</strong>ten look for help outside <strong>of</strong> oneself <strong>and</strong> one's own resources.<br />
Again, the natural <strong>and</strong> obvious place to look is<br />
towards one's relatives.<br />
This probably is the meaning <strong>of</strong> demographic data<br />
showing a direct relationship between income <strong>and</strong> headship<br />
rates (see below). Other things being equal, poor<br />
people, who are less able to maintain their own households,<br />
"double up." With greater wealth, a higher proportion<br />
<strong>of</strong> adults st<strong>and</strong> on their own residentially.<br />
D. THE HOUSEHOLD IN RURAL AND URBAN SETTINGS<br />
The attempt to learn more about families in rural <strong>and</strong><br />
urban settings has <strong>of</strong>ten led researchers to analyse census<br />
or sample survey data on households. Although families<br />
<strong>and</strong> households are not quite the same thing, this research<br />
approach makes sense, since families <strong>and</strong> households<br />
are closely related. In most societies, most<br />
households contain a group <strong>of</strong> kin or related persons,<br />
that is, a family group. And in some societies, the word<br />
22 For an example <strong>of</strong> the diversity <strong>and</strong> complexity <strong>of</strong> occupations<br />
in contemporary urban societies see United States <strong>of</strong> America,<br />
Department <strong>of</strong> Labor, Dictionary <strong>of</strong> Occupational Titles<br />
(Washington, D.C., Government Printing Office 1977). The diversity<br />
<strong>of</strong> status <strong>of</strong> the occupations is discussed in C. B. Nam <strong>and</strong><br />
Mary G. Powers, "Changes in the relative status levels <strong>of</strong> workers<br />
in the U.S.; 1950-1960", Social Forces, vol. 48 (1968), pp. 158<br />
177; <strong>and</strong> in Mary G. Powers <strong>and</strong> Joan J. Holmberg, "Occupational<br />
status scores: changes introduced by the inclusion <strong>of</strong><br />
women", Demography, vol. 15, No.2 (1978), pp. 183-204.<br />
23 Claude Levi-Strauss, "Reciprocity, the essence <strong>of</strong> social life" ,<br />
in R. L. Coser <strong>and</strong> Rosenberg, eds., Sociological Theory (New<br />
York, The Macmillan Co., 1957), pp. 84-94; <strong>and</strong> Marcel Maus,<br />
The Gift (New York, The Norton Co., 1967). See also the description<br />
<strong>of</strong> kin-based economic obligations in Nigeria in John<br />
A. Caldwell, "Toward a restatement <strong>of</strong> demographic transition<br />
theory", <strong>Population</strong> <strong>and</strong> <strong>Development</strong> Review, vol. 2 (September<br />
December 1976), pp. 321-366.<br />
97<br />
"family" has come close to meaning "the group <strong>of</strong> kin<br />
I live with". But the main reason for the frequency <strong>of</strong><br />
this approach is simply that more detailed statistical<br />
data are available for households than for family or<br />
kinship groups in the broader sense. The basic unit <strong>of</strong><br />
enumeration in a modern population census is the household.<br />
And data on individual household members allow<br />
one to study the size <strong>of</strong> households, as well as their<br />
composition in terms <strong>of</strong> age, sex, marital status <strong>and</strong><br />
relationship to household head.<br />
One <strong>of</strong> the best documented findings in household<br />
demography relates to the association between urbanization<br />
<strong>and</strong> household size, Broadly speaking, urban residence<br />
is associated with smaller residential groupings<br />
(households or residential families). This is so in three<br />
separate though related senses: (1) in contemporary<br />
international comparisons, highly urbanized countries<br />
have appreciably smaller households, on average, than<br />
do less urbanized countries; (2) for those countries<br />
where long time series <strong>of</strong> data are available, household<br />
size tends to decline as urbanization occurs (along with<br />
the closely intertwined processes <strong>of</strong> industrialization<br />
<strong>and</strong> modernization), (3) within contemporary populations,<br />
average household size among the urban segment<br />
tends to be smaller than among the rural segment. Documentation<br />
<strong>and</strong> discussion <strong>of</strong> each <strong>of</strong> these findings follow.<br />
Data on household size are readily available for a<br />
large number <strong>of</strong> populations. A recent United Nations<br />
report lists more than 100 countries <strong>and</strong> territories for<br />
which distributions <strong>of</strong> households by size were available<br />
in the 1960 round <strong>of</strong> population censuses." Convenient<br />
compilations <strong>of</strong> these data have been published in the<br />
Demographic Yearbook for the years 1955, 1962, 1963,<br />
1968,1971 <strong>and</strong> 1973. 25<br />
A recent summary <strong>of</strong> these data shows that for the<br />
developing countries, most <strong>of</strong> which have not reached<br />
high levels <strong>of</strong> urbanization, average household size is<br />
approximately 5.2 persons, compared with an over-all<br />
average <strong>of</strong> 3.5 persons for the more developed countries,<br />
most <strong>of</strong> which are highly urban." Broadly speaking,<br />
then, average household size in the less urbanized<br />
countries tends to be approximately 50 per cent greater<br />
than in the more urbanized countries.<br />
For the world as a whole, the distribution <strong>of</strong> individual<br />
countries <strong>and</strong> territories by average household<br />
size is distinctly bi-modal, that is, there is relatively<br />
little overlap between the separate distributions for the<br />
more developed <strong>and</strong> the less developed countries. In a<br />
recent compilation, the modal category for the more<br />
developed countries was from 3.00 to 3.49, <strong>and</strong> only<br />
10 out <strong>of</strong> 42 had average household sizes <strong>of</strong> 4.0 or<br />
greater. The modal category for less developed countries<br />
was from 5.00 to 5.49, <strong>and</strong> only 3 out <strong>of</strong> 72 had average<br />
household sizes <strong>of</strong> 4.0 or less." These data suggest a<br />
fairly strong <strong>and</strong> consistent, though far from perfect,<br />
cross-sectional association between degree <strong>of</strong> urbanization<br />
<strong>and</strong> size <strong>of</strong> household. As is shown below this is<br />
due in large part to the inverse association between<br />
urbanization <strong>and</strong> fertility, <strong>and</strong> to the fact that societal<br />
24 Manual VII. Methods <strong>of</strong> Projecting Households <strong>and</strong> Families.<br />
Table 1, pp. 7-10.<br />
25 United Nations publications, Sales Nos. 55.x1II.6,<br />
ass.xm.r, E.65Xm.l, E.69Xm.l, E/F.72.XIII.l <strong>and</strong><br />
E/F.74Xm.I.<br />
26 The Determinants <strong>and</strong> Consequences <strong>of</strong> <strong>Population</strong> Trends,<br />
vol. I, p. 337, table X.I.<br />
27 Ibid., p. 338, table X.2. See also T. K. Burch, lac. cit.
TABLB 39. AVERAGB HOUSEHOLD SIZE, RURAL AND URBAN POPULATIONS,<br />
ACCORDING TO RECENT NATIONAL CENSUSES<br />
COll1ltr)l<br />
Africa<br />
Benin ..<br />
Mauritius ........•.........<br />
Morocco .<br />
Southern Rhodesia- .<br />
Latin America<br />
Argentina .<br />
Bahamas .<br />
Brazil .<br />
British Honduras .<br />
Chile .<br />
Costa Rica .<br />
Dominican Republic .<br />
Ecuador .<br />
Guatemala .<br />
Guyana .<br />
Jamaica .<br />
Mexico .<br />
Nicaragua .<br />
Panama .<br />
Peru .<br />
Puerto Rico .<br />
St. Lucia .<br />
St. Vincent .<br />
Northern America<br />
Canada .<br />
United States<br />
<strong>of</strong> America .<br />
Asia"<br />
India ..<br />
Indonesia .<br />
Iran .<br />
Israel .<br />
Japan .<br />
Jordan .<br />
Pakistan ..<br />
Republic <strong>of</strong> Korea .<br />
Sikkim .<br />
Syrian Arab Republic .......•<br />
Turkey .<br />
Europe<br />
Albania .<br />
Austria .<br />
Bulgaria .<br />
Czechoslovakia .<br />
Denmark .<br />
Finl<strong>and</strong> .<br />
France ..<br />
German Democratic<br />
Republic .<br />
Greece ..<br />
Hungary .<br />
Icel<strong>and</strong> ..<br />
Irel<strong>and</strong> ..<br />
Norway .<br />
Pol<strong>and</strong> .<br />
Portugal .<br />
Dateo!<br />
census<br />
1961<br />
1962<br />
1960<br />
1962<br />
1960<br />
1963<br />
1960<br />
1960<br />
1960<br />
1970<br />
1963<br />
1960<br />
1962<br />
1964<br />
1960<br />
1960<br />
1961-1962<br />
1963<br />
1960<br />
1961<br />
1960<br />
1960<br />
1966<br />
1966<br />
1960<br />
1970<br />
1960<br />
1960<br />
1966<br />
1966<br />
1965<br />
1970<br />
1961<br />
1960<br />
1968<br />
1960<br />
1960<br />
1961-1962<br />
1965<br />
1960<br />
1961<br />
1965<br />
1961<br />
1960<br />
1960<br />
1970<br />
1962<br />
1968<br />
1971<br />
1961<br />
1963<br />
1970<br />
1960<br />
1966<br />
1960<br />
1960<br />
1960<br />
98<br />
<strong>Urban</strong><br />
4.5<br />
4.9<br />
4.3<br />
4.0<br />
3.5<br />
4.0<br />
4.8<br />
4.8<br />
5.2<br />
5.0<br />
5.4<br />
4.8<br />
5.4<br />
5.2<br />
5.1<br />
3.0<br />
5.3<br />
5.8<br />
4.4<br />
4.8<br />
4.4<br />
3.7<br />
4.4<br />
3.6<br />
3.2<br />
3.1<br />
5.2<br />
4.9<br />
4.9<br />
3.6<br />
3.8<br />
3.5<br />
5.5<br />
5.5<br />
5.6<br />
5.4<br />
4.3<br />
6.0<br />
5.3<br />
5.3<br />
2.6<br />
2.9<br />
3.0<br />
2.7<br />
2.8<br />
2.7<br />
3.0<br />
3.1<br />
2.6<br />
3.6<br />
2.7<br />
2.7<br />
3.5<br />
4.1<br />
2.6<br />
3.1<br />
4.0<br />
<strong>Rural</strong><br />
4.5<br />
4.8<br />
5.1<br />
5.4<br />
4.3<br />
4.2<br />
5.4<br />
4.7<br />
6.0<br />
5.5<br />
6.0<br />
5.1<br />
5.0<br />
5.3<br />
5.0<br />
4.3<br />
5.8<br />
6.3<br />
4.9<br />
4.9<br />
5.2<br />
4.2<br />
3.9<br />
4.1<br />
3.6<br />
3.4<br />
5.2<br />
4.3<br />
5.0<br />
4.0<br />
4.4<br />
4.1<br />
5.1<br />
5.4<br />
5.8<br />
5.6<br />
5.6<br />
5.9<br />
5.9<br />
6.1<br />
3.7<br />
3.5<br />
3.3<br />
3.3<br />
3.8<br />
3.4<br />
3.3<br />
3.3<br />
2.9<br />
4.1<br />
3.1<br />
3.2<br />
4.2<br />
4.0<br />
3.4<br />
3.9<br />
3.9<br />
Absolute<br />
difference<br />
(l'UI'al/urban)<br />
0.0<br />
-0.1<br />
0.8<br />
1.4<br />
0.8<br />
0.2<br />
0;6<br />
-0.1<br />
0.8<br />
0.5<br />
0.6<br />
0.3<br />
-0.4<br />
0.1<br />
-0.1<br />
1.3<br />
0.3<br />
0.5<br />
0.5<br />
0.1<br />
0.8<br />
0.5<br />
-0.5<br />
0.5<br />
0.4<br />
0.3<br />
0.0<br />
-0.6<br />
0.1<br />
0.4<br />
0.6<br />
0.6<br />
-0.4<br />
-0.1<br />
0.2<br />
0.2<br />
1.3<br />
-0.1<br />
0.6<br />
0.8<br />
1.1<br />
0.6<br />
0.3<br />
0.6<br />
1.0<br />
0.7<br />
0.3<br />
0.2<br />
0.3<br />
0.5<br />
0.4<br />
0.5<br />
0.7<br />
-0.1<br />
0.8<br />
0.8<br />
-0.1<br />
Ratio o!<br />
rural to<br />
urban<br />
1.00<br />
0.98<br />
1.19<br />
1.35<br />
1.23<br />
1.05<br />
1.12<br />
0.98<br />
1.15<br />
1.10<br />
1.11<br />
1.06<br />
0.93<br />
1.02<br />
0.98<br />
1.43<br />
1.09<br />
1.09<br />
1.11<br />
1.02<br />
1.18<br />
1.14<br />
0.89<br />
1.14<br />
1.12<br />
1.10<br />
1.00<br />
0.88<br />
1.02<br />
1.11<br />
1.16<br />
1.17<br />
0.93<br />
0.98<br />
1.04<br />
1.04<br />
1.30<br />
0.98<br />
1.11<br />
1.15<br />
1.42<br />
1.21<br />
1.10<br />
1.22<br />
1.36<br />
1.26<br />
1.10<br />
1.06<br />
1.12<br />
1.14<br />
1.15<br />
1.19<br />
1.20<br />
0.98<br />
1.31<br />
1.26<br />
0.98
<strong>of</strong> complexity, most broadly defined in this context as<br />
the extent to which adults other than husb<strong>and</strong>s <strong>and</strong> wives<br />
tend to share a residence with one another. Households<br />
can be made more complex through the addition either<br />
<strong>of</strong> unrelated persons, such as servants, guests, boarders<br />
<strong>and</strong> lodgers, or <strong>of</strong> related persons or kin. In broad comparative<br />
perspective, complexity due to the addition <strong>of</strong><br />
non-relatives typically has not been quantitatively important.<br />
That is, even in populations where households<br />
are fairly complex, the average number <strong>of</strong> non-relatives<br />
per household remains small.29 Seldom does the average<br />
number <strong>of</strong> non-relatives account for as much as 10 per<br />
cent <strong>of</strong> average total household size. In the contemporary<br />
world, non-relatives are particularly important in households<br />
in Latin America where the institution <strong>of</strong> live-in<br />
domestic servants is widespread. But even there, nonrelatives<br />
are less important than kin as a source <strong>of</strong><br />
household complexity.so Historically, it is argued that<br />
changes in the size <strong>of</strong> households in Great Britain over<br />
time have been due in part to important changes in the<br />
number <strong>of</strong> domestic servants." But these are exceptions.<br />
Is there a simple relationship between urbanization<br />
<strong>and</strong> household complexity? The conventional view, both<br />
in the popular mind <strong>and</strong> in sociological literature, has<br />
been that there is-that rural households tend to be<br />
more complex than urban. Indeed, a major theme <strong>of</strong><br />
writing on the family has been 'that <strong>of</strong> the "breakdown"<br />
<strong>of</strong> the extended family with urbanization <strong>and</strong> industrialization<br />
<strong>and</strong> <strong>of</strong> its replacement with the isolated<br />
nuclear family as the typical urban form. S2 The typical<br />
rural household, according to this view, is the classic<br />
extended family, comprising three or more generations<br />
<strong>of</strong> kin in a direct line plus a variety <strong>of</strong> collateral relatives<br />
all living "under one ro<strong>of</strong>", A powerful image <strong>of</strong> this<br />
large <strong>and</strong> complex household dominates the literature on<br />
traditional, rural family systems. The image is associated<br />
especially with the patriarchal family systems <strong>of</strong> Asia<br />
(notably in China, India <strong>and</strong> Japan), but also frequently<br />
is invoked with respect to family systems <strong>of</strong> the west (for<br />
example, the rural family in nineteenth-century Europe<br />
<strong>and</strong> the United States)."<br />
Over time, this image <strong>of</strong> the rural household has come<br />
under increasing attack, as various researchers have put<br />
forward evidence to show that the extended family<br />
household, far from being typical or commonplace, is<br />
rare; or have advanced theoretical arguments as to why<br />
their frequent occurrence would be unlikely. As early as<br />
1943, one writerv discussed the "myth" <strong>of</strong> Chinese<br />
family size. Subsequently, another work, dismissing the<br />
image as stereotype, spoke <strong>of</strong> the "classical family <strong>of</strong><br />
Western nostalgia"." A review <strong>of</strong> international data on<br />
households concludes that "the nuclear family (husb<strong>and</strong>wife-children)<br />
is the predominant living arrangement<br />
almost everywhere in the world", <strong>and</strong> speaks <strong>of</strong> the contrary<br />
view as "a sociological tradition more than as a<br />
statistical reality". S6 In another study, a detailed thea-<br />
89 T. K. Burch,loc. cit., p. 359, table 7.<br />
80 Ibid. .<br />
81 P. Laslett, op. cit., pp. 125-158.<br />
82 William F. Ogburn <strong>and</strong> M. F. Nimk<strong>of</strong>f, Technology <strong>and</strong><br />
the Changing Family (Boston, Houghton-Mitftin, 1955); W. J.<br />
Goode, ''The family as an element in the world revolution".<br />
88 For example, C. Kirkpatrick, op, cit., pp. 137-139; W. Kephart,<br />
op. cit., pp. 58-60; William Petersen, <strong>Population</strong>, 3rd ed,<br />
(New York, Macmillan, 1975), pp. 413-416.<br />
8. F. L. K. Hsu, loco cit.<br />
88 W. Goode, World Revolution <strong>and</strong> Family <strong>Patterns</strong>.<br />
86 Donald J. Bogue, Principles <strong>of</strong> Demography (New York,<br />
John Wiley <strong>and</strong> Sons, 1969), pp. 369-370.<br />
100<br />
retical argument is developed to show that "the general<br />
outlines <strong>and</strong> nature <strong>of</strong> the actual family structures (including<br />
household composition) have been virtually<br />
identical in certain strategic respects in all known societies<br />
in world history for well over 50 per cent <strong>of</strong> the<br />
members <strong>of</strong> those societies"." Burch interpreted a<br />
variety <strong>of</strong> contemporary census data on household size<br />
<strong>and</strong> composition as being broadly supportive <strong>of</strong> Levy's<br />
thesis." As a result <strong>of</strong> the writings <strong>of</strong> these <strong>and</strong> other<br />
researchers, the old conventional view <strong>of</strong> the rural household<br />
as invariably complex has been partially replaced<br />
by the view that households are virtually the same everywhere<br />
<strong>and</strong> at all times, that there are no important<br />
differences in household composition between urban <strong>and</strong><br />
rural populations.<br />
All things considered, this new view is as exaggerated<br />
<strong>and</strong> misleading as the old view it was supposed to correct.<br />
It is exaggerated in that, although the differences<br />
in household complexity between rural <strong>and</strong> urban populations<br />
may not be as great as implied by the older view,<br />
there are non-trivial differences. A variety <strong>of</strong> data suggest<br />
that, on average, households in rural societies have<br />
tended to be more complex than those in urban societies.<br />
The newer view also is misleading in so far as it focuses<br />
attention on the household as a residential group to the<br />
neglect <strong>of</strong> broader kinship groups, since it is largely the<br />
latter that manifest the "family complexity" characteristic<br />
<strong>of</strong> rural social systems.<br />
The direct statistical evidence on rural/urban differences<br />
in household complexity is fragmentary at bestthere<br />
is much less systematic coverage in time <strong>and</strong> space<br />
than for household size. But some relevant data do exist.<br />
The household headship rate-the proportion <strong>of</strong> the<br />
population in some age-sex group who are household<br />
heads-is in effect an inverse measure <strong>of</strong> household<br />
complexity. The higher the proportion <strong>of</strong> adults maintaining<br />
their own households, the fewer there are to<br />
double up with other adults to produce the more complex<br />
forms.<br />
In a comparison <strong>of</strong> headship rates among more developed<br />
<strong>and</strong> less developed countries, it was found that<br />
the pattern differed by sex. Male headship rates tended<br />
to be slightly higher in the more developed countries,<br />
female headship rates slightly lower." In neither case<br />
are the absolute differences large, although the relative<br />
differences between female rates in the two sets <strong>of</strong> countries<br />
are large.because female headship rates generally<br />
are low. On balance, these data suggest a generally inverse<br />
relation between national developmental level <strong>and</strong><br />
household complexity. In developed societies, more<br />
adults maintain their own households; fewer double up<br />
with relatives.<br />
A similar pattern emerges from a correlation analysis<br />
<strong>of</strong> headship rates <strong>and</strong> urbanization. Age-specific headship<br />
rates <strong>and</strong> the degree <strong>of</strong> urbanization show moderate<br />
positive correlations for males (the highest being 0.57<br />
at ages 25-34) <strong>and</strong> a mixed picture for females-small<br />
positive correlations for the 15-24 <strong>and</strong> 65+ age groups<br />
<strong>and</strong> from small to moderate negative correlations for the<br />
87 M. J. Levy, Jr., loco cit., pp. 41-42.<br />
S8 T. K. Burch, loco cit.<br />
S9 The high female rates in the less developed countries may<br />
reflect the large number <strong>of</strong> countries <strong>of</strong> Latin America in the<br />
sample. Thus, the data may not be representative <strong>of</strong> the situation<br />
in Asia <strong>and</strong> Mrica. See The Determinants <strong>and</strong> Consequences <strong>of</strong><br />
<strong>Population</strong> Trends, vol. I, pp. 349-350.
other female age groups." Similar results were obtained<br />
for the correlation between headship rates <strong>and</strong> per<br />
capita income <strong>and</strong> between headship rates <strong>and</strong> percentage<br />
<strong>of</strong> the labour force in non-agricultural activities.<br />
In terms <strong>of</strong> time trends, a recent United Nations study<br />
concludes on the basis <strong>of</strong> the small amount <strong>of</strong> evidence<br />
available-pertaining to Europe, the United States <strong>of</strong><br />
America <strong>and</strong> Japan-that "generally headship rates<br />
have increased over time in all sex-age groups except in<br />
the middle-age groups <strong>of</strong> females".41 To the extent that<br />
these time trends in headship rates are associated with<br />
trends in urbanization they may <strong>of</strong>fer additional evidence<br />
that higher headship rates are part <strong>and</strong> parcel <strong>of</strong><br />
the urban way <strong>of</strong> life.<br />
Systematic comparisons <strong>of</strong> headship rates for rural<br />
<strong>and</strong> urban populations within countries are rare. Data<br />
from a very small set <strong>of</strong> countries (Norway, Finl<strong>and</strong> <strong>and</strong><br />
Japan) suggest that headship rates tend generally to be<br />
higher in urban localities within these countries; but the<br />
relationship is far from uniform-there are exceptions<br />
for many age, sex or marital status groups."<br />
Data on non-nuclear relatives <strong>and</strong> on non-relatives<br />
per household similarly suggest that households in less<br />
urbanized <strong>and</strong> less modernized countries tend to be<br />
more complex, though the relationship is not particularly<br />
strong. Data have been compiled that show the<br />
number <strong>of</strong> "other" or non-nuclear relatives per household<br />
in India or Nicaragua to be approximately six<br />
times as large as in the United States <strong>and</strong> approximately<br />
15 times as large as in the Netherl<strong>and</strong>s. A concrete interpretation<br />
is that "in India many, probably most,<br />
families contain at least one 'other relative' <strong>of</strong> the head;<br />
in the United States or in the Netherl<strong>and</strong>s, very few do" .48<br />
Some illustrative data are given in table 40. These same<br />
data show that there is a wide range <strong>of</strong> household complexity<br />
among the less developed countries <strong>and</strong> that<br />
some less developed countries-for example, Thail<strong>and</strong>-have<br />
relativelylow indices <strong>of</strong> complexity.<br />
If one turns to rural/urban differences within contemporary<br />
countries, the picture is even less clear <strong>and</strong><br />
consistent. In an analysis <strong>of</strong> other relatives per household<br />
for India, Venezuela <strong>and</strong> the United States, small<br />
<strong>and</strong> inconsistent differences were found. <strong>Rural</strong> households<br />
were slightly more complex than urban in India<br />
<strong>and</strong> the United States (only 8 per cent more so in India),<br />
but slightlyless complex in Venezuela.v<br />
On the basis <strong>of</strong> available data, limited as they are, it<br />
appears that rural/urban differences in household complexity<br />
are larger <strong>and</strong>more consistent in comparisons<br />
over long periods <strong>and</strong> among countries than in comparisons<br />
between rural <strong>and</strong> urban sectors <strong>of</strong> contemporary<br />
national populations.<br />
Firmer <strong>and</strong> more detailed generalizations on these<br />
questions must await more empirical research on available<br />
census <strong>and</strong> survey data, <strong>and</strong> the development <strong>of</strong> a<br />
40 Manual VII. Methods <strong>of</strong> Projecting Households <strong>and</strong> Families,<br />
p. 79. The negative correlation for women aged 25-64 may<br />
reflect declining rates <strong>of</strong> widowhood with urbanization; thus, a<br />
higher proportion <strong>of</strong> married women living with their husb<strong>and</strong>s,<br />
who are reported as household heads.<br />
41 The Determinants <strong>and</strong> Consequences at <strong>Population</strong> Trends,<br />
vol. I, p. 350. The exception presumably relates to lower rates<br />
<strong>of</strong> widowhood.<br />
42 Manual VII. Methods ot Projecting Households <strong>and</strong> Families,<br />
pp. 38-39 <strong>and</strong> 70-71.<br />
48 T. K. Burch, loco cit.<br />
44 Ibid., p. 359, table 7.<br />
101<br />
TABLE 40. NUMBER OF NON-NUCLEAR RELATIVES AND OF NON-<br />
RELATIVES PER HOUSEHOLD, SELECTED NATIONAL CENSUSES<br />
Persons pe, household by relatlonshlpa<br />
Date <strong>of</strong><br />
Count,y census Non-nuclear relatives Non·,elatlvesb<br />
Brazil ......... 1950 0.42 0.25<br />
Chile ......... 1960 0.78 0.41<br />
Costa Rica ..... 1963 0.57 0.17<br />
1950 0.58 0.28<br />
Cuba ......... 1953 0.70 0.17<br />
Guatemala .... 1950 0.63 0.17<br />
llonduras ...... 1950 0.79 0.23<br />
India .......... 1951 1.20 0.07<br />
Mexico ........ 1960 0.49 0.10<br />
1950 0.44 0.19<br />
Netherl<strong>and</strong>s .... 1947 0.08 0.09<br />
Nicaragua ..... 1963 1.15 0.27<br />
1950 1.02 0.43<br />
Panama ....... 1960 0.78 0.25<br />
Thail<strong>and</strong> ...... 1947 0.38 0.05<br />
United States<br />
<strong>of</strong> America .. 1960 0.19 0.05<br />
Venezuela ...... 1950 0.88 0.61<br />
Source: Thomas K. Burch, "The size <strong>and</strong> structure <strong>of</strong> families:<br />
a comparative analysis <strong>of</strong> census data", American Sociological<br />
Review, vol. 32, No. 3 (1967), p. 350, table 7.<br />
aData pertain to persons <strong>of</strong> all ages, i.e., not just adults.<br />
b Non-relatives include servants, boarders, guests <strong>and</strong> so forth.<br />
fuller underst<strong>and</strong>ing <strong>of</strong> the determinants <strong>of</strong> household<br />
complexity. From a formal demographic point <strong>of</strong> view,<br />
it is clear that household complexityis a function <strong>of</strong> age/<br />
sex/marital status-specific headship rates, on the one<br />
h<strong>and</strong>, <strong>and</strong> <strong>of</strong> the age/sex/marital status composition <strong>of</strong><br />
the adult population, on the other. But the socioeconomic<br />
<strong>and</strong> cultural determinants <strong>of</strong> headship rates<br />
<strong>and</strong> <strong>of</strong> marital patterns are little understood.<br />
E. VARIATION AND CHANGE IN THE CONTEMPORARY<br />
FAMILY<br />
Attempts to summarize social science knowledge <strong>of</strong><br />
family structure <strong>and</strong> change inevitably lead to oversimplifications.<br />
It is convenient, for example, to think in<br />
terms <strong>of</strong> polar types <strong>of</strong> societies <strong>and</strong> <strong>of</strong> sharp contrasts<br />
between rtiral <strong>and</strong> urban family systems. Cultural <strong>and</strong><br />
historical uniqueness is played down in favour <strong>of</strong> generalization.<br />
Systems are viewed as static rather than as<br />
continuously changing, as sharply distinct rather than as<br />
intermingled. The present section tries to serve as a<br />
partial corrective to these tendencies by stressing some<br />
<strong>of</strong> the complexities <strong>of</strong> contemporary family structure<br />
<strong>and</strong> change, <strong>and</strong> some uncertainties concerning the<br />
future <strong>of</strong> the family both in the developing <strong>and</strong> the<br />
developed regions.<br />
As stated earlier, much <strong>of</strong> what has been written about<br />
rural/urban differences in the family is based on contrasts<br />
between polar types <strong>of</strong> societies. Currently, however,<br />
most urban communities, especially those in<br />
developing countries, have resulted from rapid growth<br />
<strong>and</strong> include among their populations migrants from<br />
rural areas with rural values <strong>and</strong> behaviour, <strong>and</strong> also<br />
long-term residents who adhere to social structures that<br />
existed in the pre-industrial era <strong>of</strong> the city. Similarly,<br />
the rural areas include among their inhabitants many<br />
persons who have had direct urban experience <strong>of</strong> living<br />
in cities as migrants <strong>and</strong> many more who know urban
life from radio, films <strong>and</strong> communication with relatives<br />
who migrated. The effect <strong>of</strong> these factors, the relatively<br />
recent village character <strong>of</strong> many cities <strong>and</strong> the large<br />
number <strong>of</strong> migrants, is to reduce whatever intrinsic<br />
rural/urban differencesmay exist. This section examines<br />
some specific instances <strong>of</strong> the diversity <strong>of</strong> family types<br />
found in contemporary urban <strong>and</strong> rural settings.<br />
A recent study" focuses on the varieties <strong>of</strong> the domestic<br />
social organization that existed at Isfahan, Iran, a<br />
large city <strong>of</strong> 425,000 <strong>and</strong> once the capital <strong>of</strong> Iran. The<br />
city has grown rapidly during the past 20 years <strong>and</strong><br />
contains large mechanized textile mills, some foodprocessing<br />
plants <strong>and</strong> an airport. But like many other<br />
cities in that region, it retains aspects that are village-like<br />
or pre-industrial in character. Various features <strong>of</strong> its<br />
social structure are not very different from comparable<br />
aspects <strong>of</strong> village social structure in Iran. Of particular<br />
interest here is the importance <strong>of</strong> extensive kinship ties.<br />
A study was made <strong>of</strong> a core <strong>of</strong> 175 families in three<br />
different sections <strong>of</strong> Isfahan: a part <strong>of</strong> the old city with<br />
the old type <strong>of</strong> residential compound architecture; another<br />
part in a newer area <strong>of</strong> the city; <strong>and</strong> an area in one<br />
<strong>of</strong> the squatter settlements. Because the main focus <strong>of</strong><br />
the research was on the readiness <strong>of</strong> married couples to<br />
practise family planning, the sample was drawn from<br />
recent family planning patients at a university clinic.<br />
These families <strong>and</strong> other related or unrelated families<br />
who lived in the same residence unit or compound were<br />
included in the study. They are not necessarily representative<br />
<strong>of</strong> all residents <strong>of</strong> Isfahan.<br />
The focus was on the compound <strong>and</strong> on families who<br />
lived in the same compound. These are essentially<br />
houses which share a common courtyard <strong>and</strong> a single<br />
entry way into the courtyard. The compound is an entity<br />
<strong>of</strong> ownership <strong>and</strong> may contain several households. The<br />
household according to the definition used by the authors<br />
(<strong>and</strong> by the Iranian census) consists <strong>of</strong> a group <strong>of</strong> people<br />
who both live together in the same dwelling <strong>and</strong> regularly<br />
eat together. Isfahan compounds contain from<br />
one to six households. Almost all the households in the<br />
sample consisted simply <strong>of</strong> nuclear or simple families:<br />
husb<strong>and</strong>; wife; <strong>and</strong> their unmarried children. Complex<br />
households included nuclear families with one additional<br />
relative as well as two or three related nuclear families.<br />
Many <strong>of</strong> the compounds also contained separate households<br />
that did not eat together but were related to<br />
one another.<br />
Of major interest for purposes <strong>of</strong> this chapter is the<br />
wide variety <strong>of</strong> domestic types found. Of the 140 compounds<br />
in the sample, 55 contained single households<br />
<strong>and</strong> 49 contained only two households. Only 18 <strong>of</strong> the<br />
55 single-household compounds were complex; that is,<br />
they included a simple nuclear family plus other relatives.<br />
Although most cultures in this area <strong>of</strong> the world<br />
are presumed to be patricentic, that review <strong>of</strong> the complex<br />
households revealed the presence <strong>of</strong> matrilateral<br />
relationships. In both single-household compounds <strong>and</strong><br />
multiple-household compounds, most people were related<br />
<strong>and</strong> were related both through the wives <strong>and</strong><br />
through the husb<strong>and</strong>s.<br />
Compounds <strong>and</strong> households are always defined <strong>and</strong><br />
described at one point in time but, in fact, they change<br />
.5 John Gulick <strong>and</strong> Margaret Gulick, "Varieties <strong>of</strong> domestic<br />
social organization in the Iranian City <strong>of</strong> Isfahan", Annals <strong>of</strong><br />
the New York Academy <strong>of</strong> Science, vol. 220, No.6 (11 March<br />
1974),pp. 441-469.<br />
102<br />
a good bit over time. An important finding in the research<br />
cited above is the vast amount <strong>of</strong> change that<br />
occurred in living arrangements within the short period<br />
<strong>of</strong> one year. There were major changes in 47 <strong>of</strong> the 140<br />
compounds involving moving in <strong>and</strong> out <strong>of</strong> individuals,<br />
families or even entire households. The types <strong>of</strong> moves<br />
in the 47 households involved all sorts <strong>of</strong> domestic<br />
patterns. Some were temporary changes, such as a pregnant<br />
married sister <strong>of</strong> a husb<strong>and</strong> moving from the VIllage<br />
to the town in order to be with her parents while she had<br />
the baby, or an unrelated family coming to live in the<br />
house each summer, or a mother-in-law moving out to<br />
live with another son. Although there was no single,<br />
predominant pattern <strong>of</strong> family or household type, one<br />
general sequential trend was evident: that <strong>of</strong> living with<br />
both parents <strong>and</strong> siblings right after marriage, followed<br />
by the death <strong>of</strong> one or both parents. Some couples continued<br />
to live with siblings, others to move out into<br />
separate households. Residence early in marriage with<br />
the wife's or husb<strong>and</strong>'s mother was another observed<br />
pattern. Yet, as time goes on, there is a tendency to live<br />
apart from parents <strong>and</strong> siblings, first as a tenant in a<br />
house <strong>and</strong> later as an owner <strong>of</strong> one <strong>of</strong> the housing units.<br />
The main conclusion is that there is no such thing as<br />
"the urban family"; but in a city like Isfahan, there are<br />
various forms <strong>of</strong> family <strong>and</strong> household which represent<br />
an adaptation to urban life.<br />
There were few single-person households (about 6<br />
per cent), each <strong>of</strong> them was included in a larger compound<br />
<strong>and</strong> most <strong>of</strong> the people involved were related to<br />
one or more persons in at least one other household in<br />
the compound. For example, the husb<strong>and</strong>'s mother<br />
might live in a separate household in the same compound.<br />
Furthermore, the 77 simple households that did<br />
not live with relatives were hardly isolated urban families.<br />
In fact, most <strong>of</strong> the married couples in simple<br />
households who were not living in the same compound<br />
with other relatives did have other relatives living in the<br />
vicinity <strong>and</strong> did, in fact, have regular <strong>and</strong> frequent contact<br />
with them. There were only about 20 families out<br />
<strong>of</strong> the total 175 that might be regarded as relatively<br />
isolated <strong>and</strong> most <strong>of</strong> these families were recent migrants<br />
to Isfahan.<br />
The hypothesis that urbanization, modernization <strong>and</strong><br />
industrialization modify traditional family types towards<br />
some sort <strong>of</strong> conjugal household <strong>and</strong> nuclear family was<br />
tested with data from the West Malaysia (currently<br />
called Peninsular Malaysia) family survey <strong>of</strong> 1966<br />
1967. 46 The increasing urbanization <strong>and</strong> modernization<br />
<strong>of</strong> Peninsular Malaysia has been well documented. The<br />
investigators examined the extent <strong>of</strong> extended family<br />
participation <strong>and</strong> observed that nuclear families were<br />
not uncommon in Malaysia <strong>and</strong> that extended families<br />
among the Malays could involve either set <strong>of</strong> parents.<br />
Three ethnic groups were in the sample: the Chinese;<br />
the Indians <strong>and</strong> Pakistanis; <strong>and</strong> the Malaysians. Some<br />
differences in the extent <strong>and</strong> type <strong>of</strong> extended family<br />
participation were found among-the three ethnic groups.<br />
Chinese or Indian <strong>and</strong> Pakistani women in extended<br />
families were more likely to have lived with their husb<strong>and</strong>'s<br />
parents than with their own, whereas Malay<br />
women were more likely to live with the wife's parents.<br />
46 James A. Palmore, Robert E. Klien <strong>and</strong> Ariffin bin Marzuki,<br />
"Class <strong>and</strong> family in a modernizing society", American<br />
Journal <strong>of</strong> Sociology, vol. 76, No.3 (November 1970), PP. 375<br />
398.
They found no evidence that the equivalent <strong>of</strong> the extended<br />
family has lessened over time. In fact, younger<br />
women in their sample were more likely to have lived<br />
with their parents right after marriage than were older<br />
women. Neither urban/rural residence nor level <strong>of</strong> education<br />
was highly related to extended family participation.<br />
In fact, wives in metropolitan areas <strong>and</strong> the more<br />
highly educated women were more likely to have lived<br />
with their parents right after marriage than were rural<br />
women with less education. Women in the moderate<br />
income group were more likely to have experienced living<br />
in extended families than either high- .or lowincome<br />
women.<br />
The definition <strong>of</strong> extended family used consisted <strong>of</strong><br />
"a married couple in a common household with parents<br />
<strong>of</strong> either the husb<strong>and</strong> or wife or with other married<br />
couples"." The operational definition <strong>of</strong> extended<br />
family participation was household-sharing. The researchers<br />
observed that this usually involved other types<br />
<strong>of</strong> sharing, such as income <strong>and</strong> meals. This research is<br />
one <strong>of</strong> the few to take into account the effects <strong>of</strong> mortality<br />
<strong>and</strong> migration. That is, it was not possible for<br />
some couples to live with parents right after marriage<br />
because <strong>of</strong> either parental mortality or migration. These<br />
two factors obviously influenced the extent to which<br />
young couples might live with parents <strong>and</strong> was taken<br />
into account in the research. Among women with both<br />
sets <strong>of</strong> parents available right after marriage, 42 per cent<br />
lived with the husb<strong>and</strong>s' parents <strong>and</strong> 27 per cent with<br />
the wives' parents. Among those with only the husb<strong>and</strong>'s<br />
parents available, however, 58 per cent lived with them;<br />
<strong>and</strong> among those with only the wife's parents available,<br />
52 per cent lived with them.<br />
The study concludes that rural <strong>and</strong> small-town residents<br />
were somewhat more likely to be living with<br />
parents at the time <strong>of</strong> the interview, but less likely to<br />
have done so directly after marriage. Essentially, ethnicity<br />
<strong>and</strong> age are the two variables on which extended<br />
family participation varied most, given control for<br />
availability <strong>of</strong> parents or relatives. The results certainly<br />
call into question the notion <strong>of</strong> almost automatic replacement<br />
<strong>of</strong> traditional family forms with the simple<br />
nuclear family as urbanization <strong>and</strong> socio-economic development<br />
proceed. Both <strong>of</strong> the studies discussed above<br />
describe great diversity in family <strong>and</strong> household residential<br />
structure, a diversity that appears to be influenced<br />
only in minor ways by rural/urban distinctions.<br />
Much traditional thinking about social change inappropriately<br />
assumes that city, village <strong>and</strong>. town are<br />
significantly different in life-style. The assumption that<br />
the city is different from the countryside usually is linked<br />
with an assumption that the urban community is the<br />
centre <strong>of</strong> change. That is, innovation diffuses outwards<br />
from the city to the countryside as a result <strong>of</strong> contacts<br />
with businessmen, government <strong>of</strong>ficials <strong>and</strong> particularly<br />
with migrants who were born in the village <strong>and</strong> lived or<br />
worked in the city <strong>and</strong> returned to the village. It is also<br />
usually assumed that such change is very slow, that innovation<br />
diffuses very slowly outwards from the urban<br />
metropolis to the rural countryside. Studies attempting<br />
to examine the effect <strong>of</strong> the city or metropolis on villages<br />
<strong>and</strong> rural communities in the vicinity throw additional<br />
light on the extent to which different family types<br />
characterize the two residential areas.<br />
41 Ibid.<br />
103<br />
An attempt has been made to examine the effect<strong>of</strong> the<br />
city <strong>of</strong> Delhi in India on a village about 11 miles distant."<br />
Specifically, the researcher attempted to determine<br />
whether the behaviour <strong>and</strong> attitudes <strong>of</strong> village men<br />
or women who had lived or worked at Delhi differed<br />
from those villagers who lacked such urban experience.<br />
One focus <strong>of</strong> differencewas whether the urban-influenced<br />
villagers lived more in nuclear families than joint or<br />
extended families. Another concerned educational <strong>and</strong><br />
occupational goals for their children.<br />
In the village, there was no significant difference in<br />
the proportion <strong>of</strong> joint families among families headed<br />
by urban-oriented men as compared with those with no<br />
urban experience. In response to the question whether<br />
they preferred living in joint houses or separately, a<br />
majority favoured the joint family. Again, there was no<br />
significantdifferencebetween urban-oriented <strong>and</strong> villageoriented<br />
people. In fact, there was no significant difference<br />
by caste or sex either. The strong preference for<br />
the joint family was expressed by all groups <strong>and</strong> reflected<br />
more an ideal pattern <strong>of</strong> life than the actual living<br />
arrangements, since in fact only 41 <strong>of</strong> the 110 families in<br />
the study were joint families. The reasons given for the<br />
preference were predominantly economic, <strong>and</strong> the notion<br />
<strong>of</strong> mutual aid was mentioned in most <strong>of</strong> the favourable<br />
answers. The results showed no evidence <strong>of</strong> either<br />
breakdown or reduction in kinship ties resulting from<br />
urban contacts. All the villagers preferred the joint<br />
family at least as an ideal, although there was some evidence<br />
that the function <strong>of</strong> kinsmen might be changing<br />
in that more <strong>of</strong> the urban-oriented individuals depended<br />
upon their own efforts to find jobs rather than depending<br />
upon relatives or other village relationships.<br />
An extension <strong>and</strong> distortion <strong>of</strong> the view that the extended<br />
family is characteristic <strong>of</strong> rural societies <strong>and</strong> that<br />
nuclear families characterize urban life is another common<br />
view that rapid urbanization leads to deterioration<br />
<strong>and</strong> disorganization <strong>of</strong> family life. Evidence for this<br />
view is <strong>of</strong>ten no more than pointing to the overcrowded<br />
slums <strong>and</strong> squatter settlements in any rapidly growing<br />
city, particularly those in developing countries. Squatter<br />
settlements, in particular, have been viewed as the epitome<br />
<strong>of</strong> social disorganization. A review <strong>of</strong> 10 years <strong>of</strong><br />
research on squatter settlements in Peruv dispels many<br />
<strong>of</strong> the myths perpetrated by newspapers, social workers,<br />
politicians <strong>and</strong> middle-class residents alike that the residents<br />
<strong>of</strong> the shanty-towns are uneducated, unambitious,<br />
disorganized <strong>and</strong> an economic burden. This research,<br />
based on 10 years <strong>of</strong> observation <strong>of</strong> a Peruvian barriada,<br />
suggests, to the contrary, that the barriada residents<br />
were as educated as the city population in general <strong>and</strong><br />
far removed from a rural culture, with an average <strong>of</strong><br />
nine years <strong>of</strong> urban residence. Incomes, although low,<br />
were substantially higher than in the poorest slum areas,<br />
<strong>and</strong> the barriada families were relatively stable compared<br />
with those in the city slums <strong>and</strong> the rural provinces.<br />
Delinquency <strong>and</strong> prostitution, which were common in<br />
the city slums, were rare in the barriada.<br />
The studies also reveal that the barriada residents<br />
believe strongly that the current situation is far prefer-<br />
48 Stanley A. Freed, "Attitudes, behavior <strong>and</strong> urban influences<br />
in a north Indian village", Annals <strong>of</strong> the New York Academy <strong>of</strong><br />
Sciences, vol. 220, No.6 (11 March 1974). pp.. 411-424.<br />
49 William Mangin, "Squatter settlements', Scientific American,<br />
vol. 217, No.4 (October 1967), pp. 21-28. See also "Latin<br />
American squatter settlements: a problem <strong>and</strong> a solution", Latin<br />
American Research Review, vol. 2 (Summer 1967), pp. 65-67.
TABLE 41. SUMMARY OF URBAN AND RURAL MEASURES CONCERNING MARITAL STATUS OF EITHER<br />
SEX AND URBAN/RURAL DIFFERENCES IN THESE MEASURES<br />
Males Females<br />
Measure<br />
<strong>and</strong> groupe. <strong>Urban</strong>' <strong>Rural</strong> Difference <strong>Urban</strong> <strong>Rural</strong> Difference<br />
A. Crude percentage single, ages 15 +<br />
Group I ............. 33.1 34.7 -1.6 29.1 24.8 +4.3<br />
Group II ............. 38.1 30.2 +7.9 22.4 14.5 +7.9<br />
B. Crude percentage married, ages 15 +<br />
Group I ............. 62.3 60.8 +1.5 56.3 63.4 '-7.1<br />
Group II ............. 58.0 66.2 -8.2 62.4 70.8 -8.4<br />
C. Crude percentage widowed, ages 15 +<br />
Group I ............. 2.7 3.4 -0.7 11.3 10.5 +0.8<br />
Group II ............. 2.1 3.1 -1.0 11.3 12.4 -1.1<br />
D. Crude percentage divorced, ages 15 +<br />
Group I ............. 2.0 1.1 +0.9 3.3 1.3 +2.0<br />
Group II ............. 1.8 1.6 +0.2 3.8 2.4 +1.4<br />
E. Percentage aged 25-29 single<br />
Group I ............. 34.2 36.5 -2.3 23.1 17.2 +5.9<br />
Group II ..........•.. 39.3 28.1 +11.2 13.0 6.9 +6.1<br />
F. Percentage aged 45-49 married<br />
Group I ............. 85.9 84.2 +1.7 73.9 82.2 -8.3<br />
Group II ............. 89.8 91.5 -1.7 75.7 80.6 -4.9<br />
G. Percentage aged 65-69 widowed b<br />
Group I ............. 10.0 10.9 -0.9 38.4 33.3 +5.1<br />
Group II ............. 12.2 12.6 -0.4 60.9 56.6 +4.3<br />
H. Expected years lived in the single state, ages 15·65<br />
Group I ............. 14.2 15.4 -1.2 13.2 11.0 +2.2<br />
Group II ............. 13.2 11.0 +2.2 7.3 5.2 +2.1<br />
I. Expected years lived in the married state, ages 15-65<br />
Group I ............. 34.0 33.2 +0.8 31.2 35.0 -3.8<br />
Group II ............. 34.6 36.6 -2.0 33.3 36.5 -3.2<br />
J. Expected years lived in the widowed state, ages 15-65<br />
Group I ............. 0.8 0.9 -0.1 3.7 3.2 +0.5<br />
Group II ............. 1.3 1.5 -0.2 7.7 7.1 +0.6<br />
K. Expected years lived in the divorced state, ages 15-65<br />
Group I ............. 1.1 0.6 +0.5 1.9 0.8 +1.1<br />
Group II ............. 1.0 0.8 +0.2 1.7 1.2 +0.5<br />
a Group I comprises countries <strong>of</strong> Europe, Northern America <strong>and</strong> Latin America; group II<br />
comprises countries <strong>of</strong> Africa <strong>and</strong> Asia.<br />
b In a few countries, the age groupings <strong>of</strong> the census data do not permit the separate identification<br />
<strong>of</strong> the 65-69 age group. In these cases, the nearest approximation that could be obtained<br />
was substituted. The following substitutions were made: Nicaragua (65-74); Bangladesh, Greece<br />
<strong>and</strong> Turkey (65 + ); Benin <strong>and</strong> Pakistan (60 + ).<br />
the various marital categories. None <strong>of</strong> the urban/rural<br />
differences reaches 3 percentage points. The minor differences<br />
that do exist for the single <strong>and</strong> married are the<br />
reverse <strong>of</strong> those that occur in the other sex/region<br />
groups. <strong>Urban</strong> males in the countries in group I are<br />
more likely to be married <strong>and</strong> less likely to be single<br />
than are rural males.<br />
The remainingdata in the table are based on measures<br />
that are specific to a particular age or that are agest<strong>and</strong>ardized.<br />
They suggest that the patterns <strong>of</strong> urban/<br />
rural differences just described are not exclusively a<br />
product <strong>of</strong> age-distributional differences between rural<br />
<strong>and</strong> urban areas but also can be observed when the<br />
factor <strong>of</strong> age is controlled. For persons aged 25-29, the<br />
percentage single ranges from 6 to 10 percentage points<br />
higher in urban than in rural areas for three <strong>of</strong> the four<br />
groups. For males in group I, however, the difference<br />
is again in the opposite direction, with rural males some<br />
105<br />
2 percentage points more likely to be single than urban<br />
males. The largest urban excess in the single percentage<br />
among persons aged 25-29 is found among males in<br />
group II, where an average <strong>of</strong> 39 per cent <strong>of</strong> urban<br />
residents are still single. This excess almost certainly<br />
reflects in part migration patterns in these populations,<br />
wherein young adult males in rural areas are much more<br />
likely than other groups to migrate to urban areas.<br />
This pattern shows up clearly in chapter VIII, where<br />
highly masculine urban sex distributions are revealed<br />
in Africa <strong>and</strong> Asia. Oddly, the masculine surplus does<br />
not translate into better marriage chances for urban<br />
women in the countries in group II, who continue to<br />
remain single in greater numbers (by a factor <strong>of</strong> nearly<br />
2) than women in rural areas.<br />
The unusually large percentage single among urban<br />
males in group II has largely disappeared by age 45-49.<br />
The percentage married among this group at age 45-
TABLE 42. SUMMARY OF WOMEN-TO-MEN RATIOS OF EACH MARITAL STATUS, URBAN AND RURAL<br />
AREAS, AND URBAN/RURAL RATIOS OF THOSE RATIOS<br />
Married women per 100 Non-married women per 100<br />
married menb non-married menb<br />
<strong>Urban</strong> <strong>Rural</strong> Ratio <strong>of</strong> <strong>Urban</strong> <strong>Rural</strong> Ratio <strong>of</strong><br />
Group' ratio ratio ratios ratio ratio ratios<br />
Group I ........... 101.2 98.9 1.02 142.9 98.0 1.46<br />
Group II .......... 93.9 101.6 0.92 87.6 101.5 0.86<br />
Single Women per 100 Widowed women per 100<br />
single mene widowed mene<br />
<strong>Urban</strong> <strong>Rural</strong> Ratio oj <strong>Urban</strong> <strong>Rural</strong> Ratio <strong>of</strong><br />
Group' ratio ratio ratios ratio ratio ratios<br />
Group I ........... 100.6 70.3 1.43 487.8 301.0 1.62<br />
Group II .......... 56.2 53.1 1.06 537.6 420.8 1.28<br />
a Group I comprises countries <strong>of</strong> Europe, Northern America <strong>and</strong> Latin America; group II<br />
comprises countries <strong>of</strong> Africa <strong>and</strong> Asia.<br />
b Adjusted, as explained in text.<br />
c Without adjustment.<br />
marriage in urban areas is the typically reduced role<br />
played by children in household production. Such conditions<br />
should be reflected not only in lower marriage<br />
frequencies but in higher divorce frequencies in urban<br />
areas, a situation that is made quite evident in table 41.<br />
An ironic result <strong>of</strong> the urban opportunities for women<br />
in the countries <strong>of</strong> group I is that it induces selective<br />
female migration to cities, thereby improving the marriage<br />
chances for urban males <strong>and</strong> helping to eliminate<br />
for them the urban/rural gap in marriage propensities<br />
that is to be expected on theoretical grounds <strong>and</strong> is<br />
observed in other sex/region combinations.<br />
<strong>Urban</strong> men have been compared with rural men, <strong>and</strong><br />
urban women with rural, but no systematic comparison<br />
<strong>of</strong> men <strong>and</strong> women has been made. Table 42 shows the<br />
balance between males <strong>and</strong> females in different marital<br />
statuses for urban <strong>and</strong> rural areas in the two regions.<br />
First, a comparison is made <strong>of</strong> urban <strong>and</strong> rural ratios<br />
<strong>of</strong> married women to 100 married men <strong>and</strong> <strong>of</strong> nonmarried<br />
women to 100 non-married men. In these figures<br />
an adjustment was applied for inequalities between<br />
numbers <strong>of</strong> married men <strong>and</strong> married women as<br />
reported in the censuses for the combined national<br />
populations."<br />
In the first group (I) <strong>of</strong> countries, there occurs a slight<br />
surplus <strong>of</strong> urban married women over urban married<br />
89 If a census is accurate <strong>and</strong> international migration is not<br />
important, ordinarily equal numbers <strong>of</strong> married men <strong>and</strong> married<br />
women should be reported, but this is not everywhere the<br />
case. In some countries, there is still an incidence <strong>of</strong> polygamy;<br />
hence, married women can be slightly more numerous than<br />
married men. In some other countries, where husb<strong>and</strong>s <strong>and</strong><br />
wives (or partners to a consensual union) do not live in the same<br />
household, there is some tendency <strong>of</strong> the men in question to<br />
report themselves as single, whereas the women in question tend<br />
to insist more on their marital (or union) condition. To eliminate<br />
these two possible effects, those due to polygamy <strong>and</strong> those due<br />
to misstatement <strong>of</strong> status at the census, numbers <strong>of</strong> married men<br />
<strong>and</strong> married women were so prorated that in the national totals<br />
they would both be equal to the geometrical mean <strong>of</strong> reported<br />
numbers <strong>of</strong> married men <strong>and</strong> married women. For the nonmarried,<br />
the residuals were used after subtraction <strong>of</strong> adjusted<br />
numbers <strong>of</strong> married from the total population.<br />
men <strong>and</strong> a corresponding deficit <strong>of</strong> rural married women,<br />
signifying that at least some <strong>of</strong> the wives <strong>of</strong> rural men<br />
are found to be residing in cities or towns; but it remains<br />
possible that the slight differences, despite the<br />
adjustment made, is within the margin <strong>of</strong> error <strong>of</strong> the<br />
data. In group II, there is a considerable urban deficit<br />
<strong>of</strong> married women, as compared with married men,<br />
leading to the conclusion that many rural husb<strong>and</strong>s<br />
absent themselves from their wives <strong>and</strong> families <strong>and</strong><br />
take up at least temporary residence in cities <strong>and</strong> towns<br />
but are unable to move their wives or families to these<br />
same urban places.<br />
As concerns the non-married persons (single, widowed,<br />
divorced), in the first group <strong>of</strong> countries there<br />
is a large surplus <strong>of</strong> women in the urban areas <strong>and</strong> a<br />
slight deficit <strong>of</strong> women in the rural places. The reverse<br />
is found in the second group <strong>of</strong> countries: a considerable<br />
urban deficit <strong>and</strong> a slight rural surplus <strong>of</strong> non-married<br />
" women, as compared with numbers <strong>of</strong> non-married men.<br />
In the second group (II) <strong>of</strong> countries, there is a considerable<br />
shortage <strong>of</strong> single women, as compared with<br />
single men, <strong>and</strong> the shortage is almost equally great both<br />
in urban <strong>and</strong> in rural places. Because <strong>of</strong> generally greater<br />
age <strong>of</strong> husb<strong>and</strong>s as compared with their wives, as well as<br />
the <strong>of</strong>ten greater mortality <strong>of</strong> men as compared with<br />
women <strong>of</strong> the same ages, widowed women are far more<br />
numerous than widowed men. A possible additional reason<br />
may be that widowed men find more opportunity to<br />
remarry than do the widowed women. Husb<strong>and</strong>/wife<br />
differences in average age at marriage, however, as previously<br />
stated, do not vary greatly. If the ratios <strong>of</strong> widowed<br />
women to widowed men are considerably greater<br />
in urban than in rural places-<strong>and</strong> this is generally the<br />
case in both groups <strong>of</strong> countries-at least part <strong>of</strong> the<br />
difference is probably to be attributed to the migration<br />
<strong>of</strong> widows to cities <strong>and</strong> towns or <strong>of</strong> widowed men to<br />
rural areas. This apparent effect is considerable even<br />
in the countries in group II, though in that group there<br />
is evidence <strong>of</strong> a lesser migration <strong>of</strong> single women from<br />
country to town.<br />
107
vm, SEX AND AGE DISTRIBUTIONS OF URBAN AND RURAL POPULATIONS<br />
The sex <strong>and</strong> age distribution <strong>of</strong> a population is<br />
uniquely determined by its history <strong>of</strong> fertility, mortality<br />
<strong>and</strong> migration. High fertility produces a youthful age<br />
structure; mortality reductions increase the proportions<br />
at the extremes <strong>of</strong> age <strong>and</strong> generally serve to reduce the<br />
average age <strong>of</strong> a population. Out-migration tends to<br />
hollow out an age structure, decreasing the fraction in<br />
the young adult ages, which are typically the most migratory.<br />
Sex ratios at a particular age are products <strong>of</strong><br />
the sex ratio at birth into that age cohort (which is as<br />
close as human populations come to having a biological<br />
constant) <strong>and</strong> its history <strong>of</strong> sex differentials in mortality<br />
<strong>and</strong> migration.<br />
The massive upsurge in urban proportions during<br />
the twentieth century has left an imprint on the age/sex<br />
structures <strong>of</strong> rural <strong>and</strong> urban areas. Since urbanization<br />
has occurred primarily as a result <strong>of</strong> net rural-urban<br />
migration, as documented in chapter III, it is natural<br />
to expect its effect on age structures to be most visible<br />
during the young adult years, in the form <strong>of</strong> higher<br />
ratios <strong>of</strong> urban-to-rural population at these ages than<br />
at others. These migration-induced patterns are superimposed<br />
upon what would typically be more youthful<br />
age structures in rural areas by virtue <strong>of</strong> their higher<br />
fertility levels. Predictions are less straightforward with<br />
regard to urban/rural differences in sex structure.<br />
These differences could show either higher or lower<br />
urban masculinity, depending upon whether rural-urban<br />
net migration has been predominantly male or female.<br />
There is also some evidence that differences in mortality<br />
might be systematically different in rural than in urban<br />
areas, although this factor probably does not have a<br />
decisive impact on relative sex distributions.<br />
The aim <strong>of</strong> the present chapter is to describe concisely<br />
the principal age <strong>and</strong> sex distributional differences<br />
between urban <strong>and</strong> rural areas. Regardless <strong>of</strong><br />
their source, these differences clearly have implications<br />
for planning, for social <strong>and</strong> economic performance <strong>and</strong><br />
for an individual's typical life course. There is an enormous<br />
array <strong>of</strong> data available on age/sex distributions<br />
<strong>of</strong> rural <strong>and</strong> urban populations at the national level.<br />
Because the aim <strong>of</strong> this chapter is to describe major<br />
tendencies, a strategy was adopted to process the national<br />
information into regional summaries <strong>and</strong> to recognize<br />
explicitly only two time periods. In this manner,<br />
relatively stable <strong>and</strong> secure patterns can be described, at<br />
the expense <strong>of</strong> neglecting certain interesting or unusual<br />
information for specific countries. The regional summaries<br />
in all cases constitute simple unweighted averages<br />
<strong>of</strong> observations for countries belonging to that region.<br />
Data for the analysis have been drawn from national<br />
population censuses <strong>and</strong> from various issues <strong>of</strong> the Demographic<br />
Yearbook. To be included, a country had<br />
to supply data on urban <strong>and</strong> rural age/sex distributions<br />
in one-, five- or 10-year age intervals; if 10-year<br />
intervals were used, the distributions were graduated<br />
to five-year intervals up to the open-ended category<br />
108<br />
<strong>of</strong> 70+. Evidence <strong>of</strong> extreme census-coverage or agemisreporting<br />
errors was cause for eliminating an observation.<br />
All data were drawn from the period since 1950.<br />
This period was subdivided into 1950-1964 <strong>and</strong> 1965<br />
1975. If a country could supply two observations during<br />
one <strong>of</strong> these two periods, the earliest observation<br />
was used for 1950-1964 <strong>and</strong> the most recent for 1965<br />
1975. This choice was made in order to highlight postwar<br />
trends. However, it should be mentioned that a<br />
comparison <strong>of</strong> earlier <strong>and</strong> later observations cannot be<br />
strictly interpreted as providing trends because the composition<br />
<strong>of</strong> countries in the two subperiods changed<br />
somewhat. The identity <strong>of</strong> observations for the two<br />
periods <strong>and</strong> the various regions is given below:<br />
Africa<br />
(a) Countries included in first observation, 1950<br />
1964 (N = 17): Benin (1961), Central African Empire<br />
(1959), Chad (African population, 1964); Congo (1960);<br />
Gabon (1961); Ghana (1960); Guinea (1955); Libyan<br />
Arab Jamahiriya (1964); Mali (1960); Morocco (1951);<br />
Namibia (1951); Seychelles (1960); South Africa (all<br />
races, 1951); Southern Rhodesia (non-African population,<br />
1961); Togo (1959); Egypt (1960); Nigeria (1963);<br />
(b) Countries included in second observation, 1965<br />
1975 (N = 22): Algeria (1966); Benin (1975); Botswana<br />
(1971); Burundi (1965); Ethiopia (1968); Ghana<br />
(1970); Ivory Coast (1975); Kenya (1969); Lesotho<br />
(1972); Liberia (1971); Libyan Arab Jamahiriya (1973);<br />
Mauritania (1973); Morocco (1971); Rw<strong>and</strong>a (1970);<br />
Senegal (1971); Seychelles (1971); South Africa (all<br />
races, 1970); Southern Rhodesia (all races, 1969);<br />
Tunisia (1966); Ug<strong>and</strong>a (1969); United Republic <strong>of</strong><br />
Tanzania (1973); Western Sahara (1970).<br />
Latin America<br />
(a) Countries included in first observation, 1950<br />
1964 (N = 25) : Antigua (1960); Argentina (1947);<br />
Belize (formerly British Honduras, 1960); Brazil (1950);<br />
Chile (1952); Colombia (1951); Costa Rica (1950);<br />
Cuba (1953); Dominican Republic (1950); Ecuador<br />
(1950); EI Salvador (1950); Guatemala (1950); Guyana<br />
(1960); Haiti (1950); Honduras (1961); Jamaica (1957);<br />
Mexico (1960); Nicaragua (1950); Panama (1950);<br />
Paraguay (1962); Peru (1961); Puerto Rico (1960);<br />
Trinidad <strong>and</strong> Tobago (1960); Uruguay (1963); Venezuela<br />
(1950);<br />
(b) Countries included in second observation, 1965<br />
1977 (N = 23): Antigua (1970); Bahamas (1970);<br />
Brazil (1970); Chile (1970); Colombia (1973); Costa<br />
Rica (1973); Cuba (1970); Dominican Republic (1970);<br />
Ecuador (1974); EI Salvador (1971); Guatemala (1973);<br />
Guyana (1970); Haiti (1971); Honduras (1974); Mexico<br />
(1973); Nicaragua (1971); Panama (1973); Paraguay<br />
(1972); Peru (1972); Puerto Rico (1970); United States<br />
Virgin Isl<strong>and</strong>s (1970); Uruguay (1975); Venezuela<br />
(1971).
Northern America<br />
(a) Countries included in first observation, 1950<br />
1964 (N = 3): Canada (1951); Greenl<strong>and</strong> (1960);<br />
United States <strong>of</strong> America (1950);<br />
(b) Countries included in second observation, 1965<br />
1977 (N = 3): Canada (1971); Greenl<strong>and</strong> (1965);<br />
United States <strong>of</strong> America (1970).<br />
East Asia<br />
(a) Countries included in first observation, 1950<br />
1964 (N = 2) : Japan (1950); Republic <strong>of</strong> Korea<br />
(1960);<br />
(b) Countries included in second observation, 1965<br />
1975 (N = 2) : Japan (1975); Republic <strong>of</strong> Korea<br />
(1970);<br />
South Asia<br />
(a) Countries included in first observation, 1950<br />
1964 (N = 14): Bangladesh (1961); Brunei (1960);<br />
Burma (1953); Democratic Kampuchea (1962); India<br />
(1951); Indonesia (1961); Iran (1956); Iraq (1957);<br />
Jordan (1961); Nepal (1961); Pakistan (1961); Sri<br />
Lanka (1953); Syrian Arab Republic (1960); Thail<strong>and</strong><br />
(1956);<br />
(b) Countries included in second observation, 1965<br />
1977 (N = 13): Bangladesh (1974); India (1971); Indonesia<br />
(1971); Iran (1971); Iraq (1972); Lebanon<br />
(1970); Maldives (1967); Nepal (1971); Pakistan<br />
(1968); Philippines (1970); Sri Lanka (1971); Syrian<br />
Arab Republic (1970); Thail<strong>and</strong> (1970).<br />
Europe<br />
(a) Countries included in first observation,' 1950<br />
1964 (N = 26): Albania (1955); Austria (1951); Bulgaria<br />
(1956); Cyprus (1960); Czechoslovakia (1961);<br />
Denmark (1960); Finl<strong>and</strong> (1950); France (1962); Germany,<br />
Federal Republic <strong>of</strong> (1961); Greece (1951);<br />
Hungary (1960); Icel<strong>and</strong> (1951); Irel<strong>and</strong> (1951); Israel<br />
(1961); Luxembourl (1960); Malta (1957); Netherl<strong>and</strong>s<br />
(1960); Norway (1950); Pol<strong>and</strong> (1950); Portugal<br />
(1960); :Romania (1956); Spain (1950); Sweden (1950);<br />
Switzerl<strong>and</strong> (1960); Turkey (1955); United Kingdom<br />
(1951);<br />
(b) Countries included in second observationr<br />
1965-1977 (N = 21): Austria (1971); Bulgaria (1971);<br />
Denmark (1%9); Finl<strong>and</strong> (1970); France (1968); German<br />
Democratic Republic (1971); Greece (1971); Hungary<br />
(1970); Icel<strong>and</strong> (1975); Irel<strong>and</strong> (1971); Israel<br />
(1972); Luxembourg (1970); Netherl<strong>and</strong>s (1971); Norway<br />
(1970); Pol<strong>and</strong> (1971); Romania (1972); Spain<br />
(1970); Swedea (1970); Switzerl<strong>and</strong> (1970); Turkey<br />
(1970); Yugoslavia (1971).<br />
Oceania<br />
(a) Countries included in first observation, 1950<br />
1964 (N = 2): Australia (1954); New Zeal<strong>and</strong> (1951);<br />
(b) Countries included in second observation, 1965<br />
1977 (N = 6): Australia (1971); Gilbert Isl<strong>and</strong>s <strong>and</strong><br />
1 Including Cyprus, Israel an4 Turkey! which are currently<br />
included in the region ef Western South Asia.<br />
2 Including Israel <strong>and</strong> Turkey, which are currently included<br />
in the region <strong>of</strong> Western South Asia.<br />
109<br />
Tuvalu (1968); Guam (1970); New Hebrides (1967);<br />
Solomon Isl<strong>and</strong>s (1970); Samoa (1966).<br />
USSR<br />
(a) For first observation: 1959 (N = 1);<br />
(b) For second observation: 1970 (N = 1).<br />
A. LEVELS OF URBANIZATION BY AGE AND SEX<br />
Table 43 presents data on the average percentage <strong>of</strong><br />
an age/sex group that lived in urban areas, by major<br />
area, in the post-1965 period. It should be emphasized<br />
that the figures are regional averages <strong>of</strong> information for<br />
countries with data; thus, they do not correspond to<br />
the regional averages <strong>of</strong> proportion urban shown in<br />
chapter III, which cover all countries in a region <strong>and</strong><br />
which weight observations by population size. For purposes<br />
<strong>of</strong> comparisons over time, the table also includes<br />
data for the world <strong>and</strong> the more developed <strong>and</strong> less<br />
developed regions in the period 1950-1964. The data<br />
for both periods in these latter three aggregates are<br />
shown graphically in figure IX. It is immediately evident<br />
from the figure that there have been "increases"<br />
over time in the level <strong>of</strong> urbanization but that these increases<br />
have been fairly uniform over ages. The general<br />
configuration <strong>of</strong> the curves has changed relatively little<br />
in the recent past. For this reason, <strong>and</strong> for the sake <strong>of</strong><br />
economy, the remainder <strong>of</strong> the chapter considers only<br />
the more recent period.<br />
As illustrated in figure IX, very young children are<br />
generally less urbanized than teen-agers or young adults,<br />
almost certainly because rural fertility rates are typically<br />
higher than urban rates. The level <strong>of</strong> urbanization among<br />
new-borns is determined both by the ratio <strong>of</strong> urbanto-rural<br />
fertility <strong>and</strong> by the proportion urban in the<br />
childbearing population. In the absence <strong>of</strong> rural/urban<br />
fertility differences, the urban proportion in the 0-4 age<br />
group would simply be a weighted average <strong>of</strong> the proportion<br />
urban among women <strong>of</strong> childbearing age, with the<br />
weights determined by age-specific fertility levels. The<br />
fact that urbanization among the 0-4 age group is considerably<br />
lower than that among childbearing women<br />
thus testifies to the prevalence <strong>of</strong> conditions in which<br />
rural fertility exceeds urban.<br />
<strong>Urban</strong>ization levels actually decline somewhat between<br />
age groups 0-4 <strong>and</strong> 10-14 in the more developed<br />
regions, although not in the less developed regions. The<br />
most likely reason for the decline is that the parents <strong>of</strong><br />
the older children are less highly urbanized than parents<br />
<strong>of</strong> the younger children, as evidenced by the downwardsloping<br />
urbanization level after ages 25-29 in the more<br />
developed countries. This slope is not as sharp in the<br />
less developed countries, which may account for the<br />
failure <strong>of</strong> urbanization levels in this region to decline<br />
with age among children.<br />
Beginning with ages 10-14 in the less developed regions<br />
<strong>and</strong> 15-19 in the more developed, urbanization<br />
levels begin to rise. This rise almost certainly reflects a<br />
history <strong>of</strong> net rural-urban migration in the pertinent<br />
cohorts; in the absence <strong>of</strong> migration, a continued decline<br />
in urbanization levels with age would be expected by<br />
virtue <strong>of</strong> the increasingly rural distribution <strong>of</strong> the<br />
parental cohorts with whom individuals in successively<br />
older cohorts are associated. It is well known that the<br />
dominant motive for rural-urban migration is economic
AgII group<br />
0-4 ..<br />
5-9 .<br />
10-14 .<br />
15-19 .<br />
20-24 .<br />
25-29 ................•............<br />
30-34 .<br />
35-39 .<br />
40-44 .<br />
45-49 ...........................••<br />
50-54 .<br />
55-59 ........•....................<br />
60-64 .<br />
65-69 .<br />
70+ ......•.......•...•.........•<br />
Total ..<br />
_ Both sexes .<br />
o<br />
Age group<br />
0-4 .<br />
5-9 .<br />
10-14 .<br />
15-19 ...............•.........•...<br />
20-24 .........................•...<br />
25-29 ............................•<br />
30-34 .<br />
35-39 .<br />
40-44 ..<br />
45-49 .<br />
50-54 •...........................•<br />
55-59 •......................•.....<br />
60-64 ..<br />
65-69 ...........•........•........<br />
70+ ......................•.....•<br />
Total .<br />
Both sexes ..<br />
Moles<br />
TABLE 43. AVERAGE PERCENTAGE URBAN, BY AGE AND SEX, FOR TOTAL SAMPLE,<br />
MORE DEVELOPED AND LESS DEVELOPED REGIONS, AND MAJOR AREAS<br />
Total sample<br />
Females<br />
39.389 39.188<br />
38.756 39.035<br />
39.027 40.023<br />
42.318 43.418<br />
45.594 45.776<br />
45.484 44.714<br />
44.435 43.532<br />
43.001 42.751<br />
42.539 42.461<br />
41.557 41.897<br />
40.21H 41.443<br />
39.728 41.736<br />
38.229 41.108<br />
36.912 40.951<br />
36.115 41.153<br />
41.107 41.758<br />
41.447<br />
More developlld<br />
regions<br />
Moles<br />
Females<br />
58.097 57.940<br />
56.216 56.319<br />
55.532 55.599<br />
58.804 60.154<br />
63.987 66.438<br />
64.719 65.393<br />
62.806 63.156<br />
61.025 61.829<br />
60.563 61.539<br />
60.019 61.192<br />
59.034 60.322<br />
57.799 59.660<br />
55.831 59.210<br />
54.142 58.814<br />
53.306 58.942<br />
59.075 60.362<br />
59.729<br />
1965-1975<br />
Less developed<br />
regions<br />
Males<br />
Females<br />
31.497 31.277<br />
31.390 31.743<br />
32.063 33.452<br />
35.363 36.357<br />
37.834 37.059<br />
37.369 35.990<br />
36.685 35.254<br />
35.398 34.702<br />
34.935 34.412<br />
33.768 33.756<br />
32.370 33.479<br />
32.104 34.174<br />
30.803 33.472<br />
29.643 33.415<br />
28.862 33.648<br />
33.527 33.910<br />
33.734<br />
Africa Latin America Northern America<br />
Moles Females Males Females Moles Females<br />
22.405 21.767 46.438 46.442 71.267 71.026<br />
21.269 21.907 47.125 47.626 69.514 69.557<br />
21.522 22.626 47.930 50.311 68.925 69.164<br />
24.665 24.286 50.587 54.741 70.219 72.753<br />
29.607 25.493 51.430 55.346 75.565 78.568<br />
29.704 24.874 50.692 54.201 75.572 76.656<br />
29.075 23.768 50.285 54.025 74.176 75.389<br />
27.657 23.148 49.468 53.150 72.893 73.225<br />
25.931 21.550 49.895 54.292 72.262 73.426<br />
24.0'12 20.692 49.887 54.037 72.352 72.966<br />
22.100 19.844 48.302 54.235 69.182 71.298<br />
20.561 19.780 49.022 55.454 68.552 71.305<br />
19.254 19.376 47.698 54.975 67.011 72.067<br />
l{>.933 18.473 48.094 56.209 65.944 71.961<br />
16.196 19.004 47.770 56.691 67.305 75.819<br />
23.916 22.582 48.768 51.844 71.378 72:884<br />
23.264 50.318 72.132<br />
East Asia South Asia Europe OCllania USSR<br />
Males Females Moles Femoles Moles Females Moles Females Maltls Females<br />
58.417 58.502 25.929 25.868 54.497 54.322 27.181 27.328 48,201 48.003<br />
56.368 55.984 26.523 26.517 52.397 52.554 26.783 26.347 47.874 47.727<br />
55,811 55.893 27.601 28.514 51.750 51.800 27.180 26.821 48.491 48.516<br />
62.827 63.444 29.815 29.193 54.996 56.197 34.044 31.632 61.689 63.100<br />
64.547 67.018 31.320 29.474 60.238 62.868 36.249 31.456 69.335 69.927<br />
66.319 66.122 31.183 28.384 61.414 62.123 33.427 29.318 64.682 63.452<br />
64.574 63.172 30.793 28.053 59.247 59.461 31.305 27.782 63.411 63.426<br />
61.629 59.753 29.427 28.110 57.455 58.421 29.502 28.041 58.866 58.922<br />
59.257 57.496 29.521 27.455 56.984 58.086 29.375 28.294 60.966 59.383<br />
56.384 54.786 27.603 26.609 56.513 57.879 28.757 27.792 58.013 57.921<br />
53.660 52.572 27.241 26.336 55.660 57.112 28.336 28.268 60.545 56.995<br />
51.031 51.314 28.013 28.022 54.376 56.473 27.282 27.865 57.896 53.402<br />
49.397 50.418 26.129 26.062 52.408 55.858 27.836 28.292 51.095 51.558<br />
46.934 49.310 25.241 25.883 50.932 55.586 25.000 27.075 40.849 46.604<br />
42.834 46.517 23.856 25.837 49.593 55.150 24.598 26.608 44.688 48.744<br />
58.699 58.331 28.047 27.464 55.401 56:813 29.465 28.230 56.582 55.995<br />
58.512 27.767 56.122 28.888 56.265
FIpre XI. Levell or female arbaaizatloD, by age <strong>and</strong> major<br />
ana, 1965-1975<br />
Perce". urbln<br />
80<br />
7Or-- __<br />
80<br />
110<br />
40<br />
30<br />
20<br />
10<br />
. .-<br />
...... ... outh Alii<br />
-. .<br />
Af;r:'" ............. -....._- .--..-.....-<br />
0-4 10-14 20-24 30-34 40-44 10-114 110-84 70+<br />
Att<br />
B. SEX BALANCES IN URBAN AND RURAL AREAS<br />
Unusual sexual imbalances are generally the result <strong>of</strong><br />
conditions that induce one sex to migrate much more frequently<br />
than the other. It is very rare that sex differences<br />
in mortality or births could cause a population's sex ratio<br />
to lie outside the range <strong>of</strong> 90: 110. <strong>Urban</strong> <strong>and</strong> rural sex<br />
imbalances are frequently related to uneven locational<br />
distribution <strong>of</strong> employment opportunities for one sex or<br />
the other, combined with various residential contingencies.<br />
In some less developed areas, scarcity <strong>of</strong><br />
adequate housing facilities for family-style residences in<br />
rapidly growing urban locations has caused many men in<br />
search <strong>of</strong> urban jobs to be separated, at least temporarily<br />
or periodically, from their rural families. Furthermore,<br />
the short-term nature <strong>of</strong> much migration in Africa <strong>and</strong><br />
Asia <strong>of</strong>ten makes it inefficient to carry along the family<br />
retinue. Latin America is exceptional among the major<br />
less developed areas in that the cities are typically more<br />
feminine than masculine. Single women are <strong>of</strong>ten employed<br />
by urban family households as domestic servants<br />
<strong>and</strong> lodged within the household <strong>of</strong> their employer."<br />
Because rural/urban sex balances are closely related<br />
to the general social <strong>and</strong> economic setting, it is useful to<br />
review some <strong>of</strong> their patterns through time as well as<br />
through space. Simple data on urban <strong>and</strong> rural sex balances<br />
covering many past decades are available for<br />
several more developed countries with long histories <strong>of</strong><br />
urbanization. <strong>Urban</strong> <strong>and</strong> rural sex ratios for these <strong>and</strong><br />
other countries are shown in tables 44 <strong>and</strong> 45 (except<br />
where otherwise indicated in the foot-notes to the tables,<br />
11 Harley L. Browning, "Migrant selectivity <strong>and</strong> the growth <strong>of</strong><br />
large cities in developing societies", in National Academy <strong>of</strong><br />
Sciences, Rapid <strong>Population</strong> <strong>Growth</strong>: Consequences <strong>and</strong> Policy<br />
Implications (Baltimore, Maryl<strong>and</strong>, Johns Hopkins Press, 1971),<br />
p.287.<br />
113<br />
calculations were based on national census data). The<br />
data <strong>of</strong> tables 44 <strong>and</strong> 45 are summarized in figure XIT.<br />
In order to facilitate comparisons between urban <strong>and</strong><br />
rural areas, the graph has been plotted in terms <strong>of</strong> sexratio<br />
differences, rather than absolute sex ratios. In this<br />
measure, the rural sex ratios <strong>of</strong> each country have simply<br />
been subtracted from the urban in order to obtain<br />
sex-ratio differences between urban <strong>and</strong> rural areas.<br />
Through this differencing procedure, unusual sex ratios<br />
in the population as a whole are effectively removed as<br />
an influence on the value <strong>of</strong> the measure. Figure XII<br />
shows that urban areas <strong>of</strong> India, I apan <strong>and</strong> the USSR<br />
have been relatively more masculine than rural areas at<br />
all dates under review (i.e., the urban/rural differences<br />
have been positive), whereas urban areas in Canada,<br />
Mexico <strong>and</strong> the United States have been relatively more<br />
feminine than rural areas. Only in France did the relative<br />
gender <strong>of</strong> the urban sector change during the period<br />
under review. Whereas the urban sector was relatively<br />
more masculine than rural areas in the initial periods,<br />
urban areas became more feminine than rural areas<br />
after the mid-1870s <strong>and</strong> remained so thereafter.<br />
Despite the persistence <strong>of</strong> customary patterns <strong>of</strong> relative<br />
masculinity or femininity <strong>of</strong> urban areas in most<br />
countries, there have been surprisingly parallel directions<br />
<strong>of</strong> change in both categories <strong>of</strong> the more developed<br />
countries (Canada, France, Japan, USSR <strong>and</strong> United<br />
States). Two major directions <strong>of</strong> change can be seen in<br />
the graphs <strong>of</strong> the more developed countries. During the<br />
early decades under review, the cities <strong>of</strong> the more developed<br />
countries were apparently undergoing a process<br />
<strong>of</strong> relative urban feminization as the values <strong>of</strong> the sexratio<br />
difference were declining. The steady downward<br />
trend in sex-ratio difference was interrupted briefly in<br />
the United States during the early twentieth century.<br />
This interruption was probably a result <strong>of</strong> heavy male<br />
immigration from abroad into cities in the United States<br />
during that period. The downward trend suggests that<br />
at some point, <strong>of</strong>ten before the first observation becomes<br />
available, each <strong>of</strong> the countries had predominantly<br />
masculine cities. This suggestion is consistent with the<br />
fact that many cities were just being built <strong>and</strong> that men<br />
predominate in the construction industry." Contemporary<br />
experience <strong>of</strong> less developed countries in which rapid<br />
urban construction is occurring suggests that urban<br />
existence during such periods can be something <strong>of</strong> a<br />
pioneering experience <strong>and</strong> as such may <strong>of</strong>ten attract men<br />
rather than women." Women in pre-industrial <strong>and</strong> early<br />
industrial stages <strong>of</strong> urban development may <strong>of</strong>ten be<br />
relatively better <strong>of</strong>f in the countryside than in the cities<br />
because in the countryside they have the protection <strong>and</strong><br />
support <strong>of</strong> the extended family as well as opportunity to<br />
participate in subsistence agriculture <strong>and</strong> thereby provide<br />
some <strong>of</strong> their own food supply.<br />
As conditions improve in the cities, there are relatively<br />
more opportunities for men to bring their wives<br />
<strong>and</strong> families with them; <strong>and</strong> when this happens, there is<br />
also opportunity for further equalization <strong>of</strong> the sex bal-<br />
12 For evidence on the importance <strong>of</strong> this factor in Paris, see<br />
David Pinkney, Napoleon 111 <strong>and</strong> the Rebuilding <strong>of</strong> Paris<br />
(Princeton, New Jersey, Princeton University Press, 1958).<br />
18 Donald J. Bogue, as summarized in Alan Simmons, Sergio<br />
Diaz-Briquets <strong>and</strong> Aprodicio A. Laquian, Social Change <strong>and</strong> Internal<br />
Migration: A Review <strong>of</strong> Research Findings from Africa,<br />
Asia, <strong>and</strong> Latin America, a report <strong>of</strong> the Migration R.eview<br />
Task Force <strong>of</strong> the International <strong>Development</strong> 'P - --'uch Centre<br />
(Ottawa, 1977), p. 86.
Period<br />
TABLE 44. INTERNATIONAL TIME SERIES OF URBAN SEX RATIOS (Males per 100 females)<br />
1856 .<br />
1861 .<br />
1866 .<br />
1872 .<br />
1876 .<br />
1881 .<br />
1886 .<br />
1890/91 .<br />
1896/97 .<br />
1900-1903 .<br />
1906-1908 .<br />
1910-1913 .<br />
1918 .<br />
1920121 .<br />
1926 .<br />
1930/31 ..<br />
1935/36 .<br />
1940/41 .<br />
1945/46 .<br />
1950/51 ..<br />
1955 .<br />
1959-1962 .<br />
1965-1968 .<br />
1970171 .<br />
1975 .<br />
Canada France-<br />
103.8<br />
105.8<br />
104.7<br />
101.7<br />
98.3<br />
98.0<br />
95.6<br />
93.5<br />
90.9<br />
90.2<br />
89.0<br />
104.4 89.1<br />
97.4 81.1<br />
82.0<br />
98.8 81.3<br />
96.7<br />
82.3<br />
95.8<br />
86.3<br />
98.1 92.0<br />
93.3<br />
97.7<br />
lapan b<br />
116.1<br />
117.5<br />
113.4<br />
111.4<br />
105.6<br />
94.2<br />
97.0<br />
97.1<br />
97.5<br />
97.6<br />
97.6<br />
98.0<br />
India"<br />
114.7<br />
110.7<br />
112.8<br />
112.7<br />
118.1<br />
120.8<br />
121.8<br />
122.8<br />
116.3<br />
118.4<br />
116.6<br />
Mexico<br />
86.2<br />
89.7<br />
94.6<br />
96.2<br />
United<br />
Slates<br />
01<br />
USSR America<br />
112.7<br />
96.4<br />
100.0<br />
98.6<br />
101.7<br />
100.4<br />
98.1<br />
95.5<br />
94.6<br />
82.5 94.1<br />
86.4 93.0<br />
Sources: For Canada, 1911-1961, data assembled from censuses <strong>and</strong> given in Leroy O.<br />
Stone, <strong>Urban</strong> <strong>Development</strong> in Canada, Census monograph (Ottawa, Dominion Bureau <strong>of</strong> Statistics,<br />
1961); data for 1971 taken from the census. For France, data for 1856-1936 taken from<br />
Yves Tugault, La Mesure de la mobilite, Institut national d'etudes demographiques, Travaux et<br />
documents, Cahier 67 (Paris, Presses Universitaires de France, 1973), p. 42; data after 1936<br />
taken from censuses.<br />
a In data for 1856-1936, urban category represents only the Department <strong>of</strong> Seine, which<br />
is historically co-extensive with the city <strong>of</strong> Paris; other urban places are grouped into the rural<br />
remainder. After 1936, data are for total urban <strong>and</strong> total rural population as defined in censuses.<br />
b <strong>Urban</strong> <strong>and</strong> rural categories refer to territories called shi <strong>and</strong> gun, respectively.<br />
c Recent data for India are not comparable with the previous series because India as constituted<br />
after 1948 does not include Bangladesh <strong>and</strong> Pakistan.<br />
ance through urban natural increase which tends to<br />
produce roughly equal proportions <strong>of</strong> men <strong>and</strong> women.<br />
This more or less natural process is evident in the declining<br />
portion <strong>of</strong> the graphs in figure XII in each <strong>of</strong> the<br />
currently developed countries. Occasionally at least, the<br />
process could be abrupt; Adna Weberv describes an<br />
instance <strong>of</strong> sudden feminization <strong>of</strong> previously masculine<br />
cities in Germany. According to Weber, who wrote at<br />
the end <strong>of</strong> the nineteenth century, the superiority <strong>of</strong><br />
women in the great cities (i.e., cities with 100,000 or<br />
more inhabitants) <strong>of</strong> Germany was rather recent.<br />
Twenty-five years earlier only a few <strong>of</strong> the great cities<br />
had contained more women than men; but by 1890,<br />
there were only two great cities that had a surplus <strong>of</strong><br />
men, Strassburg <strong>and</strong> Magdeburg, both being cities with<br />
large military garrisons. He also found that in 15 European<br />
countries, in the United States <strong>of</strong> America <strong>and</strong> in<br />
New South Wales (part <strong>of</strong> Australia), the urban population<br />
almost invariably contained a larger ratio <strong>of</strong> females<br />
to males than did the corresponding national population,<br />
excluding only Serbia (i.e., part <strong>of</strong> current Yugoslavia)<br />
<strong>and</strong> European Russia. Also, almost invariably, larger<br />
cities had greater surpluses <strong>of</strong> females than smaller cities<br />
14 Adna Ferrice Weber, The <strong>Growth</strong> <strong>of</strong> Cities in the Nineteenth<br />
Century, 2nd ed. (Ithaca, New York, Cornell University<br />
Press, 1973), p. 289. (Originally published in 1899.)<br />
114<br />
in the same countries, except in the case <strong>of</strong> Budapest as<br />
compared with other cities in Hungary.15<br />
At some point after 1930, the relative masculinity <strong>of</strong><br />
cities in more developed countries began to increase<br />
once again. It appears that this trend is the net result <strong>of</strong><br />
different processes in different countries. From inspection<br />
<strong>of</strong> tables 44 <strong>and</strong> 45, it can be seen that cities have<br />
become increasingly masculine in Japan since the 1950s<br />
(i.e., urban sex ratios have been rising), while rural areas<br />
have been becoming more feminine. This is probably<br />
related to the feminization <strong>of</strong> Japanese agriculture described<br />
in chapter VI. In the USSR, both cities <strong>and</strong><br />
countryside appear to have been masculinizing, but apparently<br />
the cities have been masculinizing more rapidly<br />
15 Among the causes <strong>of</strong> the usually observed urban female<br />
surplus, Weber discusses the observation that more men than<br />
women emigrate from cities <strong>and</strong> that already from an early a$e<br />
onward cities show a relative female surplus. He cites certain<br />
observations that among registered births the boy-to-girl ratio<br />
was slightly lower in cities than in the country; that infant mortality,<br />
selective particularly <strong>of</strong> boys, was higher in the city than<br />
in the country; that fatal accidents were more frequent in cities<br />
with men the more likely victims; <strong>and</strong> that, among the elderly,<br />
female mortality was higher than male in the rural areas, but<br />
male mortality exceeded the female in the urban areas. He pays<br />
rather little attention to the predominance, in the given countries,<br />
<strong>of</strong> female over male rural-to-urban migration. His observations<br />
on particular age groups are not very detailed.
indifference, it seems quite natural that differences between<br />
urban <strong>and</strong> rural sex balances, which are primarily<br />
determined by differential urban/rural working <strong>and</strong> living<br />
conditions, should gradually diminish, unless or until<br />
some new technology or some emergent environmental<br />
constraint may again disrupt the evolving equilibrium.<br />
Less is known about the evolution <strong>of</strong> sex balances in<br />
the less developed countries. Extensive time-series data<br />
are available here for only two <strong>of</strong> the less developed<br />
countries, India <strong>and</strong> Mexico. India has never reached<br />
a high level <strong>of</strong> urbanization, despite the fact that several<br />
<strong>of</strong> the world's greatest cities are in India. For many<br />
decades, from 1881 until 1941, India experienced increasing<br />
relative masculinization <strong>of</strong> its cities not unlike<br />
what was hypothesized above for the more developed<br />
countries at initial stages <strong>of</strong> urbanization, though perhaps<br />
more extreme. As indicated by the dashed line on<br />
figure XII, recent data for India are not comparable<br />
with the previous series since India, as constituted after<br />
1948, no longer includes Bangladesh <strong>and</strong> Pakistan. In<br />
the latter country, the urban populations are extremely<br />
masculine; hence, the lower sex-ratio difference for<br />
India after 1948 may be largely a consequence <strong>of</strong> the<br />
redefinition. That data for urban/rural sex-ratio differences<br />
since redefinition show fluctuation but no particular<br />
direction <strong>of</strong> change. There are indications, however,<br />
that the sex composition <strong>of</strong> migration into the cities is<br />
becoming more balanced now that channels <strong>and</strong> connexions<br />
have been established. Residents <strong>of</strong> almost every<br />
village have relatives or fellow villagers in at least one<br />
<strong>and</strong> possibly several <strong>of</strong> the major cities who can be expected<br />
to help sponsor further migrants from their<br />
village<strong>of</strong> origin." Thus, there exists some possibility that<br />
India may soon enter the second stage <strong>of</strong> relative feminization<br />
<strong>of</strong> cities.<br />
The current situation in Mexico is quite different from<br />
that <strong>of</strong> India. From figure XII it can be seen that Mexico<br />
is experiencing a recent relative masculinization <strong>of</strong> cities<br />
similar to that <strong>of</strong> the more developed countries. Although<br />
Mexico is classifiedas less developed, it has a fairly long<br />
history <strong>of</strong> urbanization which is not unlike that <strong>of</strong> the<br />
more developed countries. At the end <strong>of</strong> the nineteenth<br />
century, the percentage urban in Mexico was about the<br />
same as that in Japan." More recently, the percentage<br />
urban in Mexico has been close to that <strong>of</strong> the<br />
Soviet Union.<br />
Elsewhere in the less developed world, there are at<br />
least fragments <strong>of</strong> information to indicate that urban sex<br />
ratios, which had been very masculine at earlier dates,<br />
are beginning to become more feminine at recent dates.<br />
Census data for Cairo in the late nineteenth <strong>and</strong> .early<br />
twentieth centuries show a strong predominance <strong>of</strong><br />
males. However, by 1960, men <strong>and</strong> women were entering<br />
Cairo in fairly equal or only moderately male proportions."<br />
Ratios <strong>of</strong> men to women in most major cities <strong>of</strong><br />
Africa have become far less unbalanced since the Second<br />
World War. For example, in 1948, Nairobi had roughly<br />
500 adult men for every 100 women; in 1962, the ratio<br />
10 Donald J. Bogue <strong>and</strong> K. C. Zachariah, "<strong>Urban</strong>ization <strong>and</strong><br />
migration in India" in Roy Turner, ed., India's <strong>Urban</strong> Future<br />
(Berkeley, University <strong>of</strong> California Press, 1962), pp. 40 <strong>and</strong> 45.<br />
See also K. C. Zachariah, Migrants in Greater Bombay (London,<br />
Asia Publishing House, 1968), pp. 123-125.<br />
11 A. F. Weber, op, cit., graph facing title-page <strong>and</strong> pp. 144<br />
145.<br />
18 J. M. Nelson,loc. cit., p. 732.<br />
116<br />
was 250 to 100. 19 In the city <strong>of</strong> Kinshasa, there were 135<br />
men per 100 women in 1955, while by 1967, this ratio<br />
had dropped to 110. 20 At Lagos, the sex ratio dropped<br />
from 126 in 1931 to 108 by 1961. 21<br />
The ubiquitous appearance <strong>of</strong> peripheral squatter<br />
settlements around the cities <strong>of</strong> the less developed countries<br />
is further evidence that families, rather than lone<br />
male migrants, are beginning to move to the cities. Single<br />
male migrants typically rent only rooms, or even only<br />
bed space, in the older sections <strong>of</strong> the cities." A common<br />
pattern in Turkey (<strong>and</strong> undoubtedly elsewhere)<br />
might be called "family migration by stages". Many rural<br />
families have at least one family member working in the<br />
cities. If the city worker does not do well, he may return<br />
home. The same or a different family member may later<br />
try elsewhere. Eventually someone will find a satisfactory<br />
urban foothold, <strong>and</strong> the rest <strong>of</strong> the family will<br />
follow, perhaps in stages."<br />
Turning now to contemporary relations, table 46 presents<br />
the average ratio <strong>of</strong> males to females in urban<br />
areas, by region, for the period from 1965 to the present.<br />
These data are displayed graphically in figure XIII.<br />
Table 47 <strong>and</strong> figure XIV present the same information<br />
for rural areas. All <strong>of</strong> the regional pr<strong>of</strong>iles begin with a<br />
ratio between 1.0 <strong>and</strong> 1.1, reflecting relatively constant<br />
sex ratios at birth. By the ages 10-14 some distinct regional<br />
patterns begin to emerge in urban areas, which<br />
are typically accentuated thereafter. Northern America,<br />
Europe <strong>and</strong> East Asia maintain relatively equal numbers<br />
<strong>of</strong> urban males <strong>and</strong> females until the age <strong>of</strong> 45 or so.<br />
Thereafter, urban sex ratios decline rapidly to a range<br />
<strong>of</strong> 0.6 or 0.7 (males per female) at ages 70 <strong>and</strong> above.<br />
Presumably, this decline reflects primarily sex differences<br />
in mortality. Sex-selectivemigration may also contribute<br />
to the decline, which is not as large in rural areas<br />
(although neither, as stated earlier are sex differences in<br />
mortality).<br />
The USSR shows rapidly declining sex ratios in urban<br />
areas with age, but declines are equally large in rural<br />
areas. Clearly, the losses <strong>of</strong> the Second World War are<br />
imprinted on the sex structure in this country.<br />
<strong>Urban</strong> sex structures show remarkable diversity<br />
among the less developed regions. Africa <strong>and</strong> South Asia<br />
show quite high masculinity at the working ages, reaching<br />
a peak <strong>of</strong> 1.43 males per female at ages 45-49 in the<br />
countries <strong>of</strong> Africa sampled. Oceania also shows quite<br />
high urban masculinity, although less significanceshould<br />
be attached to the observations <strong>of</strong> the region, which is<br />
dominated by small isl<strong>and</strong> populations. Latin America,<br />
on the other h<strong>and</strong>, shows predominantly feminine cities,<br />
with females outnumbering males by an average <strong>of</strong> some<br />
10 per cent at ages 15-19 <strong>and</strong> above. <strong>Rural</strong> sex ratios in<br />
these regions are the reverse <strong>of</strong> this pattern: predominantly<br />
feminine in Africa <strong>and</strong> South Asia, at least at the<br />
prime working ages; <strong>and</strong> unusually masculine in Latin<br />
America. In general, there is less variance in rural sex<br />
ratios than in urban ratios, reflecting the fact that rural<br />
19 Ibid., p. 733.<br />
20 Maurico Ducreux, "La croissance urbaine et demographique<br />
de Kinshasa", in Colloques internationaux du Centre national<br />
de la recherche scientifique, La croissance urbaine en Afrique<br />
noire et aMadagascar (Talence, 1972), vol. I, p. 560.<br />
21 Charles N. Eiiogu, "African migrants in Lagos suburbs,"<br />
doctoral dissertation, The Australian National University, January<br />
1968, p. 48.<br />
22 J. M. Nelson, loco cit., p. 733.<br />
23 J. M. Nelson, loco cit., pp. 732-733.
....<br />
-.,J<br />
TABLE 46. AVERAGE SEX RATIOS AT VARIOUS AGES, URBAN AREAS, BASED ON DATA RECORDED IN 1965-1975<br />
More uss<br />
A,. Total tlndoped developed lAtin Northern EAft South<br />
fFOUP sampk regions regions Africa America America Asia Asia Europe Oceania USSR<br />
G-4 •.........•........ 1.04734 1.04934 1.04650 1.06655 1.02510 1.04371 1.05641 1.03896 1.05105 1.06740 1.03995<br />
5-9 .....•............. 1.02664 1.04737 1.01790 0.98344 1.00673 1.04697 1.07037 1.05116 1.04691 1.l0993 1.04266<br />
10-14 .....••.••.•....... 1.03252 1.04901 1.02556 1.02675 0.97311 1.03655 1.05578 1.06114 1.05133 1.14285 1.03796<br />
15·19 · .......•.......••. 1.02061 1.02299 1.01961 1.00999 0.88793 0.99807 1.02631 1.09890 1.02578 1.39013 1.01858<br />
20-24 ••.... , .••.•....•.• 1.03305 1.00242 1.04597 1.03865 0.87166 0.96037 0.98185 1.11975 1.00675 1.59285 1.00891<br />
25-29 · .•........•...... , 1.05136 1.02503 1.06246 1.12670 0.86972 1.04680 1.00956 1.12839 1.02234 1.43106 0.99835<br />
30-34 ...•....•..•••..... 1.08569 1.01238 1.11662 1.23137 0.89091 1.04415 1.04293 1.14254 1.00903 1.49783 0.96921<br />
35-39 •.........••......• 1.08340 1.00246 1.11755 1.28958 0.86519 1.03417 1.02581 1.15710 0.99734 1.36953 0.96191<br />
4G-44 .........•••...... " 1.10836 0.97274 1.16558 1.36488 0.89912 0.99760 0.99043 1.18427 0.96793 1.43011 0.87776<br />
45-49 •.................. 1.11256 0.!HI70 1.19729 1.42592 0.90126 1.00030 1.01333 1.24408 0.90288 1.39168 0.63246<br />
50-54 · ................. , 1.06313 0.87405 1.14290 1.31547 0.88061 0.93151 0.93000 1.17065 0.87328 1.44897 0.64511<br />
55-59 ................... 1.04773 0.85997 1.12694 1.33161 0.88338 0.87987 0.84297 1.17152 0.86764 1.22601 0.59851<br />
60-64 ......••.....•....• 0.96455 0.81644 1.02703 1.09179 0.83127 0.83981 0.79146 1.13179 0.82347 1.33729 0.50281<br />
65-69 ................•.. 0.94083 0.76433 1.01530 1.12848 0.78235 0.79329 0.71450 1.16988 0.76999 1.20126 0.40052<br />
70 + ••.........•....... 0.78466 0.60924 0.85867 0.92557 0.66981 0.62284 0.56710 1.05316 0.61383 0.94596 0.37608<br />
Total · ....•••...••.••... 1.01791 0.94883 1.04705 1.08921 0.91779 0.98221 0.99324 1.09365 0.94477 1.28397 0.86367<br />
TABLE 47. AVERAGE SEX RATIOS AT VARIOUS AGES, RURAL AREAS, BASED ON DATA RECORDED IN 1965-1975<br />
More Less<br />
A,. Total developed developed lAtin Northern Bast South<br />
group sample regions regions Africa America America Asia Asia Europe Oceania USSR<br />
G-4 .................................. 1.02743 1.04241 1.02111 1.00059 1.02343 1.03296 1.06266 1.03045 1.04296 1.06511 1.03171<br />
5-9 ............................. 1.04597 1.05221 1.04333 1.04745 1.03195 1.04974 1.04889 1.04931 1.05447 1.05591 1.03657<br />
10-14 ...................................... 1.08353 1.05265 1.09655 1.09704 1.08324 1.04960 1.05860 1.11317 1.05375 1.l0779 1.03897<br />
15-19 ...................................... 1.05447 1.09345 1.03802 0.99684 1.07536 1.12924 1.04622 1.04293 1.08225 1.07429 1.08173<br />
20-24 ...................................... 1.01951 1.13932 0.96897 0.85780 1.04156 1.14236 1.06984 0.96071 1.14496 1.13505 1.03757<br />
25-29 .................................. 0.98314 1.06949 0.94672 0.86564 1.02534 1.11444 1.00065 0.93300 1.06648 1.00381 0.94640<br />
30-34 .............................. 0.99136 1.03782 0.97176 0.87380 1.05920 1.11708 0.98771 0.96386 1.02596 1.04281 0.96986<br />
35-39 .................................... 1.02228 1.04203 1.01395 0.94973 1.03355 1.05401 0.94119 1.05487 1.04221 1.12555 0.96413<br />
4G-44 ...................................... 1.04391 1.02050 1.05378 0.97874 1.10382 1.06031 0.91987 1.04132 1.01623 1.22588 0.82163<br />
45-49 .........................<br />
O' ........ 1.05911<br />
0.96598 1.09841 1.06666 1.10339 1.03732 0.94548 1.11372 0.96116 1.20659 0.63008<br />
50-54 ................................ 1.05033 0.93509 1.09895 1.03775 1.16104 1.03624 0.88342 1.07597 0.93311 1.17168 0.55714<br />
55-59 ..................................... 1.10317 0.94937 1.16806 1.15634 1.19403 1.01642 0.85552 1.14579 0.95650 1.20758 0.49882<br />
60-64 ...................................... 1.06537 0.95902 1.11023 1.03899 1.17987 1.07165 0.83143 1.08880 0.95805 1.21506 0.51222<br />
65-69 ...................................... 1.09917 0.94875 1.16263 1.15425 1.16343 1.06549 0.79537 1.18451 0.94161 1.23440 0.50618<br />
70 + ............................ 'I. 0.99736 0.79197 1.08401 1.08921 1.02927 0.95022 0.67374 1.16719 0.77935 1.15726 0.44267<br />
Total ............................ 1.02614 1.00907 1.03334 0.99044 1.06064 1.06118 0.97363 1.03908 1.00581 1.09830 0.84332
Figure xm. <strong>Urban</strong> sex mUos by age, major areas, based on<br />
data for 1965·1975<br />
Soxrotio (.....PI' ,,,,,lie)<br />
1.8<br />
1.7<br />
0.3<br />
0.2<br />
0.1<br />
0-4 10-14<br />
20-24 30-34 40-44<br />
AfIlI<br />
50-54 80-64 70+<br />
populations in the developing regions outnumber the<br />
urban (except in Latin America). Selective migration <strong>of</strong><br />
one sex thus tends to have a smaller proportionate impact<br />
on the rural than on the urban sex ratio.<br />
<strong>Urban</strong> <strong>and</strong> rural sex ratios are partially a product <strong>of</strong><br />
the sex composition <strong>of</strong> the respective national population,<br />
which in turn is affected by sex differences in<br />
mortality <strong>and</strong> in international migration. In order to control<br />
for these national-level factors, it is useful to compare<br />
sex ratios <strong>of</strong> urban areas directly with those <strong>of</strong> the<br />
country. This comparison is made in figure XV, where<br />
the ratio, percentage urban <strong>of</strong> males to percentage urban<br />
<strong>of</strong> females, is plotted as a function <strong>of</strong> age. 24 This procedure<br />
clearly has the effect <strong>of</strong> removing the anomalous<br />
character <strong>of</strong> the Soviet Union, which, along with Europe,<br />
Northern America <strong>and</strong> East Asia, has a masculinity <strong>of</strong><br />
urban areas that differs very little from that <strong>of</strong> the respective<br />
national ratios. On average, the sex ratio in<br />
urban areas is quite close to that <strong>of</strong> the country until ages<br />
beyond 60, when it begins to decline in every region. Although<br />
this decline could result from selective overstatement<br />
<strong>of</strong> age among rural females, it appears more likely<br />
to reflect higher sex differences in mortality in urban<br />
than in rural areas, combined with sex-selective migration<br />
<strong>of</strong> the widowed population. In any case, the convergence<br />
<strong>of</strong> sex ratios between urban <strong>and</strong> rural areas<br />
that was documented above from trend data for a few<br />
24 This ratio is Mu/Fu. which can obviously also be written as<br />
M F<br />
Mu/M, which is the ratio <strong>of</strong> the sex ratio in urban areas to the<br />
Fu F<br />
sex ratio <strong>of</strong> the national population.<br />
118<br />
Figure XIV. <strong>Rural</strong> sex mUos by age, major areas, based on<br />
data for 1965·1975<br />
So. 'ltlos (mil.. perftmell)<br />
1.4<br />
1.3<br />
1.2<br />
1.1<br />
1.0<br />
0.8<br />
0.•<br />
0.7<br />
0.8<br />
"""" ""<br />
0.8 ussll'""<br />
0.4<br />
0.3<br />
0.2<br />
0.1<br />
0-4 10-14 20-24 30-34 40-44 50-54 80-64 70+<br />
AfIlI<br />
developed countries is obviously a widespread phenomenon<br />
both in space <strong>and</strong> over various ages.<br />
Among the less developed regions, relative urban sex<br />
ratios are much as indicated above. Africa, South Asia<br />
<strong>and</strong> Oceania show high relative as well as absolute masculinity<br />
in cities. Latin America, on the other h<strong>and</strong>,<br />
displays high relative <strong>and</strong> absolute feminization <strong>of</strong> cities.<br />
It is reasonable to expect that continued urbanization<br />
<strong>and</strong> development in these major areas will bring in its<br />
train the same sort <strong>of</strong> convergence <strong>of</strong> urban <strong>and</strong> rural sex<br />
ratios that has been witnessed elsewhere.<br />
Figure XV. Average mUo, male percentage urban to female<br />
percentage urban, by age, major areas, 1965·1975<br />
1.5 r---,-----,-----,-----,-----,----,----,---,<br />
1.4<br />
1.3<br />
1.2<br />
1.0<br />
0.8<br />
0.8<br />
0.7<br />
0.8<br />
0.5<br />
0.4<br />
0.3<br />
0.2<br />
0.1<br />
0-4 10-14 20-24 30-34 40-44<br />
AfIlI<br />
I , .<br />
USSR<br />
50-54 80-54 70+
ANNEXES
1<br />
1<br />
1<br />
1<br />
1<br />
1<br />
1<br />
1<br />
1<br />
1<br />
1<br />
1<br />
1<br />
1<br />
1<br />
1<br />
1<br />
1<br />
1<br />
1<br />
1<br />
1<br />
1<br />
1<br />
1<br />
1<br />
1<br />
1<br />
1<br />
1<br />
1<br />
1<br />
1<br />
1<br />
1<br />
1<br />
1<br />
1<br />
1<br />
1<br />
1<br />
1<br />
1<br />
1<br />
1<br />
1<br />
1<br />
1<br />
1<br />
1<br />
1<br />
1<br />
1<br />
1<br />
1<br />
1<br />
1<br />
1<br />
1<br />
1
Western Sahara: unknown; 1950, 1960 <strong>and</strong> 1970.<br />
Zaire: agglomerations <strong>of</strong> 2,000 or more inhabitants where the<br />
predominant economic activity is <strong>of</strong> the non-agricultural type<br />
<strong>and</strong> also mixed agglomerations which are considered urban because<br />
<strong>of</strong> their type <strong>of</strong> economic activity but are actually rural<br />
in size; 1950, 1960 <strong>and</strong> 1970·.<br />
Zambia: 1950: nine "European" towns, neighbouring mines,<br />
locations <strong>and</strong> compounds. 1969: localities having 5,000 or more<br />
inhabitants, the majority <strong>of</strong> whom depend upon non-agricultural<br />
activities. The smallest <strong>of</strong> the nine places in 1950 is estimated<br />
to have been 4,400. Greater conformity could not be achieved.<br />
Latin America<br />
Antigua: St. John City; 1960 <strong>and</strong> 1970.<br />
Argentina: population centres with 2,000 or more inhabitants;<br />
1947, 1960 <strong>and</strong> 1970.<br />
Bahamas: isl<strong>and</strong> <strong>of</strong> New Providence; 1963 <strong>and</strong> 1970.<br />
Barbados: parish <strong>of</strong> Bridgetown; 1960· <strong>and</strong> 1970*.<br />
Belize: legally established towns; 1960 <strong>and</strong> 1970*.<br />
Bolivia: assumed to be cities <strong>of</strong> La Paz, Oruro, POtOSI, Cochabamba,<br />
Sucre, Tarija, Santa Cruz, Trinidad <strong>and</strong> Cobija; 1950<br />
<strong>and</strong> 1976.<br />
Brazil: urban <strong>and</strong> suburban zones <strong>of</strong> administrative centres <strong>of</strong><br />
municipios <strong>and</strong> districts; 1950, 1960<strong>and</strong> 1970.<br />
Cayman Isl<strong>and</strong>s: totally urban; 1960 <strong>and</strong> 1970.<br />
Chile: populated centres having definite urban characteristics<br />
owing to presence <strong>of</strong> certain public <strong>and</strong> administrative services;<br />
1952, 1960 <strong>and</strong> 1970.<br />
Colombia: population living in a nucleus <strong>of</strong> 1,500 or more inhabitants;<br />
1951, 1964 <strong>and</strong> 1973.<br />
Costa Rica: administrative centres <strong>of</strong> cantons; 1950 <strong>and</strong> 1973.<br />
Cuba: population living in a nucleus <strong>of</strong> 2,000 or more inhabitants;<br />
1953 <strong>and</strong> 1970.<br />
Dominica: towns <strong>of</strong> Roseau <strong>and</strong> Portsmouth, <strong>and</strong> suburban<br />
area <strong>of</strong> Goodwill, which is an extension <strong>of</strong> Roseau; 1960.<br />
Dominican Republic: administrative centres <strong>of</strong> municipios <strong>and</strong><br />
municipal districts, some <strong>of</strong> which include suburban zones <strong>of</strong><br />
rural character; 1950, 1960<strong>and</strong> 1970.<br />
Ecuador: capitals <strong>of</strong> provinces <strong>and</strong> cantons; 1950, 1962 <strong>and</strong><br />
1974.<br />
El Salvador: administrative centres <strong>of</strong> municipios; 1950, 1961<br />
<strong>and</strong> 1971.<br />
French Guiana: communes <strong>of</strong> Cayenne <strong>and</strong> Saint-Laurent du<br />
Maroni; 1954, 1961 <strong>and</strong> 1967.<br />
Grenada: towns having a population <strong>of</strong> over 1,000; 1960.<br />
Guadeloupe: all communes with an administrative centre <strong>of</strong><br />
2,000 or more inhabitants; 1954, 1961 <strong>and</strong> 1967.<br />
Guatemala: cities, towns <strong>and</strong> villages that have been <strong>of</strong>ficially<br />
recognized as urban; 1964 <strong>and</strong> 1973.<br />
Guyana: agglomeration <strong>of</strong> Georgetown; 1960 <strong>and</strong> 1970.<br />
Haiti: administrative centres <strong>of</strong> communes; 1950 <strong>and</strong> 1971.<br />
Honduras: localities with at least 2,000 inhabitants; 1961*<br />
<strong>and</strong> 1974.<br />
Jamaica: Kingston metropolitan area <strong>and</strong> selected main towns;<br />
1960* <strong>and</strong> 1970.<br />
Martinque: total population <strong>of</strong> the commune <strong>of</strong> Fort-de<br />
France plus the agglomerations <strong>of</strong> the other communes having<br />
more than 2,000 inhabitants; 1954 <strong>and</strong> 1961.<br />
Mexico: localities <strong>of</strong> 2,500 or more inhabitants; 1950, 1960<br />
<strong>and</strong> 1970.<br />
Montserrat: town <strong>of</strong> Plymouth; 1960 <strong>and</strong> 1970.<br />
Netherl<strong>and</strong>s Antilles (Curarao): unknown; 1960.<br />
Nicaragua: administrative centres <strong>of</strong> departments <strong>and</strong> munlcipios;<br />
1950 <strong>and</strong> 1971.<br />
Panama: localities <strong>of</strong> 1,500 or more inhabitants having essentially<br />
urban characteristics; 1950, 1960 <strong>and</strong> 1970.<br />
Canal Zone: localities <strong>of</strong> 2,500 or more inhabitants; 1960<br />
<strong>and</strong> 1970.<br />
122<br />
Paraguay: cities, towns <strong>and</strong> administrative centres <strong>of</strong> departments<br />
<strong>and</strong> districts; 1950, 1962 <strong>and</strong> 1972.<br />
Peru: populated centres with 100 or more occupied dwellings;<br />
1961* <strong>and</strong> 1972.<br />
Puerto Rico: places with 2,500 or more inhabitants <strong>and</strong><br />
densely settled urban fringes <strong>of</strong> urbanized areas; 1950, 1960 <strong>and</strong><br />
1970.<br />
St. Kitts-Nevis-Anguilla: town <strong>of</strong> Basse-Terre; 1960 <strong>and</strong> 1970.<br />
St. Lucia: unknown; 1960.<br />
St. Vincent: towns <strong>of</strong> 1,000 or more inhabitants; 1960.<br />
Suriname: greater Paramaibo; 1950·, 1964* <strong>and</strong> 1971.<br />
Trinidad <strong>and</strong> Tobago; Port <strong>of</strong> Spain, Arima borough <strong>and</strong> San<br />
Fern<strong>and</strong>o town; 1946 <strong>and</strong> 1960.<br />
Turks <strong>and</strong> Caicos Isl<strong>and</strong>s: capital city; 1960 <strong>and</strong> 1970.<br />
United States Virgin Isl<strong>and</strong>s: localities with 2,500 or more inhabitants;<br />
1950, 1960 <strong>and</strong> 1970.<br />
Uruguay: areas defined as urban; 1963 <strong>and</strong> 1975.<br />
Venezuela: centres with population <strong>of</strong> 1,000 or more; 1950,<br />
1961 <strong>and</strong> 1971.<br />
Northern America<br />
Bermuda: totally urban; 1950, 1960 <strong>and</strong> 1970.<br />
Canada: incorporated cities, towns <strong>and</strong> villages <strong>of</strong> 1,000 or<br />
more population <strong>and</strong> their urbanized fringes; unincorporated<br />
places having 1,000 or more inhabitants, having a population<br />
density <strong>of</strong> at least 1,000 per square mile or 390 per square kilometre<br />
<strong>and</strong> their urbanized fringes; 1951*, 1961, 1966 <strong>and</strong> 1971.<br />
Greenl<strong>and</strong>: 1960: localities <strong>of</strong> 200 or more inhabitants; 1970:<br />
localities proclaimed as urban.<br />
St. Pierre <strong>and</strong> Miquelon: unknown; 1962.<br />
United States <strong>of</strong> America: places with 2,500 or more inhabitants<br />
incorporated as cities, boroughs (excludingAlaska), villages<br />
<strong>and</strong> towns (excluding towns in New Engl<strong>and</strong>, New York <strong>and</strong><br />
Wisconsin), but excluding persons living in rural portions <strong>of</strong> extended<br />
cities; densely settled urban fringe whether incorporated<br />
or unincorporated <strong>of</strong> urbanized areas, unincorporated places<br />
with 2,500 or more inhabitants; 1950, 1960 <strong>and</strong> 1970.<br />
East <strong>and</strong> South Asia<br />
Afghanistan: towns <strong>of</strong> 2,000 or more inhabitants; 1950, 1966<br />
<strong>and</strong> 1971.<br />
Bahrain: towns <strong>of</strong> Manama, Muharraq (including suburbs),<br />
Hedd, Jiddhafs, Sitra, Rifa'a <strong>and</strong> Awali; 1965 <strong>and</strong> 1971.<br />
Bangladesh: centres with a population <strong>of</strong> 5,000 or more inhabitants<br />
with such urban characteristics as streets, plazas, sewer.<br />
age systems, water-supply systems <strong>and</strong> electric light; 1951, 1961<br />
<strong>and</strong> 1974.<br />
Bhutan: unavailable; 1950, 1960 <strong>and</strong> 1970.<br />
Brunei: unavailable; 1960 <strong>and</strong> 1971.<br />
Burma: sum <strong>of</strong> 301 towns; 1953 <strong>and</strong> 1973.<br />
China: cities (including suburbs) <strong>and</strong> towns (based on estimates<br />
prepared in the <strong>Population</strong> Division <strong>of</strong> the Department <strong>of</strong><br />
International Economic <strong>and</strong> Social Affairs <strong>of</strong> the United Nations<br />
Secretariat); 1950, 1960 <strong>and</strong> 1970.<br />
Cyprus: six district towns <strong>and</strong> Nicosia suburbs; 1956, 1960<br />
<strong>and</strong> 1973.<br />
Democratic Kampuchea: municipalities <strong>of</strong> Pnhom-Penh,<br />
Bokor, Kep <strong>and</strong> 13 urban centres; 1950, 1962 <strong>and</strong> 1966.<br />
Democratic People's Republic <strong>of</strong> Korea: unavailable; 1960<br />
<strong>and</strong> 1967.<br />
Democratic Yemen: entire former colony <strong>of</strong> Aden, excluding<br />
the oil refinery <strong>and</strong> villages <strong>of</strong> Bureika <strong>and</strong> Fugun; 1950, 1960<br />
<strong>and</strong> 1973.<br />
East Timor: DiU, the capital; 1950 <strong>and</strong> 1960.<br />
Hong Kong: Hong Kong Isl<strong>and</strong>, Kowloon, New Kowloon <strong>and</strong><br />
the Tsuen Wan area <strong>of</strong> the New Territories; 1950, 1961 <strong>and</strong><br />
1971.
Athens, Salonika, Patras, Volos, Iraklion, Canea, Kalamata,<br />
Katerini, Agrinion, Chios, Aegion <strong>and</strong> Hermoupalis in their entirety,<br />
irrespective <strong>of</strong> the population size <strong>of</strong> the largest locality<br />
in them; 1951*, 1961 <strong>and</strong> 1971.<br />
Hungary: Budapest <strong>and</strong> all legally designated towns; 1949,<br />
1960, 1970 <strong>and</strong> 1975.<br />
Icel<strong>and</strong>: localities with 200 or more inhabitants; 1950*, 1960*,<br />
1970 <strong>and</strong> 1975.<br />
Irel<strong>and</strong>: cities <strong>and</strong> towns including suburbs <strong>of</strong> 1,500 or more<br />
inhabitants; 1951, 1956, 1961, 1966 <strong>and</strong> 1971.<br />
Is.le <strong>of</strong> Man: towns <strong>of</strong> Castletown, Douglas, Peel <strong>and</strong> Ramsey;<br />
1951,1961, 1966<strong>and</strong> 1971.<br />
Italy: communes with 10,000 or more inhabitants; 1951*,<br />
1961* <strong>and</strong> 1971....<br />
Liechtenstein: Vaduz, the capital city; 1950'" <strong>and</strong> 1960*.<br />
Luxembourg: communes having more than 2,000 inhabitants<br />
in the administrative centre; 1947, 1960, 1966 <strong>and</strong> 1970.<br />
Malta: 1948: built-up areas devoid <strong>of</strong> agricultural l<strong>and</strong>, including<br />
adjacent suburban areas. 1967: urban agglomeration <strong>of</strong><br />
Valletta.<br />
Monaco: city <strong>of</strong> Monaco; 1956, 1962 <strong>and</strong> 1968.<br />
Netherl<strong>and</strong>s: municipalities with a population <strong>of</strong> 2,000 or<br />
more inhabitants; also, municipalities with a population <strong>of</strong> less<br />
than 2,000 but with not more than 20 per cent <strong>of</strong> their economically<br />
active male population engaged in agriculture <strong>and</strong> specific<br />
residential municipalities <strong>of</strong> commuters; 1947*, 1960, 1970 <strong>and</strong><br />
1975.<br />
Norway: town municipalities; 1950, 1960 <strong>and</strong> 1970.<br />
Pol<strong>and</strong>: towns <strong>and</strong> settlements <strong>of</strong> urban type, e.g, workers'<br />
settlements, fishermen's settlements <strong>and</strong> health resorts; 1950,<br />
1960 <strong>and</strong> 1969.<br />
Portugal: agglomerations with 10,000 or more inhabitants;<br />
1950*, 1960 <strong>and</strong> 1970.<br />
Romania: cities, towns <strong>and</strong> 183 other localities (comprising 13<br />
per cent <strong>of</strong> total urban population) having urban socio-economic<br />
characteristics; 1950, 1960<strong>and</strong> 1970.<br />
San Marino: unavailable; 1969 <strong>and</strong> 1970.<br />
Spain: municipios with to,OOOor more inhabitants; 1950,<br />
1960 <strong>and</strong> 1970.<br />
Sweden: built-up areas with at least 200 inhabitants <strong>and</strong> usually<br />
not more than 200 metres between houses; 1950"', 1960,<br />
1965 <strong>and</strong> 1970.<br />
Switzerl<strong>and</strong>: communes <strong>of</strong> 10,000or more inhabitants, including<br />
suburbs; 1950*, 1960 <strong>and</strong> 1970.<br />
United Kingdom: de facto urban population: wards or parishes<br />
<strong>of</strong> 3,000 or more population (2,000 or more in certain<br />
circumstances) <strong>and</strong> having a population density <strong>of</strong> at least 0.6<br />
person per acre; or areas contiguous to urban areas with a population<br />
<strong>of</strong> 750 <strong>and</strong> a density <strong>of</strong> 0.6 person per acre. 1951"', 1961'"<br />
<strong>and</strong> 1971-. (See Department <strong>of</strong> the Environment, Regional Plans<br />
Directorate PRP4-National Framework Division B De Facto<br />
<strong>Urban</strong> Areas in Engl<strong>and</strong> <strong>and</strong> Wales, 1966.)<br />
124<br />
Yugoslavia: localities with 15,000 or more inhabitants; localities<br />
with 5,000-14,999 inhabitants <strong>of</strong> which at least 30 per cent<br />
are not engaged in agriculture; localities with 3,000-4,999 inhabitants<br />
<strong>of</strong> which at least 70 per cent are not engaged in agriculture;<br />
<strong>and</strong> localities with 2,000-2,999 inhabitants <strong>of</strong> which at<br />
least 80 per cent are not engaged in agriculture; 1953..., 1961<br />
<strong>and</strong> 1971.<br />
Oceania<br />
American Samoa: sum <strong>of</strong> Pago Pago <strong>and</strong> Leone; 1970 <strong>and</strong><br />
1974.<br />
Australia: population clusters <strong>of</strong> 1,000 or more inhabitants<br />
<strong>and</strong> some areas <strong>of</strong> lower population (e.g., holiday areas), if they<br />
contain 250 or more dwellings <strong>of</strong> which at least 100 are occupied;<br />
1961"', 1966 <strong>and</strong> 1971.<br />
Cook Isl<strong>and</strong>s: Avarue; 1966 <strong>and</strong> 1971.<br />
Fiji: Suva, Lautoka, Nadi, Labasa, Nausori <strong>and</strong> Ba plus urban<br />
localities; 1956 <strong>and</strong> 1966.<br />
French Polynesia: urban agglomeration <strong>of</strong> Papeete; 1962 <strong>and</strong><br />
1971.<br />
Gilbert Isl<strong>and</strong>s: sum <strong>of</strong> Tarawa <strong>and</strong> Ocean Isl<strong>and</strong>; 1968 <strong>and</strong><br />
1973.<br />
Guam: localities with 2,500 or more inhabitants; 1960 <strong>and</strong><br />
1970.<br />
New Caledonia: city <strong>of</strong> Noumea; 1963, 1969 <strong>and</strong> 1974.<br />
New Hebrides: cities <strong>of</strong> Vila <strong>and</strong> Santo; 1967.<br />
New Zeal<strong>and</strong>: 24 urban areas plus that <strong>of</strong> all boroughs, town<br />
districts, townships <strong>and</strong> county towns with populations over<br />
1,000; 1951, 1956, 1961, 1966, 1971 <strong>and</strong> 1976.<br />
Niue Isl<strong>and</strong>: city <strong>of</strong> Al<strong>of</strong>i; 1966 <strong>and</strong> 1971.<br />
Pacific Isl<strong>and</strong>s: district centre areas plus Ebeye in Kwajalein<br />
atoll <strong>of</strong> the Marshall Isl<strong>and</strong>s <strong>and</strong> Rota in the Marianna Isl<strong>and</strong>s;<br />
1967 <strong>and</strong> 1973.<br />
Papua New Guinea: centres with a population <strong>of</strong> 500 or more<br />
but excluding separately located schools, hospitals, missions,<br />
plantations, rural settlements <strong>and</strong> rural villages, regardless <strong>of</strong><br />
size; 1966 <strong>and</strong> 1971.<br />
Samoa: urban area <strong>of</strong> Apia, comprising the Faipule districts<br />
<strong>of</strong> Vaimauga West <strong>and</strong> Foleata East; 1951, 1956, 1961, 1966<br />
<strong>and</strong> 1971.<br />
Solomon Isl<strong>and</strong>s: centres with a population <strong>of</strong> 2,000 or more;<br />
up to 1970, this included only the township <strong>of</strong> Honiara; 1959<br />
<strong>and</strong> 1970.<br />
Tonga: places larger than 1,400 population; 1956 <strong>and</strong> 1966.<br />
Union <strong>of</strong> Soviet Socialist Republics<br />
Cities are urban-type localities, <strong>of</strong>ficially designated as such<br />
by each <strong>of</strong> the constituent Republics, usually according to the<br />
criteria <strong>of</strong> number <strong>of</strong> inhabitants <strong>and</strong> predominance <strong>of</strong> agricultural<br />
or number <strong>of</strong> non-agricultural workers <strong>and</strong> their families;<br />
1950, 1959 <strong>and</strong> 1970.
ADDex D. URBAN AND CITY POPULATION, RURAL POPULATION AND PERCENTAGE<br />
URBAN, MAJOR AREAS, REGIONS AND COUNTRIES, 1950·1000: TABLES 48·50<br />
TABLE 48. URBAN AND CITY POPULATION, MAJOR AREAS,<br />
REGIONS AND COUNTRIES, 1950·2000<br />
(Thous<strong>and</strong>s)<br />
Majorarea,region,country <strong>and</strong> citY 19'0 1960 1970 197' 1980 1990 2000<br />
World total ........................... 724147 1012084 1354357 1560860 1806 809 2422293 3208028<br />
More developed regions ............. 448929 572730 702876 767302 834401 969226 1092470<br />
Less developed regions .............. 275218 439354 651481 793558 972408 1453067 2115558<br />
Africa •••••• 00 •••• '0' 00 00 •••• 0 •• 31818 49506 80373 103032 132951 219202 345757<br />
Eastern Africa .................<br />
British Indian Ocean Territory ..<br />
3403 5821 10675 15109 21303 40345 70535<br />
Burundi ••••••• 00 •••••••••••<br />
Bujumbura •••••• 00 ••••••••<br />
54 64 74 83 98 159<br />
159<br />
301<br />
301<br />
Comoros .................... 6 11 21 29 40 72 109<br />
Djibouti ••••••• 00 •••••••••••<br />
Djibouti ..................<br />
Ethiopia ••••••• to' to, •••••••<br />
Addis Ababa 00 ••••••••••••<br />
Asmara ...................<br />
30<br />
761<br />
200<br />
40<br />
1284<br />
385<br />
105<br />
59<br />
2315<br />
784<br />
226<br />
73<br />
3273<br />
1162<br />
318<br />
88<br />
4562<br />
1668<br />
439<br />
123<br />
123<br />
8555<br />
3243<br />
822<br />
158<br />
158<br />
15 140<br />
5600<br />
1439<br />
Kenya ••••••• 00 •••••••••••••<br />
Mombasa ••••• 00 00 ••••••••<br />
Nairobi ...................<br />
336<br />
139<br />
597<br />
162<br />
238<br />
1145<br />
256<br />
550<br />
1592<br />
320<br />
862<br />
2223<br />
396<br />
1275<br />
4314<br />
658<br />
2628<br />
8125<br />
1193<br />
4869<br />
Madagascar ................. 338 569 977 1290 1718 3100 5595<br />
Tananarive ................ 180 249 373 482 625 1076 1880<br />
Malawi ...................... 107 152 407 965 1874 4273 6489<br />
Blantyre-Limbe ............ 148 223 352 783 1200<br />
Mauritius ................... 138 220 346 425 506 678 846<br />
Port-Louis ................. 111 136 142 153 186 231<br />
Mozambique ................ 136 242 468 652 901 1720 3199<br />
Lourenco Marques ......... 182 375 539 750 1438 2619<br />
Reunion •••••••••••••••• to •• 57 111 196 248 301 408 512<br />
Saint-Denis ................ 121 148 208 265<br />
Rw<strong>and</strong>a .................... 39 66 117 154 209 397 769<br />
Kigali .................... 156<br />
Seychelles ................... 10 11 14 16 18 26 39<br />
Somalia ..................... 232 385 645 839 1 101 1871 3022<br />
Merca .................... 118 190 307<br />
Mogadiscio ................ 190 273 377 681 1 101<br />
Southern Rhodesia ........... 242 446 898 1240 1 721 3254 5781<br />
Bulawayo ................. 154 265 331 422 717 1233<br />
Salisbury ................. 176 403 594 863 1 718 3010<br />
Ug<strong>and</strong>a ..................... 204 396 783 1112 1577 3092 5685<br />
Kampala .•................ 152 357 553 813 1663 3015<br />
United Republic <strong>of</strong> Tanzania ... 285 485 920 1414 2131 4501 8505<br />
Dar es Salaam ............. 164 375 666 1075 2480 4645<br />
zambia 428 •••••• •• • ••• • •••• 0 ••• 742 1290 1704 2235 3802 6260<br />
Chingola .................. 115 178 233 392 642<br />
Kitwe .................... 222 342 445 740 1198<br />
Luanshya ................. 102 124 132 174 276<br />
Lusaka ................... 299 538 791 1524 2513<br />
Mufulira .................. 116 146 162 224 355<br />
Ndola .................... 177 271 351 581 944<br />
Middle Africa ................. 3827 5751 10176 13437 17598 29130 45235<br />
Angola ..................... 301 493 848 1130 1508 2656 4508<br />
Lu<strong>and</strong>a ................... 134 216 465 695 959 1755 2934<br />
Central African Empire ....... 183 301 502 644 819 1299 1941<br />
Bangui .................... 120 187 236 297 469 697<br />
Chad ....................... 103 207 414 578 796 1418 2312<br />
Ndjamena ................. 155 222 313 582 950<br />
Congo ...................... 255 320 415 481 571 858 1347<br />
Brazzaville ................ 216 247 278 294 322 428 652<br />
Dolisie .................. - 138<br />
Pointe-Noire .............. 114 154 204 347 556<br />
125
Major area, region. country<strong>and</strong> city<br />
Argentina (continued)<br />
La Plata (Greater La Plata) •.<br />
Mar del Plata .<br />
Mendoza (Greater Mendoza) •<br />
Parana .<br />
Posadas ..<br />
Rosario (Greater Rosario) ..<br />
Salta .<br />
San Fern<strong>and</strong>o .............•<br />
San Juan (Greater San Juan) .<br />
Santa Fe .<br />
Santiago del Estero .<br />
Tucuman (Greater Tucuman)<br />
Chile ..<br />
Ant<strong>of</strong>agasta .<br />
Concepci6n ..<br />
Santiago .<br />
Talcahuano .<br />
Temuco .<br />
Valparaiso .<br />
Vifia del Mar ..........•...<br />
Falkl<strong>and</strong> Isl<strong>and</strong>s (Malvinas) .. ,<br />
Uruguay.: .<br />
Montevideo .<br />
Tropical South America .<br />
Bolivia .<br />
Cochabamba .<br />
La Paz ..<br />
Oruro .<br />
Santa Cruz .<br />
Brazil , , .<br />
Aracaju .<br />
Bauru .<br />
Belem .<br />
Belo Horizonte ..........•.<br />
Brasilia ..<br />
Campina Gr<strong>and</strong>e .<br />
Campinas ..<br />
Campo Gr<strong>and</strong>e .<br />
Campos .<br />
Caruaru .<br />
Caxias do SuI ..<br />
Curitiba , , ..<br />
Feira de Santana .<br />
Florianopolis , .<br />
Fortaleza , .<br />
Goil1nia .<br />
Govemador Valadares .<br />
Joao Pessoa .<br />
Juiz de Fora .<br />
Jundial ' .<br />
Londrina .<br />
Macei6 .<br />
Manaus .<br />
Natal .. , .<br />
Pelotas , .<br />
Petr6polis , ..<br />
Piracicaba ..<br />
Porto Alegre , .<br />
Recife ..<br />
Ribeirlio Preto ..<br />
Rio de Janeiro ,<br />
Rio Gr<strong>and</strong>e .<br />
'Salvador ..<br />
Santa Maria , ..<br />
Santos .<br />
Sao Jose de Rio Preto .. , .<br />
Slio Luis .<br />
1950<br />
301<br />
135<br />
247<br />
546<br />
120<br />
190<br />
230<br />
3558<br />
124<br />
1349<br />
228<br />
1 712<br />
991<br />
31 187<br />
614<br />
297<br />
19064<br />
239<br />
374<br />
103<br />
141<br />
263<br />
104<br />
113<br />
100<br />
436<br />
660<br />
2937<br />
401<br />
244<br />
TABLE 48. (continued)<br />
(Thous<strong>and</strong>s)<br />
1960<br />
379<br />
211<br />
356<br />
III<br />
677<br />
121<br />
113<br />
158<br />
234<br />
114<br />
310<br />
5145<br />
152<br />
1950<br />
261<br />
118<br />
2102<br />
1 175<br />
53705<br />
908<br />
124<br />
426<br />
32 996<br />
114<br />
382<br />
740<br />
142<br />
117<br />
181<br />
358<br />
487<br />
131<br />
138<br />
126<br />
155<br />
156<br />
156<br />
122<br />
792<br />
1045<br />
117<br />
4472<br />
661<br />
367<br />
126<br />
130<br />
1970<br />
485<br />
300<br />
486<br />
130<br />
818<br />
178<br />
144<br />
215<br />
279<br />
143<br />
368<br />
7048<br />
132<br />
169<br />
2889<br />
157<br />
117<br />
263<br />
190<br />
2426<br />
1312<br />
87065<br />
1344<br />
187<br />
615<br />
121<br />
193<br />
53253<br />
186<br />
126<br />
616<br />
1543<br />
510<br />
169<br />
338<br />
135<br />
158<br />
105<br />
110<br />
914<br />
131<br />
122<br />
906<br />
371<br />
129<br />
209<br />
228<br />
149<br />
162<br />
254<br />
290<br />
261<br />
159<br />
122<br />
131<br />
1451<br />
1659<br />
200<br />
7074<br />
103<br />
1087<br />
127<br />
559<br />
112<br />
175<br />
1975<br />
547<br />
356<br />
566<br />
140<br />
112<br />
896<br />
214<br />
162<br />
250<br />
304<br />
159<br />
399<br />
8044<br />
158<br />
176<br />
3448<br />
211<br />
145<br />
259<br />
238<br />
2580<br />
1374<br />
108999<br />
1641<br />
231<br />
743<br />
142<br />
278<br />
66621<br />
237<br />
151<br />
781<br />
2225<br />
962<br />
203<br />
463<br />
195<br />
208<br />
133<br />
147<br />
1456<br />
190<br />
156<br />
1235<br />
622<br />
175<br />
257<br />
306<br />
202<br />
237<br />
325<br />
396<br />
338<br />
181<br />
138<br />
165<br />
1962<br />
2088<br />
262<br />
8885<br />
114<br />
1392<br />
]61<br />
689<br />
144<br />
206<br />
1980<br />
608<br />
412<br />
644<br />
150<br />
126<br />
971<br />
252<br />
179<br />
285<br />
328<br />
175<br />
430<br />
9116<br />
184<br />
182<br />
3977<br />
269<br />
174<br />
258<br />
287<br />
2741<br />
1439<br />
134507<br />
2030<br />
283<br />
893<br />
167<br />
385<br />
82172<br />
290<br />
176<br />
949<br />
2987<br />
1605<br />
236<br />
597<br />
263<br />
260<br />
162<br />
187<br />
2119<br />
259<br />
190<br />
1586<br />
946<br />
225<br />
306<br />
390<br />
260<br />
324<br />
398<br />
511<br />
417<br />
202<br />
153<br />
201<br />
2502<br />
2516<br />
326<br />
10653<br />
124<br />
1702<br />
196<br />
818<br />
178<br />
236<br />
1990<br />
726<br />
520<br />
794<br />
173<br />
156<br />
1122<br />
325<br />
216<br />
354<br />
381<br />
210<br />
495<br />
11390<br />
240<br />
206<br />
5036<br />
392<br />
236<br />
277<br />
392<br />
3084<br />
1574<br />
195563<br />
3139<br />
431<br />
1318<br />
244<br />
681<br />
119271<br />
423<br />
243<br />
1357<br />
4797<br />
3390<br />
323<br />
923<br />
432<br />
390<br />
235<br />
288<br />
3772<br />
429<br />
277<br />
2422<br />
1788<br />
349<br />
429<br />
595<br />
404<br />
541<br />
579<br />
791<br />
613<br />
263<br />
199<br />
291<br />
3775<br />
3535<br />
486<br />
14729<br />
157<br />
2443<br />
284<br />
1 139<br />
264<br />
317<br />
2000<br />
810<br />
590<br />
890<br />
196<br />
180<br />
1234<br />
372<br />
246<br />
402<br />
426<br />
238<br />
552<br />
13460<br />
290<br />
242<br />
5760<br />
480<br />
287<br />
320<br />
473<br />
3406<br />
1687<br />
267 123<br />
4830<br />
657<br />
1963<br />
373<br />
1062<br />
163027<br />
581<br />
333<br />
1825<br />
6471<br />
4853<br />
440<br />
1269<br />
608<br />
539<br />
326<br />
402<br />
5212<br />
605<br />
384<br />
3270<br />
2530<br />
487<br />
585<br />
821<br />
563<br />
761<br />
791<br />
1089<br />
839<br />
355<br />
270<br />
401<br />
5049<br />
4666<br />
669<br />
18961<br />
213<br />
3258<br />
393<br />
1527<br />
366<br />
431
TABLE 48. (continued)<br />
(Thous<strong>and</strong>s)<br />
Major area, region. COWltr)! <strong>and</strong> ell)! 1950 1960 1970 1975 1980 1990 2000<br />
Brazil (continued)<br />
Sao Paulo .......•.......•. 2483 4451 8027 10740 13541 19892 25796<br />
Sorocaba ..............••.. 110 172 214 258 367 504<br />
Taubate ................... 103 129 156 224 311<br />
Teresina .................. 100 193 267 348 547 761<br />
Uberaba ••••••••••• 0.0 •••• 113 140 168 239 330<br />
Uberl<strong>and</strong>ia ................ 114 144 175 254 351<br />
Vit6ria •••••••••••••• 0 •••• 128 158 188 265 365<br />
Volta Redonda ............. 125 151 177 246 338<br />
Colombia ................... 4334 7665 13209 16946 21212 31102 41779<br />
Armenia .................. 134 194 211 232 292 385<br />
Barrancabermeja ........... 115 152 195 300 410<br />
Barranquilla ............... 307 473 767 982 1221 1775 2336<br />
Bello ..................... 103 184 225 270 380 508<br />
Bogota ................... 633 1309 2776 4017 5493 8892 11663<br />
Bucaramanga .............. 130 223 366 457 558 797 1059<br />
Buenaventura .•........•... 127 154 183 257 345<br />
Cali ...................... 288 529 954 1260 1606 2402 3 165<br />
Cartagena ................. 129 206 319 389 465 648 859<br />
Cienaga ...............•.•• 177 249 335 541 741<br />
CUcuta .................... 156 246 305 371 529 707<br />
Ibague .................... 145 200 229 261 344 456<br />
ltagUf .................... 200 229 261 344 456<br />
Manizales ••••••••••• 0 ••••• 131 199 251 260 274 329 427<br />
Medellin ................. , 469 835 1474 1929 2439 3601 4703<br />
Monteria .................. 109 197 213 233 291 383<br />
Neiva ..................... 116 139 165 229 308<br />
Palmira ................... 123 164 180 199 252 333<br />
Pasto ..................... 105 137 155 175 229 305<br />
Pereira ................... 141 204 255 268 286 347 452<br />
Popayan .................. 121 141 162 218 291<br />
Santa Marta ........ " ..... 121 131 144 181 240<br />
Tunja ..................... 110 153 152 155 179 234<br />
Valledupar ................ 190 242 300 439 592<br />
Ecuador .................... 911 1490 2384 2971 3707 5735 8564<br />
Cuenca ................... 116 146 232 350<br />
Guayaquil ................. 258 461 730 892 1093 1638 2370<br />
Quito ..................... 210 330 526 658 821 1264 1845<br />
French Guiana ............... 13 21 34 41 50 70 93<br />
Guyana ..................... 126 148 165 173 193 257 376<br />
Georgetown ............... 126 148 165 173 193 257 376<br />
Paraguay .................... 474 631 853 1003 1205 1800 2708<br />
Ascunci6n ................ 209 280 379 447 529 758 1112<br />
Peru ....................... 2811 4625 7605 9619 11942 17498 24132<br />
Arequipa .................. 131 271 393 533 881 1232<br />
Chiclayo .................. 172 235 305 479 669<br />
Chimbote ................. 138 217 314 564 807<br />
Cuzco .................... 131 125 125 126 128 149 200<br />
Huancayo ..... ,........... 116 159 207 327 460<br />
Iquitos .................... 102 137 176 274 386<br />
Lima-Callao ............... 1091 1757 2934 3790 4682 6762 8930<br />
Piura ..................... 108 177 267 505 732<br />
Trujillo ................... 213 318 444 760 1073<br />
Suriname .................... 101 137 170 189 220 327 489<br />
Paramaribo ................ 116 167<br />
Venezuela .................. 2739 5084 8048 9795 11776 16364 21125<br />
Barquisimeto .............. 106 199 320 399 480 671 862<br />
Cabimas .................. 117 130 143 181 232<br />
Caracas ................... 702 1335 2111 2598 3093 4198 5209<br />
Ciudad Bolivar ............. 101 124 149 210 275<br />
Cumana ................... 116 146 178 255 334<br />
Maiqueta ................. 118 144 172 239 311<br />
Maracaibo ................. 239 423 636 764 895 1200 1515<br />
Maracay .................. 134 244 322 407 604 787<br />
San Crist6bal .............. 148 178 209 285 369<br />
San Feliz de Guayana ......• 127 234 387 804 1 112<br />
Valencia .................. 164 344 492 662 1059 1387<br />
131
TABLE 48. (continued)<br />
(Thous<strong>and</strong>s)<br />
Major, area, region, country<strong>and</strong> city 1950 1960 1970 1975 1980 1990 2000<br />
Northern America ............•••• 106019 133281 159493 170501 183281 212393 239199<br />
Bermuda .........•........•.•• 37 44 52 56 60 68 76<br />
Canada .......................<br />
Calgary .....................<br />
8355<br />
133<br />
12340<br />
264<br />
16194<br />
391<br />
17789<br />
472<br />
19695<br />
523<br />
23727<br />
602<br />
27292<br />
677<br />
Edmonton ...................<br />
Halifax ............... '......<br />
164<br />
131<br />
320<br />
180<br />
480<br />
219<br />
586<br />
243<br />
656<br />
253<br />
762<br />
270<br />
856<br />
303<br />
Hamilton •••<br />
0 ••••••••••••••• 264<br />
384 492 540 555 581 642<br />
Kitchener ••••• '0' ••••••••••• 149 221 258 279 313 353<br />
London ..................... 126 177 271 370 452 589 679<br />
Montreal .................•.. 1349 2043 2701 3005 3115 3251 3496<br />
Ottawa .................•.••. 284 417 585 704 779 892 996<br />
Quebec ................•.... 269 351 470 540 577 632 703<br />
Regina ................•..... 109 140 148 149 153 171<br />
St. Catherines ................ 205 260 302 317 329 367 418<br />
Saint John ................... 108 115 116 120 135<br />
St. John's .................... 109 117 119 124 140<br />
Saskatoon ................... 102 125 135 137 143 162<br />
Sudbury ••••••• 00 ••••••••••• 109 122 125 123 123 138<br />
Thunder Bay ................. 111 119 121 126 143<br />
Toronto ..................... 1073 1755 2551 3065 3379 3804 4143<br />
Vancouver .................. 621 215 1051 1260 1388 1572 1738<br />
Victoria ..................... 149 183 192 191 193 215<br />
Windsor ..................... 162 192 251 303 337 390 442<br />
Winnipeg ................... 346 466 538 564 560 561 615<br />
Greenl<strong>and</strong> ..................... 18 25 34 39 43 50 58<br />
St. Pierre <strong>and</strong> Miquelon ......... 4 4 4 4 4 4 4<br />
United States <strong>of</strong> America ........ 97605 120868 143209 152613 163479 188544 211 769<br />
Akron (Ohio) ............... 369 501 618 673 707 794 881<br />
Albany /Schenectady/Troy<br />
(New York) .............. 416 497 552 571 576 615 679<br />
Albuquerque (New Mexico) ... 136 263 339 377 403 465 523<br />
Allentown (Pennsylvania-<br />
New Jersey) .........•..... 227 281 416 497 562 692 784<br />
Amarillo (Texas) ............ 150 144 138 132 132 148<br />
Ann Arbor (Michigan) ....... 127 205 255 299 387 446<br />
Appleton (Wisconsin) ......... 151 246 358 605 731<br />
Atlanta (Georgia) ............ 513 845 1344 1661 1928 2431 2714<br />
Atlantic City (New Jersey) .... 106 136 152 157 159 173 195<br />
Augusta (Georgia-South<br />
Carolina) .................. 135 170 187 199 228 259<br />
Aurora/Elgin (Illinois) ........<br />
Austin (Texas) •••••••• 0 •••••<br />
Bakersfield (California) .......<br />
Baltimore (Maryl<strong>and</strong>) .........<br />
Baton Rouge (Louisiana) ......<br />
Beaumont (Texas) ...........<br />
Biloxi/Gulfport (Mississippi) ...<br />
Binghamton (New York) ......<br />
Birmingham (Alabama) .......<br />
Boston (Massachusetts) .......<br />
Bridgeport (Connecticut) ......<br />
Brockton (Massachusetts) .....<br />
Buffalo (New York) ..........<br />
Canton (Ohio) ..............<br />
Cedar Rapids (Iowa) .........<br />
Charleston (South Carolina) ...<br />
Charleston (West Virginia) ....<br />
Charlotte (North Carolina) ....<br />
Chattanooga (Tennessee-<br />
Georgia) ..................<br />
137<br />
112<br />
1168<br />
140<br />
144<br />
447<br />
2238<br />
240<br />
900<br />
175<br />
121<br />
132<br />
142<br />
169<br />
125<br />
206<br />
156<br />
1549<br />
212<br />
130<br />
172<br />
577<br />
2634<br />
401<br />
122<br />
1149<br />
233<br />
115<br />
175<br />
184<br />
230<br />
224<br />
269<br />
303<br />
201<br />
1796<br />
285<br />
132<br />
139<br />
189<br />
644<br />
3015<br />
471<br />
170<br />
1233<br />
278<br />
151<br />
261<br />
178<br />
320<br />
254<br />
386<br />
360<br />
223<br />
1896<br />
323<br />
130<br />
179<br />
195<br />
667<br />
3163<br />
500<br />
197<br />
1252<br />
297<br />
169<br />
312<br />
172<br />
370<br />
265<br />
506<br />
406<br />
239<br />
1940<br />
351<br />
127<br />
214<br />
196<br />
674<br />
3216<br />
515<br />
218<br />
1243<br />
309<br />
182<br />
354<br />
164<br />
408<br />
270<br />
751<br />
500<br />
277<br />
2089<br />
414<br />
131<br />
286<br />
210<br />
719<br />
3426<br />
566<br />
263<br />
1294<br />
343<br />
213<br />
439<br />
165<br />
489<br />
293<br />
882<br />
570<br />
315<br />
2267<br />
468<br />
147<br />
334<br />
236<br />
792<br />
3680<br />
629<br />
301<br />
1404<br />
385<br />
243<br />
501<br />
184<br />
554<br />
328<br />
Chicago (Illinois-north-western<br />
Indiana) •• 0 ••••••••• ··0 ••• 4945 6508 7637 8 112 8314 8885 9411<br />
Cincinnatti (Ohio-Kentucky) ... 817 1084 1263 1337 1371 1485 1622<br />
Clevel<strong>and</strong> (Ohio) •••••••••• o' 1393 1948 2227 2335 2374 2535 2737<br />
Colorado Springs (Colorado) .. III 236 337 440 651 765<br />
Columbia (South Carolina) .... 122 179 277 338 389 492 563<br />
Columbus (Ohio) ............ 441 676 901 1021 1 105 1283 1424<br />
Columbus (Georgia-Alabama) 119 173 238 274 301 360 409<br />
132
TABLE 48. (continued)<br />
(Thous<strong>and</strong>s)<br />
Major area, region, country <strong>and</strong> city 1950 1960 1970 1975 1980 1990 2000<br />
United States <strong>of</strong> America (continued)<br />
New Britain (Connecticut) •.•.. 110 150 171 188 224 257<br />
New Haven (Connecticut) .... 246 305 397 444 477 552 620<br />
New Orleans (Louisiana) 664 923 1094 1168 1206 1320 1447<br />
New York (New York-northeastern<br />
New Jersey) .......• 12340 15422 18443 19774 20383 21797 22 773<br />
Newport News/Hampton<br />
(Virginia) ................. 146 229 306 347 378 444 502<br />
Norfolk/Portsmouth (Virginia) . 388 556 763 876 960 1132 1262<br />
Norwalk (Connecticut) 121 138 150 179 205<br />
Ogden (Utah) ............... 134 170 188 200 231 262<br />
Oklahoma City .............. 278 470 662 770 853 1020 1143<br />
Omaha (Nebraska-Iowa) ..•... 312 427 561 631 680 788 881<br />
Orl<strong>and</strong>o (Florida) ...........• 221 350 433 503 641 732<br />
Oxnard/Ventura (California) .. , 289 688 1350 3279 4146<br />
Pensacola (Florida) .......... 140 191 218 238 283 323<br />
Peoria (Dlinois) ............. 155 199 282 330 366 443 504<br />
Philadelphia (Pennsylvania-<br />
New Jersey) .......•.....• 2938 3968 4571 4811 4899 5214 5564<br />
Phoenix (Arizona) ........... 221 607 990 1239 1453 1859 2090<br />
Pittsburgh (Pennsylvania) ..... 1540 1965 2095 2120 2096 2164 2326<br />
Port Arthur (Texas) .......... 126 132 132 130 136 153<br />
Portl<strong>and</strong> (Oregon-Washington) . 516 714 941 1059 1 142 1318 1459<br />
Portl<strong>and</strong> (Maine) .....•...••• 113 122 120 117 113 115 129<br />
Providence (Rhode Isl<strong>and</strong>) .... 585 722 906 995 1052 1186 1310<br />
Provo/Orem (Utah) .......... 120 157 192 262 307<br />
Pueblo (Colorado) ........... 112 117 117 115 121 136<br />
Racine (Wisconsin) .......... 105 134 148 159 184 210<br />
Raleigh (North Carolina) ...... 103 175 222 266 352 408<br />
Reading (Pennsylvania) ....... 155 174 191 195 196 210 235<br />
Richmond (Virginia) .......... 260 365 474 530 569 656 734<br />
Roanoke (Virginia) ..........• 107 136 179 202 218 255 291<br />
Rochester (New York) ........ 411 540 685 756 803 913 1013<br />
Rockford (Illinois) ........... 123 187 235 258 273 312 352<br />
Sacramento (California) ....... 216 496 725 858 964 1172 1314<br />
Saginaw (Michigan) .......... 106 142 168 179 186 207 234<br />
Salt Lake City (Utah) ........ 230 382 548 643 717 867 975<br />
San Antonio (Texas) ......... 454 702 880 966 1020 1 150 1270<br />
San Bernardino (California) ... 139 416 669 832 971 1240 1402<br />
San Diego (California) ........ 440 919 1371 1642 1857 2269 2520<br />
San Francisco/Oakl<strong>and</strong><br />
(California) ............... 2031 2660 3405 3778 4014 4511 4877<br />
San Jose (California) ......... 182 665 1 178 1537 1862 2477 2794<br />
Santa Barbara (California) ..... 150 200 248 345 404<br />
Savannah (Georgia) .......... 129 185 186 183 177 182 203<br />
Scranton (Pennsylvania) •••• 0' 235 230 231 228 221 227 252<br />
Seattle/Everett (Washington) .. 627 949 1416 696 19t9 2343 2601<br />
Shreveport (Louisiana) ....... 15t 228 266 283 291 321 360<br />
South Bend (Indiana-<br />
Michigan) ..•.....•••••• 0. 169 240 330 380 417 497 563<br />
Spokane (Washington) ........ 177 247 261 263 260 272 303<br />
Springfield (Illinois) .......... 122 137 143 145 158 178<br />
Springfield (Massachusetts-<br />
Connecticut) •• 0 •• 0 •••••••• 359 491 585 626 649 716 794<br />
Springfield (Missouri) ........ 107 138 154 166 194 221<br />
St. Louis (Missouri) .......... 1408 1822 2142 2278 2342 2536 2746<br />
St. Petersburg (Florida) ....... 118 357 567 700 814 1034 1171<br />
Stamford (Connecticut) ....... 119 182 210 221 226 248 280<br />
Stockton (California) ......... 113 155 183 195 201 224 253<br />
Syracuse (New York) ........ 267 364 428 454 469 515 574<br />
Tacoma (Washington) ........ 169 236 381 474 555 713 815<br />
Tampa (Florida) ............. 182 330 421 466 496 568 636<br />
Toledo (Ohio-Michigan) ...... 366 478 555 586 600 654 724<br />
Topeka (Kansas) ............. 131 150 157 161 176 199<br />
Trenton (New Jersey-<br />
Pennsylvania) .............. 190 265 312 332 343 379 424<br />
Tucson (Arizona) ............ 123 249 336 382 416 490 553<br />
Tulsa (Oklahoma) ........... 208 328 424 473 507 584 655<br />
Utica/Rome (New York) ..... 119 205 204 200 193 198 220<br />
134
TABLE 48. (continued)<br />
(Thous<strong>and</strong>s)<br />
Malor area, region, country <strong>and</strong> city 1950 1960 1970 1975 1980 1990 2000<br />
United States <strong>of</strong> America (continued)<br />
Waco (Texas) ••••••••• 0 ••••• 126 135 137 136 144 163<br />
Washington, D.C. (Maryl<strong>and</strong>-<br />
Virginia) ................. 1298 1985 2836 3323 3690 4383 4792<br />
Waterbury (Connecticut) ...... 132 ISS 178 187 192 211 238<br />
Waterloo (Iowa) ............. 112 128 134 137 151 171<br />
West Palm Beach (Florida) .... 191 330 426 513 683 786<br />
Wichita (Kansas) ............ 196 318 344 350 349 370 410<br />
Wilkes-Barre (Pennsylvania) ... 271 255 253 247 238 243 269<br />
Wilmington (Delaware-New<br />
Jersey) .................... 189 311 424 485 531 627 706<br />
Winston-Salem (North Carolina) 140 162 1-71 175 193 218<br />
Worcester (Massachusetts) ., .. 219 246 281 295 301 328 367<br />
York (Pennsylvania) ......... 110 141 156 167 193 220<br />
Youngstown/Warren (Ohio) .... 300 406 449 463 466 497 550<br />
East Asia ..................... " 112812 194734 265153 308943 359457 476462 622441<br />
China ........................ 61393 121716 166710 195355 230652 320393 443213<br />
Ahsinchu ................... 146 205 237 276 377 518<br />
Amoy (Hsia-Men) ............ 150 280 400 471 554 763 1037<br />
An King ................... 107 140 200 235 277 384 529<br />
Anshan ..................... 425 849 1050 1 168 1312 1694 2247<br />
Antung (Tantung) ............ 240 350 480 542 617 815 1099<br />
Anyang ..................... 120 160 230 278 336 478 659<br />
Changchun .................. 784 1016 1200 1305 1438 1813 2391<br />
Changsha ................... 618 726 825 879 955 1 186 1569<br />
Chankiang .................. 230 190 240 274 316 425 580<br />
Chefoo ..................... 180 150 220 269 327 470 649<br />
Chengchow ................. 502 816 1050 1 191 1358 1787 2377<br />
Chengchow (Kiangan) ........ 260 320 480 591 720 1035 1413<br />
Chengtu .................... 722 1134 1250 1312 1406 1713 2246<br />
Chenkiang .................. 190 210 270 304 345 457 621<br />
Chiao-tso .................... 112 200 300 360 431 606 831<br />
Chiayi ...................... 122 173 236 270 312 421 575<br />
Chihsi ....................... 116 220 330 403 489 701 962<br />
Chinchow ................... 260 350 600 800 1039 1612 2218<br />
Chingkiang (Chen-Chiang) .... 100 200 290 350 421 598 821<br />
Chingtehchen ................ 125 230 350 438 540 791 1088<br />
Chinhuangtao (Ch'in-huang-tao) 130 230 350 438 540 791 1088<br />
Chuchow ................... 180 250 284 325 435 594<br />
Chungking .................... 1573 2174 2400 2522 2702 3275 4247<br />
Foochow (Fu-Chou) .......... 515 628 680 707 753 914 1210<br />
Fouhsin .................... 140 280 400 471 554 763 1037<br />
Fushun ..................... 530 1003 1080 1121 1 190 1436 1884<br />
Haikow ..................... 114 350 480 549 630 843 1 137<br />
Hangchow .................. 644 816 960 1042 1147 1446 1914<br />
Hantan ..................... 167 330 480 576 688 965 1312<br />
Harbin (Ha-erh-pin) .......... 960 1575 1670 1720 1814 2163 2813<br />
Hengyang ................... 200 260 350 408 477 653 889<br />
H<strong>of</strong>ei ...................... 131 352 630 843 1097 1706 2347<br />
Hokang ..................... 210 300 360 431 606 831<br />
Hsiangtan ................... 130 230 350 438 540 791 1088<br />
Hsinhailien ................. 140 200 300 375 463 679 937<br />
Hsinhsiang .................. 120 180 270 331 404 582 801<br />
Huhehot (Huhohaote;<br />
Kewi'sue) .................. 122 349 530 653 797 1146 1562<br />
Hwainan .................... 242 408 600 727 876 1237 1678<br />
I-Chun ..................... 170 250 298 354 495 680<br />
Ipin ........................ 110 170 210 232 260 339 462<br />
Kaifeng .................... 300 340 480 562 658 901 1220<br />
Kalgan (Chang-chia-K'ou) 170 523 750 879 1030 1404 1888<br />
Kaoshiung ................... 261 448 803 1098 1456 2308 3 173<br />
Keelung ..................... 151 226 319 369 428 580 790<br />
Kiamusze (Chia-nue-ssu) ...... 160 250 350 408 477 653 889<br />
Kirin (Chileir) ............... 365 596 720 792 881 1 129 1505<br />
Kochiu ...................... 122 160 230 278 336 478 659<br />
Kunming ................... 600 920 1 100 1203 1332 1692 2236<br />
Kuang chou (Canton) ........ 1456 1956 2500 2826 3208 4174 5468<br />
Kweilin ..................... 110 150 220 269 327 470 649<br />
135
TABLE 48. (continued)<br />
(Thous<strong>and</strong>s)<br />
Majorarea,region,counlry <strong>and</strong> city 1950 1960 1970 1975 1980 1990 2000<br />
Japan (continued)<br />
Hachioji •• 1,.,1 •••••• II II II'<br />
Hakodate ..... II II. I" •••••••<br />
Hamamatsu •• II ••• II ••••••••<br />
Himeji .......•......•.•••...<br />
Hirakata II ••• II ••• 11.,1 II •••<br />
222<br />
103<br />
236<br />
183<br />
159<br />
132<br />
162<br />
228<br />
214<br />
239<br />
167<br />
224<br />
221<br />
241<br />
260<br />
187<br />
290<br />
216<br />
264<br />
277<br />
205<br />
411<br />
215<br />
303<br />
307<br />
235<br />
470<br />
231<br />
335<br />
337<br />
261<br />
Hiratsuka ....................... II ...... 103 116 126 146 163<br />
Hiroshima ................... 266 403 502 540 570 622 672<br />
Hitachi ..................................... 122 140 157 185 207<br />
Ibaraki ..................... 123 138 151 174 194<br />
Iwaki ...................•••• 137 130 121 118 116 117 127<br />
Kagoshima .................... 177 230 304 370 431 535 593<br />
Kamakura ................... 107 120 131 152 169<br />
Kanazawa ................... 180 224 250 272 290 322 353<br />
Kawagoe ...................• 109 119 138 154<br />
Kitakyushu .................. 935 1311 1593 1759 1891 2096 2228<br />
Kochi ....................... 112 136 179 207 232 276 306<br />
Kodaira ..................... 116 130 142 164 183<br />
K<strong>of</strong>u ••••••••••••••••• II •••• 103 117 136 148 158 177 196<br />
Koriyama ••• 1 .............. 1. 100 112 123 142 158<br />
Kumamoto ............. I ...... 195 274 345 385 419 476 520<br />
Kure ............. II ••••••••• 159 178 203 217 227 249 273<br />
Kurume ..................... 112 119 128 135 149 165<br />
Kushiro ....................• 131 162 192 219 266 297<br />
Kyoto ••••••••••• II ••• II •••• 1001 1 164 1298 1376 1432 1528 1620<br />
Machida ••••••••••••••• 1 •••• 113 143 160 175 202 224<br />
Maebashi .................... 107 121 131 139 155 171<br />
Matsuyama .................. 141 182 210 235 278 309<br />
Mitaka ...................... 154 199 245 324 367<br />
Miyazaki .................... 116 129 141 162 180<br />
Morioka .................... 104 143 173 202 251 282<br />
Muroran .................... 131 151 163 173 192 212<br />
Musashino ............. I ....... 119 137 142 147 157 172<br />
Nagano ..................... 134 168 200 257 291<br />
Nagasaki .................... 163 258 314 328 339 362 393<br />
Nagoya ••• 0 0 0 0 0 o' 0 0 0 0 ••••••• 956 1499 1847 2010 2135 2330 2464<br />
Naha ....................... 212 307 373 434 537 595<br />
Nara 00<br />
Neyagawa ................... 104 145 184 206 225 259 286<br />
Niigata 0 •••• 0 •••••• 0 ••• 00 •• 0 159 234 275 303 326 367 401<br />
Numazu ••• 0 •••••••••••••••• 137 186 236 328 375<br />
Odawara .................... 106 119 130 150 168<br />
Oita • 0 ••• 00 •• 0000 •• 00. 0 0 0 o' 133 170 206 270 307<br />
Okayama .................... 121 154 217 251 282 334 370<br />
Okazaki ..................... 103 116 126 146 163<br />
Omiya ...................... 114 170 204 235 289 323<br />
Omuta ...................... 107<br />
Osaka/Kobe ................. 3828 5749 7595 8649 9496 10686 11109<br />
Otaru ....................... 145 162 156 156 156 161 176<br />
Sagamihara .................. 110 154 195 219 239 274 303<br />
Sapporo ..................... 254 489 815 1016 1203 1512 1 655<br />
Sasebo ...................... 112 153 146 156 164 180 198<br />
Sendai ...................... 269 334 436 516 587 705 774<br />
Shimizu ..................... 123 182 210 235 278 309<br />
Shimonoseki ................. 124 159 190 214 235 272 301<br />
Shizuoka .................... 165 229 290 337 378 448 494<br />
Takamatsu 0 ••••• 0. 0 ••• 0 o. 000 112 118 168 237 312 450 516<br />
Takatsuki ••••••• 0 •• 00 ••••••• 103 144 182 204 223 256 283<br />
Tokushima ••••• 00 •• 0 ••• o' 0 o' 102 122 141 150 157 171 189<br />
Tokyo/Yokohama 000000. 00 •• 0 6736 10685 14865 17668 20045 23372 24172<br />
Toyama ..................... 106 126 151 169 185 213 236<br />
Toyohashi ................... 110 139 159 176 206 229<br />
Urawa ...................... 129 211 267 322 417 468<br />
Utsunomiya 0000 •••••• 0 •••• o' 111 133 186 227 265 330 369<br />
Wakayama •••••••••••••• 0 •• 0 117 174 252 284 311 357 393<br />
Yamagata .0' 0 ••• 0 •••••••••• 0 100 109 116 121 125 135 149<br />
Yao o' 0" 0 •• 000 •• 0 •• 0 ••• 0 o' 0 204 321 458 732 850<br />
Yokkaichi ................... 109 126 139 151 171 190<br />
0 ••••••• 00 191 219 290 336 375 443 488<br />
Yokosuka •••••••••<br />
••• 0 0 0000. 0" 0 o. o. 0 o' 111 141 158 173 199 221<br />
137
TABLE 48. (continued)<br />
(Thous<strong>and</strong>s)<br />
Major area, region, country (J1Jd city 19'0 1960 1970 197' 1980 1990 2000<br />
Other East Asia ................ 9442 14306 24057 30164 36835 51401 65100<br />
Democratic People's Republic <strong>of</strong><br />
Korea ....................<br />
Chongjin ..................<br />
Haeju ....................<br />
3024<br />
128<br />
4231<br />
177<br />
6957<br />
300<br />
130<br />
8730<br />
387<br />
168<br />
10700<br />
490<br />
213<br />
15217<br />
734<br />
322<br />
20006<br />
966<br />
430<br />
Harnhung ••••••••••<br />
0 •••••• 203<br />
281 475 613 775 1156 1509<br />
Kaesong .................. 158 205 259 391 520<br />
Kimchaek ................. 128 177 300 387 490 734 966<br />
Narnpo ................... 147 190 241 363 484<br />
Pyongyang ••••••<br />
0 ••••••••• 540<br />
635 911 1084 1283 1755 2240<br />
Sinuiju •••••.•••.••••••• 0' 110 187 241 305 460 610<br />
Wonsan .................. 104 144 243 314 398 597 789<br />
Hong Kong ................. 1747 2739 3534 3800 4085 4703 5210<br />
Hong Kong ............... 1747 2739 3534 3800 4085 4703 5210<br />
Macao •••••••• 0 ••• 0 •• 0 ••• 0. 182 161 241 265 287 330 368<br />
Macao ••••••••• 0 ••• 0 ••• 0. 182 161 241 265 287 330 368<br />
Mongolia •• 0.0 •••• 0 •• 0 •• 0 ••• 142 332 559 687 842 1236 1709<br />
Ulan Bator •••••••••<br />
298 362 440 644 883<br />
0 ••••• 176<br />
Republic <strong>of</strong> Korea ...........<br />
Cheongju (Chungju) ........<br />
Chonchu (Jeonju) ...........<br />
Chuncheon .. ".............<br />
Gunsan ...................<br />
Inchon (lncheon) .........<br />
Jeju ......................<br />
4347<br />
283<br />
6843<br />
182<br />
394<br />
12766<br />
140<br />
255<br />
119<br />
110<br />
628<br />
103<br />
16682<br />
191<br />
310<br />
140<br />
153<br />
794<br />
134<br />
20921<br />
249<br />
370<br />
163<br />
203<br />
978<br />
169<br />
29915<br />
381<br />
502<br />
216<br />
318<br />
1372<br />
246<br />
37807<br />
492<br />
630<br />
273<br />
413<br />
1708<br />
318<br />
Jinju (Jingu) ............... 119 153 193 280 360<br />
Kwangchu (Gwangju) .......<br />
Masan ....................<br />
Mokpo ••• 0 •••• 0.0 •• 0 ••• 0.<br />
191<br />
118<br />
110<br />
307<br />
156<br />
128<br />
488<br />
185<br />
173<br />
603<br />
361<br />
193<br />
730<br />
629<br />
215<br />
1003<br />
1365<br />
268<br />
1250<br />
1851<br />
335<br />
Pusan (Busan) ............. 1040 1 154 1816 2429 3122 4580 5645<br />
Seoul ••• 0 ••• 0 ••• 0 ••• 0. ,0' 1 113 2362 5322 6837 8490 11845 14246<br />
Suweon ....•.............. 168 222 283 419 537<br />
Taegu (Daegu) ............ 389 659 1050 1303 1579 2163 2660<br />
Taejon (Daejeon) ......... 144 224 401 503 616 862 1080<br />
Ulsan ..................... 154 248 370 666 880<br />
Weonju ..................• 110 120 132 164 206<br />
Yeosu •••••••••••• 0 •• 0 •• 0 • 111 130 151 200 254<br />
South Asia ...................... 104883 146902 217290 265568 329760 515685 790685<br />
Eastern South Asia ............. 25694 38014 56640 69234 85863 134525 207672<br />
Brunei 12 39 82 103 122 158 188<br />
B<strong>and</strong>ar Seri Begawan ••• 0'. 101 123<br />
Burma ...................... 2965 4287 6337 7745 9560 14804 22442<br />
Bassein ••• 0 ••••••• 0 •• '0 ••• 120 137 160 229 343<br />
Kanbe .................... 257 254 258 262 277 350 508<br />
M<strong>and</strong>alay ................. 170 251 380 472 586 899 1336<br />
Moulmein ................. 124 163 188 220 317 473<br />
Rangoon .................. 678 978 1453 1784 2185 3273 4747<br />
Thingangyu ................ 108 184 293 617 983<br />
Democratic Kampuchea ....... 425 574 826 1025 1309 2213 3749<br />
Pnhom-Penh ............... 372 419 357 262 200 200 200<br />
East Timor .................. 43 50 62 70 82 124 205<br />
DiH •• 0 ••••••• 0.0 ••••••• 0 • 124 205<br />
Indonesia .................... 9362 13522 20395 25079 31293 49477 76612<br />
Balikpapan ................ 134 168 211 334 516<br />
B<strong>and</strong>jarmasin .............. 156 204 280 329 391 575 869<br />
B<strong>and</strong>ung ..................<br />
Bogor •••••••••••• 0 •••••••<br />
Djambi ...................<br />
Jakarta ••••••••••••• 000.00<br />
Jogjakarta ., ...............<br />
764<br />
117<br />
1725<br />
282<br />
936<br />
148<br />
107<br />
2708<br />
306<br />
1204<br />
196<br />
156<br />
4450<br />
348<br />
1370<br />
226<br />
190<br />
5718<br />
373<br />
1583<br />
265<br />
232<br />
7263<br />
411<br />
2227<br />
384<br />
354<br />
11367<br />
551<br />
3265<br />
583<br />
542<br />
16591<br />
818<br />
Kediri ••• 000000.0.000.0000<br />
Madiun ...................<br />
Magelang 000000.0000000000<br />
Makasar 0.0000000000000000<br />
Malong ...................<br />
Medan ....................<br />
Menado ...................<br />
139<br />
110<br />
333<br />
268<br />
347<br />
155<br />
121<br />
374<br />
329<br />
457<br />
124<br />
181<br />
138<br />
112<br />
440<br />
423<br />
631<br />
169<br />
197<br />
149<br />
122<br />
479<br />
482<br />
744<br />
198<br />
220<br />
165<br />
137<br />
536<br />
558<br />
886<br />
234<br />
301<br />
224<br />
190<br />
729<br />
794<br />
1300<br />
345<br />
452<br />
338<br />
289<br />
1079<br />
1 185<br />
1936<br />
526<br />
138
TABLE 48. (continued)<br />
(Thous<strong>and</strong>s)<br />
Major area, region, country <strong>and</strong> cllY 1950 1960 1970 1975 1980 1990 2000<br />
Indonesia (continued)<br />
Padang ...................<br />
Pakalongan ••• 0 •••••••••••<br />
Pakan Barn ................<br />
Palembang ................<br />
Pematang Siantar ..........<br />
Pontianak .................<br />
Samarinda .................<br />
Semarang .................<br />
Surabaja ..................<br />
Surakarta .................<br />
Tegal .....................<br />
Teluk Betung ..............<br />
Tjirebon ..................<br />
101<br />
376<br />
100<br />
378<br />
613<br />
321<br />
138<br />
136<br />
100<br />
458<br />
112<br />
142<br />
482<br />
942<br />
358<br />
126<br />
154<br />
194<br />
114<br />
136<br />
585<br />
131<br />
214<br />
130<br />
645<br />
1517<br />
420<br />
106<br />
195<br />
181<br />
233<br />
121<br />
200<br />
663<br />
142<br />
263<br />
187<br />
748<br />
1931<br />
456<br />
119<br />
243<br />
197<br />
281<br />
134<br />
285<br />
765<br />
159<br />
326<br />
263<br />
880<br />
2440<br />
509<br />
136<br />
304<br />
220<br />
423<br />
181<br />
526<br />
1080<br />
218<br />
504<br />
476<br />
1269<br />
3823<br />
691<br />
192<br />
477<br />
301<br />
644<br />
273<br />
831<br />
1602<br />
330<br />
770<br />
750<br />
1886<br />
5676<br />
1024<br />
292<br />
731<br />
453<br />
Lao People's Democratic Republic 141 189 285 376 500 871 1439<br />
Vientiane .................. 128 131 158 194 242 393 638<br />
Malaysia .................... 1260 1994 2823 3371 4110 6244 9172<br />
Georgetown ............... 202 240 272 291 314 408 580<br />
Ipoh ...................... 146 248 325 413 656 963<br />
lahore Bharu .............. 136 173 215 333 491<br />
Klang .................... 114 134 158 228 334<br />
Kuala Lumpur ............. 209 370 649 862 1106 1764 2552<br />
Philippines .................. 5695 8350 12387 15244 18902 29198 43988<br />
Angeles (City) ............. 138 187 246 411 625<br />
Bacolod (City) ............. 108 122 192 244 307 482 724<br />
Basilan (City) ............. 120 156 147 144 147 179 260<br />
Batangas (City) ............ 112 130 153 222 332<br />
Butuan (City) .............. 135 175 224 361 547<br />
Cadiz (City) ............... 127 153 184 275 412<br />
Cagayan de Oro (City) ...... 132 183 247 425 650<br />
Cebu (City) ............... 185 256 356 425 507 745 1096<br />
Davao (City) ............... 128 232 404 539 703 1 152 1720<br />
Iligan (City) ............... 108 146 192 324 496<br />
Iloilo (City) ............ : .. 120 154 215 257 307 455 675<br />
Manila .................... 15911 2288 3591 4549 5664 8630 12313<br />
Olongapo (City) ............ 111 173 256 493 770<br />
San Pablo (City) ........... 108 134 165 255 385<br />
Tarlac .................... 100 139 165 197 291 435<br />
Zamboanga (City) .......... 111 134 205 257 318 492 736<br />
Singapore ................... 815 1268 1562 1665 1805 2123 2453<br />
Singapore ................. 1115 1268 1562 1665 1805 2123 2453<br />
Thail<strong>and</strong> .................... 2096 3302 4725 5718 7110 11650 19850<br />
Bangkok-Thonburi .......... 1414 2151 3205 3958 4870 7499 11936<br />
Viet Nam .................. 2880 4439 7156 8838 11070 17663 27574<br />
Da-Nhang (Danang) ....... 105 456 921 1635 3864 6269<br />
Haiphong ................. 112 184 316 405 500 759 1158<br />
Hanoi .................... 264 417 696 877 1067 1582 2374<br />
Ho Chi Minh Ville .......... 1114 1409 1879 2119 2355 3 103 4502<br />
Hue ...................... 104 220 312 418 702 1094<br />
Nam Dinh ................ 126 156 188 277 427<br />
Middle South Asia .............. 74096 99794 143883 173993 214900 335677 517642<br />
Afghanistan ................. 676 1098 1873 2511 3383 6051 10262<br />
Baghlan ................... 107 124 148 230 381<br />
Herat ..................... 106 120 141 216 357<br />
Kabul .................... 210 359 525 541 586 801 1270<br />
K<strong>and</strong>ahar (Qu<strong>and</strong>ahar) ..... 132 165 209 350 584<br />
Tagab .................... 105 114 129 188 308<br />
Bangladesh .................. 1786 2649 5150 6838 9531 18192 32095<br />
Chittagong ................ 286 368 722 971 1293 2322 3946<br />
Dacca .................... 325 520 1289 1947 2841 5680 9725<br />
Khulna ................... 123 323 494 730 1497 2629<br />
Mymensingh ............... 134 206 305 631 1 125<br />
Narayanganj ............... 158 244 284 338 532 901<br />
Rajshashi .............. " .. 109 144 190 343 600<br />
Bhutan ..................... 15 21 32 40 52 91 167<br />
139
TABLB 48. (continued)<br />
(Thous<strong>and</strong>s)<br />
Majorarea,region,country <strong>and</strong> city 19$0 1960 1970 197$ 1980 1990 2000<br />
India ................... : ... 59247 76575 106994 127177 154524 235837 360688<br />
Agartala ........................... 114 136 202 308<br />
Agra ........................... 368 499 624 698 794 1087 1592<br />
Ahmedabad ............. I" , ••• 859 1181 1695 2040 2451 3572 5196<br />
Ahmednagar ............... i04 118 146 163 186 258 386<br />
Ajmer .................... 195 229 262 281 309 409 604<br />
Akola ..................... 114 164 198 240 360 545<br />
Allahabad ................. 327 423 506 553 617 828 1213<br />
Alleppey .................. 115 137 158 169 186 247 368<br />
Allgarh ........................ 139 182 247 290 343 496 744<br />
Alwar ........................ I· .......... 116 139 206 314<br />
Ambala Cantt. . ............ 112 105 103 102 106 131 195<br />
Amravati (Amroti, Amaravati) 101 135 189 224 267 391 589<br />
Amritsar .................. 332 394 453 486 535 706 1033<br />
Asansol ................... 162 235 281 337 498 749<br />
Aurangabad .......................... 159 208 268 433 664<br />
Bangalore ........................... 764 1 173 1615 1892 2226 3 161 4583<br />
Bareilly ...............•.•. 204 268 322 352 394 531 784<br />
Bausawal............•..•.. 103 122 146 217 330<br />
Belgaum .............................. 116 145 208 251 303 451 680<br />
Bellary ............................... 122 148 179 270 411<br />
Berhampur ................ 114 136 162 239 364<br />
Bhadravati ......................... 116 139 206 314<br />
Bhagalpur ................. 113 144 170 187 210 286 427<br />
Bhavnagar ..................... 136 174 222 252 290 408 609<br />
Bhopal .................... 212 370 487 630 1016 1537<br />
Bhubaneswar ...................... 116 139 206 314<br />
Bihar ..................... 116 139 206 314<br />
Bijapur ................................. 102 121 145 214 327<br />
Bikaner ................................. 115 148 204 241 287 419 631<br />
BiIaspur ................... 127 157 194 297 454<br />
Bokato Steel City ........... 104 124 148 219 333<br />
Bombay (Greater) .......... 2901 4060 5811 6975 8343 11 981 17056<br />
Burdwan .................. 106 140 161 188 268 404<br />
Burhanpur ........................... 103 122 146 217 330<br />
Calcutta ............................. 4446 5500 6911 7772 8822 11866 16678<br />
Calicut .................... 154 241 327 380 446 638 950<br />
Ch<strong>and</strong>igarh ................ 219 336 493 929 1452<br />
Cochin .................... 187 303 428 507 604 879 1306<br />
Coimbatore ................ 265 417 707 925 1189 1896 2834<br />
Cuddalore ................. 118 141 208 317<br />
Cuttack ................... 100 143 201 240 287 423 638<br />
Darbhanga ...................... 102 130 147 170 239 360<br />
Davanagere ....................... 117 139 166 246 373<br />
Dehra Adun ............... 143 156 200 229 266 377 565<br />
Delhi ......... , .................... 1390 2283 3531 4394 5414 8093 11683<br />
Dhanbad .................. 188 410 602 850 1525 2341<br />
Dhulia .................... 134 158 188 274 415<br />
Dindigul ..................... 125 146 173 252 381<br />
Durg Bhilainagar ........... 118 234 317 421 703 1077<br />
Durgapur ................. 101 131 183 218 260 382 576<br />
Eluru (Ellore) ............. 107 126 137 153 207 311<br />
Erode .................... 159 241 351 656 1029<br />
Faizabad-Ayodhya .......... 108 128 154 227 345<br />
Farrukhabad-Fategarh ...... 110 120 134 183 274<br />
Firozabad ................. 131 154 182 265 401<br />
Gauhati ..................<br />
Gaya •••••••••••••••••••• 0<br />
Ghaziabad ................<br />
Gorakhpur ................<br />
Gulbarga ..... , ........... ,<br />
Guntur (Guntar) ••••••• 0 ••<br />
Gwalior ..................<br />
Hubli-Dharwar .............<br />
Hyderabad •••••••••••••• 0.<br />
133<br />
130<br />
122<br />
238<br />
193<br />
1 122<br />
150<br />
177<br />
182<br />
296<br />
245<br />
1243<br />
190<br />
178<br />
122<br />
227<br />
141<br />
263<br />
397<br />
367<br />
1749<br />
268<br />
195<br />
145<br />
258<br />
172<br />
317<br />
462<br />
453<br />
2098<br />
367<br />
218<br />
173<br />
298<br />
210<br />
382<br />
542<br />
557<br />
2514<br />
639<br />
296<br />
256<br />
419<br />
317<br />
567<br />
775<br />
845<br />
3650<br />
988<br />
441<br />
389<br />
626<br />
482<br />
852<br />
1150<br />
1267<br />
5303<br />
Imphal •• 0.0 •• 0.0 •••••••• 0<br />
Indore ••••••••• 0 ••••• 0 •••<br />
Jabalpur ••••••••••••• 00 •••<br />
Jafpur ••••••••• 0 •••••••• 0. /<br />
306<br />
251<br />
285<br />
389<br />
358<br />
395<br />
546<br />
520<br />
616<br />
115<br />
651<br />
629<br />
775<br />
138<br />
779<br />
761<br />
966<br />
204<br />
1137<br />
1127<br />
1485<br />
311<br />
1684<br />
1674<br />
2212<br />
140
TABLE 48. (continued)<br />
(Thous<strong>and</strong>s)<br />
Malor area. region, country <strong>and</strong> city 1950 1960 1970 1975 1980 1990 2000<br />
Western South Asia ............. 5093 9094 16767 22341 28997 45483 65371<br />
Bahrain .....................<br />
Manama Town .............<br />
100 127 168 196 229<br />
112<br />
321<br />
149<br />
442<br />
206<br />
Democratic Yemen ...........<br />
Aden .....................<br />
Gaza Strip ..................<br />
170<br />
102<br />
100<br />
310<br />
189<br />
258<br />
461<br />
255<br />
411<br />
570<br />
301<br />
517<br />
712<br />
358<br />
638<br />
1125<br />
530<br />
935<br />
1739<br />
800<br />
1279<br />
Iraq ........................<br />
Arbil .....................<br />
Baghdad ...................<br />
Basra ....................<br />
Hilla .....................<br />
Kerbala ...................<br />
Kirkuk ...................<br />
Mosul ....................<br />
Najaf ....................<br />
Sulaimaniya (Sulaymaniyah) ..<br />
1819<br />
579<br />
116<br />
144<br />
2937<br />
1024<br />
205<br />
160<br />
204<br />
103<br />
5461<br />
148<br />
2510<br />
453<br />
171<br />
210<br />
335<br />
175<br />
116<br />
7272<br />
251<br />
3830<br />
680<br />
270<br />
120<br />
243<br />
435<br />
230<br />
164<br />
9414<br />
368<br />
5138<br />
903<br />
375<br />
136<br />
264<br />
514<br />
276<br />
209<br />
14525<br />
667<br />
8203<br />
1440<br />
638<br />
181<br />
329<br />
713<br />
392<br />
320<br />
20366<br />
964<br />
11125<br />
2006<br />
911<br />
251<br />
447<br />
978<br />
544<br />
453<br />
Jordan ......................<br />
Amman ...................<br />
Irbid .....................<br />
Zarra (Zarga) ..............<br />
Kuwait ......................<br />
Hawalli ...................<br />
Kuwait City ...............<br />
Salmuja ..................<br />
Lebanon ....................<br />
Beirut ....................<br />
Tripoli ...................<br />
Oman ......................<br />
Muscat ...................<br />
Qatar ......................<br />
Doha .....................<br />
Saudi Arabia ................<br />
Dammam .................<br />
Huful ....................<br />
Jeddah (Jidda) ..............<br />
Mecca ....................<br />
Medina ...................<br />
Riyadh •••••••••••••••••• 0<br />
Ta'if 0 ••••••••••••••••••••<br />
429<br />
90<br />
407<br />
238<br />
107<br />
9<br />
30<br />
776<br />
116<br />
216<br />
127<br />
724<br />
225<br />
201<br />
151<br />
824<br />
531<br />
138<br />
17<br />
43<br />
1777<br />
236<br />
283<br />
124<br />
268<br />
1 131<br />
394<br />
140<br />
581<br />
109<br />
224<br />
1527<br />
1 106<br />
183<br />
33<br />
63<br />
3767<br />
115<br />
504<br />
393<br />
199<br />
592<br />
184<br />
1423<br />
514<br />
104<br />
173<br />
909<br />
142<br />
301<br />
125<br />
2002<br />
1538<br />
212<br />
47<br />
77<br />
5261<br />
170<br />
133<br />
746<br />
472<br />
258<br />
888<br />
272<br />
1788<br />
655<br />
138<br />
213<br />
1271<br />
185<br />
404<br />
211<br />
2549<br />
2003<br />
240<br />
66<br />
93<br />
6967<br />
239<br />
179<br />
1044<br />
559<br />
325<br />
1259<br />
383<br />
2762<br />
1029<br />
230<br />
321<br />
2072<br />
284<br />
635<br />
445<br />
3864<br />
3116<br />
318<br />
130<br />
132<br />
132<br />
10897<br />
411<br />
291<br />
1772<br />
775<br />
488<br />
2164<br />
658<br />
4044<br />
1487<br />
343<br />
468<br />
3006<br />
408<br />
907<br />
675<br />
5296<br />
4183<br />
429<br />
248<br />
189<br />
180<br />
180<br />
15217<br />
585<br />
413<br />
2462<br />
1048<br />
675<br />
3005<br />
930<br />
Syrian Arab Republic ......... 1071 1677 2708 3393 4290 6776 10105<br />
Aleppo 00<br />
•••• 0.' 0 0 •••••• O. 299<br />
424 632 766 935 1405 2031<br />
Damascus .................<br />
Hama (Hamah) ............<br />
Homs (Hims) ..............<br />
Lattakia ..................<br />
389 583<br />
111<br />
136<br />
912<br />
137<br />
213<br />
124<br />
1132<br />
150<br />
264<br />
166<br />
1406<br />
170<br />
330<br />
221<br />
2156<br />
237<br />
513<br />
373<br />
3109<br />
346<br />
758<br />
563<br />
United Arab Emirates ........<br />
Dubai ....................<br />
23 48 109<br />
109<br />
145<br />
145<br />
187<br />
187<br />
286<br />
286<br />
398<br />
398<br />
Yemen ••••••••••• 0 0 0 0 •• 0 •••<br />
Sana (Sana'a) ..............<br />
69 151 347<br />
111<br />
529<br />
146<br />
793<br />
199<br />
1658<br />
380<br />
3051<br />
689<br />
0 ••• 0 ••• 0. 0.0 ••••••••••<br />
Eastern Europe ................<br />
222603<br />
36708<br />
266032<br />
46323<br />
318374<br />
54828<br />
343504<br />
59785<br />
369286<br />
65028<br />
423291<br />
75405<br />
476953<br />
85688<br />
Bulgaria ••••••• 0 •• 000 •• 0 •••• 1856 3033 4440 5148 5809 6900 7742<br />
Bourgas •• 0.000. 0.0 •••• 0. 0<br />
Plovdiv ••••• 00.0. 0 ••••• 0. 0<br />
Rousse ....................<br />
132 185<br />
103<br />
136<br />
252<br />
154<br />
154<br />
289<br />
184<br />
173<br />
328<br />
217<br />
210<br />
401<br />
277<br />
239<br />
452<br />
317<br />
S<strong>of</strong>ia 0 •••••••••••••••••• o.<br />
Stara Zagora •• 0. 0" 0" 0 •••<br />
Varna ••• 00 0 0 0 ••••••• 0000.<br />
550 710<br />
146<br />
886<br />
113<br />
230<br />
972<br />
144<br />
289<br />
1064<br />
177<br />
353<br />
1229<br />
241<br />
472<br />
1347<br />
280<br />
541<br />
Czechoslovakia o. 0" 0 ••••• 0"<br />
0 00 •••• 0 0 0 0 o. o'<br />
4 634<br />
195<br />
6410<br />
260<br />
7 910<br />
284<br />
8 749<br />
297<br />
9 590<br />
313<br />
11101<br />
352<br />
12502<br />
394<br />
Europe ••<br />
291<br />
Bratislava ••<br />
Bmo •• 0 ••••• 0 0 0" o' 0 0 0" 0<br />
319 336 347 363 402 448<br />
Kosice .........•.......... 142 183 229 317 371<br />
Ostrava ................... 199 245 278 297 320 368 413<br />
Plzen ..................... 120 138 148 154 162 183 207<br />
Prague 00 •• 0 0 •• 00000. 0 o. o. 1003 1067 1079 1092 1 121 1204 1311<br />
143
TABLE 48. (continued)<br />
(Thous<strong>and</strong>s)<br />
Major area, region, country <strong>and</strong> city 1950 1960 1970 1975 1980 1990 2000<br />
Denmark ...................<br />
Alborg ...................<br />
Arhus ....................<br />
Copenhagen ...............<br />
Odense ...................<br />
2904<br />
150<br />
1212<br />
113<br />
3375<br />
177<br />
1346<br />
129<br />
3929<br />
198<br />
1381<br />
137<br />
4128<br />
207<br />
1363<br />
139<br />
4297<br />
217<br />
1355<br />
143<br />
4574<br />
103<br />
235<br />
1360<br />
151<br />
4794<br />
109<br />
248<br />
1379<br />
159<br />
Faeroe Isl<strong>and</strong>s ............... 5 7 11 12 13 17 22<br />
Finl<strong>and</strong> .....................<br />
Helsinki ..................<br />
Tampere ,.................<br />
Turku ....................<br />
Icel<strong>and</strong> .....................<br />
Reykjavik .................<br />
Irel<strong>and</strong> .....................<br />
Cork .....................<br />
Dublin ...................<br />
1283<br />
364<br />
100<br />
101<br />
106<br />
1219<br />
112<br />
632<br />
1687<br />
465<br />
127<br />
123<br />
141<br />
1299<br />
115<br />
662<br />
2315<br />
620<br />
155<br />
145<br />
173<br />
1528<br />
133<br />
769<br />
2632<br />
709<br />
170<br />
156<br />
187<br />
1713<br />
146<br />
835<br />
2914<br />
800<br />
186<br />
169<br />
202<br />
104<br />
1905<br />
161<br />
910<br />
3346<br />
953<br />
215<br />
192<br />
232<br />
117<br />
2337<br />
198<br />
1083<br />
3600<br />
1020<br />
234<br />
209<br />
256<br />
130<br />
2783<br />
237<br />
1259<br />
Isle<strong>of</strong> Man .................. 29 26 31 32 33 38 43<br />
Norway .....................<br />
Bergen ...................<br />
Oslo .....................<br />
Trondheim ...............<br />
Sweden .....................<br />
Goteborg .................<br />
Helsingborg ...............<br />
Jonkdping .................<br />
Linkoping .................<br />
Malmo ...................<br />
Norrkoping ................<br />
Orebro ...................<br />
Stockholm ................<br />
Uppsala ..................<br />
Vasteras ..................<br />
United Kingdom .............<br />
Aberdeen .................<br />
Aldershot/<br />
Farnborough ............<br />
Barnsley ..................<br />
1051<br />
135<br />
492<br />
4618<br />
351<br />
190<br />
741<br />
42608<br />
214<br />
140<br />
192<br />
1 150<br />
149<br />
577<br />
5429<br />
398<br />
224<br />
805<br />
45034<br />
216<br />
155<br />
192<br />
1626<br />
175<br />
626<br />
111<br />
6525<br />
535<br />
100<br />
101<br />
372<br />
113<br />
112<br />
1094<br />
122<br />
113<br />
49091<br />
221<br />
208<br />
199<br />
1898<br />
189<br />
648<br />
122<br />
7015<br />
631<br />
124<br />
200<br />
145<br />
582<br />
138<br />
156<br />
1165<br />
178<br />
147<br />
50643<br />
222<br />
240<br />
201<br />
2165<br />
206<br />
682<br />
134<br />
7455<br />
674<br />
140<br />
325<br />
183<br />
779<br />
153<br />
192<br />
1145<br />
225<br />
170<br />
52245<br />
224<br />
271<br />
204<br />
2648<br />
246<br />
773<br />
163<br />
8135<br />
721<br />
164<br />
592<br />
243<br />
1 103<br />
172<br />
247<br />
1102<br />
299<br />
203<br />
55508<br />
232<br />
323<br />
213<br />
3039<br />
283<br />
865<br />
190<br />
8663<br />
754<br />
178<br />
689<br />
270<br />
1210<br />
185<br />
272<br />
1120<br />
331<br />
221<br />
58851<br />
246<br />
350<br />
226<br />
Birmingham ••••• 0 •••••••• 2527 2671 2809 2849 2887 2955 3003<br />
Blackburn/<br />
Accrington •• 0 •••••• o' o. 240 231 232 230 231 237 250<br />
Blackpool ................. 231 251 267 272 277 291 309<br />
Bournemouth/<br />
Poole ••••• 0 ••••••••••••<br />
Brighton/Worthing •• 0 ••••••<br />
Bristol ....................<br />
Burnley/Nelson ...........<br />
Cambridge o' 0 ••• 0" 0 ••••• 0<br />
Cardiff/Rhondda ...........<br />
Chatham/Rochester ........<br />
Chesterfield ................<br />
Coventry ..................<br />
Darlington/Auckl<strong>and</strong> .......<br />
Derby •• 0.' 0 0" 0" 0' •• 0" 0<br />
Doncaster .................<br />
Dundee ...................<br />
Edinburgh •••• 0.0 •• 0 0 0 0.0.<br />
Exeter ....................<br />
Glasgow ..................<br />
Gloucester 0 ••• 0 ••• 0 ••• o' 0 0<br />
Greenock 0.' 00 ••• 0 ••• 0.0 ,.,<br />
Grimsby 0 ••••• 0 ••• 0 ••• 0 •••<br />
Ipswich ...................<br />
Kingston-upon-Hull .........<br />
Lancaster/Morecambe ......<br />
Leeds/Bradford •••• 0 •••• 0"<br />
Leicester ..................<br />
Liverpool .0' 0 0" 0 o. 0 ••• 0 o.<br />
254<br />
366<br />
603<br />
184<br />
120<br />
597<br />
181<br />
184<br />
525<br />
148<br />
362<br />
175<br />
197<br />
593<br />
133<br />
1898<br />
104<br />
138<br />
108<br />
338<br />
105<br />
1930<br />
430<br />
1619<br />
275<br />
397<br />
640<br />
173<br />
138<br />
607<br />
199<br />
194<br />
604<br />
156<br />
378<br />
193<br />
201<br />
601<br />
142<br />
1921<br />
115<br />
146<br />
116<br />
345<br />
107<br />
1929<br />
464<br />
1626<br />
296<br />
425<br />
695<br />
170<br />
152<br />
620<br />
238<br />
197<br />
679<br />
166<br />
397<br />
203<br />
204<br />
614<br />
159<br />
1903<br />
127<br />
161<br />
123<br />
340<br />
113<br />
1989<br />
519<br />
1606<br />
303<br />
435<br />
717<br />
167<br />
157<br />
620<br />
259<br />
195<br />
712<br />
169<br />
403<br />
206<br />
203<br />
614<br />
167<br />
1871<br />
131<br />
168<br />
125<br />
333<br />
115<br />
2000<br />
544<br />
1578<br />
311<br />
446<br />
739<br />
166<br />
162<br />
624<br />
278<br />
196<br />
742<br />
173<br />
410<br />
210<br />
204<br />
618<br />
175<br />
1852<br />
136<br />
175<br />
128<br />
330<br />
118<br />
2 015<br />
568<br />
1561<br />
328<br />
468<br />
779<br />
169<br />
173<br />
639<br />
311<br />
201<br />
795<br />
183<br />
427<br />
220<br />
210<br />
633<br />
190<br />
1846<br />
147<br />
188<br />
135<br />
333<br />
125<br />
2052<br />
610<br />
1557<br />
347<br />
492<br />
813<br />
179<br />
186<br />
665<br />
333<br />
214<br />
832<br />
195<br />
449<br />
234<br />
223<br />
659<br />
204<br />
1880<br />
158<br />
105<br />
202<br />
145<br />
349<br />
134<br />
2096<br />
641<br />
1590<br />
London •••<br />
0 0 00 o. 0 ••• 0" o. 10369 10727 10588 10379 10209 9976 9861<br />
145
TABLB 48. (continued)<br />
(Thous<strong>and</strong>s)<br />
Mator a,ea, region, country <strong>and</strong> city 1950 1960 1970 1975 1980 1990 2000<br />
UnitedKingdom (continued)<br />
Luton ................. "... 146 190 227 244 261 290 310<br />
Manchester ............... 2538 2527 2529 2503 2488 2488 2524<br />
Mansfield/Sutton ........... 226 236 259 269 279 299 317<br />
Middlesbrough/<br />
Hartlepool .............. 485 534 580 597 614 648 678<br />
Newcastle-upon-Tyne ....... 1139 1159 1144 1123 1111 1110 1141<br />
Newport/Pontypool ........ 419 427 433 431 432 442 463<br />
Northampton. '" .. , ......• 143 150 166 173 180 195 209<br />
Norwich •••• 0 ••••••••••••• 216 226 257 272 287 313 334<br />
Nottingham •••••••••••••<br />
0 • 607<br />
642 684 699 714 746 777<br />
Oxford ................... 171 195 222 234 245 267 286<br />
Plymouth ................. 256 255 268 272 278 291 308<br />
Port Talbot ............... 135 150 163 167 173 184 197<br />
Portsmouth •• 0 •••••••••••• 371 407 459 483 506 546 576<br />
Preston .................. 275 282 305 315 324 344 364<br />
Reading ..................<br />
Sheffield ..................<br />
Southampton ..............<br />
St.Helens .................<br />
Stoke-on-Trent ........•....<br />
Sunderl<strong>and</strong> ................<br />
Swansea/<br />
Neath ....................<br />
Swindon ..................<br />
Warrington ..•.............<br />
Wigan/<br />
Leigh ...................<br />
york .....................<br />
206<br />
771<br />
358<br />
130<br />
494<br />
235<br />
308<br />
105<br />
182<br />
297<br />
127<br />
239<br />
785<br />
399<br />
126<br />
504<br />
244<br />
307<br />
134<br />
174<br />
291<br />
133<br />
309<br />
794<br />
457<br />
127<br />
519<br />
241<br />
316<br />
160<br />
195<br />
326<br />
137<br />
348<br />
790<br />
484<br />
127<br />
521<br />
237<br />
317<br />
173<br />
205<br />
344<br />
138<br />
386<br />
791<br />
510<br />
127<br />
525<br />
235<br />
320<br />
185<br />
216<br />
360<br />
139<br />
448<br />
804<br />
555<br />
132<br />
541<br />
238<br />
331<br />
206<br />
236<br />
391<br />
145<br />
481<br />
832<br />
586<br />
141<br />
565<br />
251<br />
349<br />
222<br />
252<br />
415<br />
155<br />
Southern Europee .............. 53763 68433 88095 99134 111141 137641 165002<br />
Albania •••••• I •••••••••••••<br />
Tirana ....................<br />
253 502<br />
137<br />
727<br />
190<br />
867<br />
222<br />
1043<br />
262<br />
1516<br />
370<br />
2117<br />
513<br />
Andorra ........<br />
1 ••••••• 0 ••••<br />
Cyprus .....................<br />
Nicosia , ..................<br />
Gibraltar ...................<br />
147<br />
23<br />
204<br />
24<br />
258<br />
114<br />
26<br />
292<br />
125<br />
27<br />
331<br />
139<br />
28<br />
418<br />
174<br />
30<br />
505<br />
212<br />
31<br />
Greece • 0 0 0 0 ••••••••••••••••<br />
Athens .000 ••••••• 0" 0 ••••<br />
Patrai •••• , ••• , 0 0 0 o. 0 0 0" 0<br />
Thessaloniki ...............<br />
2820<br />
1345<br />
291<br />
3571<br />
1 813<br />
101<br />
372<br />
4616<br />
2 511<br />
112<br />
541<br />
5128<br />
2 900<br />
116<br />
647<br />
5623<br />
3 207<br />
119<br />
739<br />
6496<br />
3 734<br />
129<br />
904<br />
7169<br />
4009<br />
144<br />
1002<br />
HolySee ..............•..... 1 1 1 1 1 1 1<br />
Israel .......................<br />
Haifa (Conurbation) ........<br />
Jerusalem> .00. 0.00 •• 0 •••••<br />
Tel-AvivlYafo (Conurbation) .<br />
813<br />
176<br />
126<br />
359<br />
1627<br />
255<br />
166<br />
740<br />
2490<br />
321<br />
217<br />
982<br />
2972<br />
352<br />
244<br />
1091<br />
3473<br />
391<br />
277<br />
1220<br />
4400<br />
480<br />
350<br />
1501<br />
5191<br />
562<br />
415<br />
1727<br />
0 ••••••••• 0 0.0 ••••••• 25402 29812 34521 36809 39048 43414 47563<br />
Italy ••<br />
Aless<strong>and</strong>ria •• .o.o.o.o • .o • .o.o.o.o .o' 109 124 131 138 154 171<br />
Ancona ...........•....... 105 124 144 154 163 183 204<br />
Bari ...................... 279 322 370 394 415 462 504<br />
Bergamo ...........•...... 101 113 126 132 138 153 169<br />
Biella "0 0 •• 0000. o. o. 0 0 000 132 150 159 163 167 180 198<br />
Bologna 0 ••••• 0 ••••••••••• 346 460 543 582 616 686 745<br />
Bolzano .o. o. 0 •• 0 •••••••••• 102 109 116 132 148<br />
0 ••••••••• 245 288 348 380 410 468 513<br />
Brescia •••••••••<br />
Cagliari ................... 134 177 219 240 260 299 331<br />
Catania ................... 381 452 507 532 5$3 604 654<br />
Ferrara ................... 132 150 155 155 156 164 180<br />
Florence .................. 649 772 911 984 1047 1169 1259<br />
Forli 103 109 •• 0 •••••• 0 0.0 •••• 0 ••• 115 129 144<br />
Genoa ••••••• 0 ••••••••••• 909 1034 1108 1137 1161 1230 1310<br />
La Spezia ................. 338 364 387 397 406 434 470<br />
Livomo ................... 275 315 351 369 384 420 458<br />
Messina ................... 225 258 259 256 254 264 286<br />
Milan .0' 0 ••••• 0. 0 ••• 0000. 3637 4510 5553 6124 6603 7394 7742<br />
Modena • .o.o •••••••• 0 ••• 00. 108 135 167 185 201 233 259<br />
•••••• 0.0 •••• 113 120 127 143 159<br />
Monza 00.000<br />
146
TABLE 48. (continued)<br />
(Thous<strong>and</strong>s)<br />
Malor area, region, country <strong>and</strong> city 1950 1960 1970 1975 1980 1990 2000<br />
Italy (continued)<br />
Naples .................... 2753 3196 3609 3808 3966 4272 4476<br />
Novara ...................<br />
106 112 126 141<br />
Padua 495 541<br />
•••••••••••••••••• 0 • 289 325 381 412 439<br />
Palermo .................. 523 623 689 718 742 801 861<br />
Parma ................. · .. 121 139 171 190 207 242 269<br />
Perugia ................... 111 127 135 143 160 178<br />
Pescara ................... 124 156 204 231 257 307 342<br />
Piacenza .................. 104 114 123 142 159<br />
Pisa ...................... 102 109 115 129 144<br />
Reggio di Calabria .......... 152 166 179 185 191 207 228<br />
Reggio Nell Emilia .....'.... 106 115 128 134 140 154 171<br />
Rimini .................... 109 144 185 208 229 271 302<br />
Rome .................... 1698 2256 2902 3265 3581 4116 4371<br />
Sassari ................... 105 114 123 141 158<br />
Siracusa .................. 106 117 127 147 165<br />
Taranto ................ '" 166 191 224 241 257 290 320<br />
Temi .................... 106 112 118 131 146<br />
Turin .................... 881 1251 1628 1835 2018 2336 2506<br />
Trieste ................... 290 291 292 291 291 304 330<br />
Udine •••••••••••••••• 0 ••• 107 119 134 142 149 166 184<br />
Venice ..................... 375 414 454 472 489 530 575<br />
Verona ................... 202 251 305 334 360 411 452<br />
Vicenza ................... 112 136 149 160 185 206<br />
Malta ............. , ........ 191 230 253 266 279 297 300<br />
Portugal ..................... 1619 1989 2262 2471 2742 3478 4406<br />
Lisbon ................... 842 936 1009 1076 1 154 1370 1671<br />
Porto .................... 346 384 384 395 411 475 585<br />
San Marino ................. 11 14 18 19 20 22 24<br />
Spain ....................... 14453 17141 22307 24978 27634 32786 37452<br />
Alicante .................. 180 218 335 415 490 636 735<br />
Barcelona ................. 1666 2208 2687 2936 3129 3516 3851<br />
Bilbao .................... 375 537 887 1 135 1375 1821 2082<br />
Cadiz .................... 139 168 207 229 247 287 329<br />
Cartagena ................. 122 134 162 177 190 219 252<br />
C6rdoba .................. 163 195 230 248 263 299 341<br />
Gij6n ..................... 162 215 273 305 332 389 445<br />
Granada .................. 175 181 181 180 178 187 211<br />
Jerez de la Frontera ........ 154 192 226 243 256 290 331<br />
La Corufia ................ 131 174 193 201 207 227 259<br />
Las Palmas(Canarias) .... , .. 176 216 314 377 436 548 632<br />
Madrid ................... 1661 2302 3338 3986 4557 5573 6163<br />
Malaga .................. , 274 298 341 363 380 424 479<br />
Murcia ................ ""<br />
Oviedo • I •••••••• I •••••• I'<br />
Palma de Mallorca (Baleares)<br />
Pamplona •• I ••• I I I •••••• I<br />
San Sebastian ..............<br />
Santa Cruz de Tenerife ......<br />
Sant<strong>and</strong>er .................<br />
Seville ....................<br />
Valencia ••• I ••• I •••••• 1.1.<br />
Valladolid .................<br />
Vigo •••••• I I •••••••••• I ••<br />
Zaragoza • I I. I ••••• I ••••••<br />
247<br />
236<br />
135<br />
174<br />
165<br />
101<br />
477<br />
654<br />
123<br />
137<br />
260<br />
282<br />
288<br />
157<br />
101<br />
220<br />
213<br />
117<br />
574<br />
704<br />
150<br />
144<br />
321<br />
307<br />
301<br />
225<br />
156<br />
325<br />
320<br />
142<br />
822<br />
1020<br />
214<br />
194<br />
463<br />
317<br />
305<br />
268<br />
194<br />
393<br />
391<br />
156<br />
981<br />
1228<br />
255<br />
225<br />
554<br />
325<br />
307<br />
308<br />
230<br />
456<br />
457<br />
168<br />
1125<br />
1416<br />
292<br />
253<br />
638<br />
353<br />
427<br />
387<br />
301<br />
579<br />
584<br />
194<br />
1394<br />
1766<br />
366<br />
310<br />
796<br />
398<br />
368<br />
448<br />
353<br />
667<br />
675<br />
224<br />
1579<br />
1996<br />
425<br />
358<br />
912<br />
Turkey ••••• I I 1.1 •••• 1.1 •• "'<br />
Adana ....................<br />
Adapazari .................<br />
Ankara ••••• I •••••• I ••••••<br />
Bursa .....................<br />
Diyarbakir ••• I 1.1.1 ••• 1.1.<br />
Elazig ••• I 1.1.1 •••••• I ••••<br />
Erzurum ..................<br />
Eskisehir ..................<br />
Gaziantep .................<br />
Istanbul • I •••••• I 1.11. I. "'<br />
Izmir •••••••••• 1.1. I •••• I<br />
Izmit .....................<br />
4441<br />
138<br />
281<br />
149<br />
124<br />
104<br />
969<br />
314<br />
8181<br />
272<br />
635<br />
221<br />
125<br />
147<br />
211<br />
180<br />
1453<br />
564<br />
119<br />
13536<br />
350<br />
100<br />
1264<br />
374<br />
200<br />
164<br />
206<br />
278<br />
299<br />
2769<br />
710<br />
198<br />
17106<br />
359<br />
119<br />
1689<br />
470<br />
252<br />
229<br />
250<br />
326<br />
393<br />
3883<br />
904<br />
259<br />
21482<br />
373<br />
141<br />
2164<br />
575<br />
308<br />
304<br />
298<br />
378<br />
498<br />
5162<br />
1 115<br />
328<br />
32 684<br />
452<br />
200<br />
3353<br />
851<br />
459<br />
500<br />
428<br />
524<br />
769<br />
8326<br />
1658<br />
507<br />
45482<br />
602<br />
279<br />
4548<br />
1 167<br />
637<br />
706<br />
590<br />
715<br />
1066<br />
11221<br />
2254<br />
707<br />
147
TABLE 48. (continued)<br />
(Thous<strong>and</strong>s)<br />
Malor area, region, country <strong>and</strong> city 1950 1960 1970 1975 1980 1990 2000<br />
Turkey (continued)<br />
Kayseri ................... 114 178 275 351 435 654 904<br />
Kenya .................... 181 289 355 427 618 848<br />
Malatya .................. 138 210 260 316 463 640<br />
Maras ....................<br />
Mersin ••••• I •• • •• • .. ••••••<br />
Samsun ...................<br />
Siirt ......................<br />
Sivas .....................<br />
Urfa .....................<br />
Yugoslavia ..................<br />
Belgrade ..................<br />
Ljubljana .................<br />
Nis .................... , .<br />
Novi Sad ..................<br />
Rijeka ....................<br />
Sarajevo ..................<br />
Skoplje ...................<br />
Split ......................<br />
Zagreb ....................<br />
3589<br />
393<br />
105<br />
106<br />
324<br />
102<br />
154<br />
143<br />
5137<br />
570<br />
132<br />
108<br />
140<br />
161<br />
423<br />
164<br />
171<br />
222<br />
217<br />
148<br />
7080<br />
759<br />
206<br />
123<br />
158<br />
130<br />
258<br />
298<br />
148<br />
555<br />
207<br />
227<br />
262<br />
149<br />
286<br />
204<br />
8198<br />
868<br />
258<br />
154<br />
191<br />
148<br />
354<br />
408<br />
183<br />
633<br />
255<br />
292<br />
305<br />
244<br />
365<br />
268<br />
9437<br />
976<br />
313<br />
186<br />
225<br />
166<br />
459<br />
529<br />
218<br />
710<br />
382<br />
459<br />
427<br />
522<br />
568<br />
436<br />
12099<br />
1212<br />
431<br />
256<br />
299<br />
208<br />
696<br />
789<br />
296<br />
881<br />
532<br />
644<br />
586<br />
776<br />
792<br />
616<br />
14761<br />
1443·<br />
532<br />
318<br />
368<br />
255<br />
855<br />
980<br />
367<br />
1054<br />
Western Europe ................<br />
Austria .....................<br />
Graz .....................<br />
Innsbruck .................<br />
Linz ......................<br />
Salzburg ..................<br />
Vienna ...................<br />
78266<br />
3407<br />
241<br />
108<br />
227<br />
118<br />
1790<br />
93085<br />
3520<br />
254<br />
116<br />
253<br />
128<br />
1794<br />
110 178<br />
3853<br />
266<br />
132<br />
258<br />
150<br />
1723<br />
116280<br />
3970<br />
268<br />
139<br />
256<br />
160<br />
1655<br />
121 841<br />
4130<br />
272<br />
147<br />
256<br />
170<br />
1611<br />
133356<br />
4602<br />
289<br />
164<br />
269<br />
192<br />
1609<br />
144144<br />
5239<br />
326<br />
189<br />
302<br />
221<br />
1744<br />
Belgium •••••••••••••••• 0 •••<br />
Antwerp ..................<br />
5475<br />
607<br />
6042<br />
649<br />
6810<br />
671<br />
7033<br />
667<br />
7281<br />
666<br />
7868<br />
683<br />
8505<br />
722<br />
Brussels ................... 969 1020 1074 1057 1049 1062 1112<br />
Charleroi ................. 221 273 217 209 205 206 221<br />
Ghent .................... 228 230 226 219 216 218 234<br />
La Louviere ............... 108 111 113 113 115 121 132<br />
Liege ..................... 429 445 442 433 429 436 463<br />
France ....... , ............. 23440 28500 36311 39703 42941 48457 53034<br />
Amiens ................... 100 118 142 154 167 193 214<br />
Angers .................... 118 140 171 190 210 247 275<br />
Angouleme ................ 101 108 123 137<br />
Avignon .................. 111 147 164 183 217 242<br />
Bayonne .................. 114 122 132 150 167<br />
Besancon ................. 120 127 136 153 170<br />
Bethune .................. 103 136 145 145 148 158 173<br />
Bordeaux ................. 313 465 574 617 662 744 806<br />
Boulogne ................. 101 108 121 135<br />
Brest ..................... 112 143 176 192 209 242 268<br />
Bruay-en-Artois ............ 129 130 123 116 113 113 123<br />
Caen ..................... 112 162 183 206 248 276<br />
Calais .................... 101 106 119 132<br />
Cannes ................... 116 161 212 210 212 222 241<br />
Clermont-Ferr<strong>and</strong> .......... 142 167 220 257 294 362 404<br />
Denain ................... 119 127 129 132 141 156<br />
Dijon .................... 146 192 210 229 266 294<br />
Douai .................... 164 189 207 211 218 235 257<br />
Dunkerque ............... 114 157 189 223 285 322<br />
Grenoble ................. 100 228 351 393 437 514 565<br />
Hagondange-Briey .......... 117 137 144 152 170 188<br />
Le Havre ................. 176 217 253 266 281 311 340<br />
Le Mans .................. 103 138 175 194 214 252 280<br />
Lens ..................... 306 321 327 330 336 357 387<br />
Lille ..................... 739 807 925 1024 1125 1298 1401<br />
Limoges .................. 111 127 154 169 185 214 238<br />
Lorient ................... 101 106 113 126 140<br />
Lyons .................... 581 878 1107 1178 1253 1388 1484<br />
Marseilles ................ 671 810 999 1079 1161 1304 1400<br />
Metz ..................... 110 143 171 182 195 220 242<br />
Montb6liard ............... 120 134 148 174 194<br />
Montpellier ............... 119 184 214 245 302 337<br />
Mulhouse ................. 149 176 206 220 236 268 295<br />
148
TABLE 48. (continued)<br />
(Thous<strong>and</strong>s)<br />
Malor area, reI/Ion, country <strong>and</strong> city 1950 1960 1970 1975 1980 1990 2000<br />
France (continued)<br />
Nancy .................... 156 219 265 282 301 338<br />
Nantes .................... 294 340 413 458 504 586 641<br />
Nice ..... , ............... 257 332 407 441 476 541 590<br />
Nlmes .................... 127 132 139 153 169<br />
Orleans ................... 112 136 181 212 245 304 340<br />
Paris ..................... 5525 7230 8510 9219 9907 10945 11330<br />
Pau ...................... 116 128 141 166 185<br />
Perpignan ................. 110 118 127 145 162<br />
Reims .................... 118 139 177 199 222 264 293<br />
Rennes ................... 119 154 204 232 260 312 346<br />
Rouen .................... 317 326 376 390 408 445 483<br />
Saint-Etienne .............. 284 310 333 336 343 364 395<br />
Saint-Nazaire .............. 114 120 127 143 157<br />
Strasbourg ................ 244 293 352 394 436 513 563<br />
Thionville ................. 119 138 142 148 162 179<br />
Toulon ................... 194 271 353 381 412 468 511<br />
Toulouse .................. 256 346 462 515 569 664 725<br />
Tours ..................... 110 155 215 249 283 344 383<br />
Troyes ................... 118 128 138 158 176<br />
Valenciennes ............... 188 207 260 360 472 685 781<br />
Germany, Federal Republic <strong>of</strong> .. 36137 42884 49369 51251 52513 56043 59185<br />
Aachen ................... 350 433 466 467 469 484 504<br />
Aschaffenburg ............. 104 124 130 136 148 159<br />
Augsburg ................. 242 317 361 372 383 407 428<br />
Bamberg .................. 102 106 104 104 107 114<br />
Bielefeld .................. 253 307 332 334 336 349 366<br />
Bonn/Siogburg ............. 210 408 477 489 501 529 552<br />
Braunschweig/Wolfenburg .. , 246 340 351 341 335 337 351<br />
Bremen/Delmenhorst ....... 500 725 801 806 813 839 867<br />
Bremerhaven/Nordenhorst .. , 121 181 192 189 188 192 203<br />
Darmstadt ................ 160 227 262 271 280 300 317<br />
Erlangen .................. 119 130 140 160 172<br />
Flensburg ................. 110 113 113 109 107 109 116<br />
Frankfurt am Main ........ 946 1381 1661 1753 1833 1965 2019<br />
Freiburg in Breisgau ........ 112 163 195 206 216 236 252<br />
Fulda .................... 105 113<br />
Gieben ................... 128 154 162 170 186 199<br />
Goppingen ................ 110 130 146 151 155 166 177<br />
Gottingen ................. 106 122 133 135 137 144 154<br />
Hamburg ............... 000 1796 2092 2200 2180 2167 2179 2207<br />
Hamm 000 •• 0.0.0 •••• 000 •• 133 153 164 164 165 172 183<br />
Hannover 000.00 •••• 00 •• 0.0 567 764 832 835 840 864 891<br />
Heidelberg 000 ••••••• 000.0. 159 223 255 263 270 288 304<br />
Heilbronn ................. 172 214 228 240 265 282<br />
Herford •• 00.0 •• 000.000. o. 113 134 141 147 161 173<br />
Hildesheim ................ 125 134 133 133 137 145<br />
Ingolstadt ................. 116 129 141 162 176<br />
Kaiserslautem •• 0.00000 •• 00 123 130 128 127 130 138<br />
Karlsruhe ................. 275 379 448 469 489 527 553<br />
Kassel .................... 222 300 342 352 362 384 404<br />
Kiel ...................... 292 334 344 338 334 339 354<br />
Koblenz ••• 0 •••• 0. 0 0 0000.0 123 152 161 160 159 164 174<br />
LUbeck •••• 00. 0 •••• 0000. 00 266 271 282 280 280 288 302<br />
Mannheim/LUdwigshafen .... 584 750 859 888 915 968 1003<br />
Minden ................... 101 107<br />
Munich (MUnchen) ......... 963 1333 1707 1869 2012 2236 2309<br />
Munster 0.000 ••• 0.0.0 ••••• 120 205 242 251 260 279 296<br />
Neunkirchen ••• 00 •••• 0 •• 0. 120 124 126 123 122 124 132<br />
Neuwied/Andemach ........ 110 127 141 144 148 158 168<br />
NUrnberglFiirth ............ 549 746 838 855 871 909 940<br />
Oldenburg ................. 124 124 131 131 132 137 146<br />
Osnabrock .00 ••••••••••• 00 137 216 250 258 265 283 299<br />
Pforzheim •••• 00.0000 •• 0" 167 204 215 224 245 260<br />
Regensburg ................ 124 159 178 182 187 198 211<br />
Reutlingen 0 ••• 0 •••••• 0 •• 00 115 142 153 163 182 196<br />
Rhein/Ruhr •••••••••• 0. 0.0 6853 8712 9337 9311 9275 9252 9151<br />
Rheydt/MUncheng/Vier ..... 277 337 358 357 357 367 384<br />
SaarbrUcken/Vo1kling ....... 349 375 378 368 361 362 377<br />
149<br />
370
, TABLE 48. (continued)<br />
(Thous<strong>and</strong>s)<br />
Malor area, region, country <strong>and</strong> city 1950 1960 1970 1975 1980 1990 2000<br />
Germany, Federal Republic <strong>of</strong><br />
(continued)<br />
Saarlouis/Dillingen ......... 100 106<br />
Schweinfurt ••••••••••• 1 0 •• 100 102 104 111 119<br />
Siegen .................... 100 142 145 140 137 138 146<br />
Stuttgart .................. 988 1355 1620 1710 1787 1916 1969<br />
Trier ..................... 114 121 120 120 124 132<br />
VIm/Neu-VIm ............. 102 165 193 200 207 222 236<br />
Wetzlar ................... 100 106 113<br />
Wiesbaden/Mainz .......... 393 542 634 661 685 733 764<br />
Wilhelmshaven ............. 103 100 102 100 100 103 110<br />
Wolfsburg ................ 133 15S 176 212 230<br />
Wurzburg ................. ISS 174 176 179 189 200<br />
Berlin .................... 2157 . 2186 2121 2026 1954 1895 1910<br />
Liechtenstein •• II •••••••• I ••• 3 3 4 5 5 6 9<br />
Luxembourg ................ 175 195 230 252 270 295 308<br />
Monaco 22 23 23 24 25 27 28<br />
••••••• II •• •••••••••<br />
Netherl<strong>and</strong>s ................. 7527 9182 10165 10376 10764 11 613 12791<br />
Amsterdam •• , I ••••••••••• 862 913 1038 984 948 924 978<br />
Apeldoom ................ 104 125 133 141 156 175<br />
Arnhem ................... 123 153 272 278 285 303 332<br />
Breda .................... 103 149 ISO 153 161 178<br />
Dordrecht ................. 101 170 184 198 223 249<br />
Eindhaven Tivoli ........... 145 167 338 355 371 404 442<br />
Enschede Hengelo .......... 152 164 232 237 244 260 286<br />
Groningen ................ 132 141 203 201 201 208 228<br />
Haarlem .................. 208 224 239 231 227 229 250<br />
Leiden .................... 106 117 164 189 215 259 291<br />
Maastricht ••••••••••• II ••• 144 145 147 156 172<br />
Nijmegen ................. 113 133 205 212 219 237 261<br />
Rotterdam ................ 747 830 1064 1027 1003 995 1056<br />
's Gravenhage ............. 619 692 715 677 652 638 680<br />
Tilburg ................... 119 131 204 211 219 236 260<br />
Utrecht ................... 231 253 457 461 467 487 528<br />
Zaanstad .................. 121 134 137 140 150 166<br />
Switzerl<strong>and</strong> .................. 2080 2736 3413 3666 3912 ·4445 5045<br />
Basel ............... " .... 257 296 380 415 442 501 565<br />
Berne •••••• 0 ••••••• ••• •• • 194 219 283 312 334 381 432<br />
Geneva ................... 194 234 319 359 392 459 521<br />
Lausanne ................. 136 160 225 257 285 339 388<br />
'<br />
Lucerne ...................<br />
Winthertur ••••• 00.0 •• 0.000<br />
Zurich ....................<br />
Oceania .........................<br />
Australia <strong>and</strong> New Zeal<strong>and</strong> .......<br />
Australia ................. , ..<br />
Adelaide ..................<br />
Brisbane 00.0000 ••••• 0 •• 0.'<br />
Canberra 00 ••••• 0 ••••• 0. O'<br />
Geelong ••••• 0 •••••• 0 •••••<br />
Greater Wollongong •••• 00 ••<br />
Hobart •• ••• 0 ••••••••••••<br />
Melbourne 0 •••••• 0 ••••••• 0<br />
Newcastle .................<br />
Perth .....................<br />
Sydney ••• 0.0 ••••• 0 ••••• o.<br />
New Zeal<strong>and</strong> •• 00 ••• 0 ••••••••<br />
Auckl<strong>and</strong> 0 •• 0 ••••••• 0.00 ••<br />
Christchurch •••• 00.0. 0 •• 0.<br />
Dunedin .0000 •••••• 0 ••• 00.<br />
Hutt 0 •• 00.0.0 ••• 0 ••••••••<br />
Wellington 0 •• 000.00 ••••• 0 0<br />
Melanesia .....................<br />
New Caledonia ••••• 0. 0 ••• 0 ••<br />
Noumea •••••••• 0 •••••••• •<br />
New Hebrides ..............•<br />
Norfolk Isl<strong>and</strong> ...............<br />
494<br />
7736<br />
7565<br />
6181<br />
355<br />
436<br />
105<br />
1490<br />
157<br />
277<br />
1646<br />
1384<br />
334<br />
179<br />
126<br />
28<br />
16<br />
118<br />
532<br />
10443<br />
10118<br />
8315<br />
565<br />
605<br />
127<br />
116<br />
1880<br />
204<br />
407<br />
2141<br />
1803<br />
457<br />
225<br />
104<br />
124<br />
85<br />
30<br />
148<br />
105<br />
715<br />
13675<br />
12979<br />
10692<br />
796<br />
801<br />
142<br />
114<br />
182<br />
128<br />
2344<br />
248<br />
613<br />
2677<br />
2287<br />
634<br />
272<br />
110<br />
121<br />
135<br />
304<br />
53<br />
161<br />
110<br />
802<br />
15630<br />
14557<br />
12039<br />
881<br />
906<br />
235<br />
124<br />
207<br />
139<br />
2646<br />
264<br />
782<br />
2968<br />
2518<br />
728<br />
293<br />
113<br />
130<br />
141<br />
580<br />
69<br />
170<br />
114<br />
870<br />
17829<br />
16211<br />
13445<br />
964<br />
1009<br />
358<br />
134<br />
232<br />
149<br />
2934<br />
280<br />
958<br />
3242<br />
2766<br />
825<br />
316<br />
118<br />
139<br />
148<br />
1001<br />
89<br />
192<br />
125<br />
1004<br />
22590<br />
19508<br />
16223<br />
1 133<br />
1211<br />
636<br />
159<br />
283<br />
175<br />
3478<br />
320<br />
1296<br />
3770<br />
3285<br />
1015<br />
368<br />
132<br />
162<br />
168<br />
2162<br />
136<br />
136<br />
220<br />
143<br />
1123<br />
27145<br />
22576<br />
18754<br />
1286<br />
1380<br />
791<br />
186<br />
331<br />
204<br />
3888<br />
369<br />
1510<br />
4194<br />
3822<br />
1 169<br />
426<br />
154<br />
190<br />
196<br />
3285<br />
188<br />
188<br />
150
TABLE 48. (continued)<br />
(Thous<strong>and</strong>s)<br />
Malorarea,region,country <strong>and</strong> city 1950 1960 1970 1975 1980 1990 2000<br />
Melanesia (continued)<br />
Papua New Guinea .........<br />
Port Moresby ............<br />
11 51 236 482<br />
120<br />
862<br />
215<br />
1913<br />
540<br />
2915<br />
853<br />
Solomon Isl<strong>and</strong>s.............. 1 4 15 29 50 113 182<br />
Micronesia <strong>and</strong> Polynesia ........<br />
Micronesia ..................<br />
GilbertIsl<strong>and</strong>s <strong>and</strong> Tuvalu ...<br />
Guam ....................<br />
Nauru ....................<br />
143<br />
29<br />
4<br />
14<br />
240<br />
46<br />
7<br />
16<br />
392<br />
79<br />
14<br />
22<br />
493<br />
105<br />
21<br />
26<br />
617<br />
236<br />
29<br />
31<br />
920<br />
212<br />
49<br />
46<br />
1284<br />
301<br />
70<br />
72<br />
Niue Isl<strong>and</strong> ................<br />
Pacific Isl<strong>and</strong>s .............<br />
Polynesia ...................<br />
American Samoa ...........<br />
Cook Isl<strong>and</strong>s ..............<br />
Fiji ......................<br />
Suva ...................<br />
French Polynesia ...........<br />
Papeete .................<br />
1<br />
10<br />
114<br />
7<br />
4<br />
70<br />
17<br />
1<br />
22<br />
194<br />
8<br />
6<br />
117<br />
32<br />
1<br />
42<br />
313<br />
11<br />
6<br />
185<br />
61<br />
1<br />
57<br />
388<br />
14<br />
7<br />
224<br />
102<br />
80<br />
1<br />
75<br />
481<br />
17<br />
9<br />
268<br />
117<br />
104<br />
100<br />
2<br />
115<br />
708<br />
27<br />
13<br />
369<br />
157<br />
159<br />
154<br />
2<br />
157<br />
983<br />
39<br />
21<br />
481<br />
206<br />
218<br />
212<br />
Samoa ....................<br />
Apia ...................<br />
Tonga ....................<br />
10<br />
6<br />
20<br />
11<br />
29<br />
21<br />
35<br />
28<br />
45<br />
38<br />
75<br />
65<br />
122<br />
122<br />
102<br />
Wallis <strong>and</strong> Futuna Isl<strong>and</strong>s....<br />
USSR ..........................<br />
Aktyubinsk ....................<br />
Alma-Ata .....................<br />
Andizhan .....................<br />
Angarsk ......................<br />
Anzhero-8udzhensk .............<br />
Arkhangelsk ...................<br />
Armavir •••••••• 0 •••••••••••••<br />
Ashkhabad ....................<br />
Astrakhan ....................<br />
Baku .........................<br />
Balakovo ••••••••• 00 ••••••••••<br />
70765<br />
286<br />
185<br />
113<br />
224<br />
708<br />
104587<br />
106<br />
494<br />
140<br />
152<br />
272<br />
111<br />
182<br />
331<br />
1014<br />
137644<br />
153<br />
744<br />
191<br />
208<br />
347<br />
148<br />
257<br />
416<br />
1274<br />
107<br />
155316<br />
181<br />
895<br />
218<br />
244<br />
384<br />
163<br />
299<br />
452<br />
1395<br />
121<br />
173653<br />
212<br />
1055<br />
248<br />
283<br />
425<br />
180<br />
343<br />
491<br />
1523<br />
136<br />
209366<br />
273<br />
1357<br />
307<br />
360<br />
508<br />
216<br />
431<br />
574<br />
1777<br />
167<br />
239614<br />
318<br />
1543<br />
355<br />
417<br />
109<br />
578<br />
250<br />
497<br />
649<br />
1974<br />
195<br />
Baranovichi ................... 104 117 132 162 189<br />
Barnaul ....................... 205 324 446 514 585 725 826<br />
Batumi ....................... 102 115 129 159 186<br />
Belaya Tserkov ................ 111 125 141 173 202<br />
Belgorod ...................... 156 217 288 434 519<br />
Belovo ........................ 105 108 108 110 120 138<br />
Beltsy ••••••••••••••••• II •••••• 104 117 132 162 189<br />
Berdyansk .................... 102 115 129 159 186<br />
Berezniki ..................... 106 147 165 184 225 260<br />
Biisk ......................... 109 154 189 199 212 243 278<br />
Blagoveshchensk ............... 130 148 168 208 242<br />
. Bobruisk ...................... 105 140 159 180 223 259<br />
Bratsk ........................ 124 163 184 207 253 293<br />
Brest ......................... 124 .. 151 180 237 279<br />
Bryansk ....................... 134 223 324 383 446 568 653<br />
Bukhara •••• •••• •• • ••••• 0 •••• 0 114 129 145 178 207<br />
Cheboksary ••••••• 0 ••••••• 0 0 o. 116 223 301 390 569 672<br />
Chelyabinsk ................... 517 723 882 954 1033 1194 1333<br />
Cherepovets •••••••• 0 •••••••••• 103 195 264 343 501 593<br />
Cherkassy ..................... 163 209 260 361 426<br />
Chernigov ..................... 101 163 204 249 339 398<br />
Chemovtsy •••• 0 ........ 0 •••••• 0 117 159 189 202 217 251 287<br />
Chimkent ••••••• 0 •••••••• 00 ••• 166 252 304 359 467 542<br />
Chirchik •••••••• 0 ••••••••• 00 •• 110 124 140 172 200<br />
Chita ...................... '" 119 183 245 278 313 384 441<br />
Daugavpils .................... 103 116 131 161 187<br />
Dneproclzerzhinsk .0 ••• 0 ••••• o. 0 155 202 227 236 249 281 319<br />
Dnepropetrovsk o. 0.0. o. 0 o' 0 0.0. 485 697 872 956 1046 1226 1371<br />
Donetsk .00 o. 0.0. 0 0 ••• 00000 ••• 541 742 887 951 1022 1171 1306<br />
Dushanbe • 00. 0 0 •• 0 •••••••••••• 139 247 382 466 556 729 841<br />
Dzerzhinsk .............. ! ..... 118 164 224 249 277 334 384<br />
151
TABLB 48. (continued)<br />
(Thous<strong>and</strong>s)<br />
Malar area, region, country <strong>and</strong> city 1950 1960 1970 1975 1980 1990 2000<br />
USSR (continued)<br />
Dzhambul ..................... 123 192 236 284 378 442<br />
Elektrostal ................... . 102 124 135 147 174 201<br />
Elets ......................... 101 114 128 158 184<br />
Engels ........................ 132 151 172 215 250<br />
Fergana ....................... 113 128 143 176 205<br />
Frunze ....................... 118 245 443 585 744 1055 1228<br />
Gomel ........................ 105 182 277 335 397 518 599<br />
Gorky ........................ 718 986 1180 1265 1359 1554 1724<br />
Gorlovka ..................... 174 260 339 379 422 509 581<br />
Grodno ....................... 135 172 213 294 347<br />
Grozny ....................... 177 265 344 383 425 509 580<br />
Guryev ....................... 115 132 151 189 220<br />
Irkutsk ....................... 223 383 455 486 521 599 674<br />
Ivano-Frankovsk ............... 107 121 136 167 195<br />
Ivanovo ...................... 254 352 423 455 491 569 643<br />
Izhevsk ....................... 190 306 429 498 572 715 816<br />
Kadievka ..................... 102 120 138 141 146 163 186<br />
Kalinin ....................... 190 276 349 385 425 505 575<br />
Kaliningrad (Kalingradskaya oblast) 141 219 302 348 397 493 566<br />
Kaliningrad (Moskovskaya oblast) . 108 122 137 169 196<br />
Kaluga ....................... 145 215 257 301 389 452<br />
Kamensk-Uralsky .............. 110 147 170 178 189 215 246<br />
Karag<strong>and</strong>a .................... 221 368 531 625 724 914 1042<br />
Kaunas ................ , ...... 153 233 310 350 394 481 550<br />
Kazan ......................... 491 704 878 961 1049 1228 1373<br />
Kemerovo ..................... 209 306 390 432 477 569 646<br />
Kerch ........................ 129 160 194 261 307<br />
Khabarovsk ................... 232 344 442 492 545 653 740<br />
Kharkov ...................... 710 10.04 1235 1343 1459 1691 1878<br />
Kherson ...................... 171 266 326 390 516 599<br />
Khmelnitsky ................... 116 131 147 181 210<br />
Kiev ••••••••••• 0 0 ••• 0 •••••••• 743 1189 1657 1917 2188 2687 2997<br />
Kirov ......................... 184 266 336 370 407 483 550<br />
Kirovabad ..................... 145 192 217 243 298 344<br />
Kirovakan ..................... 110 124 140 172 200<br />
Kirovograd .................... 141 192 219 249 308 356<br />
Kiselevsk ...................... 118 123 126 121 120 126 143<br />
Kishinev ••••••••••••• 0 •••••••• 133 236 367 449 536 705 814<br />
Klaipeda ...................... 142 168 196 252 294<br />
Kok<strong>and</strong> ....................... 104 134 144 155 181 208<br />
Kolomna ...................... 103 116 137 142 149 169 193<br />
Kommunarsk 0 ••• 0 0 •••••• 0 ••••• 104 124 134 145 170 196<br />
Komsomolsk-na-Amure •••••••• 0 152 222 263 308 395 458<br />
Konstantinovka •••••••••• 0 ••••• 107 113 121 140 161<br />
Kopeisk ....................... 151 156 156 149 147 153 173<br />
Kostroma ••••••••••• 0 ••••••••• 127 181 225 246 269 318 363<br />
Kovrov •••••••••••• 0.0.000. 0 00 104 124 134 145 170 196<br />
Kramatorsk •••• 0 ••• 0" 0 ••••••• 115 153 168 185 222 256<br />
Krasnodar ••••.•••••••••.•• o. 0 208 336 472 548 629 785 896<br />
Krasnoyarsk ................... 280 445 660 787 922 1176 1339<br />
Krasny Luch ................... 102 103 106 117 134<br />
Kremenchug ................... 151 187 226 303 356<br />
Krivoy Rog .................... 275 428 581 664 752 922 1045<br />
Kuibyshev ..................... 595 850 1058 1158 1265 1478 1648<br />
Kurgan •••••••••• 0.0. 0 o. 00 ••• 0 159 249 305 366 484 563<br />
Kursk .o ••••••••• .o •• 0 0 ••••• 0 ••• 144 218 288 325 365 445 509<br />
Kustanai ...................... 125 143 163 203 237<br />
Kutaisi ••• 0 ••••••• 0 0 •••••••••• 106 127 162 174 187 218 251<br />
Kzyl-Orda ..................... 126 142 160 196 228<br />
Leninabad ..................... 104 117 132 162 189<br />
Leninakan ..................... 116 167 196 228 290 338<br />
Leningrad ..................... 2623 3462 3978 4180 4410 4887 5294<br />
Leninsk-Kuznetsky .............. 122 126 128 122 120 125 142<br />
Lipetsk .o ••• .o •••• .o. 0" 0 •••••••• 173 297 380 471 649 757<br />
Lisichansk ..................... 102 118 122 128 145 166<br />
Lvov •••••• .o.o •• 0 0 0 ••• 00 ••• 0.00 297 435 560 623 690 825 932<br />
Lyubertsy 141 177 217 297 350<br />
" 0 0 0 ••• 00.0000. 0.' 0 0<br />
Magnitogorsk .................. 249 324 366 381 401 452 509<br />
152
TABLE 49. RURAL POPULATION, MAJOR AREAS, REGIONS AND COUNTRIES, 1950-2000<br />
(Thous<strong>and</strong>s)<br />
MajDr area, re,lon <strong>and</strong> countrY 1950 1960 1970 1975 1980 1990 2000<br />
World total .......................... 1776924 1973733 2255816 2406771 2567042 2857409 3045956<br />
More developed regions .............. 405502 402396 383894 369606 355013 325258 294700<br />
Less developed regions .............. 1371422 1571337 1871922 2037165 2212029 2532 151 2751256<br />
Africa .......................... 186986 223290 271355 298281 327963 394881 467923<br />
Eastern Africa .......................... 58474 71372 89143 99389 110688 137235 169325<br />
British Indian Ocean Territory .. 2 2 2 2 2 2 2<br />
Burundi ..................... 2381 2844 3276 3682 4190 5459 6979<br />
Comoros .................... 178 208 249 277 307 356 366<br />
Djibouti ..................... 44 41 36 33 31 29 29<br />
Ethiopia ............................ 15914 18740 22540 24702 26960 32153 38525<br />
Kenya ...................... 5682 7518 10102 11659 13465 17788 22895<br />
Madagascar .................. oo .... 3992 4801 5955 6730 7611 9700 12187<br />
Malawi ..................... 2926 3329 3953 3951 3703 3033 3051<br />
Mauritius .......................... 341 442 478 474 463 435 411<br />
Mozambique ............................ 5606 6362 7766 8587 9474 11681 14450<br />
R6union ................................ 187 227 251 253 247 231 220<br />
Rw<strong>and</strong>a ................................ 2150 2674 3562 4046 4656 6171 7938<br />
Seychelles ................... 26 31 38 43 48 57 63<br />
Somalia .................................... 1594 1841 2144 2331 2551 3036 3522<br />
Southern Rhodesia ............ 2034 3092 4410 5036 5774 7503 9366<br />
Ug<strong>and</strong>a ..................... 5765 7155 9023 10241 11645 14904 18475<br />
United Republic <strong>of</strong> Tanzania ... 7607 9588 12353 14024 15921 20304 25540<br />
zambia ..................... 2045 2477 3005 3318 3640 4393 5306<br />
Middle Africa .................. 22431 26025 30270 31873 33602 37605 42497<br />
Angola ......................... , .......... 3668 4230 4822 5223 5673 6729 7954<br />
Central African Empire ........ 962 1025 1110 1146 1185 1291 1419<br />
Chad ....................... 2358 2768 3226 3445 3677 4128 4600<br />
Congo ...................... 560 649 776 864 961 1174 1373<br />
Equatorial Guinea ............ 192 187 174 165 157 145 145<br />
Gabon ...................... 385 373 372 365 351 322 305<br />
Sao Tome <strong>and</strong> Principe ....... 52 54 57 58 57 51 44<br />
United Republic <strong>of</strong> Cameroon .. 3692 4190 4651 4655 4638 4711 5046<br />
Zaire ....................... 10562 12549 15082 15952 16903 19054 21611<br />
Northern Africa ................ 39108 46162 54283 58793 63497 72 787 79909<br />
Algeria .................................. 6805 7513 7801 7768 7763 8027 8642<br />
Egypt ......................• 13929 16111 19249 21197 23025 26036 27540<br />
Libyan Arab Jamahiriya ....... 838 1042 1274 1270 1256 1245 1332<br />
Morocco .................... 6608 8228 9890 10953 12119 14507 16200<br />
Sudan .............................. 8495 10558 13 124 14546 16115 19,411 22426<br />
Tunisia ........................................ 2427 2700 2903 3010 3167 3503 3709<br />
Western Sahara .............. 6 10 42 49 52 58 60<br />
Southern Africa ................ 8986 10614 13 685 15372 17 220 20734 23671<br />
Botswana ........................... 420 497 565 572 561 505 529<br />
Lesotho ............................... 759 872 1015 1 108 1226 1500 1810<br />
Namibia ................................. 360 437 508 533 559 617 699<br />
South Africa ................. 7197 8501 11219 12729 14379 17464 19842<br />
Swazil<strong>and</strong> ................... 250 307 378 430 495 648 791<br />
Western Africa ................ 57987 69117 83974 92854 102956 126520 15252'1<br />
Benin ................................... 1617 1912 2256 2367 2445 2559 2698<br />
Cape Verde .................. 140 188 251 278 304 354 392<br />
Gambia ..................... 310 342 393 425 459 530 590<br />
Ghana ...................... 4297 5201 6117 6680 7342 8880 10321<br />
Guinea ..................... 2539 2868 3378 3697 4058 4862 5649<br />
Guinea-Bissau ............... 460 449 399 416 437 481 517<br />
Ivory Coast ................. 2455 2771 3118 3294 3480 3877 4304<br />
Liberia ..................... 898 999 1124 1205 1299 1484 1656<br />
Mali ....................... 3149 3637 4296 4718 5186 6237 7457<br />
Mauritania .................. 789 918 1013 987 919 771 772<br />
Niger ...................... 2180 2744 3679 4120 4612 5783 7225<br />
Nigeria ..................... 30736 37305 46064 51476 57785 72 832 89883<br />
Senegal ..................... 2037 2406 2995 3348 3724 4512 5169<br />
St. Helena .................. 4 4 4 4 4 5 4<br />
Sierra Leone ................ 1615 1858 2166 2352 2559 2997 3418<br />
Togo ....................... 1114 1322 1703 1909 2144 2684 3233<br />
Upper Volta ................ 3647 4193 5018 5578 6199 7672 9233<br />
Latin America ................... 96411 108982 120670 125728 131042 142283 153695<br />
155
TABLB 49. (continued)<br />
(Thous<strong>and</strong>s)<br />
Major area, rezton <strong>and</strong> countrY 1950 1960 1970 1975 1980 1990 2000<br />
Latin America (continued)<br />
Caribbean ..................... 11120 12500 13520 13 933 14364 15204 15744<br />
Antigua ..................... 24 33 46 50 52 54 52<br />
Bahamas .................... 23 40 75 93 105 126 130<br />
Barbados .................... 140 149 150 152 153 150 139<br />
British Virgin Isl<strong>and</strong>s .......... 7 7 10 11 13 16 19<br />
Cayman Isl<strong>and</strong>s .. , ...........<br />
Cuba ....................... 2911 3169 3409 3527 3642 3786 3784<br />
Dominica ................... 51 60 71 75 80 88 91<br />
Dominican Republic .......... 1764 2205 2592 2776 2967 3395 3928<br />
Grenada ..................... 76 90 94 96 98 102 106<br />
Guadeloupe .. '............... 119 166 195 206 216 227 220<br />
Haiti ....................... 2720 3064 3398 3544 3722 4097 4280<br />
Jamaica ..................... 1028 1079 1099 1102 1090 1045 975<br />
Martinique .................. 160 167 156 143 131 112 100<br />
Montserrat .................. 11 10 11 12 12 13 12<br />
Netherl<strong>and</strong>s Antilles .......... 82 62 40 32 26 21 20<br />
Puerto Rico ........ ,,, .... ,,.. 1 318 1 310 1140 1 015 908 753 668<br />
St. Kitts-Nevis-Anguilla ....... 38 41 43 41 39 35 31<br />
St. Lucia .................... 79 94 101 108 115 127 130<br />
St. Vincent .................. 67 80 88 93 98 106 109<br />
Trinidad <strong>and</strong> Tobago ......... 487 656 750 796 834 885 883<br />
Turks <strong>and</strong> Caicos Isl<strong>and</strong>s ...... 4 4 4 4 4 3 3<br />
United States Virgin Isl<strong>and</strong>s .... 11 14 48 57 59 63 64<br />
Middle America ............... 21589 25946 30902 33528 36356 42356 48060<br />
Belize ...................... 29 42 59 71 82 99 98<br />
Costa Rica .................. 576 793 1048 1171 1294 1509 1628<br />
EI Salvador ................. 1226 1558 2131 2469 2835 3591 4175<br />
Guatemala .................. 2102 2673 3409 3860 4337 5267 5990<br />
Honduras ................... 1143 1447 1820 2066 2317 2835 3369<br />
Mexico ...................... 15258 17911 20607 21886 23305 26516 29951<br />
Nicaragua ................... 712 863 1040 1 155 1276 1522 1758<br />
Panama .................... 514 636 763 823 881 988 1064<br />
Canal Zone ................ 29 23 25 27 29 29 27<br />
Temperate South America ....... 8962 8402 7984 7687 7407 6860 6338<br />
Argentina ................... 5945 5439 5132 4948 4764 4371 3986<br />
Chile ....................... 2533 2440 2321 2209 2119 1989 1895<br />
Falkl<strong>and</strong> Isl<strong>and</strong>s (Malvinas) .... 2 2 2 2 2 2 2<br />
Uruguay .................... 482 521 529 528 522 498 455<br />
Tropical South America ......... 54740 62134 68264 70580 72915 77 863 83553<br />
Bolivia .. , .... " ............. 2405 2874 3436 3769 4132 4835 5437<br />
Brazil ...................... 33837 38543 41951 43109 44217 46486 49480<br />
Colombia ................... 7355 8240 8866 8944 9003 9222 9685<br />
Ecuador .................... 2313 2838 3647 4119 4596 5516 6209<br />
French Guiana ............... 12 12 17 19 21 24 25<br />
Guyana ..................... 297 412 544 618 691 823 880<br />
Paraguay •••••••••••• .o •••••• 897 1143 1448 1644 1857 2274 2566<br />
Peru •• .o • .o •••••••• .o •••• .o •••• 5104 5368 5643 5707 5769 5980 6429<br />
Suriname .................... 114 153 201 233 271 361 415<br />
'venezuela .................. 2406 2551 2511 2418 2358 2342 2427<br />
Northern America ................ 60054 65381 66896 66340 65552 62743 57000<br />
Bermuda ......................<br />
Canada ....................... 5382 5569 5212 5012 4881 4630 4321<br />
Greenl<strong>and</strong> ••• .o ••••• .o.o •• .o •••••• 5 8 13 15 16 17 17<br />
St. Pierre <strong>and</strong> Miquelon ......... 1 1 1 1 1 1 1<br />
United States <strong>of</strong> America ........ 54666 59803 61670 61312 60654 58095 52661<br />
East Asia ....................... 562008 593246 661713 697437 728292 757036 747621<br />
China ••••••• .o •• .o ••• .o.o.o ••• .o ••• 496797 532772 605130 643448 676957 710749 704774<br />
Japan • .o •••• .o ••• .o •• .o •••••••••• 41648 35384 29945 27696 25576 21545 18801<br />
Other East Asia ................ 23563 25090 26638 26293 25759 24742 24046<br />
Democratic People's Republic<br />
<strong>of</strong> Korea .................. 6716 6295 6935 7122 7226 7364 7451<br />
Hong Kong .................. 227 336 408 425 437 444 415<br />
Macao ...................... 6 8 7 6 5 4 4<br />
Mongolia • .o • .o • .o ••••••••••••• 605 599 689 759 827 940 992<br />
Republic <strong>of</strong> Korea ..........•. 16009 17852 18599 17981 17264 15990 15 184<br />
South Asia ...................... 565336 678453 844886 940033 1046859 1256031 1397199<br />
156
Major area, region <strong>and</strong> countrr<br />
South Asia (continued)<br />
Eastern South Asia .<br />
Brunei .<br />
Burma ..<br />
Democratic Kampuchea .<br />
East Timor .<br />
Indonesia ..<br />
Lao People's Democratic<br />
Republic .<br />
Malaysia .<br />
Philippines .<br />
Singapore .<br />
Thail<strong>and</strong> ..<br />
Viet Nam .<br />
Middle South Asia .<br />
Afghanistan .<br />
Bangladesh .<br />
Bhutan .<br />
India ..<br />
Iran ..<br />
Maldives .<br />
Nepal .<br />
Pakistan .<br />
Sri Lanka .<br />
Western South Asia .<br />
Bahrain ..<br />
Democratic Yemen .<br />
Gaza Strip ..<br />
Iraq .<br />
Jordan .<br />
Kuwait .<br />
Lebanon .<br />
Oman .<br />
Qatar .<br />
Saudi Arabia .<br />
Syrian Arab Republic .<br />
United Arab Emirates .<br />
yemen .<br />
Europe .<br />
Eastern Europe .<br />
Bulgaria ..<br />
Czechoslovakia ..<br />
German Democratic Republic ..<br />
Hungary .<br />
Pol<strong>and</strong> .<br />
Romania ..<br />
Northern Europe .<br />
Channel Isl<strong>and</strong>s .<br />
Denmark .<br />
Faeroe Isl<strong>and</strong>s .<br />
Finl<strong>and</strong> .<br />
Icel<strong>and</strong> .<br />
Irel<strong>and</strong> .<br />
Isle <strong>of</strong> Man .<br />
Norway .<br />
Sweden ..<br />
United Kingdom .<br />
Southern Europee .<br />
Albania .<br />
Andorra .<br />
Cyprus ..<br />
Gibraltar .<br />
Greece ..<br />
Holy See , .<br />
Israel ..<br />
Italy ...............•.......<br />
Malta .<br />
Portugal .<br />
1950<br />
147533<br />
34<br />
15415<br />
3738<br />
390<br />
66087<br />
1808<br />
4927<br />
15293<br />
207<br />
17 914<br />
21720<br />
401114<br />
10984<br />
39251<br />
711<br />
293417<br />
12226<br />
73<br />
7817<br />
30063<br />
6572<br />
16689<br />
27<br />
737<br />
98<br />
3361<br />
808<br />
62<br />
1036<br />
381<br />
17<br />
4114<br />
2424<br />
71<br />
3553<br />
191926<br />
51792<br />
5395<br />
7755<br />
5374<br />
5898<br />
15218<br />
12152<br />
18611<br />
61<br />
1367<br />
26<br />
2726<br />
37<br />
1750<br />
26<br />
2214<br />
2396<br />
8008<br />
77350<br />
990<br />
6<br />
347<br />
4746<br />
445<br />
21367<br />
121<br />
6786<br />
TABLE 49. (continued)<br />
(Thous<strong>and</strong>s)<br />
1960<br />
178972<br />
51<br />
17967<br />
4790<br />
450<br />
79179<br />
2193<br />
5914<br />
19211<br />
366<br />
23090<br />
25761<br />
480609<br />
12638<br />
48797<br />
832<br />
351227<br />
14305<br />
82<br />
8895<br />
35716<br />
8117<br />
18872<br />
35<br />
799<br />
119<br />
3910<br />
971<br />
77<br />
1033<br />
477<br />
16<br />
4202<br />
2884<br />
71<br />
4278<br />
189318<br />
50386<br />
4834<br />
7244<br />
4784<br />
5994<br />
15402<br />
12128<br />
17 643<br />
67<br />
1206<br />
28<br />
2743<br />
35<br />
1535<br />
22<br />
2431<br />
2051<br />
7525<br />
79861<br />
1138 8<br />
369<br />
4756<br />
487<br />
20411<br />
99<br />
6837<br />
157<br />
1970<br />
226330<br />
51<br />
21411<br />
6234<br />
542<br />
99072<br />
2677<br />
7643<br />
25217<br />
513<br />
31020<br />
31950<br />
597626<br />
15105<br />
62542<br />
1013<br />
436138<br />
16758<br />
96<br />
10792<br />
45404<br />
9778<br />
20930<br />
47<br />
975<br />
90<br />
3895<br />
1149<br />
179<br />
942<br />
624<br />
16<br />
3973<br />
3539<br />
81<br />
5420<br />
179534<br />
48114<br />
4050<br />
6429<br />
4482<br />
5620<br />
15548<br />
11985<br />
15037<br />
78<br />
1000<br />
28<br />
2291<br />
31<br />
1426<br />
25<br />
2251<br />
1518<br />
6389<br />
78424<br />
1442<br />
19<br />
375<br />
4177<br />
468<br />
19044<br />
73<br />
6366<br />
1975<br />
254604<br />
44<br />
23495<br />
7085<br />
602<br />
110965<br />
2927<br />
8722<br />
29193<br />
583<br />
36375<br />
34613<br />
663583<br />
16769<br />
66908<br />
1133<br />
486040<br />
17964<br />
106<br />
12022<br />
52014<br />
10 627<br />
21846<br />
55<br />
1090<br />
77<br />
3795<br />
1265<br />
176<br />
867<br />
719<br />
15<br />
3705<br />
3866<br />
77<br />
6139<br />
173563<br />
46481<br />
3645<br />
6044<br />
4248<br />
5257<br />
15491<br />
11796<br />
13671<br />
83<br />
898<br />
28<br />
2020<br />
29<br />
1418<br />
26<br />
2109<br />
1276<br />
5784<br />
77190<br />
1615<br />
23<br />
381<br />
3802<br />
445<br />
18214<br />
63<br />
6291<br />
1980<br />
284991<br />
38<br />
25635<br />
8100<br />
673<br />
123576<br />
3221<br />
9888<br />
33301<br />
632<br />
42363<br />
37564<br />
738849<br />
18655<br />
75272<br />
1275<br />
539785<br />
19283<br />
118<br />
13523<br />
59581<br />
11357<br />
23019<br />
65<br />
1216<br />
69<br />
3731<br />
1389<br />
168<br />
811<br />
832<br />
15<br />
3456<br />
4246<br />
73<br />
6948<br />
167229<br />
44619<br />
3266<br />
5660<br />
3996<br />
4888<br />
15325<br />
11484<br />
12463<br />
86<br />
807<br />
28<br />
1774<br />
27<br />
1393<br />
27<br />
1956<br />
1091<br />
5274<br />
75939<br />
1788<br />
25<br />
383<br />
3457<br />
425<br />
17271<br />
56<br />
6215<br />
1990<br />
344 187<br />
31<br />
29769<br />
10278<br />
819<br />
147099<br />
3807<br />
12016<br />
40921<br />
706<br />
55102<br />
43639<br />
885687<br />
22688<br />
94502<br />
1610<br />
640214<br />
21735<br />
145<br />
17 103<br />
75250<br />
12440<br />
26157<br />
82<br />
1476<br />
64<br />
3752<br />
1635<br />
157<br />
773<br />
1101<br />
16<br />
3197<br />
5047<br />
70<br />
8787<br />
154551<br />
40201<br />
2654<br />
4895<br />
3496<br />
4128<br />
14379<br />
10649<br />
10 537<br />
89<br />
664<br />
27<br />
1388<br />
24<br />
1321<br />
27<br />
1666<br />
846<br />
4485<br />
73264<br />
2068<br />
31<br />
383<br />
2873<br />
391<br />
15263<br />
44<br />
5985<br />
2000<br />
383949<br />
28<br />
32460<br />
12070<br />
940<br />
160895<br />
4286<br />
12882<br />
45719<br />
673<br />
65768<br />
48228<br />
983190<br />
26392<br />
112252<br />
1978<br />
698741<br />
23455<br />
171<br />
20921<br />
86601<br />
12679<br />
30060<br />
94<br />
1686<br />
69<br />
4079<br />
1845<br />
177<br />
822<br />
1391<br />
17<br />
3383<br />
5719<br />
76<br />
10702<br />
141 548<br />
35749<br />
2294<br />
4294<br />
3017<br />
3511<br />
12856<br />
9777<br />
9203<br />
84<br />
567<br />
25<br />
1147<br />
22<br />
1219<br />
25<br />
1444<br />
727<br />
3943<br />
69683<br />
2146<br />
37<br />
341<br />
2452<br />
375<br />
13313<br />
36<br />
5512
TABLB 49. (continued)<br />
(Thous<strong>and</strong>s)<br />
Major area, resion <strong>and</strong> country 1950 1960 1970 1975 1980 1990 2000<br />
Southern Burope- (continued)<br />
San Marino ..................<br />
Spain .......................<br />
2<br />
13415<br />
1<br />
13162<br />
1<br />
11472<br />
1<br />
10455<br />
1<br />
9575<br />
1<br />
8255<br />
1<br />
7472<br />
Turkey .,<br />
0 0 •••••••••••••••••• 16368<br />
19328 21696 22776 23881 25972 27106<br />
Yugoslavia .................. 12757 13 265 13291 13 124 12862 12008 10892<br />
Western Europe ................<br />
Austria .....................<br />
44173<br />
3528<br />
41428<br />
3528<br />
37959<br />
3594<br />
36221<br />
3568<br />
34208<br />
3498<br />
30549<br />
3254<br />
26913<br />
2879<br />
Belgium .....................<br />
France .....................<br />
Germany, Federal Republic <strong>of</strong> ..<br />
Liechtenstein ................<br />
Luxembourg ................<br />
Monaco ....................<br />
Netherl<strong>and</strong>s .................<br />
Switzerl<strong>and</strong> ..................<br />
Oceania .........................<br />
Australia <strong>and</strong> New Zeal<strong>and</strong> ......<br />
Australia ....................<br />
New Zeal<strong>and</strong> ................<br />
3164<br />
18296<br />
13 852<br />
11<br />
121<br />
2587<br />
2614<br />
4893<br />
2562<br />
2038<br />
524<br />
3 111<br />
17184<br />
12549<br />
13<br />
119<br />
2298<br />
2626<br />
5321<br />
2569<br />
2000<br />
569<br />
2828<br />
14359<br />
11331<br />
17<br />
109<br />
2867<br />
2854<br />
5638<br />
2393<br />
1860<br />
533<br />
2813<br />
13 210<br />
10431<br />
17<br />
90<br />
3223<br />
2869<br />
5667<br />
2283<br />
1770<br />
513<br />
2780<br />
12162<br />
9510<br />
18<br />
75<br />
3343<br />
2822<br />
5643<br />
2192<br />
1695<br />
497<br />
2596<br />
10359<br />
8145<br />
19<br />
55<br />
3503<br />
2618<br />
5508<br />
2041<br />
1573<br />
468<br />
2276<br />
9097<br />
7057<br />
19<br />
45<br />
3219<br />
2321<br />
5557<br />
1936<br />
1491<br />
445<br />
Melanesia .....................<br />
New Caledonia ..............<br />
New Hebrides ...............<br />
Norfolk Isl<strong>and</strong> ...............<br />
Papua New Guinea ...........<br />
Solomon Isl<strong>and</strong>s ..............<br />
1799<br />
41<br />
52<br />
1<br />
1602<br />
103<br />
2105<br />
49<br />
65<br />
1<br />
1869<br />
121<br />
2467<br />
56<br />
84<br />
2<br />
2177<br />
148<br />
2546<br />
56<br />
96<br />
2<br />
2234<br />
158<br />
2554<br />
55<br />
111<br />
2<br />
2220<br />
166<br />
2468<br />
56<br />
148<br />
2<br />
2088<br />
174<br />
2562<br />
59<br />
190<br />
2<br />
2124<br />
187<br />
Micronesia <strong>and</strong> Polynesia ........<br />
Micronesia ..................<br />
Gilbert Isl<strong>and</strong>s <strong>and</strong> Tuvalu ...<br />
Guam ....................<br />
Nauru ....................<br />
Niue Isl<strong>and</strong> ......... " .....<br />
Pacific Isl<strong>and</strong>s .............<br />
Polynesia ...................<br />
American Samoa ...........<br />
Cook Isl<strong>and</strong>s ..............<br />
Fiji ......................<br />
French Polynesia ...........<br />
Samoa ....................<br />
Tonga ....................<br />
Wallis <strong>and</strong> Futuna Isl<strong>and</strong>s ....<br />
USSR ••••••••••• ••••••• 0 •••••••<br />
532<br />
133<br />
34<br />
45<br />
4<br />
3<br />
47<br />
399<br />
12<br />
10<br />
219<br />
43<br />
68<br />
40<br />
7<br />
109310<br />
647<br />
154<br />
39<br />
51<br />
5<br />
3<br />
56<br />
493<br />
13<br />
12<br />
277<br />
47<br />
87<br />
50<br />
7<br />
109742<br />
778<br />
178<br />
42<br />
66<br />
7<br />
4<br />
59<br />
600<br />
16<br />
15<br />
335<br />
48<br />
112<br />
65<br />
9<br />
105 124<br />
838<br />
190<br />
45<br />
73<br />
8<br />
4<br />
60<br />
648<br />
18<br />
18<br />
353<br />
48<br />
129<br />
73<br />
9<br />
99722<br />
897<br />
203<br />
48<br />
82<br />
8<br />
5<br />
60<br />
694<br />
21<br />
20<br />
367<br />
47<br />
149<br />
81<br />
9<br />
94452<br />
999<br />
225<br />
50<br />
101<br />
9<br />
5<br />
60<br />
774<br />
25<br />
27<br />
376<br />
48<br />
191<br />
98<br />
9<br />
84376<br />
1059<br />
241<br />
53<br />
112<br />
10<br />
5<br />
61<br />
818<br />
28<br />
. 31<br />
366<br />
51<br />
223<br />
110<br />
9<br />
75413<br />
R Including Cyprus, Israel <strong>and</strong> Turkey, which are currently included in the region <strong>of</strong> Western South Asia.<br />
158
TABLE 50. PERCENTAGE URBAN, MAJOR AREAS, REGIONS AND COUNTRIES, 1950·2000<br />
Ma/or Mea, rerlon <strong>and</strong> country 1950 1960 1970 1975 1980 1990 1000<br />
World total ......................... 28.95 33.89 37.51 39.34 41.31 45.88 51.29<br />
Africa ........................... 14.54 18.15 22.85 25.67 28.85 35.70 42.49<br />
Eastern Africa .................. 5.50 7.54 10.69 13.20 16.14 22.72 29.41<br />
British Indian Ocean Territory ....<br />
Burundi ....................... 2.22 2.20 2.21 2.20 2.29 2.83 4.13<br />
Comoros ...................... 3.26 5.02 7.78 9.48 11.53 16.82 22.95<br />
Djibouti ...................... 40.54 49.38 62.11 68.87 73.95 80.92 84.49<br />
Ethiopia ...................... 4.56 6.41 9.31 11.70 14.47 21.02 28.21<br />
Kenya ........................ 5.58 7.36 10.18 12.01 14.17 19.52 26.19<br />
Madagascar ................... 7.81 10.60 14.09 16.08 18.42 24.22 31.46<br />
Malawi ....................... 3.53 4.37 9.33 19.63 33.60 58.49 68.02<br />
Mauritius ..................... 28.81 33.23 41.99 47.27 52.22 60.92 67.30<br />
Mozambique .................. 2.37 3.66 5.68 7.06 8.68 12.83 18.13<br />
Reunion ...................... 23.36 32.84 43.85 49.50 54.93 63.85 69.95<br />
Rw<strong>and</strong>a ...................... 1.78 2.41 3.18 3.67 4.30 6.04 8.83<br />
Seychelles ..................... 27.78 26.19 26.92 27.12 27.27 31.33 38.24<br />
Somalia ....................... 12.71 17.30 23.13 26.47 30.15 38.13 46.18<br />
Southern Rhodesia .............. 10.63 12.61 16.92 19.76 22.96 30.25 38.17<br />
Ug<strong>and</strong>a ....................... 3.42 5.24 7.98 9.79 11.93 17.18 23.53<br />
United Republic <strong>of</strong> Tanzania ..... 3.61 4.81 6.93 9.16 11.80 18.15 24.98<br />
Zambia ...................... 17.31 23.05 30.Q3 33.93 38.04 46.39 54.12<br />
Middle Africa .................... 14.57 18.10 25.16 29.66 34.37 43.65 51.56<br />
Angola ....................... 7.58 10.44 14.96 17.79 21.00 28.30 36.17<br />
Central African Empire ......... 15.98 22.70 31.14 35.98 40.87 50.15 57.77<br />
Chad ......................... 4.19 6.96 11.37 14.37 17.80 25.57 33.45<br />
Congo ........................ 31.29 33.02 34.84 35.76 37.27 42.22 49.52<br />
Equatorial Guinea .............. 15.42 25.50 38.95 46.77 53.69 64.63 70.82<br />
Gabon ........................ 11.29 17.48 25.60 30.61 35.71 45.70 53.79<br />
Sao Tome <strong>and</strong> Principe .......... 13.33 15.63 22.97 27.50 32.94 42.05 50.00<br />
United Republic <strong>of</strong> Cameroon .... 9.78 13.87 20.31 27.24 34.57 47.83 56.44<br />
Zaire ......................... 19.10 22.30 30.30 34.85 39.53 48.59 56.30<br />
Northern Africa ................. 24.51 29.77 36.61 40.1Z 43.83 51.39 58.34<br />
Algeria ....................... 22.26 30.44 45.56 53.74 60.85 71.06 76.43<br />
Egypt ........................ 31.92 37.86 42.25 43.54 45.37 50.54 57.36<br />
Libyan Arab Jamahiriya ......... 18.56 22.76 34.26 43.68 52.39' 65.32 71.88<br />
Morocco ...................... 26.19 29.31 34.62 37.43 40.55 47.50 54.88<br />
Sudan ........................ 6.31 10.30 16.38 20.37 24.77 34.03 42.46<br />
Tunisia ....................... 31.25 36.03 43.49 47.62 51.73 59.40 65.83<br />
Western Sahara •••••••••••••• 0. 53.85 56.52 41.67 34.67 34.18 34.83 40.59<br />
Southern Africa ................. 37.27 41.70 43.76 44.81 46.49 51.43 57.90<br />
Botswana ..................... 0.24 1.78 8.43 17.22 29.43 52.89 62.98<br />
Lesotho ...................... 0.91 1.47 2.68 3.48 4.52 7.24 10.71<br />
Namibia ...................... 15.49 23.33 33.68 39.64 45.41 55.61 62.88<br />
South Africa .................. 42.23 46.62 47.82 48.39 49.61 53.90 60.28<br />
Swazil<strong>and</strong> •••••••••• 0 •••••••••• 1.19 4.06 7.58 8.12 8.84 11.48 15.94<br />
Western Africa .................. 10.15 13.48 17.27 19.58 22.29 28.65 35.92<br />
Benin ........................ 6.64 9.51 16.01 23.00 30.81 45.33 54.43<br />
Cape Verde ................... 7.89 6.93 6.34 5.76 5.88 6.60 9.26<br />
Gambia ...................... 10.66 12.53 15.12 16.50 18.47 23.63 30.75<br />
Ghana ....................... 14.47 23.24 29.10 32.34 35.86 43.48 51.23<br />
Guinea ....................... 5.51 9.90 13.85 16.28 19.07 25.63 33.19<br />
Guinea-Bissau ................. 9.98 13.65 18.Q7 20.76 23.73 30.79 38.60<br />
Ivory Coast ...................<br />
Liberia ••••••••••••••••••• 0 •••<br />
Mali .........................<br />
Mauritania ....................<br />
Niger ........................<br />
Nigeria .......................<br />
Senegal .......................<br />
St. Helena .....................<br />
Sierra Leone ...................<br />
Togo ..................... , ...<br />
Upper Volta ...................<br />
13.00<br />
15.76<br />
8.09<br />
0.88<br />
4.85<br />
10.47<br />
21.65<br />
20.00<br />
9.22<br />
7.24<br />
3.24<br />
19.28<br />
20.46<br />
11.05<br />
3.37<br />
5.80<br />
13.14<br />
22.64<br />
20.00<br />
13.01<br />
9.76<br />
4.70<br />
27.66<br />
26.20<br />
14.88<br />
12.82<br />
8.39<br />
16.36<br />
23.69<br />
20.00<br />
18.08<br />
13.11<br />
6.80<br />
32.57<br />
29.45<br />
17.18<br />
23.07<br />
10.28<br />
18.19<br />
24.22<br />
20.00<br />
21.15<br />
15.08<br />
7.53<br />
37.62<br />
32.94<br />
19.85<br />
35.60<br />
12.52<br />
20.40<br />
25.36<br />
20.00<br />
24.56<br />
17.41<br />
8.49<br />
47.31<br />
40.64<br />
26.23<br />
57.05<br />
17.96<br />
26.06<br />
29.59<br />
16.67<br />
32.18<br />
23.18<br />
11.32<br />
55.25<br />
48.56<br />
33.76<br />
66.16<br />
24.49<br />
33.38<br />
36.74<br />
33.33<br />
40.20<br />
30.32<br />
15.83<br />
Latin America ..................... 41.18 49.45 57.37 61.21 64.74 70.70 75.21<br />
Caribbean .......................<br />
Antigua ......................<br />
Bahamas ......................<br />
Barbados .....................<br />
British Virgin Isl<strong>and</strong>s ............<br />
33.51<br />
46.67<br />
70.89<br />
33.65<br />
38.22<br />
40.00<br />
64.60<br />
35.50<br />
45.08<br />
34.29<br />
57.63<br />
37.24<br />
48.62<br />
31.S1<br />
54.41<br />
37.96<br />
52.15<br />
30.67<br />
54.35<br />
39.29<br />
58.74<br />
32.50<br />
55.00<br />
44.24<br />
64.62<br />
38.82<br />
60.61<br />
51.23<br />
159
TABLE 50. (continued)<br />
Major area, region <strong>and</strong> country 1950 1960 1970 1975 1980 1990 2000<br />
Caribbean (continued)<br />
Cayman Isl<strong>and</strong>s ................ 100.00 100.00 100.00 100.00 100.00 100.00 100.00<br />
Cuba ......................... 49.39 54.85 60.20 62.80 65.42 70.55 75.21<br />
Dominica .....................<br />
Dominican Republic ............ 23.74 30.22 40.32 45.76 50.97 60.02 66.60<br />
Grenada ......................<br />
Guadeloupe ................... 42.23 39.19 40.55 41.81 43.46 48.41 55.38<br />
Haiti ......................... 12.17 15.59 19.76 22.14 24.90 31.49 39.25<br />
Jamaica ....................... 26.73 33.76 41.60 45.69 49.82 57.59 64.23<br />
Martinique .................... 27.93 39.93 53.85 60.61 66.50 74.72 79.38<br />
Montserrat .................... 21.43 16.67 8.33 7.69 7.69 7.14 14.29<br />
Netherl<strong>and</strong>s Antilles ............ 49.38 67.71 81.98 86.78 90.26 93.66 94.86<br />
Puerto Rico ....... , ........... 40.60 44.54 58.44 65.02 70.47 78.05 82.06<br />
S1. Kitts-Nevis-Anguilla ......... 22.45 28.07 33.85 37.88 41.79 48.53 55.71<br />
S1. Lucia ......................<br />
St. Vincent ....................<br />
Trinidad <strong>and</strong> Tobago ............ 22.94 22.18 21.47 21.11 21.47 24.49 31.02<br />
Turks <strong>and</strong> Caicos Isl<strong>and</strong>s ........ 33.33 33.33 33.33 33.33 33.33 50.00 50.00<br />
United States Virgin Isl<strong>and</strong>s ...... 59.26 56.25 23.81 13.64 13.24 13.70 15.79<br />
Middle America .................. 39.75 46.71 53.88 57.37 60.75 66.95 72.17<br />
Belize ........................ 56.72 54.35 50.83 49.29 49.38 51.71 58.12<br />
Costa Rica .................... 33.49 36.56 39.67 41.27 43.39 48.92 55.94<br />
EI Salvador ................... 36.51 38.35 39.39 39.90 41.10 45.55 52.57<br />
Guatemala .................... 30.47 33.01 35.65 37.02 38.92 44.32 51.59<br />
Honduras ..................... 17.77 22.74 28.71 31.97 35.55 43.27 51.04<br />
Mexico ....................... 42.65 50.75 59.04 63.03 66.69 72.83 77.35<br />
Nicaragua ..................... 35.80 41.37 47.21 50.17 53.31 59.71 65.89<br />
Panama ....................... 35.75 41.22 47.67 50.95 54.35 60.99 67.06<br />
Canal Zone .................. 30.95 34.29 35.90 37.21 38.30 45.28 50.91<br />
Temperate South America ......... 64.77 72.74 77.87 80.16 82.18 85.45 87.83<br />
Argentina ..................... 65.34 73.61 78.39 80.51 82.40 85.52 87.87<br />
Chile ......................... 58.41 67.83 75.23 78.46 81.14 85.13 87.66<br />
Falkl<strong>and</strong> Isl<strong>and</strong>s (Malvinas) ......<br />
Uruguay ...................... 78.03 80.14 82.10 83.01 84.00 86.10 88.22<br />
Tropical South America ........... 36.29 46.36 56.05 60.70 64.85 71.52 76.17<br />
Bolivia ....................... 20.34 24.01 28.12 30.33 32.94 39.37 47.04<br />
Brazil .. , ..................... 36.04 46.12 55.94 60.71 65.02 71.96 76.72<br />
Colombia ... , .... ,' .. ,., .. , ... 37.08 48.19 59.84 65.45 70.20 77.13 81.18<br />
Ecuador ., .................... 28.26 34.43 39.53 41.90 44.65 50.97 57.97<br />
French Guiana ................ 52.00 63.64 66.67 68.33 70.42 74.47 78.81<br />
Guyana ....................... 29.79 26.43 23.27 21.87 21.83 23.80 29.94<br />
Paraguay ..................... 34.57 35.57 37.07 37.89 39.35 44.18 51.35<br />
Peru .,.'., ................... 35.51 46.28 57.40 62.76 67.43 74.53 78.96<br />
Suriname ..................... 46.98 47.24 45.82 44.79 44.81 47.53 54.09<br />
Venezuela ..................... 53.24 66.59 76.22 80.20 83.32 87.48 89.70<br />
Northern America .................. 63.84 67.09 70.45 71.99 73.66 77.20 80.76<br />
Bermuda ........................ 100.00 100.00 100.00 100.00 100.00 100.00 100.00<br />
Canada .. , ...................... 60.82 68.90 75.65 78.02 80.14 83.67 86.33<br />
Greenl<strong>and</strong> ....................... 78.26 75.76 72.34 72.22 72.88 74.63 77.33<br />
St. Pierre <strong>and</strong> Miquelon .......... 80.00 80.00 80.00 80.00 80.00 80.00 80.00<br />
United States <strong>of</strong> America .......... 64.10 66.90 69.90 71.34 72.94 76.45 80.09<br />
East Asia ......................... 16.72 24.71 28.61 30.70 33.05 38.63 45.43<br />
China .......................... 11.00 18.60 21.60 23.29 25.41 31.07 38.61<br />
Japan , ......................... 50.20 62.40 71.30 75.08 78.24 82.93 85.86<br />
Other East Asia .................. 28.61 36.31 47.46 53.43 58.85 67.51 73.03<br />
Democratic People's Republic <strong>of</strong><br />
Korea ...................... 31.05 40.20 50.08 55.07 59.69 67.39 72.86<br />
Hong Kong ................... 88.50 89.Q7 89.65 89.94 90.34 91.37 92.62<br />
Macao ....................... 96.81 95.27 97.18 97.79 98.29 98.80 98.92<br />
Mongolia ..................... 19.01 35.66 44.79 47.51 50.45 56.80 63.27<br />
Republic <strong>of</strong> Korea .............. 21.35 27.71 40.70 48.13 54.79 65.17 71.35<br />
South Asia ........................ 15.65 17.80 20.45 22.02 23.95 29.10 36.13<br />
Eastern South Asia ............... 14.83 17.52 20.02 21.38 23.15 28.10 35.10<br />
Brunei ........................ 26.09 43.33 61.65 70.07 76.25 83.60 87.04<br />
Burma ........................ 16.13 19.26 22.84 24.79 27.16 33.21 40.88<br />
Democratic Kampuchea ......... 10.21 10.70 11.70 12.64 13.91 17.72 23.70<br />
East Timor .................... 9.93 10.00 10.26 10.42 10.86 13.15 17.90<br />
Indonesia ..................... 12.41 14.59 17.07 18.43 20.21 25.17 32.26<br />
160
Major area, region <strong>and</strong> country<br />
Eastern South Asia (continued)<br />
Lao People's Democratic Republic<br />
Malaysia .<br />
Philippines .<br />
Singapore .<br />
Thail<strong>and</strong> .<br />
Viet Nam .<br />
Middle South Asia .<br />
Afghanistan .<br />
Bangladesh .<br />
Bhutan .<br />
India .<br />
Iran '" .<br />
Maldives .<br />
Nepal .<br />
Pakistan .<br />
Sri Lanka .<br />
Western South Asia .<br />
Bahrain .<br />
Democratic Yemen .<br />
Gaza Strip .<br />
Iraq " .<br />
Jordan , , .<br />
Kuwait .<br />
Lebanon , ., .<br />
Oman '" .<br />
Qatar , ..<br />
Saudi Arabia .<br />
Syrian Arab Republic .<br />
United Arab Emirates .<br />
yemen .<br />
Europe .<br />
Eastern Europe .<br />
Bulgaria .<br />
Czechoslovakia .<br />
German Democratic Republic .<br />
Hungary .<br />
Pol<strong>and</strong> .<br />
Romania .<br />
Northern Europe .<br />
Channel Isl<strong>and</strong>s .<br />
Denmark .<br />
Faeroe Isl<strong>and</strong>s .<br />
Finl<strong>and</strong> '" .<br />
Icel<strong>and</strong> .<br />
Irel<strong>and</strong> .<br />
Isle <strong>of</strong> Man .. , .<br />
Norway .<br />
Sweden .<br />
United Kingdom .<br />
Southern Europe» .<br />
Albania .<br />
Andorra .<br />
Cyprus .<br />
Gibraltar .<br />
Greece .<br />
Holy See .<br />
Israel<br />
Italy .<br />
Malta .<br />
Portugal .<br />
San Marino .<br />
Spain .<br />
Turkey .<br />
Yugoslavia .<br />
Western Europe .<br />
Austria .<br />
Belgium .<br />
France .<br />
1950<br />
7.23<br />
20.37<br />
27.13<br />
79.75<br />
10.47<br />
11.71<br />
15.59<br />
5.80<br />
4.35<br />
2.07<br />
16.80<br />
27.71<br />
10.98<br />
2.29<br />
17.52<br />
14.40<br />
23.38<br />
78.74<br />
18.74<br />
50.51<br />
35.12<br />
34.68<br />
59.21<br />
28.21<br />
2.31<br />
63.83<br />
15.87<br />
30.64<br />
24.47<br />
1.91<br />
53.70<br />
41.48<br />
25.60<br />
37.40<br />
70.77<br />
36.84<br />
38.70<br />
25.50<br />
74.32<br />
41.35<br />
67.99<br />
16.13<br />
32.00<br />
74.13<br />
41.06<br />
52.73<br />
32.19<br />
65.84<br />
84.18<br />
41.01<br />
20.35<br />
29.76<br />
100.00<br />
37.27<br />
100.00<br />
64.63<br />
21.96<br />
54.31<br />
61.22<br />
19.26<br />
84.62<br />
51.86<br />
21.34<br />
63.92<br />
49.13<br />
63.38<br />
56.16<br />
TABLE 50. (continued)<br />
1960<br />
7.93<br />
25.21<br />
30.30<br />
77.60<br />
12.51<br />
14.70<br />
17.19<br />
7.99<br />
5.15<br />
2.46<br />
17.90<br />
33.63<br />
10.87<br />
3.10<br />
22.10<br />
17.92<br />
32.52<br />
78.40<br />
27.95<br />
68.44<br />
42.89<br />
42.71<br />
72.30<br />
44.37<br />
3.44<br />
72.88<br />
29.72<br />
36.77<br />
40.34<br />
3.41<br />
58.42<br />
47.90<br />
38.55<br />
46.95<br />
72.25<br />
39.96<br />
47.90<br />
34.10<br />
76.73<br />
39.09<br />
73.67<br />
20.00<br />
38.08<br />
80.11<br />
45.84<br />
54.17<br />
32.11<br />
72.58<br />
85.68<br />
46.15<br />
30.61<br />
35.60<br />
100.00<br />
42.88<br />
100.00<br />
76.96<br />
27.92<br />
59.36<br />
69.91<br />
22.54<br />
93.33<br />
56.57<br />
29.74<br />
69.20<br />
49.94<br />
66.01<br />
62.39<br />
161<br />
1970<br />
9.62<br />
26.97<br />
32.94<br />
75.28<br />
13.22<br />
18.30<br />
19.40<br />
11.03<br />
7.61<br />
3.06<br />
19.70<br />
40.91<br />
11.11<br />
3.92<br />
24.89<br />
21.86<br />
44.48<br />
78.14<br />
32.10<br />
87.04<br />
58.37<br />
49.61<br />
76.45<br />
61.85<br />
5.02<br />
79.75<br />
48.67<br />
43.35<br />
57.37<br />
6.02<br />
63.94<br />
53.26<br />
52.30<br />
55.16<br />
73.72<br />
45.64<br />
52.12<br />
40.80<br />
81.28<br />
36.07<br />
79.71<br />
28.21<br />
50.26<br />
84.80<br />
51.73<br />
55.36<br />
41.94<br />
81.13<br />
88.48<br />
52.90<br />
33.52<br />
40.76<br />
100.00<br />
52.50<br />
100.00<br />
84.18<br />
34.76<br />
64.45<br />
77.61<br />
26.22<br />
94.74<br />
66.04<br />
38.42<br />
74.38<br />
51.74<br />
70.66<br />
71.66<br />
1975<br />
11.38<br />
27.88<br />
34.30<br />
74.07<br />
13.58<br />
20.34<br />
20.77<br />
13.02<br />
9.27<br />
3.41<br />
20.74<br />
45.44<br />
10.92<br />
4.37<br />
26.28<br />
24.02<br />
50.56<br />
78.09<br />
34.34<br />
87.04<br />
65.71<br />
52.94<br />
83.78<br />
69.78<br />
6.14<br />
83.70<br />
58.68<br />
46.74<br />
65.32<br />
7.93<br />
66.43<br />
56.26<br />
58.55<br />
59.14<br />
75.20<br />
50.09<br />
54.22<br />
44.30<br />
83.32<br />
35.16<br />
82.13<br />
30.00<br />
56.58<br />
86.57<br />
54.71<br />
55.17<br />
47.37<br />
84.61<br />
89.75<br />
56.22<br />
34.93<br />
43.39<br />
100.00<br />
57.42<br />
100.00<br />
86.98<br />
66.90<br />
80.85<br />
28.20<br />
95.00<br />
70.49<br />
42.89<br />
38.45<br />
76.25<br />
52.67<br />
71.43<br />
75.03<br />
1980<br />
13.44<br />
29.36<br />
36.21<br />
74.07<br />
14.37<br />
22.76<br />
22.53<br />
15.35<br />
11.24<br />
3.92<br />
22.26<br />
49.90<br />
10.61<br />
4.98<br />
28.17<br />
26.56<br />
55.75<br />
77.89<br />
36.93<br />
90.24<br />
71.62<br />
56.28<br />
88.33<br />
75.86<br />
7.35<br />
86.11<br />
66.84<br />
50.26<br />
71.92<br />
10.24<br />
68.83<br />
59.31<br />
64.01<br />
62.89<br />
76.81<br />
54.41<br />
56.61<br />
47.93<br />
85.12<br />
35.34<br />
84.19<br />
31.71<br />
62.J6<br />
88.21<br />
57.76<br />
55.00<br />
52.54<br />
87.23<br />
90.83<br />
59.41<br />
36.84<br />
46.36<br />
100.00<br />
61.93<br />
100.00<br />
89.10<br />
69.33<br />
83.28<br />
30.61<br />
95.24<br />
74.27<br />
47.36<br />
42.32<br />
78.08<br />
54.14<br />
72.37<br />
77.93<br />
1990<br />
18.62<br />
34.19<br />
41.64<br />
75.04<br />
17.45<br />
28.81<br />
27.48<br />
21.06<br />
16.14<br />
5.35<br />
26.92<br />
58.12<br />
12.12<br />
6.79<br />
33.55<br />
32.87<br />
63.49<br />
79.65<br />
43.25<br />
93.59<br />
79.47<br />
62.82<br />
92.96<br />
83.33<br />
10.56<br />
89.19<br />
77.32<br />
57.31<br />
80.34<br />
15.87<br />
73.25<br />
65.23<br />
72.22<br />
69.40<br />
80.06<br />
62.15<br />
61.98<br />
55.24<br />
87.95<br />
37.76<br />
87.32<br />
38.64<br />
70.68<br />
90.63<br />
63.89<br />
58.46<br />
61.38<br />
90.58<br />
92.52<br />
65.26<br />
42.30<br />
52.84<br />
100.00<br />
69.34<br />
100.00<br />
91.84<br />
73.99<br />
87.10<br />
36.75<br />
95.65<br />
79.89<br />
55.72<br />
50.19<br />
81.36<br />
58.58<br />
75.19<br />
82.39<br />
2000<br />
25.14<br />
41.59<br />
49.04<br />
78.47<br />
23.18<br />
36.38<br />
34.48<br />
28.00<br />
22.23<br />
7.79<br />
34.05<br />
64.78<br />
16.59<br />
9.81<br />
41.06<br />
40.58<br />
68.50<br />
82.46<br />
50.77<br />
94.88<br />
83.31<br />
68.67<br />
94.44<br />
86.56<br />
15.13<br />
91.37<br />
81.81<br />
63.86<br />
83.97<br />
22.18<br />
77.11<br />
70.56<br />
77.14<br />
74.43<br />
83.18<br />
68.28<br />
67.74<br />
62.04<br />
89.92<br />
44.74<br />
89.42<br />
46.81<br />
75.84<br />
92.09<br />
69.54<br />
63.24<br />
67.79<br />
92.26<br />
93.72<br />
70.31<br />
49.66<br />
59.69<br />
100.00<br />
74.51<br />
100.00<br />
93.26<br />
78.13<br />
89.29<br />
44.42<br />
96.00<br />
83.37<br />
62.66<br />
57.54<br />
84.27<br />
64.54<br />
78.89<br />
85.36
TABLE 50. (continued)<br />
Major area, region <strong>and</strong> country 1950 1960 1970 1975 1980 1990 2000<br />
Western Europe (continued)<br />
Federal Republic <strong>of</strong> Germany .... 72.29 77.36 81.33 83.09 84.67 87.31 89.35<br />
Liechtenstein .................. 21.43 18.75 19.05 22.73 21.74 24.00 32.14<br />
Luxembourg ................... 59.12 62.10 67.85 73.68 78.26 84.29 87.25<br />
Monaco ...................... 100.00 100.00 100.00 100.00 100.00 100.00 100.00<br />
Netherl<strong>and</strong>s ................... 74.42 79.98 78.00 76.30 76.30 76.83 79.89<br />
Switzerl<strong>and</strong> .................... 44.31 51.03 54.46 56.10 58.09 62.93 68.49<br />
Oceania ........................ 61.24 66.22 70.77 73.35 75.93 80.37 82.97<br />
Australia <strong>and</strong> New Zeal<strong>and</strong> ........ 74.70 79.75 84.44 86.44 88.09 90.53 92.10<br />
Australia ...................... 75.20 80.61 85.18 87.18 88.80 91.16 92.64<br />
New Zeal<strong>and</strong> .................. 72.54 76.01 81.10 83.07 84.77 87.53 89.57<br />
Melanesia ....................... 1.53 3.88 10.97 18.55 28.16 46.70 56.18<br />
New Caledonia ................ 28.07 37.97 48.62 55.20 61.81 70.83 76.11<br />
New Hebrides .................<br />
Norfolk Isl<strong>and</strong> ................<br />
Papua New Guinea ............. 0.68 2.66 9.78 17.75 27.97 47.81 57.85<br />
Solomon Isl<strong>and</strong>s ................ 0.96 3.20 9.20 15.51 23.15 39.37 49.32<br />
Micronesia <strong>and</strong> Polynesia .......... 21.09 26.85 33.19 36.76 40.49 47.67 54.50<br />
Micronesia .................... 17.37 22.12 29.59 34.31 38.86 47.32 54.14<br />
Gilbert Isl<strong>and</strong>s <strong>and</strong> Tuvalu .... 10.53 15.22 25.00 31.82 37.66 49.49 56.91<br />
Guam ...................... 23.73 23.88 25.00 26.26 27.43 31.29 39.13<br />
Nauru ......................<br />
Niue ....................... 25.00 25.00 20.00 20.00 16.67 28.57 28.57<br />
Pacific Isl<strong>and</strong>s ............... 17.54 28.21 41.58 48.72 55.56 65.71 72.02<br />
Polynesia ..................... 22.31 28.28 34.25 37.45 40.97 47.77 54.61<br />
American Samoa ............. 36.84 38.10 40.74 43.75 44.74 51.92 58.21<br />
Cook Isl<strong>and</strong>s ................ 28.57 33.33 28.57 28.00 31.03 32.50 40.38<br />
Fiji ........................ 24.22 29.70 35.58 38.82 42.20 49.53 56.79<br />
French Polynesia ............ 28.33 40.51 55.96 62.50 68.87 76.81 81.04<br />
Samoa ...................... 12.82 18.69 20.57 21.34 23.20 28.20 35.36<br />
Tonga ...................... 13.04 18.03 24.42 27.72 31.93 39.88 48.11<br />
Wallis <strong>and</strong> Futuna Isl<strong>and</strong>s .....<br />
USSR ............................ 39.30 48.80 56.70 60.90 64.77 71.28 76.06<br />
a Including Cyprus, Israel <strong>and</strong> Turkey, which are currently included in the region <strong>of</strong> Western South Asia.<br />
162
Annex m. OCCUPATIONAL COMPOSmON OFURBA,N AND RURAL LABOUR FORCE, PERCENTAGE URBAN IN<br />
VARIOUS OCCUPATIONS AND PERCENTAGE FEMALE IN VARIOUS OCCUPATIONS, RURAL AND URBAN<br />
AREAS, BY COUNTRY: TABLES 51-53<br />
TABLE 51. OCCUPATIONAL COMPosmON OF URBAN AND RURAL LABOUR FORCE, BY COUNTRY<br />
P"centage o/labour force In:<br />
Manu/ae- Pro/esslonal<br />
Major area turing <strong>and</strong> <strong>and</strong> Clerical <strong>and</strong> Traditional<br />
<strong>and</strong> country A.grlculture transport administrative sales services Unknown<br />
Africa<br />
Algeria, 1966&<br />
Total ...... , ........ 45.9 21.1 4.0 7.8 8.2 13.1<br />
<strong>Urban</strong> .............. 23.5 28.2 7.3 14.6 13.9 12.4<br />
<strong>Rural</strong> ............... 59.7 16.7 1.9 3.5 4.6 13.5<br />
Central African<br />
Empire, 1960<br />
Total ............... 86.6 2.3 0.7 0.7 0.6 b 9.2 b<br />
<strong>Urban</strong> .............. 74.7 6.6 1.3 2.5 1.9 b 13.0 b<br />
<strong>Rural</strong> ............... 90.1 1.0 0.5 0.2 0.2 b 8.0 b<br />
Guinea, 1955<br />
Total ............... 79.8 3.4 0.4 1.1 0.7 14.6<br />
<strong>Urban</strong> .............. 34.3 16.7 1.7 6.2 3.9 37.1<br />
<strong>Rural</strong> ..............• 83.9 2.2 0.3 0.7 0.4 12.5<br />
Libyan Arab<br />
Jamahiriya, 1964 c d<br />
Total ............... 37.5 25.6 4.4 10.8 10.1 11.6<br />
<strong>Urban</strong> .............. 25.2 32.3 5.1 15.7 13.0 8.7<br />
<strong>Rural</strong> ............... 45.7 21.1 4.0 7.5 8.1 13.6<br />
Morocco, 1951<br />
Total ............... 69.9 19.5 1.7 4.5 2.5 b 1.9 b<br />
<strong>Urban</strong> .............. 5.7 61.7 2.9 14.3 9.2 b 6.1 b<br />
<strong>Rural</strong> ............... 86.2 8.7 1.4 2.0 0.8 b 0.9 b<br />
Morocco, 1960<br />
Total ............... 57.5 15.5 3.5 7.6 6.9 9.0<br />
<strong>Urban</strong> .............. 5.3 36.5 6.7 19.2 17.6 14.7<br />
<strong>Rural</strong> ............... 79.9 6.5 2.1 2.7 2.3 6.5<br />
Morocco, 1971<br />
Total ............... 51.4 19.2 4.6 7.9 8.2 b 8.6 b<br />
<strong>Urban</strong> .............. 4.7 34.8 8.4 17.3 17.7 b 17.2 b<br />
<strong>Rural</strong> ..........'....• 76.9 10.7 2.6 2.8 3.1 b 4.0 b<br />
Sudan, 1956d e t<br />
Total ............... 84.7 6.9 0.5g 4.3g 3.6<br />
<strong>Urban</strong> .............. 15.1 39.4 3.7g 18.6g 23.3<br />
<strong>Rural</strong> .............. 91.0 4.0 0.2g 3.0g 1.8<br />
Tunisia, 1966&<br />
Total ..............• 38.8 36.5 4.7 8.2 5.9 5.9<br />
<strong>Urban</strong> .............. 12.6 46.4 8.6 14.2 10.4 7.9<br />
<strong>Rural</strong> .............. 58.3 29.2 1.8 3.7 2.5 4.4<br />
United Republic <strong>of</strong><br />
Tanzania, 1967d b<br />
Total ............... 90.6 3.8 1.6 1.7 1.8 0.6<br />
<strong>Urban</strong> .............. 12.5 37.6 9.6 19.9 18.1 2.3<br />
<strong>Rural</strong> .............. 92.1 3.1 1.4 1.3 1.5 0.6<br />
Latin America<br />
Bolivia, 1963&<br />
Total ............... 67.1 14.8 5.8 5.8 5.5 1.0<br />
<strong>Urban</strong> .............. 3.6 35.7 21.0 19.6 19.5 0.6<br />
<strong>Rural</strong> .............. 80.5 10.4 2.6 2.9 2.5 1.1<br />
Chile, 1970&<br />
Total ............... 21.1 29.4 9.0 17.7 15.6 7.1<br />
<strong>Urban</strong> .............. 6.3 34.2 11.1 22.2 18.6 7.5<br />
, <strong>Rural</strong> .............. 69.3 13.7 2.2 3.0 5.8 5.9<br />
Costa Rica, 1963&<br />
Total ...•..........• 47.2 19.0 1 6.5 12.8 9.5 1 5.0<br />
<strong>Urban</strong> .............• 6.8 31.5 1 13.0 25.1 17.5 1 6.0<br />
<strong>Rural</strong> .............. 70.9 1l.61 2.7 5.6 4.9 1 4.3<br />
163
TABLE 51. (c.ontinued)<br />
Percentage <strong>of</strong> labourtorce In:<br />
Manuiac- Pr<strong>of</strong>essional<br />
Majorarea turing <strong>and</strong> <strong>and</strong> Clerical <strong>and</strong> Traditional<br />
<strong>and</strong> country Agriculture transport administrative sales services Unknown<br />
Latin America (continued)<br />
Costa Rica, 1973a<br />
Total ...............<br />
<strong>Urban</strong> •• 0 •••• 0 ••••••<br />
<strong>Rural</strong> ..............<br />
35.5<br />
5.1<br />
58.8<br />
24.1<br />
31.8<br />
18.2<br />
9.4<br />
17.2<br />
3.4<br />
13.7<br />
23.2<br />
6.4<br />
11.6<br />
17.5<br />
7.1<br />
5.7<br />
5.2<br />
6.0<br />
Ecuador, 1962a<br />
Total ............... 56.5 20.8 3.4 9.0 6.8 3.5<br />
<strong>Urban</strong> .............. 10.6 37.9 7.4 21.0 14.9 8.1<br />
<strong>Rural</strong> .............. 80.7 11.7 1.2 2.7 2.5 1.1<br />
Ecuador, 1974a<br />
Total .............. 46.0 22.5 6.2 11.6 7.0 6.8<br />
<strong>Urban</strong> .............. 7.5 33.9 11.9 22.4 14.1 10.1<br />
<strong>Rural</strong> •• 0 ••••••••••• 73.6 14.2 2.1 3.8 1.9 4.4<br />
Guatemala, 1973<br />
Total .............. 56.5 20.8 4.7J 8.5 8.0 1.5<br />
<strong>Urban</strong> .............. 20.0 33.3 1O.6J 16.1 17.9 2.1<br />
<strong>Rural</strong> •••••• 0 •• 0' ••• 77.5 13.6 1.3J 4.0 2.3 1.2<br />
Nicaragua, 1963a<br />
Total .............. 58.9 18.9 2.8 9.8 9.3 0.3<br />
<strong>Urban</strong> .............. 16.3 38.9 6.4 21.4 16.6 0.5<br />
<strong>Rural</strong> .............. 87.2 5.7 0.5 2.2 4.4 0.1<br />
Nicaragua, 1971a<br />
Total ...............<br />
<strong>Urban</strong> ..............<br />
<strong>Rural</strong> ..............<br />
46.8<br />
11.3<br />
80.0<br />
22.2<br />
36.8<br />
8.5<br />
5.9<br />
10.9<br />
1.3<br />
11.3<br />
20.6<br />
2.7<br />
11.0<br />
17.4<br />
5.0<br />
2.8<br />
3.1<br />
2.4<br />
Peru, 1961<br />
Total .............. 49.1 20.9 i 4.7k n.s- 8.9 i 4.8<br />
<strong>Urban</strong> .............. 18.1 31.0 1 8.3 k 20.2 k 15.2 1 7.3<br />
<strong>Rural</strong> •••••••••• 0 ••• 79.9 10.9i 1.2k 2.9k 2.7 1 2.4<br />
Peru, 1972<br />
Total ..............<br />
<strong>Urban</strong> ..............<br />
<strong>Rural</strong> ··········.0 ..<br />
40.3<br />
15.3<br />
81.2<br />
23.1<br />
31.2<br />
9.8<br />
8.0<br />
11.9<br />
1.6<br />
14.3<br />
21.6<br />
2.3<br />
8.3<br />
12.4<br />
1.6<br />
6.0<br />
7.6<br />
3.5<br />
Puerto Rico, 1960a I<br />
Total .............. 23.1 35.2 12.1 17.1 11.1 1.3<br />
<strong>Urban</strong> .............. 3.0 37.8 18.7 25.2 14.3 1.0<br />
<strong>Rural</strong> .............. 43.9 32.5 5.4 8.7 7.9 1.7<br />
Puerto Rico, 1970a I<br />
Total ..............<br />
<strong>Urban</strong> ..............<br />
<strong>Rural</strong> ..............<br />
Venezuela, 1961<br />
7.3<br />
1.3<br />
19.2<br />
40.8<br />
36.6<br />
49.0<br />
18.7<br />
23.8<br />
8.8<br />
19.4<br />
23.9<br />
10.3<br />
11.0<br />
11.3<br />
10.5<br />
2.7<br />
3.1<br />
2.1<br />
d m<br />
Total .............. 32.4 26.5 7.0 k 16.7k <strong>Urban</strong> .............. 8.4 35.7 9.7<br />
11.1 6.4<br />
k 22.9k <strong>Rural</strong> .............. 75.7 9.8 2.2<br />
15.0 8.3<br />
k 5.6k Northern America<br />
Canada, 1961<br />
4.0 2.8<br />
Total ..............<br />
<strong>Urban</strong> ..............<br />
<strong>Rural</strong> ..............<br />
11.8<br />
1.5<br />
40.5<br />
36.0<br />
38.3<br />
29.8<br />
18.0<br />
20.6<br />
11.0<br />
19.2<br />
23.5<br />
7.3<br />
12.3<br />
13.5<br />
9.0<br />
2.6<br />
2.6<br />
2.5<br />
Canada, 1971<br />
Total ..............<br />
<strong>Urban</strong> ..............<br />
<strong>Rural</strong> ••• •••• 0 ••••••<br />
7.0<br />
1.6<br />
27.5<br />
28.9<br />
28.8<br />
29.2<br />
17.0<br />
18.9<br />
9.9<br />
25.4<br />
28.6<br />
13.4<br />
11.2<br />
11.9<br />
8.8<br />
10.5<br />
10.3<br />
11.1<br />
United States <strong>of</strong><br />
America, 19401<br />
Total •••<br />
0 •••••••••• 18.2<br />
36.2 11.5 20.8 12.3 0.8<br />
<strong>Urban</strong> .........•.... 0.8 41.5 14.1 27.7 15.2 0.8<br />
<strong>Rural</strong> .............. 45.6 28.1 7.6 10.1 7.8 0.8<br />
164
TABLE 51. (continued)<br />
Percentage <strong>of</strong> labour force in:<br />
Manuiao- Pr<strong>of</strong>essional<br />
Major area turing <strong>and</strong> <strong>and</strong> Clerical <strong>and</strong> Traditional<br />
<strong>and</strong> country Agriculture transport administrative sales services Unknown<br />
Northern America (continued)<br />
United States <strong>of</strong><br />
America, 1950 1<br />
Total .............. 11.9 39.7 15.2 21.7 10.1 1.3<br />
<strong>Urban</strong> .............. 0.8 41.9 17.8 26.5 11.9 1.1<br />
<strong>Rural</strong> .............. 35.9 35.1 9.5 11.5 6.3 1.7<br />
United States <strong>of</strong><br />
America, 1960 1<br />
Total .............. 6.7 35.6 15.9 25.4 11.5 4.9<br />
<strong>Urban</strong> ............. 1.1 34.9 17.6 28.7 12.3 5.4<br />
<strong>Rural</strong> .............. 21.9 37.5 11.2 16.5 9.2 3.6<br />
United States <strong>of</strong><br />
America, 1970 1<br />
Total .............. 3.0 35.0 22.6 24.4 11.0 4.0<br />
<strong>Urban</strong> .............. 0.6 32.6 24.2 26.9 11.4 4.3<br />
<strong>Rural</strong> .............. 10.8 42.5 17.5 16.6 9.7 2.9<br />
East Asia<br />
Japan, 1960d 1 n<br />
Total .............. 32.6 32.7 7.2 21.0 6.0 0.5<br />
<strong>Urban</strong> .............. 2.4 42.9 10.9 32.8 10.2 0.7<br />
<strong>Rural</strong> .............. 54.2 25.4 4.6 12.6 2.9 0.4<br />
Japan, 1965d 1 n<br />
Total .............. 24.5 34.9 8.6 24.7 6.7 0.5<br />
<strong>Urban</strong> .............. 2.0 40.9 11.7 34.6 10.1 0.7<br />
<strong>Rural</strong> .............. 45.0 29.5 5.8 15.7 3.7 0.3<br />
Japan, 1970d 1 n<br />
Total .............. 19.2 36.5 10.5 26.0 7.3 0.5<br />
<strong>Urban</strong> .............. 1.8 39.6 14.0 34.0 10.1 0.6<br />
<strong>Rural</strong> .............. 38.0 33.3 6.8 17.3 4.3 0.4<br />
South Asia<br />
Cyprus, 1960<br />
Total .............. 38.9 33.8 4.7 10.7 8.1 3.8<br />
<strong>Urban</strong> .............. 3.7 39.0 10.0 24.0 15.6 7.8<br />
<strong>Rural</strong> .............. 54.6 31.5 2.3 4.8 4.7 2.0<br />
India, 1961<br />
Total .............. 72.9 0 15.9 2.7k 5.3k 3.0 0.2<br />
<strong>Urban</strong> .............. 12.3 0 43.9 9.8k 23.0k 10.5 0.5<br />
<strong>Rural</strong> .............. 82.8 0 11.3 1.5k 2.5k 1.7 0.2<br />
Indonesia, 1971&<br />
Total .............. 59.6 11.8 5.6 13.3 3.8 6.0<br />
<strong>Urban</strong> .............. 9.5 25.4 8.2 34.7 11.7 10.6<br />
<strong>Rural</strong> .............. 68.5 9.4 5.2 9.4 2.4 5.1<br />
Iran, 1956 1<br />
Total .............. 55.5 22.6 2.1 8.4 7.7 3.6<br />
<strong>Urban</strong> .............. 13.0 41.4 4.5 20.8 13.9 6.5<br />
<strong>Rural</strong> .............. 74.3 14.3 1.0 3.0 5.0 2.4<br />
Israel, 1961 1<br />
Total .............. 19.1 30.7 26.8p 7.0p 10.9 5.5<br />
<strong>Urban</strong> .............. 13.5 33.2 29.2p 8.0p 10.7 5.5<br />
<strong>Rural</strong> .............. 45.7 19.0 15.3p 2.5p 11.8 5.6<br />
Malaysia<br />
Peninsular<br />
Malaysia, 1970&<br />
Total ............. 46.1 18.9 5.2 12.9 7.9 9.1<br />
<strong>Urban</strong> ............. 6.7 31.2 10.2 26.6 15.3 10.0<br />
<strong>Rural</strong> ... '......... 61.3 14.1 3.3 7.6 5.0 8.7<br />
Sabah, 1970&<br />
i.<br />
Total ............. 56.4 14.3 5.3 8.6 6.4 9.1<br />
<strong>Urban</strong> ............<br />
<strong>Rural</strong> ............<br />
6.2<br />
65.9<br />
30.1<br />
11.2<br />
12.5<br />
3.9<br />
26.2<br />
5.3<br />
17.9<br />
4.2<br />
7.0<br />
9.5<br />
165
TABLE 51. (continued)<br />
Percentage 01 labour jorc« In:<br />
Manuiac- Pr<strong>of</strong>essional<br />
Major area turing <strong>and</strong> <strong>and</strong> Clerical <strong>and</strong> Traditional<br />
<strong>and</strong> country Agriculture transport administrative sales services Unknown<br />
South Asia (continued)<br />
Sarawak, 1970a<br />
Total .............<br />
<strong>Urban</strong> ............<br />
<strong>Rural</strong> ............<br />
65.9<br />
7.2<br />
74.3<br />
9.7<br />
27.5<br />
7.1<br />
3.5<br />
12.0<br />
2.2<br />
7.1<br />
26.8<br />
4.3<br />
5.1<br />
16.4<br />
3.5<br />
8.8<br />
10.1<br />
8.6<br />
Sri Lanka, 1953 1<br />
Total .............. 51.3 16.3 4.8 10.8 14.7 2.1<br />
<strong>Urban</strong> .............. 5.9 24.1 9.7 26.1 30.5 3.7<br />
<strong>Rural</strong> .............. 59.6 14.9 3.9 8.1 11.8 1.8<br />
Sri Lanka, 1970 1<br />
Total .............. 50.8 24.5 6.0 11.2 7.4 0.2<br />
<strong>Urban</strong> .............. 8.8 38.2 12.2 26.5 14.1 0.2<br />
<strong>Rural</strong> .............. 58.7 21.9 4.8 8.3 6.1 0.2<br />
Thail<strong>and</strong>, 1954<br />
Total .............. 88.0 4.2 1.5 4.4 1.1 0.8<br />
<strong>Urban</strong> ............. 12.2 31.3 9.1 30.5 10.2 6.7<br />
<strong>Rural</strong> .............. 92.6 2.6 1.1 2.8 0.6 0.4<br />
Thail<strong>and</strong>, 1970<br />
Total ........... " ..<br />
<strong>Urban</strong> ..............<br />
<strong>Rural</strong> ..............<br />
81.3<br />
7.9<br />
89.4<br />
7.6<br />
31.0<br />
5.1<br />
2.5<br />
14.9<br />
1.2<br />
5.9<br />
30.8<br />
3.1<br />
2.5<br />
14.9<br />
1.2<br />
0.1<br />
0.5<br />
0.1<br />
Turkey, 1950a<br />
Total ..............<br />
<strong>Urban</strong> ..............<br />
<strong>Rural</strong> ..............<br />
81.3<br />
22.8<br />
92.6<br />
9.5<br />
38.0<br />
4.0<br />
3.8<br />
15.7<br />
1.4<br />
2.4<br />
10.9<br />
0.8<br />
1.3<br />
6.3<br />
0.3<br />
1.7<br />
6.2<br />
0.9<br />
Turkey, 1960a<br />
Total ..............<br />
<strong>Urban</strong> ..............<br />
<strong>Rural</strong> ..............<br />
78.0<br />
19.0<br />
91.6<br />
12.4<br />
44.5<br />
5.0<br />
4.1P<br />
15.8p<br />
1.5p<br />
2.6p<br />
9.8p<br />
0.9p<br />
2.9<br />
10.9<br />
1.0<br />
Turkey, 1970a<br />
Total ..............<br />
<strong>Urban</strong> ..............<br />
<strong>Rural</strong> ..............<br />
Europe<br />
66.8<br />
11.3<br />
86.0<br />
9.0<br />
23.5<br />
4.0<br />
4.2<br />
10.2<br />
2.2<br />
5.4<br />
16.2<br />
1.6<br />
3.7<br />
10.3<br />
1.4<br />
10.9<br />
28.6<br />
4.7<br />
Bulgaria, 1956<br />
Total ...............<br />
<strong>Urban</strong> ..............<br />
<strong>Rural</strong> ..............<br />
60.6<br />
13.1<br />
78.5<br />
20.8<br />
42.3<br />
12.7<br />
8.4<br />
21.6<br />
3.5<br />
6.1<br />
13.9<br />
3.1<br />
4.1<br />
9.2<br />
2.2<br />
Greece, 1961q<br />
Total .............. 53.7 22.1 4.2 10.1 6.1 3.7<br />
<strong>Urban</strong> .............. 8.7 42.6 8.3 21.6 11.9 6.8<br />
<strong>Rural</strong> .............. 80.2 10.1 1.8 3.3 2.6 1.9<br />
Greece, 1971q r<br />
Total .............. 40.5 29.4 6.4 14.6 6.9 2.1<br />
<strong>Urban</strong> .............. 5.6 44.9 10.5 25.0 10.6 3.4<br />
<strong>Rural</strong> ............. " 72.5 15.2 2.5 5.2 3.6 1.0<br />
Hungary. 1970<br />
Total .............. 18.1 50.3 11.5 14.4 5.8 8 _8<br />
<strong>Urban</strong> .............. 4.5 50.6 17.4 20.5 7.0 8 _8<br />
<strong>Rural</strong> .............. 30.8 50.0 5.9 8.6 4.6 8 _8<br />
Portugal, 1960<br />
Total .............. 43.4 31.4 4.1 10.9 9.2 1.1<br />
<strong>Urban</strong> .............. 4.4 41.0 9.1 25.1 19.5 0.9<br />
<strong>Rural</strong> .............. 56.3 28.2 2.4 6.1 5.8 1.1<br />
Romania, 1956<br />
Total .............. 68.7 16.3 7.4 4.4 3.1<br />
<strong>Urban</strong> .............. 16.5 41.4 20.8 12.4 8.8 0.1<br />
<strong>Rural</strong> .............. 87.0 7.5 2.7 1.6 1.1<br />
166
TABLE 51. (continued)<br />
Percentage <strong>of</strong> labour force In:<br />
Manufac- Pr<strong>of</strong>ess/anal<br />
Major area . turing <strong>and</strong> <strong>and</strong> Clerical <strong>and</strong> Traditional<br />
<strong>and</strong> country Agriculture transport admlnlstrallve sales services Unknown<br />
Romania, 1966<br />
Total .............. 55.4 25.9 9.4 5.2 4.1<br />
<strong>Urban</strong> .............. 14.6 46.3 20.5 10.8 7.7 0.1<br />
<strong>Rural</strong> .............. 77.4 14.8 3.5 2.1 2.1<br />
Spain, 1960d t u<br />
Total .............. 39.5 31.5 u 5.1 11.6 u 7.2 5.0<br />
<strong>Urban</strong> .............. 22.5 38.5 u 6.8 16.2 U 9.9 6.1<br />
<strong>Rural</strong> .............. 69.6 19.1 u 2.3 3.5 u 2.4 3.1<br />
Sweden, 1960<br />
Total .............. 13.5 41.1 15.2 19.9 9.6 0.6<br />
<strong>Urban</strong> .............. 1.9 40.6 19.6 26.1 11.2 0.6<br />
<strong>Rural</strong> .............. 27.3 41.6 10.1 12.5 7.8 0.7<br />
Sweden, 1970<br />
Total .............. 8.0 40.7 21.2 19.8 9.6 0.7<br />
<strong>Urban</strong> .............. 1.9 41.0 23.7 22.3 10.3 0.7<br />
<strong>Rural</strong> .......... 0.· . 38.0 38.9 9.1 7.5 6.1 0.4<br />
United Kingdom<br />
Scotl<strong>and</strong>, 1961d v<br />
Total ............. 6.0 47.5 9.8 24.7 10.4 1.6<br />
<strong>Urban</strong> ............ 1.5 49.3 10.0 27.2 10.7 1.3<br />
<strong>Rural</strong> ............ 21.3 41.6 9.0 16.2 9.3 2.6<br />
Note: In this table, Cyprus, Israel <strong>and</strong> Turkey are included in South Asia.<br />
a No information available on disposition <strong>of</strong> members <strong>of</strong> the armed forces.<br />
b Members <strong>of</strong> armed forces included in "services" rather than in "unknown".<br />
c <strong>Urban</strong> defined as towns <strong>of</strong> Tripoli <strong>and</strong> Benghazi only.<br />
d <strong>Rural</strong> obtained by subtracting urban from total.<br />
e Excluding unemployed persons <strong>and</strong> those <strong>of</strong> unknown occupations.<br />
! <strong>Urban</strong> defined as 35 selected towns.<br />
g Primary- <strong>and</strong> intermediate-school teachers, <strong>and</strong> junior religious occupations included in<br />
"clerical" rather than in "pr<strong>of</strong>essional <strong>and</strong> administrative".<br />
b <strong>Urban</strong> defined as 15 gazetted townships in Tanganyika only.<br />
I Laundry workers <strong>and</strong> cleaners included in "manufacturing" rather than in "services".<br />
j Refers to pr<strong>of</strong>essionals, industrialists <strong>and</strong> businessmen.<br />
k Sales managers included in "administrative workers" rather than in "sales workers".<br />
1 Employed persons only.<br />
m <strong>Urban</strong> defined as localities <strong>of</strong> 2 500 or more inhabitants.<br />
D <strong>Urban</strong> defined as densely inhabited districts (DID).<br />
o Including cultivators.<br />
P "Clerical workers" included in "administrative <strong>and</strong> managerial workers".<br />
q Semi-urban included in rural.<br />
r Excluding members <strong>of</strong> the armed forces from the labour force.<br />
s Members <strong>of</strong> the armed forces <strong>and</strong> persons with unknown occupations included in<br />
"manufacturing".<br />
t <strong>Urban</strong> defined as localities <strong>of</strong> 2 000 or more inhabitants.<br />
U Some communication workers included in "manufacturing" rather than in "clerical<br />
workers".<br />
v <strong>Urban</strong> defined as areas outside "l<strong>and</strong>ward areas".<br />
167
TABLE 52. PERCENTAGE URBAN IN VARIOUS OCCUPATIONS, BY COUNTRY<br />
P"centage <strong>of</strong> labour force 171:<br />
Manufae- Pr<strong>of</strong>essional<br />
Malorarea turing <strong>and</strong> <strong>and</strong> Clerical <strong>and</strong> Traditional<br />
<strong>and</strong> country A/lTlculture transport administrative sales services Unknown<br />
Africa<br />
Algeria<br />
1966& .............. 19.6 51.2<br />
Central African<br />
Empire<br />
1960 ............... 19.8 66.1 43.0<br />
70.7 72.0 65.0 36.3<br />
77.7 74.9 b 32.7 b<br />
Guinea<br />
1955 ............... 3.6 40.9 38.6 45.9 45.5 21.2<br />
Libyan Arab<br />
Jamahiriya<br />
19640d ............. 26.9 50.6 45.6 58.5 51.6 30.1<br />
Morocco<br />
1951 ............... 1.7 64.2 34.7 63.9 75.5 b 64.0 b<br />
1960 ••• •••• ·0 •••••• 2.8 70.6 57.8 75.5 76.9 49.1<br />
1971 ............... 3.2 64.0 63.6 77.0 75.9 b 70.3 b<br />
Sudan<br />
1956d. f •••••••••••• 1.5 47.1 64.71 35.61 53.7<br />
Tunisia<br />
1966& ............... 13.8 54.0 77.9 73.9 75.2 57.1<br />
United Republic <strong>of</strong><br />
Tanzania<br />
1967d h ............. 0.2 18.1 11.2 21.6 18.5 6.9<br />
Latin America<br />
Bolivia<br />
1963& .............. 0.9 42.1 62.9 58.9 62.3 10.2<br />
Chile<br />
1970& .............. 22.9 89.1 94.3 96.0 91.3 80.5<br />
Costa Rica<br />
1963& ••••••••• 10 ••• 5.4 61.3 1 73.8 72.5 67.9 n 1973& ···.··· ... ·.0 . 6.2 57.3 79.4 73.6 65.5<br />
44.8<br />
39.8<br />
Ecuador<br />
1962&<br />
1974&<br />
..............<br />
..............<br />
6.5<br />
6.8<br />
63.1<br />
63.1<br />
76.0<br />
80.7<br />
80.8<br />
80.9<br />
75.6<br />
84.0<br />
79.8<br />
62.2<br />
Guatemala<br />
1973 ............... 12.9 58.3 81.9J
TABLE 52. (continued)<br />
P"centag, <strong>of</strong> labour force III:<br />
Manu/ae- Proiesslona;<br />
Major area turing <strong>and</strong> <strong>and</strong> Clerical <strong>and</strong> Traditional<br />
<strong>and</strong> country AgrIculture transport administrative sales services Unknown<br />
East Asia<br />
Japan<br />
1960d 1 n ••..•••••••• 3.1 54.7 63.1 65.1 71.2 56.7<br />
1965d 1 n ••..•••••••• 3.9 55.8 64.7 66.6 71.3 65.1<br />
1970d 1 n ..•••••••••• 4.9 56.2 68.9 67.9 71.8 63.3<br />
South Asia<br />
Cyprus<br />
1960 .............................. 2.9 35.6 65.9 68.8 59.5 63.5<br />
India<br />
1961 ............................. 2.4 0 38.7 51.4 k 60.4 k 49.6 28.4<br />
Indonesia<br />
1971a ............................ 2.4 32.6 22.1 39.7 47.1 26.9<br />
Iran<br />
1956 1 ............................ 7.2 56.1 66.2 75.4 55.3 54.5<br />
Israel<br />
19611 ........................... 58.0 89.1 89.9p 93.8p 80.9 82.3<br />
Malaysia<br />
Peninsular Malaysia<br />
1970" ...................... 4.1 46.2 54.6 57.6 54.6 30.9<br />
Sabah<br />
1970a ........................ 1.8 33.7 37.8 48.6 45.1 12.4<br />
Sarawak<br />
1970a ........................ 1.4 35.7 43.5 47.1 40.4 14.4<br />
Sri Lanka<br />
1953 1 ............................ 1.8 22.7 31.2 37.0 31.9 27.5<br />
Sri Lanka<br />
1970· ............................ 2.8 24.8 32.3 37.7 30.3 16.7<br />
Thail<strong>and</strong><br />
1954 .............................. 0.8 42.3 34.1 39.9 51.7 50.4<br />
1970 ............................. 1.0 40.0 58.3 51.8 58.1 37.5<br />
Turkey<br />
1950 a ..................... o. .o. 4.6 64.7 67.8 72.7 80.9 58.4<br />
1960· ............................ 4.6 67.2 71.2p 71.8p 70.8<br />
1970· ............................ 4.3 66.8 61.7 77.8 71.7 67.7<br />
Europe<br />
Bulgaria<br />
1956 ........................... o. 5.9 55.6 70.1 62.6 61.7 79.6<br />
Greece<br />
1961q ............................ 6.0 71.3 72.7 79.4 72.9 67.7<br />
1971q r .......................... 6.6 73.0 79.1 81.4 73.1 76.1<br />
Hungary<br />
1970 ............................. 12.1 48.8 73.6 69.1 58.9<br />
8 ......<br />
Portugal<br />
1960 ............................. 2.5 32.6 56.0 57.6 52.7 21.3<br />
Romania<br />
1956 .............................. 6.3 66.0 73.2 72.5 73.2 80.2<br />
1966 ....................... o. .... 9.2 62.7 75.8 73.0 66.2 59.4<br />
Spain<br />
1960d t u •••••••••••• 36.4 78.1 u 84.2 89.1 u 88.0 77.6<br />
Sweden<br />
1960 .............................. 7.8 53.7 69.8 71.3 63.2 49.3<br />
1970 ................... 0 .. ,o. .. 19.6 83.9 92.8 93.6 89.2 89.9<br />
169
Major area<br />
<strong>and</strong> country<br />
TABLE 52. (continued)<br />
Percentage oj labour iorce In:<br />
ManuJac. Pr<strong>of</strong>essional<br />
turing <strong>and</strong> <strong>and</strong> Clerical <strong>and</strong> Traditional<br />
Agriculture transport administrative sales services Unknown<br />
United Kingdom<br />
Scotl<strong>and</strong><br />
1961d v ••••••••••• 19.5 80.2 79.2 85.2 79.7 63.2<br />
Note: In this table, Cyprus, Israel <strong>and</strong> Turkey are included in South Asia.<br />
a No information available on disposition <strong>of</strong> members <strong>of</strong> the armed forces.<br />
b Members <strong>of</strong> armed forces included in "services" rather than in "unknown".<br />
C <strong>Urban</strong> defined as towns <strong>of</strong> Tripoli <strong>and</strong> Benghazi only.<br />
d <strong>Rural</strong> obtained by subtracting urban from total.<br />
e Excluding unemployed persons <strong>and</strong> those <strong>of</strong> unknown occupations.<br />
t <strong>Urban</strong> defined as 35 selected towns.<br />
g Primary- <strong>and</strong> intermediate-school teachers, <strong>and</strong> junior religious occupations included in<br />
"clerical" rather than in "pr<strong>of</strong>essional <strong>and</strong> administrative".<br />
h <strong>Urban</strong> defined as 15 gazetted townships in Tanganyika only.<br />
I Laundry workers <strong>and</strong> cleaners included in "manufacturing" rather than in "services".<br />
l Refers to pr<strong>of</strong>essionals, industrialists <strong>and</strong> businessmen.<br />
k Sales managers included in "administrative workers" rather than in "sales workers".<br />
1 Employed persons only.<br />
m <strong>Urban</strong> defined as localities <strong>of</strong> 2 500 or more inhabitants.<br />
n <strong>Urban</strong> defined as densely inhabited districts (DID).<br />
o Including cultivators.<br />
P "Clerical workers" included in "administrative <strong>and</strong> managerial workers",<br />
q Semi-urban included in rural.<br />
r Excluding members <strong>of</strong> the armed forces from the labour force.<br />
S Members <strong>of</strong> the armed forces <strong>and</strong> persons with unknown occupations included in<br />
"manufacturing".<br />
t <strong>Urban</strong> defined as localities <strong>of</strong> 2 000 or more inhabitants.<br />
u Some communication workers included in "manufacturing" rather than in "clerical<br />
workers".<br />
v <strong>Urban</strong> defined as areas outside "l<strong>and</strong>ward areas".<br />
170
TABLE 53. (continued)<br />
Percentage female In:<br />
Manufae- Pr<strong>of</strong>essional<br />
Major area turing <strong>and</strong> <strong>and</strong> Clerical <strong>and</strong> Traditional<br />
<strong>and</strong> country Agriculture transport administrative sales services Unknown<br />
Costa Rica, 1973a<br />
Total ............... 1.6 11.7 41.2 27.3 64.7 14.0<br />
<strong>Urban</strong> .............• 2.2 12.6 41.8 30.6 68.4 16.2<br />
<strong>Rural</strong> ............... 1.5 10.5 38.8 18.0 57.5 12.5<br />
Ecuador, 1962a<br />
Total ............... 7.6 22.9 43.9 24.3 68.4 12.2<br />
<strong>Urban</strong>' .............. 4.8 15.8 44.2 25.6 68.3 13.5<br />
<strong>Rural</strong> ............... 7.8 35.0 43.1 18.4 68.8 6.9<br />
Ecuador, 1974a<br />
Total ............... 4.5 15.4 38.0 30.0 66.2 14.4<br />
<strong>Urban</strong> .............. 3.4 11.9 38.7 32.6 68.1 16.3<br />
<strong>Rural</strong> ............... 4.6 21.5 35.2 19.2 56.2 11.2<br />
Guatemala, 1973<br />
Total .............. 1.5 13.7 31.7i 34.3 67.6 16.3<br />
<strong>Urban</strong> .............. 1.1 12.6 32.7J 40.2 68.4 22.5<br />
<strong>Rural</strong> ............... 1.5 15.2 27.0J 20.6 64.1 10.0<br />
Nicaragua, 1963a<br />
Total ............... 4.2 20.1 49.4 46.0 84.7 31.7<br />
<strong>Urban</strong> .............. 3.5 19.3 48.6 44.4 82.8 22.9<br />
<strong>Rural</strong> ............... 4.3 23.9 55.3 55.9 89.5 55.3<br />
Nicaragua, 1971a<br />
Total ............... 3.2 15.8 37.6 45.8 77.8 31.8<br />
<strong>Urban</strong> .............. 3.4 16.3 37.2 47.3 80.1 31.8<br />
<strong>Rural</strong> ............... 3.2 13.8 40.9 34.5 70.3 31.9<br />
Peru, 1961<br />
Total ............... 13.9 17.9 1 35.3 k 29.8 k 60.0 1 14.6<br />
<strong>Urban</strong> .............. 11.2 13.5 1 35.1 k 30.4 k 59.9 1 14.3<br />
<strong>Rural</strong> ............... 14.5 30.3 1 36.3 k 25.9 k 60.4 1 15.6<br />
Peru, 1972<br />
Total ............... 8.6 13.6 31.8 32.5 56.6 27.0<br />
<strong>Urban</strong> .............. 7.3 10.6 32.5 32.8 57.0 27.6<br />
<strong>Rural</strong> ................ 9.0 29.3 23.3 27.9 51.7 24.9<br />
Puerto Rico, 1960a 1<br />
Total ............... 1.7 21.2 34.9 32.6 55.2 49.0<br />
<strong>Urban</strong> .............. 2.2 21.1 35.5 36.5 56.1 45.6<br />
<strong>Rural</strong> ............... 1.7 21.3 32.5 20.8 53.5 51.0<br />
Puerto Rico, 1970a 1<br />
Total ............... 2.3 22.7 35.7 45.0 37.9 56.4<br />
<strong>Urban</strong> .............. 3.4 22.5 35.5 47.2 38.0 55.0<br />
<strong>Rural</strong> ............... 2.1 22.9 37.1 34.8 37.7 60.5<br />
Venezuela, 1961d m<br />
Total ............... 3.3 11.6 40.7 k 19.2 k 64.4 9.7<br />
<strong>Urban</strong> ...........•.. 2.7 10.7 39.3 k 20.3k 63.3 10.2<br />
<strong>Rural</strong> ............... 3.4 17.4 52.6 k 11.2 k 71.8 6.7<br />
Northern America<br />
Canada, 1961<br />
Total ............... 9.9 11.3 28.3 52.8 49.7 26.0<br />
<strong>Urban</strong> .............. 4.9 12.6 26.7 53.0 49.7 26.5<br />
<strong>Rural</strong> ............... 10.5 6.8 36.3 51.0 50.0 24.4<br />
Canada, 1971<br />
Total ............... 17.9 11.7 39.9 54.3 46.2 37.7<br />
<strong>Urban</strong> ...•.........• 10.2 12.6 38.6 54.5 44.8 38.2<br />
<strong>Rural</strong> ............... 19.6 8.3 49.1 52.3 53.1 35.8<br />
United States <strong>of</strong><br />
America, 19401<br />
Total ............... 5.7 13.8 33.1 35.4 58.0 35.4<br />
<strong>Urban</strong> .............. 6.6 15.7 31.8 37.0 56.4 36.2<br />
<strong>Rural</strong> .............. 5.7 9.3 36.9 28.3 62.9 34.1<br />
172
TABLE 53. (continued)<br />
Percentage female in:<br />
Manulae- Pr<strong>of</strong>essional<br />
Malor area turing <strong>and</strong> <strong>and</strong> Clerical <strong>and</strong> Traditional<br />
<strong>and</strong> country "-grlculture transport administrative sales services Unknown<br />
United States <strong>of</strong><br />
America, 19501<br />
Total ............... 8.4 15.1 27.6 48.2 57.0 38.1<br />
<strong>Urban</strong> .............. 11.1 16.6 26.8 49.1 55.1 37.5<br />
<strong>Rural</strong> .............. 8.3 11.3 30.9 43.7 64.8 39.0<br />
United States <strong>of</strong><br />
America, 19601<br />
Total ............... 8.5 14.5 32.4 50.8 62.0 37.6<br />
<strong>Urban</strong> .............. 7.8 14.8 31.6 51.1 59.7 38.2<br />
.<strong>Rural</strong> .............. 8.6 13.8 35.9 49.2 70.5 35.1<br />
United States <strong>of</strong><br />
America, 1970 1<br />
Total ............... 9.5 18.0 31.6 63.8 55.5 36.7<br />
<strong>Urban</strong> .............. 17.5 17.7 31.4 63.7 53.7 33.3<br />
<strong>Rural</strong> .............. 8.2 18.8 32.7 64.5 62.2 52.9<br />
East Asia<br />
Japan, 1960d 1 D<br />
Total ............... 51.7 25.4 25.3 39.3 64.3 3.3<br />
<strong>Urban</strong> .............. 33.2 23.9 24.2 38.5 65.1 3.7<br />
<strong>Rural</strong> ............... 52.3 27.1 27.2 40.8 62.4 2.8<br />
Japan, 1965d J D<br />
Total ............... 51.5 26.1 25.5 43.8 62.5 4.4<br />
<strong>Urban</strong> .............. 37.3 25.1 24.3 43.6 62.5 5.0<br />
<strong>Rural</strong> ..............• 52.1 27.5 27.6 44.1 62.6 3.3<br />
Japan, 1970d 1 D<br />
Total ............... 53.0 27.1 24.8 46.3 60.3 3.9<br />
<strong>Urban</strong> .............. 39.9 25.4 23.4 45.8 59.7 5.0<br />
<strong>Rural</strong> .............. 53.7 29.2 27.7 47.4 61.7 1.9<br />
South Asia<br />
Cyprus, 1960<br />
Total ............... 53.9 18.5 28;8 17.0 31.0 6.5<br />
<strong>Urban</strong> .............. 35.1 15.0 31.0 18.9 37.4 6.3<br />
<strong>Rural</strong> .............. 54.5 20.5 24.6 12.7 21.7 6.9<br />
India, 1961<br />
Total ............... 35.6° 25.6 11.3 k 8.6 k 25.0 12.5<br />
<strong>Urban</strong> .............. 31.7 0 15.2 12.5 k 5.2 k 20.9 6.1<br />
<strong>Rural</strong> .............. 35.7° 32.1 10.0 k 13.9 k 29.1 15.0<br />
Indonesia, 1971-<br />
Total .....•......... 32.3 31.4 23.9 36.1 42.8 40.1<br />
<strong>Urban</strong> .............. 21.4 15.3 28.9 28.8 49.1 29.8<br />
<strong>Rural</strong> .0 ............ 32.6 39.2 22.5 40.9 37.1 43.9<br />
Iran, 1956 1<br />
Total ............... 4.8 20.4 15.3 2.4 23.9 1.8<br />
<strong>Urban</strong> .............. 3.0 11.2 19.6 2.6 27.2 1.1<br />
<strong>Rural</strong> .............. 4.9 32.2 6.8 1.7 19.9 2.8<br />
Israel, 1961 1<br />
Total ............... 18.2 11.3 35.9P 24.4p 56.3 32.0<br />
<strong>Urban</strong> .............. 17.1 10.9 35.3p 24.9p 52.2 29.7<br />
<strong>Rural</strong> .............. 19.7 14.4 40.7p 16.1p 73.7 42.4<br />
Malaysia<br />
Peninsular<br />
Malaysia, 1970-<br />
Total ............. 37.7 17.4 30.2 20.6 32.9 47.8<br />
<strong>Urban</strong> ............ 37.1 17.8 33.2 20.9 40.1 44.0<br />
<strong>Rural</strong> ............ 37.7 17.1 26.7 20.1 24.3 49.5<br />
Sabah, 1970-<br />
Total ............. 36.3 7.2 26.7 25.7 22.8 60.2<br />
<strong>Urban</strong> ............ 6.2 8.4 28.6 29.2 30.5 43.2<br />
<strong>Rural</strong> ............ 36.8 6.6 25.5 22.5 16.5 62.6<br />
173
TA1ILE 53. (continued)<br />
Percentage female in:<br />
Manufac- Pr<strong>of</strong>essional<br />
Malor area turing <strong>and</strong> <strong>and</strong> Clerical <strong>and</strong> Traditional<br />
<strong>and</strong> country Agriculture transport administrative sales services Unknown<br />
Sarawak, 1970 a<br />
Total ............. 44.5 11.3 26.1 21.7 24.1 61.9<br />
<strong>Urban</strong> ............ 19.4 9.9 31.2 22.7 33.3 50.4<br />
<strong>Rural</strong> ............ 44.8 12.1 22.2 20.8 17.8 63.8<br />
Sri Lanka, 1953 1<br />
Total ............... 27.7 21.5 24.1 9.5 22.7 47.3<br />
<strong>Urban</strong> ••••••••••• 0 •• 14.1 7.1 22.0 6.7 24.2 39.2<br />
<strong>Rural</strong> .............. 28.0 25.7 25.1 11.1 22.0 50.3<br />
Sri Lanka, 1970 1<br />
Total ............... 26.8 17.7 28.3 9.5 29.9<br />
<strong>Urban</strong> .............. 9.7 13.5 27.5 12.6 34.7<br />
<strong>Rural</strong> .............. 27.3 19.1 28.7 7.7 27.8<br />
Thail<strong>and</strong>, 1954<br />
Total ...............<br />
<strong>Urban</strong> ..............<br />
51.2<br />
44.9<br />
25.6<br />
21.6<br />
21.9<br />
30.2<br />
43.6<br />
36.8<br />
44.7<br />
45.2<br />
0.8<br />
1.5<br />
<strong>Rural</strong> ..... 0 •• 0 •••••• 51.3 28.4 17.6 48.1 44.1 0.1<br />
Thail<strong>and</strong>, 1970<br />
Total ............... 49.7 29.4 28.2 51.8 48.5 38.3<br />
<strong>Urban</strong> .............. 41.8 27.4 29.7 47.3 56.0 35.3<br />
<strong>Rural</strong> .............. 49.8 30.7 26.1 56.7 38.2 40.1<br />
Turkey, 1950a Total ............... 50.0 12.8 9.2 8.1 11.7 45.2<br />
<strong>Urban</strong> .............. 29.6 8.6 11.1 9.0 12.6 45.4<br />
<strong>Rural</strong> ••••••••• 0 ••• • 50.9 20.7 5.2 5.9 8.2 44.8<br />
Turkey, 1960&<br />
Total ............... 49.8 9.8 13.6p l·3 P 8.2<br />
<strong>Urban</strong> .............. 7.6 6.9 16.3P 1.3p 10.1<br />
<strong>Rural</strong> .............. 51.8 15.7 6.8 p 1.5p 3.5<br />
Turkey, 1970&<br />
Total ............... 51.0 19.1 22.6 11.1 8.5 7.1<br />
<strong>Urban</strong> .............. 17.6 12.9 22.2 12.9 9.4 4.6<br />
<strong>Rural</strong> .............. 52.5 31.7 23.3 4.8 6.0 12.3<br />
Europe<br />
Bulgaria, 1956<br />
Total ..............• 53.0 18.5 33.8 30.5 33.4 25.1<br />
<strong>Urban</strong> .............. 45.8 26.2 34.5 35.9 43.2 25.7<br />
<strong>Rural</strong> •• 0 •••••••••• • 53.5 8.9 32.0 21.5 17.6 22.6<br />
Greece, 1961q<br />
Total ............... 40.0 19.4 28.8 18.9 39.9 39.6<br />
<strong>Urban</strong> .............. 25.2 19.0 28.8 20.7 45.3 38.2<br />
<strong>Rural</strong> .............. 40.9 20.5 28.7 12.0 25.4 42.4<br />
Greece, 1971q r<br />
Total ............... 36.4 14.7 31.6 26.5 37.4 13.7<br />
<strong>Urban</strong> .............. 23.1 15.2 32.0 28.5 41.3 11.4<br />
<strong>Rural</strong> .............. 37.3 13.2 30.3 17.7 26.6 20.8<br />
Hungary, 1970<br />
Total ............... 45.8 28.2 45.6 65.6 70.6<br />
<strong>Urban</strong> ..............<br />
<strong>Rural</strong> ..............<br />
39.4<br />
46.7<br />
32.8<br />
23.9<br />
45.5<br />
45.9<br />
67.1<br />
62.2<br />
74.5<br />
64.9<br />
8 _s<br />
8 _8<br />
8 _8<br />
Portugal, 1960<br />
Total ............... 7.3 17.4 35.8 16.4 67.9 3.4<br />
<strong>Urban</strong> ............•. 4.1 22.4 33.3 19.3 69.1 6.6<br />
<strong>Rural</strong> .............. 7.4 14.9 38.9 12.5 66.6 2.5<br />
Romania, 1956<br />
Total ............... 54.2 16.2 32.0 34.3 49.8 51.0<br />
<strong>Urban</strong> ............•• 51.8 19.6 32.8 39.9 55.5 54.7<br />
<strong>Rural</strong> •••••• to, .0... 54.3 9.7 29.8 19.6 34.1 35.7<br />
174
TABLE 53. (continued)<br />
Percentage female In:<br />
Manufac- Pr<strong>of</strong>essional<br />
Major area turing <strong>and</strong> <strong>and</strong> Clerical <strong>and</strong> Traditional<br />
<strong>and</strong> country Agriculture transport administrative sales services Unknown<br />
Romania, 1966<br />
Total ............... 58.6 16.7 41.8 45.7 51.2 42.6<br />
<strong>Urban</strong> .............. 59.7 22.5 41.9 53.3 61.2 43.2<br />
<strong>Rural</strong> ••••• 0 •••••••• 58.5 6.9 41.5 25.0 31.5 41.6<br />
Spain, 1960d t u<br />
Total ............... 12.3 14.7 u 34.2 . 18.4u 62.0 45.1<br />
<strong>Urban</strong> .............. 4.9 15.4 u 34.0 18.8 u 62.2 39.9<br />
<strong>Rural</strong> ............ 0. 16.6 12.5 u 35.2 15.5 u 60.4 63.0<br />
Sweden, 1960<br />
Total ............... 8.3 12.3 33.3 56.5 75.1 4.6<br />
<strong>Urban</strong> .............. 9.4 14.5 33.3 57.4 72.3 4.5<br />
<strong>Rural</strong> .............. 8.3 9.8 33.2 54.2 79.7 4.7<br />
Sweden, 1970<br />
Total ...............<br />
<strong>Urban</strong> ..............<br />
<strong>Rural</strong> •••••• 0 •••••••<br />
19.8<br />
12.6<br />
21.5<br />
15.0<br />
16.0<br />
9.9<br />
39.6<br />
38.9<br />
47.9<br />
62.0<br />
62.3<br />
57.2<br />
71.9<br />
71.3<br />
76.8<br />
9.5<br />
10.0<br />
6.0<br />
United Kingdom<br />
Scotl<strong>and</strong>, 1961 d v<br />
Total ............. 7.4 14.4 37.1 55.3 66.8 12.9<br />
<strong>Urban</strong> ............ 7.0 15.2 36.7 55.0 65.2 14.0<br />
<strong>Rural</strong> ............ 7.5 11.6 38.9 56.6 73.1 10.9<br />
Note: In this table, Cyprus, Israel <strong>and</strong> Turkey are included in South Asia.<br />
a No information available on disposition <strong>of</strong> members <strong>of</strong> the armed forces.<br />
b Members <strong>of</strong> armed forces included in "services" rather than in "unknown".<br />
c <strong>Urban</strong> defined as towns <strong>of</strong> Tripoli <strong>and</strong> Benghazi only.<br />
d <strong>Rural</strong> obtained by subtracting urban from total.<br />
e Excluding unemployed persons <strong>and</strong> those <strong>of</strong> unknown occupations.<br />
f <strong>Urban</strong> defined as 35 selected towns.<br />
g Primary-<strong>and</strong> intermediate-school teachers, <strong>and</strong> junior religious occupations included in<br />
"clerical" rather than "pr<strong>of</strong>essional <strong>and</strong> administrative".<br />
h <strong>Urban</strong> defined as 15 gazetted townships in Tanganyika only.<br />
I Laundry workers <strong>and</strong> cleaners included in "manufacturing" rather than in "services".<br />
j Refers to pr<strong>of</strong>essionals, industrialists <strong>and</strong> businessmen.<br />
k Sales managers included in "administrative workers" rather than in "sales workers".<br />
J Employed persons only.<br />
m <strong>Urban</strong> defined as localities <strong>of</strong> 2 500 or more inhabitants.<br />
n <strong>Urban</strong> defined as densely inhabited districts (DID).<br />
o Including cultivators.<br />
P "Clerical workers" included in "administrative <strong>and</strong> managerial workers".<br />
q Semi-urban included in rural.<br />
r Excluding members <strong>of</strong> the armed forces from the labour force.<br />
s Members <strong>of</strong> the armed forces <strong>and</strong> persons with unknown occupations included in<br />
"manufacturing".<br />
t <strong>Urban</strong> defined as localities <strong>of</strong> 2 000 or more inhabitants.<br />
u Some communication workers included in "manufacturing" rather than in "clerical<br />
workers".<br />
v <strong>Urban</strong> defined as areas outside "l<strong>and</strong>ward areas".<br />
175