Indian One horned Rhinoceros - Central Zoo Authority
Indian One horned Rhinoceros - Central Zoo Authority
Indian One horned Rhinoceros - Central Zoo Authority

You also want an ePaper? Increase the reach of your titles
YUMPU automatically turns print PDFs into web optimized ePapers that Google loves.
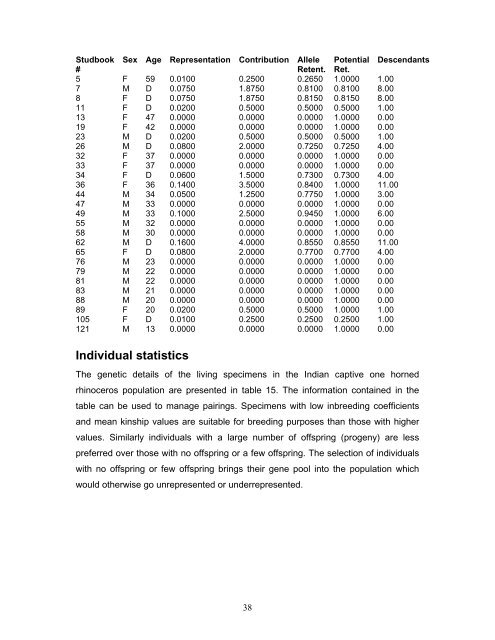
Studbook Sex Age Representation Contribution Allele Potential Descendants<br />
#<br />
Retent. Ret.<br />
5 F 59 0.0100 0.2500 0.2650 1.0000 1.00<br />
7 M D 0.0750 1.8750 0.8100 0.8100 8.00<br />
8 F D 0.0750 1.8750 0.8150 0.8150 8.00<br />
11 F D 0.0200 0.5000 0.5000 0.5000 1.00<br />
13 F 47 0.0000 0.0000 0.0000 1.0000 0.00<br />
19 F 42 0.0000 0.0000 0.0000 1.0000 0.00<br />
23 M D 0.0200 0.5000 0.5000 0.5000 1.00<br />
26 M D 0.0800 2.0000 0.7250 0.7250 4.00<br />
32 F 37 0.0000 0.0000 0.0000 1.0000 0.00<br />
33 F 37 0.0000 0.0000 0.0000 1.0000 0.00<br />
34 F D 0.0600 1.5000 0.7300 0.7300 4.00<br />
36 F 36 0.1400 3.5000 0.8400 1.0000 11.00<br />
44 M 34 0.0500 1.2500 0.7750 1.0000 3.00<br />
47 M 33 0.0000 0.0000 0.0000 1.0000 0.00<br />
49 M 33 0.1000 2.5000 0.9450 1.0000 6.00<br />
55 M 32 0.0000 0.0000 0.0000 1.0000 0.00<br />
58 M 30 0.0000 0.0000 0.0000 1.0000 0.00<br />
62 M D 0.1600 4.0000 0.8550 0.8550 11.00<br />
65 F D 0.0800 2.0000 0.7700 0.7700 4.00<br />
76 M 23 0.0000 0.0000 0.0000 1.0000 0.00<br />
79 M 22 0.0000 0.0000 0.0000 1.0000 0.00<br />
81 M 22 0.0000 0.0000 0.0000 1.0000 0.00<br />
83 M 21 0.0000 0.0000 0.0000 1.0000 0.00<br />
88 M 20 0.0000 0.0000 0.0000 1.0000 0.00<br />
89 F 20 0.0200 0.5000 0.5000 1.0000 1.00<br />
105 F D 0.0100 0.2500 0.2500 0.2500 1.00<br />
121 M 13 0.0000 0.0000 0.0000 1.0000 0.00<br />
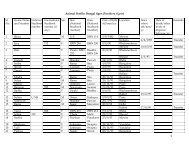
Individual statistics<br />
The genetic details of the living specimens in the <strong>Indian</strong> captive one <strong>horned</strong><br />
rhinoceros population are presented in table 15. The information contained in the<br />
table can be used to manage pairings. Specimens with low inbreeding coefficients<br />
and mean kinship values are suitable for breeding purposes than those with higher<br />
values. Similarly individuals with a large number of offspring (progeny) are less<br />
preferred over those with no offspring or a few offspring. The selection of individuals<br />
with no offspring or few offspring brings their gene pool into the population which<br />
would otherwise go unrepresented or underrepresented.<br />
38