On-line and in-situ measurement of turbidity and COD in ... - S-can
On-line and in-situ measurement of turbidity and COD in ... - S-can
On-line and in-situ measurement of turbidity and COD in ... - S-can

Create successful ePaper yourself
Turn your PDF publications into a flip-book with our unique Google optimized e-Paper software.
<strong>On</strong>-<strong>l<strong>in</strong>e</strong> <strong>and</strong> <strong>in</strong>-<strong>situ</strong> <strong>measurement</strong> <strong>of</strong> <strong>turbidity</strong> <strong>and</strong> <strong>COD</strong> <strong>in</strong><br />
wastewater us<strong>in</strong>g UV/VIS spectrometry<br />
N. Fleischmann*, G. Langergraber *, A. We<strong>in</strong>gartner **, F. H<strong>of</strong>staedter**, S. Nusch*** <strong>and</strong> P. Maurer***<br />
* Department for Sanitary Eng<strong>in</strong>eer<strong>in</strong>g <strong>and</strong> Water Pollution Control (IWGA-SIG), University <strong>of</strong> Agricultural<br />
Sciences Vienna (BOKU), Muthgasse 18, A-1190 Vienna, AUSTRIA<br />
(E-mail: fleischmann@iwga-sig.boku.ac.at, langergraber@iwga-sig.boku.ac.at)<br />
** s::<strong>can</strong> Messtechnik GmbH, Herm<strong>in</strong>engasse 10, A-1020 Vienna, AUSTRIA (www.s-<strong>can</strong>.at)<br />
(E-mail: awe<strong>in</strong>gartner@s-<strong>can</strong>.at, fhotstaedter@s-<strong>can</strong>.at)<br />
*** IAKS – Ingenieurbüro für Abfluß-, Kläranlagen-, Steuerung GmbH; H<strong>in</strong>delanger Straße 35, D-87327<br />
Sonth<strong>of</strong>en/Allgäu, Germany<br />
(E-mail: snusch@iaks.de, pmaurer@iaks.de)<br />
Abstract<br />
Advanced treatment plant <strong>and</strong> sewer network control is a promis<strong>in</strong>g application <strong>of</strong> modell<strong>in</strong>g <strong>in</strong><br />
the field <strong>of</strong> urban wastewater management. At the same time there are only vague ideas about the<br />
<strong>measurement</strong> techniques that would be necessary for model based real time prognosis <strong>and</strong> control.<br />
<strong>On</strong>e <strong>of</strong> he major tasks on the way towards on<strong>l<strong>in</strong>e</strong> modell<strong>in</strong>g is the search for <strong>and</strong> the validation <strong>of</strong><br />
<strong>measurement</strong> techniques. An UV/VIS spectrometer (“spectro::lyser”) was successfully used for<br />
measur<strong>in</strong>g organic matter at the highly dynamic <strong>in</strong>flow <strong>of</strong> a wastewater treatment plant. This<br />
poster describes the UV/VIS spectrometer, the calibration procedure <strong>and</strong> the results obta<strong>in</strong>ed.<br />
Keywords<br />
<strong>in</strong>-<strong>situ</strong> analysis, on-<strong>l<strong>in</strong>e</strong> monitor<strong>in</strong>g, UV/VIS sensor, wastewater.<br />
INTRODUCTION<br />
Advanced treatment plant <strong>and</strong> sewer network control is a promis<strong>in</strong>g application <strong>of</strong> modell<strong>in</strong>g <strong>in</strong> the<br />
field <strong>of</strong> urban wastewater management. At the same time there are only vague ideas about the<br />
<strong>measurement</strong> techniques that would be necessary for model based real time prognosis <strong>and</strong> control.<br />
<strong>On</strong>e <strong>of</strong> he major tasks on the way towards on<strong>l<strong>in</strong>e</strong> modell<strong>in</strong>g is the search for <strong>and</strong> the validation <strong>of</strong><br />
<strong>measurement</strong> techniques.<br />
<strong>On</strong>e task <strong>of</strong> the presented demonstration project is the development <strong>and</strong> validation <strong>of</strong> methods to<br />
quantify pollutant loads <strong>in</strong> real time. The project aims at the <strong>in</strong>tegrated management <strong>and</strong> control <strong>of</strong> a<br />
municipal sewer network <strong>and</strong> the treatment plant itself, based on <strong>in</strong>formation from dedicated<br />
<strong>measurement</strong>s.<br />
The devices to be selected for the purpose have to comply with several criteria that reflect<br />
especially the dem<strong>and</strong><strong>in</strong>g <strong>situ</strong>ation <strong>in</strong> sewers. These criteria concern simple technical requirements<br />
like power supply but also more sophisticated features like long term stability, foul<strong>in</strong>g prevention<br />
<strong>and</strong> self diagnosis.<br />
<strong>On</strong>e major step beyond the state <strong>of</strong> the art is expected to be done with the help <strong>of</strong> a submersible<br />
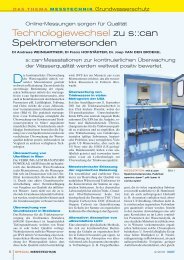
UV/VIS spectrometer (“spectro::lyser” by s::<strong>can</strong> Messtechnik GmbH, Vienna). This spectrometer<br />
was successfully used for measur<strong>in</strong>g <strong>turbidity</strong> <strong>and</strong> organic matter parameters at the <strong>in</strong>flow <strong>of</strong> a<br />
wastewater treatment plant.<br />
It is state <strong>of</strong> the art to measure light attenuation at one or two fixed wavelengths. The conventional<br />
<strong>measurement</strong> at 254 nm <strong>in</strong> order to quantify the content <strong>of</strong> dissolved organic carbons (<strong>in</strong> some cases<br />
compensated with the <strong>measurement</strong> at 350 nm) showed to be <strong>in</strong>sufficient for the desired<br />
<strong>measurement</strong>. The selected new method is able to solve open questions concern<strong>in</strong>g cross<br />
sensitivities, compensation or background elim<strong>in</strong>ation.
Feasibility studies <strong>in</strong>dicate strongly that spectrometric <strong>measurement</strong>s <strong>can</strong> give not only a surrogate<br />
for total organic carbon but also for different fractions <strong>of</strong> the organic load. Different degradation<br />
processes affect the spectra <strong>in</strong> a different manner. Signifi<strong>can</strong>tly different spectral features correlate<br />
to signifi<strong>can</strong>tly different properties <strong>of</strong> the organic load. However, this paper deals with results<br />
concern<strong>in</strong>g surrogates for conventional parameters, especially BOD, <strong>COD</strong>, <strong>and</strong> filtrated <strong>COD</strong><br />
(<strong>COD</strong>f).<br />
An other advantage <strong>of</strong> sensor <strong>measurement</strong>s as described here is that the costs do not depend on<br />
<strong>measurement</strong> frequency. Therefore they are especially suitable for the monitor<strong>in</strong>g <strong>of</strong> highly<br />
dynamic systems like ra<strong>in</strong>fall run<strong>of</strong>f <strong>in</strong> municipal comb<strong>in</strong>ed sewers <strong>and</strong> wastewater treatment<br />
plants.<br />
MATERIALS AND METHODS<br />
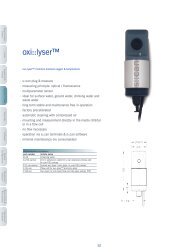
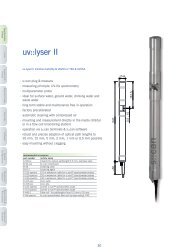
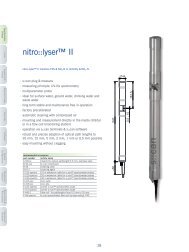
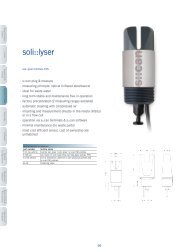
The “spectro::lyser” (Figure 1) is a spectrometric probe <strong>of</strong> about 0.6 m length <strong>and</strong> 4.5 cm diameter,<br />
records light attenuation <strong>in</strong> the wavelength region between 200 nm <strong>and</strong> 750 nm <strong>and</strong> displays <strong>and</strong>/or<br />
communicates the result <strong>in</strong> real time. It is a 2-beam 256 pixel UV/VIS spectrometer, with a Xenon<br />
lamp as a light source. A path length <strong>of</strong> 10 mm is used for raw wastewater. All <strong>of</strong> the controller<br />
electronics <strong>in</strong>clud<strong>in</strong>g a data logger <strong>and</strong> a water level meter are <strong>in</strong>cluded <strong>in</strong> a 44 mm tubular<br />
anodised alum<strong>in</strong>ium hous<strong>in</strong>g. The communication is via RS232 or RS485 <strong>in</strong>terface. The<br />
<strong>measurement</strong> takes place directly <strong>in</strong>-<strong>situ</strong> without sampl<strong>in</strong>g or sample treatment. A s<strong>in</strong>gle<br />
<strong>measurement</strong> typically takes about 15 seconds.<br />
Figure 1. “spectro::lyser” by s::<strong>can</strong> Messtechnik GmbH, Vienna.<br />
For the compensation <strong>of</strong> <strong>turbidity</strong> a mathematical equation was developed which describes the<br />
relationship between scatter<strong>in</strong>g <strong>in</strong>tensity <strong>and</strong> wavelength as a function <strong>of</strong> the particle diameter based<br />
on the basic relationships given <strong>in</strong> Huber <strong>and</strong> Frost (1998). The <strong>turbidity</strong> compensation feature uses<br />
the orig<strong>in</strong>al spectrum <strong>and</strong> estimates two parameters <strong>of</strong> the <strong>turbidity</strong> function. The results <strong>of</strong> the<br />
<strong>turbidity</strong> compensation showed to be very sensitive to the <strong>in</strong>itial values <strong>of</strong> these parameters.<br />
The company provides a global calibration for a number <strong>of</strong> parameters valid for typical municipal<br />
raw wastewater composition. Usually high correlation coefficients <strong>can</strong> be achieved us<strong>in</strong>g this<br />
st<strong>and</strong>ard parameter set. For many purposes such as plant control the global calibration <strong>of</strong>ten delivers<br />
sufficient results.
Due to the different composition <strong>of</strong> wastewaters, e.g. with signifi<strong>can</strong>t <strong>in</strong>dustrial contributions, a<br />
second step for calibration <strong>can</strong> be required to enhance the accuracy. The local calibration uses<br />
laboratory analysis from samples taken from the actual wastewater under consideration. The<br />
calibration procedure comprises the follow<strong>in</strong>g steps: validation <strong>of</strong> the spectral plausibility to<br />
exclude wrong spectra at the very beg<strong>in</strong>n<strong>in</strong>g, <strong>and</strong> a recursive procedure <strong>in</strong>clud<strong>in</strong>g a multivariate<br />
calibration us<strong>in</strong>g a PLS-regression (e.g. Legendre <strong>and</strong> Legendre, 1998), a multiple cross validation<br />
(e.g. Otto, 1997), <strong>and</strong> the detection <strong>and</strong> elim<strong>in</strong>ation <strong>of</strong> outliers. The recursive procedure is repeated<br />
until a good calibration result is obta<strong>in</strong>ed. It is also possible to run the local calibration procedure<br />
dur<strong>in</strong>g operation.<br />
RESULTS AND DISCUSSION<br />
The “spectro::lyser” was tested at the <strong>in</strong>fluent <strong>of</strong> a wastewater treatment plant for three weeks. The<br />
<strong>measurement</strong> <strong>in</strong>terval was 2 m<strong>in</strong>utes. The estimated <strong>COD</strong> values us<strong>in</strong>g the st<strong>and</strong>ard parameter set <strong>of</strong><br />
the global calibration for the whole period <strong>and</strong> for a s<strong>in</strong>gle day are shown <strong>in</strong> Figure 2 <strong>and</strong> Figure 3<br />
respectively. The correlation coefficient between the on-<strong>l<strong>in</strong>e</strong> <strong>COD</strong> values <strong>and</strong> grab samples<br />
analysed at the plants laboratory was about 90 %. Dur<strong>in</strong>g three weeks <strong>of</strong> operation the<br />
“spectro::lyser” was work<strong>in</strong>g without clean<strong>in</strong>g <strong>and</strong> ma<strong>in</strong>tenance work. No trends, which are a<br />
<strong>in</strong>dicator for pollution <strong>of</strong> the measur<strong>in</strong>g w<strong>in</strong>dow, could be observed. The criteria <strong>of</strong> long term<br />
stability <strong>and</strong> prevention <strong>of</strong> foul<strong>in</strong>g could be achieved.<br />
In Figure 2 <strong>and</strong> Figure 3 it becomes evident that the high <strong>measurement</strong> frequency gives a different<br />
type <strong>of</strong> <strong>in</strong>formation, compared to grab samples. Figure 3 shows the addition <strong>of</strong> <strong>in</strong>ternal process<br />
water <strong>in</strong> the morn<strong>in</strong>g <strong>and</strong> the clean<strong>in</strong>g <strong>in</strong>tervals <strong>of</strong> the screen (10 m<strong>in</strong>utes) at about 4:00 p.m. It is<br />
obvious that this type <strong>of</strong> "pollutogram" conta<strong>in</strong>s <strong>in</strong>formation which is totally different from an<br />
"average <strong>COD</strong>".<br />
<strong>COD</strong>, <strong>COD</strong>_eq [mg/l]<br />
600<br />
500<br />
400<br />
300<br />
200<br />
100<br />
0<br />
14.11.00<br />
15.11.00<br />
16.11.00<br />
17.11.00<br />
18.11.00<br />
Laboratory <strong>COD</strong><br />
spectro::lyser<br />
19.11.00<br />
20.11.00<br />
21.11.00<br />
22.11.00<br />
23.11.00<br />
Figure 2. <strong>On</strong>-<strong>l<strong>in</strong>e</strong> <strong>and</strong> laboratory <strong>COD</strong> dur<strong>in</strong>g the test<strong>in</strong>g period <strong>of</strong> 3 weeks.<br />
24.11.00<br />
25.11.00<br />
26.11.00<br />
27.11.00<br />
28.11.00<br />
29.11.00<br />
30.11.00<br />
01.12.00<br />
02.12.00<br />
03.12.00<br />
04.12.00<br />
05.12.00
spectro::lyser <strong>COD</strong>_eq [mg/l]<br />
400<br />
350<br />
300<br />
250<br />
200<br />
150<br />
100<br />
50<br />
0<br />
0:00<br />
6:00<br />
12:00<br />
Figure 3. <strong>On</strong>-<strong>l<strong>in</strong>e</strong> <strong>COD</strong> for a s<strong>in</strong>gle day.<br />
For the local calibration 39 data po<strong>in</strong>ts were used. For these data po<strong>in</strong>ts analysis <strong>of</strong> <strong>COD</strong>, filtrated<br />
<strong>COD</strong>, <strong>and</strong> BOD were available. None <strong>of</strong> these data po<strong>in</strong>ts was excluded due to its non-plausibility,<br />
4 data po<strong>in</strong>ts were detected as outliers <strong>and</strong> elim<strong>in</strong>ated. The results shown for the local calibration<br />
therefore use 35 data po<strong>in</strong>ts.<br />
The local calibration <strong>in</strong>creases the correlation coefficient for <strong>COD</strong> only to a little amount (92 %).<br />
Figure 4 shows 1 out <strong>of</strong> 100 cross validations performed. The data used for validation (circles)<br />
scatter no more around the regression <strong>l<strong>in</strong>e</strong> than the data from which the regression <strong>l<strong>in</strong>e</strong> is calculated<br />
from (rhombuses). Figure 4 also shows the stability <strong>of</strong> the obta<strong>in</strong>ed calibration: a number <strong>of</strong><br />
co<strong>in</strong>cidental chosen data po<strong>in</strong>ts fits the calibration that results from the rema<strong>in</strong><strong>in</strong>g data po<strong>in</strong>ts.<br />
Laboratory <strong>COD</strong> [mg/l]<br />
1000<br />
800<br />
600<br />
400<br />
200<br />
0<br />
18:00<br />
R 2 = 92.0%<br />
data for calibration<br />
data for validation<br />
0 200 400 600 800 1000<br />
spectro::lyser <strong>COD</strong>_eq [mg/l]<br />
Figure 4. Calibration <strong>and</strong> validation data <strong>of</strong> <strong>COD</strong>.<br />
0:00
Figure 5 gives results <strong>of</strong> cross validations performed for filtrated <strong>COD</strong> (<strong>COD</strong>f) <strong>and</strong> BOD, the<br />
correlation coefficient achieved was 96.7 % <strong>and</strong> 88.2 % respectively. The results show a similar<br />
behaviour as obta<strong>in</strong>ed for <strong>COD</strong>.<br />
Laboratory <strong>COD</strong>f [mg/l]<br />
400<br />
300<br />
200<br />
100<br />
0<br />
R 2 = 96.9%<br />
data for calibration<br />
data for validation<br />
0 100 200 300 400<br />
spectro::lyser <strong>COD</strong>f_eq [mg/l]<br />
Laboratory BOD [mg/l]<br />
250<br />
200<br />
150<br />
100<br />
50<br />
R 2 = 88.2%<br />
data for calibration<br />
data for validation<br />
0<br />
0 50 100 150 200 250<br />
spectro::lyser BOD_eq [mg/l]<br />
Figure 5. Calibration <strong>and</strong> validation data <strong>of</strong> <strong>COD</strong>f (left) <strong>and</strong> BOD (right).<br />
As expected the correlation coefficient was highest for filtrated <strong>COD</strong>. This is due to elim<strong>in</strong>ation <strong>of</strong><br />
the particulate matter for the analysis <strong>of</strong> filtrated <strong>COD</strong>. The particulate matter is known as the ma<strong>in</strong><br />
contribution to the sampl<strong>in</strong>g error (Haider <strong>and</strong> Haider, 1998) <strong>and</strong> therefore also contributes to the<br />
“total error <strong>of</strong> <strong>measurement</strong>” <strong>of</strong> <strong>COD</strong> <strong>and</strong> BOD.<br />
Interpretation <strong>of</strong> the results has to consider the “total error <strong>of</strong> <strong>measurement</strong>” (TOM) which consists<br />
<strong>of</strong> sampl<strong>in</strong>g, sample transport <strong>and</strong> storage error <strong>and</strong> a usually very small analytical error. Often<br />
comparison <strong>of</strong> field <strong>and</strong> lab methods only take the analytical error <strong>in</strong>to account <strong>and</strong> neglect other<br />
elements <strong>of</strong> the sample to lab cha<strong>in</strong>. Unfortunately the major error contributions are unknown <strong>in</strong><br />
most cases, nevertheless this fact has to be kept <strong>in</strong> m<strong>in</strong>d. The errors <strong>of</strong> the sample to lab cha<strong>in</strong> <strong>can</strong><br />
be avoided by <strong>in</strong>-<strong>situ</strong> <strong>measurement</strong> devices like the “spectro::lyser” <strong>and</strong> therefore the TOM is<br />
reduced signifi<strong>can</strong>tly.<br />
Another consideration concerns to which extent a sample is representative. Go<strong>in</strong>g beyond<br />
comparison <strong>of</strong> sampl<strong>in</strong>g <strong>and</strong> lab error it has to be taken <strong>in</strong>to account that frequent <strong>measurement</strong><br />
elim<strong>in</strong>ates all statistical problems concern<strong>in</strong>g representativity.<br />
SUMMARY<br />
This poster deals with results concern<strong>in</strong>g surrogates for conventional parameters for organic matter<br />
(BOD, <strong>COD</strong>, <strong>and</strong> filtrated <strong>COD</strong>) <strong>in</strong> the <strong>in</strong>fluent <strong>of</strong> wastewater treatment plants. The <strong>measurement</strong>s<br />
us<strong>in</strong>g the “spectro::lyser” have shown a sufficient correlation with reference methods especially<br />
when tak<strong>in</strong>g the “total error <strong>of</strong> <strong>measurement</strong>” <strong>in</strong>to account.<br />
At the same time the “spectro::lyser” meets other criteria like affordability at a desired <strong>measurement</strong><br />
frequency. The high <strong>measurement</strong> frequency also avoids problems concern<strong>in</strong>g the statistical<br />
representativity <strong>of</strong> a sample. The cost <strong>of</strong> sensor <strong>measurement</strong>s does not depend on <strong>measurement</strong><br />
frequency. Therefore <strong>in</strong>-<strong>situ</strong> <strong>measurement</strong> devices like the “spectro::lyser” are especially suitable<br />
for the monitor<strong>in</strong>g <strong>of</strong> highly dynamic systems like ra<strong>in</strong>fall run<strong>of</strong>f <strong>in</strong> municipal comb<strong>in</strong>ed sewers <strong>and</strong><br />
<strong>in</strong>fluents <strong>of</strong> wastewater treatment plants.<br />
The “spectro::lyser” has proved to be a valuable device for on-<strong>l<strong>in</strong>e</strong> <strong>and</strong> <strong>in</strong>-<strong>situ</strong> <strong>measurement</strong>s <strong>of</strong><br />
organic matter <strong>in</strong> highly dynamic systems with high accuracy <strong>and</strong> only little ma<strong>in</strong>tenance work
needed. Def<strong>in</strong>ed criteria such as long term stability <strong>and</strong> foul<strong>in</strong>g prevention are fulfilled completely.<br />
Us<strong>in</strong>g the “spectro::lyser” enables the quantification <strong>of</strong> organic loads <strong>of</strong> wastewater treatment plants<br />
<strong>in</strong> real-time <strong>and</strong> is therefore a basic requirement for on-<strong>l<strong>in</strong>e</strong> prognosis <strong>and</strong> control applications.<br />
REFERENCES<br />
Haider R. & S. Haider (1998): Overestimated <strong>COD</strong> values for raw wastewaters extracted by<br />
vacuum sampl<strong>in</strong>g devices due to sedimentation effects; Wat. Sci. Tech. 37(12), 293-300.<br />
Huber E. <strong>and</strong> Frost M. (1998): Light scatter<strong>in</strong>g by small particles; J Water SRT – Aqua 47(2), 87-<br />
94.<br />
Legendre P. <strong>and</strong> Legendre L. (1998): Numerical Ecology – Second English Edition; Developments<br />
<strong>in</strong> Environmental Modell<strong>in</strong>g 20, Elsevier, Amsterdam.<br />
Otto M. (1997): Chemometrie: Satistik und Computere<strong>in</strong>satz <strong>in</strong> der Analytik; VCH, We<strong>in</strong>heim.