

Analytical Chemistry Chemical Cytometry Quantitates Superoxide
Analytical Chemistry Chemical Cytometry Quantitates Superoxide
Analytical Chemistry Chemical Cytometry Quantitates Superoxide

Create successful ePaper yourself
Turn your PDF publications into a flip-book with our unique Google optimized e-Paper software.
(pH 8.0) with cysteine and cystamine at concentrations of 6 and<br />
1 mM, respectively. Isoform-A was enriched by incubating the<br />
IgG2 under the same conditions but with the addition of 1.0 M<br />
guanidinium chloride (GuHCl) to the buffer. The samples were<br />
protected from light at 2-8 °C for approximately 48 h.<br />
The IgG2 mAb#3 was subjected to Cysf Ser mutagenesis at<br />
position 232 as described by Allen et al. 10 Site-directed mutagenesis<br />
was performed using the QuickChange XL site-directed mutagenesis<br />
kit (Stratagene, La Jolla, CA). The mutant was stably transfected into<br />
a serum-free suspension-adapted CHO cell line. 31 Following production,<br />
the mAb was purified by protein A affinity chromatography.<br />
Incorporation of the expected mutation was verified on the purified<br />
molecule by size exclusion chromatography (SEC) MS. 12<br />
For IMMS analysis, IgG samples were buffer exchanged and<br />
concentrated using Vivaspin 30 kDa molecular weight cutoff filters<br />
(GE Healthcare, Buckinghamshire, UK). For experiments performed<br />
under native conditions, the IgGs were diluted using 160 mM<br />
ammonium acetate (pH not adjusted) to a final working concentration<br />
of ∼3 µM.<br />
Mass spectrometry experiments were performed using a<br />
hybrid ion mobility quadrupole time-of-flight MS (Synapt, Waters<br />
Inc., Milford, MA) equipped with a nanoelectrospray ionization<br />
(ESI) source using metal coated borosilicate glass capillaries<br />
(nanoflow probe tips, long thin walled, Waters Corporation).<br />
Solution flow rates of ∼75 nL/min and an ESI capillary voltage of<br />
∼1.3 kV were used for all experiments. The source temperature<br />
was 50 °C, and the pressure of the vacuum/backing region was<br />
3.5 mbar. Each ion mobility mass spectrum was acquired from<br />
m/z 4000-8000 every 2 s; approximately 12 counts per scan were<br />
observed. The signal was typically averaged for approximately 10<br />
min. Gentle source conditions were used to minimize gas phase<br />
unfolding of the protein (sample cone: 40 V, trap voltage: 10 V,<br />
transfer lens: 12 V, bias: 25; cone gas: 30 L/Hr; P TRAP(Ar): 0.0175<br />
mbar). Nitrogen was used as the mobility carrier gas, and the<br />
following parameters were found to give optimal ion mobility<br />
separation (PIMS: 0.5 mbar, wave velocity: 300 m/s, wave height:<br />
9.8 V). The instrument was mass calibrated using a 50 µg/µL<br />
CsI solution. Waters’ raw data files were translated to Matlab<br />
binary files using software developed in-house. Data processing<br />
and plotting were performed in Matlab (The MathWorks Inc.<br />
Natick, MA) and Igor Pro (WaveMetrics Inc., Lake Oswego, OR).<br />
RESULTS AND DISCUSSION<br />
Antibodies belonging to the IgG2 subclass exist as a group of<br />
distinct isoforms with different disulfide connectivities between<br />
the Fab domain and the hinge region of the molecule. The goal<br />
of this study was to investigate the ability of IMMS to successfully<br />
separate these discrete IgG2 isoforms.<br />
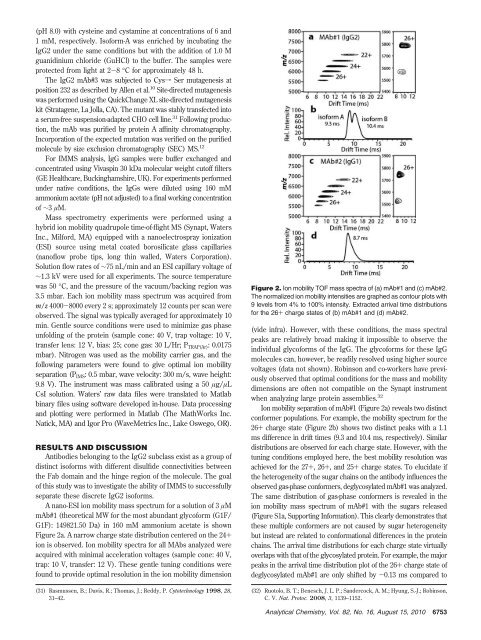
A nano-ESI ion mobility mass spectrum for a solution of 3 µM<br />
mAb#1 (theoretical MW for the most abundant glycoform (G1F/<br />
G1F): 149821.50 Da) in 160 mM ammonium acetate is shown<br />
Figure 2a. A narrow charge state distribution centered on the 24+<br />
ion is observed. Ion mobility spectra for all MAbs analyzed were<br />
acquired with minimal acceleration voltages (sample cone: 40 V,<br />
trap: 10 V, transfer: 12 V). These gentle tuning conditions were<br />
found to provide optimal resolution in the ion mobility dimension<br />
(31) Rasmussen, B.; Davis, R.; Thomas, J.; Reddy, P. Cytotechnology 1998, 28,<br />
31–42.<br />
Figure 2. Ion mobility TOF mass spectra of (a) mAb#1 and (c) mAb#2.<br />
The normalized ion mobility intensities are graphed as contour plots with<br />
9 levels from 4% to 100% intensity. Extracted arrival time distributions<br />
for the 26+ charge states of (b) mAb#1 and (d) mAb#2.<br />
(vide infra). However, with these conditions, the mass spectral<br />
peaks are relatively broad making it impossible to observe the<br />
individual glycoforms of the IgG. The glycoforms for these IgG<br />
molecules can, however, be readily resolved using higher source<br />
voltages (data not shown). Robinson and co-workers have previously<br />
observed that optimal conditions for the mass and mobility<br />
dimensions are often not compatible on the Synapt instrument<br />
when analyzing large protein assemblies. 32<br />
Ion mobility separation of mAb#1 (Figure 2a) reveals two distinct<br />
conformer populations. For example, the mobility spectrum for the<br />
26+ charge state (Figure 2b) shows two distinct peaks with a 1.1<br />
ms difference in drift times (9.3 and 10.4 ms, respectively). Similar<br />
distributions are observed for each charge state. However, with the<br />
tuning conditions employed here, the best mobility resolution was<br />
achieved for the 27+, 26+, and 25+ charge states. To elucidate if<br />
the heterogeneity of the sugar chains on the antibody influences the<br />
observed gas-phase conformers, deglycosylated mAb#1 was analyzed.<br />
The same distribution of gas-phase conformers is revealed in the<br />
ion mobility mass spectrum of mAb#1 with the sugars released<br />
(Figure S1a, Supporting Information). This clearly demonstrates that<br />
these multiple conformers are not caused by sugar heterogeneity<br />
but instead are related to conformational differences in the protein<br />
chains. The arrival time distributions for each charge state virtually<br />
overlaps with that of the glycosylated protein. For example, the major<br />
peaks in the arrival time distribution plot of the 26+ charge state of<br />
deglycosylated mAb#1 are only shifted by -0.13 ms compared to<br />
(32) Ruotolo, B. T.; Benesch, J. L. P.; Sandercock, A. M.; Hyung, S.-J.; Robinson,<br />
C. V. Nat. Protoc. 2008, 3, 1139–1152.<br />
<strong>Analytical</strong> <strong>Chemistry</strong>, Vol. 82, No. 16, August 15, 2010<br />
6753


