

Analytical Chemistry Chemical Cytometry Quantitates Superoxide
Analytical Chemistry Chemical Cytometry Quantitates Superoxide
Analytical Chemistry Chemical Cytometry Quantitates Superoxide

Create successful ePaper yourself
Turn your PDF publications into a flip-book with our unique Google optimized e-Paper software.
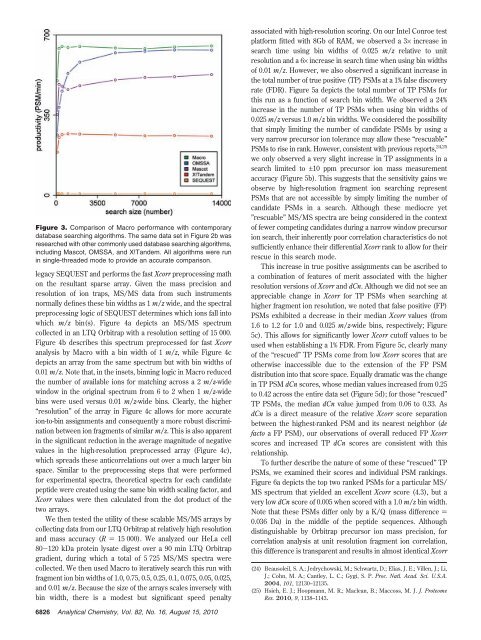
Figure 3. Comparison of Macro performance with contemporary<br />
database searching algorithms. The same data set in Figure 2b was<br />
researched with other commonly used database searching algorithms,<br />
including Mascot, OMSSA, and X!Tandem. All algorithms were run<br />
in single-threaded mode to provide an accurate comparison.<br />
legacy SEQUEST and performs the fast Xcorr preprocessing math<br />
on the resultant sparse array. Given the mass precision and<br />
resolution of ion traps, MS/MS data from such instruments<br />
normally defines these bin widths as 1 m/z wide, and the spectral<br />
preprocessing logic of SEQUEST determines which ions fall into<br />
which m/z bin(s). Figure 4a depicts an MS/MS spectrum<br />
collected in an LTQ Orbitrap with a resolution setting of 15 000.<br />
Figure 4b describes this spectrum preprocessed for fast Xcorr<br />
analysis by Macro with a bin width of 1 m/z, while Figure 4c<br />
depicts an array from the same spectrum but with bin widths of<br />
0.01 m/z. Note that, in the insets, binning logic in Macro reduced<br />
the number of available ions for matching across a 2 m/z-wide<br />
window in the original spectrum from 6 to 2 when 1 m/z-wide<br />
bins were used versus 0.01 m/z-wide bins. Clearly, the higher<br />
“resolution” of the array in Figure 4c allows for more accurate<br />
ion-to-bin assignments and consequently a more robust discrimination<br />
between ion fragments of similar m/z. This is also apparent<br />
in the significant reduction in the average magnitude of negative<br />
values in the high-resolution preprocessed array (Figure 4c),<br />
which spreads these anticorrelations out over a much larger bin<br />
space. Similar to the preprocessing steps that were performed<br />
for experimental spectra, theoretical spectra for each candidate<br />
peptide were created using the same bin width scaling factor, and<br />
Xcorr values were then calculated from the dot product of the<br />
two arrays.<br />
We then tested the utility of these scalable MS/MS arrays by<br />
collecting data from our LTQ Orbitrap at relatively high resolution<br />
and mass accuracy (R ) 15 000). We analyzed our HeLa cell<br />
80-120 kDa protein lysate digest over a 90 min LTQ Orbitrap<br />
gradient, during which a total of 5 725 MS/MS spectra were<br />
collected. We then used Macro to iteratively search this run with<br />
fragment ion bin widths of 1.0, 0.75, 0.5, 0.25, 0.1, 0.075, 0.05, 0.025,<br />
and 0.01 m/z. Because the size of the arrays scales inversely with<br />
bin width, there is a modest but significant speed penalty<br />
6826 <strong>Analytical</strong> <strong>Chemistry</strong>, Vol. 82, No. 16, August 15, 2010<br />
associated with high-resolution scoring. On our Intel Conroe test<br />
platform fitted with 8Gb of RAM, we observed a 3× increase in<br />
search time using bin widths of 0.025 m/z relative to unit<br />
resolution and a 6× increase in search time when using bin widths<br />
of 0.01 m/z. However, we also observed a significant increase in<br />
the total number of true positive (TP) PSMs at a 1% false discovery<br />
rate (FDR). Figure 5a depicts the total number of TP PSMs for<br />
this run as a function of search bin width. We observed a 24%<br />
increase in the number of TP PSMs when using bin widths of<br />
0.025 m/z versus 1.0 m/z bin widths. We considered the possibility<br />
that simply limiting the number of candidate PSMs by using a<br />
very narrow precursor ion tolerance may allow these “rescuable”<br />
PSMs to rise in rank. However, consistent with previous reports, 24,25<br />
we only observed a very slight increase in TP assignments in a<br />
search limited to ±10 ppm precursor ion mass measurement<br />
accuracy (Figure 5b). This suggests that the sensitivity gains we<br />
observe by high-resolution fragment ion searching represent<br />
PSMs that are not accessible by simply limiting the number of<br />
candidate PSMs in a search. Although these mediocre yet<br />
”rescuable” MS/MS spectra are being considered in the context<br />
of fewer competing candidates during a narrow window precursor<br />
ion search, their inherently poor correlation characteristics do not<br />
sufficiently enhance their differential Xcorr rank to allow for their<br />
rescue in this search mode.<br />
This increase in true positive assignments can be ascribed to<br />
a combination of features of merit associated with the higher<br />
resolution versions of Xcorr and dCn. Although we did not see an<br />
appreciable change in Xcorr for TP PSMs when searching at<br />
higher fragment ion resolution, we noted that false positive (FP)<br />
PSMs exhibited a decrease in their median Xcorr values (from<br />
1.6 to 1.2 for 1.0 and 0.025 m/z-wide bins, respectively; Figure<br />
5c). This allows for significantly lower Xcorr cutoff values to be<br />
used when establishing a 1% FDR. From Figure 5c, clearly many<br />
of the “rescued” TP PSMs come from low Xcorr scores that are<br />
otherwise inaccessible due to the extension of the FP PSM<br />
distribution into that score space. Equally dramatic was the change<br />
in TP PSM dCn scores, whose median values increased from 0.25<br />
to 0.42 across the entire data set (Figure 5d); for those “rescued”<br />
TP PSMs, the median dCn value jumped from 0.06 to 0.33. As<br />
dCn is a direct measure of the relative Xcorr score separation<br />
between the highest-ranked PSM and its nearest neighbor (de<br />
facto a FP PSM), our observations of overall reduced FP Xcorr<br />
scores and increased TP dCn scores are consistent with this<br />
relationship.<br />
To further describe the nature of some of these “rescued” TP<br />
PSMs, we examined their scores and individual PSM rankings.<br />
Figure 6a depicts the top two ranked PSMs for a particular MS/<br />
MS spectrum that yielded an excellent Xcorr score (4.3), but a<br />
very low dCn score of 0.005 when scored with a 1.0 m/z bin width.<br />
Note that these PSMs differ only by a K/Q (mass difference )<br />
0.036 Da) in the middle of the peptide sequences. Although<br />
distinguishable by Orbitrap precursor ion mass precision, for<br />
correlation analysis at unit resolution fragment ion correlation,<br />
this difference is transparent and results in almost identical Xcorr<br />
(24) Beausoleil, S. A.; Jedrychowski, M.; Schwartz, D.; Elias, J. E.; Villen, J.; Li,<br />
J.; Cohn, M. A.; Cantley, L. C.; Gygi, S. P. Proc. Natl. Acad. Sci. U.S.A.<br />
2004, 101, 12130–12135.<br />
(25) Hsieh, E. J.; Hoopmann, M. R.; Maclean, B.; Maccoss, M. J. J. Proteome<br />
Res. 2010, 9, 1138–1143.


