

Analytical Chemistry Chemical Cytometry Quantitates Superoxide
Analytical Chemistry Chemical Cytometry Quantitates Superoxide
Analytical Chemistry Chemical Cytometry Quantitates Superoxide

You also want an ePaper? Increase the reach of your titles
YUMPU automatically turns print PDFs into web optimized ePapers that Google loves.
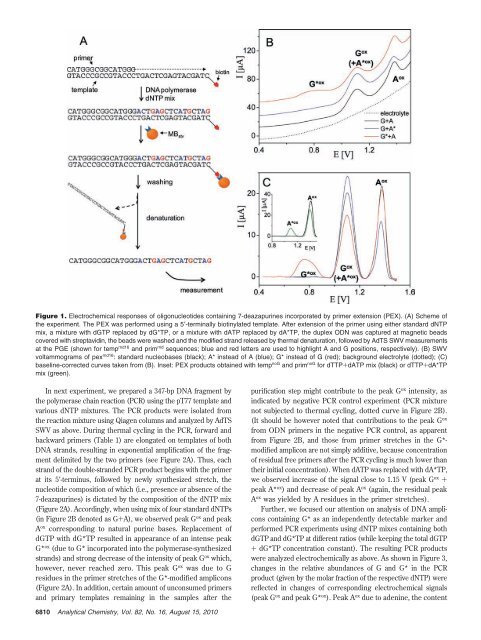
Figure 1. Electrochemical responses of oligonucleotides containing 7-deazapurines incorporated by primer extension (PEX). (A) Scheme of<br />
the experiment. The PEX was performed using a 5′-terminally biotinylated template. After extension of the primer using either standard dNTP<br />
mix, a mixture with dGTP replaced by dG*TP, or a mixture with dATP replaced by dA*TP, the duplex ODN was captured at magnetic beads<br />
covered with streptavidin, the beads were washed and the modified strand released by thermal denaturation, followed by AdTS SWV measurements<br />
at the PGE (shown for temp rnd16 and prim rnd sequences; blue and red letters are used to highlight A and G positions, respectively). (B) SWV<br />
voltammograms of pex rnd16 : standard nucleobases (black); A* instead of A (blue); G* instead of G (red); background electrolyte (dotted); (C)<br />
baseline-corrected curves taken from (B). Inset: PEX products obtained with temp noG and prim noG for dTTP+dATP mix (black) or dTTP+dA*TP<br />
mix (green).<br />
In next experiment, we prepared a 347-bp DNA fragment by<br />
the polymerase chain reaction (PCR) using the pT77 template and<br />
various dNTP mixtures. The PCR products were isolated from<br />
the reaction mixture using Qiagen columns and analyzed by AdTS<br />
SWV as above. During thermal cycling in the PCR, forward and<br />
backward primers (Table 1) are elongated on templates of both<br />
DNA strands, resulting in exponential amplification of the fragment<br />
delimited by the two primers (see Figure 2A). Thus, each<br />
strand of the double-stranded PCR product begins with the primer<br />
at its 5′-terminus, followed by newly synthesized stretch, the<br />
nucleotide composition of which (i.e., presence or absence of the<br />
7-deazapurines) is dictated by the composition of the dNTP mix<br />
(Figure 2A). Accordingly, when using mix of four standard dNTPs<br />
(in Figure 2B denoted as G+A), we observed peak G ox and peak<br />
A ox corresponding to natural purine bases. Replacement of<br />
dGTP with dG*TP resulted in appearance of an intense peak<br />
G* ox (due to G* incorporated into the polymerase-synthesized<br />
strands) and strong decrease of the intensity of peak G ox which,<br />
however, never reached zero. This peak G ox was due to G<br />
residues in the primer stretches of the G*-modified amplicons<br />
(Figure 2A). In addition, certain amount of unconsumed primers<br />
and primary templates remaining in the samples after the<br />
6810 <strong>Analytical</strong> <strong>Chemistry</strong>, Vol. 82, No. 16, August 15, 2010<br />
purification step might contribute to the peak G ox intensity, as<br />
indicated by negative PCR control experiment (PCR mixture<br />
not subjected to thermal cycling, dotted curve in Figure 2B).<br />
(It should be however noted that contributions to the peak G ox<br />
from ODN primers in the negative PCR control, as apparent<br />
from Figure 2B, and those from primer stretches in the G*modified<br />
amplicon are not simply additive, because concentration<br />
of residual free primers after the PCR cycling is much lower than<br />
their initial concentration). When dATP was replaced with dA*TP,<br />
we observed increase of the signal close to 1.15 V (peak G ox +<br />
peak A* ox ) and decrease of peak A ox (again, the residual peak<br />
A ox was yielded by A residues in the primer stretches).<br />
Further, we focused our attention on analysis of DNA amplicons<br />
containing G* as an independently detectable marker and<br />
performed PCR experiments using dNTP mixes containing both<br />
dGTP and dG*TP at different ratios (while keeping the total dGTP<br />
+ dG*TP concentration constant). The resulting PCR products<br />
were analyzed electrochemically as above. As shown in Figure 3,<br />
changes in the relative abundances of G and G* in the PCR<br />
product (given by the molar fraction of the respective dNTP) were<br />
reflected in changes of corresponding electrochemical signals<br />
(peak G ox and peak G* ox ). Peak A ox due to adenine, the content


