

Analytical Chemistry Chemical Cytometry Quantitates Superoxide
Analytical Chemistry Chemical Cytometry Quantitates Superoxide
Analytical Chemistry Chemical Cytometry Quantitates Superoxide

Create successful ePaper yourself
Turn your PDF publications into a flip-book with our unique Google optimized e-Paper software.
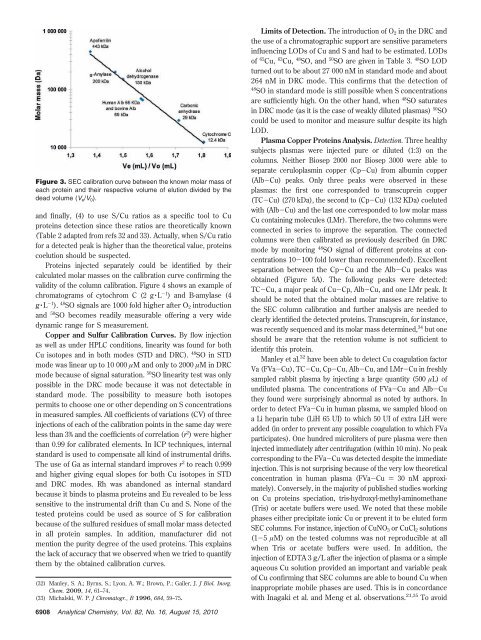
Figure 3. SEC calibration curve between the known molar mass of<br />
each protein and their respective volume of elution divided by the<br />
dead volume (Ve/V0).<br />
and finally, (4) to use S/Cu ratios as a specific tool to Cu<br />
proteins detection since these ratios are theoretically known<br />
(Table 2 adapted from refs 32 and 33). Actually, when S/Cu ratio<br />
for a detected peak is higher than the theoretical value, proteins<br />
coelution should be suspected.<br />
Proteins injected separately could be identified by their<br />
calculated molar masses on the calibration curve confirming the<br />
validity of the column calibration. Figure 4 shows an example of<br />
chromatograms of cytochrom C (2 g · L -1 ) and B-amylase (4<br />
g · L -1 ). 48 SO signals are 1000 fold higher after O2 introduction<br />
and 50 SO becomes readily measurable offering a very wide<br />
dynamic range for S measurement.<br />
Copper and Sulfur Calibration Curves. By flow injection<br />
as well as under HPLC conditions, linearity was found for both<br />
Cu isotopes and in both modes (STD and DRC). 48 SO in STD<br />
mode was linear up to 10 000 µM and only to 2000 µM inDRC<br />
mode because of signal saturation. 50 SO linearity test was only<br />
possible in the DRC mode because it was not detectable in<br />
standard mode. The possibility to measure both isotopes<br />
permits to choose one or other depending on S concentrations<br />
in measured samples. All coefficients of variations (CV) of three<br />
injections of each of the calibration points in the same day were<br />
less than 3% and the coefficients of correlation (r 2 ) were higher<br />
than 0.99 for calibrated elements. In ICP techniques, internal<br />
standard is used to compensate all kind of instrumental drifts.<br />
The use of Ga as internal standard improves r 2 to reach 0.999<br />
and higher giving equal slopes for both Cu isotopes in STD<br />
and DRC modes. Rh was abandoned as internal standard<br />
because it binds to plasma proteins and Eu revealed to be less<br />
sensitive to the instrumental drift than Cu and S. None of the<br />
tested proteins could be used as source of S for calibration<br />
because of the sulfured residues of small molar mass detected<br />
in all protein samples. In addition, manufacturer did not<br />
mention the purity degree of the used proteins. This explains<br />
the lack of accuracy that we observed when we tried to quantify<br />
them by the obtained calibration curves.<br />
(32) Manley, S. A.; Byrns, S.; Lyon, A. W.; Brown, P.; Gailer, J. J Biol. Inorg.<br />
Chem. 2009, 14, 61–74.<br />
(33) Michalski, W. P. J Chromatogr., B 1996, 684, 59–75.<br />
6908 <strong>Analytical</strong> <strong>Chemistry</strong>, Vol. 82, No. 16, August 15, 2010<br />
Limits of Detection. The introduction of O2 in the DRC and<br />
the use of a chromatographic support are sensitive parameters<br />
influencing LODs of Cu and S and had to be estimated. LODs<br />
of 65 Cu, 63 Cu, 48 SO, and 50 SO are given in Table 3. 48 SO LOD<br />
turned out to be about 27 000 nM in standard mode and about<br />
264 nM in DRC mode. This confirms that the detection of<br />
48 SO in standard mode is still possible when S concentrations<br />
are sufficiently high. On the other hand, when 48 SO saturates<br />
in DRC mode (as it is the case of weakly diluted plasmas) 50 SO<br />
could be used to monitor and measure sulfur despite its high<br />
LOD.<br />
Plasma Copper Proteins Analysis. Detection. Three healthy<br />
subjects plasmas were injected pure or diluted (1:3) on the<br />
columns. Neither Biosep 2000 nor Biosep 3000 were able to<br />
separate ceruloplasmin copper (Cp-Cu) from albumin copper<br />
(Alb-Cu) peaks. Only three peaks were observed in these<br />
plasmas: the first one corresponded to transcuprein copper<br />
(TC-Cu) (270 kDa), the second to (Cp-Cu) (132 KDa) coeluted<br />
with (Alb-Cu) and the last one corresponded to low molar mass<br />
Cu containing molecules (LMr). Therefore, the two columns were<br />
connected in series to improve the separation. The connected<br />
columns were then calibrated as previously described (in DRC<br />
mode by monitoring 48 SO signal of different proteins at concentrations<br />
10-100 fold lower than recommended). Excellent<br />
separation between the Cp-Cu and the Alb-Cu peaks was<br />
obtained (Figure 5A). The following peaks were detected:<br />
TC-Cu, a major peak of Cu-Cp, Alb-Cu, and one LMr peak. It<br />
should be noted that the obtained molar masses are relative to<br />
the SEC column calibration and further analysis are needed to<br />
clearly identified the detected proteins. Transcuprein, for instance,<br />
was recently sequenced and its molar mass determined, 34 but one<br />
should be aware that the retention volume is not sufficient to<br />
identify this protein.<br />
Manley et al. 32 have been able to detect Cu coagulation factor<br />
Va (FVa-Cu), TC-Cu, Cp-Cu, Alb-Cu, and LMr-Cu in freshly<br />
sampled rabbit plasma by injecting a large quantity (500 µL) of<br />
undiluted plasma. The concentrations of FVa-Cu and Alb-Cu<br />
they found were surprisingly abnormal as noted by authors. In<br />
order to detect FVa-Cu in human plasma, we sampled blood on<br />
a Li heparin tube (LiH 65 UI) to which 50 UI of extra LiH were<br />
added (in order to prevent any possible coagulation to which FVa<br />
participates). One hundred microliters of pure plasma were then<br />
injected immediately after centrifugation (within 10 min). No peak<br />
corresponding to the FVa-Cu was detected despite the immediate<br />
injection. This is not surprising because of the very low theoretical<br />
concentration in human plasma (FVa-Cu ) 30 nM approximately).<br />
Conversely, in the majority of published studies working<br />
on Cu proteins speciation, tris-hydroxyl-methyl-aminomethane<br />
(Tris) or acetate buffers were used. We noted that these mobile<br />
phases either precipitate ionic Cu or prevent it to be eluted form<br />
SEC columns. For instance, injection of CuNO3 or CuCl2 solutions<br />
(1-5 µM) on the tested columns was not reproducible at all<br />
when Tris or acetate buffers were used. In addition, the<br />
injection of EDTA 3 g/L after the injection of plasma or a simple<br />
aqueous Cu solution provided an important and variable peak<br />
of Cu confirming that SEC columns are able to bound Cu when<br />
inappropriate mobile phases are used. This is in concordance<br />
with Inagaki et al. and Meng et al. observations. 21,35 To avoid


