

Analytical Chemistry Chemical Cytometry Quantitates Superoxide
Analytical Chemistry Chemical Cytometry Quantitates Superoxide
Analytical Chemistry Chemical Cytometry Quantitates Superoxide

You also want an ePaper? Increase the reach of your titles
YUMPU automatically turns print PDFs into web optimized ePapers that Google loves.
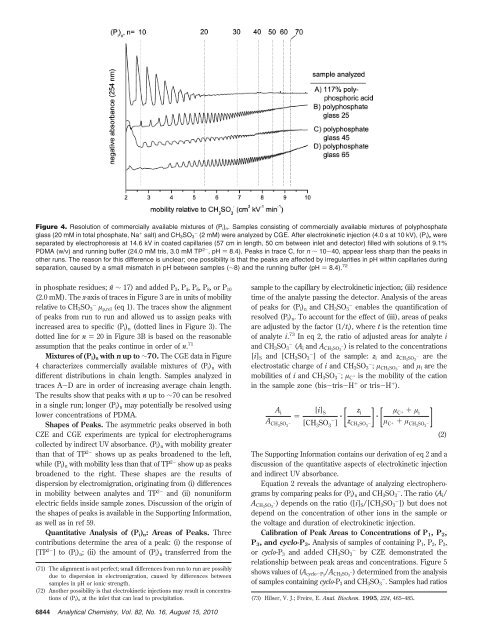
Figure 4. Resolution of commercially available mixtures of (Pi)n. Samples consisting of commercially available mixtures of polyphosphate<br />
glass (20 mM in total phosphate, Na + salt) and CH3SO3 - (2 mM) were analyzed by CGE. After electrokinetic injection (4.0 s at 10 kV), (Pi)n were<br />
separated by electrophoresis at 14.6 kV in coated capillaries (57 cm in length, 50 cm between inlet and detector) filled with solutions of 9.1%<br />
PDMA (w/v) and running buffer (24.0 mM tris, 3.0 mM TP 2- ,pH) 8.4). Peaks in trace C, for n ∼ 10-40, appear less sharp than the peaks in<br />
other runs. The reason for this difference is unclear; one possibility is that the peaks are affected by irregularities in pH within capillaries during<br />
separation, caused by a small mismatch in pH between samples (∼8) and the running buffer (pH ) 8.4). 72<br />
in phosphate residues; n¯ ∼ 17) and added P3, P4, P6, P8, orP10<br />
(2.0 mM). The x-axis of traces in Figure 3 are in units of mobility<br />
relative to CH3SO3 - µp,rel (eq 1). The traces show the alignment<br />
of peaks from run to run and allowed us to assign peaks with<br />
increased area to specific (Pi)n (dotted lines in Figure 3). The<br />
dotted line for n ) 20 in Figure 3B is based on the reasonable<br />
assumption that the peaks continue in order of n. 71<br />
Mixtures of (Pi)n with n up to ∼70. The CGE data in Figure<br />
4 characterizes commercially available mixtures of (Pi)n with<br />
different distributions in chain length. Samples analyzed in<br />
traces A-D are in order of increasing average chain length.<br />
The results show that peaks with n up to ∼70 can be resolved<br />
in a single run; longer (Pi)n may potentially be resolved using<br />
lower concentrations of PDMA.<br />
Shapes of Peaks. The asymmetric peaks observed in both<br />
CZE and CGE experiments are typical for electropherograms<br />
collected by indirect UV absorbance. (Pi)n with mobility greater<br />
than that of TP 2- shows up as peaks broadened to the left,<br />
while (Pi)n with mobility less than that of TP 2- show up as peaks<br />
broadened to the right. These shapes are the results of<br />
dispersion by electromigration, originating from (i) differences<br />
in mobility between analytes and TP 2- and (ii) nonuniform<br />
electric fields inside sample zones. Discussion of the origin of<br />
the shapes of peaks is available in the Supporting Information,<br />
as well as in ref 59.<br />
Quantitative Analysis of (Pi)n: Areas of Peaks. Three<br />
contributions determine the area of a peak: (i) the response of<br />
[TP 2- ]to(Pi)n; (ii) the amount of (Pi)n transferred from the<br />
sample to the capillary by electrokinetic injection; (iii) residence<br />
time of the analyte passing the detector. Analysis of the areas<br />
of peaks for (Pi)n and CH3SO3 - enables the quantification of<br />
resolved (Pi)n. To account for the effect of (iii), areas of peaks<br />
are adjusted by the factor (1/ti), where t is the retention time<br />
of analyte i. 73 In eq 2, the ratio of adjusted areas for analyte i<br />
and CH3SO3 - (Ai and ACH3SO3 -) is related to the concentrations<br />
[i]S and [CH3SO3 - ] of the sample: zi and zCH3SO3 - are the<br />
electrostatic charge of i and CH3SO3 - ; µCH3SO3 - and µi are the<br />
mobilities of i and CH3SO3 - ; µC + is the mobility of the cation<br />
in the sample zone (bis-tris-H + or tris-H + ).<br />
A i<br />
A CH3 SO 3 -<br />
[i] S<br />
)<br />
[CH3SO3 - ] · [<br />
z i<br />
z CH3 SO 3 -]<br />
· µ + µ C+ i [ µ + µ C+ CH3SO -] 3<br />
(2)<br />
The Supporting Information contains our derivation of eq 2 and a<br />
discussion of the quantitative aspects of electrokinetic injection<br />
and indirect UV absorbance.<br />
Equation 2 reveals the advantage of analyzing electropherograms<br />
by comparing peaks for (Pi)n and CH3SO3 - . The ratio (Ai/<br />
ACH3SO3 -) depends on the ratio ([i]S/[CH3SO3 - ]) but does not<br />
depend on the concentration of other ions in the sample or<br />
the voltage and duration of electrokinetic injection.<br />
Calibration of Peak Areas to Concentrations of P1, P2,<br />
P3, and cyclo-P3. Analysis of samples of containing P1, P2, P3,<br />
or cyclo-P3 and added CH3SO3 - by CZE demonstrated the<br />
relationship between peak areas and concentrations. Figure 5<br />
shows values of (Acyclo-P3 /ACH3SO3 -) determined from the analysis<br />
of samples containing cyclo-P3 and CH3SO3 - . Samples had ratios<br />
(71) The alignment is not perfect; small differences from run to run are possibly<br />
due to dispersion in electromigration, caused by differences between<br />
samples in pH or ionic strength.<br />
(72) Another possibility is that electrokinetic injections may result in concentrations<br />
of (Pi)n at the inlet that can lead to precipitation. (73) Hilser, V. J.; Freire, E. Anal. Biochem. 1995, 224, 465–485.<br />
6844 <strong>Analytical</strong> <strong>Chemistry</strong>, Vol. 82, No. 16, August 15, 2010


