Safari Developer Tools Guide (TP40007874 6.3.0) - Apple Developer
Safari Developer Tools Guide (TP40007874 6.3.0) - Apple Developer
Safari Developer Tools Guide (TP40007874 6.3.0) - Apple Developer

You also want an ePaper? Increase the reach of your titles
YUMPU automatically turns print PDFs into web optimized ePapers that Google loves.
<strong>Safari</strong> <strong>Developer</strong> <strong>Tools</strong><br />
<strong>Guide</strong>
Contents<br />
About <strong>Safari</strong> <strong>Developer</strong> <strong>Tools</strong> 5<br />
At a Glance 5<br />
Enable the <strong>Developer</strong> <strong>Tools</strong> in <strong>Safari</strong> Preferences 6<br />
Speed Up Prototyping by Interactively Testing for Errors 6<br />
Debug Your HTML and CSS Interactively Using Web Inspector 7<br />
Use Web Inspector to Debug JavaScript Interactively 8<br />
Get Help with Cookies, Local Storage, the Application Cache, and HTML5 Client-Side Databases 8<br />
Use the Instrument Navigator 9<br />
Be a Power User 10<br />
Enable, Build, and Debug Extensions 10<br />
See Also 11<br />
<strong>Developer</strong> <strong>Tools</strong> for <strong>Safari</strong> Overview 12<br />
Developing Websites with the <strong>Developer</strong> <strong>Tools</strong> 12<br />
<strong>Safari</strong> on the Desktop, <strong>Safari</strong> on iOS, and WebKit 12<br />
Enabling <strong>Developer</strong> <strong>Tools</strong> in <strong>Safari</strong> on the Desktop 13<br />
The Develop Menu Command Summary 14<br />
Enabling <strong>Developer</strong> <strong>Tools</strong> in WebKit-Based Applications Other Than <strong>Safari</strong> 15<br />
Enabling and Using Web Inspector in <strong>Safari</strong> on iOS Devices 15<br />
Prototyping Your Website 16<br />
The Prototyping Process, Improved 16<br />
Using the Snippet Editor 17<br />
Using the Error Console 17<br />
Opening the Error Console 18<br />
Viewing Issues 18<br />
Using the Console to Prototype JavaScript 18<br />
Changing the User Agent String 19<br />
Switching to Another App 20<br />
Debugging Your Website 21<br />
Use Cases 21<br />
Debugging HTML and CSS Using Web Inspector 22<br />
Inspecting and Editing DOM Attributes 24<br />
2012-07-23 | © 2012 <strong>Apple</strong> Inc. All Rights Reserved.<br />
2
Contents<br />
Inspecting and Editing Styles 25<br />
Inspecting and Editing Metrics 27<br />
Inspecting and Editing HTML Properties 28<br />
Inspecting Listener Functions 29<br />
Debugging JavaScript Using the Web Inspector 29<br />
Using the Console to Debug JavaScript 31<br />
Entering JavaScript Interactively 31<br />
The Command-Line API 32<br />
<strong>Safari</strong> JavaScript Console API 33<br />
Analyzing Client-Side Storage, Databases, and Cookies 35<br />
Inspecting the Offline Application Cache 38<br />
Optimizing Your Website 40<br />
Optimizing Loading, Scripting, and Rendering Times 40<br />
Optimizing JavaScript 43<br />
Keyboard and Mouse Shortcuts 45<br />
General Shortcuts 45<br />
Web Inspector Shortcuts 45<br />
Console Shortcuts 46<br />
DOM Tree Shortcuts 46<br />
Style Details Shortcuts 47<br />
Debugger Shortcuts 47<br />
Document Revision History 48<br />
2012-07-23 | © 2012 <strong>Apple</strong> Inc. All Rights Reserved.<br />
3
Figures<br />
About <strong>Safari</strong> <strong>Developer</strong> <strong>Tools</strong> 5<br />
Figure I-1 Web Inspector 5<br />
<strong>Developer</strong> <strong>Tools</strong> for <strong>Safari</strong> Overview 12<br />
Figure 1-1 Enabling developer tools in <strong>Safari</strong> 13<br />
Figure 1-2 The Develop menu 13<br />
Prototyping Your Website 16<br />
Figure 2-1 The Snippet Editor 17<br />
Figure 2-2 The Error Console in the Log navigator 18<br />
Figure 2-3 The type and version of various browsers in the User Agent submenu 19<br />
Debugging Your Website 21<br />
Figure 3-1 Editing DOM attributes 24<br />
Figure 3-2 Nodal context menu 24<br />
Figure 3-3 Viewing styles in the Details sidebar of Web Inspector 25<br />
Figure 3-4 Editing style properties 25<br />
Figure 3-5 Editing metric attributes 27<br />
Figure 3-6 Editing HTML properties 28<br />
Figure 3-7 Event Listeners 29<br />
Figure 3-8 The Breakpoint navigator 30<br />
Figure 3-9 Inspecting cookies 36<br />
Figure 3-10 Inspecting databases 37<br />
Figure 3-11 An SQL query 38<br />
Figure 3-12 Application cache 39<br />
Optimizing Your Website 40<br />
Figure 4-1 Inspecting timelines 41<br />
Figure 4-2 Network timeline view 42<br />
Figure 4-3 Network content and headers view 42<br />
Figure 4-4 Profiling JavaScript 43<br />
2012-07-23 | © 2012 <strong>Apple</strong> Inc. All Rights Reserved.<br />
4
About <strong>Safari</strong> <strong>Developer</strong> <strong>Tools</strong><br />
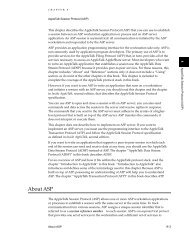
<strong>Safari</strong> 4.0 and later includes built-in tools such as Web Inspector, shown in Figure I-1 (page 5), to help you<br />
prototype, analyze, debug, and optimize websites and web apps. <strong>Safari</strong> 5.0 and later has additional tools you<br />
can use to develop and debug <strong>Safari</strong> extensions.<br />
Figure I-1 Web Inspector<br />
Note: This document was formerly titled <strong>Safari</strong> User <strong>Guide</strong> for Web <strong>Developer</strong>s . This document<br />
describes the developer tools in <strong>Safari</strong> 6.0 and later. The developer tools in earlier versions of <strong>Safari</strong><br />
are substantially different.<br />
At a Glance<br />
<strong>Safari</strong> has tools for prototyping HTML, CSS, and JavaScript; tools for interactively inspecting and debugging<br />
elements, attributes, properties, and styles; an integrated JavaScript debugger; optimization tools such as a<br />
latency and download timeline; and a JavaScript and CSS profiler.<br />
2012-07-23 | © 2012 <strong>Apple</strong> Inc. All Rights Reserved.<br />
5
About <strong>Safari</strong> <strong>Developer</strong> <strong>Tools</strong><br />
At a Glance<br />
These tools are built into <strong>Safari</strong> on OS X, iOS, and Windows. You can enable them in other WebKit-based apps.<br />
Enable the <strong>Developer</strong> <strong>Tools</strong> in <strong>Safari</strong> Preferences<br />
Enable the developer tools in the Advanced pane of <strong>Safari</strong> preferences:<br />
● On OS X or Windows, use <strong>Safari</strong> preferences to show the Develop menu in <strong>Safari</strong>. The full set of developer<br />
tools are then available.<br />
● On iOS devices, use <strong>Safari</strong> Preferences to enable Web Inspector in <strong>Safari</strong>. You can then use Web Inspector<br />
on OS X to debug web content on your iOS device through a USB connection. For details, see “Enabling<br />
and Using Web Inspector in <strong>Safari</strong> on iOS Devices” (page 15).<br />
● You can add the developer tools to other Webkit-based Mac apps as a contextual menu by modifying the<br />
application’s preferences file. For details, see “Enabling <strong>Developer</strong> <strong>Tools</strong> in WebKit-Based Applications<br />
Other Than <strong>Safari</strong>” (page 15).<br />
Speed Up Prototyping by Interactively Testing for Errors<br />
Show Web Inspector’s console while prototyping your website to quickly spot HTML and JavaScript structural<br />
and syntactic errors. The console shows you errors and warnings, highlights the line number of the problem<br />
in your source file, and tells you how <strong>Safari</strong> dealt with the error (by ignoring an extra closing tag, for example).<br />
For details, see “Using the Error Console” (page 17), “Viewing Issues” (page 18), and “Using the Console to<br />
Prototype JavaScript” (page 18).<br />
2012-07-23 | © 2012 <strong>Apple</strong> Inc. All Rights Reserved.<br />
6
About <strong>Safari</strong> <strong>Developer</strong> <strong>Tools</strong><br />
At a Glance<br />
<strong>Safari</strong> also comes with a Snippet Editor, where you can type in HTML, CSS, and JavaScript snippets and see<br />
them evaluated interactively. No more having to create a dummy HTML page to test an element or a JavaScript<br />
function—just type in the part you’re working on and see the results. When it works as you want it to, copy<br />
and paste it into your actual webpage. For details, see “Using the Snippet Editor” (page 17).<br />
If your website has different code paths for different browsers, have <strong>Safari</strong> give different user-agent strings to<br />
test the code branches. Then, verify the behavior changes for <strong>Safari</strong>, Internet Explorer, Opera, Chrome, or <strong>Safari</strong><br />
on iOS without having to switch browsers, operating systems, or devices. When you’re ready to open your<br />
website in another application, make the switch from inside <strong>Safari</strong>, without having to quit, open another<br />
application, and navigate to your site. For details, see “Changing the User Agent String” (page 19) and “Switching<br />
to Another App” (page 20).<br />
Relevant Chapter: “Prototyping Your Website” (page 16)<br />
Debug Your HTML and CSS Interactively Using Web Inspector<br />
The Error Console finds and identifies syntactic and structural errors, but sometimes your website doesn’t look<br />
or behave as you want, even though the syntax and structure are legal. That’s when you need Web Inspector.<br />
Web Inspector shows you the DOM as it exists in memory—for a static HTML page, that’s often identical to<br />
the page source, but for websites that modify the DOM using JavaScript and CSS, it can be very different.<br />
With Web Inspector, you can:<br />
● Find Things Fast<br />
Click an element in the DOM and it is highlighted in the browser window. Use the DOM node locator<br />
button, which looks like a hand pointing a finger, and click on something in the browser window to<br />
highlight the element in the DOM.<br />
● Change Things on the Fly<br />
Click an element in the DOM and see its attributes, styles, metrics, and properties, as well as any event<br />
listener functions attached to it. Double-click the element to add, delete, or edit attributes interactively.<br />
Click the value of a style, property, or metric to modify or disable it. Increment or decrement numeric<br />
values using the arrow keys in steps of 1, or with a step of 0.1 or 10 by holding down the Option or Shift<br />
modifier keys, respectively. Right-click or Control-click to edit the DOM as if it were HTML in a text editor.<br />
Any changes you make are shown immediately in the browser window.<br />
● Get it Working in the Browser Before You Change the Source<br />
Make changes without affecting your website, or modify any website inside the browser to better<br />
understand how it works or how you could adapt it to your needs. Find problems and fix them on a live<br />
website without making a copy to a new site or modifying your production site’s source code. Copy and<br />
paste the modified code into your source after it’s fully tested and works exactly the way you want.<br />
2012-07-23 | © 2012 <strong>Apple</strong> Inc. All Rights Reserved.<br />
7
About <strong>Safari</strong> <strong>Developer</strong> <strong>Tools</strong><br />
At a Glance<br />
Relevant Section: “Debugging HTML and CSS Using Web Inspector” (page 22).<br />
Use Web Inspector to Debug JavaScript Interactively<br />
Web Inspector includes tools to help you set breakpoints, pause, inspect variable values, see the call stack, log<br />
messages and data to the console, set variable values and continue, and enter JavaScript on the fly to test<br />
it—all with autocompletion of function, property, and variable names to speed you along.<br />
● See It All<br />
Web Inspector shows all the JavaScript sources—inline functions in the HTML, included .js files, output<br />
from server-side scripts, and code generated on the fly by other code. All the resources are listed. Click a<br />
resource in the list to see the source code.<br />
● Pause Execution When You Want<br />
Click in the gutter anywhere in the source code view to set a breakpoint, without having to edit the source.<br />
Disable breakpoints and re-enable them with a click. Pause any time with a mouse click, without setting<br />
a breakpoint.<br />
● Continue When and How You Like<br />
Check the call stack, examine variable values, change values while paused, enter and execute test code,<br />
then continue, optionally stepping through the code function by function. Step over functions or step out<br />
of a function at will.<br />
● Use the Interactive Console<br />
<strong>Safari</strong> implements the same Console API as the popular Firebug debugger. Add test code to your scripts<br />
to log branches in the code or print variable values on the fly, without pausing or setting breakpoints.<br />
Type commands in the console with auto-completion, and see the results immediately.<br />
Relevant Sections: “Debugging JavaScript Using the Web Inspector” (page 29), “Using the Console<br />
to Debug JavaScript” (page 31).<br />
Get Help with Cookies, Local Storage, the Application Cache, and HTML5<br />
Client-Side Databases<br />
Use Web Inspector’s Storage navigator to inspect cookies, local key-value storage, the offline application cache,<br />
and even client-side relational databases created with HTML5. All local data is displayed in editable data grids.<br />
You can perform actions or enter data in the webpage and see the results in the grid, or enter data interactively<br />
2012-07-23 | © 2012 <strong>Apple</strong> Inc. All Rights Reserved.<br />
8
About <strong>Safari</strong> <strong>Developer</strong> <strong>Tools</strong><br />
At a Glance<br />
in the grid itself. Issue SQL queries right from Web Inspector, with auto-completion of SQL functions and<br />
database field names. Inspect the contents of the HTML5 application cache to better understand offline<br />
application behavior.<br />
Relevant Sections: “Analyzing Client-Side Storage, Databases, and Cookies” (page 35), “Inspecting<br />
the Offline Application Cache” (page 38)<br />
Use the Instrument Navigator<br />
Web Inspector’s Instrument navigator shows you exactly where time is spent, so you know where work is<br />
needed before you change anything. Once you know exactly where the bottlenecks are, you can make changes<br />
interactively without leaving <strong>Safari</strong>, optimizing your site—and fixing any resulting problems—before you<br />
modify your working source.<br />
The Instrument navigator shows all the resources your site uses—HTML files, JavaScript files, CSS style sheets,<br />
server-side output, images, fonts, and media files—in a timeline view, showing when each resource was<br />
requested, the latency for each request, when the first byte of the resource arrived, and when the resource<br />
finished loading. At a glance, see if your website is hung by a slow server script, bandwidth-choking file sizes,<br />
network latency problems, or unexpected dependencies such as a resource that is not requested until after a<br />
script executes.<br />
The Instrument navigator lets you profile your website in real time, showing not only the latency and load time<br />
for each resource, but when events occur, as well as the time spent executing scripts, parsing, and rendering.<br />
Complex interactions—a script that changes the DOM, causing a resource to load, and a table to be rerendered,<br />
for example—are laid out clearly. Header details and memory usage over time are also shown.<br />
Relevant Section: “Optimizing Loading, Scripting, and Rendering Times” (page 40)<br />
If the timeline shows that significant time is spent in your scripts, use the Profiles section of the Instrument<br />
navigator to determine where. Moving a single function call from the inside of a loop to the outside of the<br />
loop can sometimes have a tremendous impact. Running a profile takes the guesswork out of optimizing<br />
JavaScript. A profile shows you how much time is spent in each function, including dependent functions, and<br />
how many times each function is called.<br />
See the output in milliseconds or percent of execution time. Sort by execution time. Then spend your effort<br />
optimizing code that you know is going to make a significant difference—modify only functions that take a<br />
proportionally long time to execute or functions that are called many times.<br />
2012-07-23 | © 2012 <strong>Apple</strong> Inc. All Rights Reserved.<br />
9
About <strong>Safari</strong> <strong>Developer</strong> <strong>Tools</strong><br />
At a Glance<br />
Relevant Section: “Optimizing JavaScript” (page 43)<br />
Be a Power User<br />
The <strong>Safari</strong> developer tools include dozens of keyboard and mouse shortcuts to speed up common operations,<br />
from opening Web Inspector to cycling through auto-completion suggestions. See the shortcuts table in<br />
“Keyboard and Mouse Shortcuts” (page 45) to boost your productivity.<br />
Enable, Build, and Debug Extensions<br />
Use Extension Builder to create extensions. You need to join the <strong>Safari</strong> <strong>Developer</strong> Program to install the<br />
extensions you create—you can’t install an extension unless it has a signed certificate. Go to developer.apple.com<br />
to join the program.<br />
Whenyou’rereadytobuildanextension,read<strong>Safari</strong>ExtensionsDevelopment<strong>Guide</strong> ,andreferto<strong>Safari</strong>Extensions<br />
Reference . If you’ve already developed extensions for other browsers, see <strong>Safari</strong> Extensions Conversion <strong>Guide</strong><br />
for time-saving tips.<br />
Note: When inspecting storage, remember that the domain for the global page, popovers, or<br />
extension bars is the extension, but the domain of injected scripts is the domain of the webpage<br />
the script is injected into.<br />
The full set of developer tools for inspecting, modifying, and optimizing HTML, CSS, and JavaScript works on<br />
extensions. Once you’ve built and installed an extension, you can use Web Inspector to debug and optimize:<br />
● Injected scripts and style sheets as if they were downloaded from the webpage’s host.<br />
Note: You must load a webpage that the extension has access to in order to inject a script or<br />
style sheet, and you must load a webpage that causes the script or style sheet to be injected<br />
before you can inspect the injected content using <strong>Safari</strong>’s developer tools.<br />
● Extension bars by right-clicking or Control-clicking it and using the Inspect Element contextual menu to<br />
open Web Inspector.<br />
● Popovers can be debugged by right-clicking or Control-clicking it and using the Inspect Element contextual<br />
menu to open Web Inspector.<br />
● A global HTML page by clicking Inspect Global Page in Extension Builder (the button is present only if the<br />
selected extension is installed and has a global page).<br />
2012-07-23 | © 2012 <strong>Apple</strong> Inc. All Rights Reserved.<br />
10
About <strong>Safari</strong> <strong>Developer</strong> <strong>Tools</strong><br />
See Also<br />
Important: The console does not currently recognize JavaScript elements defined in injected scripts. You<br />
can log data to the console, but you cannot interact with elements defined in an injected script from the<br />
console by typing their names.<br />
See Also<br />
● <strong>Safari</strong> Extensions Development <strong>Guide</strong> delivers step-by-step directions for creating <strong>Safari</strong> extensions using<br />
Extension Builder<br />
● <strong>Safari</strong> Extensions Reference lists the JavaScript classes, methods, and properties you can access from <strong>Safari</strong><br />
extensions<br />
● <strong>Safari</strong> HTML Reference gives the supported HTML tags for <strong>Safari</strong><br />
● <strong>Safari</strong> CSS Reference gives the supported CSS tags for <strong>Safari</strong><br />
● <strong>Safari</strong> Web Content <strong>Guide</strong> offers guidance for developing web content for the iPhone<br />
● WebKit DOM Programming Topics includes articles on using and modifying the Document Object Model<br />
2012-07-23 | © 2012 <strong>Apple</strong> Inc. All Rights Reserved.<br />
11
<strong>Developer</strong> <strong>Tools</strong> for <strong>Safari</strong> Overview<br />
There are developer tools built into <strong>Safari</strong> on OS X, iOS, Windows, and in other WebKit-based apps. These tools<br />
can help you prototype, debug, and optimize your website. This chapter gives a quick overview of how to<br />
enable and use these developer tools.<br />
Developing Websites with the <strong>Developer</strong> <strong>Tools</strong><br />
The development process for websites can be accelerated by the <strong>Safari</strong> toolset at several points. The usual<br />
process is as follows:<br />
● Prototype—Determine what combination of HTML, JavaScript, CSS, and local storage deliver the functionality<br />
you need, testing snippets of code interactively.<br />
● Write—Author the website, using your favorite text editor.<br />
● Test and debug—Test using several browsers and platforms (Mac, Windows, iOS), track errors and correct<br />
them.<br />
● Optimize—Make your website more responsive, shorten load times, and improve JavaScript execution.<br />
Once you’ve enabled and familiarized yourself with the developer tools, use the Snippet Editor to streamline<br />
prototyping, Web Inspector’s Error Console for testing and debugging, and Web Inspector’s timeline view and<br />
JavaScript profiler to help you optimize your website.<br />
<strong>Safari</strong> on the Desktop, <strong>Safari</strong> on iOS, and WebKit<br />
The toolset for <strong>Safari</strong> on the desktop (OS X or Windows) includes a Develop menu with several commands and<br />
a number of interactive tools. <strong>Safari</strong> on iOS (iPhone, iPad, and iPod touch) can enable a setting to allow Web<br />
Inspector to debug web content over a USB connection.<br />
The toolset for WebKit-based apps is essentially the same as for <strong>Safari</strong> on the desktop, but it is available via<br />
the contextual menu, and you enable the tools differently.<br />
2012-07-23 | © 2012 <strong>Apple</strong> Inc. All Rights Reserved.<br />
12
<strong>Developer</strong> <strong>Tools</strong> for <strong>Safari</strong> Overview<br />
Enabling <strong>Developer</strong> <strong>Tools</strong> in <strong>Safari</strong> on the Desktop<br />
Enabling <strong>Developer</strong> <strong>Tools</strong> in <strong>Safari</strong> on the Desktop<br />
You enable the developer tools in <strong>Safari</strong> on the desktop (OS X or Windows) by turning on the Develop menu.<br />
In <strong>Safari</strong> preferences, click Advanced, then select "Show Develop menu in menu bar," as shown in Figure 1-1.<br />
Figure 1-1 Enabling developer tools in <strong>Safari</strong><br />
Selecting this option adds a Develop menu to your menu bar (Figure 1-2 (page 13)). The <strong>Safari</strong> developer tools<br />
are now enabled.<br />
Figure 1-2 The Develop menu<br />
2012-07-23 | © 2012 <strong>Apple</strong> Inc. All Rights Reserved.<br />
13
<strong>Developer</strong> <strong>Tools</strong> for <strong>Safari</strong> Overview<br />
Enabling <strong>Developer</strong> <strong>Tools</strong> in <strong>Safari</strong> on the Desktop<br />
The Develop Menu Command Summary<br />
The Develop menu contains a set of tools to assist you in prototyping, debugging, and optimizing your website:<br />
● Open Page With—Open the current webpage in another application.<br />
● User Agent—Browsers send a user agent string that identifies the browser type and version to the server.<br />
The same string is sent in response to a JavaScript request for the user agent string. Use this menu item<br />
to modify the user agent string <strong>Safari</strong> sends, to simulate visiting your site using a different browser or<br />
device type.<br />
● Show Web Inspector—Open the Web Inspector window to inspect or modify the DOM, HTML attributes,<br />
and CSS properties.<br />
● Show Error Console—Open the console in Web Inspector to see any HTML or JavaScript errors and any<br />
corrective actions taken by <strong>Safari</strong>.<br />
● Show Page Source—Open the Source Code in Web Inspector to see the HTML of the current page.<br />
● Show Page Resources—Open the Resource navigator in Web Inspector to view all images, scripts, and<br />
style sheets attached to the current page.<br />
● Show Snippet Editor—Open the Snippet Editor window to interactively prototype HTML, CSS, or JavaScript<br />
snippets.<br />
● Show Extension Builder—Open Extension Builder to install, modify, create, or uninstall a <strong>Safari</strong> extension.<br />
For more information, see <strong>Safari</strong> Extensions Development <strong>Guide</strong> .<br />
● Start Profiling JavaScript—Turn on the JavaScript profiler to see how many times each function is called,<br />
how long it takes, and so on.<br />
● Start Timeline Recording—Record detailed information about the status of incoming HTTP requests,<br />
JavaScript events, and layout rendering.<br />
● Empty Caches—Delete all caches stored by the browser.<br />
● Disable Caches—Turn off caching to see how a website loads the first time.<br />
● Disable Images—Turn off image display and view websites as text only.<br />
● Disable Styles—Turn off CSS style properties to view the page purely as HTML and JavaScript.<br />
● Disable JavaScript—View websites with the JavaScript interpreter disabled.<br />
● Disable Site-specific Hacks—Use this to disable the modifications to <strong>Safari</strong> and test your site for correct<br />
operation (if <strong>Apple</strong> engineers have modified <strong>Safari</strong> specifically to work around a problem with your website).<br />
● Disable Local File Restrictions—Disable security checks that may prohibit local development.<br />
● Enable WebGL—Turn on the ability to view OpenGL content in <strong>Safari</strong>.<br />
2012-07-23 | © 2012 <strong>Apple</strong> Inc. All Rights Reserved.<br />
14
<strong>Developer</strong> <strong>Tools</strong> for <strong>Safari</strong> Overview<br />
Enabling <strong>Developer</strong> <strong>Tools</strong> in WebKit-Based Applications Other Than <strong>Safari</strong><br />
Enabling <strong>Developer</strong> <strong>Tools</strong> in WebKit-Based Applications Other Than<br />
<strong>Safari</strong><br />
To enable the developer tools in a WebKit-based application other than <strong>Safari</strong>, set the WebKit<strong>Developer</strong>Extras<br />
key to the Boolean value True in the .plist file.<br />
From the command console, type:<br />
defaults write com.myApp WebKit<strong>Developer</strong>Extras bool true<br />
replacing myApp with the bundle identifier of your application.<br />
You must also enable contextual menus in your application. Once this is done, launch the application. The<br />
Develop menu can now be accessed by a Control-click or right-click from within a web view in the application.<br />
Enabling and Using Web Inspector in <strong>Safari</strong> on iOS Devices<br />
You can enable an advanced setting in <strong>Safari</strong> on iOS to debug web content on your device directly from your<br />
desktop. To do this, turn on Web Inspector in the Advanced pane under <strong>Safari</strong> in the Settings app. Once it is<br />
enabled, connect your device to your desktop machine with a USB cable. Alternately, you can use Simulator<br />
to take advantage of Web Inspector’s debugging capabilities, which comes free with Xcode from the Mac App<br />
Store. If you are a registered iOS developer, you can even inspect the web content of a UIWebView. For more<br />
information, read the chapter “Debugging” in <strong>Safari</strong> Web Content <strong>Guide</strong> .<br />
2012-07-23 | © 2012 <strong>Apple</strong> Inc. All Rights Reserved.<br />
15
Prototyping Your Website<br />
The first step in designing a website is primarily esthetic—how do you want it to look and feel? The next several<br />
steps are technical—can you achieve what you want using a given combination of HTML, CSS, and JavaScript?<br />
Does a particular JavaScript function do what you need? How does applying a specific CSS style affect the<br />
page? Does the combined set work on the browsers and platforms you want to support?<br />
The <strong>Safari</strong> developer tools can help you answer the technical questions in a streamlined and efficient manner.<br />
The Prototyping Process, Improved<br />
It’s common to prototype a website by creating a combination of HTML, style sheets, and scripts, load the<br />
combination into a browser, see problems, modify the source—or multiple sources—then reload the page to<br />
see the results. It's a cumbersome and sometimes painful process.<br />
It’s inefficient to create a complete webpage before you can test any part of it, then test it using several<br />
browsers, rewriting and reloading the page each time you find an error, going back and forth between your<br />
HTML, CSS, and JavaScript sources. If your webpage contains a hidden error, and browsers deal with the error<br />
differently, it can be frustrating to find the problem.<br />
Here’s how <strong>Safari</strong> can help:<br />
● Use the Snippet Editor to interactively test elements of your page in a sandbox, debugging your syntax<br />
and testing different attributes and elements without going through the process of creating a whole<br />
website. Test the snippets first—set an HTML attribute, apply a CSS style, call a JavaScript function—and<br />
see the results immediately, then build your prototype website using a combination of parts that you<br />
already know work.<br />
● Once you have a prototype, load it in <strong>Safari</strong> and use the console to spot hidden errors that <strong>Safari</strong> is dealing<br />
with for you—other browsers may deal with them differently. Correct the errors to maximize your chances<br />
of compatibility.<br />
● If you use the user agent string to execute various code branches that are intended to execute on different<br />
browsers or devices, choose User Agent String from the Develop menu to modify the user agent string<br />
and invoke the code branches in your website, making sure that each browser is being shown what you<br />
intend. Resolve the question of proper code branch versus browser differences in advance.<br />
● Finally, you can test your prototype using other browsers or web apps by invoking them directly from the<br />
Develop menu in <strong>Safari</strong>.<br />
2012-07-23 | © 2012 <strong>Apple</strong> Inc. All Rights Reserved.<br />
16
Prototyping Your Website<br />
Using the Snippet Editor<br />
Using the Snippet Editor<br />
Choose Show Snippet Editor from the Develop menu to open the Snippet Editor. The Snippet Editor contains<br />
an upper pane, in which you can type any combination of HTML, CSS, or JavaScript, and a lower pane that<br />
shows how it displays in <strong>Safari</strong> (or any WebKit-based application), as shown in Figure 2-1.<br />
Figure 2-1 The Snippet Editor<br />
The Snippet Editor provides an interactive interface for quickly prototyping or debugging your HTML, CSS, and<br />
JavaScript. You don’t have to create complete HTML pages and open them in a browser, or switch between<br />
your editor and browser repeatedly to edit the code and refresh the browser display. Simply type in fragments<br />
of code and the display refreshes immediately. You can freely edit text in the upper pane of the Snippet<br />
Editor—cut, copy, paste, insert text, and so on. When your code produces the effect you want, you can copy<br />
and paste it into a working document.<br />
If the "Update after typing" option is selected, the display pane is updated each time you press a key. This is<br />
ideal for working with short snippets of HTML or debugging the syntax in a line of JavaScript. For longer<br />
snippets, where the display of unfinished code would be distracting, deselect the option and click the Update<br />
Now button to refresh the display when you are ready.<br />
Using the Error Console<br />
The Error Console of Web Inspector is the most basic tool for debugging a website, so it’s an appropriate tool<br />
for prototyping. The Error Console notifies you of any syntactic or structural errors that <strong>Safari</strong> detects in your<br />
HTML, CSS, or JavaScript, gives you the location of the error—including the source file and line number—and<br />
includes a brief description of how <strong>Safari</strong> handled the error (such as by ignoring an extra closing tag).<br />
2012-07-23 | © 2012 <strong>Apple</strong> Inc. All Rights Reserved.<br />
17
Prototyping Your Website<br />
Using the Error Console<br />
Opening the Error Console<br />
There are several ways to open the Error Console. You can choose Show Error Console from the Develop menu,<br />
or you can click Current Log in the Log navigator of Web Inspector, as shown in Figure 2-2.<br />
Figure 2-2 The Error Console in the Log navigator<br />
You also have access to the Quick Console—a console available at the bottom of the content browser of Web<br />
Inspector—by clicking the Console area (the blue greater-than sign), or by pressing the Esc key.<br />
Viewing Issues<br />
Any errors encountered when loading a website appear under the Issue navigator. Clicking an error opens the<br />
troublesome line in the source code.<br />
To view warnings along with errors, click Current Log under the Log navigator. Errors and warnings are shown<br />
with a URL link to the resource that generated the problem, the line number (where applicable), and a brief<br />
description of how <strong>Safari</strong> dealt with the problem.<br />
Using the Console to Prototype JavaScript<br />
Like the Snippet Editor, the console of Web Inspector allows you to enter JavaScript interactively and see the<br />
results immediately. In addition, a number of console functions can be used to log data to the console (see<br />
“<strong>Safari</strong> JavaScript Console API” (page 33)).<br />
2012-07-23 | © 2012 <strong>Apple</strong> Inc. All Rights Reserved.<br />
18
Prototyping Your Website<br />
Changing the User Agent String<br />
The console has auto-completion support for JavaScript. As you type, JavaScript variables, properties, and<br />
function names are suggested in gray. Pressing the Right Arrow key accepts the current suggestion. If multiple<br />
selections begin with the same prefix, a menu appears, and you can cycle through the suggestions using the<br />
Up and Down Arrow keys. If there is only one suggestion, the Tab key accepts it.<br />
To display a variable's current value, type the variable name and press Enter.<br />
Any changes you make to the DOM using JavaScript from the console are immediately displayed in Web<br />
Inspector’s content browser, as well as in the browser window.<br />
Changing the User Agent String<br />
Every browser has a user agent string that identifies its type and version number. The browser sends this string<br />
to the server. Your website can also use JavaScript to read the user agent string to determine which version<br />
of a browser a user is running. You can choose what <strong>Safari</strong> reports as its user agent from the User Agent<br />
submenu.<br />
This can be useful to quickly test your code to see if it is reacting to various user agents as you expect, without<br />
having to actually load the page in multiple versions of multiple browsers. The User Agent submenu is shown<br />
in Figure 2-3.<br />
Note: The browser versions listed in the submenu are updated frequently to reflect current availability.<br />
Figure 2-3 The type and version of various browsers in the User Agent submenu<br />
2012-07-23 | © 2012 <strong>Apple</strong> Inc. All Rights Reserved.<br />
19
Prototyping Your Website<br />
Switching to Another App<br />
You can choose the common versions of most popular browsers from the submenu. Note that the list includes<br />
the versions of <strong>Safari</strong> found on iPhone, iPad, and iPod touch.<br />
The Other... menu item opens a sheet showing the default user agent string, which you can inspect and edit<br />
to any string you like.<br />
If your website has different code branches for different browsers, and loading the site in a given browser<br />
reveals problems, first question whether the code has actually branched as expected. By changing the user<br />
agent string in <strong>Safari</strong>, you can isolate the code branch from the browser differences. You can also log the code<br />
branch to the console and check for it using Web Inspector’s console.<br />
Note: If you have a mobile version of your website, optimized for iPhone and iPod touch, you should<br />
not display the mobile version to visitors using <strong>Safari</strong> on iPad. You can test your website by setting<br />
the user agent string to <strong>Safari</strong> on iPad to verify that iPad users see the normal website, not the mobile<br />
version.<br />
Switching to Another App<br />
When first testing a website, you typically open it in several browsers—such as <strong>Safari</strong>, Internet Explorer, and<br />
Firefox—to make sure that it works correctly in all cases. The Open Page With command is a convenient way<br />
to open the current webpage in another browser, without having to leave <strong>Safari</strong>, open the other browser, and<br />
navigate to the page.<br />
Choose Open Page With from the Develop menu. A submenu is displayed listing all the apps that the operating<br />
system knows can open the page.<br />
2012-07-23 | © 2012 <strong>Apple</strong> Inc. All Rights Reserved.<br />
20
Debugging Your Website<br />
<strong>Safari</strong>'s powerful Web Inspector tool can find and correct problems with your website. Syntactic and structural<br />
problems can be revealed by using the interactive console. Data transmitting over the network can be analyzed<br />
and dissected. Script execution can be paused and examined in the Debug navigator. Even the most complex<br />
problems can usually be resolved using Web Inspector.<br />
Note: If you are a registered OS X or iOS developer, you can test the behavior and appearance of<br />
your website on iOS devices using the Simulator application. Simulator is part of the Xcode installation.<br />
To open Simulator, first open Xcode, then Control-click on the Xcode icon in the Dock, and select<br />
iOS Simulator from the Open <strong>Developer</strong> Tool submenu. You can switch between iPad and iPhone<br />
simulation using Simulator’s Hardware menu.<br />
Use Cases<br />
Here are some common cases and the best ways to deal with them.<br />
● You have a new website that you’re ready to start testing, or a half-finished website that you’re<br />
developing.<br />
See the section “Prototyping Your Website” (page 16). It includes basic testing.<br />
● You have a website designed for Internet Explorer on Windows, and you are having trouble making<br />
it work in <strong>Safari</strong> on the desktop or iOS.<br />
Use the Error Console to see if <strong>Safari</strong> detects any syntactic or structural errors in your HTML, CSS, or<br />
JavaScript, and if so, what corrective action it is taking. This will also reveal the use of extensions that may<br />
be proprietary to Explorer.<br />
Note: If <strong>Safari</strong> reports a tag that works in Explorer as an error, it is not a standard tag, and you<br />
need to use an equivalent tag, or include a branch in your code that uses one tag for Explorer<br />
and another tag for other browsers.<br />
See “Using the Error Console” (page 17) for a description of basic testing. Start by correcting the reported<br />
errors. In most cases, that will solve the problem. If no errors are reported, or you correct the reported<br />
errors and problems persist, see the following use cases.<br />
2012-07-23 | © 2012 <strong>Apple</strong> Inc. All Rights Reserved.<br />
21
Debugging Your Website<br />
Debugging HTML and CSS Using Web Inspector<br />
● Your website doesn’t work on iOS devices, but Web Inspector shows no errors.<br />
Enable Web Inspector for iPhone or iPod touch (see “Enabling and Using Web Inspector in <strong>Safari</strong> on iOS<br />
Devices” (page 15)) and check for errors on the device itself. See <strong>Safari</strong> Web Content <strong>Guide</strong> for guidance<br />
on specific design considerations for web content on iOS devices.<br />
● Your website doesn’t look or behave as you expect, but Web Inspector shows no errors.<br />
See the sections in this chapter, “Debugging HTML and CSS Using Web Inspector” (page 22) and “Debugging<br />
JavaScript Using the Web Inspector” (page 29), to learn how to use the developer tools to analyze and<br />
debug website behavior.<br />
● You are having problems with an HTML5 client-side database.<br />
See the last section in this chapter, “Analyzing Client-Side Storage, Databases, and Cookies” (page 35).<br />
● Your website works, but it is sluggish or unresponsive.<br />
See the next chapter, “Optimizing Your Website” (page 40).<br />
Debugging HTML and CSS Using Web Inspector<br />
If your website doesn’t look or act as you expect, analyze your site using Web Inspector.<br />
Choose Show Web Inspector from the Develop menu. This opens the Web Inspector window.<br />
iOS Note: You can use Web Inspector to inspect web content on iOS 6 and later by enabling Web<br />
Inspector on iOS in the Settings app. Once it’s enabled, you can follow along with the rest of this<br />
document, as features of Web Inspector work with iOS as well as OS X. To learn more about enabling<br />
Web Inspector for iOS, read the “Debugging Web Content on iOS” chapter of <strong>Safari</strong> Web Content <strong>Guide</strong> .<br />
The left sidebar of Web Inspector is known as the Navigation sidebar. Here you’ll find the main sections of Web<br />
Inspector under each navigator icon. At the bottom of the Navigation sidebar is the Filter input field. Anything<br />
typed into this field will filter the results displayed within the currently selected navigator. For example, in the<br />
Resource navigator (Control-1), typing *.min.js will refine the results shown to only display files containing<br />
.min.js in their filepaths.<br />
The center of Web Inspector, known as the content browser, contains the content view of the selected item<br />
in the Navigation sidebar. You can access the DOM of the current webpage as a collapsable and expandable<br />
structure of nested elements by clicking a source file in the Resource navigator. Click the disclosure triangle<br />
to expand or collapse the view of a given element and its contents. A breadcrumb path is added to the top<br />
bar, allowing you to see where you are in the DOM hierarchy. You can click a breadcrumb to move back up<br />
the hierarchy, as well as toggle between viewing the DOM and the source.<br />
2012-07-23 | © 2012 <strong>Apple</strong> Inc. All Rights Reserved.<br />
22
Debugging Your Website<br />
Debugging HTML and CSS Using Web Inspector<br />
The DOM displayed is the symbolic structure of the webpage that <strong>Safari</strong> has constructed in memory. In a simple<br />
static webpage with no errors, the DOM is identical to the HTML source. In websites where the DOM changes<br />
interactively, the content browser gives you the current state of the DOM. If there are errors in the webpage,<br />
the content browser shows you the DOM that <strong>Safari</strong> has constructed, which may differ significantly from the<br />
source.<br />
When you click an element in the DOM, the corresponding element is highlighted in the browser window. If<br />
you Control-click or right-click in the browser window, a contextual menu is displayed with an Inspect Element<br />
option. Choosing Inspect Element highlights the corresponding element in the DOM, making it easy to zoom<br />
in on a given element and find its location in the source, even in a complex web app.<br />
Tip: Another way to get from an element in the browser display to its definition in the DOM is to<br />
click the DOM node locator button to the right of the breadcrumb bar, then move the cursor over<br />
the browser window. The DOM node locator button looks like a hand pointing its finger. Elements<br />
are highlighted as the mouse passes over them, and a summary of the element’s style and metrics<br />
are shown in a tooltip under the element. Clicking an element opens the DOM tree to the element’s<br />
definition and highlights it.<br />
The Details sidebar on the right side of Web Inspector displays the properties, styles, and metrics of the currently<br />
selected element, as well as information about the page itself, such as query parameters and HTTP headers.<br />
Using the DOM view along with the styles, metrics, and properties, you can inspect and interactively modify<br />
any element on a webpage. More significantly, you can quickly grasp the inheritance structure that gives each<br />
element its appearance, placement, and behavior.<br />
When debugging a webpage, it’s typically best to Control-click or right-click on the part of the page that looks<br />
wrong in <strong>Safari</strong>’s browser window, select Inspect Element, then look at the highlighted element in the DOM<br />
panel of Web Inspector to see how the element is defined. You can interactively modify the HTML parameters<br />
in Web Inspector to see how that changes the behavior in the browser window. If the HTML attributes seem<br />
correct, check the applied CSS styles by selectively disabling them or modifying them in Web Inspector. The<br />
effects are immediately visible in the browser window. If this solves the problem, copy the modified HTML or<br />
CSS and paste it into your source. If not, the problem may be caused by an errant script. See “Debugging<br />
JavaScript Using the Web Inspector” (page 29).<br />
If you know the name of an element in the DOM that you want to inspect (for example, to find all instances of<br />
a particular class), use the Search navigator (Control-4) in the upper-left corner of the Inspector. The Search<br />
navigator conducts a plain-text search across all resources linked from the current page.<br />
The following subsections show how to inspect and modify HTML and CSS using Web Inspector.<br />
2012-07-23 | © 2012 <strong>Apple</strong> Inc. All Rights Reserved.<br />
23
Debugging Your Website<br />
Debugging HTML and CSS Using Web Inspector<br />
Inspecting and Editing DOM Attributes<br />
The left pane shows the DOM attributes associated with the currently selected element. Double-click an element<br />
name, attribute name, or attribute value to edit it interactively, as shown in Figure 3-1.<br />
Figure 3-1 Editing DOM attributes<br />
Use the Tab key and Shift-Tab key combination to traverse the attributes.<br />
You can edit values using the letter and number keys as you would expect. For numerical values, you can also<br />
use the arrow keys to increment or decrement the value by 1. Holding down the Option or Alt key increments<br />
or decrements the value by 0.1, while holding down the Shift key increments or decrements by 10.<br />
Double-click an element or attribute to edit it, or Control-click or right-click the element to bring up a contextual<br />
menu, as shown in Figure 3-2 (page 24).<br />
Figure 3-2 Nodal context menu<br />
2012-07-23 | © 2012 <strong>Apple</strong> Inc. All Rights Reserved.<br />
24
Debugging Your Website<br />
Debugging HTML and CSS Using Web Inspector<br />
You can add a new attribute to the element, edit the DOM as if it were an HTML file in a text editor, copy the<br />
HTML for the element and its children to the clipboard, of delete the element and all of its children.<br />
Inspecting and Editing Styles<br />
Click Style (Control-Shift-3) in the Details sidebar to see the CSS styles that are applied to the currently selected<br />
element, as shown in Figure 3-3.<br />
Figure 3-3 Viewing styles in the Details sidebar of Web Inspector<br />
The first section of text in the Style details sidebar shows the computed style for the selected element, which<br />
is the sum of all inherited and overridden styles specified for that element and its containers. This section is<br />
followed by the sections containing the CSS specifications that apply to the element, in hierarchical order.<br />
Select the “Show inherited” option to see the inherited default styles being applied as well.<br />
Clicking an editable style brings up a series of checkboxes. Deselecting a checkbox disables the application of<br />
that style property. The results are immediately displayed in the browser window. The style is then displayed<br />
in strikethrough text, as shown in Figure 3-4. Reselecting the checkbox enables the style property again.<br />
Figure 3-4 Editing style properties<br />
2012-07-23 | © 2012 <strong>Apple</strong> Inc. All Rights Reserved.<br />
25
Debugging Your Website<br />
Debugging HTML and CSS Using Web Inspector<br />
Double-clicking a style allows you to edit it on the fly and immediately see the difference in your browser<br />
window. You can edit properties in a few different ways:<br />
● Press Delete with the property selected to delete the property, if allowed.<br />
● Use the keyboard to change the property values.<br />
● Use the arrow keys to increment or decrement the value by 1 (for numerical values only). Holding down<br />
the Option or Alt key increments or decrements the value by 0.1, while holding down the Shift key<br />
increments or decrements by 10.<br />
● Add style attributes by clicking in the white space or tabbing past the last attribute, or by appending a<br />
semicolon to the end of a line and typing in new style attributes.<br />
● Edit a selector by double-clicking it.<br />
● Create a new rule by choosing New Style Rule from the gear menu.<br />
● Cycle through different color representations—white, #ffffff, or rgb(255,255,255), for example—by<br />
clicking on the color swatch beside a color value.<br />
Because style properties are interactively editable, you can modify them until you have exactly the effect you<br />
want—before you change a line of source code.<br />
2012-07-23 | © 2012 <strong>Apple</strong> Inc. All Rights Reserved.<br />
26
Debugging Your Website<br />
Debugging HTML and CSS Using Web Inspector<br />
Inspecting and Editing Metrics<br />
Click Appearance to see the spatial metrics for a given element—its height and width, along with the height<br />
and width of any borders, margins, or padding. Double-click a metric value displayed on the right to edit it<br />
directly, as shown in Figure 3-5.<br />
Figure 3-5 Editing metric attributes<br />
2012-07-23 | © 2012 <strong>Apple</strong> Inc. All Rights Reserved.<br />
27
Debugging Your Website<br />
Debugging HTML and CSS Using Web Inspector<br />
Inspecting and Editing HTML Properties<br />
Click the disclosure triangle for HTMLElement under the Node navigator in the Details sidebar to view the<br />
highlighted element’s HTML properties. Double-click a property to edit its value, as illustrated in Figure 3-6 (page<br />
28).<br />
Figure 3-6 Editing HTML properties<br />
In this image, you can see the properties of the element with an id of main. The hidden property is set to<br />
false. Double-clicking the property allows you to edit its value.<br />
2012-07-23 | © 2012 <strong>Apple</strong> Inc. All Rights Reserved.<br />
28
Debugging Your Website<br />
Debugging JavaScript Using the Web Inspector<br />
Inspecting Listener Functions<br />
If any JavaScript functions have been added as event listeners, you can inspect them by clicking the HTML<br />
node of interest in the content browser, and then clicking the Event Listeners disclosure triangle in the Details<br />
sidebar, as shown in Figure 3-7.<br />
Figure 3-7 Event Listeners<br />
Clicking the go-to arrow to the right of the function name will take you to where the event handler is declared<br />
in the code.<br />
Debugging JavaScript Using the Web Inspector<br />
To start debugging JavaScript, open Web Inspector and click Breakpoint in the Navigation sidebar.<br />
You can set a breakpoint in any script by clicking in the gutter by the line number. The script will pause at the<br />
breakpoint. The script name, line number, and text of the breakpoint appear in the Breakpoints section on the<br />
left of the Web Inspector window. Clicking a breakpoint on the left jumps the text in the content browser to<br />
the line with the breakpoint. The breakpoint icon to the right of the line number allows you to enable and<br />
disable the breakpoint without removing it.<br />
2012-07-23 | © 2012 <strong>Apple</strong> Inc. All Rights Reserved.<br />
29
Debugging Your Website<br />
Debugging JavaScript Using the Web Inspector<br />
You can add breakpoints to your code by selecting a JavaScript file in the Resource navigator. Clicking in the<br />
gutter will add blue breakpoints. You also have the option to break on all exceptions or all uncaught exceptions<br />
in the Breakpoint navigator, as shown in Figure 3-8.<br />
Figure 3-8 The Breakpoint navigator<br />
When the source of the script is a JavaScript file, the filename is listed. If the source is in-line JavaScript in an<br />
HTML file, the URL of the HTML is listed. If the JavaScript is the result of a string passed through eval() or<br />
another anonymous source, the resource is listed as Anonymous Script.<br />
The pause button in the Quick Console at the bottom causes the debugger to pause JavaScript execution.<br />
While paused, all JavaScript calls are blocked, and you are presented with additional controls to help you<br />
understand your code:<br />
● On the left, the call stack is displayed in the Debug navigator. Viewing the call stack helps you trace the<br />
path in which functions execute.<br />
● On the right, properties of the scoped object, as well as local and global variables, are displayed in the<br />
Scope Chain details sidebar. These details help you visualize the current values of objects at that exact<br />
position in the code.<br />
● At the bottom, the pause button changes into more debugging buttons, allowing you to step past the<br />
next function, step into the next function, or step out of the current function. These controls allow you to<br />
step through any script, function by function, skipping functions as needed, and examine the call stack<br />
and variables at each point.<br />
2012-07-23 | © 2012 <strong>Apple</strong> Inc. All Rights Reserved.<br />
30
Debugging Your Website<br />
Using the Console to Debug JavaScript<br />
Web Inspector has a unique feature regarding in-scope variables: It shows closures, “with” statements, and<br />
event-related scope objects separately. This gives you a clearer picture of where your variables are coming<br />
from and why things might be breaking (or even working correctly by accident).<br />
You can also use the console to assist in debugging JavaScript.<br />
Using the Console to Debug JavaScript<br />
Click the Log navigator to open the Current Log. You can also press the Esc key anywhere in Web Inspector to<br />
move focus to the Quick Console in the bottom bar.<br />
Note: You can have multiple independent consoles open—one for each window or tab being<br />
inspected—as well as consoles for each component of a <strong>Safari</strong> extension being inspected, such as<br />
extension bars, injected scripts, and the global page.<br />
You can use the console to debug JavaScript in two distinct ways:<br />
● You can enter JavaScript interactively in the console and see the results immediately.<br />
● You can include various console functions in your JavaScript to log data to the Current Log while the<br />
script is running. These functions use the same syntax as the popular Firebug debugger.<br />
Entering JavaScript Interactively<br />
You can enter JavaScript in the console interactively to help debug your script. For example, you can call<br />
functions defined in the script and see the results; you can evaluate expressions that include variables or<br />
functions declared in your script; and you can query the values of variables directly.<br />
This is particularly helpful when used in combination with breakpoints in your code, allowing you to pause<br />
and inspect the script interactively at any point.<br />
The console also has auto-completion support. As you type, JavaScript variables, properties, and function<br />
names are suggested in a pop-up selection menu. Pressing Tab or the Right Arrow key accepts the current<br />
suggestion. If multiple selections begin with the same prefix, you can cycle through suggestions by pressing<br />
the Up and Down Arrow keys.<br />
Typing a variable name and pressing Enter displays the variable’s current value.<br />
Any changes you make to the DOM using JavaScript from the console are immediately displayed in the content<br />
browser, as well as in the browser window.<br />
2012-07-23 | © 2012 <strong>Apple</strong> Inc. All Rights Reserved.<br />
31
Debugging Your Website<br />
Using the Console to Debug JavaScript<br />
The Command-Line API<br />
In addition to the usual JavaScript methods, and the functions and variables defined in your script, you can<br />
enter some Firebug command-line APIs interactively at the console. The following commands are supported:<br />
● $0-$4<br />
Variables that contain the current and previous three selected nodes in Web Inspector.<br />
● $(id)<br />
Returns the element with the specified ID. Similar to getElementById().<br />
● $$(selector)<br />
Returns the array of elements that match the given CSS selector. Similar to querySelectorAll.<br />
● $x(xpath)<br />
Returns the array of elements that match the given XPath expression.<br />
● clear()<br />
Clears the console.<br />
● dir(object)<br />
Prints an interactive listing of all properties of the object. Similar to the popover from hovering over an<br />
object when a script is paused.<br />
● dirxml(node)<br />
Prints the XML source tree of an HTML or XML element. This looks identical to the view that you would<br />
see in the content browser of Web Inspector. You can click on any node to inspect it.<br />
● inspect(),<br />
Takes an element, database, or storage area as an argument and automatically jumps to the appropriate<br />
panel to display the relevant information.<br />
● keys(object)<br />
Returns an array containing the names of all properties of the object. (Properties are key-value pairs; the<br />
name of a property is the key.)<br />
● monitor(functionName)<br />
Turns on logging for all calls to a function.<br />
● monitorEvents(object[, types])<br />
Turns on logging for all events dispatched to an object. The optional argument types may specify a specific<br />
family of events to log. The most commonly used values for types are mouse and key.<br />
The full list of available types includes composition, contextmenu, drag, focus, form, key, load,<br />
mouse, mutation, paint, scroll, text, ui, and xul.<br />
2012-07-23 | © 2012 <strong>Apple</strong> Inc. All Rights Reserved.<br />
32
Debugging Your Website<br />
Using the Console to Debug JavaScript<br />
● profile([title])<br />
Turns on the JavaScript profiler. The optional title is a label for the profile.<br />
● profileEnd()<br />
Stops a running profile.<br />
● unmonitor(functionName)<br />
Stops logging calls to a function.<br />
● unmonitorEvents(object[, types])<br />
Stops logging events, optionally events of a particular type, that are dispatched to an object.<br />
● values(object)<br />
Returns an array containing the values of all properties of the object. The values are returned in the same<br />
order as the keys in keys(object).<br />
To make working with these APIs easier, they are included in the Console’s auto-completion capability.<br />
<strong>Safari</strong> JavaScript Console API<br />
<strong>Safari</strong> supports several JavaScript console functions for debugging. As an alternative to setting breakpoints,<br />
you can log branches in your code path, print variable values, and so on, using console functions. <strong>Safari</strong><br />
supports many of the same console functions used in the Firebug API.<br />
Note: You type the Firebug command-line APIs interactively in the console. You insert the Firebug<br />
console functions into your scripts.<br />
Many console functions take a message-object as a parameter. This message-object is logged to the error<br />
console. When <strong>Safari</strong> logs a message-object, it appends a hyperlink to the line in the source code where the<br />
logging console function appears. A message-object can contain a string, one or more variables, or a<br />
combination. You can use printf-style string substitution using numeric or string variable values. If variables<br />
are included, but not used for string substitution, the variable values are logged, space delimited.<br />
Examples of valid message-objects:<br />
"It got this far..."<br />
"Item and count:", item, count<br />
"Item: %s Count: %d", item, count<br />
"Item: %s Count:", item, count<br />
2012-07-23 | © 2012 <strong>Apple</strong> Inc. All Rights Reserved.<br />
33
Debugging Your Website<br />
Using the Console to Debug JavaScript<br />
count<br />
The following console functions are supported in <strong>Safari</strong>:<br />
● console.assert(expression, message-object)<br />
Logs the message, if expression evaluates false.<br />
● console.count([title])<br />
Logs the number of times this line of code has executed, and an optional title.<br />
● console.debug([message-object])<br />
Logs the message object.<br />
● console.dir(object)<br />
Logs the current properties of the object.<br />
● console.dirxml(node)<br />
Logs the DOM tree of an HTML or XML element.<br />
● console.error(message-object)<br />
Logs an “error” icon followed by a color-coded message object.<br />
● console.group(message-object)<br />
Logs the message-object and begins an indented block for further log entries.<br />
● console.groupEnd()<br />
Ends an indented block of log entries.<br />
● console.info(message-object)<br />
Logs the message-object.<br />
● console.log(message-object)<br />
Logs the message-object.<br />
● console.profile([title])<br />
Begins profiling JavaScript—tracking the number of times each function is called, the time spent in that<br />
function, and the time spent in nested groups of functions. If a title is provided, the profile is named. See<br />
“Optimizing JavaScript” (page 43).<br />
● console.profileEnd([title])<br />
Ends one or more JavaScript profiles. If a title is provided and a running profile has a matching title, only<br />
the current run of that profile is ended. Otherwise, the current run of all profiles is ended.<br />
● console.time(name)<br />
2012-07-23 | © 2012 <strong>Apple</strong> Inc. All Rights Reserved.<br />
34
Debugging Your Website<br />
Analyzing Client-Side Storage, Databases, and Cookies<br />
Starts a timer and gives it a name.<br />
● console.markTimeline("string")<br />
Adds a label to the timeline view marking the point when the method was called.<br />
● console.trace()<br />
Logs a JavaScript stack trace at the moment the function is called. The stack trace lists the functions on<br />
the call stack (functions that have been called and have not yet finished executing and returned), and the<br />
values of any arguments passed to those functions.<br />
● console.warn(message-object)<br />
Logs a “warning” icon followed by a color-coded message-object.<br />
Note: The functions console.log, console.info, console.warn, console.debug, and<br />
console.error all log a message. The only difference between the functions is the color-coding<br />
of the log entry and the inclusion of marker icons for warnings and errors.<br />
Analyzing Client-Side Storage, Databases, and Cookies<br />
You can use Web Inspector’s Storage navigator to inspect HTML5 client-side databases, local storage, session<br />
storage, cookies, and the application cache.<br />
2012-07-23 | © 2012 <strong>Apple</strong> Inc. All Rights Reserved.<br />
35
Debugging Your Website<br />
Analyzing Client-Side Storage, Databases, and Cookies<br />
Local storage and session storage are displayed as an editable data grid of key-value pairs. As shown in Figure<br />
3-9, cookies are displayed in a table that lists each cookie’s name, value, domain, path, expiration date, and<br />
size. Pressing the Delete key while a cookie is selected deletes the cookie.<br />
Figure 3-9 Inspecting cookies<br />
2012-07-23 | © 2012 <strong>Apple</strong> Inc. All Rights Reserved.<br />
36
Debugging Your Website<br />
Analyzing Client-Side Storage, Databases, and Cookies<br />
If a webpage uses HTML5 databases, they will display in the Storage navigator. Click the Databases disclose<br />
triangle to see a list of open databases and their tables. Selecting a database table displays a data grid containing<br />
all the columns and rows for that table, as shown in Figure 3-10.<br />
Figure 3-10 Inspecting databases<br />
2012-07-23 | © 2012 <strong>Apple</strong> Inc. All Rights Reserved.<br />
37
Debugging Your Website<br />
Inspecting the Offline Application Cache<br />
In addition to inspecting HTML5 databases, you can interact with them by issuing SQL queries against any of<br />
the displayed databases. Select a database in the sidebar to see an interactive console for evaluating SQL<br />
queries, as illustrated in Figure 3-11.<br />
Figure 3-11 An SQL query<br />
The input to this console has auto-completion and tab-completion for table names in the database, as well as<br />
common SQL words and phrases.<br />
Inspecting the Offline Application Cache<br />
Websites that provide a manifest file can have items stored in <strong>Safari</strong>’s offline application cache. On subsequent<br />
visits to the website, <strong>Safari</strong> loads these items from the cache instead of loading them from the website again.<br />
This provides a mechanism for websites to offer features such as canvas-based games that users can play, even<br />
when their device’s browser has no Internet connection.<br />
2012-07-23 | © 2012 <strong>Apple</strong> Inc. All Rights Reserved.<br />
38
Debugging Your Website<br />
Inspecting the Offline Application Cache<br />
You can inspect all the current contents of the application cache by opening the Storage navigator of the Web<br />
Inspector and clicking the Application Cache disclosure triangle. <strong>Safari</strong> shows a list of domains that have cached<br />
files. Select a domain to see the files in that domain’s cache, showing the URL from which they were loaded,<br />
the type of entry the resource was specified as (explicit, manifest, master, or fallback), and the file size, as shown<br />
in Figure 3-12.<br />
Figure 3-12 Application cache<br />
2012-07-23 | © 2012 <strong>Apple</strong> Inc. All Rights Reserved.<br />
39
Optimizing Your Website<br />
The final step in website development is optimization—making your website load and your scripts run as<br />
quickly and responsively as possible. <strong>Safari</strong> has a visual download analyzer and a JavaScript profiler to help<br />
you.<br />
Optimizing Loading, Scripting, and Rendering Times<br />
If your website loads slowly, use the timeline view in the Instrument navigator to see why. You can see<br />
immediately if the delay is caused by a server-side script that is not responding promptly, a large resource that<br />
takes a long time to load, or a script that takes a long time to execute prior to requesting another resource.<br />
You can also use the timeline view to scan for resources that are not loading at all, such as missing style sheets<br />
or requested resources that have been misspelled.<br />
To see how long it takes to load a website, including the time spent evaluating scripts and rendering, click the<br />
gray record circle button toward the top-right corner of the Instrument navigator. When the circle turns red<br />
to indicate that recording has started, press Command-R to reload the website. Wait until the site has loaded,<br />
then click the red circle button to stop recording.<br />
2012-07-23 | © 2012 <strong>Apple</strong> Inc. All Rights Reserved.<br />
40
Optimizing Your Website<br />
Optimizing Loading, Scripting, and Rendering Times<br />
At the top of the content browser, <strong>Safari</strong> lists the network requests, CSS layout calculations and rendering<br />
processes, and JavaScript events involved in loading and displaying the website when they occur chronologically.<br />
They appear as a series of blue-, purple-, and yellow-colored bars, as shown in Figure 4-1.<br />
Figure 4-1 Inspecting timelines<br />
When the Network Requests timeline is selected, the bottom portion of the content browser displays each<br />
individual file requested from the webpage. The horizontal bar graph shows you when each resource was<br />
requested, the latency of the server, and the download time for each resource. Hover over any bar to see<br />
additional details in a tooltip.<br />
The vertical dashed blue line indicates when the DOM is available to <strong>Safari</strong>, and is equivalent to the<br />
DOMContentLoaded JavaScript event. The red line indicates when all resources have loaded, and is equivalent<br />
to the load JavaScript event.<br />
Click the record button or press Command-R again to record a new timeline.<br />
To see an alternate timeline view showing network latency, resource size, load time, HTTP request type, and<br />
status, click the Columns button on the right edge of Web Inspector. This brings up the network timeline view,<br />
as shown in Figure 4-2. Drag the divider between any two columns to make a column wider or narrower, and<br />
2012-07-23 | © 2012 <strong>Apple</strong> Inc. All Rights Reserved.<br />
41
Optimizing Your Website<br />
Optimizing Loading, Scripting, and Rendering Times<br />
click any column header to sort that column. Sorting by Transferred, for example, will show you the largest<br />
resources coming over the wire. Sorting by Latency will show you the files that took the longest for the remote<br />
host to serve.<br />
Figure 4-2 Network timeline view<br />
Click the go-to arrow next to an item in the Name column to preview the file’s contents, and to see the request<br />
and response headers, as illustrated in Figure 4-3. Click the Back arrow to return to the timeline view.<br />
Figure 4-3 Network content and headers view<br />
Just as you can see great detail about every resource that has loaded, you can see great detail about every CSS<br />
rendering process and every JavaScript event. Click on Layout & Rendering or JavaScript & Events in the<br />
Timelines pane to display a table of each paint and event that has been captured.<br />
2012-07-23 | © 2012 <strong>Apple</strong> Inc. All Rights Reserved.<br />
42
Optimizing Your Website<br />
Optimizing JavaScript<br />
Optimizing JavaScript<br />
Underneath the Timelines pane in the Instrument navigator is the Profiles pane. This pane allows you to see<br />
where execution time is being spent in your JavaScript. Use the Profiles pane to find bottlenecks in your scripts<br />
and optimize their performance.<br />
To use the Profiles pane, you must start profiling, either manually or by including a console.profile() call<br />
in your script. To start profiling manually, click the record button (gray circle) in the top right of the Profiles<br />
pane. The record button turns red. To stop the profile, click the record button again. No profile is displayed<br />
until you stop profiling, either manually or through a call to console.profileEnd(). Each time you begin<br />
and end profiling, another profile is captured.<br />
The JavaScript profiler is fully compatible with the Firebug functions console.profile() and<br />
console.profileEnd(), but in <strong>Safari</strong> you can optionally specify a title in console.profileEnd() to stop<br />
a specific profile if multiple profiles are being recorded.<br />
Once you have captured one or more profiles, they are listed on the left side of Web Inspector. Manual profiles<br />
are named sequentially (JavaScript Profile 1, JavaScript Profile 2, and so on). Profiles created by calls to<br />
console.profile() are named with the title of the profile provided in the script. If multiple profiles are<br />
captured under the same name, a disclosure triangle reveals multiple runs within the profile.<br />
The time spent in each function executed during the profile is displayed, as well as the number of times each<br />
function is called, as shown in Figure 4-4. The time is displayed as a percentage of total time.<br />
Figure 4-4 Profiling JavaScript<br />
2012-07-23 | © 2012 <strong>Apple</strong> Inc. All Rights Reserved.<br />
43
Optimizing Your Website<br />
Optimizing JavaScript<br />
Clicking a profile name displays the functions that were executed during the profile, the time spent in each<br />
function, and the number of times each function was called. The time spent is broken down into three categories:<br />
Self, the total time spent in the function itself; Total, the total time spent in the function and any subordinate<br />
functions it calls in turn; and Average, the average time spent in the function itself during each call (the Self<br />
time divided by the number of calls).<br />
If a function is declared with a name, the function name is displayed. If a function is created programmatically<br />
by an eval() statement or inline tagset, it is labeled (program) in the profile. Other<br />
unnamed functions, for example a function defined within a variable declaration, are labeled (anonymous<br />
function).<br />
Note: To assist in debugging, assign a displayName to this kind of otherwise anonymous function.<br />
The displayName is used as the function name in profiles.<br />
Where applicable, the source URL and line number of the function declaration is shown in gray to the right of<br />
the function name. The source URL is a link. Clicking it opens the source in the content browser, scrolled to<br />
the line number where the function is declared.<br />
2012-07-23 | © 2012 <strong>Apple</strong> Inc. All Rights Reserved.<br />
44
Keyboard and Mouse Shortcuts<br />
There are a number of mouse and keyboard shortcuts in Web Inspector. These can be significant time savers<br />
if you use Web Inspector frequently.<br />
General Shortcuts<br />
Toggle Web Inspector<br />
Show Console<br />
Toggle Profiling JavaScript<br />
Mac<br />
Web Inspector Shortcuts<br />
Resource navigator<br />
Storage navigator<br />
Instrument navigator<br />
Search navigator<br />
Issue navigator<br />
Debug navigator<br />
Breakpoint navigator<br />
Log navigator<br />
Resource details<br />
Mac<br />
Control-1<br />
Control-2<br />
Control-3<br />
Control-4<br />
Control-5<br />
Control-6<br />
Control-7<br />
Control-8<br />
Command-Option-I<br />
Command-Option-C<br />
Command-Option-Shift-P<br />
Control-Shift-1<br />
Windows<br />
Ctrl-1<br />
Ctrl-2<br />
Ctrl-3<br />
Ctrl-4<br />
Ctrl-5<br />
Ctrl-6<br />
Ctrl-7<br />
Ctrl-8<br />
Ctrl-Shift-1<br />
Windows<br />
Ctrl-Alt-I<br />
Ctrl-Alt-C<br />
Ctrl-Alt-P<br />
2012-07-23 | © 2012 <strong>Apple</strong> Inc. All Rights Reserved.<br />
45
Keyboard and Mouse Shortcuts<br />
Console Shortcuts<br />
Node details<br />
Style details<br />
Appearance details<br />
Quick Console<br />
Control-Shift-2<br />
Control-Shift-3<br />
Control-Shift-4<br />
Esc<br />
Console Shortcuts<br />
Accept Suggestion (auto-completion)<br />
Next Line / Command<br />
Previous Line / Command<br />
Next Command<br />
Previous Command<br />
Clear History<br />
Execute<br />
DOM Tree Shortcuts<br />
Navigate<br />
Expand / Collapse<br />
Edit Node<br />
Expand<br />
Edit Attribute<br />
Add Attribute<br />
Mac<br />
Up and Down Arrows<br />
Left and Right Arrows<br />
Return<br />
Double-click tag<br />
Mac<br />
Ctrl-Shift-2<br />
Ctrl-Shift-3<br />
Ctrl-Shift-4<br />
Esc<br />
Tab or Right Arrow<br />
Down Arrow<br />
Up Arrow<br />
Control-N<br />
Control-P<br />
Command-K or Control-L<br />
Return<br />
Double-click attribute or tab to next<br />
attribute<br />
Tab past last attribute<br />
Windows<br />
Windows<br />
Tab or Right Arrow<br />
Down Arrow<br />
Up Arrow<br />
Ctrl-L<br />
Enter<br />
Up and Down Arrows<br />
Left and Right Arrows<br />
Enter<br />
2012-07-23 | © 2012 <strong>Apple</strong> Inc. All Rights Reserved.<br />
46<br />
Double-click tag<br />
Double-click attribute or tab to next<br />
attribute<br />
Tab past last attribute
Keyboard and Mouse Shortcuts<br />
Style Details Shortcuts<br />
Style Details Shortcuts<br />
Edit Rule<br />
Next / Prev Property<br />
Insert New Property<br />
Increment / Decrement Value<br />
Increment / Decrement by 0.1<br />
Increment / Decrement by 10<br />
Increment / Decrement by<br />
100<br />
Debugger Shortcuts<br />
Step Out<br />
Step Into<br />
Step Over<br />
Continue<br />
Toggle Breakpoint<br />
Mac<br />
Mac<br />
Double-click<br />
Tab / Shift-Tab<br />
Double-click whitespace<br />
Up and Down Arrows<br />
Option-Up and Option-Down<br />
Arrows<br />
Shift-Up and Shift-Down Arrows,<br />
or PgUp and PgDn<br />
Shift-PgUp and Shift-PgDn<br />
F8 or Command-Shift-;<br />
F7 or Command-;<br />
F6 or Command-’<br />
Command-/ or Command-Shift-Y<br />
Click line number<br />
Windows<br />
Windows<br />
Double-click<br />
F8 or Ctrl-Shift-;<br />
F7 or Ctrl-;<br />
F6 or Ctrl-’<br />
Tab / Shift-Tab<br />
Double-click whitespace<br />
Up and Down Arrows<br />
Alt-Up and Alt-Down Arrows<br />
Shift-Up and Shift-Down Arrows,<br />
or PgUp and PgDn<br />
Shift-PgUp and Shift-PgDn<br />
Ctrl-/ or Ctrl-Shift-Y<br />
Click line number<br />
2012-07-23 | © 2012 <strong>Apple</strong> Inc. All Rights Reserved.<br />
47
Document Revision History<br />
This table describes the changes to <strong>Safari</strong> <strong>Developer</strong> <strong>Tools</strong> <strong>Guide</strong> .<br />
Date<br />
2012-07-23<br />
2011-07-21<br />
2010-08-26<br />
2010-06-21<br />
2010-01-20<br />
2009-11-17<br />
2009-06-01<br />
2009-01-06<br />
2008-10-15<br />
2008-09-09<br />
Notes<br />
Updated screenshots to reflect new Web Inspector UI.<br />
Removed references to runaway JavaScript timer.<br />
Updated for <strong>Safari</strong> 5.1. Changed title from <strong>Safari</strong> User <strong>Guide</strong> for Web<br />
<strong>Developer</strong>s.<br />
Updated for <strong>Safari</strong> 5.0.1. Corrected typos and minor errors.<br />
Updated for <strong>Safari</strong> 5.0<br />
Added description of JavaScript 'console' API.<br />
Revised to be task-oriented, with sections on prototyping, debugging,<br />
and optimizing websites.<br />
Revised and expanded for <strong>Safari</strong> 4.0.<br />
Added description of <strong>Safari</strong> Mobile debug console.<br />
Corrected typos.<br />
Corrected minor typos and adjusted for style and consistency.<br />
Describes hidden developer tools introduced in <strong>Safari</strong> 3.1<br />
2012-07-23 | © 2012 <strong>Apple</strong> Inc. All Rights Reserved.<br />
48
<strong>Apple</strong> Inc.<br />
© 2012 <strong>Apple</strong> Inc.<br />
All rights reserved.<br />
No part of this publication may be reproduced,<br />
stored in a retrieval system, or transmitted, in any<br />
form or by any means, mechanical, electronic,<br />
photocopying, recording, or otherwise, without<br />
prior written permission of <strong>Apple</strong> Inc., with the<br />
following exceptions: Any person is hereby<br />
authorized to store documentation on a single<br />
computer for personal use only and to print<br />
copies of documentation for personal use<br />
provided that the documentation contains<br />
<strong>Apple</strong>’s copyright notice.<br />
No licenses, express or implied, are granted with<br />
respect to any of the technology described in this<br />
document. <strong>Apple</strong> retains all intellectual property<br />
rights associated with the technology described<br />
in this document. This document is intended to<br />
assist application developers to develop<br />
applications only for <strong>Apple</strong>-labeled computers.<br />
<strong>Apple</strong> Inc.<br />
1 Infinite Loop<br />
Cupertino, CA 95014<br />
408-996-1010<br />
<strong>Apple</strong>, the <strong>Apple</strong> logo, iPad, iPhone, iPod, iPod<br />
touch, Mac, OS X, <strong>Safari</strong>, and Xcode are<br />
trademarks of <strong>Apple</strong> Inc., registered in the U.S.<br />
and other countries.<br />
App Store and Mac App Store are service marks<br />
of <strong>Apple</strong> Inc.<br />
Java is a registered trademark of Oracle and/or<br />
its affiliates.<br />
OpenGL is a registered trademark of Silicon<br />
Graphics, Inc.<br />
Times is a registered trademark of Heidelberger<br />
Druckmaschinen AG, available from Linotype<br />
Library GmbH.<br />
iOS is a trademark or registered trademark of<br />
Cisco in the U.S. and other countries and is used<br />
under license.<br />
Even though <strong>Apple</strong> has reviewed this document,<br />
APPLE MAKES NO WARRANTY OR REPRESENTATION,<br />
EITHER EXPRESS OR IMPLIED, WITH RESPECT TO THIS<br />
DOCUMENT, ITS QUALITY, ACCURACY,<br />
MERCHANTABILITY, OR FITNESS FOR A PARTICULAR<br />
PURPOSE. AS A RESULT, THIS DOCUMENT IS PROVIDED<br />
“AS IS,” AND YOU, THE READER, ARE ASSUMING THE<br />
ENTIRE RISK AS TO ITS QUALITY AND ACCURACY.<br />
IN NO EVENT WILL APPLE BE LIABLE FOR DIRECT,<br />
INDIRECT, SPECIAL, INCIDENTAL, OR CONSEQUENTIAL<br />
DAMAGES RESULTING FROM ANY DEFECT OR<br />
INACCURACY IN THIS DOCUMENT, even if advised of<br />
the possibility of such damages.<br />
THE WARRANTY AND REMEDIES SET FORTH ABOVE<br />
ARE EXCLUSIVE AND IN LIEU OF ALL OTHERS, ORAL<br />
OR WRITTEN, EXPRESS OR IMPLIED. No <strong>Apple</strong> dealer,<br />
agent, or employee is authorized to make any<br />
modification, extension, or addition to this warranty.<br />
Some states do not allow the exclusion or limitation<br />
of implied warranties or liability for incidental or<br />
consequential damages, so the above limitation or<br />
exclusion may not apply to you. This warranty gives<br />
you specific legal rights, and you may also have other<br />
rights which vary from state to state.