Spectral in-situ analysis of NO2, NO3, COD, DOC and TSS ... - S-can
Spectral in-situ analysis of NO2, NO3, COD, DOC and TSS ... - S-can
Spectral in-situ analysis of NO2, NO3, COD, DOC and TSS ... - S-can

Create successful ePaper yourself
Turn your PDF publications into a flip-book with our unique Google optimized e-Paper software.
<strong>Spectral</strong> <strong>in</strong>-<strong>situ</strong> <strong>analysis</strong> <strong>of</strong> <strong>NO2</strong>, <strong>NO3</strong>, <strong>COD</strong>, <strong>DOC</strong> <strong>and</strong> <strong>TSS</strong> <strong>in</strong><br />
the effluent <strong>of</strong> a WWTP<br />
L. Rieger 1 , G. Langergraber 2 , M. Thomann 3 , N. Fleischmann 4 , <strong>and</strong> H. Siegrist 1<br />
1) EAWAG, Swiss Federal Institute for Environmental Science <strong>and</strong> Technology<br />
Ueberl<strong>and</strong>str. 133, PO Box 611, 8600 Duebendorf, Switzerl<strong>and</strong>. leiv.rieger@eawag.ch<br />
2 ) Institute <strong>of</strong> Sanitary Eng<strong>in</strong>eer<strong>in</strong>g <strong>and</strong> Water Pollution Control, BOKU – Univ. <strong>of</strong> Natural Resources <strong>and</strong><br />
Applied Life Sciences, Vienna, Austria. guenter.langergraber@boku.ac.at<br />
3 ) BMG Eng<strong>in</strong>eer<strong>in</strong>g AG, Grammetstrasse 14, 4410 Liestal, Switzerl<strong>and</strong>. michael.thomann@bmgeng.ch<br />
4 ) hydrophil, Lerchenfeldergürtel 43, Top 6/3, 1160 Vienna, Austria. niki.fleischmann@hydrophil.at<br />
Abstract<br />
An <strong>in</strong>-<strong>situ</strong> UV spectrometer was applied <strong>in</strong> the effluent <strong>of</strong> a WWTP <strong>in</strong> Switzerl<strong>and</strong> <strong>and</strong> calibrated<br />
us<strong>in</strong>g a multivariate calibration algorithm that is based on PLS regression. Except for nitrite the<br />
calibration was based on comparative measurements <strong>of</strong> the effluent <strong>in</strong> the plant laboratory. For<br />
nitrite calibration samples made <strong>of</strong> stock solution added to three different matrices made <strong>in</strong> the<br />
EAWAG laboratory were used for the calibration because the effluent concentrations were always<br />
<strong>in</strong> the range <strong>of</strong> 0.06 – 0.26 mg/l. The results show very good precision for nitrite <strong>and</strong> nitrate. For<br />
<strong>COD</strong> <strong>and</strong> <strong>DOC</strong> the measur<strong>in</strong>g range was not completely covered with measurements, so the<br />
mean<strong>in</strong>gfulness <strong>of</strong> the results is limited. Nevertheless the obta<strong>in</strong>ed precision for soluble <strong>COD</strong> is<br />
high enough for most applications at WWTP’s. The accuracy <strong>of</strong> the <strong>TSS</strong> measurement is unsatisfy<strong>in</strong>g<br />
regard<strong>in</strong>g effluent limits s<strong>in</strong>ce the used spectrometer does not cover the wavelength region<br />
up to 700 nm, which give better signals for <strong>TSS</strong> calibration due to its strong relation to turbidity.<br />
Keywords<br />
Spectroscopy, <strong>in</strong>-<strong>situ</strong> sensor, nitrite, nitrate, <strong>COD</strong>, <strong>DOC</strong>, <strong>TSS</strong><br />
INTRODUCTION<br />
Nitrite is an <strong>in</strong>termediate product <strong>of</strong> the two-step process <strong>of</strong> nitrification. S<strong>in</strong>ce the second step <strong>of</strong><br />
nitratation is very fast, the nitrite concentration <strong>in</strong> the effluent <strong>of</strong> a WWTP is normally very low<br />
(around 0.1 mg/l). Enrichment <strong>of</strong> nitrite <strong>in</strong> the system usually is a h<strong>in</strong>t that the microbiological<br />
processes are disturbed. This means <strong>in</strong>hibition due to toxic substances or due to unfavourable<br />
conditions for the nitrite oxidiser. Nitrite is a strong poison for fishes, which reduce the oxygen<br />
transfer capability <strong>of</strong> the blood (Gujer, 1999). High concentrations <strong>of</strong> nitrite <strong>in</strong> the effluent <strong>of</strong><br />
WWTP’s <strong>can</strong> lead to damages <strong>of</strong> organisms if the dilution <strong>of</strong> the receiv<strong>in</strong>g water body is too low.<br />
S<strong>in</strong>ce lab measurements <strong>of</strong> grab samples only <strong>can</strong> give a snapshot <strong>and</strong> the <strong>analysis</strong> <strong>of</strong> 24hcomposite<br />
samples is critical due to the <strong>in</strong>stable nitrite concentration the mean<strong>in</strong>gfulness is limited.<br />
Us<strong>in</strong>g on-l<strong>in</strong>e analysers, which need a high sample preparation time <strong>can</strong> lead to similar problems.<br />
Therefore <strong>in</strong>-<strong>situ</strong> sensors will be advantageously.<br />
The dissolved organic carbon (<strong>DOC</strong>) <strong>and</strong> the soluble <strong>COD</strong> are parameters for the <strong>in</strong>ert or persistent<br />
compounds <strong>in</strong> the effluent, which <strong>can</strong> not be elim<strong>in</strong>ated <strong>in</strong> the biological stage <strong>of</strong> the plant. For<br />
<strong>in</strong>dustrial plants or future process steps <strong>in</strong> municipal plants it <strong>can</strong> be used for an optimization <strong>of</strong> the<br />
carbon degradation processes, e.g. as an <strong>in</strong>put signal for a control concept to treat persistent<br />
compounds with ozone.<br />
29
Session 1 AutMoNet 2004<br />
The concentration <strong>of</strong> total suspended solids (<strong>TSS</strong>) <strong>in</strong> the effluent <strong>of</strong> the secondary clarifier is one <strong>of</strong><br />
the most important measurements on a WWTP us<strong>in</strong>g normal clarifiers, because it identifies the<br />
amount <strong>of</strong> sludge lost <strong>in</strong> the effluent. The sludge <strong>of</strong> municipal WWTP’s conta<strong>in</strong>s ca. 7% nitrogen,<br />
2.5% phosphorus <strong>and</strong> consists ma<strong>in</strong>ly <strong>of</strong> biomass (<strong>TSS</strong>/<strong>COD</strong> ratio between 0.9 <strong>and</strong> 1.1).<br />
Additionally heavy metals <strong>can</strong> adsorb on sludge flocs. Therefore the lost sludge could play an<br />
important role regard<strong>in</strong>g effluent quality levels (<strong>in</strong> Switzerl<strong>and</strong> ma<strong>in</strong>ly for P due to the strict<br />
effluent levels <strong>of</strong> normally 0.8 mg P/l) or if the clarifier fails completely the loss <strong>of</strong> the biomass<br />
cause lower purification performance.<br />
Measur<strong>in</strong>g all parameters on-l<strong>in</strong>e will <strong>in</strong>crease the monitor<strong>in</strong>g capability <strong>and</strong> therefore enable<br />
appropriate control <strong>of</strong> the plant <strong>in</strong> order to prevent ecologically harmful discharges. Measur<strong>in</strong>g them<br />
with one s<strong>in</strong>gle probe will reduce the effort <strong>and</strong> therefore the costs.<br />
MATERIAL AND METHODS<br />
In-<strong>situ</strong> spectrometer<br />
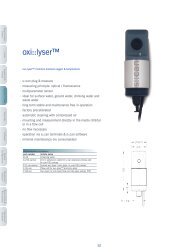
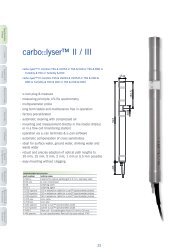
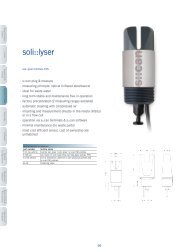
The tested <strong>in</strong>-<strong>situ</strong> spectrometer (spectro::lyser, s::<strong>can</strong> Messtechnik GmbH, Vienna, Austria) is<br />
capable <strong>of</strong> measur<strong>in</strong>g absorbance <strong>of</strong> ultraviolet (UV from 200 nm - 400 nm) light, or ultraviolet <strong>and</strong><br />
visible (UV/VIS from 200 nm - 750 nm) light. A s<strong>in</strong>gle evaluation <strong>of</strong> the entire spectrum typically<br />
takes 15 seconds. Measur<strong>in</strong>g UV/VIS absorbance is an <strong>in</strong>direct method for determ<strong>in</strong><strong>in</strong>g wastewater<br />
compounds. The sensor <strong>can</strong> be calibrated to all absorb<strong>in</strong>g substances, typical applications <strong>in</strong> the<br />
water sector are organic matter (e.g. total <strong>COD</strong>, <strong>COD</strong> fractions, BOD5, TOC, or <strong>DOC</strong>), <strong>TSS</strong>,<br />
turbidity <strong>and</strong> nitrate (Figure 1). For typical waters (e.g. municipal wastewater – raw <strong>and</strong> treated,<br />
river water, dr<strong>in</strong>k<strong>in</strong>g water, …) a global calibration is provided as default configuration <strong>of</strong> the<br />
UV/VIS spectrometer. Due to the specific wastewater characteristics the sensor has to be calibrated<br />
to the wastewater at the measurement location (local calibration). The local calibration improves<br />
trueness, precision <strong>and</strong> long term stability <strong>of</strong> the results.<br />
30<br />
Absorption [1/m]<br />
500<br />
450<br />
400<br />
350<br />
300<br />
250<br />
200<br />
150<br />
NO 3,<br />
NO 2<br />
UV radiation Visible radiation (Vis)<br />
CSB-total<br />
Uncompensated spectrum<br />
(left axis)<br />
100<br />
Turbidity, <strong>TSS</strong><br />
20<br />
50<br />
Color<br />
Turbidity compensated<br />
0<br />
CSB-soluble<br />
spectrum (right axis)<br />
0<br />
200 250 300 350 400 450 500 550 600 650 700 750<br />
Wavelength [nm]<br />
120<br />
100<br />
80<br />
60<br />
40<br />
s::<strong>can</strong> Messtechnik GmbH<br />
Figure 1: Absorption <strong>of</strong> different compounds with<strong>in</strong> the spectrum from 200 to 750 nm<br />
The spectrometer is built as a compact submersible sensor enabl<strong>in</strong>g measurement <strong>of</strong> optical spectra<br />
with laboratory quality directly <strong>in</strong> liquid media. Sensitivity <strong>can</strong> be adapted to the application<br />
dem<strong>and</strong>s by select<strong>in</strong>g the optical path length with<strong>in</strong> a range <strong>of</strong> 1 - 100 mm. This opens a wide range<br />
<strong>of</strong> applications from ultra pure waters (<strong>DOC</strong> > 10 µg/l) up to concentrated <strong>in</strong>dustrial wastewater.<br />
The spectrometer is equipped with an auto-clean<strong>in</strong>g system us<strong>in</strong>g pressurized air, which has been<br />
proved to work extremely reliable (W<strong>in</strong>kler et al., 2002). More <strong>in</strong>formation about the sensor <strong>can</strong> be<br />
found <strong>in</strong> W<strong>in</strong>kler et al. (2002) <strong>and</strong> Langergraber et al. (2003).<br />
Absorption [1/m]
AutMoNet 2004 Rieger et al.<br />
The sensor located <strong>in</strong> the secondary clarifier effluent <strong>of</strong> the WWTP Thunersee is an UV<br />
spectrometer equipped with a path length <strong>of</strong> 10 mm to enable the differentiation between nitrite <strong>and</strong><br />
nitrate at <strong>TSS</strong> concentrations up to 15 mg/l (manufacturer specification). Physically<br />
256 wavelengths are measured between 210 <strong>and</strong> 400 nm (resolution ca. 0.8 nm), which will be<br />
converted <strong>in</strong>to a resolution <strong>of</strong> 1 nm for the calculation <strong>of</strong> the concentrations.<br />
Sensor calibration<br />
The calibration <strong>of</strong> the spectrometer is based on a Partial-Least-Square (PLS) regression for the<br />
parameters <strong>of</strong> concern. The PLS regression is an <strong>in</strong>direct chemometric model correlat<strong>in</strong>g the<br />
concentrations <strong>of</strong> the required determ<strong>in</strong>ants to spectra <strong>and</strong> especially accounts for concentrationspectra<br />
relationships. The number <strong>of</strong> signifi<strong>can</strong>t pr<strong>in</strong>cipal components for the PLS regression is<br />
obta<strong>in</strong>ed from the m<strong>in</strong>imum residual error (m<strong>in</strong>imum PRESSCV value; PRESSCV value = predictive<br />
residual sum <strong>of</strong> squares based on cross validation; Otto, 1999). For every parameter under<br />
consideration a PRESSCV value is calculated. For multivariate calibrations <strong>of</strong> multiple parameters<br />
the mean value <strong>of</strong> the s<strong>in</strong>gle PRESSCV values was used to determ<strong>in</strong>e the optimal number <strong>of</strong><br />
pr<strong>in</strong>cipal components <strong>in</strong> the algorithm described by Langergraber et al. (2003). An improved<br />
algorithm uses different optimal numbers <strong>of</strong> pr<strong>in</strong>cipal components for each parameter. Additionally<br />
different optimal wavelengths (WL) <strong>can</strong> be chosen. The applied improved algorithm leads to better<br />
calibration results for the s<strong>in</strong>gle parameters.<br />
Figure 2 shows the spectrum from tap water spiked with nitrite <strong>and</strong> its de-convolution <strong>in</strong>to the<br />
s<strong>in</strong>gle substance spectra <strong>of</strong> nitrate <strong>and</strong> nitrite (4.3 mg/l <strong>NO3</strong>-N <strong>and</strong> 0.3 mg/l <strong>NO2</strong>-N). The rema<strong>in</strong><strong>in</strong>g<br />
spectrum represents organic matter (1.1 mg/l TOC) which shows the highest absorbance for all<br />
wavelengths at about 250 nm. Both nitrate <strong>and</strong> nitrite have their highest absorbance <strong>in</strong> the lower<br />
wavelength region (210 – 240 nm) <strong>and</strong> the peaks for nitrate <strong>and</strong> nitrite at around 300 nm <strong>and</strong><br />
360 nm respectively are relatively small compared to the absorbance <strong>of</strong> organic matter. Therefore<br />
no dist<strong>in</strong>ction between nitrate <strong>and</strong> nitrite was possible us<strong>in</strong>g only one or two wavelengths (see<br />
results <strong>and</strong> discussion). With PLS regression based on 5 to 7 wavelength an accurate calibration <strong>can</strong><br />
be achieved (Figure 4).<br />
Absorption [1/m]<br />
100<br />
10<br />
1<br />
0.1<br />
0.01<br />
Sample<br />
0.001<br />
230 240 250 260 270 280 290 300 310 320 330 340 350 360 370 380<br />
Wavelenght [nm]<br />
Nitrate (<strong>NO3</strong>-N = 4.3 mg/l)<br />
Nitrite (<strong>NO2</strong>-N = 0.31 mg/l)<br />
Organic matter (TOC = 1.1 mg/l)<br />
Figure 2: Spectrum for tap water (spiked with nitrite) <strong>and</strong> the de-convolution <strong>in</strong>to spectra <strong>of</strong> <strong>NO3</strong>, <strong>NO2</strong> <strong>and</strong><br />
org. matter<br />
Figure 3 shows spectra for three different matrices with vary<strong>in</strong>g <strong>NO2</strong>-N concentrations. A slight<br />
<strong>in</strong>crease <strong>in</strong> absorption (logarithmic y-axis) over the whole wavelength region <strong>can</strong> be observed for<br />
the spectra from reverse osmosis (RO) water spiked with 1 <strong>and</strong> 2 mg/l <strong>NO2</strong>-N respectively. The<br />
content <strong>of</strong> organic matter <strong>and</strong> nitrate <strong>in</strong> the RO water was below 0.05 mg/l TOC <strong>and</strong> 0.05 mg/l <strong>NO3</strong>-<br />
N respectively. Due to the higher organic matter content <strong>in</strong> the tap water samples (0.7 mg/l TOC<br />
<strong>and</strong> 1.1 mg/l <strong>NO3</strong>-N) the differences for the same two <strong>NO2</strong>-N concentrations <strong>can</strong> be observed below<br />
31
Session 1 AutMoNet 2004<br />
255 nm <strong>and</strong> around 360 nm. Us<strong>in</strong>g samples from the WWTP effluent (12.3 mg/l <strong>DOC</strong> <strong>and</strong> 6.2 mg/l<br />
<strong>NO3</strong>-N) only below 245 nm differences <strong>in</strong> the spectra <strong>can</strong> be observed for the two <strong>NO2</strong>-N<br />
concentrations. Therefore only wavelengths <strong>in</strong> this region were determ<strong>in</strong>ed as the optimal<br />
wavelengths for <strong>NO2</strong>-N by the calibration algorithm. It is obvious that the calibration algorithm will<br />
result <strong>in</strong> different optimal wavelengths for <strong>NO2</strong>-N for different matrices.<br />
32<br />
Absorption [m -1 ]<br />
1000<br />
100<br />
10<br />
1<br />
0.1<br />
Used wavelength range for nitrite calibration<br />
at WWTP Thunersee<br />
WWTP effluent with <strong>NO2</strong>-N = 1mg/l<br />
WWTP effluent with <strong>NO2</strong>-N = 3mg/l<br />
Tap water with <strong>NO2</strong>-N = 1mg/ l<br />
Tap water with <strong>NO2</strong>-N = 2mg/ l<br />
RO water with <strong>NO2</strong>-N = 1mg/l<br />
RO water with <strong>NO2</strong>-N = 2mg/l<br />
0.01<br />
210 230 250 270 290 310 330 350 370 390 410<br />
Wavelength [nm]<br />
Figure 3: Spectra for three different matrices with different <strong>NO2</strong>-N concentrations<br />
Application on effluent <strong>of</strong> WWTP Thunersee<br />
The WWTP Thunersee (CH) treats the wastewater <strong>of</strong> 130’000 PE <strong>and</strong> receives ma<strong>in</strong>ly municipal<br />
wastewater. It is designed for full nitrification, pre-denitrification <strong>and</strong> EBPR accord<strong>in</strong>g to the AAO<br />
scheme. The goal <strong>of</strong> monitor<strong>in</strong>g nitrite was to evaluate the <strong>in</strong>fluence <strong>of</strong> low dissolved oxygen<br />
concentrations <strong>in</strong> the biological stage <strong>and</strong> especially the possible accumulation <strong>of</strong> nitrite <strong>in</strong> the<br />
effluent.<br />
The spectrometer was <strong>in</strong>stalled <strong>in</strong> the effluent <strong>of</strong> the secondary clarifier. For the reference <strong>analysis</strong><br />
the spectrometer was removed from the measurement location <strong>and</strong> put <strong>in</strong>to a bucket with a grab<br />
sample <strong>of</strong> secondary effluent. Then several spectra were recorded with<strong>in</strong> the bucket ma<strong>in</strong>ta<strong>in</strong><strong>in</strong>g<br />
complete mix<strong>in</strong>g. In order to secure the <strong>in</strong>dependence <strong>of</strong> the subsequent spectra – the auto clean<strong>in</strong>g<br />
was triggered after each measurement. For laboratory measurements a grab sample from the bucket<br />
was taken <strong>and</strong> analysed twice with Dr.Lange test kits (<strong>NO2</strong>-N: LCK341, <strong>NO3</strong>-N: LCK339/340,<br />
<strong>DOC</strong>: LCK383, <strong>COD</strong>: LCK414) us<strong>in</strong>g a CADAS 200 <strong>and</strong> gravimetrical <strong>TSS</strong> <strong>analysis</strong>.<br />
Laboratory<br />
S<strong>in</strong>ce the concentrations <strong>of</strong> the comparative nitrite measurements are all <strong>in</strong> the range between 0.06<br />
<strong>and</strong> 0.26 mg N/l (Figure 5), a calibration on the measur<strong>in</strong>g range <strong>of</strong> 0 to 3 mg N/l would imply a<br />
signifi<strong>can</strong>t extrapolation on a weak basis. To overcome this lack <strong>of</strong> calibration data a n<strong>in</strong>e step<br />
addition <strong>of</strong> stock solution (Merck, 1000 mg <strong>NO2</strong>/l) on three different effluent matrices. The<br />
result<strong>in</strong>g 30 calibration samples were measured with the flow <strong>in</strong>jection <strong>analysis</strong> method (FIA.<br />
ASIA, Ismatec AG, Glattbrugg, Switzerl<strong>and</strong>) <strong>and</strong> with the spectrometer probe. To get <strong>in</strong>formation<br />
about the precision <strong>of</strong> the sensor, each measurement was performed three times.<br />
RESULTS AND DISCUSSION<br />
Except for nitrite all data measured at WWTP Thunersee were needed for calibration. Therefore no<br />
validation with <strong>in</strong>dependent measurements was possible. For nitrite the calibration was made with<br />
the calibration samples described above <strong>and</strong> the data from the WWTP Thunersee were used for<br />
validation.
AutMoNet 2004 Rieger et al.<br />
Nitrite<br />
The precision <strong>of</strong> the spectrometer for nitrite was analysed with three repeated measurements <strong>of</strong> each<br />
<strong>of</strong> the 30 calibration samples. The mean st<strong>and</strong>ard deviation for nitrite was 0.03 mg N/l. For nitrate<br />
<strong>and</strong> <strong>TSS</strong> the st<strong>and</strong>ard deviation for each <strong>of</strong> the three matrices was calculated to 0.07 mg N/l for<br />
nitrate <strong>and</strong> 1.12 mg/l for <strong>TSS</strong> respectively. The data show no dependency between st<strong>and</strong>ard<br />
deviation <strong>and</strong> concentration (ISO 8466-1, 1990).<br />
Figure 4 shows a very good correspondence between lab <strong>and</strong> sensor values. Of course the values<br />
over 3 mg/l have a strong <strong>in</strong>fluence on the correlation, but without the three data po<strong>in</strong>ts the<br />
correlation coefficient is still good with R 2 = 0.977 <strong>in</strong>stead <strong>of</strong> 0.993. The width <strong>of</strong> the 95%<br />
confidence <strong>in</strong>terval for the calibration curve is very narrow with 0.026 mg/l at the mean value <strong>of</strong><br />
0.94 mg N/l. The <strong>in</strong>terval conta<strong>in</strong>s all possible calibration curves with a probability <strong>of</strong> 95%. This<br />
means that the precision is very accurate <strong>and</strong> the l<strong>in</strong>ear regression fits well with the data. The 95%<br />
prediction <strong>in</strong>terval (also known as 95% confidence <strong>in</strong>terval <strong>of</strong> a predicted value, Draper <strong>and</strong> Smith,<br />
1981) is 0.14 mg N/l at the mean lab value. A future value should be <strong>in</strong> this <strong>in</strong>terval with a<br />
probability <strong>of</strong> 95%.<br />
s::<strong>can</strong> NO 2-Neq [mg/l]<br />
3.5<br />
3<br />
2.5<br />
2<br />
1.5<br />
1<br />
0.5<br />
0<br />
<strong>NO2</strong>-N st<strong>and</strong>ard addition at EAWAG lab<br />
95% prediction <strong>in</strong>terval<br />
95% confidence <strong>in</strong>terval (calibration function)<br />
R 2 = 0.993<br />
0 0.5 1 1.5 2 2.5 3 3.5<br />
EAWAG laboratory <strong>NO2</strong>-N [mg/l]<br />
Figure 4: Calibration data for nitrite based on<br />
st<strong>and</strong>ard addition samples with 95%-confidence<br />
<strong>in</strong>terval <strong>of</strong> the calibration function <strong>and</strong> 95%<br />
prediction <strong>in</strong>terval (width = 0.14 mg/l at mean lab<br />
value <strong>of</strong> 0.94 mg <strong>NO2</strong>-N/l).<br />
s::<strong>can</strong> NO 2-Neq [mg/l]<br />
0.5<br />
0.4<br />
0.3<br />
0.2<br />
0.1<br />
0<br />
<strong>NO2</strong>-N WWTP Thunersee<br />
Mean lab value<br />
95% prediction <strong>in</strong>terval<br />
Calibration data<br />
0 0.1 0.2 0.3 0.4 0.5<br />
WWTP laboratory <strong>NO2</strong>-N [mg/l]<br />
Figure 5: Validation data for nitrite based on WWTP<br />
effluent samples with 95% prediction <strong>in</strong>terval (width<br />
= 0.2 mg/l at mean lab value <strong>of</strong> 0.15 mg <strong>NO2</strong>-N/l<br />
In Figure 5 a validation is presented based on measurements <strong>in</strong> the effluent <strong>of</strong> the WWTP<br />
Thunersee. The work<strong>in</strong>g range is very small hence no accurate regression could be calculated.<br />
Therefore only the 95% prediction <strong>in</strong>terval is shown based on an ideal calibration (normally the<br />
prediction <strong>in</strong>terval is based on a previous regression <strong>analysis</strong>). For the calibration <strong>of</strong> nitrite five<br />
wavelengths (from 230 to 240 nm) were chosen by means <strong>of</strong> PLS regression described above. The<br />
criteria which calibration fits best is a compromise between longterm stability, trueness <strong>and</strong><br />
precision. Great emphasis was placed on a robust calibration, therefore a low number <strong>of</strong> wavelength<br />
was chosen <strong>in</strong> order to desensitise the model.<br />
Nitrate<br />
Nitrate was calibrated us<strong>in</strong>g 49 comparative measurements (Figure 6). S<strong>in</strong>ce all data were used for<br />
calibration only the precision is stated as a 95% prediction <strong>in</strong>terval. The width <strong>of</strong> the <strong>in</strong>terval is<br />
0.54 mg N/l at the mean laboratory value <strong>of</strong> 6.7 mg N/l. The correlation coefficient is strongly<br />
depend<strong>in</strong>g on the value at 17 mg N/l, but without this value the coefficient is still at 0.942 (<strong>in</strong>stead<br />
33
Session 1 AutMoNet 2004<br />
<strong>of</strong> 0.978). Also for nitrate five wavelengths (from 230 to 240 nm) gave good longterm stability <strong>and</strong><br />
accuracy.<br />
Soluble <strong>COD</strong><br />
For the calibration <strong>of</strong> soluble <strong>COD</strong> only 12 measurements are available <strong>in</strong> the range between 17.4<br />
<strong>and</strong> 21.4 mg <strong>COD</strong>/l (Figure 7). Therefore a statement about the precision for future measurements<br />
<strong>in</strong> a wider range means an extrapolation <strong>and</strong> is therefore not very accurate. Nevertheless for the<br />
covered work<strong>in</strong>g range the precision is very good with a 95% prediction <strong>in</strong>terval <strong>of</strong> 0.93 mg <strong>COD</strong>/l<br />
at the mean laboratory value <strong>of</strong> 19.3 mg <strong>COD</strong>/l. Five wavelengths (from 250 to 340 nm) were<br />
selected by the calibration algorithm as the optimal number <strong>of</strong> wavelengths for the correlation to the<br />
reference measurements.<br />
s::<strong>can</strong> NO 3-Neq [mg/l]<br />
34<br />
17.5<br />
15<br />
12.5<br />
10<br />
7.5<br />
5<br />
2.5<br />
<strong>NO3</strong>-N<br />
95% prediction <strong>in</strong>terval<br />
Mean lab value<br />
R 2 = 0.978<br />
2.5 5 7.5 10 12.5 15 17.5<br />
Laboratory <strong>NO3</strong>-N [mg/l]<br />
Figure 6: Calibration data for nitrate based on<br />
WWTP effluent samples with 95% prediction<br />
<strong>in</strong>terval (width = 0.54 mg/l at mean lab value <strong>of</strong> 6.7<br />
mg <strong>NO3</strong>-N/l)<br />
s::<strong>can</strong> soluble <strong>COD</strong>eq [mg/l]<br />
22.5<br />
21<br />
19.5<br />
18<br />
16.5<br />
15<br />
<strong>COD</strong><br />
Mean lab value<br />
95% prediction <strong>in</strong>terval<br />
R 2 = 0.905<br />
15 16.5 18 19.5 21 22.5<br />
Laboratory soluble <strong>COD</strong> [mg/l]<br />
Figure 7: Calibration data for soluble <strong>COD</strong> based on<br />
WWTP effluent samples with 95% prediction<br />
<strong>in</strong>terval (width = 0.93 mg/l at mean lab value <strong>of</strong> 19.3<br />
mg <strong>COD</strong>/l)<br />
<strong>DOC</strong><br />
The <strong>DOC</strong> calibration resulted <strong>in</strong> the use <strong>of</strong> six wavelengths (from 290 to 330 nm). The calibration<br />
seems to be less accurate than for soluble <strong>COD</strong>, but the work<strong>in</strong>g range covered with measurements<br />
is still very small <strong>and</strong> the amount <strong>of</strong> comparative measurements is also limited to 12. The used<br />
Dr.Lange test kits (<strong>DOC</strong>: LCK383; <strong>COD</strong>: LCK414) should be more accurate for the <strong>COD</strong> s<strong>in</strong>ce for<br />
the <strong>DOC</strong> test the analytical steps are more sophisticated. The test kits are specified from Dr.Lange<br />
(under st<strong>and</strong>ard conditions accord<strong>in</strong>g to DIN 38402-A51) for a guaranteed precision stated as<br />
coefficient <strong>of</strong> variation <strong>of</strong> 5% for <strong>DOC</strong> <strong>and</strong> 3% for <strong>COD</strong> respectively. Of course this does not<br />
expla<strong>in</strong> the measured differences. Perhaps the method is not sensitive enough to the chang<strong>in</strong>g<br />
matrix. Future evaluations should be performed us<strong>in</strong>g st<strong>and</strong>ard methods with a thermal digestion.<br />
Us<strong>in</strong>g the lab measurements <strong>and</strong> the calibration described above the 95% prediction <strong>in</strong>terval<br />
amounts to 9.1 mg <strong>DOC</strong>/l at the mean laboratory value <strong>of</strong> 9.7 mg/l. Regard<strong>in</strong>g Swiss effluent limits<br />
<strong>of</strong> 10 mg <strong>DOC</strong>/l (>2000 PE) the accuracy is not suitable to monitor the effluent quality.<br />
<strong>TSS</strong><br />
For the <strong>TSS</strong> calibration 44 comparative measurements were used (<strong>in</strong>clud<strong>in</strong>g the measurements <strong>in</strong><br />
the EAWAG lab). The number <strong>of</strong> chosen wavelengths for calibration amounts to 7 (from 230 to<br />
330 nm nm). The precision <strong>of</strong> 5.5 mg <strong>TSS</strong>/l (95% prediction <strong>in</strong>terval at mean laboratory value <strong>of</strong><br />
13.5 mg/l) is not very accurate regard<strong>in</strong>g Swiss effluent limits <strong>of</strong> 15 mg <strong>TSS</strong>/l (>10’000 PE). The
AutMoNet 2004 Rieger et al.<br />
reason for the unsatisfy<strong>in</strong>g result is that the used spectrometer probe only measure <strong>in</strong> the<br />
wavelength region between 210 <strong>and</strong> 400 nm. Good results for <strong>TSS</strong> <strong>can</strong> only be obta<strong>in</strong>ed by us<strong>in</strong>g an<br />
UV/VIS spectrometer due to the fact that the wavelength range <strong>of</strong> the visible light has the highest<br />
correlation for <strong>TSS</strong> as for turbidity.<br />
s::<strong>can</strong> <strong>DOC</strong>eq [mg/l]<br />
17.5<br />
15<br />
12.5<br />
10<br />
7.5<br />
5<br />
2.5<br />
<strong>DOC</strong><br />
Mean lab value<br />
95% prediction <strong>in</strong>terval<br />
R 2 = 0.382<br />
2.5 5 7.5 10 12.5 15 17.5<br />
Laboratory <strong>DOC</strong> [mg/l]<br />
Figure 8: Calibration data for <strong>DOC</strong> based on WWTP<br />
effluent samples with 95% prediction <strong>in</strong>terval (width<br />
= 9.1 mg/l at mean lab value <strong>of</strong> 9.7 mg <strong>DOC</strong>/l)<br />
s::<strong>can</strong> <strong>TSS</strong>eq [mg/l]<br />
25<br />
22.5<br />
20<br />
17.5<br />
15<br />
12.5<br />
10<br />
7.5<br />
5<br />
2.5<br />
0<br />
<strong>TSS</strong><br />
95% prediction <strong>in</strong>terval<br />
Mittelw ert<br />
R 2 = 0.848<br />
0 2.5 5 7.5 10 12.5 15 17.5 20 22.5 25<br />
Laboratory <strong>TSS</strong> [mg/l]<br />
Figure 9: Calibration data for <strong>TSS</strong> based on WWTP<br />
effluent samples with 95% prediction <strong>in</strong>terval (width<br />
= 5.5 mg/l at mean lab value <strong>of</strong> 13.5 mg <strong>TSS</strong>/l)<br />
Comparison with s<strong>in</strong>gle-wavelength calibrations<br />
Table 1 compares the correlation coefficients R² for s<strong>in</strong>gle-wavelength calibrations <strong>and</strong> the<br />
calibrations with the multivariate calibration algorithm. For s<strong>in</strong>gle-wavelength calibrations the<br />
wavelength with the maximum correlation coefficient is shown. The same wavelength regions as<br />
for the multivariate calibration (230 to 390 nm) <strong>and</strong> the same number <strong>of</strong> reference data as described<br />
above were used. It <strong>can</strong> be clearly shown that no dist<strong>in</strong>ction between the substances was possible<br />
us<strong>in</strong>g only one wavelength. Us<strong>in</strong>g the multivariate calibration algorithm based on PLS regression<br />
accurate calibration <strong>can</strong> be achieved for nitrite, nitrate, <strong>and</strong> soluble <strong>COD</strong>.<br />
Table 1. Comparison <strong>of</strong> the correlation coefficients R² for s<strong>in</strong>gle-wavelength calibrations (the number <strong>in</strong> the<br />
brackets give the optimal wavelength <strong>in</strong> nm) <strong>and</strong> the calibrations with the multivariate calibration algorithm.<br />
Nitrite Nitrate Soluble <strong>COD</strong> <strong>DOC</strong> <strong>TSS</strong><br />
S<strong>in</strong>gle-wavelength calibration 0.139 (230) 0.320 (230) 0.316 (230) 0.183 (234) 0.326 (378)<br />
Multivariate calibration algorithm 0.993 0.978 0.905 0.382 0.848<br />
CONCLUSION<br />
The tested spectrometer probe was applied <strong>in</strong> the effluent <strong>of</strong> the WWTP Thunersee (CH). Except<br />
for nitrite all data were used for calibration, a validation is not available <strong>and</strong> should be carried out <strong>in</strong><br />
the future. For nitrite the work<strong>in</strong>g range covered with measurements was so small, that an addition<br />
<strong>of</strong> nitrite stock solution to three different matrices was carried out <strong>in</strong> the EAWAG laboratory. These<br />
data were used for the sensor calibration. Good results were achieved for the precision <strong>of</strong> nitrite <strong>and</strong><br />
nitrate. A differentiation between nitrite <strong>and</strong> nitrate <strong>in</strong> the WWTP effluent is only possible, if the<br />
<strong>TSS</strong> concentration does not <strong>in</strong>terfere the measurement <strong>of</strong> nitrate <strong>and</strong> nitrite. The measurements at<br />
WWTP Thunersee do not show limitations up to a <strong>TSS</strong> concentration <strong>of</strong> 20.5 mg <strong>TSS</strong>/l, which is<br />
higher than the manufacturer specification <strong>of</strong> 15 mg <strong>TSS</strong>/l. Future evaluations should be made, up<br />
to which <strong>TSS</strong> concentration the <strong>in</strong>terferences are neglectible.<br />
35
Session 1 AutMoNet 2004<br />
The results for soluble <strong>COD</strong> only cover a work<strong>in</strong>g range between 17.4 <strong>and</strong> 21.4 mg <strong>COD</strong>/l, but the<br />
precision is with less than 1 mg/l (95% prediction <strong>in</strong>terval at 19 mg/l) very promis<strong>in</strong>g. Future tests<br />
have to confirm these results for a broader measur<strong>in</strong>g range.<br />
The achieved precision for <strong>DOC</strong> is worse than for soluble <strong>COD</strong> <strong>and</strong> does not fulfil the requirements<br />
regard<strong>in</strong>g Swiss effluent limits. It should be tested, if a calibration with data us<strong>in</strong>g a st<strong>and</strong>ard<br />
method <strong>in</strong>stead <strong>of</strong> the test kits <strong>and</strong> more <strong>and</strong> better spreaded data will lead to a higher precision.<br />
The <strong>TSS</strong> calibration fails, s<strong>in</strong>ce the used spectrometric probe is only capable <strong>of</strong> measur<strong>in</strong>g the UV<br />
wavelength range between 210 <strong>and</strong> 400 nm. To obta<strong>in</strong> good calibration results also for <strong>TSS</strong> the<br />
evaluation <strong>of</strong> the wavelength range <strong>of</strong> the visible light (up to 750 nm) <strong>and</strong> therefore the use <strong>of</strong> a<br />
UV/VIS spectrometer would be required.<br />
To sum up the used UV spectrometer gave promis<strong>in</strong>g results, which have to be confirmed with<br />
validation data. A better calibration without extrapolation is needed to guarantee accurate<br />
measurements <strong>in</strong> the complete measur<strong>in</strong>g range. For limited work<strong>in</strong>g ranges a calibration procedure<br />
with calibration samples made from different matrices was <strong>in</strong>troduced <strong>and</strong> amounts <strong>in</strong> very good<br />
results for the precision. This method is only suitable for s<strong>in</strong>gle substances like nitrite or nitrate. For<br />
lump parameters like <strong>COD</strong> or <strong>DOC</strong> a dilution experiment is needed s<strong>in</strong>ce no representative stock<br />
solution is available. This implies high concentrations <strong>in</strong> order to cover a wide work<strong>in</strong>g range.<br />
It was shown that the calibration results <strong>can</strong> not simply be applied on other locations <strong>and</strong> matrices<br />
without specific calibration. S<strong>in</strong>ce the measur<strong>in</strong>g method is always only a correlation between<br />
absorbance <strong>and</strong> concentration <strong>and</strong> not a direct measurement a regular monitor<strong>in</strong>g <strong>of</strong> the<br />
measurements has to be considered. The effort for the specific calibration was rather high. In order<br />
to get a ‘global calibration’, which <strong>can</strong> be adapted e.g. with a simple two-po<strong>in</strong>t calibration the<br />
results have to be validated at different plants.<br />
ACKNOWLEDGMENTS<br />
The authors would like to thank the staff <strong>of</strong> WWTP Thunersee especially A. Baumann <strong>and</strong> G. Eugster for<br />
their generous support.<br />
REFERENCES<br />
DIN 38 402-51 (1986). Deutsche E<strong>in</strong>heitsverfahren zur Wasser-, Abwasser und Schlammuntersuchung. Allgeme<strong>in</strong>e<br />
Angaben (Gruppe A). Kalibrierung von Analysenverfahren, Auswertung von Analysenergebnissen und l<strong>in</strong>eare<br />
Kalibrierfunktionen für die Bestimmung von Verfahrenskenngrössen (A51). Normenausschuss Wasserwesen (NAW)<br />
im DIN Deutsches Institut für Normung e.V., Beuth Verlag GmbH, Berl<strong>in</strong> [<strong>in</strong> German].<br />
Draper N.R. <strong>and</strong> Smith H. (1981). Applied regression <strong>analysis</strong>. 2nd edn., Wiley, New York.<br />
Gujer W. (1999). Siedlungswasserwirtschaft. Spr<strong>in</strong>ger-Verlag Berl<strong>in</strong>, Heidelberg, New York [<strong>in</strong> German].<br />
ISO 8466-1 (1990). Water quality – Calibration <strong>and</strong> evaluation <strong>of</strong> analytical methods <strong>and</strong> estimation <strong>of</strong> performance<br />
characteristics. Part 1: Statistical evaluation <strong>of</strong> the l<strong>in</strong>ear calibration function. ISO, Geneve, Switzerl<strong>and</strong>.<br />
Langergraber, G., Fleischmann, N., H<strong>of</strong>staedter, F. (2003). A multivariate calibration procedure for UV/VIS<br />
spectrometric quantification <strong>of</strong> organic matter <strong>and</strong> nitrate <strong>in</strong> wastewater. Wat.Sci.Tech. 47(2), 63-71.<br />
Otto M. (1999): Chemometrics: Statistics <strong>and</strong> Computer Application <strong>in</strong> Analytical Chemistry; Wiley-VCH Verlag<br />
GmbH, We<strong>in</strong>heim, Germany.<br />
W<strong>in</strong>kler S., Rieger L., Thomann M., Siegrist H., Bornemann C. <strong>and</strong> Fleischmann N. (2002). In-l<strong>in</strong>e monitor<strong>in</strong>g <strong>of</strong> <strong>COD</strong><br />
<strong>and</strong> <strong>COD</strong>-fractionation: Improv<strong>in</strong>g dynamic simulation data quality. In: IWA (ed.): Proceed<strong>in</strong>gs <strong>of</strong> the 3rd IWA<br />
International World Water Congress, April 7-12, 2002, Melbourne, Australia (paper No. e21604a).<br />
36