Vet Therapeutics MASTERPAGE - VetLearn.com
Vet Therapeutics MASTERPAGE - VetLearn.com
Vet Therapeutics MASTERPAGE - VetLearn.com

Create successful ePaper yourself
Turn your PDF publications into a flip-book with our unique Google optimized e-Paper software.
<strong>Vet</strong>erinary <strong>Therapeutics</strong> • Vol. 6, No. 2, Summer 2005<br />
Comparative Efficacy of Tulathromycin versus<br />
Florfenicol and Tilmicosin against Undifferentiated<br />
Bovine Respiratory Disease in Feedlot Cattle*<br />
Terry L. Skogerboe, DVM, MBA Daniel J. Weigel, PhD<br />
Kathleen A. Rooney, MS, DVM Kimberly Gajewski, MS<br />
Robert G. Nutsch, DVM, MS, MBA W. Randal Kilgore, DVM<br />
Pfizer Animal Health<br />
<strong>Vet</strong>erinary Medicine Research and Development<br />
7000 Portage Road<br />
Kalamazoo, MI 49001<br />
■ INTRODUCTION<br />
Bovine respiratory disease (BRD) is reported<br />
to be the most prevalent disease responsible for<br />
morbidity and mortality in feedlots. Beef in-<br />
*This work was sponsored by Pfizer.<br />
180<br />
CLINICAL RELEVANCE<br />
Four studies conducted at feedlots in Greeley and Wellington, Colorado; Nebraska;<br />
and Texas <strong>com</strong>pared the efficacy of tulathromycin to florfenicol or tilmicosin<br />
for the treatment of cattle with undifferentiated bovine respiratory disease (BRD)<br />
and subsequent feedlot performance and carcass characteristics. In each study,<br />
100 calves with BRD were treated with tulathromycin given SC at 2.5 mg/kg body<br />
weight. At the Greeley, CO, and Nebraska study locations, 100 calves were treated<br />
with florfenicol given SC at 40 mg/kg body weight, and at the Wellington, CO,<br />
and Texas study locations, tilmicosin was given SC at 10 mg/kg body weight.<br />
Cure rate, a derived variable that included assessments of mortality, rectal temperature,<br />
and attitude and respiratory scores from day 3 to day 28 and day 3<br />
through harvest, was the primary assessment of BRD efficacy. Cure rates of<br />
calves treated with tulathromycin were significantly (P ≤ .009) higher than those<br />
calves treated with florfenicol. At Wellington, CO, the cure rate of calves treated<br />
with tulathromycin was significantly higher (P ≤ .018) <strong>com</strong>pared with tilmicosintreated<br />
calves. The differences in cure rates between tulathromycin and tilmicosin<br />
treatment groups in the Texas study were not significantly different (P > .05). Tulathromycin<br />
was more efficacious in the treatment of undifferentiated BRD <strong>com</strong>pared<br />
with florfenicol and, in one study, <strong>com</strong>pared with tilmicosin.<br />
dustry feedlot practices, such as transport,<br />
<strong>com</strong>mingling, processing, diet change, and<br />
stocking density, create a high-stress environment<br />
for recently weaned cattle arriving at<br />
feedlots. These new arrivals are at an increased
T. L. Skogerboe, K. A. Rooney, R. G. Nutsch, D. J. Weigel, K. Gajewski, and W. R. Kilgore<br />
risk of developing BRD, with morbidity peaks<br />
occurring within the first 3 weeks after arrival. 1<br />
Common pathogens associated with morbidity<br />
and mortality of BRD include Mannheimia<br />
haemolytica, Pasteurella multocida, Haemophilus<br />
somnus (Histophilus somni), and Mycoplasma<br />
spp, with M. haemolytica considered to<br />
be the primary bacterial pathogen. 2,3 Preconditioning<br />
programs, including vaccination and<br />
weaning management, may minimize the morbidity<br />
risk of BRD. 4 However, many factors,<br />
including ranchers’ efforts to decrease production<br />
costs, have not supported preconditioning<br />
programs as a standard operation within the<br />
industry. 5,6<br />
Tulathromycin is the first of a new class of<br />
macrolide antimicrobials that has been termed<br />
triamilides. Tulathromycin was synthesized and<br />
developed specifically for the treatment of<br />
bovine and swine respiratory disease. The<br />
pharmacokinetics of tulathromycin in cattle is<br />
well-characterized. 7 After subcutaneous admin-<br />
istration, tulathromycin is extensively distributed<br />
to lung tissue with a slow decline in drug<br />
concentration in the lung. The pharmacokinetic<br />
data of tulathromycin are consistent with<br />
a desired characteristic of extended retention of<br />
an antimicrobial, resulting in a prolonged period<br />
of antimicrobial exposure to bacterial<br />
pathogens associated with respiratory disease<br />
in cattle.<br />
In an earlier multistudy field efficacy program,<br />
tulathromycin provided superior clinical<br />
efficacy <strong>com</strong>pared with tilmicosin over a 14day<br />
study period. 8 The objectives of these studies<br />
were to <strong>com</strong>pare the efficacy of tulathromycin<br />
(Draxxin Injectable Solution,<br />
Pfizer Animal Health) with either florfenicol<br />
(Nuflor, Schering-Plough Animal Health) or<br />
tilmicosin (Micotil 300 Injection, Elanco Animal<br />
Health) injectable solutions for the treatment<br />
of undifferentiated BRD and the subsequent<br />
feedlot performance and carcass<br />
characteristics of the treated cattle. The primary<br />
assessment of BRD efficacy was cure rate,<br />
a derived variable of treatment success from<br />
day 3 through day 28 and day 3 through the final<br />
day of the study (harvest) that included assessments<br />
of mortality, rectal temperature, and<br />
attitude and respiratory scores. Husbandry and<br />
care of cattle in these studies were in accordance<br />
with the Guide for the Care and Use of<br />
Agricultural Animals in Agricultural Research<br />
and Teaching. 9<br />
■ MATERIALS AND METHODS<br />
Cattle<br />
Calves for these studies were purchased from<br />
auction markets and transported to four re-<br />
Tulathromycin is extensively distributed to lung<br />
tissue with a slow decline in drug concentration.<br />
search feedlots. Castrated male calves (n = 498,<br />
weighing 315–559 lb at enrollment) purchased<br />
from auction markets in Kansas, Minnesota,<br />
and North Dakota were transported to Adams<br />
Land & Cattle Co., Broken Bow, NE. Castrated<br />
male calves (n = 500, weighing 348–692 lb<br />
at enrollment) purchased from auction markets<br />
in Tennessee were transported to Farr<br />
Feeders, Greeley, CO. Castrated male calves (n<br />
= 774, weighing 414–745 lb at enrollment)<br />
purchased from auction markets in Colorado<br />
and Wyoming were transported to Horton<br />
Feedlot and Research Center, Wellington, CO.<br />
Heifer calves (n = 319, weighing 387–576 lb at<br />
enrollment) purchased from auction markets<br />
181
<strong>Vet</strong>erinary <strong>Therapeutics</strong> • Vol. 6, No. 2, Summer 2005<br />
TABLE 1. Treatment Decision Chart Used after Administration of Tulathromycin,<br />
Tilmicosin (NE, TX, and Wellington, CO), or Florfenicol (Greeley, CO)<br />
Treatment (NE, TX,<br />
Study Period Response and Wellington, CO) Treatment (Greeley, CO)<br />
Days 3 to 28 First time animal met Oxytetracycline, Danofloxacin, 6 mg/kg SC<br />
nonresponse criteria 20 mg/kg SC given twice at a 2-d interval<br />
Second time animal met Enrofloxacin, Oxytetracycline,<br />
nonresponse criteria 11 mg/kg SC 20 mg/kg SC<br />
Third time animal met<br />
nonresponse criteria<br />
Removed as chronic Removed as chronic<br />
Day 29 to First time animal met Oxytetracycline, Danofloxacin, 6 mg/kg SC<br />
harvesta nonresponse criteria 20 mg/kg SC given twice at a 2-d interval<br />
Second time animal met Enrofloxacin, Oxytetracycline,<br />
nonresponse criteria 11 mg/kg SC 20 mg/kg SC<br />
Third time animal met<br />
nonresponse criteria<br />
Removed as chronic Removed as chronic<br />
a See Table 2 for harvest days.<br />
in Arkansas and Oklahoma were transported<br />
to Agri Research Center, Canyon, TX. After<br />
arrival, the calves were processed, held in feedlot<br />
pens, and observed daily until enrollment.<br />
Pre-enrollment processing was typical for<br />
<strong>com</strong>mercial feedlot practices and included vaccination<br />
with viral and bacterin antigens and<br />
treatment for internal and external parasites<br />
(Greeley, CO: Bovi-Shield IBR-BVD and Dectomax<br />
Injectable, Pfizer Animal Health;<br />
Nebraska: Dectomax Pour-On, Ultrabac7, and<br />
Bovi-Shield 4, Pfizer Animal Health; Wellington,<br />
CO: Dectomax Injectable, Bovi-Shield 4,<br />
and Durasect II, Pfizer Animal Health; and<br />
Texas: Dectomax Injectable, Ultrabac7, and<br />
Bovi-Shield 4). At each site hormonal implants<br />
were also injected (Greeley, CO: ComponentE-S,<br />
Ivy Animal Health, Overland Park,<br />
KS; Nebraska: Ralgro, Schering, Canada;<br />
Wellington, CO: Synovex S, Fort Dodge Animal<br />
Health; and Texas: ComponentE-H, Ivy<br />
Animal Health). No antimicrobials were ad-<br />
182<br />
ministered during processing. Ear tags were<br />
used for individual animal identification. After<br />
processing, calves were observed daily until<br />
enrollment.<br />
Animal Selection, Clinical Assessments,<br />
and Treatments<br />
Selection, enrollment, and initiation of<br />
treatments occurred on day 0 at each site. At<br />
each of the four sites, 200 calves were randomly<br />
assigned to pen(s), blocks, and treatments<br />
(100 calves/treatment group).<br />
Calves that met the enrollment criteria of a<br />
clinical attitude score (CAS) of 1, 2, or 3 and<br />
pyrexia (rectal temperature ≥104.0˚F) were selected<br />
by the investigators and randomly assigned<br />
to receive one of two treatments at each<br />
location according to a randomized <strong>com</strong>plete<br />
block design, with calves blocked by order of<br />
enrollment and enrollment <strong>com</strong>pleted over 2<br />
to 7 consecutive days across all four locations.<br />
Each block contained one calf from each treat-
T. L. Skogerboe, K. A. Rooney, R. G. Nutsch, D. J. Weigel, K. Gajewski, and W. R. Kilgore<br />
TABLE 2. Comparative Efficacy of Tulathromycin versus Florfenicol and Tilmicosin for<br />
the Treatment of Cattle with BRD<br />
Location Study Period No. (%) of Cattle a P value b<br />
Greeley, COc Tulathromycin Florfenicol<br />
Cures Days 3–28 82 (82.0%) 64 (64.0%) .002<br />
Day 3–harvest 77 (79.4%) 63 (63.6%) .009<br />
Chronics and mortalitiesd Days 3–28 3 (3.0%) 9 (9.0%) .058<br />
Day 3–harvest 4 (4.1%) 10 (10.1%) .058<br />
Nebraskae Tulathromycin Florfenicol<br />
Cures Day 3–28 73 (73.7%) 30 (30.3%) .001<br />
Day 3–harvest 50 (53.2%) 23 (23.2%) .001<br />
Chronics and mortalitiesd Days 3–28 5 (5.1%) 26 (26.3%) .001<br />
Day 3–harvest 19 (20.2%) 47 (47.5%) .001<br />
Wellington, COf Tulathromycin Tilmicosin<br />
Cures Days 3–28 84 (85.7%) 63 (64.3%) .002<br />
Day 3–harvest 76 (77.6%) 57 (60.6%) .018<br />
Chronics and mortalitiesd Days 3–28 0 (0.0%) 6 (6.1%) .025<br />
Day 3–harvest 0 (0.0%) 7 (7.5%) .014<br />
Texasg Tulathromycin Tilmicosin<br />
Cures Days 3–28 78 (78%) 69 (69%) .160<br />
Day 3–harvest 73 (73%) 67 (67%) .355<br />
Chronics and mortalitiesd Days 3–28 2 (2.0%) 4 (4.0%) .414<br />
Day 3–harvest 2 (2.0%) 5 (5.0%) .257<br />
a % = n / No. of cattle (n = 100) in the treatment group at the start of the time period – No. of cattle removed for non-<br />
BRD reasons × 100.<br />
bWithin a row, P values are provided for contrasts between treatments by study location.<br />
cInitiation, March 2003; harvest, day 173, 174, or 175.<br />
dBRD-associated mortalities.<br />
eInitiation, October 2001; harvest, day 316 or 317.<br />
f Initiation, October 2001; harvest, day 224, 225, 226, 227, 228, 229, or 230.<br />
g Initiation, September 2001; harvest, day 257, 258, or 259.<br />
ment group and was filled in 1 day. The criteria<br />
for assigning CASs were:<br />
0 = Normal; bright, alert, and responsive<br />
1 = Mild depression<br />
2 = Moderate to marked depression; may be<br />
reluctant to stand<br />
3 = Severe depression; unable to stand without<br />
assistance<br />
4 = Moribund; unable to rise<br />
At each of the four study locations, tulathromycin<br />
was given SC at 2.5 mg/kg body<br />
weight (1.1 ml/100 lb). At Greeley, CO, and<br />
Nebraska, florfenicol was given SC at 40.0<br />
mg/kg body weight (6 ml/100 lb). At Wellington,<br />
CO, and Texas, tilmicosin was given SC at<br />
10.0 mg/kg body weight (1.5 ml/100 lb).<br />
Treatments were given once on the lateral side<br />
of the neck with a maximum volume of 10 ml/<br />
183
<strong>Vet</strong>erinary <strong>Therapeutics</strong> • Vol. 6, No. 2, Summer 2005<br />
TABLE 3. Frequency Distribution of Treatment Cures, Treatment Failures, and Non-BRD<br />
Removals from Day 3 through Harvest a<br />
Treatment<br />
Treatment Failures b<br />
Group First Second Third Fourth BRD Non-BRD<br />
(n = 100/group) Cure Nonresponse Nonresponse Nonresponse Nonresponse Chronicsc Mortalities Removals<br />
Greeley, CO<br />
Tulathromycin 77 12 3 1 0 3 1 3<br />
Florfenicol 63 19 6 1 0 10 0 1<br />
P value .009<br />
Nebraska<br />
Tulathromycin 50 7 12 4 2 18 1 6<br />
Florfenicol 23 11 11 4 3 42 5 1<br />
P value .001<br />
Wellington, CO<br />
Tulathromycin 76 17 3 2 0 0 0 2<br />
Tilmicosin 57 20 9 1 0 4 3 6<br />
P value .018<br />
Texas<br />
Tulathromycin 73 20 5 0 0 2 0 0<br />
Tilmicosin 67 11 13 4 0 4 1 0<br />
P value .355<br />
aSee Table 2 for harvest days.<br />
bNonresponse frequency categories represent the number of times calves were BRD nonresponders. Nonresponse<br />
criteria for days 3–28 was: (1) a CAS of 1 or 2 and a rectal temperature ≥104.0˚F or (2) a CAS of 3 or 4. Nonresponse<br />
criterion after day 28 was a CAS of 1, 2, 3, or 4.<br />
cDepending on the study period (days 3–28 or after day 28), a calf was a chronic nonresponder the third, fourth, or fifth<br />
time it met the nonresponse criteria.<br />
injection site. Personnel not responsible for<br />
any other clinical assessments administered<br />
treatments during the course of the study.<br />
Clinical observations for adverse events were<br />
made before treatment and approximately 0.5<br />
to 5 hours after treatment.<br />
Except for the calves in the Greeley, CO,<br />
study, a randomly preselected set of cattle in<br />
each study (20 calves from each treatment<br />
group) had nasopharyngeal swab samples collected<br />
for bacterial culture and identification<br />
before treatment. Bacterial identification was<br />
performed by Colorado Animal Research Enterprise,<br />
Fort Collins, CO.<br />
184<br />
Body Weights<br />
Body weights for individual cattle were obtained<br />
in each study on the day of treatment<br />
(day 0), when a calf required additional treatment,<br />
when a calf was removed from the study,<br />
on day 28, at reimplanting and revaccination<br />
(on day 97, 98, or 99 in Greeley, CO [Component<br />
TE-S, Ivy Animal Health, and Bovi-<br />
Shield IBR]; day 139 or 140 in Nebraska [Synovex<br />
Plus and Pyramid IBR, Fort Dodge<br />
Animal Health]; day 75 in Wellington, CO<br />
[Bovi-Shield IBR and Revalor-IS, Intervet];<br />
and day 82, 83, or 84 in Texas [Component T-<br />
H, Ivy Animal Health, and Frontier III, Inter-
T. L. Skogerboe, K. A. Rooney, R. G. Nutsch, D. J. Weigel, K. Gajewski, and W. R. Kilgore<br />
vet]), and before shipment to packing plants<br />
(on day 173, 174, or 175 in Greeley, CO; day<br />
316 or 317 in Nebraska; approximately day<br />
227 in Wellington, CO; and day 257, 258, or<br />
259 in Texas).<br />
Clinical Assessments and<br />
Nonresponse BRD Treatments<br />
Clinical assessments of response to initial<br />
BRD treatments began 3 days after dose administration.<br />
From day 3 through day 28, CAS<br />
was assessed daily for each calf. Any calf assigned<br />
a score of 1 or 2 was removed from<br />
study pens to allow measurement of its rectal<br />
temperature. The nonresponse criteria for days<br />
3 through 28 were (1) a CAS of 1 or 2 plus a<br />
rectal temperature of ≥104.0˚F or (2) a CAS of<br />
3 or 4. From day 29 to the day of harvest<br />
(slaughter), cattle were observed according to<br />
standard feedlot practice; those with clinical<br />
signs of BRD (a CAS of 1, 2, 3, or 4 regardless<br />
of rectal temperature) met the nonresponse<br />
criteria.<br />
After the initial treatment for BRD, a treatment<br />
decision chart was used at each study location<br />
(Table 1). At three locations (Wellington,<br />
CO, Nebraska, and Texas), cattle fulfilling<br />
nonresponse criteria for the first time were retreated<br />
with oxytetracycline (Liquamycin LA-<br />
200, Pfizer Animal Health) given SC at 20<br />
mg/kg body weight (4.5 ml/100 lb). Calves fulfilling<br />
nonresponse criteria a second time were<br />
treated with enrofloxacin (Baytril 100, Bayer<br />
Animal Health) given SC at 11 mg/kg body<br />
weight (5 ml/100 lb). At the Greeley, CO, location,<br />
cattle fulfilling nonresponse criteria for<br />
the first time were retreated with danofloxacin<br />
(A180, Pfizer Animal Health) given SC at 6<br />
mg/kg body weight (1.5 ml/100 lb) and repeated<br />
approximately 48 hours later. Cattle fulfilling<br />
the nonresponse criteria the second time<br />
were treated with oxytetracycline given SC at<br />
20 mg/kg body weight (4.5 ml/100 lb).<br />
Except for allowing a minimum of 2 days after<br />
<strong>com</strong>pleting the danofloxacin dose regimen,<br />
cattle were allowed approximately 3 days following<br />
each retreatment before their clinical<br />
status was reassessed. At each study location,<br />
treatment regimens were reinitiated on day 29,<br />
allowing cattle that met the nonresponse criteria<br />
after study day 28 to receive additional<br />
treatments before they were classified as chronics.<br />
All danofloxacin, enrofloxacin, and oxy-<br />
Cure rates were significantly higher for<br />
tulathromycin-treated cattle in three of the four studies.<br />
tetracycline injections were given SC on the<br />
lateral side of the neck with a maximum volume<br />
of 10 ml/injection site.<br />
Cattle that met the nonresponse criteria<br />
three times in the period from day 3 through<br />
day 28 or three times between day 29 and harvest<br />
were classified as chronics and removed<br />
from the study. To determine cause of mortality,<br />
necropsies were performed on all cattle that<br />
died during the study.<br />
Precautions were taken to avoid any undue<br />
animal suffering during these studies. All applicable<br />
animal husbandry and animal welfare<br />
guidelines were followed. The investigator or<br />
a designee could re<strong>com</strong>mend euthanasia for<br />
humane reasons if the animal was moribund or<br />
if the clinical condition of the calf warranted<br />
euthanasia. Calves with severe clinical signs<br />
associated with BRD were classified as BRDrelated<br />
mortalities.<br />
All remaining cattle were shipped to harvest<br />
185
<strong>Vet</strong>erinary <strong>Therapeutics</strong> • Vol. 6, No. 2, Summer 2005<br />
TABLE 4. Cumulative Frequency of Antimicrobial Treatments a from Day 3 through Harvest<br />
No. of BRD<br />
Greeley, CO Nebraska Wellington, CO<br />
Treatment Regimensb Tulathromycin Florfenicol Tulathromycin Florfenicol Tulathromycin Tilmicosin<br />
1 12 19 8 13 17 22<br />
2 8 12 42 74 6 20<br />
3 12 30 18 36 6 15<br />
4 0 4 8 12 0 0<br />
5 0 0 20 50 0 0<br />
Total 32 65 96 185 29 57<br />
a BRD nonresponse treatments were oxytetracycline, enrofloxacin, or danofloxacin (see Table 1 for treatment decision<br />
chart by study location). Once a calf was declared a chronic, it was removed from the study and given standard feedlot<br />
therapy; such therapy is not included in this summary.<br />
b There were 100 cattle with BRD in each treatment group at each study location.<br />
on a single day. Carcass data were obtained on<br />
the day following shipment to the packing<br />
plant and included the following: hot carcass<br />
weight; yield grade; quality grade; kidney,<br />
pelvic, and heart (KPH) fat; fat (inches); and<br />
rib eye area.<br />
Housing<br />
Greeley, CO<br />
Cattle were housed in <strong>com</strong>mercial feedlot<br />
pens. For the first 28 days, the cattle were<br />
housed in 10 pens with 10 blocks of two calves/<br />
pen. From day 29 until harvest, all the cattle<br />
were housed in a single pen. Pen space throughout<br />
the study was approximately 200 sq ft/calf.<br />
The feed bunk was a concrete fence line bunk<br />
feeder, and the pens had dirt flooring.<br />
Nebraska<br />
Cattle were housed in a <strong>com</strong>mercial feedlot<br />
pen that was divided approximately in half by<br />
a fence and a gate into two pens; one measured<br />
199 × 215 ft and the other was 147 × 186 ft.<br />
Each pen had 50 blocks of two calves each.<br />
The feed bunk was a concrete fence line bunk<br />
feeder, and the pen had dirt flooring.<br />
186<br />
Wellington, CO<br />
Cattle were housed in 20 typical cattle finishing<br />
pens with each pen housing five blocks<br />
of two calves. Each pen was similar in design<br />
(20 × 80 ft) and condition with approximately<br />
16 inches/calf bunk space. Feed bunks were<br />
concrete fence line bunks with dividers between<br />
pens.<br />
Texas<br />
Cattle were initially housed in 20 outdoor,<br />
dirt-floor pens constructed of pipe and cable.<br />
Each pen housed five blocks of two calves each.<br />
Each pen was similar in design (18 × 52 ft) and<br />
condition and provided adequate space (approximately<br />
93.6 sq ft/calf). The pens contained 8foot<br />
long in-line concrete feed bunks extending<br />
the width of the pens, thus allowing the cattle<br />
21.6 inches of bunk space. Later, all cattle were<br />
<strong>com</strong>mingled into one large pen for approximately<br />
3 months; then, until harvest, the cattle<br />
were housed in four pens of equal size.<br />
Across all study locations, pen space ranged<br />
from 100 to 200 sq ft for each calf, and cattle<br />
were fed to appetite according to standard<br />
practice; fresh water was available ad libitum.
T. L. Skogerboe, K. A. Rooney, R. G. Nutsch, D. J. Weigel, K. Gajewski, and W. R. Kilgore<br />
Masking<br />
At each study<br />
Texas<br />
location, individuals<br />
Tulathromycin Tilmicosin who performed clin-<br />
20<br />
10<br />
11<br />
30<br />
ical observations and<br />
assigned CASs were<br />
unaware of treat-<br />
6 21 ment group assign-<br />
0 0 ment. The personnel<br />
0<br />
36<br />
0<br />
62<br />
who administered<br />
treatments were unmasked<br />
to assignment<br />
of individual<br />
cattle to treatment<br />
group. Individuals<br />
who determined carcass<br />
evaluations were<br />
masked to treatment assignments.<br />
Data Analysis<br />
Each calf was an experimental unit with the<br />
determination of efficacy being cure rate, a derived<br />
variable determined by CAS and BRD<br />
mortality or CAS, rectal temperature, and<br />
BRD mortality. Clinical cure percentage (cure<br />
rate) was defined as follows:<br />
(No. of animals <strong>com</strong>pleting<br />
the study not classified as<br />
nonresponders, not BRD-related<br />
mortalities, and not removed<br />
for reasons unrelated to BRD)<br />
100 ×<br />
(No. of animals enrolled –<br />
No. of animals removed for<br />
reasons unrelated to BRD)<br />
In each study, responses to treatment were<br />
categorized as a cure (responding to treatment),<br />
as a treatment failure (nonresponse indicated<br />
by requiring additional treatment, including<br />
BRD-related mortalities and removals/<br />
chronics), or as a non-BRD removal. Frequencies<br />
of cure/failure responses were analyzed using<br />
a Cochran-Mantel-Haenszel row mean<br />
score test with a separate analysis for days 3 to<br />
28 and for the overall study.<br />
The repeatedly measured response variable,<br />
body weight, was analyzed using a general linear<br />
mixed model. Appropriate contrasts between<br />
treatments were made at each day of<br />
study after requiring a significant treatment or<br />
treatment-by-day of study effect. Least squares<br />
means of average daily gains (ADGs) were estimated<br />
within PROC MIXED of SAS (SAS<br />
Version 6.12, SAS Institute, Cary, NC) using<br />
the appropriate estimate statements.<br />
Body weights obtained only on day 0, day<br />
28, day of reimplant, and before harvest were<br />
included in the repeated measures mixed model.<br />
Cattle that died or were removed from the<br />
study before day 28 had only day 0 body<br />
weights and could not be included in the<br />
analyses. Thus, any negative effects they may<br />
have contributed to the estimate of gain and<br />
ADG for that treatment group were not captured.<br />
Body weights were not available for cattle<br />
that died (mortalities) or were removed<br />
from the study (chronics) before the day of<br />
reimplanting or the day of harvest. The more<br />
times an animal was available to be weighed,<br />
the more that animal’s body weight contributed<br />
to the model’s estimate of weight gain.<br />
All quantitative carcass measures were analyzed<br />
using a general linear mixed model. Categoric<br />
responses for carcass variables were analyzed<br />
using the Cochran-Mantel-Haenszel row<br />
mean score statistic for tests of association. Continuous<br />
carcass response variables were analyzed<br />
using a general linear mixed model analysis.<br />
The 5% level of significance was used to assess<br />
statistical differences for all tests.<br />
■ RESULTS<br />
Greeley, CO<br />
The cure rate from day 3 through day 28 was<br />
significantly higher (P = .002) for calves that received<br />
tulathromycin (82 of 100; 82.0%) than<br />
187
<strong>Vet</strong>erinary <strong>Therapeutics</strong> • Vol. 6, No. 2, Summer 2005<br />
BRD Nonresponse (cumulative %)<br />
for calves that received florfenicol (64 of 100;<br />
64.0%) (Table 2). The cure rate from day 3<br />
through harvest was also significantly higher (P<br />
= .009) for calves that received tulathromycin<br />
(77 of 97; 79.4%) than for calves that received<br />
florfenicol (63 of 99; 63.6%). Chronic/mortality<br />
rates from day 3 through day 28 and from<br />
day 3 through harvest were not significantly<br />
lower (P = .058 for both) for calves that received<br />
tulathromycin (three of 100 [3.0%] and four of<br />
97 [4.1%], respectively) than for calves that received<br />
florfenicol (9 of 100 [9.0%] and 10 of 99<br />
[10.1%], respectively). Three tulathromycinand<br />
10 florfenicol-treated cattle were classified<br />
as chronics. After removal from the study, one of<br />
the tulathromycin-treated cattle died and two<br />
went on to harvest. Six of the florfenicol-treated<br />
cattle died and four went on to harvest.<br />
The frequency distribution of the treatment<br />
cures, treatment failures (BRD morbidities and<br />
mortalities), and non-BRD removals for the<br />
duration of the study (i.e., through harvest) is<br />
summarized in Table 3. The cumulative frequency<br />
of danofloxacin and oxytetracycline<br />
nonresponder treatments from day 3 through<br />
188<br />
40<br />
35<br />
30<br />
25<br />
20<br />
15<br />
10<br />
5<br />
0<br />
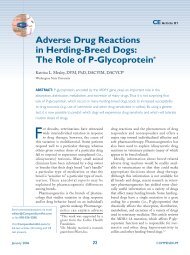
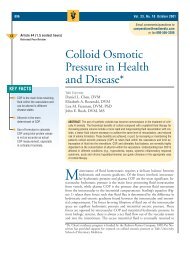
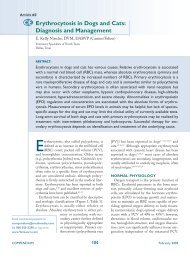
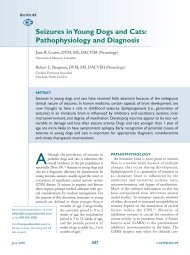
Cumulative Percentage of Nonresponse was Lower in Tulathromycin-Treated Cows<br />
Tulathromycin Florfenicol<br />
3 5 7 9 11 13 15 17 19 21 23 25 27 End a<br />
Day of Study<br />
Figure 1. Cumulative percentage of first-time BRD nonresponse from day 3 through end of study (Greeley, CO).<br />
a See Table 2 for harvest days (end of study).<br />
//<br />
harvest is presented in Table 4. The cumulative<br />
frequencies of first-time BRD nonresponders<br />
from day 3 through the end of the study are<br />
summarized in Figure 1.<br />
The ADG from day 0 through day 28 and<br />
from day 0 to day of harvest was not significantly<br />
different (P = .7152 and P = .1113, respectively)<br />
for calves that received tulathromycin<br />
(2.78 and 3.71 lb, respectively) than<br />
for calves that received florfenicol (2.72 and<br />
3.85 lb, respectively) (Table 5). The least<br />
squares means final live body weights (Table 5)<br />
and the hot carcass weights (Table 6) were not<br />
significantly different (P = .9240 and P =<br />
.7473, respectively). Except for a significantly<br />
greater (P = .0396) rib eye area in tulathromycin-treated<br />
cattle, differences in the other<br />
carcass variables (Table 6) were not significant.<br />
The descriptive statistics of ADG with chronics<br />
and deads included are summarized in Table 7.<br />
Nebraska<br />
The treatment cure rate from day 3 through<br />
day 28 was significantly higher (P = .001) for<br />
calves that received tulathromycin (73 of 99;
T. L. Skogerboe, K. A. Rooney, R. G. Nutsch, D. J. Weigel, K. Gajewski, and W. R. Kilgore<br />
TABLE 5. Repeated Measures Mixed Model Least Squares Means Estimates of Body<br />
Weight a and Average Daily Gain (ADG)<br />
Study Group Initial Body Weight (lb) Final Body Weight (lb) ADG (lb)<br />
Greeley, CO<br />
Tulathromycin 534 1,176 3.71<br />
Florfenicol 513 1,178 3.85<br />
P value b .0858 .9240 .1113<br />
Nebraska<br />
Tulathromycin 437 1,417 3.09<br />
Florfenicol 441 1,404 3.04<br />
P value b .5306 .5449 .3877<br />
Wellington, CO<br />
Tulathromycin 530 1,354 3.63<br />
Tilmicosin 526 1,340 3.58<br />
P value b .5912 .3311 .3760<br />
Texas<br />
Tulathromycin 490 1,233 2.88<br />
Tilmicosin 493 1,235 2.88<br />
P value b .5038 .8788 .9421<br />
a Cattle removed before day 28 did not contribute to the estimate of weight gain and ADG for their treatment group.<br />
Day 0 weights included all cattle enrolled. Body weights were not available for cattle that died (mortalities) or were removed<br />
from the study (chronics) before time of reimplant or day of harvest.<br />
b Within a column, P values are provided for contrasts between treatments by study location.<br />
73.7%) than for calves that received florfenicol<br />
(30 of 99; 30.3%) (Table 2). The cure rate<br />
from day 3 through harvest was also significantly<br />
higher (P = .001) for calves that received<br />
tulathromycin (50 of 94; 53.2%) than for<br />
calves that received florfenicol (23 of 99;<br />
23.2%). Chronic/mortality rates from day 3<br />
through day 28 and day 3 through harvest<br />
were significantly lower (P = .001 for both) for<br />
calves that received tulathromycin (5 of 99<br />
[5.1%] and 19 of 94 [20.2%], respectively)<br />
than for calves that received florfenicol (26 of<br />
99 [26.3%], and 47 of 99 [47.5%]). Eighteen<br />
cattle treated with tulathromycin and 42 treated<br />
with florfenicol were classified as chronics.<br />
After removal from the study, four of the 18<br />
cattle treated with tulathromycin died or were<br />
euthanized, six were processed/salvaged, and<br />
eight were transferred to a different group. Fifteen<br />
of the florfenicol-treated cattle were euthanized,<br />
six were processed/salvaged, and 21<br />
were transferred to a different group and then<br />
shipped for salvage harvest.<br />
The frequency distribution of the treatment<br />
cures, treatment failures (BRD morbidities and<br />
mortalities), and non-BRD removals for the duration<br />
of the study is summarized in Table 3.<br />
The cumulative frequency of oxytetracycline<br />
and enrofloxacin nonresponder treatments from<br />
day 3 through harvest is presented in Table 4.<br />
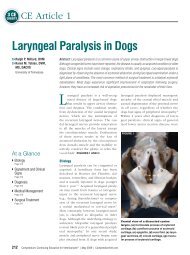
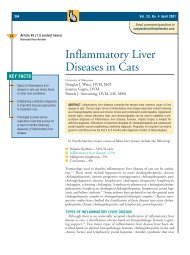
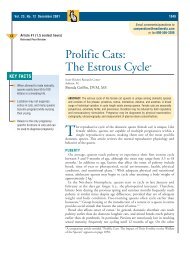
The cumulative frequencies of first-time BRD<br />
nonresponders from day 3 through the end of<br />
the study are summarized in Figure 2.<br />
Nasopharyngeal samples from 21 of 40<br />
189
<strong>Vet</strong>erinary <strong>Therapeutics</strong> • Vol. 6, No. 2, Summer 2005<br />
TABLE 6. Least Squares Means, Hot Carcass Weight, Carcass Adjusted ADG, and Carcass<br />
Characteristics<br />
Kidney,<br />
Hot Carcass Pelvic, and<br />
Carcass Adjusted Yield Choice Heart Fat Rib Eye<br />
Study Group Weight (lb) ADG (lb) Grade (%) (%) Fat (in.) Area (in 2 )<br />
Greeley, CO<br />
Tulathromycin 723 3.33 2.62 22 3.2 0.47 14.0<br />
(n = 93)<br />
Florfenicol 719 3.42 2.82 24 3.2 0.50 13.5<br />
(n = 88)<br />
P value a .7473 .3290 .0612 .8570 .6104 .9798 .0396<br />
Nebraska<br />
Tulathromycin 896 2.95 3.41 68 2.1 0.64 14.1<br />
(n = 75)<br />
Florfenicol 892 2.93 3.12 73 2.0 0.56 14.3<br />
(n = 52)<br />
P value a .8194 .7161 .1640 .835 .5474 .0997 .5278<br />
Wellington, CO<br />
Tulathromycin 841 3.42 3.83 65 2.0 0.70 12.5<br />
(n = 98)<br />
Tilmicosin 821 3.31 3.66 58 2.0 0.66 12.6<br />
(n = 86)<br />
P value a .0649 .0484 .1194 .537 .7938 .2903 .7228<br />
Texas<br />
Tulathromycin 755 3.01 3.16 55 3.0 0.60 13.4<br />
(n = 98)<br />
Tilmicosin 759 3.02 3.19 49 3.0 0.60 13.5<br />
(n = 95)<br />
P value a .5881 .8396 .7833 .3270 .5049 .8469 .8499<br />
a Within a column, P values are provided for contrasts between treatments by study location.<br />
ADG = average daily gain.<br />
calves and lung samples from two cattle yielded<br />
P. multocida, M. haemolytica, and H. somnus<br />
(H. somni) species with nine, 13, and two isolates,<br />
respectively, confirming the presence of<br />
BRD pathogens.<br />
The ADG from day 0 through day 28 was significantly<br />
higher (P = .001) for calves that received<br />
tulathromycin (3.46 lb) than for calves<br />
that received florfenicol (2.40 lb), but there was<br />
190<br />
no significant difference (P = .3877) in ADG<br />
from day 0 through day of harvest (3.09 lb for<br />
tulathromycin-treated calves and 3.04 lb for florfenicol-treated<br />
calves) (Table 5). The least<br />
squares means final live body weights (Table 5)<br />
and the hot carcass weights (Table 6) were not<br />
significantly different (P = .5449 and P = .8194,<br />
respectively). Differences in individual carcass<br />
variables were not statistically different (Table 6).
T. L. Skogerboe, K. A. Rooney, R. G. Nutsch, D. J. Weigel, K. Gajewski, and W. R. Kilgore<br />
TABLE 7. Cattle Weight Gain Including Deads and Chronics a<br />
Study Total Body Total Body Deads/<br />
Location/ Weight Enrolled No. of Head Weight Chronics<br />
Group in Study (lb) Marketed b,c Marketed (lb) in ADG<br />
Greeley, CO<br />
Tulathromycin 51,846 93 111,790 3.57<br />
Florfenicol 50,459 88 110,770 3.52<br />
Nebraska<br />
Tulathromycin 41,122 75 106,715 2.20<br />
Florfenicol 43,492 52 73,442 0.95<br />
Wellington, CO<br />
Tulathromycin 52,029 98 132,699 3.63<br />
Tilmicosin 49,301 86 116,555 3.15<br />
Texas<br />
Tulathromycin 48,951 98 123,331 2.88<br />
Tilmicosin 49,267 95 122,189 2.83<br />
aDeads/chronics in ADG = [Weight sold to harvest – (Weight enrolled – Non-BRD removals)] / [(Total head in count –<br />
Non-BRD removals) / Days on feed]<br />
bSee Table 2 for harvest days.<br />
cTotal head marketed includes only cattle remaining in the study pens for the entire study duration.<br />
ADG = average daily gain.<br />
The descriptive statistics of ADG with chronics<br />
and deads included are summarized in Table 7.<br />
Wellington, CO<br />
The treatment cure rate from day 3 through<br />
day 28 was significantly higher (P = .002) for<br />
calves that received tulathromycin (84 of 98;<br />
85.7%) than for calves that received tilmicosin<br />
(63 of 98; 64.3%) (Table 2). The cure rate from<br />
day 3 through the day of harvest was also significantly<br />
higher (P = .018) for calves that received<br />
tulathromycin (76 of 98; 77.6%) than<br />
for calves that received tilmicosin (57 of 94;<br />
60.6%). Chronic/mortality rates from day 3<br />
through day 28 and day 3 through harvest were<br />
significantly lower (P = .025 and P = .014, respectively)<br />
for calves that received tulathromycin<br />
(0% and 0%) than for calves that<br />
received tilmicosin (six of 98 [6.1%] and seven<br />
of 94 [7.5%], respectively). Seven tilmicosin-<br />
treated cattle were removed from the study as<br />
BRD-related mortalities or chronics. Of these<br />
cattle, three died of BRD. Of the four chronics,<br />
three went on to harvest and one died.<br />
The frequency distribution of the treatment<br />
cures, treatment failures (BRD morbidities and<br />
mortalities), and non-BRD removals for the duration<br />
of the study is summarized in Table 3.<br />
The cumulative frequency of oxytetracycline<br />
and enrofloxacin nonresponder treatments from<br />
day 3 through harvest is presented in Table 4.<br />
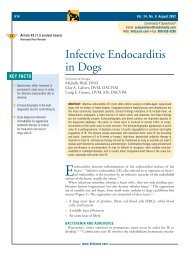
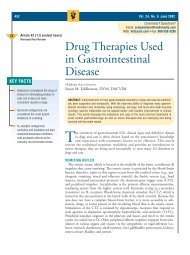
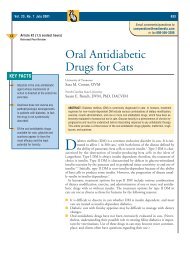
The cumulative frequencies of first-time BRD<br />
nonresponders from day 3 through the end of<br />
the study are summarized in Figure 3.<br />
Nasopharyngeal samples from 27 calves and a<br />
lung sample from one calf yielded P. multocida,<br />
M. haemolytica, and H. somnus (H. somni) species<br />
with one, 25, and two isolates, respectively,<br />
confirming the presence of BRD pathogens.<br />
The ADG from day 0 through day 28 was<br />
191
<strong>Vet</strong>erinary <strong>Therapeutics</strong> • Vol. 6, No. 2, Summer 2005<br />
BRD Nonresponse (cumulative %)<br />
Figure 2. Cumulative percentage of first-time BRD nonresponse from day 3 through end of study (Nebraska).<br />
a See Table 2 for harvest days (end of study).<br />
significantly higher (P = .0005) for calves that<br />
received tulathromycin (3.81 lb) than for<br />
calves that received tilmicosin (3.34 lb), but<br />
there was no significant difference (P = .3760)<br />
in ADG from day 0 through day of harvest<br />
(3.63 lb for tulathromycin-treated calves and<br />
3.58 lb for tilmicosin-treated calves) (Table 5).<br />
The least squares means final live body weight<br />
was 1,354 lb for tulathromycin-treated cattle<br />
and 1,340 lb for tilmicosin-treated cattle (P =<br />
.3311) (Table 5). Tulathromycin-treated cattle<br />
yielded a least squares means hot carcass weight<br />
of 840.8 lb <strong>com</strong>pared with 821.3 lb (P =<br />
.0649) in tilmicosin-treated cattle (Table 6).<br />
Except for carcass adjusted ADG, differences<br />
in individual carcass variables were not statistically<br />
different (Table 6). The descriptive statistics<br />
of ADG with chronics and deads included<br />
are summarized in Table 7.<br />
Texas<br />
The treatment cure rate from day 3 through<br />
day 28 was not significantly higher (P = .160)<br />
192<br />
90<br />
80<br />
70<br />
60<br />
50<br />
40<br />
30<br />
20<br />
10<br />
0<br />
Cumulative Percentage of Nonresponse was Lower in Tulathromycin-Treated Cows<br />
Tulathromycin Florfenicol<br />
3 5 7 9 11 13 15 17 19 21 23 25 27 End a<br />
Day of Study<br />
//<br />
for calves that received tulathromycin (78 of<br />
100; 78%) than for calves that received tilmicosin<br />
(69 of 100; 69%) (Table 2). The cure rate<br />
from day 3 through harvest was not significantly<br />
higher (P = .355) for calves that received tulathromycin<br />
(73 of 100; 73%) than for calves<br />
that received tilmicosin (67 of 100; 67%).<br />
Chronic/mortality rates from day 3 through<br />
day 28 and day 3 through harvest were not significantly<br />
different (P = .414 and P = .257) for<br />
calves that received tulathromycin (two of 100<br />
[2%] for both) than for calves that received<br />
tilmicosin (four of 100 [4%] and five of 100<br />
[5%], respectively). Two tulathromycin- and<br />
four tilmicosin-treated cattle were classified as<br />
chronics. After removal from the study, all<br />
chronics were euthanized.<br />
The frequency distribution of the treatment<br />
cures, treatment failures (BRD morbidities and<br />
mortalities), and non-BRD removals for the<br />
duration of the study is summarized in Table 3.<br />
The cumulative frequency of oxytetracycline<br />
and enrofloxacin nonresponder treatments
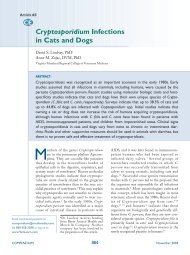
BRD Nonresponse (cumulative %)<br />
45<br />
40<br />
35<br />
30<br />
25<br />
20<br />
15<br />
10<br />
5<br />
0<br />
T. L. Skogerboe, K. A. Rooney, R. G. Nutsch, D. J. Weigel, K. Gajewski, and W. R. Kilgore<br />
Cumulative Percentage of Nonresponse was Lower in Tulathromycin-Treated Cows<br />
Tulathromycin Tilmicosin<br />
3 5 7 9 11 13 15 17 19 21 23 25 27 End a<br />
Figure 3. Cumulative percentage of first-time BRD nonresponse from day 3 through end of study (Wellington, CO).<br />
a See Table 2 for harvest days (end of study).<br />
from day 3 through harvest is presented in<br />
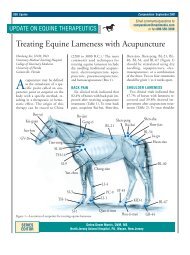
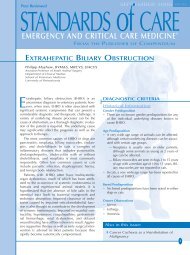
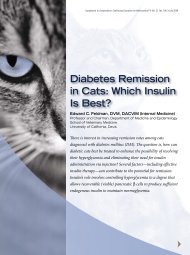
Table 4. The cumulative frequencies of firsttime<br />
BRD nonresponders from day 3 through<br />
the end of the study are summarized in<br />
Figure 4.<br />
Nasopharyngeal samples from 40 calves<br />
yielded P. multocida and M. haemolytica species<br />
with six and 11 isolates, respectively, confirming<br />
the presence of BRD pathogens.<br />
The ADG from day 0 through day 28 was<br />
significantly higher (P = .0018) for calves that<br />
received tulathromycin (4.00 lb) than for<br />
calves that received tilmicosin (3.62 lb), but<br />
there was no significant difference (P = .9421)<br />
in ADG from day 0 through harvest (2.88 lb<br />
for both groups) (Table 5). The least squares<br />
means final live body weight of tulathromycintreated<br />
cattle was 1,233 lb and of tilmicosintreated<br />
cattle was 1,235 lb (P = .8788) (Table<br />
5). Tulathromycin-treated cattle yielded a least<br />
squares means hot carcass weight of 755 lb<br />
<strong>com</strong>pared with a tilmicosin-treated cattle carcass<br />
weight of 759 lb (P = .5881) (Table 6).<br />
Differences in individual carcass variables were<br />
Day of Study<br />
not statistically different (Table 6). The descriptive<br />
statistics of weight gains with chronics<br />
and deads included are summarized in<br />
Table 7.<br />
Overall<br />
No suspected adverse experiences were observed<br />
from antimicrobial product administration<br />
in any of the studies.<br />
■ DISCUSSION<br />
In three of these four studies, cattle with undifferentiated<br />
BRD that were treated with tulathromycin<br />
had superior BRD cure rates over<br />
the duration of the feeding period from the<br />
time of feedlot entry to harvest <strong>com</strong>pared with<br />
cattle treated with florfenicol or tilmicosin. At<br />
the Greeley, CO, and Nebraska study locations,<br />
where tulathromycin was <strong>com</strong>pared with<br />
florfenicol, the percentage differences in cure<br />
rates were 14% and 27%, respectively. For the<br />
tilmicosin <strong>com</strong>parisons, the Wellington, CO,<br />
study had a 19% difference in cure rates. In the<br />
Texas study, which had the smallest percentage<br />
//<br />
193
<strong>Vet</strong>erinary <strong>Therapeutics</strong> • Vol. 6, No. 2, Summer 2005<br />
BRD Nonresponse (cumulative %)<br />
Figure 4. Cumulative percentage of first-time BRD nonresponse from day 3 through end of study (Texas).<br />
a See Table 2 for harvest days (end of study).<br />
difference in cure rates, 6% more tilmicosintreated<br />
cattle required further BRD treatment<br />
than did tulathromycin-treated cattle, but the<br />
cure rates of 73% for tulathromycin-treated<br />
cattle and 67% for tilmicosin-treated cattle<br />
were not significantly different. Many factors,<br />
such as pathogen exposure, immunosuppression,<br />
physiologic status, environment, and<br />
management practices, contribute to the severity<br />
of BRD; thus, although cattle in these studies<br />
were purchased at several auction markets,<br />
<strong>com</strong>mingled, and shipped to the study site,<br />
one or more of these factors may have mitigated<br />
the disease challenge.<br />
The differences in efficacy between tulathromycin<br />
and florfenicol or tilmicosin are<br />
more remarkable in the <strong>com</strong>parison of the cumulative<br />
frequency of first-time BRD nonresponders<br />
(morbidities). At all four locations,<br />
the majority of the first-time nonresponders after<br />
initial BRD therapy occurred during the<br />
28-day period after treatment. In the Greeley,<br />
CO, <strong>com</strong>parison with florfenicol, the number<br />
of florfenicol BRD morbidities showed a<br />
steady increase beginning at day 7 and contin-<br />
194<br />
35<br />
30<br />
25<br />
20<br />
15<br />
10<br />
5<br />
0<br />
Cumulative Percentage of Nonresponse was Lower in Tulathromycin-Treated Cows<br />
Tulathromycin Tilmicosin<br />
3 5 7 9 11 13 15 17 19 21 23 25 27 End a<br />
Day of Study<br />
//<br />
uing through day 9; thereafter, the BRD morbidity<br />
rates were similar between the florfenicol-<br />
and tulathromycin-treated calves through<br />
the end of the study. After initial treatments at<br />
the Nebraska location, morbidity rates were<br />
nearly equal until day 13, when the number of<br />
florfenicol-treated calves classified as BRD<br />
morbidities steadily increased through day 21<br />
<strong>com</strong>pared with calves treated with tulathromycin.<br />
After that, cumulative BRD morbidities<br />
of both treatments were similar<br />
through the end of the study. Calves treated<br />
with tilmicosin at Wellington, CO, had three<br />
times more BRD morbidities at 3 days after<br />
treatment <strong>com</strong>pared with tulathromycin-treated<br />
calves. The number of tilmicosin BRD morbidities,<br />
relative to tulathromycin-treated<br />
calves, was much higher than those treated<br />
with tulathromycin until day 7, at which time<br />
the two groups of cattle had similar morbidity<br />
rates through the end of the study. Although<br />
the differences in cure rates were the least in<br />
the Texas study when <strong>com</strong>pared with the other<br />
three studies, more tilmicosin-treated calves<br />
showed BRD morbidity on days 3, 4, 5, and 6
T. L. Skogerboe, K. A. Rooney, R. G. Nutsch, D. J. Weigel, K. Gajewski, and W. R. Kilgore<br />
than calves treated with tulathromycin, with<br />
negligible differences in morbidity rates from<br />
day 7 through the end of the study.<br />
An out<strong>com</strong>e of the greater number of BRD<br />
treatment failures (first through fourth nonresponders,<br />
chronics, BRD mortalities) of calves<br />
treated with either florfenicol or tilmicosin was<br />
that a higher number of antimicrobial treatments<br />
were administered to those cattle <strong>com</strong>pared<br />
with those treated with tulathromycin.<br />
Although in the Greeley, CO, study, the second-<br />
and third-line antimicrobials used for<br />
nonresponse therapy were different than in the<br />
other three studies, the same antimicrobials<br />
were used in each study following initial BRD<br />
treatments; thus, these are valid <strong>com</strong>parisons.<br />
Notably, the ratio of BRD nonresponse antimicrobial<br />
treatments of florfenicol- and<br />
tilmicosin-treated calves <strong>com</strong>pared with tulathromycin-treated<br />
calves ranged from 1.7 to<br />
2.0 across all four studies.<br />
Except for the Texas study, in which ADGs<br />
were the same for both tulathromycin and<br />
tilmicosin, ADGs of tulathromycin-treated<br />
cattle were numerically higher than tilmicosin<br />
or florfenicol in the three other studies. This is<br />
attributable to the weight gain analyses that<br />
only body weights collected on all animals at a<br />
single time point in each study were included<br />
in the repeated measures mixed model analyses.<br />
Thus, the calves that would be expected to<br />
have the greatest negative effect on performance<br />
were not included in these analyses. Of<br />
more importance is the live body weight of cat-<br />
tle to market. Because there were more chronics<br />
and mortalities in the groups of cattle treated<br />
with florfenicol or tilmicosin, more cattle<br />
treated with tulathromycin were marketed, resulting<br />
in a higher total pounds of body weight<br />
than for those cattle treated with florfenicol or<br />
tilmicosin. In the two locations that had more<br />
florfenicol- or tilmicosin-treated chronics and<br />
mortalities, the differences in deads/chronics<br />
in ADG between tulathromycin- and tilmicosin-<br />
or florfenicol-treated calves was 0.48<br />
and 1.25 lb, respectively, while these differences<br />
were only 0.05 lb in the other two <strong>com</strong>parisons.<br />
It is worth mentioning that the management<br />
of the chronics in these studies<br />
followed acceptable industry practices. After<br />
The differences in efficacy between<br />
tulathromycin and florfenicol or tilmicosin<br />
are more remarkable in the <strong>com</strong>parison of the<br />
cumulative frequency of first-time BRD nonresponders.<br />
meeting criteria of a chronic designation, these<br />
cattle were removed from their home pens and<br />
the study. Although some of the calves classified<br />
as chronics did eventually reach harvest,<br />
after removal from the study they were not experimental<br />
units for data analyses, as they were<br />
managed differently than calves still remaining<br />
in the studies.<br />
Both tilmicosin and florfenicol are extensively<br />
used in feedlots as first-line BRD therapeutics<br />
because of their single-dose regimens<br />
and spectrum of activity against bacteria most<br />
<strong>com</strong>monly associated with BRD. Thus, the<br />
<strong>com</strong>parison of tulathromycin to each of these<br />
products was useful in evaluating the efficacy<br />
of tulathromycin under typical feedlot conditions<br />
from the time of treatment for BRD<br />
through harvest.<br />
195
<strong>Vet</strong>erinary <strong>Therapeutics</strong> • Vol. 6, No. 2, Summer 2005<br />
■ CONCLUSION<br />
Tulathromycin given as a single SC injection<br />
at 2.5 mg/kg body weight was effective and<br />
safe for the treatment of undifferentiated<br />
BRD. In <strong>com</strong>parison with florfenicol and<br />
tilmicosin, treatment of undifferentiated BRD<br />
with tulathromycin showed significantly higher<br />
cure rates in the two <strong>com</strong>parisons to florfenicol<br />
and the one <strong>com</strong>parison to tilmicosin.<br />
■ ACKNOWLEDGMENTS<br />
The authors thank the following investigators and their staffs<br />
for conducting these studies: Mary Wray, PhD, Horton<br />
Feedlot and Research Center, Wellington, CO; E. G. Johnson,<br />
DVM, Johnson Research LLC, Parma, ID; David T.<br />
Bechtol, DVM, Agri Research Center, Inc., Canyon, TX;<br />
Karen Rogers, DVM, and Delbert Miles, DVM, <strong>Vet</strong>erinary<br />
Research and Consulting Services, Greeley, CO; and Donald<br />
J. Bade, BS, Colorado Animal Research Enterprises, Fort<br />
Collins, CO. The authors are also grateful for the assistance<br />
of Korb W. Maxwell, DVM; Andrea C. Brake, PhD; Sam E.<br />
Ives, DVM, PhD; and Chad E. Guyer, BS.<br />
■ REFERENCES<br />
1. Kelly AP, Janzen ED: A review of morbidity and mortality<br />
rates and disease occurrence in North American<br />
196<br />
feedlot cattle. Can <strong>Vet</strong> J 27:496–500, 1986.<br />
2. Mosier DA: Bacterial pneumonia, bovine respiratory disease<br />
update. <strong>Vet</strong> Clin North Am 13(3):483–493, 1997.<br />
3. Perino LJ, Apley M: Bovine respiratory disease, in<br />
Howard JL, Smith RA (eds): Current <strong>Vet</strong>erinary Therapy:<br />
Food Animal Practice. Philadelphia, WB Saunders,<br />
1999, pp 446–455.<br />
4. Hartwig NR, Faber R, Busby D, BreDahl R: The costs<br />
and predictive factors of bovine respiratory diseases in<br />
standardized steer tests, 1999 Beef Research Report.<br />
A.S. Leaflet R1648. Ames, Iowa State University, 1999.<br />
5. Speer NC, Young C, Roeber D: The importance of preventing<br />
bovine respiratory disease: A beef industry review.<br />
Bovine Pract 35(2):189–195, 2001.<br />
6. Thornsbury RM: Preconditioning for cow-calf producers:<br />
A marketing advantage or disadvantage? Compend<br />
Contin Educ Pract <strong>Vet</strong> 13:495–501, 1991.<br />
7. Nowakowski MA, Inskeep PB, Risk JE, et al: Pharmacokinetics<br />
and lung tissue concentration of tulathromycin,<br />
a new triamilide antibiotic in cattle. <strong>Vet</strong> Ther<br />
5(1):60–74, 2004.<br />
8. Kilgore WR, Spensley MS, Sun F, et al: Therapeutic efficacy<br />
of tulathromycin, a novel triamilide antimicrobial,<br />
against bovine respiratory disease in feeder calves.<br />
<strong>Vet</strong> Ther 6(2):143–153, 2005.<br />
9. Federation of Animal Science Societies (FASS): Guide<br />
for the Care and Use of Agricultural Animals in Agricultural<br />
Research and Teaching. FASS Publications, Savoy,<br />
IL, 1999.