Dames & Moore, 1999 - USDA Forest Service
Dames & Moore, 1999 - USDA Forest Service Dames & Moore, 1999 - USDA Forest Service
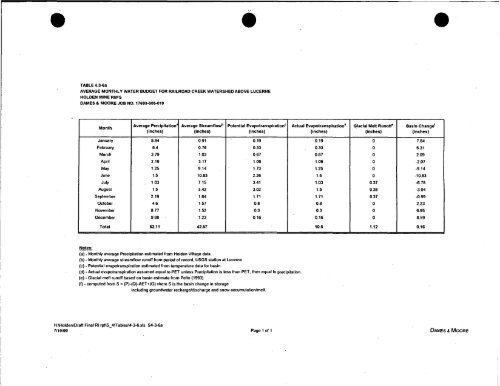
TABLE 4.3ba AVERAGE MONTHLY WATER BUDGET FOR RAILROAD CREEK WATERSHED ABOVE LUCERNE HOLDEN MINE RIIFS DAMES a MOORE JOB NO. 1769340~19 Month January February March April MaY June JulV August September October November December Total Average Precipitation' (inches) 8.94 6.4 3.79 2.16 1.25 1.5 . 1.03 1.5 2.19 4.6 8.77 9.98 52.1 1 Average streamflowb (inches) 0.91 0.76 1.03 3.17 9.14 10.83 7.15 3.42 1.84 1.57 1.52 1.23 Notes: (a) - Monthly average Precipitation estimated from Holden Village data (b) -Monthly average streamflow runoff from period of record. USGS station at Lucerne (c) - Potential evapotranspiration estimated from temperature data for basin. (d) -Actual evapotranspiration assumed equal to PET unless Precipilation is less than PET, then equal to precipitation. (e) - Glacial melt runoff based on basin estimate from Pelto (1993) (I) - computed from S = (P)-(Q)-AET+(G) vhere S is the basin change in storage including groundwater rechargeldischarge and snow accumulationlmelt. H:\Holden\Drafl Final Ri rpt\S-4\Tables\4-3-6.xls S4-3-6a 711 9/99 Page 1 of 1 42.57 Potential EvapotranspirationC (inches) 0.19 0.33 0.67 1.06 1.73 2.26 3.41 3.02 1.71 0.8 0.3 0.16 Actual Evapotransplration'' (inches) 0.19 0.33 0.67 1.06 1.25 1.5 1.03 1.5 1.71 0.8 0.3 0.16 10.5 Glacial Melt Runorf (inches) 0 0 0 0 0 0 0.37 0.38 0.37 0 0 0 1.12 Basin change' (inches) 7.84 5.31 2.09 -2.07 -9.14 -10.83 -6.78 -3.04 -0.99 2.23 6.95 8.59 0.16 L
TABLE 4.34b AVERAGE MONTHLY WATER BUDGET FOR HOLDEN MINE SITE HOLDEN MINE RIPS DAMES & MOORE JOB NO. 17693-005419 Noter: (a) . HoMen Village average precipitation (b) - Holden Village estimated average potential mpotranspiratlon (c) - estimated ~noff (gmundwater) from mine site; equal to 0 75% of the average monthly flow (d) - ~noff in inches for mine site area, assumed equal to 120 acres. (e) - net change in storage from mine site. (0 - Holden Village precipitation for 1997 -April and May values include estimated snowmelt of 50 inches (water equivalent of 500 inch snowfall) (g) - Estimated PET from monthly average temperature for 1997. (h) -estimated runoff as 0.75% of 1997 monthly awrage values at RC-4 (i) - ~noff in inches. (j) - change in storage in mine site area
- Page 227 and 228: Reference Reaches RC-10. Railroad C
- Page 229 and 230: accessed, including the RM-3 "Dan's
- Page 231 and 232: The banks are relatively nonvegetat
- Page 233 and 234: Ratio of Shredder Functional Feedin
- Page 235 and 236: without scrapers and organisms requ
- Page 237 and 238: present at RC-6, RC-I, RC-3, SFAC-I
- Page 239 and 240: and stumps with bark piles surround
- Page 241 and 242: Tailings Piles A flock of violet-gr
- Page 243 and 244: 4.6.3 Threatened or Endangered Spec
- Page 245 and 246: Background Information Grizzly bear
- Page 247 and 248: anadromous populations occurring in
- Page 249 and 250: Creek drainage, they are more commo
- Page 251 and 252: R16E S7). These species include an
- Page 253 and 254: TABLE 4.1-1 KEY OF SITE FEATURES 8
- Page 255 and 256: TABLE 4.1-1 KEY OF SITE FEATURES 8
- Page 257 and 258: TABLE 4.1 -1 KEY OF SITE FEATURES 8
- Page 259 and 260: Pitchblende Sericite Biotite Source
- Page 261 and 262: TABLE 4.2-2a EROSION POTENTIAL RANK
- Page 263 and 264: TABLE 4.2-4 RIP-RAP CONDITION RANKI
- Page 265 and 266: TABLE 4.24 BORROW SOURCE EVALUATION
- Page 267 and 268: TABLE 4.3-1 AVERAGE MONTHLY FLOW PE
- Page 269 and 270: TABLE 4.33 AVERAGE MONTHLY POTENTIA
- Page 271 and 272: TABLE 4.3& SURFACE WATER FIELD PARA
- Page 273 and 274: TABLE 4.3da SURFACE WATER flELD PAR
- Page 275 and 276: TABLE 4.3-5 MONTHLY STREAMFLOW AVER
- Page 277: NA = not measured NF = no flow S =
- Page 281 and 282: Station RC- I RC-4 RC-9 Copper Cree
- Page 283 and 284: Hydrostratigraphic Unit SoilIFill C
- Page 285 and 286: TABLE 4.4-2 GROUNDWATER FIELD PARAM
- Page 287 and 288: TABLE 4.4-2 GROUNDWATER FIELD PARAM
- Page 289 and 290: TABLE 4.4-2 GROUNDWATER FIELD PARAM
- Page 291 and 292: Stream Reach RC-4 to RC-7 RC-7 to R
- Page 293 and 294: TABLE 4.4-6 RESULTS OF OCTOBER 1998
- Page 295 and 296: Seep SP-8 was observed flowing in l
- Page 297 and 298: TABLE 4.448 SEEPAGE FIELD PARAMETER
- Page 299 and 300: TABLE 4.4- SEEPAGE FIELD PARAMETERS
- Page 301 and 302: TABLE 4.4-9 REACH 1 SITE-SPECIFIC W
- Page 303 and 304: Habitat Variable Stream Velocity an
- Page 305 and 306: a TABLE 4.6-2A BENTHIC MACROINVERTE
- Page 307 and 308: TABLE 4.6-2C DISTRIBUTION FIT FOR M
- Page 309 and 310: TABLE 4.6-3 TROUT POPULATION ESTIMA
- Page 311 and 312: Date September 9 September 10 Septe
- Page 313 and 314: TABLE 4.6-6 . HERPETOFAUNA LIKELY T
- Page 315 and 316: North-aspect Slope Sharp-shinned ha
- Page 317 and 318: ! I TABLE 4.6-10 MAMMAL SPECIES OBS
- Page 319 and 320: CLIENT PRI VILECED AND CONFIDENTlA
- Page 321 and 322: TABLE 4.6-13 U.S. FOREST SERVICE SU
- Page 323 and 324: TABLE 4.6-15 SURVEY AND MANAGE SPEC
- Page 325 and 326: . . ; SOURCE: Wen et al., 1992 ,, .
- Page 327 and 328: SOURCE: Base mrlp information from
TABLE 4.3ba<br />
AVERAGE MONTHLY WATER BUDGET FOR RAILROAD CREEK WATERSHED ABOVE LUCERNE<br />
HOLDEN MINE RIIFS<br />
DAMES a MOORE JOB NO. 1769340~19<br />
Month<br />
January<br />
February<br />
March<br />
April<br />
MaY<br />
June<br />
JulV<br />
August<br />
September<br />
October<br />
November<br />
December<br />
Total<br />
Average Precipitation'<br />
(inches)<br />
8.94<br />
6.4<br />
3.79<br />
2.16<br />
1.25<br />
1.5<br />
. 1.03<br />
1.5<br />
2.19<br />
4.6<br />
8.77<br />
9.98<br />
52.1 1<br />
Average streamflowb<br />
(inches)<br />
0.91<br />
0.76<br />
1.03<br />
3.17<br />
9.14<br />
10.83<br />
7.15<br />
3.42<br />
1.84<br />
1.57<br />
1.52<br />
1.23<br />
Notes:<br />
(a) - Monthly average Precipitation estimated from Holden Village data<br />
(b) -Monthly average streamflow runoff from period of record. USGS station at Lucerne<br />
(c) - Potential evapotranspiration estimated from temperature data for basin.<br />
(d) -Actual evapotranspiration assumed equal to PET unless Precipilation is less than PET, then equal to precipitation.<br />
(e) - Glacial melt runoff based on basin estimate from Pelto (1993)<br />
(I) - computed from S = (P)-(Q)-AET+(G) vhere S is the basin change in storage<br />
including groundwater rechargeldischarge and snow accumulationlmelt.<br />
H:\Holden\Drafl Final Ri rpt\S-4\Tables\4-3-6.xls S4-3-6a<br />
711 9/99 Page 1 of 1<br />
42.57<br />
Potential EvapotranspirationC<br />
(inches)<br />
0.19<br />
0.33<br />
0.67<br />
1.06<br />
1.73<br />
2.26<br />
3.41<br />
3.02<br />
1.71<br />
0.8<br />
0.3<br />
0.16<br />
Actual Evapotransplration''<br />
(inches)<br />
0.19<br />
0.33<br />
0.67<br />
1.06<br />
1.25<br />
1.5<br />
1.03<br />
1.5<br />
1.71<br />
0.8<br />
0.3<br />
0.16<br />
10.5<br />
Glacial Melt Runorf<br />
(inches)<br />
0<br />
0<br />
0<br />
0<br />
0<br />
0<br />
0.37<br />
0.38<br />
0.37<br />
0<br />
0<br />
0<br />
1.12<br />
Basin change'<br />
(inches)<br />
7.84<br />
5.31<br />
2.09<br />
-2.07<br />
-9.14<br />
-10.83<br />
-6.78<br />
-3.04<br />
-0.99<br />
2.23<br />
6.95<br />
8.59<br />
0.16<br />
L


