Dames & Moore, 1999 - USDA Forest Service
Dames & Moore, 1999 - USDA Forest Service Dames & Moore, 1999 - USDA Forest Service
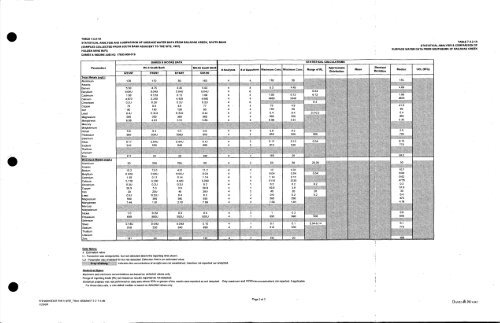
TABLE 7.2.2-1A STATISTICAL ANALYSIS AND COMPARISON OF SURFACE WATER DATA FROM RAILROAD CREEK, SOUTH BANK (SAMPLES COLLECTED FROM SOUTH BANK UPSTREAM OF SITE, 1991 - 1997) HOLDEN MINE RUFS DAMES 8 MOORE JOB NO. 1769340WJ19 Parameters Data Notes: J - Estimated Value. 'U - Parameter was analyzed for, but not detected above the reporting l~mit shaum. r. but not detected. Detect~on limit is an estimated value. dicates the concentration of analyte was not established, therefore not reported nor analyzed Data Source: (a) Kilburn, et al. 1994. Gwchemical data and sample locahty maps for stream-sediment. heavy-mineral-concentrate. mill tailing, water. and precipitate samples collected in and around the Holden mine. Chelan County. Washington USGS Open File Report 94-680A Paper Version. 94-6808 Diskette version (Data Collected in 1994). (b) Kilburn. J.E. 8 S.J. Sutley. 1996. Characterization of acid mine drainage at the Holden mine. Chelan. Washington. USGS Open File Report 96-531. (Data collected in 1995) (c) Kilburn. J.E. 8 S.J. Sutley. 1997. Analytical results and comparative overview of geochemical studies conducted at the Holden Mine. spring 1996. USGS Open File Report 97-1 28 (Data collected in Spring 1996). (d) Kilburn. J E. 8 S.J. Sutley. 1997. Preliminary data (no report attached. data collected in FaU 1996) H.\Holden\Drafl final ri rpt\S_7\eco raUables\7-2-2-1-a.x(s Tl?6/99 Page 1 of 3 TABLE 7.2.2-1A STATISTICAL ANALYSIS B COMPARISON OF SURFACE WATER DATA FROM SOUTHBANK OF RAILROAD CREEK Statistical Notes: (Statisical calculations were performed using Washington Gepartment of Ecology's MTCAStat Excel V 5 Macro (Module 2.1). downloaded from their web site.) Maximum and minimum concentrations are based on detected values only. ' Range of reporting limrts (RL) are based on results reported as not detected Distribution is determined based on the MTCA stat program by analyzing the data'through the 'W-Test' or 'DAgostino's test". Where data is not lognormally nor normally distributed, the distribution is noted as 'Neither. When approdrnate distribution is reported as 'ne~thef, the maximum concentratim is reported as the 95% UCL and is presented in BOLD font The mean is an arithmetic mean if data are normally distributed or if distributiorjir. indicated as 'Neither'. The reported mean for lognormally distributed data is a lognormal mean. Statistical analysis was not performed on data sets where 50% or greater of thi results were reported as not detected. Only maximum and minimum concentrations are reported, if applicable For tk& data sets. a calculated median is based on detected values only.
TABLE 7.2.2-1 A STATISTICAL ANALYSIS AND COMPARISON OF SURFACE WATER DATA FROM RAILROAD CREEK. SOUTH BANK (SAMPLES COLLECTED FROM SOUTH BANK ADJACENT TO THE SITE, 1997) HOLDEN MINE RUFS DAMES 8 MOORE JOB NO. 17693905-019 Parameters H \Holden\Drafl final n rptS_7\eco ra\tables\7-2-2-1 -a.xls 7/26/96 Data Notes: J - Estimated value. U - Parameter was analyzed for, but not detected above the reporting limit shown. r but not detected. Detection limit is an estimated value. dicates the concentration of anawe was not established, therefore not reported nor analyzed Statistical Notes: Maximum and minimum concentrations are based on detected values only. Range of reporting limns (RL) are based on results reported as not detected. Statistical analysis was not performed on data sets where 50% or greater of the results were reported as not detected. Only maximum and minimum concentrations are reported, if applicable. For these data sets. a calculated median 1s based on detected values only. Page 2 of 3 TABLE 7.2.2-1A STATISTICAL ANALYSIS 8 COMPARISON OF SURFACE WATER DATA FROM SOUTHBANK OF RAILROAD CREEK
- Page 997 and 998: TABLE 7.1 J MSTORKM AJR MONITORING
- Page 999 and 1000: TABLE 7.1-1 AREA AND NATURAL BACKGR
- Page 1002 and 1003: TABLE 7.1-4 TOXICITY CRITERIA AND B
- Page 1004 and 1005: TABLE 7.14 HUMAN HEALTH SCREENING O
- Page 1006 and 1007: TABLE 7.14 HUMAN HEALTH SCREENING O
- Page 1008 and 1009: TABLE 7.1-10 HUMAN HEALTH SCREENING
- Page 1011 and 1012: TABLE 7.1-13 HUMAN HEALTH SCREENING
- Page 1013 and 1014: TABLE 7.1-15 HUMN HEALTH SCREENING
- Page 1015 and 1016: TABLE 7.1-17 HUMAN HEALTH SCREENING
- Page 1017 and 1018: TABLE 7.1-19 HUMAN HEALTH SCREENING
- Page 1019 and 1020: TABLE 7.1 -21 HUMAN HEALTH SCREENIN
- Page 1021 and 1022: TABLE 7.1-23 HUMAN HEALTH SCREENING
- Page 1023 and 1024: TABLE 7.1-25 HUMAN HEALTH SCREENING
- Page 1025 and 1026: TABLE 7.1-27 HUMAN HEALTH SCREENING
- Page 1027 and 1028: TABLE 7.1-29 HUMANHEALTHSCREENINGOF
- Page 1029: TABLE 7.1-31 HUMAN HEALTH SCREENING
- Page 1032 and 1033: TABLE 7.1-34 HUMAN HEALTH SCREENING
- Page 1034 and 1035: TABLE 7.1-36 EXPOSURE PATHWAYS AND
- Page 1036 and 1037: TABLE 7.1 -38 TOXICITY CRITERIA AND
- Page 1038 and 1039: TABLE 7.1.40 SITE-SPECIFIC METHOD C
- Page 1040 and 1041: TABLE 7.142 CALCUIATION OF CANCER R
- Page 1042 and 1043: Constituent Aluminum Arsenic Acute
- Page 1044 and 1045: Constituent Chromium Copper Acute T
- Page 1046 and 1047: Constituent Selenium Zinc Gasoline
- Page 1050 and 1051: H.\Holden\Draft final ri rpt\S_7\ec
- Page 1052 and 1053: TABLE 7.2.2-162 STATISnCAL ANALYSIS
- Page 1054 and 1055: TABLE 7.2.2-1C COMPARISON OF TOTAL
- Page 1056 and 1057: TABLE 7.2.2-1C =b COMPARISON OF SED
- Page 1058 and 1059: 'a TABLE I 7.2.2-1D SUMMARY OF RI F
- Page 1060 and 1061: TABLE 7.2.2-1E STATISTICAL ANALYSIS
- Page 1062 and 1063: TABLE 7.2.2-1F STATISTICAL ANALYSIS
- Page 1064 and 1065: TABLE 7.2.2-1F STATISTICAL ANALYSIS
- Page 1066 and 1067: TABLE 7.2.2-1F STATISTICAL ANALYSIS
- Page 1068 and 1069: TABLE 7.22-1G STATISTICAL ANALYSIS
- Page 1070 and 1071: TABLE 7.22-10 STAT~SMAL ANALYSIS AN
- Page 1072 and 1073: - - -. TABLE 7.2.2-1H STATISTICAL A
- Page 1074 and 1075: TABLE 7.2.2-1H STATISTICAL ANALYSIS
- Page 1076 and 1077: TABLE 7.2.2-1 H STATISTICAL ANALYSI
- Page 1078 and 1079: TABLE 7.2.2-1H STATISTICAL ANALYSIS
- Page 1080 and 1081: TABLE 7.2.2-2 (CONTINUED) SPECIES O
- Page 1082 and 1083: TABLE 7.2.2-4 SUMMARY OF REPRESENTA
- Page 1084 and 1085: TABLE 7.2.3-1B RESULTS OF PEER-REVI
- Page 1086 and 1087: TABLE 7.2.3-2B RESULTS OF PEER-REVI
- Page 1088 and 1089: TABLE 7.2.3-3B SOIL CONCENTRATIONS
- Page 1090 and 1091: , TABLE 7.2.3-4B TOXICITY REFERENCE
- Page 1092 and 1093: " Metal C Atscnic Cadmium Copper Le
- Page 1094 and 1095: TABLE 7.2.3-8 DOSES TO OSPREY CONSU
- Page 1096 and 1097: Biota Plants Cd Cu Pb Zn Earthworms
TABLE 7.2.2-1 A<br />
STATISTICAL ANALYSIS AND COMPARISON OF SURFACE WATER DATA FROM RAILROAD CREEK. SOUTH BANK<br />
(SAMPLES COLLECTED FROM SOUTH BANK ADJACENT TO THE SITE, 1997)<br />
HOLDEN MINE RUFS<br />
DAMES 8 MOORE JOB NO. 17693905-019<br />
Parameters<br />
H \Holden\Drafl final n rptS_7\eco ra\tables\7-2-2-1 -a.xls<br />
7/26/96<br />
Data Notes:<br />
J - Estimated value.<br />
U - Parameter was analyzed for, but not detected above the reporting limit shown.<br />
r but not detected. Detection limit is an estimated value.<br />
dicates the concentration of anawe was not established, therefore not reported nor analyzed<br />
Statistical Notes:<br />
Maximum and minimum concentrations are based on detected values only.<br />
Range of reporting limns (RL) are based on results reported as not detected.<br />
Statistical analysis was not performed on data sets where 50% or greater of the results were reported as not detected. Only maximum and minimum concentrations are reported, if applicable.<br />
For these data sets. a calculated median 1s based on detected values only.<br />
Page 2 of 3<br />
TABLE 7.2.2-1A<br />
STATISTICAL ANALYSIS 8 COMPARISON OF<br />
SURFACE WATER DATA FROM SOUTHBANK OF RAILROAD CREEK


