DATA HIGHLIGHTS - Census of India Website
DATA HIGHLIGHTS - Census of India Website
DATA HIGHLIGHTS - Census of India Website

You also want an ePaper? Increase the reach of your titles
YUMPU automatically turns print PDFs into web optimized ePapers that Google loves.
Page 1 <strong>of</strong> 4<br />
Source: Office <strong>of</strong> the Registrar General, <strong>India</strong><br />
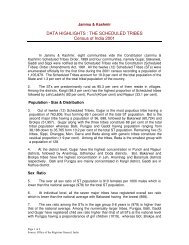
Jammu & Kashmir<br />
<strong>DATA</strong> <strong>HIGHLIGHTS</strong> : THE SCHEDULED CASTES<br />
<strong>Census</strong> <strong>of</strong> <strong>India</strong> 2001<br />
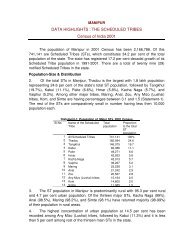
The State <strong>of</strong> Jammu & Kashmir, known as the crown <strong>of</strong> <strong>India</strong> is located in the<br />
extreme north <strong>of</strong> the country. The State has three geographical divisions namely<br />
Ladakh, Kashmir and Jammu. These regions are distinct in terms <strong>of</strong> culture, language<br />
and ethnicity. The Scheduled Castes are mainly concentrated in the Jammu region.<br />
According to 2001 census, the Scheduled Caste (SC) population <strong>of</strong> Jammu &<br />
Kashmir is 770,155 which form 7.6 per cent <strong>of</strong> the total population <strong>of</strong> the State. As the<br />
1991 census was not conducted in the State, decadal (1991-2001) growth rate <strong>of</strong><br />
population is not possible to work out. The growth <strong>of</strong> the Scheduled Caste population<br />
during 1981-2001 i.e. in a span <strong>of</strong> twenty years has been 54.9 per cent. Thirteen (13)<br />
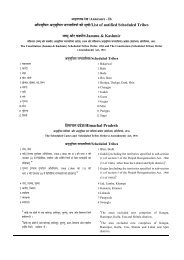
castes have been scheduled in respect <strong>of</strong> Jammu & Kashmir. All <strong>of</strong> them have been<br />
enumerated at the 2001 census.<br />
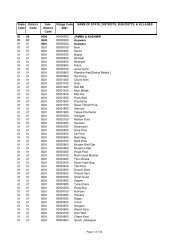
2. The SCs are overwhelmingly rural. As many as 82.6 per cent <strong>of</strong> them reside in<br />
rural areas. District wise distribution <strong>of</strong> the SC population shows that they have<br />
maximum concentration in Jammu with a share <strong>of</strong> 24.9 per cent, followed by<br />
Kathua(23.2 per cent) and Udhampur(19.1per cent). The districts <strong>of</strong> Kashmir region<br />
have returned a meagre SC population. Four districts <strong>of</strong> Kashmir region have recorded<br />
SC population below 500 . Of these, Kupwara and Pulwama districts have less than<br />
100 SCs each.<br />
Population : Size & Distribution<br />
3. Out <strong>of</strong> thirteen SCs, Megh is the most populous caste having a population <strong>of</strong><br />
300,980, constituting 39.1 per cent <strong>of</strong> the total SC population. They are followed by<br />
Chamar with 187,277 population (24.3 per cent) and Doom having a number <strong>of</strong> 159,908<br />
(20.8 per cent). These three SCs together constitute 84.2 per cent <strong>of</strong> the total SC<br />
population. Four SCs, namely Batwal, Barwala, Basith and Saryara with population<br />
ranging from 39,385 to 13,327 account for 12.9 per cent; remaining six castes along with<br />
generic castes constitute the residual 2.9 percent <strong>of</strong> the total SC population <strong>of</strong> the State.<br />
Among all the thirteen SCs, Watal is the smallest community having population below<br />
200.<br />
4. At district level, Megh, Chamar and Batwal are primarily concentrated in Jammu<br />
district. Dooms have the highest proportion <strong>of</strong> the total SC population in Kathua district.<br />
Sex Ratio<br />
5. The over all sex ratio <strong>of</strong> the SC population in Jammu & Kashmir is 910 females<br />
per 1000 males which is lower than the national average <strong>of</strong> 936 for the total SC<br />
population.
6. Among the larger groups, Megh have the highest sex ratio <strong>of</strong> 924, higher than<br />
the state average but lower than the national average. Remaining three major groups<br />
have sex ratio below the state and national averages both.<br />
7. The sex ratio among SC children in the age group 0-6 years.(899) is lower than<br />
that <strong>of</strong> all SCs at the national level. Among the major SCs, Doom have registered the<br />
highest child sex ratio (935) which is close to the national average (939), Chamar and<br />
Batwal have the child sex ratio below 900 showing that they have preference for male<br />
child over the female.<br />
Age group<br />
All SCs<br />
(<strong>India</strong> )<br />
Page 2 <strong>of</strong> 4<br />
Source: Office <strong>of</strong> the Registrar General, <strong>India</strong><br />
Statement - 1 : Sex Ratio<br />
All SCs<br />
(State)<br />
Megh Doom Chamar Batwal<br />
All ages 936 910 924 905 898 891<br />
0 – 6 yrs. 938 899 904 935 859 848<br />
Literacy & Educational Level<br />
8. The literacy rate (7 years & above) among the SCs is 59.0 per cent. This figure<br />
is higher than the national average <strong>of</strong> 54.7 per cent in respect <strong>of</strong> all SCs. Male and<br />
female literacy rates in respect <strong>of</strong> all SCs <strong>of</strong> the State (69.6 per cent and 47.5 per cent)<br />
are also higher than those recorded at the national level (66.6 per cent male literacy &<br />
41.9 per cent female literacy)<br />
9. Among the numerically larger castes, Chamars have registered the highest<br />
overall as well as female literacy rates.<br />
Statement - 2 : Literacy Rate<br />
Literacy Rate All SCs Chamar Batwal Megh Doom<br />
Persons 59.0 65.5 64.0 59.6 49.7<br />
Females 47.5 55.0 52.4 47.5 38.4<br />
10. Among the SC literates, 24.8 per cent are either without any educational level or<br />
have attained education below primary level. The primary level literates constitute 29 per<br />
cent <strong>of</strong> all literates. Literates up to middle school level have a share <strong>of</strong> 27.7 per cent.<br />
Literates who have attained education upto matric / secondary / higher secondary level<br />
are 16.3 per cent. This implies that every 6 th SC literate is a matriculate. Graduates &<br />
above are 2.1 per cent .<br />
11. Among the larger castes, Chamars have shown the highest proportion <strong>of</strong><br />
matriculates, followed by Megh. Doom have registered the lowest percentage <strong>of</strong><br />
matriculates preceded by Batwal.<br />
12. It may be discerned from the Statement -3 given below that there is a sharp<br />
decline in the percentage <strong>of</strong> literates from secondary level onwards. The percentage <strong>of</strong><br />
matriculates (12.7 per cent) is less than half <strong>of</strong> the middle level literates and the<br />
percentage <strong>of</strong> higher secondary literates is almost one fourth <strong>of</strong> that <strong>of</strong> matriculates.
Statement - 3 : Levels <strong>of</strong> Education among the major Scheduled Castes<br />
Names <strong>of</strong> SCs<br />
Literate<br />
without<br />
educational<br />
level<br />
Page 3 <strong>of</strong> 4<br />
Source: Office <strong>of</strong> the Registrar General, <strong>India</strong><br />
Below<br />
primary Primary Middle<br />
Educational levels attained<br />
Matric/Secondary<br />
Higher Secondary/<br />
Intermediate etc.<br />
Technical<br />
&Nontechnical<br />
diploma<br />
etc.<br />
Graduate<br />
and<br />
above<br />
All SCs 3.0 21.8 29.0 27.7 16.3 0.1 2.0<br />
Megh 3.1 21.7 28.4 28.6 16.1 0.0 2.0<br />
Chamar 2.4 17.9 26.3 28.8 21.3 0.1 3.2<br />
Doom 3.7 28.1 32.8 23.3 11.0 0.0 1.0<br />
Batwal 2.9 21.7 30.0 30.8 13.3 0.0 1.2<br />
13. Out <strong>of</strong> the total 1.9 lakh SC children in the age group 5-14 years, 1.4 lakh (69.8<br />
per cent) attend school. A large proportion <strong>of</strong> 30,2 per cent (58,930) children belonging<br />
to the same age group do not go to school. The Statement-4 given below shows that<br />
Batwal has the highest percentage <strong>of</strong> children attending school whereas Doom have the<br />
lowest (61per cent).<br />
Work Participation Rate (WPR)<br />
14. The Work Participation Rate (WPR) <strong>of</strong> the Scheduled Caste population is 36.7<br />
per cent which is less than that <strong>of</strong> all SCs recorded at the national level (40.4 per cent).<br />
While male WPR (50.3 per cent) is nearly equal to that <strong>of</strong> the national average (50.7 per<br />
cent), female WPR (21.7 per cent) is lower than that recorded by all SCs at the national<br />
level (29.4 per cent). Among the total workers, 68.4 per cent are main workers and this<br />
proportion is also lower than the national average recorded by all SCs (73 per cent).<br />
15. Among the major SCs, Megh have registered higher overall (37.2 per cent) as<br />
well as female WPR (23.5 per cent) than those <strong>of</strong> all SCs at the State level whereas<br />
Doom and Batwal have registered WPR less than those <strong>of</strong> the State average.<br />
Category <strong>of</strong> Workers<br />
Statement - 4 : Percentage <strong>of</strong> the school going children in the<br />
age group 5-14 yrs.<br />
Age<br />
Group<br />
All SCs Batwal Chamar Megh Doom<br />
5-14 yrs. 69.8 79.9 75.8 70.7 61<br />
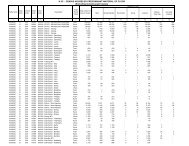
16. Almost half <strong>of</strong> total SC workers are engaged in cultivation and this percentage is<br />
more than twice that <strong>of</strong> the national average (20 per cent) in respect <strong>of</strong> all SCs. ‘Other<br />
Workers’ also have a significant share <strong>of</strong> 39.8 per cent showing higher proportion than<br />
that <strong>of</strong> the country (30.5 per cent). ‘Agricultural Labourers’ constitute 8.7 per cent which<br />
is significantly lower if compared with the national average (45.6 per cent). Workers in<br />
‘Household Industry’ account for 1.7 per cent only.
17. At the individual caste level, Megh and Chamar have maximum proportion <strong>of</strong><br />
‘Cultivators’ whereas Batwal and Doom have the highest percentage <strong>of</strong> ‘Other Workers’<br />
in their total working population.<br />
Marital Status<br />
18. The data on marital status show that 54.7 per cent persons among all SCs <strong>of</strong><br />
Jammu & Kashmir are ‘never married’. The ‘married’ persons constitute 41.7 per cent.<br />
‘Widowed’ persons constitute 3.4 per cent persons and a negligible 0.2 per cent persons<br />
are ‘divorced & separated’.<br />
19. The marriages <strong>of</strong> girls and boys below the stipulated age for each are not<br />
common in Jammu & Kashmir. The proportion <strong>of</strong> married girls below 18 years (1.8 per<br />
cent) and boys below 21 years (1.7 per cent) are significantly lower than those at the<br />
national level (2.8 per cent and 3.1 per cent).<br />
20. The mean number <strong>of</strong> children ever born per ever married SC woman (45 – 49<br />
years) is 5 which is higher than that <strong>of</strong> all SCs at national level (4).<br />
Religion<br />
Statement - 5 : Percentage distribution <strong>of</strong> Workers in four Economic<br />
Categories<br />
Economic<br />
category<br />
All Scheduled<br />
Castes<br />
21. Hinduism is the predominant religion <strong>of</strong> the Scheduled Castes (98.7 per cent) <strong>of</strong><br />
Jammu & Kashmir. The SCs pr<strong>of</strong>essing Sikhism are 1.3 percent (10,159). Buddhist<br />
SCs are 194 only.<br />
Page 4 <strong>of</strong> 4<br />
Source: Office <strong>of</strong> the Registrar General, <strong>India</strong><br />
Megh Chamar Doom Batwal<br />
Cultivators 49.7 56 46.6 42.2 26.4<br />
Agricultural<br />
Labourers<br />
8.7 7.8 6.6 10.9 22.5<br />
HHI Workers 1.7 1.5 1.6 2.4 2<br />
Other Workers 39.8 34.6 45.2 44.5 49.1<br />
_________