Canadian Packaging Machinery Market Research Report - PMMI
Canadian Packaging Machinery Market Research Report - PMMI
Canadian Packaging Machinery Market Research Report - PMMI

You also want an ePaper? Increase the reach of your titles
YUMPU automatically turns print PDFs into web optimized ePapers that Google loves.
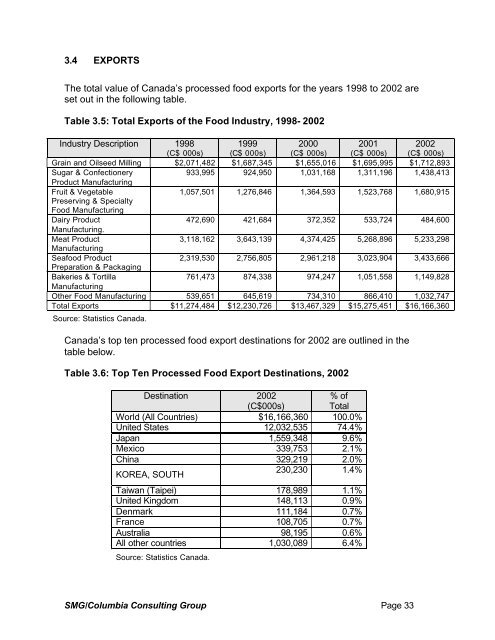
3.4 EXPORTS<br />
The total value of Canada’s processed food exports for the years 1998 to 2002 are<br />
set out in the following table.<br />
Table 3.5: Total Exports of the Food Industry, 1998- 2002<br />
Industry Description 1998 1999 2000 2001 2002<br />
(C$ 000s) (C$ 000s) (C$ 000s) (C$ 000s) (C$ 000s)<br />
Grain and Oilseed Milling $2,071,482 $1,687,345 $1,655,016 $1,695,995 $1,712,893<br />
Sugar & Confectionery<br />
Product Manufacturing<br />
933,995 924,950 1,031,168 1,311,196 1,438,413<br />
Fruit & Vegetable<br />
Preserving & Specialty<br />
Food Manufacturing<br />
1,057,501 1,276,846 1,364,593 1,523,768 1,680,915<br />
Dairy Product<br />
Manufacturing.<br />
472,690 421,684 372,352 533,724 484,600<br />
Meat Product<br />
Manufacturing<br />
3,118,162 3,643,139 4,374,425 5,268,896 5,233,298<br />
Seafood Product<br />
Preparation & <strong>Packaging</strong><br />
2,319,530 2,756,805 2,961,218 3,023,904 3,433,666<br />
Bakeries & Tortilla<br />
Manufacturing<br />
761,473 874,338 974,247 1,051,558 1,149,828<br />
Other Food Manufacturing 539,651 645,619 734,310 866,410 1,032,747<br />
Total Exports $11,274,484 $12,230,726 $13,467,329 $15,275,451 $16,166,360<br />
Source: Statistics Canada.<br />
Canada’s top ten processed food export destinations for 2002 are outlined in the<br />
table below.<br />
Table 3.6: Top Ten Processed Food Export Destinations, 2002<br />
Destination 2002<br />
% of<br />
(C$000s) Total<br />
World (All Countries) $16,166,360 100.0%<br />
United States 12,032,535 74.4%<br />
Japan 1,559,348 9.6%<br />
Mexico 339,753 2.1%<br />
China 329,219 2.0%<br />
KOREA, SOUTH<br />
230,230 1.4%<br />
Taiwan (Taipei) 178,989 1.1%<br />
United Kingdom 148,113 0.9%<br />
Denmark 111,184 0.7%<br />
France 108,705 0.7%<br />
Australia 98,195 0.6%<br />
All other countries 1,030,089 6.4%<br />
Source: Statistics Canada.<br />
SMG/Columbia Consulting Group Page 33