DesignCon 2002
DesignCon 2002
DesignCon 2002

You also want an ePaper? Increase the reach of your titles
YUMPU automatically turns print PDFs into web optimized ePapers that Google loves.
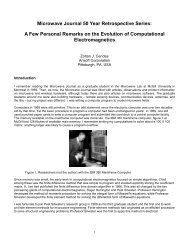
Figure 19: Post-layout results for the extracted Switch-Backplane-Blade channel extracted from<br />
SIwave<br />
using VerifEye analysis with 8 taps of FFE and 3 taps of DFE at the receiver.<br />
Measured Analysis<br />
To determine if the simulated solution space was representative of the actual design an<br />
end-to-end frequency domain channel measurement was made and the measured<br />
Touchstone file was used to determine the channel BER using the statistical simulation<br />
tool. The measurement methodology used Gore 3.5 mm (EN0CB0CA036) cables along<br />
with a 3.5 mm to SMP adapter cable (Rosenberger 101076-4604) that allowed mating to<br />
the female SMP connectors on the Switch and Blade. A SOLT calibration was performed<br />
on an Agilent E8361A PNA with an N4421BH67 test switch up to 20 GHz to the end of<br />
the Gore cables and therefore did not calibrate out the 3.5 mm to SMP adapter cable. This<br />
adapter cable has not been taken into consideration in any of the simulations. The<br />
measurement was taken from 10 MHz to 10 GHz with a frequency step of 10 MHz. The<br />
authors realize this measurement methodology will not provide the most accurate data.<br />
However, given the physical size and constraints of the entire system which included:<br />
three PWBs along (Switch, Backplane, and Blade), a right angle connector, and a left<br />
angle connector the measurement setup was considered sufficient. The awkwardness of<br />
the physical setup precluded the use of RF probes with which extremely accurate<br />
measurements could have been made. Due to limitations in the measurement setup the<br />
authors limited the upper frequency of the measurement to 10 GHz and believe error<br />
introduction started to become a factor beyond 6 GHz.<br />
The measured .s4p file was imported into the circuit simulator tool and then simulated<br />
using VerifEye with 8 taps of FFE and 3 taps of DFE at the receiver. Comparing the pre-<br />
and post-layout simulations to the measured channel .s4p simulation good correlation was<br />
obtained. For a BER of 1x10 -12 the measured s-parameters yielded an eye opening of 43<br />
ps where the pre- and post-layout simulations yielded eye opening of 49 ps and 51ps<br />
respectively. The authors believe even better correlation can be obtained by incorporating<br />
the actual VHDM connector model and obtaining better measurement results up to 15<br />
GHz for the simulation. However, despite these anomalies good correlation (8 ps for a<br />
BER of 1x10 -12 ) was achieved. These results have been used in defining an operating<br />
BladeServer KR channel (5 GHz or 10 Gb/s) which includes over 26 inches of FR4 with<br />
very large via stubs (up to 125 mils) within the channel and an additional four 50 mil via<br />
stubs to support the measurement methodology.