Chapter 4 Networks in Their Surrounding Contexts - Cornell University
Chapter 4 Networks in Their Surrounding Contexts - Cornell University
Chapter 4 Networks in Their Surrounding Contexts - Cornell University

You also want an ePaper? Increase the reach of your titles
YUMPU automatically turns print PDFs into web optimized ePapers that Google loves.
106 CHAPTER 4. NETWORKS IN THEIR SURROUNDING CONTEXTS<br />
Selection: rapid<br />
<strong>in</strong>crease <strong>in</strong> similarity<br />
before first contact<br />
Social <strong>in</strong>fluence:<br />
cont<strong>in</strong>ued slower<br />
<strong>in</strong>crease <strong>in</strong> similarity<br />
after first contact<br />
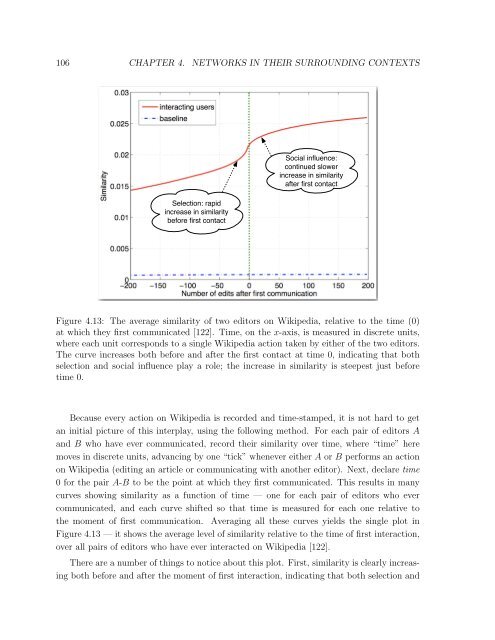
Figure 4.13: The average similarity of two editors on Wikipedia, relative to the time (0)<br />
at which they first communicated [122]. Time, on the x-axis, is measured <strong>in</strong> discrete units,<br />
where each unit corresponds to a s<strong>in</strong>gle Wikipedia action taken by either of the two editors.<br />
The curve <strong>in</strong>creases both before and after the first contact at time 0, <strong>in</strong>dicat<strong>in</strong>g that both<br />
selection and social <strong>in</strong>fluence play a role; the <strong>in</strong>crease <strong>in</strong> similarity is steepest just before<br />
time 0.<br />
Because every action on Wikipedia is recorded and time-stamped, it is not hard to get<br />
an <strong>in</strong>itial picture of this <strong>in</strong>terplay, us<strong>in</strong>g the follow<strong>in</strong>g method. For each pair of editors A<br />
and B who have ever communicated, record their similarity over time, where “time” here<br />
moves <strong>in</strong> discrete units, advanc<strong>in</strong>g by one “tick” whenever either A or B performs an action<br />
on Wikipedia (edit<strong>in</strong>g an article or communicat<strong>in</strong>g with another editor). Next, declare time<br />
0 for the pair A-B to be the po<strong>in</strong>t at which they first communicated. This results <strong>in</strong> many<br />
curves show<strong>in</strong>g similarity as a function of time — one for each pair of editors who ever<br />
communicated, and each curve shifted so that time is measured for each one relative to<br />
the moment of first communication. Averag<strong>in</strong>g all these curves yields the s<strong>in</strong>gle plot <strong>in</strong><br />
Figure 4.13 — it shows the average level of similarity relative to the time of first <strong>in</strong>teraction,<br />
over all pairs of editors who have ever <strong>in</strong>teracted on Wikipedia [122].<br />
There are a number of th<strong>in</strong>gs to notice about this plot. First, similarity is clearly <strong>in</strong>creas<strong>in</strong>g<br />
both before and after the moment of first <strong>in</strong>teraction, <strong>in</strong>dicat<strong>in</strong>g that both selection and