VINCI - 2005 annual report
VINCI - 2005 annual report VINCI - 2005 annual report
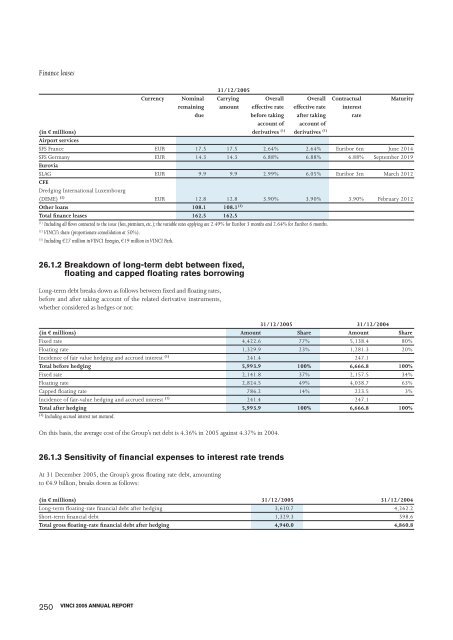
Finance leases 31/12/2005 Currency Nominal Carrying Overall Overall Contractual Maturity remaining amount effective rate effective rate interest due before taking after taking rate account of account of (in € millions) derivatives (1) derivatives (1) Airport services SFS France EUR 17.5 17.5 2.64% 2.64% Euribor 6m June 2014 SFS Germany EUR 14.3 14.3 6.88% 6.88% 6.88% September 2019 Eurovia SLAG EUR 9.9 9.9 2.99% 6.05% Euribor 3m March 2012 CFE Dredging International Luxembourg (DEME) (2) EUR 12.8 12.8 3.90% 3.90% 3.90% February 2012 Other loans 108.1 108.1 (3) Total finance leases 162.5 162.5 (1) Including all flows connected to the issue (fees, premium, etc.); the variable rates applying are 2.49% for Euribor 3 months and 2.64% for Euribor 6 months. (2) VINCI’s share (proportionate consolidation at 50%). (3) Including €27 million in VINCI Energies, €19 million in VINCI Park. 26.1.2 Breakdown of long-term debt between fixed, floating and capped floating rates borrowing Long-term debt breaks down as follows between fixed and floating rates, before and after taking account of the related derivative instruments, whether considered as hedges or not: 31/12/2005 31/12/2004 (in € millions) Amount Share Amount Share Fixed rate 4,422.6 77% 5,138.4 80% Floating rate 1,329.9 23% 1,281.3 20% Incidence of fair value hedging and accrued interest (1) 241.4 247.1 Total before hedging 5,993.9 100% 6,666.8 100% Fixed rate 2,141.8 37% 2,157.5 34% Floating rate 2,824.5 49% 4,038.7 63% Capped floating rate 786.2 14% 223.5 3% Incidence of fair-value hedging and accrued interest (1) 241.4 247.1 Total after hedging 5,993.9 100% 6,666.8 100% (1) Including accrued interest not matured. On this basis, the average cost of the Group’s net debt is 4.36% in 2005 against 4.37% in 2004. 26.1.3 Sensitivity of financial expenses to interest rate trends At 31 December 2005, the Group’s gross floating rate debt, amounting to €4.9 billion, breaks down as follows: (in € millions) 31/12/2005 31/12/2004 Long-term floating-rate financial debt after hedging 3,610.7 4,262.2 Short-term financial debt 1,329.3 598.6 Total gross floating-rate financial debt after hedging 4,940.0 4,860.8 250 VINCI 2005 ANNUAL REPORT
Based on this position, a 1% increase in interest rates would generate extra financial expenses of €49 million. Such an increase in interest rates would conversely also result in comparable greater income from the Group’s cash surpluses, which amounted to 5.5 billion at 31 December 2005. 26.2 LIQUIDITY AND FINANCIAL RATINGS 26.2.1 Liquidity position The Group’s liquidity position at 31 December 2005 was €9.4 billion, taking account of cash and cash-management financial assets of €5.4 billion and unused credit facilities of €4 billion (see detail in Note 25.3.1 and 25.3.2). 26.2.2 Management of liquidity risk and maturity of financial debt In connection with the management of liquidity risk, the Group analyses the average maturity of its debt at more than one year by type of activity financed. At 31 December 2005, the average maturity of the Group’s financial debt is 7.4 years (against 8.1 years at 31 December 2004). The average maturity CONSOLIDATED FINANCIAL STATEMENTS Also, at 31 December 2005, derivatives that are not considered as hedges for accounting purposes amount to €4.6 million at market value; for a uniform increase of 1% in interest rates, the market value would rise by €2 million. Unused commercial paper at 31 December 2005 amounts to €657 million (see Note 25.3.1). is 3.4 years for VINCI SA, 8.8 years for the Concessions and Services division and 3.2 years for the rest of the Group. The VINCI Group’s financial debts break down as follows by maturity: 31/12/2005 31/12/2004 VINCI SA Concessions Other Total Total (in € millions) and services business lines Accrued interest not matured 26.3 57.5 1.1 84.8 Maturing in less than one year 0.5 311.0 177.5 489.1 511.2 Current part of financial debt at redemption value 26.8 368.5 178.6 573.8 511.2 Maturing in more than 1 year and not after 2 years (at redemption value) 1.1 371.4 63.7 436.3 342.7 Maturing in more than 2 years and not after 5 years (at redemption value) 1,002.0 882.0 171.0 2,055.0 2,287.8 Maturing in more than 5 years and not after 10 years (at redemption value) 369.5 82.0 451.6 355.7 Maturing after 10 years (at redemption value) 2,303.8 18.7 2,322.6 1,937.9 Non-current part of financial debt 1,003.1 3,926.8 335.6 5,265.5 4,924.1 Impact of amortised cost and adjustment of fair value of debt 26.0 129.1 (0.5) 154.6 133.5 Financial debt (excluding OCEANE) 1,055.9 4,424.4 513.7 5,993.9 5,568.8 251
- Page 203 and 204: Joint venture partnerships created
- Page 205 and 206: - when borrowing is not intended to
- Page 207 and 208: Cash management financial assets Ca
- Page 209 and 210: - Hedge of a net investment in a fo
- Page 211 and 212: 1.2.2 Breakdown of revenue by locat
- Page 213 and 214: FY 2004 CONSOLIDATED FINANCIAL STAT
- Page 215 and 216: FY 2004 CONSOLIDATED FINANCIAL STAT
- Page 217 and 218: 4. SEGMENT INFORMATION BY GEOGRAPHI
- Page 219 and 220: 5.3 SHARE-BASED PAYMENTS The expens
- Page 221 and 222: The income arising in the period fr
- Page 223 and 224: E. NOTES TO THE BALANCE SHEET 10. I
- Page 225 and 226: 12.2 IMPAIRMENT LOSSES ON OTHER NON
- Page 227 and 228: CONSOLIDATED FINANCIAL STATEMENTS 1
- Page 229 and 230: 15. LEASED ASSETS Property, plant a
- Page 231 and 232: CONSOLIDATED FINANCIAL STATEMENTS 1
- Page 233 and 234: 20. CONSTRUCTION CONTRACTS 20.1 FIN
- Page 235 and 236: The changes in capital in 2005 brea
- Page 237 and 238: CONSOLIDATED FINANCIAL STATEMENTS I
- Page 239 and 240: CONSOLIDATED FINANCIAL STATEMENTS 2
- Page 241 and 242: Changes in the period CONSOLIDATED
- Page 243 and 244: 24. PROVISIONS During the period, c
- Page 245 and 246: By business line, the analysis of n
- Page 247 and 248: . Other bonds Other bonds break dow
- Page 249 and 250: d. Finance leases The table below s
- Page 251 and 252: 25.3.2 Cash and cash management fin
- Page 253: CONSOLIDATED FINANCIAL STATEMENTS T
- Page 257 and 258: 26.3.3 Analysis of other foreign cu
- Page 259 and 260: 28. TRANSACTIONS WITH RELATED PARTI
- Page 261 and 262: The maturities of contractual oblig
- Page 263 and 264: 31. REMUNERATION AND RELATED BENEFI
- Page 265 and 266: promissory notes issued by Intertou
- Page 267 and 268: CONSOLIDATED FINANCIAL STATEMENTS I
- Page 269 and 270: (h) Reclassification under operatin
- Page 271 and 272: 1.5 SUMMARIES OF IMPACTS OF RESTATE
- Page 273 and 274: 2.3.2 Goodwill CONSOLIDATED FINANCI
- Page 275 and 276: 2.3.6 Fair value of derivatives CON
- Page 277 and 278: 2.4 RECONCILIATION OF BALANCE SHEET
- Page 279 and 280: 2.4.6 Trade and other current payab
- Page 281 and 282: CONSOLIDATED FINANCIAL STATEMENTS 4
- Page 283 and 284: K. MAIN CONSOLIDATED COMPANIES AT 3
- Page 285 and 286: CONSOLIDATED FINANCIAL STATEMENTS C
- Page 287 and 288: CONSOLIDATED FINANCIAL STATEMENTS R
- Page 289 and 290: 1.3 OTHER FINANCIAL TRANSACTIONS Th
- Page 291 and 292: 3.2 EQUITY PARENT COMPANY FINANCIAL
- Page 293 and 294: 5. NET FINANCIAL DEBT The holding c
- Page 295 and 296: PARENT COMPANY FINANCIAL STATEMENTS
- Page 297 and 298: PARENT COMPANY FINANCIAL STATEMENTS
- Page 299 and 300: PARENT COMPANY FINANCIAL STATEMENTS
- Page 301 and 302: Meeting are determined by the Share
- Page 303 and 304: 3. INFORMATION ON VINCI’S SHARE C
Finance leases<br />
31/12/<strong>2005</strong><br />
Currency Nominal Carrying Overall Overall Contractual Maturity<br />
remaining amount effective rate effective rate interest<br />
due before taking after taking rate<br />
account of account of<br />
(in € millions) derivatives (1) derivatives (1)<br />
Airport services<br />
SFS France EUR 17.5 17.5 2.64% 2.64% Euribor 6m June 2014<br />
SFS Germany EUR 14.3 14.3 6.88% 6.88% 6.88% September 2019<br />
Eurovia<br />
SLAG EUR 9.9 9.9 2.99% 6.05% Euribor 3m March 2012<br />
CFE<br />
Dredging International Luxembourg<br />
(DEME) (2) EUR 12.8 12.8 3.90% 3.90% 3.90% February 2012<br />
Other loans 108.1 108.1 (3)<br />
Total finance leases 162.5 162.5<br />
(1) Including all flows connected to the issue (fees, premium, etc.); the variable rates applying are 2.49% for Euribor 3 months and 2.64% for Euribor 6 months.<br />
(2) <strong>VINCI</strong>’s share (proportionate consolidation at 50%).<br />
(3) Including €27 million in <strong>VINCI</strong> Energies, €19 million in <strong>VINCI</strong> Park.<br />
26.1.2 Breakdown of long-term debt between fixed,<br />
floating and capped floating rates borrowing<br />
Long-term debt breaks down as follows between fixed and floating rates,<br />
before and after taking account of the related derivative instruments,<br />
whether considered as hedges or not:<br />
31/12/<strong>2005</strong> 31/12/2004<br />
(in € millions) Amount Share Amount Share<br />
Fixed rate 4,422.6 77% 5,138.4 80%<br />
Floating rate 1,329.9 23% 1,281.3 20%<br />
Incidence of fair value hedging and accrued interest (1) 241.4 247.1<br />
Total before hedging 5,993.9 100% 6,666.8 100%<br />
Fixed rate 2,141.8 37% 2,157.5 34%<br />
Floating rate 2,824.5 49% 4,038.7 63%<br />
Capped floating rate 786.2 14% 223.5 3%<br />
Incidence of fair-value hedging and accrued interest (1) 241.4 247.1<br />
Total after hedging 5,993.9 100% 6,666.8 100%<br />
(1) Including accrued interest not matured.<br />
On this basis, the average cost of the Group’s net debt is 4.36% in <strong>2005</strong> against 4.37% in 2004.<br />
26.1.3 Sensitivity of financial expenses to interest rate trends<br />
At 31 December <strong>2005</strong>, the Group’s gross floating rate debt, amounting<br />
to €4.9 billion, breaks down as follows:<br />
(in € millions) 31/12/<strong>2005</strong> 31/12/2004<br />
Long-term floating-rate financial debt after hedging 3,610.7 4,262.2<br />
Short-term financial debt 1,329.3 598.6<br />
Total gross floating-rate financial debt after hedging 4,940.0 4,860.8<br />
250<br />
<strong>VINCI</strong> <strong>2005</strong> ANNUAL REPORT


