

burden of deforestation, desertification, erosion of ... - Social Watch
burden of deforestation, desertification, erosion of ... - Social Watch
burden of deforestation, desertification, erosion of ... - Social Watch

Create successful ePaper yourself
Turn your PDF publications into a flip-book with our unique Google optimized e-Paper software.
Country performance on the serf Index 8<br />
The Core SERF Index can be calculated for 99 countries<br />
and the Supplementary SERF Index for High<br />
Income OECD Countries can be calculated for an additional<br />
24 countries. The Component Right Indices<br />
can be calculated for a significantly larger number<br />
<strong>of</strong> countries. In the case <strong>of</strong> the Core SERF Index,<br />
the Right to Food, Education, Health, Housing, and<br />
Work Indices can be calculated for 123, 145, 131,<br />
144, and 118 countries, respectively. With regard<br />
to the Supplementary Index it can be calculated for<br />
and 28, 27, 28, and 25 countries in the case <strong>of</strong> the<br />
Right to Food, Education, Health, and Work Indices,<br />
respectively.<br />
The extent to which countries honor their<br />
commitments to fulfill economic and social rights<br />
obligations varies widely. None <strong>of</strong> the countries<br />
for which either the Core or Supplementary SERF<br />
Index can be calculated succeeds in fully meeting<br />
its commitments with regard to all economic and<br />
social rights simultaneously. The best performing<br />
core country, Uruguay, achieves a score <strong>of</strong> just over<br />
94% on the SERF Index while the best performing<br />
OECD country, Finland, achieves a score just shy <strong>of</strong><br />
95%. Although a number <strong>of</strong> countries fully meet their<br />
commitments with regard to specific economic and<br />
social rights, other countries fall far short <strong>of</strong> meeting<br />
any <strong>of</strong> their commitment with regard to each <strong>of</strong> the<br />
five economic and social rights. Equatorial Guinea<br />
scores 20% on the SERF Index and its scores on<br />
the component right indices range from just above<br />
3% to just under 29%. The mean score on the Core<br />
SERF Index is just shy <strong>of</strong> 72%; it is substantially<br />
higher, just under 90%, on the Supplementary Index<br />
for high income OECD countries. There is variation<br />
in the mean score across the different component<br />
right indices. For core countries, the range is 71% to<br />
79% for the right to food and the right to education,<br />
respectively. For high income OECD countries, the<br />
range is larger—62% to nearly 98% for the right to<br />
work and education, respectively. What is clear is that<br />
there is considerable room for improvement for most<br />
countries. The Economic and <strong>Social</strong> Rights Empowerment<br />
Initiative’s website, www.serfindex.org/data,<br />
provides downloadable spread sheets showing each<br />
country’s performance on the SERF and component<br />
right indices.<br />
shedding light on important policy questions:<br />
virtuous and vicious cycles<br />
The ICESCR commits countries to devote “the<br />
maximum <strong>of</strong> available resources” to enhancing the<br />
enjoyment <strong>of</strong> economic and social rights. A key<br />
question is whether countries that honor this commitment<br />
do so at the expense <strong>of</strong> generating additional<br />
resources that could enable even greater<br />
enjoyment <strong>of</strong> economic and social rights in the future.<br />
A recent application <strong>of</strong> the SERF methodology,<br />
8 The results presented here are for the most recent version<br />
<strong>of</strong> the dataset (International SERF Index Dataset Version<br />
2011.1 available at ). This version<br />
reflects several refinements over the version reported on<br />
in Randolph, Fukuda-Parr, and Lawson-Remer, “Economic<br />
and <strong>Social</strong> Rights Fulfillment Index: Country Scores and<br />
Rankings,” Journal <strong>of</strong> Human Rights, 9: 230-61, (2010).<br />
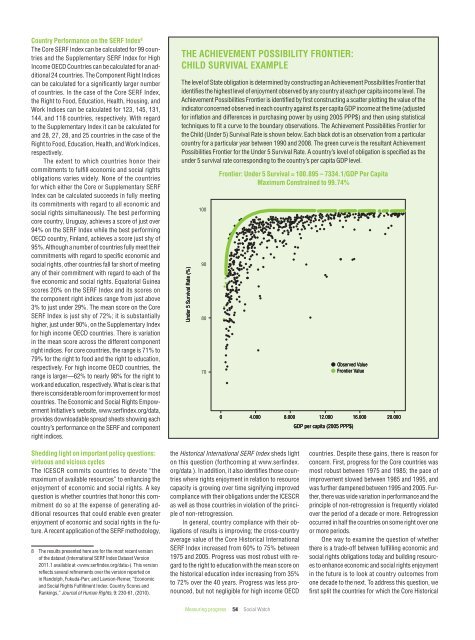
The aChIevemenT possIBIlITy fronTIer:<br />
ChIld survIval example<br />
The level <strong>of</strong> State obligation is determined by constructing an Achievement Possibilities Frontier that<br />
identifies the highest level <strong>of</strong> enjoyment observed by any country at each per capita income level. The<br />
Achievement Possibilities Frontier is identified by first constructing a scatter plotting the value <strong>of</strong> the<br />
indicator concerned observed in each country against its per capita GDP income at the time (adjusted<br />
for inflation and differences in purchasing power by using 2005 PPP$) and then using statistical<br />
techniques to fit a curve to the boundary observations. The Achievement Possibilities Frontier for<br />
the Child (Under 5) Survival Rate is shown below. Each black dot is an observation from a particular<br />
country for a particular year between 1990 and 2008. The green curve is the resultant Achievement<br />
Possibilities Frontier for the Under 5 Survival Rate. A country’s level <strong>of</strong> obligation is specified as the<br />
under 5 survival rate corresponding to the country’s per capita GDP level.<br />
Under 5 Survival Rate (%)<br />
100<br />
90<br />
80<br />
70<br />
frontier: under 5 survival = 100.895 – 7334.1/gdp per Capita<br />
maximum Constrained to 99.74%<br />
0 4.000 8.000<br />
the Historical International SERF Index sheds light<br />
on this question (forthcoming at www.serfindex.<br />
org/data ). In addition, it also identifies those countries<br />
where rights enjoyment in relation to resource<br />
capacity is growing over time signifying improved<br />
compliance with their obligations under the ICESCR<br />
as well as those countries in violation <strong>of</strong> the principle<br />
<strong>of</strong> non-retrogression.<br />
In general, country compliance with their obligations<br />
<strong>of</strong> results is improving; the cross-country<br />
average value <strong>of</strong> the Core Historical International<br />
SERF Index increased from 60% to 75% between<br />
1975 and 2005. Progress was most robust with regard<br />
to the right to education with the mean score on<br />
the historical education index increasing from 35%<br />
to 72% over the 40 years. Progress was less pronounced,<br />
but not negligible for high income OECD<br />
Measuring progress 54 <strong>Social</strong> <strong>Watch</strong><br />
Observed Value<br />
Frontier Value<br />
12.000 16.000 20.000<br />
GDP per capita (2005 PPP$)<br />
countries. Despite these gains, there is reason for<br />
concern. First, progress for the Core countries was<br />
most robust between 1975 and 1985; the pace <strong>of</strong><br />
improvement slowed between 1985 and 1995, and<br />
was further dampened between 1995 and 2005. Further,<br />
there was wide variation in performance and the<br />
principle <strong>of</strong> non-retrogression is frequently violated<br />
over the period <strong>of</strong> a decade or more. Retrogression<br />
occurred in half the countries on some right over one<br />
or more periods.<br />
One way to examine the question <strong>of</strong> whether<br />
there is a trade-<strong>of</strong>f between fulfilling economic and<br />
social rights obligations today and building resources<br />
to enhance economic and social rights enjoyment<br />
in the future is to look at country outcomes from<br />
one decade to the next. To address this question, we<br />
first split the countries for which the Core Historical


