Group structure - BWT Group
Group structure - BWT Group Group structure - BWT Group
Management Report 1999 The financial result worsened from € –1.6 million during 1998 to € –4.1 million. The main part of the worsening is due to the negative result of Christ AG which is an associate consolidated at equity. The increase in interest payments of around € 0.6 million is largely due to the first-time consolidation of the Van der Molen Group. The result from ordinary operating activities amounted to € 15.1 million and is lower than last year, chiefly due to the decrease in financial earnings by 18.8% compared with the previous year (€ 18.6 million). Due to a slight increase in the tax burden to 24%, profit for the year decreased from € 14.4 million to € 11.6 million, a decrease of 18.9%. Without the negative impact of the extraordinary depreciation and the result of the Christ participation, profit for the year would have increased by 7.8% compared with the business year 1998. At group parent company level, BWT AG reduced operating profits from € 4.9 million to € 4.6 million, with financial earnings lowered from € 3.1 million to 0.1 million, as a result of a decrease in subsidiaries’ dividend payouts. As a result, earnings from ordinary operating activities were reduced from € 8.0 million to € 4.5 million and profit for the year fell from € 7.6 million to € 4.3 million. – 36 – Operating earnings (in € million) 19,2 20,2 1999 1998 Earnings from ordinary activities (EGT) (in € million) 15,1 1999 Profit for the year (in € million) 11,6 1999 18,6 1998 14,4 1998
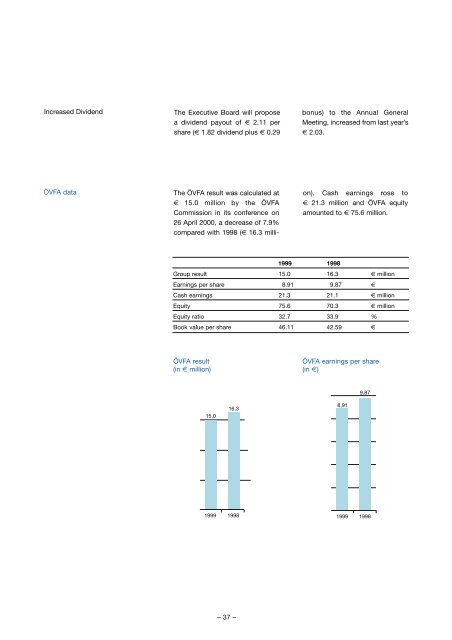
Increased Dividend The Executive Board will propose a dividend payout of € 2.11 per share (€ 1.82 dividend plus € 0.29 ÖVFA data The ÖVFA result was calculated at € 15.0 million by the ÖVFA Commission in its conference on 26 April 2000, a decrease of 7.9% compared with 1998 (€ 16.3 milli- ÖVFA result (in € million) 15,0 1999 16,3 1998 – 37 – bonus) to the Annual General Meeting, increased from last year’s € 2.03. on). Cash earnings rose to € 21.3 million and ÖVFA equity amounted to € 75.6 million. 1999 1998 Group result 15.0 16.3 € million Earnings per share 8.91 9.87 € Cash earnings 21.3 21.1 € million Equity 75.6 70.3 € million Equity ratio 32.7 33.9 % Book value per share 46.11 42.59 € ÖVFA earnings per share (in €) 8,91 1999 9,87 1998
- Page 1 and 2: ANNUAL REPORT 1999
- Page 3 and 4: Group structure (as of 31.12.1999)
- Page 5 and 6: BWT Group: Locations Headquarters B
- Page 7 and 8: Locations of the Christ Group SWITZ
- Page 9 and 10: Cash flow rose by 3.7% to € 21.7
- Page 11 and 12: s largest ology Group TER • PROCE
- Page 13 and 14: BWT-Value-Strategie Vision BWT - a
- Page 15 and 16: Members of the Executive and the Su
- Page 17 and 18: Water Life source for mankind - bus
- Page 19 and 20: BWT Business Areas Domestic Water T
- Page 21 and 22: BWT Business Areas Commercial and I
- Page 23 and 24: BWT Business Areas Project engineer
- Page 25 and 26: BWT Business Areas Swimming Pool Te
- Page 27 and 28: BWT Business Areas Turnover was inc
- Page 29 and 30: All prices in € Stock market rele
- Page 31 and 32: Management Report 1999 Turnover ris
- Page 33 and 34: Management Report 1999 Economic fra
- Page 35 and 36: Overview of the Sector Construction
- Page 37: Order book € 72 million, + 27.4 %
- Page 41 and 42: Investments 1999, a year of strong
- Page 43 and 44: Outlook for 2000 Target for 2000: G
- Page 45 and 46: Highlights of the year 1999 AQA tot
- Page 47 and 48: Alliance with the Japanese Nomura M
Increased Dividend The Executive Board will propose<br />
a dividend payout of € 2.11 per<br />
share (€ 1.82 dividend plus € 0.29<br />
ÖVFA data The ÖVFA result was calculated at<br />
€ 15.0 million by the ÖVFA<br />
Commission in its conference on<br />
26 April 2000, a decrease of 7.9%<br />
compared with 1998 (€ 16.3 milli-<br />
ÖVFA result<br />
(in € million)<br />
15,0<br />
1999<br />
16,3<br />
1998<br />
– 37 –<br />
bonus) to the Annual General<br />
Meeting, increased from last year’s<br />
€ 2.03.<br />
on). Cash earnings rose to<br />
€ 21.3 million and ÖVFA equity<br />
amounted to € 75.6 million.<br />
1999 1998<br />
<strong>Group</strong> result 15.0 16.3 € million<br />
Earnings per share 8.91 9.87 €<br />
Cash earnings 21.3 21.1 € million<br />
Equity 75.6 70.3 € million<br />
Equity ratio 32.7 33.9 %<br />
Book value per share 46.11 42.59 €<br />
ÖVFA earnings per share<br />
(in €)<br />
8,91<br />
1999<br />
9,87<br />
1998


