Hydrologic data, 1965 - Department of Water Resources - State of ...
Hydrologic data, 1965 - Department of Water Resources - State of ... Hydrologic data, 1965 - Department of Water Resources - State of ...
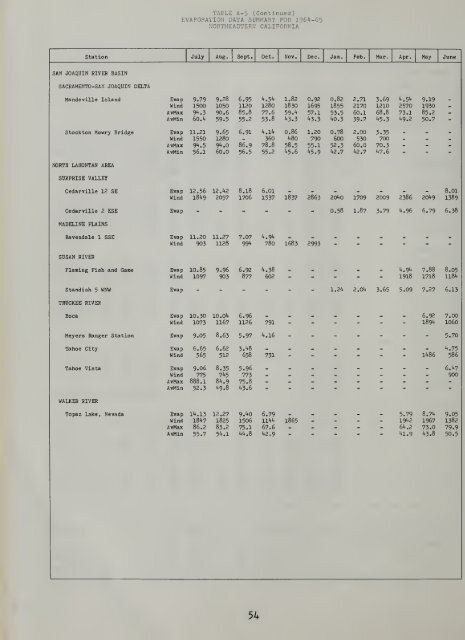
TABLE A-5 (Continued) EVAPORATION DATA SUMMARY FOR 1964-65 NORTHEASTERN CALIFORNIA Station July Aug. Sept. Oct. Nov. Dec. Jan Apr. May June SAN JOAQUIN RIVER BASIN SACRAMENTO-SAN JOAQUIN DELTA Mandeville Island Stockton Mowry Bridge NORTH LAHONTAN AREA SURPRISE VALLEY Cedarville 12 SE Cedarville 2 ESE MADELINE PLAINS Ravendale 1 SSE SUSAN RIVER Fleming Fish and Game Standish 5 WNW TRUCKEE RIVER Evap
station SACRAMENTO RIVER 3ASI? FEATHER RIVER Bucks Lake Cascade Lake Wilenor YUDA-BEAR RIVERS Camptonville RS Challenge RS Deer Creek PH Drum Forebay Lake Spauldinp, AMERICAN HIVER Blue Canyon WB AP El Dorado PH Foresthill RS Georgetown RS Iowa Hill Mount Danahcr RS Pacific House Twin Lakes ache c: Lakeport PUTAH CREEK i Middletown 7 NW ;iORTH LAKOf.'TAN ARE, TRUCKEE RIVER Tahoe City December 1964 Maximum of Record December 1964 Maximum of Record December 1 9 6 if Maximum of Record December 1964 Maximum of Record December 196*4 Maximum of Record December 1964 Maximum of Record December 1964 Maximum of Record December 1964 Maximum of Record December 1964 Maximum of Record December 1964 Maximum of Record December 1964 Maximum of Record December 1964 Maximum of Record December 1964 Maximum of Record December 1964 Maximum of Record December 1964 Maximum of Record December 1964 Maximum of Record December 1964 Maximum of Record December 1964 Maximum of Record December 1964 Maximum of Record TABLE A-6 EXTREME PRECIPITATION DATA FOR STORM OP DECEMBER 17-26, 1964 FOR SELECTED STATIONS NORTHEASTERN CALIFORNIA Inches of Precipitation for Indicated Number of Consecutive Days 10.78 10.26 17.98 17.08 22.27 24.44 29.23 20.95 21.75 24.49 32.59 28.59 10 35.72 29.55 11.34 22.26 28.22 32.63 36.75 41.52 44.69 5.65 9.60 10.28 12.18 13.68 15.32 15.51 6.07 9.58 10.73 11.81 15.11 15-93 18.90 8.83 9.06 8.65 9.93 8.98 8.78 6.01 6.78 11.55 8.84 10.22 8.56 3 5 4.36 5.43 16.03 13.32 13.98 17.17 18.23 18.47 20.37 22.24 18.08 19.56 22.65 24.98 22.07 23.71 26.23 25.57 27.93 27.04 23.71 27.11 31.26 25.21 25.99 28.33 15.00 19.68 22.84 27.83 31.54 35.51 16.83 20.3*4 23.15 29.72 33-39 36.04 10.17 18.06 20.51 13.11 16.30 19.26 17.59 23.05 27. 3*4 32.50 36.21 39.26 16.63 18.64 20.96 29.50 33.17 35.11 17.29 13.81 21.51 19.55 24.78 22.04
- Page 19: Appendix A Climate
- Page 22 and 23: All of the data presented here are
- Page 24 and 25: and minimum data are recorded on th
- Page 26 and 27: EXPLANATION OF TABLES Table A-l, "I
- Page 28 and 29: Table A-2, "Precipitation Data for
- Page 30 and 31: TABLE A-l INDEX OF CLIMATOLOGICAL S
- Page 32 and 33: TABLE A-l (Continued) INDEX OF CLIM
- Page 34 and 35: TABLE A-l (Continued) INDEX OF CLIM
- Page 36 and 37: TABLE A-l (Continued) INDEX OF CLIM
- Page 38 and 39: TABLE A-l (Continued) INDEX OF CLIM
- Page 40 and 41: Station SACRAMENTO RIVER BASIN SACR
- Page 42 and 43: Station TABLE A-2 (Continued) PRECI
- Page 44 and 45: Station SACRAMENTO RIVER BASIN FEAT
- Page 46 and 47: Station SACRAMENTO RIVER BASIN CACH
- Page 48 and 49: Station TABLE A-2 (Continued) PRECI
- Page 50 and 51: Station TABLE A-3 STORAGE PRECIPITA
- Page 52 and 53: Station SACRAMENTO RIVER BASIM SACR
- Page 54 and 55: Station TABLE A-4 (Continued) TEMPE
- Page 56 and 57: TABLE A-4 (Continued) TEMPERATURE D
- Page 58 and 59: Stotion TABLE A-4 (Continued) TEMPE
- Page 60 and 61: Station TABLE A-4 (Continued) TEMPE
- Page 62 and 63: Station TABLE A-4 (Continued) TEMPE
- Page 64 and 65: Station TABLE A-4 (Continued) TEMPE
- Page 66 and 67: Station TABLE A-5 EVAPORATION DATA
- Page 71: Sheet I of 3 Sheets PLATE A- A-l LE
- Page 75: Center X ome \ cy lesville WendellC
- Page 79: e V ( Arb Dav j V StdK N «drictabu
- Page 84: ,*3
- Page 89 and 90: N? 601058 aid forn ia . Department
TABLE A-5 (Continued)<br />
EVAPORATION DATA SUMMARY FOR 1964-65<br />
NORTHEASTERN CALIFORNIA<br />
Station July Aug. Sept. Oct. Nov. Dec. Jan Apr. May June<br />
SAN JOAQUIN RIVER BASIN<br />
SACRAMENTO-SAN JOAQUIN DELTA<br />
Mandeville Island<br />
Stockton Mowry Bridge<br />
NORTH LAHONTAN AREA<br />
SURPRISE VALLEY<br />
Cedarville 12 SE<br />
Cedarville 2 ESE<br />
MADELINE PLAINS<br />
Ravendale 1 SSE<br />
SUSAN RIVER<br />
Fleming Fish and Game<br />
Standish 5 WNW<br />
TRUCKEE RIVER<br />
Evap


