Hydrologic data, 1965 - Department of Water Resources - State of ...
Hydrologic data, 1965 - Department of Water Resources - State of ...
Hydrologic data, 1965 - Department of Water Resources - State of ...

You also want an ePaper? Increase the reach of your titles
YUMPU automatically turns print PDFs into web optimized ePapers that Google loves.
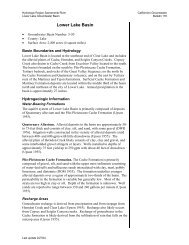
Table A-2, "Precipitation Data for 1964-65", presents<br />
the precipitation measurements collected in the Northeastern<br />
California area during the report period. The listing is by<br />
drainage and river basins with the individual climatological<br />
stations in alphabetical order under the basins. The total<br />
monthly precipitation in inches, which is usually a summation<br />
<strong>of</strong> the daily observations, is reported as well as the total<br />
for the fiscal year, July 1, 1964, through June 30, <strong>1965</strong>. The<br />
daily records, and hourly at some locations, are available in<br />
the <strong>Department</strong>'s <strong>of</strong>fice files.<br />
Table A-3, "Storage Precipitation Gage Data for<br />
1964-65", contains <strong>data</strong> collected in the mountainous areas <strong>of</strong><br />
Northeastern California from storage precipitation gages. The<br />
table is organized by drainage basins and lists the responsible<br />
agency for the station as well as the total "catch" in inches<br />
between the date the gage was charged and the date <strong>of</strong><br />
measurement<br />
Table A-4, "Temperature Data for 1964-65", shows a<br />
monthly temperature summary for stations within the Northeastern<br />
California area which are not published by the U. S. Weather<br />
Bureau. The stations are listed under drainage basins in<br />
alphabetical order and all values are in degrees Fahrenheit.<br />
The daily records are also available in the <strong>Department</strong>'s <strong>of</strong>fice<br />
files. Terms used in connection with Table A-4 are as follows:<br />
Maximum - The highest temperature <strong>of</strong> record for<br />
the month.<br />
Avg.Max.- The arithmetic average <strong>of</strong> daily maximum<br />
temperatures for the month.<br />
Average - The arithmetic average <strong>of</strong> the daily<br />
maximum and mimimum temperatures for<br />
the month.<br />
14