
You also want an ePaper? Increase the reach of your titles
YUMPU automatically turns print PDFs into web optimized ePapers that Google loves.
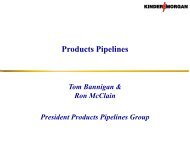
<strong>Terminals</strong><br />
Jeff Armstrong<br />
President <strong>Terminals</strong> Group
Terminal Locations<br />
Legend<br />
2 3<br />
Dry and/or Break Bulk Locations<br />
Liquid Locations<br />
Transload Operations<br />
2<br />
2<br />
Product Pipelines Locations<br />
2<br />
4<br />
3<br />
4<br />
3<br />
3<br />
2<br />
2<br />
3<br />
2<br />
3<br />
4<br />
2<br />
2<br />
2<br />
7<br />
3<br />
2<br />
2<br />
2<br />
2<br />
4<br />
2<br />
3<br />
KM <strong>Terminals</strong> Segment Facilities<br />
Bulk 88 <strong>Terminals</strong><br />
Liquids 26 <strong>Terminals</strong><br />
KMMS 35 Transload Operations<br />
2
Historical Growth<br />
($ in thousands)<br />
2006 2007 2008 2009 2010 2011 2012<br />
Actual Actual Actual Actual Actual Actual Budget<br />
Earnings before DD&A (a) $396,858 $442,330 $538,836 $576,096 $646,608 $701,042 $756,844<br />
Growth from prior year 24.7% 11.5% 21.8% 6.9% 12.2% 8.4% 8.0%<br />
Internal 14.2% 2.3% 14.7% 6.0% 6.7% 6.1% 6.0%<br />
Acquisition 10.6% 9.1% 7.1% 0.9% 5.6% 2.4% 2.0%<br />
__________________________<br />
(a) Before certain items<br />
(b) 2002-2012 CAGR<br />
CAGR (b)<br />
12.4%<br />
3
Financial Overview<br />
($ in thousands)<br />
2009 Actual 2010 Actual 2011 Actual 2012 Budget<br />
Revenue (net) $1,081,679 $1,244,810 $1,298,507 $1,347,870<br />
Opex $501,175 $591,547 $598,212 $579,863 (b)<br />
EBITDA (a) $580,504 $653,263 $700,295 $768,007<br />
Book income tax $4,408 $6,655 (747) $11,163<br />
Earnings before DD&A $576,096 $646,608 $701,042 $756,844<br />
Sustaining capital $64,642 $77,277 $83,187 $96,600<br />
DCF $511,454 $569,331 $617,855 $660,244<br />
Expansion capital (c) $218,996 $220,444 $223,173 $473,058<br />
Operating margin 53.7% 52.5% 53.9% 57.0%<br />
__________________________<br />
(a) Before certain items<br />
(b) Operating expense variance (2011 vs 2012)<br />
Acquisition / equity earnings $9.4<br />
Divestitures $14.5<br />
Labor $(6.6)<br />
TOTI $(2.6)<br />
All other $3.6<br />
(c) 2012 budget excludes acquisition capital of $108MM and equity contributions of $60MM<br />
4
Contract Diversification<br />
Liquids Revenue Breakout (a) Bulk Revenue Breakout (a)<br />
Top-10 Customers (a)<br />
Top-10 Customers $409.9MM<br />
Total Revenue $1,348MM<br />
__________________________<br />
(a) 2012 budget<br />
(b) 2012 budget weighted average, as of 12/31/2011<br />
3.9-yr Avg. Contract Life (b)<br />
Liquids 4.0 Years<br />
Bulk 3.8 Years<br />
5
Bulk Tonnage<br />
KMBT Tonnage<br />
(tons)<br />
__________________________<br />
Note: acquisition tonnages represented as owned during prior periods<br />
Actual Actual Budget<br />
2010 2011 2012<br />
Variance ('12 vs '11)<br />
Amt %<br />
Coal 32,571,773 39,041,902 43,759,862 4,717,960 12.1%<br />
Petcoke 12,665,891 11,511,349 12,513,856 1,002,507 8.7%<br />
Cement (Including Clinker) 607,748 588,084 552,000 (36,084) -6.1%<br />
Fertilizers 5,718,218 5,315,357 5,515,568 200,211 3.8%<br />
Salt 3,275,317 3,316,786 3,399,927 83,141 2.5%<br />
Ores/Metals 24,095,642 26,762,459 27,599,004 836,545 3.1%<br />
Soda Ash 3,895,722 3,913,049 4,038,700 125,651 3.2%<br />
Aggregate 1,964,767 2,568,337 2,777,800 209,463 8.2%<br />
Other Bulk 8,645,601 7,622,980 8,080,051 457,071 6.0%<br />
Totals 93,440,680 100,640,303 108,236,768 7,596,465 7.5%<br />
6
Liquids Throughput<br />
Throughput<br />
(bbls)<br />
KM Utilization<br />
__________________________<br />
Note: 2010 throughput was revised during 2011<br />
Actual Actual Budget<br />
2010 2011 2012<br />
Variance ('12 vs '11)<br />
Amt %<br />
Chemical 21,748,652 24,359,936 32,732,431 8,372,495 34.4%<br />
Distillate 163,367,651 154,115,558 145,906,266 (8,209,292) -5.3%<br />
Gasoline 333,903,633 330,353,480 341,403,630 11,050,150 3.3%<br />
Fuel Grade Ethanol / Bio-diesel 57,881,078 60,951,613 72,379,960 11,428,347 18.7%<br />
Petroleum 34,179,136 35,938,478 32,201,872 (3,736,606) -10.4%<br />
Vegetable Oils 4,806,666 6,271,907 7,641,256 1,369,349 21.8%<br />
Animal Fats 580,718 570,947 442,488 (128,459) -22.5%<br />
Other 3,232,359 3,268,420 3,774,708 506,288 15.5%<br />
Totals 619,699,893 615,830,340 636,482,611 20,652,271 3.4%<br />
Actual Actual Budget<br />
2010 2011 2012<br />
Capacity Utilization Rate 96.2% 94.5% 97.0%<br />
Capacity (MM bbls) 58.2 60.2 60.5<br />
7
Major Projects Completed in 2011<br />
LIQUIDS<br />
BULK<br />
ACQUISITIONS<br />
First Full<br />
Year<br />
EBITDA<br />
Avg.<br />
Contract<br />
Length (a)<br />
MODELED<br />
In Service<br />
PROJECT NAME PRODUCT<br />
CAPACITY CAPITAL<br />
Date<br />
MMBBLS (MM) (MM)<br />
Gateway Project (Carteret, NJ) Distillates 1.0 $62.1 Q3/11 10<br />
Deer Park Ethanol (Deer Park, TX) Ethanol 0.2 $27.3 Q1/12 4.4<br />
Chemical Expansion (Philadelphia, PA) Chemicals 0.4 $14.4 Q1/12 5<br />
TOTAL 1.6 $103.8 $15.1<br />
PROJECT NAME PRODUCT MODELED VOLUME CAPITAL<br />
First Full<br />
Year<br />
EBITDA<br />
In Service<br />
Date<br />
MNTPY (MM) (MM)<br />
Petcoke Handling Project (Deer Park, TX) Petcoke 2.0 $16.2 Q1/11 10<br />
Copper Handling (Vancouver, BC) Copper Ore 0.1 $14.8 Q3/11 5<br />
Port of Houston Export Coal (Deer Park, TX) Coal 1.2 $17.9 Q1/12 3<br />
TOTAL 3.3 $48.9 $10.0<br />
First Full<br />
Year<br />
EBITDA<br />
Avg.<br />
Contract<br />
Length (a)<br />
Avg.<br />
Contract<br />
Length<br />
MODELED<br />
Close<br />
PROJECT NAME PRODUCT CAPACITY/VOLUME CAPITAL<br />
Date<br />
(MM) (MM)<br />
Deeprock (Cushing, OK ) (b) Crude 0.9 $24.7 Q1/11 5<br />
Total (Port Arthur, TX) Petcoke 1.0 $66.5 Q2/11 25<br />
Watco Preferred Investment (2nd Tranche) N/A N/A $50.0 Q4/11 N/A<br />
TOTAL 1.9 $141.2 $19.1<br />
__________________________<br />
(a) Initial Term<br />
(b) <strong>Kinder</strong> <strong>Morgan</strong> Equity share<br />
COMBINED TOTAL $293.9 $44.2<br />
8
Major Projects in Progress<br />
LIQUIDS<br />
BULK<br />
First Full<br />
Avg.<br />
MODELED<br />
Year Expected Contract<br />
PROJECT NAME PRODUCT<br />
CAPACITY CAPITAL EBITDA In Service Length (a)<br />
MMBBLS (MM)<br />
Ethanol Pipeline (Linden, NJ)<br />
Pipeline Rate Expansion (Edmonton, Alberta)<br />
Ethanol N/A $8.8 Q1/12 10<br />
(b)<br />
Tank Expansion (Edmonton, Alberta)<br />
Crude N/A $8.5 Q3/12 15.6<br />
(b) Crude 2.4 $212.4 Q4/13 7.5<br />
BOSTCO Project (La Porte, TX) Crude/VGO/Distillates 6.6 $431.6<br />
Q3/13 -<br />
Q4/14<br />
5<br />
TOTAL 9.0 $661.3 $75.3<br />
PROJECT NAME PRODUCT MODELED VOLUME CAPITAL<br />
First Full<br />
Year<br />
EBITDA<br />
Expected<br />
In Service<br />
MNTPY (MM)<br />
Copper Handling - Phase 2 (Vancouver, BC) (b) Copper Ore 0.1 $5.7 Q3/12 6<br />
Fertilizer Domes (Fairless Hills, PA) Fertilizer 0.1 $10.0 Q1/13 4<br />
Shiploader Expansion (Portland, OR) Soda Ash 0.1 $9.5 Q2/13 10<br />
Petcoke Handling (Whiting, IN) Petcoke 2.2 $60.5 Q2/13 10<br />
IMT Phase 1 (Myrtle Grove, LA) Coal 4.0 $70.0 Q2/13 15<br />
IMT Phase 2 (Myrtle Grove, LA) Coal 2.5 $44.1 Q1/13 10<br />
TOTAL 9.0 $199.8 $35.1<br />
COMBINED TOTAL $861.1 $110.4<br />
Potential Future Projects<br />
$300 – $500 Million<br />
__________________________<br />
(a) Initial Term<br />
(b) C$ / USD exchange rate 1:1<br />
Crude<br />
Coal<br />
Diesel/Gasoline<br />
Avg.<br />
Contract<br />
Length<br />
9
Petroleum Exports / Imports
Distillate<br />
South<br />
America<br />
59%<br />
PADD 3<br />
76%<br />
__________________________<br />
Source: EIA<br />
Distillate Fuel Oil – Export Destination<br />
(% of 2011 Daily Average)<br />
Asia<br />
1%<br />
Europe<br />
33%<br />
Canada<br />
2%<br />
Other<br />
2%<br />
Africa<br />
3%<br />
Distillate Fuel Oil – U.S. Export Location<br />
(% of 2011 Daily Average)<br />
PADD 4<br />
0%<br />
PADD 5<br />
9%<br />
PADD 1<br />
14%<br />
PADD 2<br />
1%<br />
MBbl/d<br />
700<br />
600<br />
500<br />
400<br />
300<br />
200<br />
100<br />
0<br />
(100)<br />
(200)<br />
(149)<br />
Distillate Fuel Oil - Net Exports<br />
(37)<br />
314<br />
362<br />
426<br />
636<br />
2006 2007 2008 2009 2010 2011<br />
11
Finished Gasoline<br />
Finished Motor Gasoline – Export Destination<br />
(% of 2011 Daily Average)<br />
South<br />
America<br />
88%<br />
PADD 3<br />
88%<br />
__________________________<br />
Source: EIA<br />
Europe<br />
5%<br />
Canada<br />
4%<br />
Africa<br />
2%<br />
Other<br />
1%<br />
Asia<br />
0%<br />
Finished Motor Gasoline – U.S. Export<br />
Location<br />
(% of 2011 Daily Average)<br />
PADD 4<br />
0%<br />
PADD 5<br />
10%<br />
PADD 1<br />
1%<br />
PADD 2<br />
1%<br />
MBbl/d<br />
400<br />
300<br />
200<br />
100<br />
0<br />
(100)<br />
(200)<br />
(300)<br />
(400)<br />
(334)<br />
Finished Motor Gasoline - Net Exports<br />
(285)<br />
(130)<br />
(28)<br />
161<br />
338<br />
2006 2007 2008 2009 2010 2011<br />
12
Million Barrels<br />
Fuel Oil Exports<br />
140<br />
120<br />
100<br />
80<br />
60<br />
40<br />
20<br />
0<br />
__________________________<br />
Source: Poten & Partners<br />
USGC Residual Fuel Import and Export<br />
41.647<br />
84.049<br />
93.169<br />
36.985 37.436<br />
2007 2008 2009 2010<br />
Import Export<br />
109.698<br />
Declining US Demand<br />
+ Steady Production<br />
= Increasing Exports<br />
28.836<br />
118.136<br />
Million Barrels<br />
16<br />
14<br />
12<br />
10<br />
8<br />
6<br />
4<br />
2<br />
Movements of Residual Fuel Oil (High-Sulfur and Low-Sulfur)<br />
from Padd 3 to Other Padds by Barge<br />
0<br />
2007 2008 2009 2010<br />
Padd 1 Lower Atlantic Padd 1 Central Atlantic Padd 2 Padd 5<br />
13
BOSTCO Project<br />
14
World Refinery Capacity Changes<br />
__________________________<br />
Source: Baker O’Brien<br />
15
East Coast Refinery Closures<br />
� ConocoPhillips announced in late September 2011 the intention to sell or close the Trainer refinery (185 MB/D) and began<br />
preparations for idling the plant (plant is now down).<br />
� In early December 2011, Sunoco announced that it was shutting down Marcus Hook (178 MB/D) and will also close<br />
Philadelphia (310 MB/D) if it cannot be sold.<br />
� At the start of 2009, total fuels refining capacity stood at approximately 1.6 MMB/D.<br />
� By July 2012, it is possible that only 735 MB/D will remain.<br />
Fuels Refinery Capacity, MB/D Status Comments<br />
ConocoPhillips Bayway 252 Operating<br />
ConocoPhillips Trainer 181 Shut down Oct 2011<br />
Hess Perth Amboy 66 Operating Cracker only<br />
PBF Delaware City 190 Operating Restarted 2011; $1B hydrocracker project<br />
PBF Paulsboro 160 Operating<br />
Sunoco Philadelphia 310 Operating For sale; to be shut July 2012 if no buyer<br />
Sunoco Marcus Hook 178 Shut down Dec 2011<br />
Sunoco Westville 145 Shut down 2009 Refinery reported to be dismantled/sold<br />
United Refining Warren 67 Operating Located inland Pennsylvania<br />
Western Yorktown 70 Shut down 2010 Related terminal assets sold to Plains 2011<br />
Total 1,619<br />
__________________________<br />
Source: Baker O’Brien<br />
16
PADD 1B Demand vs. Refining Capacity in Region<br />
__________________________<br />
Source: Baker O’Brien<br />
17
Implications of East Coast Refinery Closures<br />
� If significant capacity is shutdown in<br />
the NY Harbor area, additional barrels<br />
will be required from the USGC or<br />
longer-haul imports<br />
� Because the Colonial pipeline system<br />
is periodically constrained, supplying<br />
more barrels to NY Harbor will require<br />
some combination of (1) increases in<br />
waterborne imports or (2) movements<br />
from USGC via Jones Act ships<br />
— Colonial has recently announced<br />
a 100 MB/D expansion on Line 1<br />
(gasoline)<br />
� NY Harbor pricing will have to<br />
increase to cover the incremental<br />
logistical costs, whether it be USGC<br />
or offshore sources of product<br />
__________________________<br />
Source: Baker O’Brien<br />
18
Impact of Petroleum Market Shift for KM<br />
Build-Out US Gulf Export Capacity<br />
• BOSTCO 6.6 million barrels in Phase 1 underway<br />
• BOSTCO Phase II approximately 3.7 million barrels<br />
Maximize Throughput at Three<br />
New York Harbor Facilities<br />
• Just completed 1 million barrel build-out<br />
in Carteret<br />
19
Ethanol
RFS2: Four Annual Standards<br />
__________________________<br />
Source: 2011 Houston BioFuels Consultants LLC<br />
21
US and Global Ethanol S&D<br />
� In 2011, the US accounted for 55% of global ethanol demand<br />
� In 2011, the US and Brazil together accounted for over 80% of global demand, a share that is<br />
expected to continue through the forecast period<br />
� Most of the global growth will be in the US and Brazil as well in the coming 5 years<br />
__________________________<br />
Source: 2011 Houston BioFuels Consultants LLC<br />
22
US Ethanol Imports and Exports<br />
� The RFS2 advanced biofuel requirements can most economically be met with imports of cane<br />
ethanol, mainly from Brazil<br />
� The California LCFS will only determine the share of imports directed to California; the<br />
amount of imports is set by the RFS2 advanced biofuel mandates.<br />
KMT Ethanol Handling<br />
__________________________<br />
Source: 2011 Houston BioFuels Consultants LLC<br />
2011 2012P<br />
Storage (MBbls) 5,190 5,425<br />
Throughput (Bbl/d) 161,858 188,442<br />
KMPP Ethanol Handling<br />
Storage (MBbls) 1,549 1,549<br />
Throughput (Bbl/d) 83,348 85,357<br />
US Ethanol Demand<br />
Throughput (Bbl/d) 848,092 884,606<br />
23
Coal
International Metallurgical Coal<br />
Market Conditions & Drivers<br />
Global Met Coal Trade<br />
Met Coal Imports (MMt) 2009 2010 2011E 2012E<br />
Europe 36 45 49 51<br />
Japan 53 58 56 62<br />
China 34 48 52 54<br />
Korea 21 28 31 32<br />
India 25 30 34 40<br />
Brazil 9 12 14 15<br />
Other 42 52 41 47<br />
World Imports 220 273 277 301<br />
Met Coal Exports (MMt) 2009 2010 2011E 2012E<br />
Australia 135 159 137 165<br />
Canada 22 28 30 33<br />
U.S. 34 51 54 49<br />
Russia 13 14 17 17<br />
Other 16 21 39 37<br />
World Exports 220 273 277 301<br />
__________________________<br />
Sources: Australian Bureau of Resources & Energy Economics, Arch Coal Inc., World Steel Association and Business Briefing<br />
Total Growth In World<br />
Steel Consumption<br />
(billions of tons of finished steel)<br />
Iron and Steel Capacity Build Out<br />
Through 2015<br />
(excluding electric arc furnace capacity)<br />
25
International Steam Coal<br />
Market Conditions & Drivers<br />
� Coal is forecasted to supply approximately 43% of the<br />
worlds electricity generation in 2035.<br />
� Thermal coal imports to India’s utilities increased by 70%<br />
in 2011 and increasing demand by new coastal<br />
Independent Power Producers (IPP) and Ultra Mega<br />
Power Producers (UMPP) will help nearly double coal<br />
usage from 2010 to 2015.<br />
� India’s steam coal demand expected to surpass China’s<br />
imports by 2015.<br />
� Projections of Asian steam coal demand continues to<br />
outpace Europe’s demands for seaborne steam coal.<br />
Steam Coal Imports (MMt)<br />
Importer 2009 2010 2011 2012 2015<br />
China 62 97 97 107 119<br />
India 60 75 90 105 127<br />
Korea 83 95 100 100 107<br />
Taiwan 55 59 63 64 67<br />
Japan 108 120 119 123 125<br />
Total Asia 426 508 534 567 627<br />
Europe 176 158 175 176 179<br />
Americas 37 37 37 41 56<br />
World 638 703 745 784 862<br />
__________________________<br />
Sources: EIA, Macquarie Commodities Research ,Bloomberg, and IHS McCloskey Group<br />
World Electricity Generation (Trillion<br />
Kilowatt hours)<br />
Indian Import Demand (MMt)<br />
26
Domestic Coal Markets<br />
Millions<br />
short tons<br />
1,060.0<br />
1,040.0<br />
1,020.0<br />
1,000.0<br />
980.0<br />
960.0<br />
940.0<br />
Total Forecasted<br />
U.S. Coal Consumption<br />
2010 2011 2012 2013<br />
__________________________<br />
Source: EIA and Wood Mackenzie, Fall 2011 Web Call<br />
U.S. Coal Retirements<br />
27
KM Response<br />
East Coast<br />
(1) Fairless Hills Terminal,<br />
Fairless Hills PA<br />
expected capital outlay = $5.6 mm<br />
U.S. Gulf<br />
(1) International Marine Terminal,<br />
Myrtle Grove LA – Phase 1 expected<br />
capital outlay = $70 mm<br />
6 million tons<br />
(2) International Marine Terminal,<br />
Myrtle Grove LA – Phase 2 expected<br />
capital outlay = $44.0 mm<br />
4 million tons<br />
(3) Port of Houston Terminal, expected<br />
capital outlay = $17.9mm<br />
2 million tons<br />
KM Coal Handling (TPY) 2010 2011 2012est. CAGR<br />
Throughput (MMt) 32.6 39.0 43.8 15.8%<br />
Export (MMt) 7.9 12.9 18.5 53%<br />
Additional Capacity<br />
Potential<br />
10 million tons – Texas<br />
8 million tons – Louisiana<br />
8 million tons – East Coast<br />
26 million tons – Total<br />
28
Canadian Crude Tankage
Canadian Crude Market Fundamentals<br />
Increasing oil sands production<br />
$160<br />
$140<br />
$120<br />
$100<br />
$80<br />
$60<br />
$40<br />
$20<br />
$0<br />
WTI vs Canadian Heavy (Cold Lake) Pricing<br />
1-Jan-07<br />
1-Apr-07<br />
1-Jul-07<br />
1-Oct-07<br />
1-Jan-08<br />
1-Apr-08<br />
1-Jul-08<br />
1-Oct-08<br />
1-Jan-09<br />
1-Apr-09<br />
1-Jul-09<br />
1-Oct-09<br />
1-Jan-10<br />
1-Apr-10<br />
1-Jul-10<br />
1-Oct-10<br />
1-Jan-11<br />
1-Apr-11<br />
1-Jul-11<br />
1-Oct-11<br />
Increasing price volatility<br />
Increased Canadian demand for petroleum storage<br />
__________________________<br />
Source: Figure 2.2 - CAPP Crude Oil Forecast, June 2011; WTI - Chevron.com, Posted Pricing - East of the Rockies, East of the Rockies - Bulletin 1/-E11<br />
and Cenovus.com, Crude oil pricing<br />
30
Edmonton, AB – Canada’s Primary Crude Hub<br />
<strong>Kinder</strong> <strong>Morgan</strong>’s Edmonton Terminal:<br />
� Trans Mountain Operational 2.5 MM Bbls<br />
� North 40 Merchant 2.1 MM Bbls<br />
� Edmonton Merchant (2013) 2.4 MM Bbls<br />
(under construction)<br />
� Edmonton Merchant (2014+) 3.6 MM Bbls<br />
(future phases)<br />
Current and Future Capacity: 10.6 MM Bbls<br />
� Connected to 10 major inbound feeder streams<br />
� Direct connection to Trans Mountain Pipeline<br />
— West Coast Canada, Puget Sound and<br />
Off shore access<br />
� Connected to Enbridge mainline<br />
— All major North American inland markets<br />
� Adjacent to the Edmonton refinery complex<br />
� Customer flexibility<br />
— Storage & Blending<br />
— Subleasing<br />
— Trunk pipeline staging<br />
� Future economies of scale = competitive pricing<br />
31
Latest Investment in Watco<br />
Financial Components:<br />
� Second $50MM Tranche of<br />
Preferred Equity<br />
— Preferred Investment now<br />
totals $100MM<br />
� Terms similar to initial investment<br />
— Preferred distributions of 13%,<br />
paid quarterly<br />
Proceeds to Support Following Acquisitions/Investments:<br />
� Birmingham Southern<br />
— 76 miles of track around U.S. Steel Corp mill in Fairfield, AL as well as the line<br />
serving the Port Facility on the Black Warrior River<br />
— 90,000 car loads in 2010<br />
� Wisconsin & Southern<br />
— 700-mile common carrier in southern and eastern Wisconsin<br />
— 50,000 car loads in 2010<br />
� Western Australia<br />
— Watco to provide comprehensive rail logistics services, including rolling stock,<br />
maintenance, and management<br />
32