2011 Alumni D - Chemical and Biomolecular Engineering ...
2011 Alumni D - Chemical and Biomolecular Engineering ...
2011 Alumni D - Chemical and Biomolecular Engineering ...

You also want an ePaper? Increase the reach of your titles
YUMPU automatically turns print PDFs into web optimized ePapers that Google loves.
-18-<br />
Graduate Program<br />
Ranking<br />
Th e 2012 U.S. News <strong>and</strong> World Report rankings of engineering graduate programs<br />
placed the Lowrie Department of <strong>Chemical</strong> <strong>and</strong> <strong>Biomolecular</strong> <strong>Engineering</strong> at #27.<br />
While the college rankings are based in good part on objective measures such as<br />
research funding, number of Ph.D. graduates, number of publications, etc., the<br />
departmental rankings are based on subjective surveys of deans of engineering <strong>and</strong><br />
industrial executives.<br />
2008 2009 2010 <strong>2011</strong> 2012<br />
Ohio State College of <strong>Engineering</strong> 26 29 27 25 29<br />
<strong>Engineering</strong> Specialties<br />
Aerospace 21 21 22 19 19<br />
Biomedical - - - 35 35<br />
<strong>Chemical</strong> 26 27 27 27 27<br />
Civil 36 38 36 36 36<br />
Computer <strong>Engineering</strong> 23 29 20 28 23<br />
Electrical 26 26 20 22 22<br />
Environmental/Env. Health 39 39 39 42 42<br />
Industrial/Manufacturing 19 18 21 16 16<br />
Materials 14 14 16 15 15<br />
Mechanical 21 20 22 21 21<br />
Nuclear Nr Nr 13 15 15<br />
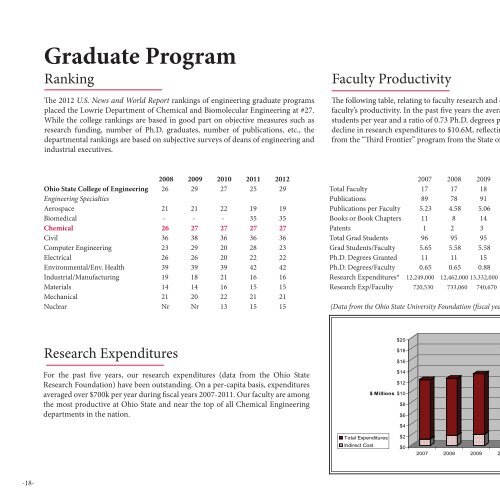
Research Expenditures<br />
For the past fi ve years, our research expenditures (data from the Ohio State<br />
Research Foundation) have been outst<strong>and</strong>ing. On a per-capita basis, expenditures<br />
averaged over $700k per year during fi scal years 2007-<strong>2011</strong>. Our faculty are among<br />
the most productive at Ohio State <strong>and</strong> near the top of all <strong>Chemical</strong> <strong>Engineering</strong><br />
departments in the nation.<br />
Faculty Productivity<br />
Th e following table, relating to faculty research <strong>and</strong> our Ph.D. program, attests to our<br />
faculty’s productivity. In the past fi ve years the average graduation rate was 13 Ph.D.<br />
students per year <strong>and</strong> a ratio of 0.73 Ph.D. degrees per faculty member. <strong>2011</strong> shows a<br />
decline in research expenditures to $10.6M, refl ecting the end of substantial funding<br />
from the “Th ird Frontier” program from the State of Ohio.<br />
2007 2008 2009 2010 <strong>2011</strong><br />
Total Faculty 17 17 18 19 19<br />
Publications 89 78 91 125 100<br />
Publications per Faculty 5.23 4.58 5.06 6.58 5.26<br />
Books or Book Chapters 11 8 14 10 13<br />
Patents 1 2 3 4 1<br />
Total Grad Students 96 95 95 88 89<br />
Grad Students/Faculty 5.65 5.58 5.58 4.89 4.94<br />
Ph.D. Degrees Granted 11 11 15 18 9<br />
Ph.D. Degrees/Faculty 0.65 0.65 0.88 0.95 0.5<br />
Research Expenditures* 12,249,000 12,462,000 13,332,000 16,181,000 10,648,893<br />
Research Exp/Faculty 720,530 733,060 740,670 851,580 560,468<br />
(Data from the Ohio State University Foundation (fi scal year))<br />
$ Millions $10<br />
Total Expenditures<br />
Indirect Cost<br />
$20<br />
$18<br />
$16<br />
$14<br />
$12<br />
$8<br />
$6<br />
$4<br />
$2<br />
$0<br />
2007 2008 2009 2010 <strong>2011</strong>