A new approach to single shot laser ablation - Department of ...
A new approach to single shot laser ablation - Department of ...
A new approach to single shot laser ablation - Department of ...

Create successful ePaper yourself
Turn your PDF publications into a flip-book with our unique Google optimized e-Paper software.
PAPER www.rsc.org/jaas | Journal <strong>of</strong> Analytical A<strong>to</strong>mic Spectrometry<br />
A <strong>new</strong> <strong>approach</strong> <strong>to</strong> <strong>single</strong> <strong>shot</strong> <strong>laser</strong> <strong>ablation</strong> analysis and its application <strong>to</strong><br />
in situ Pb/U geochronology<br />
J. M. Cottle,* ab M. S. A. Horstwood b and R. R. Parrish b<br />
Received 8th December 2008, Accepted 9th July 2009<br />
First published as an Advance Article on the web 30th July 2009<br />
DOI: 10.1039/b821899d<br />
A novel <strong>approach</strong> <strong>to</strong> <strong>laser</strong> <strong>ablation</strong> Pb/U geochronology is presented that allows accurate<br />
determination <strong>of</strong> iso<strong>to</strong>pe ratios from a <strong>single</strong> pulse <strong>of</strong> a 193 nm <strong>laser</strong>. Data are acquired using a low<br />
volume <strong>ablation</strong> cell that facilitates: (1) production <strong>of</strong> a high density particle stream; and (2) a short<br />
( 0.5 s) sample washout time. Iso<strong>to</strong>pe ratios from an individual <strong>laser</strong> pulse are calculated by<br />
integrating the baseline-subtracted <strong>to</strong>tal number <strong>of</strong> counts for the entire pulse and assigning an internal<br />
uncertainty based on counting statistics. This ‘<strong>to</strong>tal signal integration’ method eliminates the effects <strong>of</strong><br />
differing detec<strong>to</strong>r response times, particularly in multi-collec<strong>to</strong>r-inductively coupled plasma-mass<br />
spectrometry (MC-ICP-MS), providing an alternative means <strong>to</strong> quantify transient signals. Data from<br />
reference zircons indicate that it is possible <strong>to</strong> consistently measure 206 Pb/ 238 U and 207 Pb/ 206 Pb ratios<br />
with external reproducibilities <strong>of</strong> 2% and 2.8% (2SD) respectively, using a similar amount <strong>of</strong> material <strong>to</strong><br />
standard static <strong>ablation</strong> pro<strong>to</strong>cols. Decreasing sample consumption <strong>to</strong> 14 ng zircon ( 75% less<br />
than the ‘normal’ ablated mass) results in only a modest increase in the uncertainty <strong>to</strong> 5% on the<br />
206 Pb/ 238 U ratio. By analysing consecutive <strong>laser</strong> pulses from the same <strong>ablation</strong> site, iso<strong>to</strong>pic depth<br />
pr<strong>of</strong>iles can be generated with a depth resolution <strong>of</strong> 0.1 mm pulse 1 . This technique <strong>of</strong>fers a <strong>new</strong><br />
opportunity <strong>to</strong> identify complexities within accessory minerals that were previously beyond the<br />
spatial resolution <strong>of</strong> <strong>laser</strong> based geochronology methods.<br />
Introduction<br />
Continued developments in <strong>laser</strong> <strong>ablation</strong>-inductively coupled<br />
plasma mass spectrometry (LA-ICP-MS) over the past decade<br />
(e.g. use <strong>of</strong> shorter wavelength <strong>laser</strong>s and more sensitive mass<br />
spectrometers) have facilitated the production <strong>of</strong> ever more<br />
precise and accurate U(-Th)-Pb age determinations from<br />
a variety <strong>of</strong> accessory phase minerals. Alongside improvements<br />
in precision, a fundamental goal <strong>of</strong> <strong>laser</strong> <strong>ablation</strong> geochronology<br />
is <strong>to</strong> increase the spatial resolution with which analyses can be<br />
performed; thereby decreasing the amount <strong>of</strong> sample consumed<br />
and ultimately leading <strong>to</strong> avoidance <strong>of</strong> mixing micron-scale<br />
complexities during analysis. This objective has largely been<br />
addressed by using smaller <strong>ablation</strong> spot sizes and/or shorter<br />
acquisition times. However, for the most part, analyses are<br />
carried out using continuous pulsing <strong>of</strong> the <strong>laser</strong> at relatively high<br />
repetition rates (>5 Hz) and a static or dynamic <strong>ablation</strong><br />
pro<strong>to</strong>col (see e.g. Kosler 1 and Simonetti et al. 2 for reviews).<br />
Because the signal generated by the <strong>laser</strong> <strong>ablation</strong> process is<br />
generally transient, acquisition methods typically acquire data<br />
from <strong>ablation</strong>s lasting up <strong>to</strong> several tens <strong>of</strong> seconds, with the<br />
minimum length <strong>of</strong> the analysis being largely determined by<br />
the precision required on the least abundant iso<strong>to</strong>pe <strong>of</strong> interest<br />
( 207 Pb in the case <strong>of</strong> U(-Th)-Pb geochronology). Continuous<br />
a <strong>Department</strong> <strong>of</strong> Earth Science, University <strong>of</strong> California, Santa Barbara,<br />
CA, 93106, USA. E-mail: cottle@geol.ucsb.edu; Fax: +1 805-893-2314;<br />
Tel: +1 805-893-3471<br />
b NERC Iso<strong>to</strong>pe Geosciences Labora<strong>to</strong>ry, British Geological Survey,<br />
Kingsley Dunham Centre, Keyworth, UK NG12 5GG; Fax: +44 (0) 115<br />
936 3302; Tel: +44 (0) 115 936 3037<br />
pulsing <strong>of</strong> the <strong>laser</strong> introduces a time-dependent elemental fractionation<br />
with increasing crater depth 3 and although this can be<br />
corrected 4 its minimisation is an important step <strong>to</strong> achieving the<br />
goals outlined above.<br />
An alternative <strong>approach</strong> <strong>to</strong> multi-second analyses is <strong>to</strong> obtain<br />
information from the shortest time-interval possible, i.e. on the<br />
<strong>single</strong> <strong>laser</strong> pulse scale. Several workers have experimented with<br />
<strong>single</strong> <strong>laser</strong> pulses for a range <strong>of</strong> applications including time-<strong>of</strong>flight<br />
mass spectrometry (TOF-MS) 5 and quantification <strong>of</strong> fast<br />
transient signals. 6,7 Although this work met with some considerable<br />
success, these workers highlighted several issues with<br />
<strong>single</strong> <strong>shot</strong> analysis including poor reproducibility <strong>of</strong> <strong>shot</strong>-<strong>to</strong><strong>shot</strong><br />
<strong>laser</strong> irradiance, 5 issues <strong>of</strong> spectral skew on <strong>single</strong> collec<strong>to</strong>r<br />
ICP-MS 6 and potentially large deviations in the inter-element 7<br />
and iso<strong>to</strong>pic ratio(s) with successive <strong>laser</strong> pulses.<br />
Therefore, despite the potential illustrated by this work there<br />
have been few attempts <strong>to</strong> rigorously quantify iso<strong>to</strong>pe or interelement<br />
ratios from <strong>single</strong> pulse spectra and assess their potential<br />
application <strong>to</strong> U(-Th)-Pb geochronology and the earth sciences<br />
generally. In this contribution we present a <strong>new</strong> method for<br />
obtaining accurate iso<strong>to</strong>pic data from <strong>single</strong> <strong>laser</strong> pulses that<br />
seeks <strong>to</strong> minimise sample destruction whilst maximising the<br />
spatial resolution <strong>of</strong> the analyses. This relatively straight forward<br />
technique involves mounting crystals on double-sided sticky tape<br />
and ablating the outer surface <strong>of</strong> the grains using <strong>single</strong> pulses <strong>of</strong><br />
a <strong>laser</strong> beam with a view <strong>to</strong> targeting the thin magmatic and<br />
metamorphic zircon rims <strong>of</strong>ten seen on zircons. The material is<br />
then analysed using multi-collec<strong>to</strong>r-inductively coupled plasma<br />
mass spectrometry (MC-ICP-MS). We demonstrate, with data<br />
from reference zircons, that this method is capable <strong>of</strong> producing<br />
This journal is ª The Royal Society <strong>of</strong> Chemistry 2009 J. Anal. At. Spectrom., 2009, 24, 1355–1363 | 1355
accurate ages with comparable uncertainties <strong>to</strong> conventional<br />
static spot analyses whilst consuming only two-thirds, and<br />
potentially as little as 10%, <strong>of</strong> the material. Case studies from<br />
complex natural zircons highlight the geologic utility <strong>of</strong> this<br />
<strong>approach</strong> for obtaining reliable ages from age domains in<br />
accessory phases that are otherwise beyond the limit <strong>of</strong> static<br />
spot pro<strong>to</strong>cols. Finally, the potential for this method <strong>to</strong> generate<br />
age depth pr<strong>of</strong>iles is considered.<br />
Instrumentation<br />
Pb/U iso<strong>to</strong>pe data were collected using a Nu Instruments’<br />
Nu-Plasma HR MC-ICP-MS at the Natural Environment<br />
Research Council Iso<strong>to</strong>pe Geosciences Labora<strong>to</strong>ry (NIGL) UK.<br />
The detection system in this instrument comprises 12 Faraday<br />
cups and three ETP discrete dynode electron multipliers.<br />
Analytical set-up and operating conditions are summarised in<br />
Table 1. Faraday detec<strong>to</strong>rs equipped with 10 11 ohm resis<strong>to</strong>rs were<br />
used <strong>to</strong> measure 238 U, 235 U, 205 Tl, 203 Tl and 202 Hg whilst 207 Pb,<br />
206 Pb, and 204 X (where X represents the iso<strong>to</strong>pes <strong>of</strong> Pb and Hg)<br />
were measured on ion counters. 202 Hg was used <strong>to</strong> correct for<br />
the 204 Hg isobaric interference on 204 Pb assuming a 204 Hg/ 202 Hg<br />
natural iso<strong>to</strong>pic composition <strong>of</strong> 0.22988, adjusted for mass bias<br />
assuming 205 Tl/ 203 Tl ¼ 2.38925.<br />
A Tl- 235 U solution was simultaneously aspirated in<strong>to</strong> the<br />
plasma via a Nu Instruments’ DSN-100 desolvating nebuliser <strong>to</strong><br />
correct for instrumental mass bias and <strong>to</strong> moni<strong>to</strong>r plasma<br />
induced inter-elemental fractionation. The Tl- 235 U solution was<br />
also used <strong>to</strong> determine ion counter gain prior <strong>to</strong> analysis by<br />
measuring the iso<strong>to</strong>pe pair <strong>of</strong> 205 Tl- 203 Tl first in Faraday cups<br />
then by peak switching the 205 Tl through the three ion counters.<br />
Total gain variation is usually
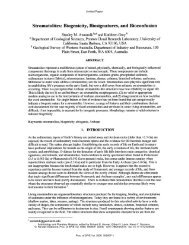
Fig. 1 Scanning electron microscope (SEM) secondary electron images<br />
<strong>of</strong> <strong>ablation</strong> craters in the Himalayan zircon analysed during this<br />
study. In both cases the <strong>laser</strong> settings used were 35 mm spot diameter<br />
and 2.4 J cm 2 . (a) Twenty pulses equating <strong>to</strong> a final depth <strong>of</strong> 3 mm;<br />
(b) from left <strong>to</strong> right: 5 ( 0.8 mm deep), 10 ( 1.5 mm deep), and<br />
30 (final depth <strong>of</strong> 3 mm) pulses respectively.<br />
followed by an ‘on-peak’ zero (OPZ). These were subtracted<br />
on-line from the raw counts <strong>to</strong> give an OPZ baseline-subtracted<br />
iso<strong>to</strong>pe intensity, apart from the continuously aspirated 203 Tl,<br />
205 Tl and 235 U peaks which only had the ESA zero subtracted. A<br />
dead-time correction was applied <strong>to</strong> iso<strong>to</strong>pes measured on ion<br />
counters using dead-time values <strong>of</strong> 7, 6 and 9 ns for IC0, IC1 and<br />
IC2 respectively. A correction for the time-response delay (Tau)<br />
<strong>of</strong> the Faraday detec<strong>to</strong>rs was made using the Nu Instruments<br />
s<strong>of</strong>tware. 204 Hg- 204 Pb interference correction, Tl correction for Pb<br />
mass bias, initial Tl-U mass bias correction for Pb/U and final<br />
Pb/U normalisation <strong>to</strong> the reference material were all carried out<br />
<strong>of</strong>f-line using an Excel spreadsheet.<br />
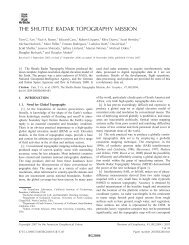
Fig. 3(a) illustrates a time-resolved iso<strong>to</strong>pe trace for a <strong>single</strong><br />
pulse analysis (35 mm spot diameter, 2.4 J cm 3 fluence, and<br />
1 Hz repetition rate) <strong>of</strong> Plesovice zircon. After the <strong>laser</strong> is fired<br />
(at t ¼ 0 s) there is a delay <strong>of</strong> 1.2 s until a signal is registered by<br />
the electron multipliers, representing the travel time <strong>of</strong> material<br />
from the site <strong>of</strong> <strong>ablation</strong> <strong>to</strong> the plasma. Both Faraday and<br />
multiplier signals rise at a similar rate but it is evident that the<br />
time taken for the Faraday <strong>to</strong> reach its peak signal intensity is<br />
delayed by 0.2 s relative <strong>to</strong> the multipliers.<br />
Assuming that ionisation <strong>of</strong> the material and response <strong>of</strong> the<br />
ion counting detec<strong>to</strong>r is instantaneous it is possible <strong>to</strong> make some<br />
observations regarding the timing and nature <strong>of</strong> material flux <strong>to</strong><br />
the plasma. From Fig. 3(a) it is evident that material is being<br />
transported <strong>to</strong> the plasma over an interval <strong>of</strong> 1.4 s (period <strong>of</strong><br />
1.2 and 2.6 s on Fig. 3(a)). The form <strong>of</strong> the signal pr<strong>of</strong>ile can be<br />
taken as reflecting the shape <strong>of</strong> the pulse <strong>of</strong> ablated material with<br />
respect <strong>to</strong> its mass, assuming all particles are ionised and<br />
contribute <strong>to</strong> the signal pr<strong>of</strong>ile equivalently. The pr<strong>of</strong>ile is near<br />
symmetrical suggesting a near symmetrical mass <strong>of</strong> material<br />
arriving at the plasma. The loss <strong>of</strong> symmetry exhibited in the<br />
period between 2.1–2.6 s indicates a tail <strong>of</strong> particles after the<br />
main pulse. The cell geometry and set-up therefore appear <strong>to</strong><br />
produce a largely symmetrical pulse <strong>of</strong> material with a small tail<br />
<strong>of</strong> particles constituting a minimum washout time <strong>of</strong> 0.5 s.<br />
Interestingly, the signal pr<strong>of</strong>ile for the Faraday detec<strong>to</strong>r exhibits<br />
a similar shape following the asymp<strong>to</strong>tic shape <strong>of</strong> the ion counter<br />
pr<strong>of</strong>ile as the signal decays. This suggests that the input Faraday<br />
Tau corrections are not limiting in this instance. The Faraday<br />
Tau corrections were pre-determined for each collec<strong>to</strong>r and<br />
applied on-line using the Nu Plasma instrument control s<strong>of</strong>tware.<br />
This involves determining the response for each collec<strong>to</strong>r<br />
on removal <strong>of</strong> a >3 V ion beam and applying an arithmetic<br />
correction <strong>to</strong> achieve a remnant ion signal <strong>of</strong>
Fig. 3 (a) Time-resolved pr<strong>of</strong>ile for a <strong>single</strong> <strong>laser</strong> pulse analysis <strong>of</strong> Plesovice reference zircon. Note the apparent 0.2 s time-lag between intensities<br />
recorded by the electron multipliers ( 206Pb and 207Pb) versus the Faraday detec<strong>to</strong>r ( 238U). This time-delay results from using a Faraday detec<strong>to</strong>r equipped<br />
with a 1011 ohm resis<strong>to</strong>r. A <strong>single</strong> intensity for each iso<strong>to</strong>pe (and therefore a <strong>single</strong> iso<strong>to</strong>pic ratio) for each pulse is calculated by summing the <strong>to</strong>tal<br />
number <strong>of</strong> counts for each iso<strong>to</strong>pe over the period 0.8–3.0 s. Uncertainties for each iso<strong>to</strong>pic ratio are calculated through counting statistics. (b) The<br />
207 206 206 238 207 206 Pb/ Pb and Pb/ U ratios were also calculated using a 200 ms integration interval. Also plotted for comparison are the ‘mean’ measured Pb/ Pb<br />
and 206Pb/ 238U ratios from 20 40 s spot <strong>ablation</strong>s run during the same analytical session.<br />
multi-second static or dynamic <strong>ablation</strong>s include: (1) producing<br />
ratios <strong>of</strong> the mean intensities for each iso<strong>to</strong>pe measured multiple<br />
times over a selected time-interval (e.g. Quadrupole ICP-MS) or<br />
(2) calculating iso<strong>to</strong>pic ratios on an integration-by-integration<br />
basis (e.g. MC-ICP-MS). Applying either method <strong>to</strong> a <strong>single</strong><br />
pulse, such as that in Fig. 3(a), will yield erroneous results as<br />
demonstrated by Fig. 3(b). Fig. 3(b) plots the 207 Pb/ 206 Pb and<br />
206 Pb/ 238 U ratios calculated using each 200 ms integration<br />
interval. Also plotted for comparison are the ‘mean’ measured<br />
207 Pb/ 206 Pb and 206 Pb/ 238 U ratios from twenty 40 s spot <strong>ablation</strong>s<br />
run during the same analytical session. Fig. 3(b) reveals that<br />
207 Pb/ 206 Pb ratios calculated from any 200 ms integration during<br />
the period 1.4–2.0 s are accurate relative <strong>to</strong> the mean measured<br />
multi-second ‘normal’ <strong>ablation</strong>s, reflecting the simultaneous<br />
response <strong>of</strong> the multipliers. In contrast, individual 206 Pb/ 238 U<br />
ratios deviate consistently relative <strong>to</strong> this mean, largely as a result<br />
<strong>of</strong> the time-<strong>of</strong>fset between the signal intensities <strong>of</strong> the Faraday<br />
and the multipliers and the variable nature <strong>of</strong> the <strong>ablation</strong> signal.<br />
Because <strong>of</strong> the potential inaccuracies in calculating ratios by<br />
these methods we use an alternative method, integrating the<br />
whole <strong>of</strong> each pulse. This technique uses the time-resolved<br />
analysis mode s<strong>of</strong>tware on the mass spectrometer, <strong>to</strong> sum the<br />
<strong>to</strong>tal number <strong>of</strong> baseline-subtracted counts for each iso<strong>to</strong>pe from<br />
baseline-<strong>to</strong>-baseline on either side <strong>of</strong> the pulse (in this case 0.8 s <strong>to</strong><br />
3.0 s). By summing the <strong>to</strong>tal number <strong>of</strong> counts for each iso<strong>to</strong>pe<br />
we eliminate the time-<strong>of</strong>fset and decay (Tau) effects <strong>of</strong> the<br />
Faraday detec<strong>to</strong>r relative <strong>to</strong> the ion counter, because as long as<br />
the <strong>to</strong>tal signals for each iso<strong>to</strong>pe are integrated from before-<strong>shot</strong><br />
baseline <strong>to</strong> after-<strong>shot</strong> baseline there will be no systematic <strong>of</strong>fset <strong>of</strong><br />
the resulting iso<strong>to</strong>pic ratios.<br />
Uncertainties for each iso<strong>to</strong>pe ratio were calculated by<br />
assigning the limiting uncertainty based on counting statistics for<br />
the smallest ion beam <strong>of</strong> the iso<strong>to</strong>pe pair in question (e.g. that for<br />
207 Pb in the case <strong>of</strong> the 207 Pb/ 206 Pb ratio) propagated with the<br />
standard deviation <strong>of</strong> this ratio for the <strong>ablation</strong> reference material<br />
(as outlined by Horstwood 12 ). Because the 207 Pb iso<strong>to</strong>pe<br />
yields the lowest intensity, its measurement uncertainty<br />
dominates the uncertainty budget for the 207 Pb/ 206 Pb ratio <strong>of</strong> any<br />
<strong>single</strong> pulse analysis.<br />
Reference zircon data<br />
We performed two separate experiments using the 91500<br />
zircon, 13 treated as an ‘unknown’ or secondary reference material,<br />
normalised <strong>to</strong> Plesovice zircon 14 as the primary reference<br />
material. The aim <strong>of</strong> these experiments was <strong>to</strong> investigate the<br />
precision and accuracy <strong>of</strong> this <strong>approach</strong> for geochronology<br />
studies. In the first experiment we collected data from<br />
30 consecutive pulses at the same <strong>ablation</strong> site (Fig. 4). The first<br />
1358 | J. Anal. At. Spectrom., 2009, 24, 1355–1363 This journal is ª The Royal Society <strong>of</strong> Chemistry 2009
Fig. 4 Plots <strong>of</strong> 30 consecutive baseline-subtracted 206 Pb/ 238 U (A) and<br />
207 Pb/ 206 Pb (B) ratios for two reference zircons (91500 and Plesovice).<br />
Note that the first three ratios are inaccurate due <strong>to</strong> a significant<br />
component <strong>of</strong> surface common-lead.<br />
three pulses were discarded from both ‘reference’ and ‘unknown’<br />
due <strong>to</strong> high surface common-lead.<br />
The internal data point uncertainties on the measured<br />
207 Pb/ 206 Pb and 206 Pb/ 238 U ratios for an individual pulse <strong>of</strong> ‘91500’<br />
zircon are 2 and 2.8% (2s) respectively. The <strong>shot</strong>-<strong>to</strong>-<strong>shot</strong> or<br />
‘within run’ reproducibility <strong>of</strong> the measured 207 Pb/ 206 Pb<br />
and 206 Pb/ 238 U ratios is 3.6 and 3.2% (2s) respectively for<br />
91500 (Fig. 4). The fractionation index <strong>of</strong> the measured<br />
206 Pb/ 238 U ratio with increasing pulse number, calculated as the<br />
mean ratio <strong>of</strong> the second half <strong>of</strong> the run relative <strong>to</strong> that <strong>of</strong> the first<br />
half, 3 is 1.017 0.028 (2SD) for 91500 and 1.005 0.026 (2SD)<br />
for Plesovice (Fig. 4(a)). Rejecting the first three analyses <strong>of</strong><br />
91500 yields a weighted mean 206 Pb/ 238 U age <strong>of</strong> 1070 6.0 Ma<br />
(mean square weighted deviates (MSWD) ¼ 1.2) (Fig. 5(a))<br />
in reasonable agreement with the published 206 Pb/ 238 U age <strong>of</strong><br />
1062.4 0.4 Ma. 13 During this experiment material was excavated<br />
at a rate <strong>of</strong> 0.15 mm pulse 1 for a spot diameter <strong>of</strong> 50 mm,<br />
yielding a <strong>to</strong>tal volume <strong>of</strong> material ablated for 30 pulses <strong>of</strong><br />
8836 mm 3 (calculated by measuring the pit depth with an SEM).<br />
This equates <strong>to</strong> 41 ng zircon, 0.61 pg <strong>to</strong>tal ablated Pb (assuming<br />
a specific gravity <strong>of</strong> 4.65 g cm 3 15 and 14.8 ppm Pb in 91500 13 ).<br />
For comparison, at NIGL the standard <strong>ablation</strong> pro<strong>to</strong>col<br />
employs a 30 mm spot diameter, a duration <strong>of</strong> 40 s (including<br />
grow-in and washout time) and comprises 200 pulses (at 5 Hz)<br />
ablating down <strong>to</strong> 16 mm. 8,12 This results in a <strong>to</strong>tal ablated volume<br />
<strong>of</strong> 11 310 mm 3 , and consumption <strong>of</strong> 53 ng zircon, 0.78 pg Pb<br />
(for 91500). For similar LA-MC-ICP-MS set-ups, spot sizes and<br />
<strong>ablation</strong> durations, Simonetti et al. (40 mm spot, 15 mm pit<br />
depth) 2 utilise 1.3 pg <strong>to</strong>tal Pb per analysis <strong>of</strong> 91500 zircon whilst<br />
Simonetti et al. 16 (40 mm spot 5 mm pit depth) utilise 0.43 pg <strong>to</strong>tal<br />
Pb per analysis <strong>of</strong> 91500. A run <strong>of</strong> 30 consecutive <strong>single</strong> pulses<br />
Fig. 5 Pb/U concordia diagrams for: (a) 30 consecutive 1 Hz pulses; and<br />
(b)–(d) three different groups <strong>of</strong> 10 1 Hz pulses for 91500 zircon,<br />
normalised <strong>to</strong> Plesovice analysed using the same conditions. The uncertainties<br />
also include uncertainties related <strong>to</strong> the external reproducibility<br />
<strong>of</strong> the primary reference material.<br />
using the <strong>ablation</strong> conditions stated here, therefore consumes<br />
around the same amount <strong>of</strong> material as standard spot <strong>ablation</strong><br />
pro<strong>to</strong>cols regularly employed by the geochronology community.<br />
In the second experiment we obtained ten consecutive pulses<br />
from a <strong>single</strong> <strong>ablation</strong> site and repeated this in three different<br />
locations on the same crystal <strong>of</strong> ‘91500’ zircon. Again rejecting<br />
the first three pulses from each site, we obtained weighted mean<br />
206 Pb/ 238 U ages <strong>of</strong>: 1066 11 Ma (Fig. 5(b)), 1070 11 Ma<br />
(Fig. 5(c)) and 1058 18 Ma (Fig. 5(d)) respectively, all with<br />
MSWD values close <strong>to</strong> unity. The uncertainties on these analyses<br />
This journal is ª The Royal Society <strong>of</strong> Chemistry 2009 J. Anal. At. Spectrom., 2009, 24, 1355–1363 | 1359
are larger than for the 30-pulse experiment since each represents<br />
3 less data and the weighted mean calculation is dependent on<br />
the square root <strong>of</strong> n. Nevertheless, they are consistently within<br />
uncertainty <strong>of</strong> the accepted age. The <strong>to</strong>tal volume <strong>of</strong> ablated<br />
material for each ten-pulse run is 2945 mm 3 (13.7 ng zircon,<br />
0.2 pg Pb), indicating that approximately 75% less material is<br />
consumed relative <strong>to</strong> our standard <strong>ablation</strong> pro<strong>to</strong>col. Of particular<br />
note is that each pulse <strong>of</strong> the <strong>laser</strong> produces iso<strong>to</strong>pe ratios<br />
that are consistently accurate, within the defined uncertainty<br />
ellipse whilst consuming only 1.4 ng <strong>of</strong> zircon ( 20 fg Pb)<br />
therefore allowing interpretation <strong>of</strong> a pulse-<strong>to</strong>-pulse change in<br />
iso<strong>to</strong>pe ratio as indicative <strong>of</strong> depth related changes in composition.<br />
This is around half the material used by the small-spot<br />
multiple-<strong>shot</strong> <strong>approach</strong> <strong>of</strong> Johns<strong>to</strong>n et al. 17 which used 3ng<br />
zircon and ablated down 4 mm. Sensitivities for this latter<br />
<strong>approach</strong> are quoted as 2270 cps ppm 1 ng 1 U and (by calculation)<br />
1350 cps ppm 1 ng 1 206 Pb. Equivalent sensitivities<br />
described here are six times higher at 13 835 cps ppm 1 ng 1 U<br />
and 8050 cps ppm 1 ng 1 206 Pb (assuming 950 ppm U and<br />
50 ppm Pb in Plesovice). This difference is likely the result <strong>of</strong> the<br />
better transportation dynamics <strong>of</strong> the low volume <strong>ablation</strong><br />
chamber utilised in this <strong>approach</strong>. Using half the material<br />
therefore still allows a three-fold improvement <strong>of</strong> the signal/noise<br />
ratio compared <strong>to</strong> the Johns<strong>to</strong>n et al. 17 <strong>approach</strong> but sacrifices<br />
two-dimensional resolution (35–50 mm vs. 14 mm) for greater<br />
resolution in the third-dimension (0.15 mm vs. 4 mm). This is<br />
important for resolving the existence <strong>of</strong> thin metamorphic rims<br />
on zircons, the target <strong>of</strong> our study, which might otherwise be<br />
missed. Clearly, however, there is scope <strong>to</strong> utilise a combination<br />
<strong>of</strong> these two <strong>approach</strong>es <strong>to</strong> obtain data <strong>of</strong> equivalent quality on<br />
sectioned polished representative cathodoluminescence (CL)imaged<br />
zircons using <strong>ablation</strong> spots smaller than stated here but<br />
shallower than stated in Johns<strong>to</strong>n et al. 17 Since the data quality<br />
will be governed by counting statistics, an <strong>ablation</strong>, <strong>of</strong> equivalent<br />
volume <strong>to</strong> that described here for the 50 mm one-pulse <strong>approach</strong><br />
using our set-up, would be expected <strong>to</strong> yield data <strong>of</strong> equivalent<br />
quality in an <strong>ablation</strong> pit <strong>of</strong> dimensions 20 mm wide 1 mm deep<br />
( 1.5 ng zircon) and would require only 6 pulses (depending on<br />
whether the accumulation <strong>of</strong> count rate was a purely linear<br />
effect). Experiments <strong>to</strong> optimise this <strong>approach</strong> for the application<br />
<strong>of</strong> dating complexly zoned zircon phases in a similar way <strong>to</strong> that<br />
shown in Johns<strong>to</strong>n et al., 17 whilst still maintaining a depth<br />
resolution <strong>of</strong> 100 km then rapidly exhumed during the early stages <strong>of</strong> the<br />
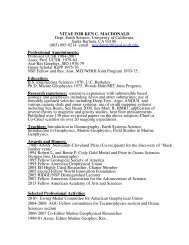
Fig. 6 CL-images <strong>of</strong> zircons from (a) KV16 and (b) BK14. Both contain<br />
thin rims surrounded by inherited cores that are <strong>to</strong>o small <strong>to</strong> analyse by<br />
conventional in situ techniques.<br />
Himalayan orogeny. For a full background <strong>to</strong> this sample the<br />
reader is referred <strong>to</strong> Parrish et al. (and references therein). 18<br />
Three <strong>single</strong> grain zircon fractions from KV16 were analysed<br />
by iso<strong>to</strong>pe dilution-thermal-ionisation mass spectrometry (ID-<br />
TIMS). They yield a linear discordia trajec<strong>to</strong>ry with intercepts <strong>of</strong><br />
45.5 6.6 Ma and 350 150 Ma (MSWD ¼ 0.4, 2s) (Fig. 7(a)).<br />
These data were interpreted by Parrish et al. 18 as being consistent<br />
with a mixture <strong>of</strong> Palaeozoic zircon (from the grani<strong>to</strong>id pro<strong>to</strong>lith)<br />
and Tertiary overgrowths. The depth resolution capability<br />
<strong>of</strong> the <strong>single</strong> pulse technique <strong>of</strong>fers an ideal opportunity <strong>to</strong><br />
establish the age <strong>of</strong> these ‘Tertiary overgrowths’ (Fig. 6(a)) with<br />
greater precision than the ID-TIMS analyses and thereby further<br />
refine the timing and duration <strong>of</strong> high pressure metamorphism<br />
and subsequent exhumation <strong>of</strong> these rocks.<br />
We selected several zircon crystals from the same bulk separate<br />
from which the ID-TIMS fractions were picked, and mounted<br />
them on double-sided sticky tape. Ten consecutive <strong>single</strong> pulse<br />
<strong>ablation</strong>s were made on four randomly selected crystals. The spot<br />
size (50 mm) and <strong>laser</strong> fluence ( 2.5 J cm 2 ) were optimised <strong>to</strong><br />
give good signal strength at a repetition rate <strong>of</strong> 1 Hz. These<br />
settings equated <strong>to</strong> a drill rate <strong>of</strong> 0.13 mm pulse 1 (as measured<br />
by SEM). As with the reference zircons described above, the first<br />
three pulses were discarded because they were dominated by<br />
common-lead. Whilst the majority <strong>of</strong> the remaining analyses are<br />
concordant, the presence <strong>of</strong> several sub-concordant points is<br />
interpreted <strong>to</strong> reflect a small amount <strong>of</strong> residual common-lead in<br />
these analyses. Pooling the data yields a weighted mean<br />
206 Pb/ 238 U age <strong>of</strong> 47.2 0.5 Ma (2SD, MSWD ¼ 1.6, n ¼ 27)<br />
(Fig. 7(c)). This age is consistent with 46.4 0.9 Ma allanite from<br />
the same rock 16 as well as 46.4 0.1 Ma zircon from a mafic<br />
eclogite enclosed within the gneiss, validating the geologic<br />
significance <strong>of</strong> the age and our methodology.<br />
As a second example, BK14 is an augen gneiss from the<br />
Greater Himalayan Series <strong>of</strong> north-central Bhutan (the geologic<br />
context <strong>of</strong> this sample is given by Parrish et al.). 19 Five <strong>single</strong> and<br />
one multi-grain zircon fractions were analysed by ID-TIMS.<br />
1360 | J. Anal. At. Spectrom., 2009, 24, 1355–1363 This journal is ª The Royal Society <strong>of</strong> Chemistry 2009
Fig. 7 (a) Pb/U concordia diagram for ID-TIMS zircon data for granitic<br />
gneiss KV16 from Kaghan Valley, Northern Pakistan, re-plotted with<br />
permission from ref. 18. Copyright 2006, Geological Society <strong>of</strong> America.<br />
(b) Pb/ 238 U concordia diagram for 27 <strong>single</strong> pulse analyses from four<br />
KV16 zircon crystals. (c) 206 Pb/ 238 U ages for the same data in (c).<br />
They yielded a linear discordia trajec<strong>to</strong>ry with intercepts <strong>of</strong><br />
72 41 Ma and 514 3 Ma (MSWD ¼ 0.45) (inset <strong>to</strong><br />
Fig. 8(a)). 19 The upper intercept can be confidently interpreted in<br />
terms <strong>of</strong> a Cambrian grani<strong>to</strong>id pro<strong>to</strong>lith age, consistent with<br />
numerous other augen gneisses throughout the Himalayas. In<br />
contrast, the lower intercept age is extremely difficult <strong>to</strong> interpret.<br />
The fact that it yields a ‘non-zero’ age raises at least two<br />
possibilities: (1) there has been a significant amount <strong>of</strong> radiogenic<br />
Fig. 8 (a) Pb/U concordia diagram <strong>of</strong> ID-TIMS zircon data from<br />
orthogneiss BK14. (b) Pb/U concordia diagram for 14 consecutive <strong>single</strong><br />
pulses from a <strong>single</strong> BK14 zircon. (c) and (d) 206 Pb/ 238 U age depth pr<strong>of</strong>iles<br />
for two zircon crystals from BK14.<br />
lead loss, and/or (2) that <strong>new</strong> zircon growth occurred during the<br />
Himalayan orogenesis (i.e. at
<strong>of</strong> material consumed and precision achieved, nevertheless it<br />
demonstrates that by using the <strong>single</strong> pulse method it is possible<br />
<strong>to</strong> extract geologically meaningful age information from<br />
domains as thin as 1 mm in zoned accessory phases.<br />
Summary<br />
The method presented here represents a significant departure<br />
from previous LA-ICP-MS Pb/U acquisition pro<strong>to</strong>cols. Standard<br />
procedures employ continuous pulsing <strong>of</strong> the <strong>laser</strong> at higher<br />
frequencies and a multi-second analysis period. In contrast, our<br />
data demonstrate that it is possible <strong>to</strong> extract iso<strong>to</strong>pe data from<br />
<strong>single</strong> pulses <strong>of</strong> a <strong>laser</strong> with uncertainties useful for Pb/U<br />
geochronology. Within a <strong>single</strong> pulse pr<strong>of</strong>ile, integration-byintegration<br />
iso<strong>to</strong>pic and inter-element ratios are inaccurate when<br />
measured on disparate detec<strong>to</strong>rs, largely as a result <strong>of</strong> differing<br />
detec<strong>to</strong>r response and decay times. This can be overcome by<br />
employing a <strong>to</strong>tal signal integration method that sums the<br />
intensities <strong>of</strong> each iso<strong>to</strong>pe for the entire pulse duration and<br />
calculates a <strong>single</strong> intensity for each analyte. Iso<strong>to</strong>pe ratios and<br />
resulting ages obtained from reference zircons are consistently<br />
within the uncertainty <strong>of</strong> published values validating our <strong>to</strong>tal<br />
signal integration <strong>approach</strong>.<br />
Pooling 30 <strong>single</strong> pulse analyses produces <strong>to</strong>tal uncertainties<br />
that are comparable <strong>to</strong> data from a multi-second smaller spot<br />
analysis. It is possible <strong>to</strong> reduce sample consumption <strong>to</strong> 75% less<br />
material than ‘normal’, with the resulting 2 loss in precision,<br />
balanced by the benefit <strong>of</strong> minimal sample destruction.<br />
For a 30 pulse analysis the Pb/U fractionation with increasing<br />
pulse number (which equals depth) is in the order <strong>of</strong> 1.7% and<br />
0.5% for 91500 and Plesovice reference zircons respectively. This<br />
contrasts with 8% fractionation during normal 40 s static<br />
<strong>ablation</strong>s at 25–50 mm spot diameter, 2–3 J cm 2 fluence at 5 Hz<br />
repetition rate (equating <strong>to</strong> 200 pulses/analysis, e.g. ref. 12).<br />
This is attributed <strong>to</strong> the low crater depth/diameter aspect<br />
ratio <strong>of</strong>
Acknowledgements<br />
The Natural Environment Research Council is thanked for<br />
providing support <strong>to</strong> NIGL which allowed support <strong>of</strong> J.M.C. as<br />
an NIGL Iso<strong>to</strong>pe Apprentice and the development <strong>of</strong> this<br />
application. Simon Chenery and three anonymous reviewers are<br />
thanked greatly for helping improve the manuscript through<br />
their constructive reviews.<br />
References<br />
1 J. Kosler, in Laser Ablation ICP-MS in the Earth Sciences: Current<br />
Practices and Outstanding issues, ed. P. Sylvester, Mineralogical<br />
Association <strong>of</strong> Canada, Quebec, Short Course Series, 2008, vol. 40,<br />
pp. 79–92.<br />
2 A. Simonetti, L. M. Heaman, R. P. Hartlaub, R. A. Creaser,<br />
T. G. MacHattie and C. Bohm, J. Anal. At. Spectrom., 2005, 20,<br />
677–686.<br />
3 B. J. Fryer, S. E. Jackson and H. P. Longerich, Can. Mineral., 1995,<br />
33, 303–312.<br />
4 I. Horn, R. L. Rudnick and W. F. McDonough, Chem. Geol., 2000,<br />
164, 281–301.<br />
5 A. M. Leach and G. M. Hieftje, J. Anal. At. Spectrom., 2000, 15, 1121.<br />
6 T. Pettke, C. A. Heinrich, A. C. Ciocan and D. G€unther, J. Anal. At.<br />
Spectrom., 2000, 15, 1149.<br />
7 H. Liu, X. Mao and R. E. Russo, J. Anal. At. Spectrom., 2001, 16,<br />
1115–1120.<br />
8 M. S. A. Horstwood, G. L. Foster, R. R. Parrish, S. R. Noble and<br />
G. M. Nowell, J. Anal. At. Spectrom., 2003, 18, 837–846.<br />
9 D. Bleiner and D. G€unther, J. Anal. At. Spectrom., 2001, 16, 449–456.<br />
10 A. H. Jaffey, K. F. Flynn, L. E. Glendenin, C. R. Bentley and<br />
A. M. Essling, Phys. Rev., 1971, C4, 1889–1906.<br />
11 K. R. Ludwig, Isoplot 3.00 A geochronological <strong>to</strong>olkit for Micros<strong>of</strong>t<br />
Excel, Berkeley Geochronology Center, California, 2003.<br />
12 M. S. A. Horstwood, in Laser Ablation ICP-MS in the Earth Sciences:<br />
Current Practices and Outstanding issues, ed. P. Sylvester,<br />
Mineralogical Association <strong>of</strong> Canada, Quebec, Short Course Series,<br />
2008, vol. 40, pp. 283–303.<br />
13 M. Wiedenbeck, P. Alle, F. Corfu, W. L. Griffin, M. Meier, F. Oberli,<br />
A. Von Quadt, J. C. Roddick and W. Spiegel, Geostand. Newsl., 1995,<br />
19, 1–23.<br />
14 J. Slama, J. Kosler, D. J. Condon, J. L. Crowley, A. Gerdes,<br />
J. M. Hanchar, M. S. A. Horstwood, G. A. Morris, L. Nasdala,<br />
N. Norberg, U. Schaltegger, B. Schoene, M. N. Tubrett and<br />
M. J. Whitehouse, Chem. Geol., 2008, 249, 1–35.<br />
15 W. A. Deer, R. A. Howie and J. Zussman, An Introduction <strong>to</strong> the<br />
Rock-Forming Minerals, Longman, London, UK, 2nd edn, 1992.<br />
16 A. Simonetti, L. M. Heaman and T. Chacko, in Laser Ablation<br />
ICP-MS in the Earth Sciences: Current Practices and Outstanding<br />
issues, ed. P. Sylvester, Mineralogical Association <strong>of</strong> Canada,<br />
Quebec, Short Course Series, 2008, vol. 40, pp. 241–264.<br />
17 S. Johns<strong>to</strong>n, G. Gehrels, V. Valencia and J. Ruiz, Chem. Geol., 2009,<br />
259, 218–229.<br />
18 R. R. Parrish, S. J. Gough, M. P. Searle and D. J. Waters, Geology,<br />
2006, 34, 989–992.<br />
19 R. R. Parrish, D. Grujic, L. S. Hollister, K. Klepeis, R. K€undig and<br />
R. Dorji, 12th Himalaya-Karakoram-Tibet International Workshop,<br />
Rome, Abs Vol, 1997.<br />
20 C. G. Daniel, L. S. Hollister, R. R. Parrish and D. Grujic,<br />
J. Metamorph. Geol., 2003, 21, 317–334.<br />
21 J. M. Cottle, M. S. A. Horstwood and R. R. Parrish, Rapid and<br />
precise Laser <strong>ablation</strong> U(-Th)-Pb geochronologyat the sub-micron<br />
scale, Eos, American Geophysical Union, Washing<strong>to</strong>n D. C., U. S.,<br />
Fall Meeting 2008, 89((53)), Abstract V13A-2089.<br />
22 M. Grove and T. M. Harrison, Geology, 1999, 27, 487–490.<br />
23 C. J. Carson, J. J. Ague, M. Grove, C. D. Coath and T. M. Harrison,<br />
Earth Planet. Sci. Lett., 2002, 199, 287–310.<br />
This journal is ª The Royal Society <strong>of</strong> Chemistry 2009 J. Anal. At. Spectrom., 2009, 24, 1355–1363 | 1363