yy^SS^-.^T - ISMAR
yy^SS^-.^T - ISMAR
yy^SS^-.^T - ISMAR

You also want an ePaper? Increase the reach of your titles
YUMPU automatically turns print PDFs into web optimized ePapers that Google loves.
a<br />
(D-<br />
Ofi<br />
'£*.<br />
y y ^SS^-.^ T -.:?\;^<br />
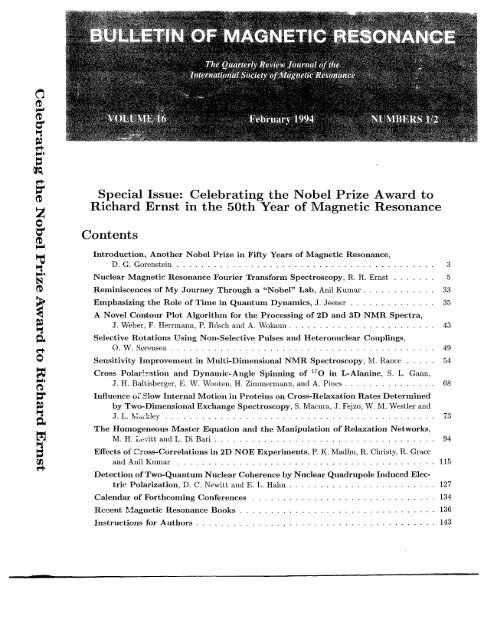
Special Issue: Celebrating the Nobel Prize Award to<br />
Richard Ernst in the 50th Year of Magnetic Resonance<br />
Contents<br />
Introduction, Another Nobel Prize in Fifty Years of Magnetic Resonance,<br />
D. G. Gorenstein 3<br />
Nuclear Magnetic Resonance Fourier Transform Spectroscopy, R. R. Ernst 5<br />
Reminiscences of My Journey Through a "Nobel" Lab, Anil Kumar 33<br />
Emphasizing the Role of Time in Quantum Dynamics, J. Jeener 35<br />
A Novel Contour Plot Algorithm for the Processing of 2D and 3D NMR Spectra,<br />
J. Weber, F. Herrmann, P. Rosch and A. Wokaun 43<br />
Selective Rotations Using Non-Selective Pulses and Heteronuclear Couplings,<br />
O. W. S0rensen 49<br />
Sensitivity Improvement in Multi-Dimensional NMR Spectroscopy, M. Ranee 54<br />
Cross Polarization and Dynamic-Angle Spinning of 17 O in L-Alanine, S. L. Gann,<br />
J. H. Baltisberger, E. W. Wooten, H. Zimmermann, and A. Pines 68<br />
Influence of Slow Internal Motion in Proteins on Cross-Relaxation Rates Determined<br />
by Two-Dimensional Exchange Spectroscopy, S. Macura, J. Fejzo, W. M. Westler and<br />
J. L. Maikley 73<br />
The Homogeneous Master Equation and the Manipulation of Relaxation Networks,<br />
M. H. Levitt and L. Di Bari 94<br />
Effects of Cross-Correlations in 2D NOE Experiments, P. K. Madhu, R. Christy, R. Grace<br />
and Anil Kumar 115<br />
Detection of Two-Quantum Nuclear Coherence by Nuclear Quadrupole Induced Electric<br />
Polarization, D. C. Newitt and E. L. Harm 127<br />
Calendar of Forthcoming Conferences 134<br />
Recent Magnetic Resonance Books 136<br />
Instructions for Authors 143
BULLETIN OF MAGNETIC RESONANCE<br />
The Quarterly Review Journal of the<br />
International Society of Magnetic Resonance<br />
Editor:<br />
DAVID G. GORENSTEIN<br />
Department of Chemistry<br />
Purdue University<br />
West Lafayette, IN 47907 U.S.A.<br />
Fax: 317-494-0239<br />
INTERNET :david@chem.purdue .edu<br />
Editorial Board:<br />
E.R.ANDREW LAWRENCE BERLINER ROBERT BLINC<br />
University of Florida Ohio State University E. Kardelj University of Ljubljana<br />
Gainesville, Florida, U.S.A. Columbus, Ohio, U.S.A. Ljubljana, Yugoslavia<br />
H. CHIHARA GARETH R. EATON DANIEL FIAT<br />
Osaka University University of Denver University of Illinois at Chicago<br />
Toyonaka, Japan Denver, Colorado, U.S.A. Chicago, Illinois, U.S.A.<br />
SHIZUO FUJIWARA DAVID GRANT ALEXANDER PINES<br />
University of Tokyo University of Utah University of California<br />
Bunkyo-Ku, Tokyo, Japan Salt Lake City, Utah, U.S.A. Berkeley, California, U.S.A.<br />
MIK PINTAR CHARLES P. POOLE, JR. BRIAN SYKES<br />
University of Waterloo University of South Carolina University of Alberta<br />
Waterloo, Ontario, Canada Columbia, South Carolina, U.S.A. Edmonton, Alberta, Canada<br />
The Bulletin of Magnetic Resonance is a quarterly review journal by the International Society of<br />
Magnetic Resonance. Reviews cover all parts of the broad field of magnetic resonance, viz.. the<br />
theory and practice of nuclear magnetic resonance, electron paramagnetic resonance, and nuclear<br />
quadrupole resonance spectroscopy including applications in physics, chemistry, biology, and<br />
medicine. The BULLETIN also acts as a house journal for the International Society of Magnetic<br />
Resonance.<br />
CODEN: BUMRDT ISSN: 0163-559X<br />
Bulletin of Magnetic Resonance, The Quarterly Journal of International Society of Magnetic<br />
Resonance. 1994 copyright by the International Society of Magnetic Resonance. Rates: Libraries<br />
and non-<strong>ISMAR</strong> members $80.00, members of <strong>ISMAR</strong>, $25.00. All subscriptions are for a volume<br />
year. All rights reserved. No part of this journal may be reproduced in any form for any purpose or by<br />
any means, abstracted, or entered into any data base, electronic or otherwise, without specific<br />
permission in writing from the publisher.
J. ANGLISTER<br />
Israel<br />
G. BODENHAUSEN<br />
Switzerland<br />
R. DESLAURIERS<br />
Canada<br />
E.L. HAHN<br />
U.S.A.<br />
H-J. JAKOBSEN<br />
Denmark<br />
C.L. KHETRAPAL<br />
India<br />
H.C. PANEPUCCI<br />
Brazil<br />
M. PUNKEMEN<br />
Finland<br />
V. SKLENAR<br />
Czechoslovakia<br />
H.W. SPIESS<br />
Germany<br />
J.S. WAUGH<br />
U.S.A.<br />
K. WUTHRICH<br />
Switzerland<br />
Council of the International Society of Magnetic Resonance<br />
President: A. PINES, U.S.A.<br />
Vice-President: M. GOLDMAN, France<br />
Founding Chairman: D. FIAT, U.S.A.<br />
Secretary-General: P. SERVOZ-GAVIN, France<br />
Treasurer: R.R. VOLD, U.S.A.<br />
Past President: R. FREEMAN, England<br />
E.D. BECKER<br />
U.S.A.<br />
P.T. CALLAGHAN<br />
New Zealand<br />
S. FORSEN<br />
Sweden<br />
R.K. HARRIS<br />
England<br />
R. KAPTEIN<br />
The Netherlands<br />
B. MARAVIGLIA<br />
Italy<br />
V. PETROSIAN<br />
C.I.S.<br />
J. REISSE<br />
Belgium<br />
C.P. SLICHTER<br />
U.S.A.<br />
H. STERK<br />
Austria<br />
A.B. WIECKOWSKI<br />
Poland<br />
C.S. YANNONI<br />
U.S.A.<br />
M.R. BENDALL<br />
Australia<br />
S. CLOUGH<br />
England<br />
C.FYFE<br />
Canada<br />
M.J.R. HOCH<br />
5. Africa<br />
D. KELLY<br />
Australia<br />
M. MEHRING<br />
Germany<br />
MM. PINTAR<br />
Canada<br />
G.C.K. ROBERTS<br />
England<br />
P. SOHAR<br />
Hungary<br />
T.TERAO<br />
Japan<br />
X-W.WU<br />
China<br />
The aims of the International Society of Magnetic Resonance are to advance and diffuse knowledge<br />
of magnetic resonance and its applications in physics, chemistry, biology, and medicine, and to<br />
encourage and develop international contacts between scientists.<br />
The Society sponsors international meetings and schools in magnetic resonance and its applications<br />
and publishes the quarterly review journal. The Bulletin of Magnetic Resonance, the house journal of<br />
<strong>ISMAR</strong>.<br />
The annual fee for <strong>ISMAR</strong> membership is $20 plus $25 for a member subscription to the Bulletin of<br />
Magnetic Resonance.<br />
Send subscription to: International Society of Magnetic Resonance<br />
Professor Regitze R. Void, Treasurer<br />
Department of Chemistry<br />
University of California, San Diego<br />
9500 Gilman Drive<br />
La Jolla, CA 92093-0340<br />
(619) 534-0200; FAX (619) 534-6174<br />
e-mail: rrvold@ucsd.edu
Vol. 16, No. 1/2 3<br />
Introduction, Another Nobel Prize in Fifty Years of Magnetic Resonance<br />
In this issue of the Bulletin of Magnetic Resonance,<br />
we celebrate the success of one of the<br />
leaders of modern magnetic resonance. In 1991,<br />
Richard R. Ernst received the Nobel Prize in Chemistry<br />
for his major contributions to the development<br />
of Fourier transform and multidimensional NMR.<br />
This year, 1994, represents the 50th anniversary of<br />
the discovery of electron paramagnetic resonance by<br />
Zavoisky (1) as reported in his 1944 Thesis (Figure<br />
1). Next year, 1995, represents the 50th anniversary<br />
of the discovery of nuclear magnetic resonance<br />
and the subsequent publication of the results<br />
in 1946. These experiments of E. M. Purcell,<br />
H. G. Torrey and T. V. Pound at Harvard (2) and<br />
F. Bloch, W. Hansen and M. E. Packard (3) at Stanford<br />
ultimately led to the award of the first Nobel<br />
Prize in nuclear magnetic resonance to Bloch and<br />
Purcell in 1952. In fact 1994 also represents the<br />
50th anniversary of the award of the Nobel Prize to<br />
another famous researcher in the field, Isidor I. Rabi<br />
for his groundbreaking molecular-beam experiments<br />
(4). A very lucid discussion of the early history of<br />
magnetic resonance can be found in a Bulletin article<br />
by Norman Ramsey (5).<br />
In this special issue of the Bulletin, we have reproduced<br />
the Nobel Prize award lecture of Richard<br />
Ernst. In addition articles from some of his past<br />
coworkers and other eminent NMR spectroscopists<br />
have been included. As noted by Dr. Ernst, both in<br />
his article and in an <strong>ISMAR</strong> 1992 Special Plenary<br />
Lecture, his success rests on the many significant<br />
contributions of others in the field.<br />
Unlike almost all other fields of science, the theory<br />
and application of magnetic resonance has been<br />
on an exponentially rising curve for the past 50<br />
years. Normally in science we expect an exciting<br />
new field to draw initially many new participants to<br />
it (the "bandwagon" phenomenon) with a resulting<br />
explosion of new discoveries. However, once many of<br />
the major questions are answered, an equilibrium in<br />
the population of top scientists is established. The<br />
result is an S-shaped curve characterizing the vitality<br />
of a field with time. Ultimately as the field passes<br />
from favor (fewer grant funds!), many participants<br />
David G. Gorenstein, Editor<br />
Q<br />
90<br />
80<br />
70<br />
CO<br />
50<br />
30\<br />
10<br />
1<br />
1<br />
i<br />
1<br />
—<br />
0 ZOO ¥dij 600 800 WO012001W0<br />
Figure 1: Electron paramagnetic resonance spectrum<br />
of CrCl3, from Zavoisky (1).<br />
migrate to the next exciting development in science.<br />
This often leads to an actual decrease of scientists<br />
in the field. The vitality of the field is now better<br />
characterized by a bell-shaped curve.<br />
The lifetime of a field in science is often disturbingly<br />
short, 15 to 25 years. However, this has<br />
not been the case with magnetic resonance, where<br />
we find that even after these past five decades we<br />
still are on the rising exponential portion of the<br />
curve. The reason for the difference of course is<br />
that there have been numerous ways of inventing<br />
new and exciting applications and understanding of<br />
magnetic resonance. As pointed out by R. Ernst<br />
(6), "I am not aware of any other field of science<br />
outside of magnetic resonance that offers so much
freedom and opportunities for a creative mind to<br />
invent and explore new experimental schemes that<br />
can be fruitfully applied in a variety of disciplines."<br />
In the first wave physicists discovered much basic<br />
magnetic resonance theory. This is still going<br />
on today as evidenced by the continued strong participation<br />
of physical scientists in the meetings of<br />
the International Society of Magnetic Resonance.<br />
Early on chemists began to recognize the importance<br />
of the chemical shift and coupling information<br />
as a way to identify the structure of molecules.<br />
A new wave of interest developed as commercial<br />
machines were built and that wave also continues<br />
to this day. Biochemists followed in turn<br />
as instruments became more sensitive and applications<br />
to biomolecular structure and function took<br />
off. That wave especially continues to expand exponentially<br />
today following the more recent introduction<br />
of Fourier transform, 2D and now multidimensional<br />
NMR spectroscopy - fields richly contributed<br />
by Richard Ernst.<br />
I don't believe that any of the early visionaries<br />
of magnetic resonance would have thought that<br />
NMR, with such low sensitively, could ever be used<br />
for 3D imaging. Magnetic resonance imaging and<br />
spectroscopy now constitute a fourth phase of this<br />
explosion, and now we are also seeing new developments<br />
in solid state magnetic resonance and materials<br />
science that hold much promise as well for the<br />
future. Each of these waves has brought forth ever<br />
more diverse and creative scientists into our field.<br />
In this issue Anil Kumar describes his journey<br />
through Richard Ernst's laboratory. Jean Jeener,<br />
the pioneer of the first 2D NMR pulse experiment,<br />
takes us on a journey through time in quantum dynamics.<br />
Alexander Wokaun and colleagues describe<br />
an algorithm that may help lead to automated assignment<br />
of multidimensional NMR spectra. Ole<br />
S0rensen describes some novel pulse sequences for<br />
multidimensional NMR. Mark Ranee again returns<br />
to multidimensional NMR (clearly a popular field!)<br />
and methods for improving sensitivity. Alex Pines<br />
and colleagues describe some of their pioneering developments<br />
in dynamic-angle spinning. Slobadan<br />
Macura and colleagues take us back to 2D NMR and<br />
motional effects in cross-relaxation/exchange spectroscopy.<br />
Malcolm Levitt and colleague present a<br />
novel method for treating spin dynamics using the<br />
homogeneous master equation. Anil Kumar returns<br />
Bulletin of Magnetic Resonance<br />
with his colleagues to discuss the importance of<br />
cross-correlations in 2D NOE experiments. Finally,<br />
one of the first pioneers of pulsed NMR spectroscopy,<br />
Erwin Hahn describes with his colleague some<br />
nuclear electric resonance detection.<br />
Where is it all going? As pointed out by Richard<br />
Ernst, following the discovery of X-rays many Nobel<br />
Prizes have been awarded in that field, including<br />
medical and biomolecular structure applications. It<br />
is rather obvious that over the next 50 years we<br />
will also see many more major magnetic resonance<br />
discoveries and applications, with numerous other<br />
Nobel Prizes and awards to come.<br />
REFERENCES<br />
X<br />
E. K. Zavoisky, Ph. D. Thesis (1944) and J.<br />
Phys. USSR 9, 211 and 245 (1945) and 10, 197<br />
(1946).<br />
2<br />
E. M. Purcell, H. G. Torrey and R. V. Pound,<br />
Phys. Rev. 69, 37 (1946).<br />
3<br />
F. Bloch, W. Hansen and M. E. Packard, Phys.<br />
Rev. 69, 127 (1946).<br />
4 I. I. Rabi, Phys. Rev. 51, 652 (1937); J. M.<br />
B. Kellogg, I. I. Rabi, N. F. Ramsey and J. R.<br />
Zacharias, Phys. Rev. 57, 677 (1940).<br />
5 N. F. Ramsey, Bull. Magn. Reson. 7, 94<br />
(1984).<br />
6 R. Ernst, Bull. Magn. Reson. 16, 5 (1994);<br />
following article.<br />
P.S. The next meeting of <strong>ISMAR</strong> will be held<br />
in Sydney, Australia from July 16-21, 1995. The<br />
council is discussing several possible sites for the<br />
1998 meeting in Europe. If you are interested in<br />
hosting the next <strong>ISMAR</strong> meeting in 2001, please<br />
contact the president of the society:<br />
Dr. Alexander Pines<br />
Department of Chemistry<br />
University of California<br />
Berkeley, California 94720 USA<br />
Telephone: 415-642-1220<br />
Fax: 415-486-5744.<br />
Clearly the field of magnetic resonance will be<br />
thriving into the next century.
Vol. 16, No. 1/2 5<br />
Contents<br />
Nuclear Magnetic Resonance Fourier Transform<br />
Spectroscopy (Nobel Lecture) 1<br />
Richard R. Ernst<br />
Laboratorium fur Physikalische Chemie, Eidgenossische Technische Hochschule<br />
ETH-Zentrum 8092 Zurich, Switzerland<br />
I. Introduction 5<br />
II. One-Dimensional Fourier Transform Spectroscopy 7<br />
III. Two-Dimensional Fourier Transform Spectroscopy 9<br />
IV. Modified Two-Dimensional FT-NMR Experiments 15<br />
V. Relayed Correlation 15<br />
VI. Rotating Frame Experiments 15<br />
VII. Multiple-Quantum Spectroscopy 18<br />
VIII. Multiple-Quantum Filtering 19<br />
IX. Spin-Topology Filtration 22<br />
X. Exclusive Correlation Spectroscopy 22<br />
XI. Heteronuclear Two-Dimensional Experiments 22<br />
XII. Three-Dimensional Fourier-Transformation Spectroscopy 23<br />
XIII. Molecular Dynamics Investigated by NMR 25<br />
XIV. Magnetic Resonance Fourier Imaging 27<br />
XV. Conclusion 28<br />
XVI. References 29<br />
I. Introduction<br />
The world of the nuclear spins is a true par- mechanics and quantum statistics, and numerous<br />
adise for theoretical and experimental physicists. textbook-like examples have emerged. On the other<br />
It supplies, for example, most simple test systems hand, the ease in handling nuclear spin systems prefor<br />
demonstrating the basic concepts of quantum destines them for the testing of novel experimental<br />
concepts. Indeed, the universal procedures of co-<br />
^opyright © The Nobel Foundation 1992. - We thank , ,<br />
,. -, . , J? j .. r,, i, , t • • . -4.il.- herent spectroscopy have been developed predomithe<br />
Nobel Foundation, Stockholm, for permission to print this K KJ .<br />
lecture. nantly within nuclear magnetic resonance (NMR)
6 Bulletin of Magnetic Resonance<br />
and have found widespread application in a variety<br />
of other fields.<br />
Several key experiments of magnetic resonance<br />
have already been honored by Nobel prizes in<br />
physics, starting with the famous molecular-beam<br />
experiments by Isidor I. Rabi (1-3) acknowledged in<br />
1944, followed by the classical NMR experiments by<br />
Edward M. Purcell (4) and Felix Bloch (5,6), honored<br />
with the 1952 prize, and the optical detection<br />
schemes by Alfred Kastler (7), leading to a prize in<br />
1966. Some further Nobel prize winners in Physics<br />
have been associated in various ways with magnetic<br />
resonance: John H. Van Vleck developed the theory<br />
of dia- and paramagnetism and introduced the<br />
moment method into NMR; Nicolaas Bloembergen<br />
had a major impact on early relaxation theory and<br />
measurements; Karl Alex Miiller contributed significantly<br />
to electron paramagnetic resonance; Norman<br />
F. Ramsey is responsible for the basic theory<br />
of chemical shifts and J couplings; and Hans G.<br />
Dehmelt developed pure nuclear quadrupole resonance.<br />
But not only for physicists is nuclear magnetic<br />
resonance of great fascination. More and more<br />
chemists, biologists and medical doctors discover<br />
NMR spectroscopy, not so much for its conceptual<br />
beauty but for its extraordinary usefulness. In this<br />
context, a great number of magnetic resonance tools<br />
have been invented to enhance the power of NMR in<br />
view of a variety of applications (8-15). This Nobel<br />
lecture provides a glimpse behind the scenes in an<br />
NMR toolmaker's workshop.<br />
Nuclear spin systems possess unique properties<br />
that predestine them for studies of molecules:<br />
1) The atomic nuclei serving as sensors are extremely<br />
well localized, with a diameter of a few femtometers,<br />
and can report on local affairs in their<br />
immediate vicinity. It is thus possible to explore<br />
molecules and matter in great detail.<br />
2) The interaction energy of the sensors with<br />
the environment is extremely small, less than 0.2<br />
J mol" 1 , corresponding to the thermal energy at 30<br />
mK. The monitoring of molecular properties is thus<br />
virtually perturbation-free. Nevertheless, the interaction<br />
is highly sensitive to the local environment.<br />
3) Information on the structure of molecules can<br />
be obtained from nuclear pair interactions: Magnetic<br />
dipole-dipole interactions provide distance information,<br />
while scalar J couplings allow one to de-<br />
termine dihedral angles.<br />
At first glance, it may be astonishing that it is<br />
possible to accurately determine internuclear distances<br />
by radio frequencies with wavelengths A »<br />
1 m, since this seemingly violates the quantum mechanical<br />
uncertainty relation, aq • ap > Ti/2, with<br />
the linear momentum p = 2nh/X, as it applies to<br />
scattering experiments or to a microscope. It is<br />
important that in magnetic resonance the geometric<br />
information is encoded in the spin Hamiltonian,<br />
7i = 7i (qi,..., qfc), where q^ is the nuclear coordinates.<br />
An accurate structure determination, therefore,<br />
boils down to an accurate energy measurement<br />
that can be made as precise as desired, provided<br />
that the observation time t is extended according<br />
to CTE • t > %/2. An upper limit of t is in practice<br />
given by the finite lifetime of the energy eigenstates<br />
due to relaxation processes. Thus, the accuracy of<br />
NMR measurements is not restricted by the wavelength<br />
but rather by lifetimes limited by relaxation<br />
processes.<br />
The information content of a nuclear spin Hamiltonian<br />
and the associated relaxation superoperator<br />
of a large molecule, for example a protein, is immense:<br />
It is possible to determine the frequencies of<br />
the chemical shifts of hundreds of spins in a molecule<br />
to an accuracy of 16-18 bits. Internuclear distances<br />
for thousands of proton pairs can be measured to<br />
about 0.1 A. Several hundred dihedral angles in a<br />
molecule can be determined with an uncertainty of<br />
less than 10°.<br />
The weakness of the nuclear spin interactions, so<br />
far described as an advantage, leads on the other<br />
hand to severe problems in detection. Large numbers<br />
of spins are required to discriminate the weak<br />
signals from noise. Under optimum conditions with<br />
modern high-field NMR spectrometers, 10 14 -10 15<br />
spins of one kind are needed to detect a signal within<br />
a measurement time of one hour. The low signal-tonoise<br />
ratio is the most limiting handicap of NMR.<br />
Any increase by technical means would significantly<br />
extend the possible range of NMR applications.<br />
This clearly defines the two goals that had to be<br />
achieved during the past three decades to promote<br />
NMR as a practical tool for molecular structure determination:<br />
1) Optimization of the signal-to-noise<br />
ratio; 2) Development of procedures to cope with<br />
the enormous amount of inherent information on the<br />
molecule under investigation.
Vol. 16, No. 1/2<br />
FT CW<br />
Figure 1: Schematic representation of pulse FT<br />
spectroscopy illustrated by the 60 MHz 1 H NMR<br />
spectrum of 7-ethoxy-4-methylcoumarin (22). An<br />
initial (7r/2)y rf pulse, represented by the rotation<br />
superoperator P, excites the transverse magnetization<br />
with Fy — where Iky is a component angular<br />
momentum operator of spin k. 7i is the Hamiltonian<br />
commutator superoperator,7iA = [H, A] and F is<br />
the relaxation superoperator. The expectation value<br />
(t) of the observable operator D is then given<br />
by eqn. 2, where cr$ represents the density operator<br />
of the spin system in thermal equilibrium.<br />
< D > (i) = Tr{DE(t)Pcr0} (2)<br />
The reduction in performance time for one spectrum<br />
is determined by the number of spectral elements<br />
N, that is, the number of significant points in<br />
the spectrum, roughly given by N = F/Af, where<br />
F is the total width of the frequency range and A/<br />
a typical linewidth of a signal. A corresponding increase<br />
in the signal-to-noise ratio of y/~N per unit<br />
time can be obtained by coadding an appropriate<br />
number of FID signals originating from a repeated<br />
pulse experiment. The gain in signal-to-noise can<br />
be appreciated from Figure 1.<br />
It has been known for a long time that the frequency<br />
response function (spectrum) of a linear system<br />
is the Fourier transform of the impulse response<br />
(FID). This was already implicitly evident<br />
in the work of Jean Baptiste Joseph Fourier who in<br />
1822 investigated the heat conduction in solid bodies<br />
(24). In 1957 Lowe and Norberg proved this<br />
relation to hold also for spin systems despite their<br />
strongly nonlinear response characteristics (25).<br />
Stochastic testing of unknown systems by white<br />
random noise was proposed in the forties by Norbert<br />
Wiener (26). One could say that the color of<br />
the output noise carries the spectral information on<br />
the investigated system. The first applications of<br />
random noise excitation in NMR spectroscopy were<br />
proposed independently by Russel H. Varian (27)<br />
and by Hans Primas (28,29) for broad-band excitation<br />
and broad-band decoupling, respectively. The<br />
first successful experiments using random noise irradiation<br />
led to heteronuclear "noise decoupling"<br />
(30,31), a method that proved to be essential for<br />
the practical success of 13 C NMR spectroscopy in<br />
chemical applications.<br />
In 1970, Reinhold Kaiser (32) and the author<br />
(33) independently demonstrated stochastic resonance<br />
as a means to improve the signal-to-noise<br />
ratio of NMR experiments by broad-band irradiation.<br />
Here, the computed cross-correlation function<br />
Bulletin of Magnetic Resonance<br />
(eqn. 3) of the input noise n;(i) and the output noise<br />
no(t) is equivalent to the FID of pulse FT spectroscopy.<br />
CI(TT) = no(t)ni(t - T) (3)<br />
This is illustrated in Figure 2 for fluorine resonance<br />
of 2,4-difluorotoluene. A binary pseudo-random sequence<br />
with a maximal white spectrum is used for<br />
excitation. Its advantages are the predictable spectral<br />
properties and the constant rf power. The low<br />
peak-power puts less stringent requirements on the<br />
electronic equipment. Disadvantages arise from the<br />
simultaneous irradiation and detection which can<br />
lead to line-broadening effects absent in pulse FT<br />
spectroscopy in which perturbation and detection<br />
are separated in time. A further disadvantage, when<br />
real random noise is used, is the probabilistic nature<br />
of the response which requires extensive averaging<br />
to obtain a stable mean value. Higher order correlation<br />
functions, such as eqn. 4 allow also the characterization<br />
of nonlinear transfer properties of the<br />
investigated system (26).<br />
= no(t)rii(t - - r2)rij(t - r3)<br />
(4)<br />
This has been exploited extensively by Bliimich and<br />
Ziessow for NMR measurements (34,35).<br />
A third approach, rapid scan spectroscopy,<br />
initially proposed by Dadok and Sprecher (36),<br />
achieves a virtually simultaneous excitation of all<br />
spins by a rapid sweep through the frequency range<br />
(37,38). The resulting spectrum is strongly distorted,<br />
but can be corrected mathematically because<br />
of the deterministic nature of the distortions.<br />
Correction amounts to convolution with the signal<br />
of a single spin measured under identical conditions<br />
or simulated on a computer. An example is given<br />
in Figure 3. It is interesting to note how similar<br />
a rapid scan spectrum is to an FID except for the<br />
successively increasing oscillation frequency.<br />
Finally, it is possible by computer synthesis to<br />
compute an excitation function with a virtually arbitrary<br />
excitation profile. This was originally utilized<br />
for decoupling purposes by Tomlinson and Hill<br />
(39), but is also the basis for composite pulse excitation<br />
schemes that have proved to be very powerful<br />
(40,41).<br />
Among the broad-band excitation techniques,<br />
pulse excitation is the only one that allows for a rig-
Vol. 16, No. 1/2<br />
orous analytical treatment irrespective of the complexity<br />
of the spin system. It does not lead to<br />
any method-inflicted line broadening as in stochastic<br />
resonance nor to correction-resistant signal distortions<br />
as in rapid scan spectroscopy of coupled spin<br />
systems (38). Pulse FT spectroscopy is conceptually<br />
and experimentally simple, and last but not least, it<br />
can easily be expanded and adapted to virtually all<br />
conceivable experimental situations. Measurements<br />
of relaxation times, for example, require just a modified<br />
relaxation-sensitive preparation sequence, such<br />
as a ir — vr/2 pulse pair for T\ measurements (42)<br />
and a vr/2 — TT pulse pair for Ti measurements (43).<br />
Also the extension to the investigation of chemical<br />
exchange using the saturation-transfer experiment<br />
of Forsen and Hoffman (44) is easily possible.<br />
It should be mentioned at this point that pulse<br />
NMR experiments were suggested already by Felix<br />
Bloch in 1946 in his famous paper (6), and the<br />
first time-domain magnetic resonance experiments<br />
were performed in 1949 by H. C. Torrey (45) and,<br />
in particular, by Erwin L. Hahn (46-48), who may<br />
be regarded as the true father of pulse spectroscopy.<br />
He invented the spin-echo experiment (46) and devised<br />
extremely important and conceptually beautiful<br />
solid-state experiments (49,50).<br />
Pulse FT spectroscopy has not only revolutioned<br />
high-resolution liquid-state NMR spectroscopy, but<br />
it has unified NMR methodology across all fields,<br />
from solid-state resonance, through measurements<br />
of relaxation times, to high-resolution NMR, with<br />
numerous spillovers also into other fields such as ion<br />
cyclotron resonance (51), microwave spectroscopy<br />
(52), and electron paramagnetic resonance (53). It<br />
also provided the germ for the development of multidimensional<br />
NMR spectroscopy.<br />
III. Two-Dimensional Fourier<br />
Transform Spectroscopy<br />
As long as purely spectroscopic measurements are<br />
made for the determination of the eigenfrequencies<br />
or normal modes of a system, one-dimensional (ID)<br />
spectroscopy is fully adequate. In NMR spectroscopy,<br />
this applies to the measurement of the chemical<br />
shifts that characterize the local chemical environment<br />
of the different nuclei. However, no information<br />
can be obtained in this manner on the<br />
spatial relationships between the observed nuclei.<br />
Figure 2: Schematic representation of stochastic<br />
resonance illustrated by the 56.4 MHz 19 F NMR<br />
spectrum of 2,4-difluorotoluene (33). Excitation<br />
with a binary pseudo-random sequence n\(t) 1023<br />
points in length generates the response no{t). Crosscorrelation<br />
of the two signals produces ci(r) which,<br />
after Fourier transformation, delivers the spectrum<br />
shown. In an alternative procedure, which has actually<br />
been used in this case, the individual Fourier<br />
transforms of n\(i) and no(t) are computed, and<br />
the complex conjugate ^ r {n;(i)}* is multiplied by<br />
to obtain the same spectrum.<br />
FREQUENCY SWEEP<br />
Figure 3: Schematic representation of rapid scan<br />
spectroscopy. The highly distorted sample spectrum<br />
obtained by a rapid frequency sweep of the<br />
frequency during the time t can be corrected by convolution<br />
with the equally sweep-distorted spectrum<br />
of a one-line test sample.
10 Bulletin of Magnetic Resonance<br />
i> H^ R O<br />
a -- - i [ H , a ] - f { cr - a0 }<br />
COHERENT TRANSFER | | CROSS-RELAXATION "|<br />
Figure 4: The two pair-interactions relevant in NMR<br />
spectroscopy. The through-bond scalar 3\.\ coupling<br />
contributes to the Hamiltonian and leads to a coherent<br />
transfer (A) of spin order between spins Ik<br />
and I/. The time-modulated through-space dipoledipole<br />
interaction Dmn(t) causes multiexponential<br />
cross relaxation (B) between spins lm and In. The<br />
two interactions allow a sequential assignment of the<br />
resonances of neighboring spins in the peptide fragment<br />
shown and the determination of structure parameters.<br />
The three-bond J coupling is a measure<br />
for the dihedral angle about the central bond, the<br />
dipole-dipole interaction for internuclear distances.<br />
There are two important pair interactions in<br />
nuclear spin systems, the scalar through-bond<br />
electron-mediated spin-spin interaction (J coupling)<br />
and the through-space magnetic dipole-dipole interaction<br />
(Figure 4). The J coupling is described by<br />
the scalar term Tiki = 27rJfc/I/cI; in the spin Hamiltonian.<br />
It is responsible for the multiplet splittings<br />
in high-resolution spectra of liquids. Under suitable<br />
conditions, it can lead to an oscillatory transfer<br />
of spin order between the two spins Ij, and I;.<br />
The magnetic dipole-dipole interaction Dmn, on the<br />
other hand, is represented by a traceless tensor of<br />
second rank. Its average in isotropic solution is zero,<br />
and it can lead to signal splitting only in anisotropic<br />
media. However, its time modulation causes relaxation<br />
processes also in isotropic solution that are<br />
responsible for a multiexponential recovery of the<br />
spins to thermal equilibrium after a perturbation.<br />
Knowledge of these interactions allows one to deduce<br />
geometric relations in the molecule in solution<br />
(54,55) and arrangements of atoms in solids. In the<br />
optimum case, a complete three-dimensional struc-<br />
A B C D E F G H<br />
Figure 5: Schematic correlation diagram for the representation<br />
of pair interactions of nuclear spins.<br />
Vol. 16, No. 1/2 11<br />
contain connectivity information (57). Particularly<br />
fruitful were double- and triple-resonance experiments<br />
in which two or three rf fields are applied<br />
simultaneously, resulting in decoupling and spintickling<br />
effects (58-60).<br />
The early multiple-resonance experiments have<br />
in the meantime been replaced by multidimensional<br />
experiments. Pair interactions among spins are<br />
most conveniently represented in terms of a correlation<br />
diagram as shown in Figure 5. This suggests the<br />
recording of a "two-dimensional spectrum" that establishes<br />
such a correlation map of the corresponding<br />
spectral features. The most straightforward approach<br />
may be a systematic double-resonance experiment<br />
whose result can be represented as an amplitude<br />
S(u>i,u>2) which depends on the frequencies<br />
u>i and u>2 of the two applied rf fields (8,58).<br />
A new approach to measuring two-dimensional<br />
(2D) spectra was proposed by Jean Jeener in 1971<br />
(61). He suggested a 2D FT experiment consisting<br />
of two 7r/2 pulses with a variable time t\ between the<br />
pulses and the time variable £2 measuring the time<br />
elapsed after the second pulse as shown in Figure 6;<br />
this is an expansion of the principles illustrated in<br />
Figure 1 (see also Fig. 10a). Measuring the response<br />
s{t\,t2) of the two-pulse sequence which is Fouriertransformed<br />
with respect to both time variables produces<br />
a two-dimensional spectrum 5(^1,^2) of the<br />
desired form (62,63).<br />
This two-pulse experiment by Jean Jeener is the<br />
progenitor of a whole class of 2D experiments (8,63)<br />
which can also easily be expanded to multidimensional<br />
spectroscopy. Each 2D experiment, as shown<br />
in Figures 6 and 7, starts with a preparation pulse<br />
sequence P, which excites coherences, that is, coherent<br />
superpositions represented by the density operator<br />
(ti, t2) = Tt{DE(*2)RE(ti)P(7o} (5)<br />
PREPA- EVOLUTION MIXING DETECTION<br />
RATION ' PERIOD ' PERIOD ' PERIOD<br />
PERIOD ' ' l<br />
t, I 1 t,<br />
Figure 7: Schematic representation of a general<br />
2D experiment consisting of preparation, evolution,<br />
mixing, and detection periods. The duration<br />
t\ of the evolution period is varied systematically<br />
from experiment to experiment. The resulting<br />
signal s(£i,*2) oc < D > (£i,*2) is Fouriertransformed<br />
in two dimensions to produce the 2D<br />
spectrum<br />
It is not sufficient to perform a single two-pulse<br />
experiment. To obtain the necessary data <br />
(£1,^2) to compute a 2D spectrum S(COI,UJ2), it is<br />
required to systematically vary £1 in a series of experiments<br />
and to assemble a 2D data matrix that<br />
is then Fourier-transformed in two dimensions as is<br />
indicated schematically in Figure 7. The resulting<br />
2D spectrum correlates the precession frequencies<br />
during the evolution period with the precession frequencies<br />
during the detection period, and is a vivid<br />
and easily interpretable representation of the mixing<br />
process. Diagonal and cross peaks are measures<br />
for the elements of the transfer matrix of the mixing<br />
pulse sequence in Figure 6.<br />
Among the numerous transfer processes that can<br />
be represented in this manner, the most important<br />
ones (8) are 1) the scalar J coupling leading to<br />
2D correlation spectroscopy abbreviated as COSY,<br />
2) internuclear cross relaxation leading to 2D nuclear<br />
Overhauser effect spectroscopy abbreviated as<br />
NOESY, and 3) chemical exchange leading to 2D<br />
exchange spectroscopy abbreviated as EXSY.
12 Bulletin of Magnetic Resonance<br />
7 6 5 4 3 2 1<br />
~" a>2[ppm]<br />
©ifppm]<br />
Figure 8: Phase-sensitive 400 MHz X H COSY spectrum<br />
of antamanide (1) in chloroform (at 250 K) in<br />
a contour-line representation. Positive and negative<br />
contours are not distinguished. The spectrum was<br />
recorded by Dr. Martin Blackledge.<br />
Figure 9: Assignment of the protons of the backbone<br />
of antamanide (1) by the combination of COSY (C)<br />
and NOESY (N) cross peaks. The missing NH protons<br />
in the four proline residues break the chain of<br />
sequential C-N connectivities.<br />
The COSY transfer, which proceeds through J<br />
coupling, is truly a quantum mechanical effect that<br />
does not find a satisfactory classical explanation. By<br />
means of a single (n/2)x rf mixing pulse, as in Figure<br />
6, it is possible to transfer coherence of spin<br />
k, which is antiphase with respect to spin I and<br />
represented in the density operator by the operator<br />
term 21^1^ into coherence of spin I, which is<br />
antiphase with respect to spin k, represented by -<br />
2IfczIjj/ (eqn. 6), whereby each factor of the product<br />
spin-operator can be considered to be rotated by<br />
TT/2 about the a;-axis.<br />
21*,,! kyi-lz<br />
~ 2IfczI.<br />
•fcz%<br />
Antiphase coherence of the type 21kyIiz is only<br />
formed during the evolution period when there is<br />
a direct spin-spin coupling between the spins Ik and<br />
1/ (eqn. 7).<br />
+ 2IkyIlzsin<br />
(7)<br />
This implies that in a two-dimensional correlation<br />
spectrum there are cross peaks only between directly<br />
coupled spins (as long as the approximation of weak<br />
coupling holds). It is obvious from eqn. 7 that there<br />
is no net coherence transfer, e.g. I^x —> lix, and<br />
the cross-peak integral must disappear. In other<br />
words, there is an equal number of cross-peak multiplet<br />
lines with positive and negative intensity.<br />
Pro H<br />
Phe 10 Val 1<br />
Pro z<br />
/ 2 \ 2 i 2 i 2 i i \<br />
CH2 CH-CO-NH-CH-CO-NH-CH-CO-NH-CH-CO-N. ^CH,<br />
^N"^ CH 2<br />
I I<br />
CO CO<br />
I I<br />
^CHV<br />
/NN<br />
CH2 N-CO-CH-NH-CO-CH-NH-CO-CH-NH-CO-CH CH2<br />
\ / I I i \ I<br />
CH2-CH2 CH2<br />
O o<br />
Pro 7 Phe 6 Phe 5 Ala 4<br />
CH2-CH2<br />
Pro J<br />
A COSY spectrum, such as the one shown in<br />
Figure 8 for the cyclic decapeptide antamanide (1)<br />
can be used to find pairs of spins belonging to the<br />
same coupling network of an amino acid residue in<br />
(6)
Vol. 16, No. 1/2 13<br />
COSY<br />
NOESY j<br />
EXSY<br />
RELAY<br />
TOCSY<br />
ROESY<br />
MQS n<br />
1<br />
]<br />
1<br />
w<br />
n71<br />
n n w<br />
—41—12-^<br />
Figure 10: Pulse sequences for some of the most<br />
useful homonuclear 2D experiments: a) COSY, b)<br />
NOESY or EXSY, c) relayed COSY, d) TOCSY<br />
or ROESY in the rotating coordinate system, e)<br />
multiple-quantum spectroscopy.<br />
the molecule. All intense cross peaks arise from couplings<br />
over two and three bonds that allow, first of<br />
all, the assignment of the pairs of NH and CaH along<br />
the polypeptide backbone (backbone protons), as<br />
indicated by C in Figure 9 for the six amino acid<br />
residues with NH protons. In addition, it is also<br />
possible to assign the protons in the side chains.<br />
The transfers of NOESY and EXSY experiments<br />
involve incoherent, dissipative processes that bring<br />
the system back to equilibrium in an exponential or<br />
multiexponential manner after an initial perturbation.<br />
They require an extended mixing time during<br />
which the random processes are given a chance<br />
to occur. Both processes can be investigated with<br />
the same three-pulse scheme (Figure 10b) (8,64-67).<br />
The mixing period is bracketed by two TT/2 pulses<br />
that transform coherence into static spin-order and<br />
back into coherence. The exchange processes transfer<br />
the spin order between different spins or between<br />
different chemical species, respectively. This type<br />
of transfer can be understood on the basis of classical<br />
kinetic models. The resulting 2D spectrum<br />
represents a kinetic matrix with cross-peak intensities<br />
proportional to the exchange rate constants of<br />
pseudo-first-order reactions.<br />
[<br />
',lppm]<br />
Figure 11: 400 MHz 1 H NOESY spectrum of antamanide<br />
(1) in chloroform (at 250 K) in a contourline<br />
representation. The spectrum was recorded by<br />
Dr. Martin Blackledge.<br />
For the NOESY transfer, the exchange rate constants<br />
are given by the cross-relaxation rate constants,<br />
which are due to magnetic dipole-dipole interactions,<br />
and are proportional to 1/4, for nuclear<br />
pairs Ifc and I;, and depend on the correlation time<br />
rc of the tumbling of the molecules in solution. The<br />
distance dependence can be used to measure relative<br />
or, if rc is known, absolute distances in molecules.<br />
The NOESY cross peaks thus allow the identification<br />
of neighboring protons in a molecule - important,<br />
for example, in identifying protons that belong<br />
to adjacent amino acid residues in peptides.<br />
A NOESY spectrum of antamanide (1) is given<br />
in Figure 11. The sequential backbone protons of<br />
adjacent amino acid residues with NOESY cross<br />
peaks are marked in Figure 9 with N. It is seen<br />
in Figure 9 that these together with the protons<br />
with J- cross peaks from the COSY spectrum (Figure<br />
8) form two unbroken chains of connectivities<br />
that can be used for the identification of the backbone<br />
protons. The two chains are not joined because<br />
of the absence of NH protons in the four proline<br />
residues. The general assessment procedure of<br />
proton resonance frequencies based on COSY and<br />
NOESY spectra has been established by Wiithrich
14<br />
Figure 12: 2D 13 C EXSY spectrum of a mixture<br />
of cis- and irans-decalin recorded at 22.5 MHz and<br />
241 K (76). Top: Three-dimensional representation<br />
(stacked plot). Bottom: A contour-line representation<br />
with the assignment of the peaks.<br />
and his research group (56).<br />
Based on a complete or partial set of assigned<br />
resonances, it is then possible to deduce information<br />
on the molecular structure. Each NOESY crosspeak<br />
intensity provides an internuclear distance that<br />
can be used in a manual or computerized process to<br />
construct a molecular model compatible with the<br />
experimental data. In this process it is also possible<br />
to employ scalar coupling constants extracted<br />
from COSY-type spectra (most conveniently from<br />
E. COSY spectra, as mentioned later). According<br />
to the Karplus relations (54), there is a relation between<br />
vicinal coupling constants and dihedral angles.<br />
Ingenious computer procedures to determine<br />
molecular structures based on NMR data were first<br />
developed by Kurt Wiithrich and his research team<br />
and tested on a large number of small to mediumsize<br />
proteins (56, 68-71). At present, mainly two<br />
a i<br />
COSY<br />
Bulletin of Magnetic Resonance<br />
RELAY<br />
E.COSY<br />
B<br />
a a<br />
9 e<br />
Figure 13: Extensions of the standard COSY experiment.<br />
Relayed correlation, total correlation spectroscopy<br />
(TOCSY), and multiple-quantum spectroscopy<br />
(MQS) increase the information content, while<br />
exclusive correlation (E. COSY), multiple-quantum<br />
filtering (MQF), and spin-topology filtration reduce<br />
the complexity. Both avenues can lead to threedimensional<br />
spectroscopy.<br />
computer algorithms for the structure determination<br />
are in use - the distance-geometry algorithm<br />
(72,73) and modifications of it, and the restrained<br />
molecular-dynamics algorithm (74,75), again with<br />
many variations. The structural problem in antamanide<br />
(1) will be discussed later, as it involves intramolecular<br />
dynamic processes that complicate the<br />
situation.<br />
Cross peaks in a NOESY-type exchange spectrum<br />
can also originate from chemical exchange; the<br />
three-pulse experiment of Figure 10b is indeed well<br />
suited for the investigation of chemical exchange<br />
networks (64,65,76). A distinction of the two types<br />
of signals is not possible by inspection of a single<br />
2D spectrum. However, variable-temperature studies<br />
are often conclusive. At sufficiently low temperatures<br />
at which chemical exchange becomes slow,<br />
only NOESY cross peaks should remain. The two<br />
types of signals may also be distinguished in experiments<br />
with rotating coordinate systems as mentioned<br />
in the next section.<br />
The 13 C NMR spectrum of a mixture of cis- and<br />
irons-decalin in Figure 12 is typical for a spectrum<br />
.<br />
4<br />
©
Vol. 16, No. 1/2 15<br />
showing chemical exchange. The spectrum gives evidence<br />
of the well-known conformational stability of<br />
irans-decalin, whereas for cis-decalin four pairs of<br />
carbon spins are involved in a conformational exchange<br />
process, giving raise to two pairs of cross<br />
peaks (76).<br />
IV. Modified Two-Dimensional<br />
FT-NMR Experiments<br />
Starting from the two prototypical 2D FT NMR<br />
experiments, numerous modified, expanded, and improved<br />
experiments have been suggested. Many of<br />
them have found a place in the arsenal of routine<br />
methods for the NMR spectroscopist. A first category<br />
of experiments, represented in the upper part of<br />
Figure 13, causes extended correlation through two<br />
or more transfer steps: Relayed correlation experiments<br />
involve two-step correlation, and total correlation<br />
spectroscopy (TOCSY) multiple-step correlation.<br />
The latter experiment leads to the important<br />
class of rotating frame experiments, including<br />
rotating frame Overhauser effect spectroscopy<br />
(ROESY) an alternative to NOESY. Finally also<br />
multiple-quantum spectroscopy allows one to investigate<br />
connectivity in spin systems. A second class<br />
of experiments attempts the simplification of spectra<br />
by exclusive correlation (E. COSY), multiplequantum<br />
filtering, and spin-topology filtration.<br />
V. Relayed Correlation<br />
In a standard COSY experiment, coherence is<br />
transfered exclusively between two directly coupled<br />
spins by means of a single mixing pulse. By a sequence<br />
of two TT/2 pulses, as in Figure 10c, it is<br />
possible to effect a transfer of coherence across two<br />
sequential couplings from spin I& to spin I; through<br />
the relay spin Ir (77,78). For the relation in eqn. 8,<br />
Jkrh = Jkr r m = Jri T m = 1/2 is assumed.<br />
*-kx<br />
-2L.J<br />
rzMy<br />
(8)<br />
During the extended mixing period rm, it is thus<br />
necessary to refocus the antiphase character of the<br />
Ir spin coherences with respect to spin Ij. and create<br />
antiphase character with respect to spin 1/ to<br />
allow for a second transfer by the second mixing<br />
pulse. Relayed correlation is useful whenever the<br />
resonance of the relay spin Ir cannot be identified<br />
unambiguously. With a relay experiment it is then<br />
nevertheless possible to assign spins Ifc and 1/ to the<br />
same coupling network (e.g. belonging to the same<br />
amino acid residue in a polypeptide chain). It is<br />
usually advantageous to refocus the effects of the<br />
chemical shift precession during the mixing period<br />
by incorporating a central n pulse as shown in Figure<br />
10c.<br />
Relayed coherence transfer is illustrated by 300<br />
MHz X H NMR spectra of the linear nonapeptide<br />
buserilin, pyro-Glu-His-Trp-Ser-Tyr-D-Ser-Leu-<br />
Arg-Pro-NHCH2CH3. Figure 14a shows a (doublequantum<br />
filtered) COSY spectrum and Figure 14b<br />
the corresponding relayed COSY spectrum (79).<br />
In both spectra, the resonance connectivities for<br />
the leucine residue are marked. It is evident that<br />
in the COSY spectrum only nearest neighbor protons<br />
are connected by cross peaks: NH-CaH, CaH-<br />
C^H 1 - 2 , C^H 1 - 2 -C7H, and C7H-(C^H3) 1 ' 2 . On the<br />
other hand, in the relayed COSY spectrum, also<br />
the next-nearest neighbors NH-C^H 1 ' 2 and C/3H 1 ' 2 -<br />
(C5H3) 1 ' 2 are connected. The third pair of relayed<br />
cross peaks CaH-C7H, is weak because of the high<br />
multiplicity of the C7H resonance and is not visible<br />
in the contour representation of Figure 14b. Similar<br />
relayed cross peaks can be found for the other amino<br />
acid residues.<br />
VI. Rotating Frame Experiments<br />
By means of an extended mixing pulse sequence,<br />
transfer of coherence over an arbitrary number<br />
of steps is possible in principle. In particular,<br />
continuous wave irradiation leads to the mixing of<br />
all eigenmodes of a spin system and correspondingly<br />
to transfers of coherence between all of them.<br />
This is exploited in total correlation spectroscopy<br />
(TOCSY) with the sequence shown in Figure lOd.<br />
All spins belonging to the same J-coupling network<br />
can be identified with TOCSY (80,81). The accurate<br />
matching of the precession frequencies of the
16 Bulletin of Magnetic Resonance<br />
8.0 7.0 6.0 5.0 4.0 3.0 2.0 1.0<br />
8.0 7.0 6.0 5.0 4.0 3.0 2.0 1.0<br />
8.0 7.0 6.0 5.0 4.0 3.0 2.0 1.0<br />
— o)2[ppm]<br />
Figure 14: 300 MHz correlation spectra of the nonapeptide buserilin in dimethyl sulfoxide (DMSO). Phasesensitive<br />
spectra with equal representation of positive and negative contours are shown. The resonance<br />
connectivities and the positions of the NH, CaH, CgH, C7H, and CgH diagonal peaks are indicated for the<br />
leucine residue (79). a) Double-quantum filtered COSY spectrum with the sequence from Figure 18. b)<br />
Relayed COSY spectrum with the sequence from Figure 10c and rm = 25 ms. c) TOCSY spectrum with the<br />
sequence from Figure lOd, rm = 112 ms, and an MLEV-17 pulse sequence applied during rm.<br />
various spins in the presence of a radio frequency<br />
field is crucial in enabling an efficient transfer of coherence.<br />
Either very strong radio-frequency fields<br />
or specially designed pulse sequences are needed for<br />
this purpose (81). Coherence transfer is possible<br />
when the effective average magnetic field strengths<br />
in the rotating frame are equal to within a J-<br />
oijlppml<br />
coupling constant, | 7(B| cor<br />
ft - Bf<br />
responding to a strong coupling case in the rotating<br />
frame.<br />
The TOCSY experiment is of interest for assignment<br />
of proton resonances to individual amino acid<br />
residues in a protein. Of particular value is that its<br />
transfer rate is enhanced by a factor of 2 in com-
Vol. 16, No. 1/2 17<br />
parison to COSY or relayed transfer experiments in<br />
the laboratory frame (80). Another property is that,<br />
because of the presence of a radio-frequency field, inphase<br />
coherence transfer is possible (eqn. 9), leading<br />
to in-phase cross-peak multiplet structures.<br />
life, Hx (9)<br />
A TOCSY spectrum of buserilin is included in<br />
Figure 14c for comparison with the relayed and<br />
standard COSY spectra depicted. Again three-step<br />
transfers CoH^CgHs) 1 ' 2 and even four-step transfers<br />
NH-^C^Hs) 1 ' 2 are visible here. Some expected<br />
cross peaks involving C7H are missing as before because<br />
of the extensive multiplet structure of C7H.<br />
The elimination of the chemical shift precession<br />
by the rf irradiation leads not only to the coherent<br />
transfer through the J-coupling network, but<br />
also to an incoherent transfer of spin order through<br />
transverse cross-relaxation. The transverse crossrelaxation<br />
terms are, in principle, always present.<br />
However, strong differential chemical shift precession<br />
of spin pairs normally causes a quenching of<br />
the transfer in the sense of first-order perturbation<br />
theory. In the presence of a strong rf field,<br />
this quenching is no longer operative and transverse<br />
cross-relaxation occurs. This is the transfer mechanism<br />
of the rotating frame Overhauser effect spectroscopy<br />
(ROESY) experiment (82).<br />
ROESY has similar properties as NOESY but<br />
differs in the dependence of the cross-relaxation rate<br />
constant Y^i on the correlation time TC of the molecular<br />
rotational motion that modulates the internuclear<br />
dipole-dipole interaction responsible for crossrelaxation<br />
(cf. eqns. 10 and 11 where the spectral<br />
density J is defined by eqn. 12).<br />
NOE<br />
MoY<br />
Air)<br />
4TT<br />
3J(2u;o) (10)<br />
^J(2co0)\ (11)<br />
(12)<br />
As usual, coo is the Larmor frequency of the two nuclei<br />
with the internuclear distance r^i- Eqns. 10 and<br />
12 imply that Fj^ OE changes sign for an intermediate<br />
correlation time rc of (5/4) l / 2 u0 *; that is, the crossrelaxation<br />
rate becomes small in the neighborhood<br />
of this condition. Depending on the viscosity of the<br />
solvent and the resonance frequency LL>O, this occurs<br />
for globular molecules within a range of molecular<br />
mass of 500-2000 Da. F^ OE , on the other hand,<br />
is less sensitive to rc and remains positive for any<br />
molecular mass. The ROESY experiment is therefore<br />
of advantage for molecules of intermediate size.<br />
- In addition, the different sensitivity of NOE and<br />
ROE to rc allows one to deduce information on<br />
intramolecular mobility by comparison of the two<br />
measurements (83). An advantage of ROESY over<br />
NOESY experiments is that the cross-peak amplitude<br />
is negative, while the simultaneously occurring<br />
cross peaks due to chemical exchange are positive<br />
and allow for an easy distinction as long as the signals<br />
do not overlap.<br />
It should be recognized that in the rotating frame<br />
coherence transfer through J couplings and cross<br />
relaxation occur simultaneously, whereby TOCSY<br />
cross peaks are positive and ROESY cross peaks<br />
appear with negative amplitude. This complicates<br />
the 2D spectra and calls for separation procedures.<br />
The suppression of the coherent transfer through J<br />
couplings (TOCSY) is easy, because it is only necessary<br />
to mismatch the condition | 7(B| — Bf) \<<br />
| 2irJki |, for example by a slight frequency offset in<br />
the presence of not-too-strong rf fields. The crossrelaxation<br />
rates are much less sensitive to such a<br />
mismatch and a clean ROESY spectrum results.<br />
Obtaining a clean TOCSY spectrum is more demanding<br />
because relaxation cannot easily be manipulated.<br />
A technique was proposed by C. Griesinger<br />
(84), which relies on a combination of eqns. 10 and<br />
11 to set the average cross-relaxation rate constant<br />
to zero (eqn. 13). A suitable weighting factor p can<br />
be found whenever T^[ OE < 0, that is, for sufficiently<br />
large molecules with rc > (5/4) 1 / 2 w(J" 1 . This<br />
requires the magnetization to move on a trajectory<br />
that spends a fraction p of time along the z-axis and<br />
a fraction (1-p) in the transverse plane. For rc —> oo,<br />
one finds p = 2/3 for TM — 0. A suitable pulse sequence,<br />
a modification of an MLEV-17 spin-locking<br />
sequence, has been proposed in ref. (84).<br />
Another optimized sequence, called "Clean<br />
CITY", was developed by J. Briand (85). A clean
18 Bulletin of Magnetic Resonance<br />
10.0 8.0 6.0<br />
— u>2 Ippm)<br />
10.0 8.0 6.0 4.0<br />
o/,[ppm]<br />
10.0 8.0 6.0<br />
tt»2 Ippfni<br />
2.0<br />
MLEV-17<br />
ro.o<br />
2.0<br />
4.0<br />
6.0<br />
8.0<br />
10.0<br />
Clean CITY<br />
>, Ippm]<br />
Figure 15: Phase-sensitive 300 MHz l R TOCSY<br />
spectra of 15 mM sample of bovine pancreatic<br />
trypsin inhibitor in D2O recorded with a mixing<br />
time of 69 ms (85). a) Mixing process with MLEV-<br />
17 pulse sequence. Negative peaks are shown bycontours<br />
filled in black, b) Mixing process with the<br />
Clean CITY pulse sequence, c) Cross sections along<br />
LOI through the diagonal peak of Tyr 23 eH at LV2 =<br />
6.33 ppm in the spectra a) and b) (marked with<br />
broken lines).<br />
TOCSY spectrum of bovine pancreatic trypsin inhibitor<br />
(BPTI) using the Clean CITY sequence is<br />
compared in Figure 15 with a conventional TOCSY<br />
spectrum to demonstrate the efficient suppression of<br />
the (negative) ROESY peaks.<br />
VII. Multiple-Quantum<br />
Spectroscopy<br />
In the spectroscopy, in general, only those transitions<br />
are directly observable for which the observable<br />
operator has matrix elements not equal to zero,<br />
leading to the so-called allowed transitions. For<br />
«•<br />
1<br />
2ft.,<br />
Figure 16: 90 MHz 2D X H correlation spectrum of<br />
[D3]3-amino-propanol with double-quantum transitions<br />
along u>\ and single-quantum transitions along<br />
u>2 • The three types of double-quantum transitions<br />
mentioned in the text are indicated. Enlargements<br />
of all cross peaks are shown on the left. The spectrum<br />
is shown in an absolute value representation<br />
(from ref. 89).<br />
magnetic resonance in strong magnetic fields with<br />
weak cw perturbation or with a free induction decay<br />
in the absence of rf, the observable operator of<br />
the transverse magnetization Fx = ]Tfe Ifei has matrix<br />
elements only between eigenstates of the Hamiltonian<br />
differing in the magnetic quantum number<br />
M by ±1. Thus single-quantum transitions are the<br />
allowed transitions, while multiple-quantum transitions<br />
with I AM I > 1 are forbidden. Multiplequantum<br />
transitions can, however, be induced by<br />
strong cw rf fields that cause a mixing of states<br />
(8,57) or by a sequence of at least two rf pulses<br />
(Fig. lOe) (8,63,86,87). Observation is possible again<br />
in the presence of a strong rf field (8,57) or after a<br />
further detection pulse (8,63,86,87).
Vol. 16, No. 1/2 19<br />
For spin systems with 1=1/2, multiple-quantum<br />
transitions invariably involve several spins, and<br />
multiple-quantum spectra contain information on<br />
the connectivity of spins within the J-coupling network<br />
in analogy to 2D correlation spectra. In particular,<br />
the highest order transition allows one to<br />
determine the number of coupled spins. Relaxation<br />
rate constants of multiple-quantum coherences are<br />
dependent on the correlation of the random perturbations<br />
affecting the spins involved and provide information<br />
on motional processes (88).<br />
A simple instructive example of a 2D doublequantum<br />
spectrum is given in Figure 16 to demonstrate<br />
the use of multiple-quantum transitions for<br />
the assignment of resonances (89). Along u)\, doublequantum<br />
transitions and along o>2 single-quantum<br />
transitions are displayed for the six-spin system of<br />
[D3]3-aminopropanol DOCH2CH2CH2ND2. In general,<br />
there are three categories of double-quantum<br />
transitions:<br />
1) Double-quantum transitions involving two directly<br />
coupled spins. They lead to pairs of cross<br />
peaks displaced symmetrically from the doublequantum<br />
diagonal (u\ = 2o>2) with u;2 coordinates<br />
corresponding to the Larmor frequencies of the two<br />
spins (e.g. uox - OA + $7M, fijvi + ^x)-<br />
2) Double-quantum transitions involving two<br />
magnetically equivalent spins. They lead to one or<br />
more cross peaks at an UJ\ frequency that intersects<br />
the double-quantum diagonal at the w2 frequency<br />
corresponding to the common Larmor frequency of<br />
the two spins (e.g. uj\ = 20,^,20,^, 2QX, although<br />
the spins are magnetically equivalent only within<br />
experimental accuracy).<br />
3) Double-quantum transitions involving two remotely<br />
coupled spins. They lead to single cross<br />
peaks at an u>\ frequency that intersects the double<br />
quantum diagonal at w2 equal to the mean of the<br />
two Larmor frequencies (e.g. OJI = OA + HX). These<br />
cross peaks carry information identical to that in<br />
relayed correlation spectra.<br />
For the practical application it is essential that<br />
a multiple-quantum spectrum never contains an<br />
array of strong diagonal peaks. It should be<br />
mentioned that a beautiful and useful form of<br />
a double-quantum experiment is the 2D INADE-<br />
QUATE spectroscopy proposed by Bax, Freeman,<br />
and Kempsell (90,91). There, only type 1 peaks can<br />
arise.<br />
The methods mentioned so far produce additional<br />
cross peaks that provide information not accessible<br />
with the standard COSY and NOESY experiments.<br />
In the following, techniques are discussed<br />
that lead to simplified spectra which may<br />
facilitate their interpretation.<br />
VIII. Multiple-Quantum Filtering<br />
Selective filtering can be achieved by exciting<br />
multiple-quantum coherence, selecting a particular<br />
quantum order, and reconverting the selected order<br />
into observable magnetization. Depending on the<br />
selected order, this leads to multiple-quantum filtering<br />
of various orders. The spin-system-selective<br />
effect relies on coherence transfer selection rules that<br />
limit the allowed transfers for weakly coupled spins<br />
(8,92):<br />
1) It is impossible to excite p quantum coherence<br />
in spin systems with less than p-coupled spins<br />
1=1/2.<br />
2) For the appearance of a diagonal peak of spin<br />
Ifc in a p-quantum-filtered COSY spectrum, the spin<br />
1^ must be directly coupled to at least p - 1 further<br />
spins.<br />
3) For the appearance of the cross peaks between<br />
spins Ifc and I; in a p-quantum-filtered COSY spectrum,<br />
both spins must simultaneously be coupled to<br />
at least p - 2 further spins.<br />
Violations of these coherence transfer selection<br />
rules occur for strong coupling and for certain special<br />
relaxation situations (93).<br />
In Figure 17, the effect of four-quantum filtering<br />
on various four-spin systems is demonstrated. The<br />
sample consists of a mixture of the five compounds<br />
irans-phenylcyclopropanecarboxylic acid (K4), DLisocitric<br />
acid-lactone (P3,].), 1,1-dichloroethane (S4),<br />
2-chloropropionic acid (C4), and D-saccharic acid-<br />
1,4-lactone (L4) with the coupling topologies indicated<br />
in Scheme 1 (94).<br />
Figure 17a shows a conventional (doublequantum-filtered)<br />
COSY spectrum of the mixture,<br />
while in Figure 17b the corresponding fourquantum-filtered<br />
spectrum is reproduced. The filtering<br />
effect can easily be understood based on the<br />
given rules and the coupling topologies shown in
20 Bulletin of Magnetic Resonance<br />
2 1<br />
Figure 17: Multiple-quantum-filtered and spin-topology-filtered 300 MHz 1 H COSY spectra of a mixture of<br />
the compounds from Scheme 1 containing four-spin systems, a) Double-quantum-filtered spectrum obtained<br />
with the pulse sequence from Figure 18. b) Four-quantum-filtered spectrum obtained with the pulse sequence<br />
from Figure 18. c) G4 spin-topology-filtered spectrum obtained with the pulse sequence from Figure 19 (from<br />
ref. 94).<br />
Scheme 1. The interpretation is left to the reader.<br />
Only cross peaks of the molecule with K4 topology<br />
and diagonal peaks of molecules with P3 1, S4, and<br />
K4 topologies remain.<br />
Technically, multiple-quantum filtering exploits<br />
the characteristic dependence of a multiplequantum<br />
coherence transfer on the rf phase of the<br />
acting pulse sequence (8,92,95,96). Let us assume a<br />
transfer of coherence cpl(t) by a unitary transformation<br />
U(0), representing a particular pulse sequence,<br />
to coherence cp2(t), where px and p2 are the orders<br />
of coherence.<br />
U(0)<br />
cp2(t) (14)<br />
All rf pulses in the sequence are now phase-shifted<br />
by $, leading to U($). Then it can be shown that<br />
the resulting coherence Cp2(t) is phase-shifted by<br />
(15)<br />
The phase shift is therefore proportional to the<br />
change in coherence order (Ap = P2—Pi)- After a series<br />
of experiments are performed in which the phase
Vol. 16, No. 1/2 21<br />
® ^o<br />
Scheme 1. The compounds used for the spectra in<br />
Figure 17 and their spin-coupling topologies.<br />
is incremented systematically in a set of N experiments<br />
and the resulting experimental results are<br />
combined according to eqn. 16.<br />
Figure 19: Pulse sequence for C4 spin-topology filtration<br />
consisting of TT/2 and TT pulses. The delays<br />
are adjusted to T = 1/(8J) and A = 1/(2J), where<br />
J is the uniform J-coupling constant. is phasecycled<br />
for four-quantum selection and 9 for the suppression<br />
of axial peaks (94).<br />
2QF<br />
• o • o<br />
o • o •<br />
o • o •<br />
3QF<br />
o»«o<br />
• oo»<br />
• oo»<br />
E.COSY<br />
• o<br />
• c)<br />
—<br />
J 23<br />
-M2<br />
Figure 20: E. COSY experiment to simplify the<br />
multiplet structure of cross peaks. The doublequantum-<br />
and the triple-quantum-filtered cross<br />
peak between spins Ii and I2 of a three-spin system<br />
are combined to produce an E. COSY pattern.<br />
Positive and negative multiplet components are distinguished<br />
by empty and filled circles.<br />
1
22 Bulletin of Magnetic Resonance<br />
IX. Spin-Topology Filtration<br />
It may be desirable to enhance the filtering effect<br />
illustrated in Figure 17 and to select individual<br />
spin coupling topologies. Indeed it is possible to design<br />
extended pulse sequences, in combination with<br />
multiple-quantum nitration, that are tailor-made for<br />
specific spin coupling topologies (94,97,98). A pulse<br />
sequence built into a 2D COSY experiment, that<br />
is selective for cyclic C4 spin coupling topologies is<br />
depicted schematically in Figure 19. If this pulse sequence<br />
is applied to the mixture of compounds with<br />
four-spin systems (Scheme 1), the 2D spectrum of<br />
Figure 17c is obtained. It shows efficient suppression<br />
of all other spin systems. It should be noted, however,<br />
that the situation is here rather ideal. Often,<br />
these filters do not perform as well because their<br />
design relies on all non-zero spin couplings being<br />
equal. In reality, there are weak and strong couplings<br />
that cannot be characterized by topological<br />
considerations alone. Often also the intensities of<br />
signals decrease during the extended pulse sequences<br />
due to relaxation. This limits the practical usefulness<br />
of these methods.<br />
X. Exclusive Correlation Spectroscopy<br />
Multiple-quantum filtering suppresses not only<br />
diagonal and cross peaks in 2D spectra but also<br />
changes the sign pattern in the cross-peak multiplet<br />
structure. By appropriate combination of differently<br />
multiple-quantum-filtered 2D spectra, it is<br />
possible to simplify the multiplet structure by reducing<br />
the number of multiplet components. Exclusive<br />
correlation spectroscopy (E. COSY), proposed by<br />
O.W. S0rensen, eliminates all multiplet components<br />
from a COSY spectrum except for those belonging<br />
to pairs of transitions with an energy level in common<br />
(99-101). In practice, it is not necessary to<br />
combine multiple-quantum-filtered spectra literally,<br />
but it is possible to coadd directly the experimental<br />
results from a phase cycle with the appropriate<br />
weighting factors.<br />
Figure 20 shows schematically the combination<br />
of cross-peak multiplets connecting two spins, Ii and<br />
I2, in a three-spin system after double- and triplequantum<br />
filtering. The remaining pattern consists<br />
of two basic squares with side lengths equal to the<br />
active coupling constant J\i responsible for the coherence<br />
transfer. The displacement vector between<br />
the two squares is given by the two passive couplings<br />
J13 and J23 to the third (passive) spin. It should be<br />
mentioned that this multiplet structure is identical<br />
to the one obtained by a COSY experiment with<br />
a mixing pulse with an extremely small flip angle<br />
(102).<br />
E. COSY is of practical use whenever the crosspeak<br />
multiplet structure must be analyzed for the<br />
determination of J-coupling constants. This can be<br />
done conveniently by hand by measuring the displacement<br />
of peripheral multiplet components (101)<br />
or by a recursive contraction procedure on a computer<br />
(103).<br />
XI. Heteronuclear Two-Dimensional<br />
Experiments<br />
In addition to the homonuclear 2D experiments<br />
discussed so far, at least as many heteronuclear<br />
experiments have been proposed and introduced<br />
to the repertoire of routine spectroscopy methods.<br />
Of greatest practical importance are heteronuclear<br />
shift correlation spectra which correlate the chemical<br />
shifts of directly bonded or remotely connected<br />
heteronuclei (104,105). In this context, so-called inverse<br />
detection experiments are of particular interest.<br />
Here proton I-spin coherence is observed in %2<br />
while spin coherence of a less sensitive, less abundant<br />
S nucleus evolves in t\ (104). The most efficient<br />
pulse sequences create heteronuclear two-spin<br />
coherence that evolves in t\ and that acquires the<br />
frequency information of the S-spin resonance (106).<br />
Also in the heteronuclear environment, relayed coherence<br />
transfer (78) as well as experiments in the<br />
rotating frame (107) are important. Spin filtering is<br />
used for multiplicity selectivity, that is, for distinguishing<br />
S spins coupled to one, two, or three I spins<br />
(108), and in the form of J filtering for the distinction<br />
of one-bond and multiple-bond couplings (109).<br />
This enumeration of heteronuclear experiments is by<br />
no means exhaustive.
Vol. 16, No. 1/2 23<br />
Figure 21: Schematic representation of a 3D NMR experiment as an extension of Figures 1 and 6. Three<br />
evolution periods with the time variables t\, ti, and £3 are separated by two transfer or mixing processes with<br />
the transfer matrices Rl and R2. A 3D experiment can be conceived as the contraction of two 2D experiments.<br />
Figure 22: 3D representation of a 300 MHz 3D<br />
homonuclear ROESY-TOCSY spectrum of buserilin<br />
in [De]DMSO photographed from a computer screen<br />
(116).<br />
XII. Three-Dimensional Fourier-<br />
Transformation<br />
Spectroscopy<br />
No new principles are required for the development<br />
of 3D NMR spectroscopy, which is just a<br />
logical extension of 2D NMR spectroscopy. Instead<br />
of a single mixing process which relates two frequency<br />
variables, two sequential mixing processes<br />
relate three frequencies: the origin frequency u>\,<br />
the relay frequency u>2, and the detection frequency<br />
UJ3 (Figure 21). In this sense a 3D experiment can<br />
be considered as the combination of two 2D experiments.<br />
Obviously a very large number of possible<br />
3D experiments can be conceived. However, only<br />
few of them have proved to be indispensible so far<br />
(110-118).<br />
Figure 23: 3D resolution of a 2D X H NMR spectrum<br />
by 15 N resonance spreading. The NH-CaH<br />
cross peaks are displaced in a third dimension by<br />
the corresponding 15 N chemical shifts.<br />
Two applications of the 3D spectroscopy concept<br />
have emerged: 1) 3D correlation and 2) 3D<br />
dispersion spectroscopy (see also Fig. 13). Threedimensional<br />
correlation is of importance in homonuclear<br />
experiments. It has been mentioned that<br />
the assignment procedure in biomolecules requires a<br />
COSY-type and a NOESY-type 2D spectrum. The<br />
two 2D experiments could be contracted into one<br />
3D experiment, combining a J-coupling-mediated<br />
transfer and a cross-relaxation transfer. A 3D<br />
COSY-NOESY spectrum possesses the advantage<br />
that the entire assignment process can be carried<br />
out with a single homogeneous data set (115,116).<br />
It also incorporates redundant information that allows<br />
cross checks of the assignments. For obtaining<br />
quantitative information, however, 3D spectra are<br />
less suited, since all peak intensities are products of
24 Bulletin of Magnetic Resonance<br />
two transfer coefficients that are sometimes difficult<br />
to separate.<br />
A 3D ROESY-TOCSY spectrum of the linear<br />
nonapeptide buserilin is shown in Figure 22 (vf.<br />
Fig. 14)(116). A ROESY instead of a NOESY sequence<br />
is required for buserilin, as it is a molecule<br />
of intermediate size for which the NOE intensities<br />
are small. The TOCSY step has the advantage that<br />
chains of multiple-step cross peaks extend to nuclei<br />
in the side chains are obtained thus facilitating the<br />
identification of the amino acid residues.<br />
It should be recognized that recording a 3D spectrum<br />
is considerably more time-consuming than two<br />
2D spectra, since two time parameters, t\ and £2,<br />
must be incremented independently, requiring a 2D<br />
array of experiments. Thus the question arises of<br />
when it is worth the effort to record a 3D spectrum.<br />
This question has been discussed in numerous publications<br />
(116,119,120).<br />
Let us consider a particular cross peak in a 3D<br />
spectrum that correlates the coherences {tu} in the<br />
wi, {rs} in the w2 and {pq} in the U13 dimension.<br />
Its intensity is determined by the following product<br />
(eqn. 17) of matrix elements in the eigenbasis of the<br />
unperturbed Hamiltonian HQ (116).<br />
Z{pq}{rs}{tu} ~<br />
A nonvanishing intensity establishes a two-step correlation<br />
{tu}-{rs}-{pq}.<br />
The 3D experiment can be compared with two<br />
2D experiments that employ the mixing processes<br />
x(l) x(2)<br />
R and R , respectively. The corresponding intensities<br />
are expressed by eqns. 18 and 19.<br />
Z {rs}{tu}<br />
~~<br />
D 1P R {pq}{rs}( I><br />
(18)<br />
(19)<br />
If in the 2D spectra the two relevant peaks with<br />
intensities Z and Z \ can be identified,<br />
J {rs}{tu} {Pq}{}<br />
possibly in crowded regions, the two-step correlation,<br />
represented by a 3D peak, could also be established<br />
based on the two 2D spectra {tu}-{rs}<br />
and {rs}-{pq}. Provided that Z{pq}{rs}{tu} / 0 is<br />
true, the intensities and Z < {Jq}{rs} are de-<br />
{<br />
ferent from zero when in addition Dgr ^ 0 and<br />
(P
Vol. 16, No. 1/2 25<br />
In this case, ribonuclease A was grown in an E. coli<br />
medium containing 15 N-labeled nutrients. The spectrum<br />
was obtained with the pulse sequence from<br />
Figure 25. Initially proton coherence is excited and<br />
precesses during t\ under 15 N refocusing by the applied<br />
vr pulse. During the mixing time rm, coherence<br />
transfer from other protons to the NH protons<br />
is effected in the rotating frame by the application<br />
of a TOCSY multiple-pulse sequence. The<br />
NH coherence is then converted into 15 NH heteronuclear<br />
multiple-quantum coherence (HMQC) which<br />
precesses during t-i and acquires 15 N resonance information<br />
(under proton refocusing). After reconversion<br />
into NH proton coherence, detection follows<br />
during £3 under 15 N decoupling. For a complete<br />
assignment of the proton resonances a 15 N-spread<br />
NOESY spectrum is required in addition.<br />
The step to 4D spectroscopy (121) is a logical<br />
one: In 2D experiments, spins are pairwise correlated,<br />
for example NH and CQH protons. Threedimensional<br />
dispersion uses either 15 N or 13 Ca resonance<br />
for spreading the resonances of NH or CQH,<br />
respectively. In a 4D experiment, both spreading<br />
processes are applied simultaneously (Scheme 2).<br />
The order of the frequencies in the actual experiment<br />
is a matter of convenience. Normally, the detection<br />
frequency W4 refers to proton spins for sensitivity<br />
reasons. In most cases, the two spreading<br />
coordinates are rather coarsely digitized to limit the<br />
performance time, just enough to achieve separation<br />
of peaks overlapping in the 2D spectrum. Often 8<br />
to 32 points in each of the two dimensions are sufficient.<br />
Scheme 2. Double spreading in 4D experiments.<br />
XIII. Molecular Dynamics<br />
vestigated by NMR<br />
In-<br />
The molecular structures determined by NMR<br />
spectroscopy in solution, by X-ray diffraction in single<br />
crystals, or by other means are invariably motionally<br />
averaged structures, whereby the averaging<br />
Figure 24: 3D 15 N-spread 600 MHz X H TOCSY<br />
spectrum of 15 N-labeled ribonuclease A in water.<br />
The 3D spectrum shows the 15 N resonances<br />
along the 102 axis. The spectrum was recorded by<br />
C. Griesinger with the pulse sequence from Figure<br />
25 and processed by S. Boentges. The sample<br />
was provided by Prof. S. Benner of ETH Zurich.<br />
15 N<br />
CH<br />
NH<br />
TTTTTTT<br />
TOCSY<br />
71/2 7T/2<br />
Figure 25: Pulse sequence for recording a 3D 15 Nspread<br />
TOCSY spectrum. After presaturation of<br />
the water resonance (I), the proton resonances are<br />
excited and precess during t\. After the homonuclear<br />
TOCSY transfer from CH to the NH protons,<br />
the coherence is converted into heteronuclear<br />
multiple-quantum coherence (HMQC) that evolves<br />
during ti and acquires 15 N shift information. After<br />
reconversion to proton coherence, the NH resonances<br />
are detected during £3 under 15 N decoupling.
26 Bulletin of Magnetic Resonance<br />
process is strongly dependent on the measurement<br />
technique. To interpret experimentally determined<br />
structures, some knowledge of the motional properties<br />
of the molecule is in fact indispensible. Molecular<br />
dynamics is also relevant for its own sake, in<br />
particular for the understanding of reactivity and<br />
interaction with other molecules. In many cases, active<br />
sites in a molecular pocket are only accessible<br />
due to the flexibility of the molecule itself.<br />
The characterization of the motional properties<br />
of a molecule is orders of magnitude more difficult<br />
than the description of an averaged molecular structure.<br />
While 3^—6 coordinates are sufficient to fix a<br />
structure containing N atoms, the characterization<br />
of molecular dynamics requires 3N-6 variances of<br />
the intramolecular coordinates, (3JV-6)(3iV-5)/2 covariances,<br />
and the same number of auto- and crosscorrelation<br />
functions, respectively. In addition, also<br />
higher order correlation functions are needed for a<br />
more refined description of dynamics. In practice,<br />
a sufficient number of observables is never available<br />
for a full description of dynamics. In this sense, the<br />
study of dynamics is an open-ended problem.<br />
Numerous techniques are available for obtaining<br />
data on dynamics: Debye-Waller factors in X-ray<br />
diffraction give hints on the variances of the nuclear<br />
coordinates, however, without a measure for<br />
the time scale. Inelastic and quasielastic neutron<br />
scattering deliver correlation functions, but without<br />
a reference to the structure. Fluorescence depolarization<br />
allows one to determine the motional correlation<br />
function of fluorescent groups, such as tyrosine<br />
residues in proteins. Ultrasonic absorption gives an<br />
indication of the frequencies of the dominant motional<br />
modes, but again without a structural reference.<br />
NMR spectroscopy is more universally applicable<br />
to motional studies than most of the other techniques.<br />
The range of correlation times rc that can<br />
be covered by various NMR methods is enormous,<br />
from picoseconds to seconds and more (Scheme 3).<br />
1 s < rc: Real-time monitoring after initial<br />
perturbation<br />
10 ms < rc < 10 s: 2D exchange spectroscopy (EXSY)<br />
100 fis < TC < 1 s: Lineshape analysis, exchange<br />
broadening, and exchange narrowing<br />
1 /xs < TC < 10 ms: Measurements of relaxation time Tje<br />
in the rotating frame<br />
30 ps < rc < I/us: Measurements of relaxation time Ti<br />
in the laboratory frame<br />
TC < 100 ps: Averaged parameter values<br />
Scheme 3. NMR methods for the determination of<br />
motional correlation times rc<br />
Except for slow motions on a time scale of a<br />
millisecond or more for which lineshape analysis,<br />
saturation transfer experiments, and 2D exchange<br />
studies can be performed, many dynamics studies<br />
by NMR rely on measurements of relaxation times.<br />
The various relaxation parameters, such as the longitudinal<br />
relaxation time Ti, the transverse relaxation<br />
time T2, the rotating-frame relaxation time<br />
Tie, and cross-relaxation rate constants TM depend<br />
on the correlation time rc of the underlying random<br />
process.<br />
The following discussion shall be restricted to a<br />
recent study of the intramolecular dynamics in antamanide<br />
(1) (83,122,123) (see Figs. 8,9,11). Antamanide<br />
is an antidote for toxic components of<br />
the mushroom Amanita phalloides. Astonishingly,<br />
the antidote is a component of the same mushroom.<br />
Indications have been found in early ultrasonic<br />
absorption studies (124) that the peptide<br />
ring seems to undergo a conformational exchange<br />
process with a frequency of about 1 MHz. In the<br />
course of extensive investigations of antamanide by<br />
Kessler's research group (125), it has also been noticed<br />
that the distance constraints obtained from<br />
NMR measurements could not be fitted by a single<br />
conformation. In our laboratory Martin Blackledge<br />
performed rotating-frame relaxation measurements<br />
and localized a hydrogen-bond exchange process<br />
with an activation energy of about 20 kJ mol" 1<br />
and a lifetime of 25 fj,s at room temperature (unpublished<br />
results, see also ref. 126). With a new<br />
dynamic structure determination procedure called<br />
MEDUSA (123), the conformational space of antamanide<br />
was investigated more systematically than<br />
ever before. 1176 feasible low-energy structures<br />
were found. They were combined in dynamically
Vol. 16, No. 1/2 27<br />
interconverting pairs in an attempt to fulfill all experimental<br />
constraints including NOE distance constraints,<br />
J-coupling angular constraints, and specific<br />
information on hydrogen-bond dynamics. A large<br />
set of feasible structural pairs were constructed.<br />
Many pairs are compatible with the experimental<br />
data within experimental accuracy. For a more restrictive<br />
description of the dynamic system of antamanide,<br />
additional and more accurate experimental<br />
data is required. Figure 26 shows, as an example,<br />
the dynamic pair of structures that fits the<br />
experimental data best so far. The two interconverting<br />
structures differ primarily in the hydrogen<br />
bonds Va^NH-Phe 9 © and Phe 6 NH-Ala 4 0, which<br />
exist only in one of the two conformations (II), and<br />
in the torsional angles ^5 and ^10.<br />
A second study concentrated on the dynamics<br />
of ring puckering of the four proline residues in antamanide<br />
(122). The conformation of the five-ring<br />
systems can be determined from the dihedral angles<br />
Xi, X2) an d X3 which in turn can be deduced from<br />
the vicinal proton-proton J-coupling constants using<br />
the Karplus relations (54). The relevant coupling<br />
constants (21 per residue) were determined<br />
from E. COSY spectra. Based on these measurements,<br />
a model was constructed for each of the proline<br />
residues by least-squares fitting. It was found<br />
that for Pro 3 and Pro 8 a good fit can be obtained<br />
with a single rigid conformation, while for Pro 2 and<br />
Pro 7 two rapidly exchanging conformations were required<br />
to reduce the fitting error to within an acceptable<br />
range. At the same time, measurements<br />
of the 13 C relaxation time confirmed that Pro 3 and<br />
Pro 8 are rigid, while Pro 2 and Pro 7 show dynamic<br />
behavior with correlation times between 30 and 40<br />
ps. This implies that the dynamics of the peptide<br />
ring and the proline ring are not correlated and proceed<br />
on entirely different time scales. The two exchanging<br />
conformations found for Pro 2 are shown<br />
in Figure 27. It is seen that the conformational<br />
changes resemble the up and down movements of<br />
the "flap of the envelope" (C7).<br />
XIV. Magnetic Resonance<br />
Fourier Imaging<br />
Magnetic resonance imaging (MRI) has had<br />
an enormous impact on medical diagnosis and has<br />
rapidly become a powerful routine tool. The basic<br />
Figure 26: Pairs of conformers of antamanide that<br />
fulfill the experimentally determined structural constraints.<br />
The two pairs are shown as stereoplots as<br />
well as in abstract form. In the former, hydrogen<br />
bonds are indicated by broken lines, in the latter by<br />
arrows pointing towards the hydrogen-bonded oxygen<br />
atom. The C-C. bonds about which the torsion<br />
angles 5 and 4>§ are defined are indicated by heavy<br />
lines. 4>5 is in the lower and io in the upper half of<br />
the stereoplots. (from ref. 123).<br />
Pro 2 d)<br />
Pro 2 (2)<br />
Figure 27: The two experimentally determined conformations<br />
of the amino acid residue Pro 2 in antamanide<br />
(1) (see ref. 122).
28 Bulletin of Magnetic Resonance<br />
I<br />
Figure 28: Schematic representation of Fourier<br />
NMR imaging, here shown in two dimensions. Two<br />
orthogonal gradients (gx,9y) are applied during the<br />
t\ and £2 periods of a 2D experiment. A 2D Fourier<br />
transformation of the data set s(ti,t2) produces a<br />
2D image of the investigated subject (R.R.E.).<br />
procedure for recording a 2D or 3D NMR image of<br />
an object is attributed to Paul Lauterbur (127). A<br />
magnetic field gradient, applied along different directions<br />
in space in a sequence of experiments, produces<br />
projections of the nuclear spin density of the<br />
object onto the direction of the gradient. From a<br />
sufficiently large set of such projections it is possible<br />
to reconstruct an image of the object, for example,<br />
by filtered backprojection in analogy to X-ray<br />
tomography.<br />
A different approach is directly related to 2D<br />
and 3D FT spectroscopy. Frequency encoding of<br />
the three spatial dimensions is achieved by a linear<br />
magnetic field gradient applied successively along<br />
three orthogonal directions for the durations £1, £2,<br />
and £3, respectively, in a pulse FT experiment (128).<br />
In full analogy to 3D spectroscopy, the time parameters<br />
t\ and £2 are incremented in regular intervals<br />
from experiment to experiment. The recorded signal<br />
s(t\,t2,tz) is Fourier-transformed in three dimensions<br />
to produce a function S(OJI,0^2,^3) which<br />
is equivalent to a 3D spatial image when the spatial<br />
information is decoded using the relations x —<br />
^l/Sx, V ~ ^2/gy, and z = io^/gz with the three field<br />
gradients gx, gy, and gz. The procedure is illustrated<br />
in Figure 28 for two dimensions.<br />
In a further refinement, proposed by Edelstein et<br />
al. (129), the time variables £1 and £2 are replaced by<br />
variable field gradient strengths gx and gy applied<br />
during a constant evolution time. With regard to<br />
the accumulated phase, (eqn. 20) it is immaterial<br />
whether the evolution time or the field gradients are<br />
varied.<br />
7 =<br />
(20)<br />
However, keeping the time t^ constant eliminates<br />
undesired relaxation effects.<br />
In medical imaging, 3D experiments have a natural<br />
justification, although it is sometimes simpler to<br />
apply selective excitation techniques to select a 2D<br />
slice through the object to be imaged (130). Even<br />
extensions to higher dimensions are quite realistic.<br />
In a fourth dimension, for example, chemical shift<br />
information can be accommodated (131). Also 2D<br />
spectroscopic information could be combined with<br />
three spatial dimensions, leading to a 5D experiment.<br />
No limitations seem to exist for human imagination.<br />
However, the practical limits will soon be<br />
reached when the required performance times are<br />
also taken into consideration.<br />
XV. Conclusion<br />
I am not aware of any other field of science outside<br />
of magnetic resonance that offers so much freedom<br />
and opportunities for a creative mind to invent<br />
and explore new experimental schemes that can be<br />
fruitfully applied in a variety of disciplines. NMR<br />
spectroscopy is intellectually attractive because the<br />
observed phenomena can be understood based on a<br />
sound theory, and almost all conceits can also be<br />
tested by easy experiments. At the same time, the<br />
practical importance of NMR is enormous and can<br />
justify much of the playful activities of an addicted<br />
spectroscopist.<br />
Most of the credit for the inspiration and execution<br />
of the work described should go to my teachers<br />
Hans Primas and Hans H. Giinthard, to my<br />
supervisor Weston A. Anderson, to the inspirator<br />
Jean Jeener, and to my co-workers (in more or<br />
less chronological order): Thomas Baumann, Enrico<br />
Bartholdi, Robert Morgan, Stefan Schaublin, Anil<br />
Kumar, Dieter Welti, Luciano Miiller, Alexander
Vol. 16, No. 1/2 29<br />
Wokaun, Walter P. Aue, Jiri Karhan, Peter Bachmann,<br />
Geoffrey Bodenhausen, Peter Brunner, Alfred<br />
Hohener, Andrew A. Maudsley, Kuniaki Nagayama,<br />
Max Linder, Michael Reinhold, Ronald<br />
Haberkorn, Thierry Schaffhauser, Douglas Burum,<br />
Federico Graf, Yongren Huang, Slobodan Macura,<br />
Beat H. Meier, Dieter Suter, Pablo Caravatti, Ole<br />
W. S0rensen, Lukas Braunschweiler, Malcolm H.<br />
Levitt, Rolf Meyer, Mark Ranee, Arthur Schweiger,<br />
Michael H. Frey, Beat U. Meier, Marcel Miiri,<br />
Christopher Councell, Herbert Kogler, Roland<br />
Kreis, Norbert Miiller, Annalisa Pastore, Christian<br />
Schonenberger, Walter Studer, Christian Radloff,<br />
Albert Thomas, Rafael Briischweiler, Herman Cho,<br />
Claudius Gemperle, Christian Griesinger, Zoltan<br />
L. Madi, Peter Meier, Serge Boentges, Marc Mc-<br />
Coy, Armin Stockli, Gabriele Aebli, Martin Blackledge,<br />
Jacques Briand, Matthias Ernst, Tilo Levante,<br />
Pierre Robyr, Thomas Schulte-Herbriiggen,<br />
Jxirgen Schmidt and Scott Smith. I would also<br />
like to thank my technical staff, Hansruedi Hager,<br />
Alexandra Frei, Janos A. Deli, Jean-Pierre Michot,<br />
Robert Ritz, Thomas Schneider, Markus Hintermann,<br />
Gerhard Gucher, Josef Eisenegger, Walter<br />
Lammler and Martin Neukomm; my secretary Irene<br />
Miiller; and several research groups with which I<br />
had the pleasure to collaborate, first of all the research<br />
group of Kurt Wiithrich and the group of<br />
Horst Kessler. I am grateful for support in the early<br />
days from Varian Associates and more recently from<br />
the Swiss Federal Institute of Technology, the Swiss<br />
National Science Foundation, the Kommission zur<br />
Forderung der Wissenschaftlichen Forschung, and<br />
last but not least to Spectrospin AG.<br />
XVI. References<br />
^.I. Rabi, Phys. Rev. 51, 652 (1937).<br />
2<br />
I.I. Rabi, J.R. Zacharias, S. Miilman, and P.<br />
Kusch, Phys. Rev. 53, 318 (1938); I.I. Rabi, S.<br />
Miilman, P. Kusch, and J.R. Zacharias, ibid. 55,<br />
526 (1939).<br />
3<br />
J.M.B. Kellogg, I.I. Rabi, N.F. Ramsey, and<br />
J.R. Zacharias, Phys. Rev. 55, 318 (1939); ibid.<br />
56, 728 (1939); ibid. 57, 677 (1940).<br />
4<br />
E.M. Purcell, H.G. Torrey, and R.V. Pound,<br />
Phys. Rev. 69, 37 (1946).<br />
5<br />
F. Bloch, W. Hansen, and M.E. Packard, Phys.<br />
Rev. 69, 127 (1946).<br />
6<br />
F. Bloch, Phys. Rev. 70, 460 (1946).<br />
7<br />
J. Brossel and A. Kastler, C. R. Hebd. Seances<br />
Acad. Sci. 229, 1213 (1949); A. Kastler, J. Phys.<br />
Radium 11, 255 (1950).<br />
8<br />
R.R. Ernst, G. Bodenhausen, and A. Wokaun,<br />
"Principles of NMR in One and Two Dimensions",<br />
Clarendon Press, Oxford, 1987.<br />
9<br />
A. Bax, "Two-Dimensional NMR in Liquids",<br />
Delft University Press, Reidel, Dortrecht, 1982.<br />
10<br />
Attur-ur Rahman, "Nuclear Magnetic Resonance,<br />
Basic Principles", Springer, New York, 1986.<br />
U<br />
N. Chandrakumar and S. Subramanian, "Modern<br />
Techniques in High-Resolution FT-NMR",<br />
Springer, New York, 1987.<br />
12<br />
H. Friebolin, "Ein- und zweidimensionale<br />
NMR-Spektroskopie", VCH, Weinheim, 1988; "Basic<br />
One- and Two-Dimensional NMR Spectroscopy",<br />
VCH, Weinheim, 1991.<br />
13<br />
G.E. Martin and A.S. Zektzer, "Two-<br />
Dimensional NMR Methods for Establishing Molecular<br />
Connectivity", VCH, Weinheim, 1988.<br />
14<br />
J. Schraml and J.M. Bellama, "Two-Dimensional<br />
NMR Spectroscopy", Wiley Interscience, New<br />
York, 1988.<br />
15<br />
"Pulse Methods in ID and 2D Liquid-Phase<br />
NMR", (Ed.: W.S. Brey), Academic Press, New<br />
York, 1988.<br />
16<br />
A.A. Michelson, Philos. Mag. Ser. 5, 31, 256<br />
(1981); A.A. Michelson, "Light Waves and Their<br />
Uses", University of Chicago Press, Chicago, 1902.<br />
17<br />
P. Fellgett, Dissertation, Cambridge University,<br />
1951; P. Fellgett, J. Phys. Radium 19, 187<br />
(1958).<br />
18<br />
Varian Associates Magazine, 24, (7), 11<br />
(1979); IEEE Center for the History of Electrical<br />
Engineering Newsletter (24), 2 (1990).<br />
19<br />
R.R. Ernst and W.A. Anderson, Rev. Sci. Instrum.<br />
37, 93 (1966).<br />
20<br />
R.R. Ernst, Adv. Magn. Reson. 2, 1 (1966).<br />
21<br />
W.A. Anderson and R.R. Ernst, US-A 3 475<br />
680 (Impulse Resonance Spectrometer Including a<br />
Time Averaging Computer and a Fourier Analyzer),<br />
1969 (submitted May 26, 1965).<br />
22<br />
R.R. Ernst, in "The Applications of Computer<br />
Techniques in Chemical Research", The Institute of<br />
Petroleum, London, 1972, p.61.<br />
23<br />
O.W. S0rensen, G.W. Eich, M.H. Levitt, G.<br />
Bodenhausen, and R.R. Ernst, Prog. Nucl. Magn.<br />
Reson. Spectrosc. 16, 163 (1983).
30 Bulletin of Magnetic Resonance<br />
24 J.B.J. Fourier, "Theorie analytique de la<br />
chaleur", Firmin Didot, Pere et ills, Paris, 1822.<br />
25 I.J. Lowe and R.E. Norberg, Phys. Rev. 107,<br />
46 (1957).<br />
26 N. Wiener, Mass. Inst. Technol. Res. Lab.<br />
Radiation Rep., (V) 16 S (1942); "Nonlinear Problems<br />
in Random Theory", Wiley, New York, 1958.<br />
27 R.H. Varian, US-A 3 287 629 (Gyromagnetic<br />
Resonance Methods and Apparatus), 1966 (submitted<br />
August 29, 1956).<br />
28 H. Primas, Helv. Phys. Ada 34, 36 (1961).<br />
29 R.R. Ernst and H. Primas, Helv. Phys. Ada<br />
36, 583 (1963).<br />
30 R.R. Ernst, J. Chem. Phys. 45, 3845 (1966).<br />
31 R.R. Ernst, Mol. Phys. 16, 241 (1969).<br />
32 R. Kaiser, J. Magn. Reson. 3, 28 (1970).<br />
33 R.R. Ernst, /. Magn. Reson. 3, 10 (1970).<br />
34 D. Ziessow and B. Bliimich, Ber. Bunsenges.<br />
Phys. Chem. 78, 1169 (1974); B. Bliimich and D.<br />
Ziessow, J. Chem. Phys. 78, 1059 (1983).<br />
35 B. Blumich, Bull. Magn. Reson. 7, 5 (1985).<br />
36 J. Dadok and R.F. Sprecher, J. Magn. Reson.<br />
13, 243 (1974).<br />
37<br />
R.K. Gupta, J.A. Ferretti, and E.D. Becker, J.<br />
Magn. Reson. 13, 275 (1974).<br />
38<br />
J.A. Ferretti and R.R. Ernst, J. Chem. Phys.<br />
65, 4283 (1976).<br />
39 B.L. Tomlinson and H.D.W. Hill, J. Chem.<br />
Phys. 59, 1775 (1973).<br />
40 M.H. Levitt and R. Freeman, J. Magn. Reson.<br />
33, 473 (1979).<br />
41 M.H. Levitt, Prog. Nucl. Magn. Reson. Spec-<br />
trosc. 18, 61 (1986).<br />
42 R.L. Void, J.S. Waugh, M.P. Klein, and D.E.<br />
Phelps, J. Chem. Phys. 48, 3831 (1968).<br />
43 R. Freeman and H.D.W. Hill, in "Dynamic<br />
NMR Spectroscopy" (Eds.: L.M. Jackman and F.A.<br />
Cotton), Academic Press, New York, 1975, S.131.<br />
44 S. Forsen and R.A. Hoffman, J. Chem. Phys.<br />
39, 2892 (1963).<br />
45 H.C. Torrey, Phys. Rev. 75, 1326 (1949); ibid.<br />
76, 1059 (1949).<br />
46<br />
E.L. Hahn, Phys. Rev. 76, 145 (1949).<br />
47<br />
E.L. Hahn, Phys. Rev. 80, 297 (1950).<br />
48<br />
E.L. Hahn, Phys. Rev. 80, 580 (1950).<br />
49<br />
M. Emshwiller, E.L. Hahn, and D. Kaplan,<br />
Phys. Rev. 118, 414 (1960).<br />
50<br />
S.R. Hartmann and E.L. Hahn, Phys. Rev.<br />
128, 2042 (1962).<br />
51 M.B. Comisarow and A.G. Marshall, Chem.<br />
Phys. Lett. 25, 282 (1974); ibid. 26, 489 (1974).<br />
52 J.C. McGurk, H. Mader, R.T. Hofmann, T.G.<br />
Schmalz, and W.H. Flygare, J. Chem. Phys. 61,<br />
3759 (1974).<br />
53 For example, M.K. Bowman in "Modern<br />
Pulsed and Continuous-Wave Electron Spin Resonance",<br />
(Eds.: L. Kevan, M.K. Bowman), J. Wiley,<br />
New York, 1990, p.l.<br />
54 M. Karplus, J. Chem. Phys. 30, 11 (1959).<br />
55 J.H. Noggle and R.E. Schirmer, "The Nuclear<br />
Overhauser Effect", Academic Press, New York,<br />
1971.<br />
56 K. Wiithrich, "NMR of Proteins and Nucleic<br />
Acids", Wiley Interscience, New York, 1986.<br />
57 S. Yatsiv, Phys. Rev. 113, 1522 (1952).<br />
58 W.A. Anderson and R. Freeman, J. Chem.<br />
Phys. 37, 85 (1962).<br />
59 R. Freeman and W.A. Anderson, J. Chem.<br />
Phys. 37, 2053 (1962).<br />
60 R.A. Hoffman and S. Forsen, Prog. Nucl.<br />
Magn. Reson. Spectrsoc. 1, 15 (1966).<br />
61 J. Jeener, Ampere International Summer<br />
School (Basko Polje, Yugoslavia) 1971, unpublished.<br />
62 R.R. Ernst, Vlth International Conference on<br />
Magnetic Resonance in Biological Systems (Kandersteg,<br />
Switzerland) 1974, unpublished.<br />
63 W.P. Aue, E. Bartholdi, and R.R. Ernst, J.<br />
Chem. Phys. 64, 2229 (1976).<br />
64 J. Jeener, B.H. Meier, and R.R. Ernst, J.<br />
Chem. Phys. 71, 4546 (1979).<br />
65 B.H. Meier and R.R. Ernst, J. Am. Chem.<br />
Soc. 101, 6641 (1979).<br />
66 S. Macura and R.R. Ernst, Mol. Phys. 41, 95<br />
(1980).<br />
67 Anil Kumar, R.R. Ernst, and K. Wiithrich,<br />
Biochem. Biophys. Res. Commun. 95, 1 (1980).<br />
68 M.P. Williamson, T.F. Havel, and K.<br />
Wiithrich, J. Mol. Biol. 182, 295 (1985).<br />
69 A.D. Kline, W. Braun, and K. Wuthrich, J.<br />
Mol. Biol. 189, 377 (1986).<br />
70 B.A. Messerle, A. Schaffer, M. Vasak, J.H.R.<br />
Kagi, and K. Wuthrich, J. Mol. Biol. 214, 765<br />
(1990).<br />
71 G. Otting, Y.Q. Qian, M. Billeter, M. Miiller,<br />
M. Affolter, W.J. Gehring, and K. Wuthrich,<br />
EMBO J. 9, 3085 (1990).<br />
72 T.F. Haveland and K. Wuthrich, Bull. Math.<br />
Biol. 46, 673 (1984).
Vol. 16, No. 1/2 31<br />
73 W. Braun and N. Go, J. Mol. Biol. 186, 611<br />
(1985).<br />
74 R. Kaptein, E.R.P. Zuiderweg, R.M. Scheek,<br />
R. Boelens, and W.F. van Gunsteren, J. Mol. Biol.<br />
182, 179 (1985).<br />
75 G.M. Clore, A.M. Gronenborn, A.T. Briinger,<br />
and M. Karplus, J. Mol. Biol. 186, 435 (1985).<br />
76 Y. Huang, S. Macura, and R.R. Ernst, J. Am.<br />
Chem. Soc. 103, 5327 (1981).<br />
77 G.W. Eich, G. Bodenhausen, and R.R. Ernst,<br />
J. Am. Chem. Soc. 104, 3731 (1982).<br />
78 P.H. Bolton and G. Bodenhausen, Chem.<br />
Phys. Lett. 89, 139 (1982).<br />
79 The spectra were recorded by C. Griesinger,<br />
see R.R. Ernst, Chimia 41, 323 (1987).<br />
80 L. Braunschweiler and R.R. Ernst, J. Magn.<br />
Reson. 53, 521 (1983).<br />
81 D.G. Davis and A. Bax, J. Am. Chem. Soc.<br />
107, 2821 (1985).<br />
82 A.A. Bothner-By, R.L. Stephens, J. Lee, C.O.<br />
Warren, and R.W. Jeanloz, J. Am. Chem. Soc.<br />
106, 811 (1984).<br />
83 R. Briischweiler, B. Roux, M. Blackledge, C.<br />
Griesinger, M. Karplus, and R.R. Ernst, J. Am.<br />
Chem. Soc. 114, 2289 (1992).<br />
84 C. Griesinger, G. Otting, K. Wiithrich, and<br />
R.R. Ernst, J. Am. Chem. Soc. 110, 7870 (1988).<br />
85 J. Briand and R.R. Ernst, Chem. Phys. Lett.<br />
185, 276 (1991).<br />
86 S. Vega, T.W. Shattuck, and A. Pines, Phys.<br />
Rev. Lett. 37, 43 (1976).<br />
87 S. Vega and A. Pines, J. Chem. Phys. 66,<br />
5624 (1977).<br />
88 A. Wokaun and R.R. Ernst, Mol. Phys. 36,<br />
317 (1978).<br />
89 L. Braunschweiler, G. Bodenhausen, and R.R.<br />
Ernst, Mol. Phys. 48, 535 (1983).<br />
90 A. Bax, R. Freeman, and S.P. Kempsell, J.<br />
Am. Chem. Soc. 102, 4849 (1980).<br />
91 A. Bax, R. Freeman, and S.P. Kempsell, J.<br />
Magn. Reson. 41, 349 (1980).<br />
92<br />
U. Piantini, O.W. S0rensen, and R.R. Ernst,<br />
J. Am. Chem. Soc. 104, 6800 (1982).<br />
93<br />
N. Miiller, G. Bodenhausen, K. Wiithrich, and<br />
R.R. Ernst, J. Magn. Reson. 65, 531 (1985).<br />
94<br />
C. Radloff and R.R. Ernst, Mol. Phys. 66,<br />
161 (1989).<br />
95<br />
A. Wokaun and R.R. Ernst, Chem. Phys.<br />
Lett. 52, 407 (1977).<br />
96 G. Bodenhausen, H. Kogler, and R.R. Ernst,<br />
J. Magn. Reson. 58, 370 (1984).<br />
97 M.H. Levitt and R.R, Ernst, Chem. Phys.<br />
Lett. 100, 119 (1983).<br />
98 M.H. Levitt and R.R. Ernst, J. Chem. Phys.<br />
83, 3297 (1985).<br />
"C. Griesinger, O.W. S0rensen, and R.R. Ernst,<br />
J. Am. Chem. Soc. 107, 6394 (1985).<br />
100<br />
C. Griesinger, O.W. S0rensen, and R.R.<br />
Ernst, J. Chem. Phys. 85, 6837 (1986).<br />
101<br />
C. Griesinger, O.W. S0rensen, and R.R.<br />
Ernst, J. Magn. Reson. 75, 474 (1987).<br />
102<br />
A. Bax and R. Freeman, J. Magn. Reson. 44,<br />
542 (1981).<br />
103<br />
B.U. Meier and R.R. Ernst, J. Magn. Reson.<br />
79, 540 (1988).<br />
104 A.A. Maudsley and R.R. Ernst, Chem. Phys.<br />
Lett. 50, 368 (1977).<br />
105 G. Bodenhausen and R. Freeman, J. Magn.<br />
Reson. 28, 471 (1977).<br />
106 L. Miiller, J. Am. Chem. Soc. 101, 4481<br />
(1979).<br />
107 M. Ernst, C. Griesinger, R.R. Ernst, and W.<br />
Bermel, Mol. Phys. 74, 219 (1991).<br />
108 M.H. Levitt, O.W. S0rensen, and R.R. Ernst,<br />
Chem. Phys. Lett. 94, 540 (1983).<br />
109 H. Kogler, O.W. S0rensen, G. Bodenhausen,<br />
and R.R. Ernst, J. Magn. Reson. 55, 157 (1983).<br />
110 H.D. Plant, T.H. Mareci, M.D. Cockman,<br />
and W.S. Brey, 27th Experimental NMR Conference<br />
(Baltimore, MA, USA) 1986.<br />
111 G.W. Vuister and R. Boelens, J. Magn. Re-<br />
son. 73, 328 (1987).<br />
112 C. Griesinger, O.W. S0rensen, and R.R.<br />
Ernst, J. Magn. Reson. 73, 574 (1987).<br />
113 C. Griesinger, O.W. S0rensen, and R.R.<br />
Ernst, J. Am. Chem. Soc. 109, 7227 (1987).<br />
U4 H. Oschkinat, C. Griesinger, P. Kraulis, O.W.<br />
S0rensen, R.R. Ernst, A.M. Gronenborn, and G.M.<br />
Clore, Nature (London) 332, 374 (1988).<br />
115 G.W. Vuister, R. Boelens, and R. Kaptein, J.<br />
Magn. Reson. 80, 176 (1988).<br />
116 C. Griesinger, O.W. S0rensen, and R.R.<br />
Ernst, J. Magn. Reson. 84, 14 (1989).<br />
117 E.R.P. Zuiderweg and S.W. Fesik, Biochem-<br />
istry 28, 2387 (1989).<br />
U8 D. Marion, P.C. Driscoll, L.E. Kay, P.T.<br />
Wingfield, A. Bax, A.M. Gronenborn, and G.M.<br />
Clore, Biochemistry 28, 6150 (1989).
32 Bulletin of Magnetic Resonance<br />
119 S. Boentges, B.U. Meier, C. Griesinger, and<br />
R.R. Ernst, J. Magn. Reson. 85, 337 (1989).<br />
120 O.W. S0rensen, J. Magn. Reson. 89, 210<br />
(1990).<br />
121 L.E. Kay, G.M. Clore, A. Bax, and A.M. Gro<br />
nenborn, Science 249, 411 (1990).<br />
122 Z.L. Madi, C. Griesinger, and R.R. Ernst, J.<br />
Am. Chem. Soc. 112, 2908 (1990).<br />
123 R. Briischweiler, M. Blackledge, and R.R.<br />
Ernst, J. Biomol. NMR 1, 3 (1991).<br />
124 W. Burgermeister, T. Wieland, and R. Winkler,<br />
Eur. J. Biochem. 44, 311 (1974).<br />
125 H. Kessler, M. Klein, A. Miiller, K. Wagner,<br />
J.W. Bats, K. Ziegler, and M. Frimmer, Angew.<br />
Chem. 98, 1030 (1986); Angew. Chem. Int. Ed.<br />
Engl. 25, 997 (1986); H. Kessler, A. Miiller, and<br />
K.H. Pook, Liebigs Ann. Chem., 903 (1989); H.<br />
Kessler, J.W. Bats, J. Lautz, and A. Miiller, Liebigs<br />
Ann. Chem., 913 (1989); J. Lautz, H. Kessler, W.F.<br />
van Gunsteren, H.J. Berendsen, R.M. Scheek, R.<br />
Kaptein, and J. Blaney, Proc. 20th Eur. Pept.<br />
Symp., (Eds.: G. Jung, E. Bayer), 438 (1989).<br />
126 R.R. Ernst, M. Blackledge, S. Boentges, J.<br />
Briand, R. Briischweiler, M. Ernst, C. Griesinger,<br />
Z.L. Madi, T. Schulte-Herbriiggen, and O.W.<br />
S0rensen, in "Proteins, Structure, Dynamics, Design"<br />
(Eds.: V. Renugopalakrishnan, P.R. Carey,<br />
I.C.P. Smith, S.G. Huang, and A.C. Storer), ES-<br />
COM, Leiden, 1991.<br />
127 P.C. Lauterbur, Nature 242, 190 (1973).<br />
128 Anil Kumar, D. Welti, and R.R. Ernst, J.<br />
Magn. Reson. 18, 69 (1975).<br />
129 W.A. Edelstein, J.M.S. Hutchison, G. Johnson,<br />
and T.W. Redpath, Phys. Med. Biol. 25, 751<br />
(1980).<br />
130 P. Mansfield, A.A. Maudsley, and T. Baines,<br />
J. Phys. E9, 271 (1976).<br />
131 P.C. Lauterbur, D.M. Kramer, W.V. House,<br />
and C.-N. Chen, J. Am. Chem. Soc. 97, 6866<br />
(1975).
Vol. 16, No. 1/2 33<br />
Reminiscences of My Journey Through a "Nobel" Lab<br />
Anil Kumar<br />
Indian Institute of Science, Bangalore - 560 012, INDIA<br />
It was the Christmas of 1972 when I received<br />
an exciting offer - the possibility of working with<br />
Richard Ernst of Switzerland. I had just returned<br />
to India from U.S.A. after completing three years of<br />
Post-doctoral work after a Ph.D. in 1969 from the<br />
Indian Institute of Technology, Kanpur. I was looking<br />
for openings and immediately grabbed it. An old<br />
friend from Kanpur days, who was already working<br />
in E.T.H., met me at Zurich airport (Feb., 1973) and<br />
we immediately launched into the bylanes of Zurich<br />
looking for the best places to eat and drink. Ernst,<br />
a junior faculty member in the Physical Chemistry<br />
Laboratory of E.T.H., was occupying a small office<br />
at the top landing of a flight of stairs. I was the<br />
only post-doc and he had 4 Ph.D. students, one of<br />
which (Dieter Welti) was busy working through a<br />
paper I had published from Kanpur. With the help<br />
of another (Enrico Bartholdi) I soon found living<br />
quarters, a two bedroom apartment at Roetel Str.,<br />
which I shared with a Swiss architect, who still is<br />
a good friend. The other lab mates were Thomas<br />
Baumann and Stefan Schaublin. Soon Alexander<br />
Wokaun and Geoffrey Bodenhausen came to do their<br />
diploma work. While Alexander stayed on to do his<br />
Ph.D., Geoffrey decided to go to England.<br />
Lab consisted of three crammed rooms full of<br />
people and equipment half of it home made. I got<br />
involved into doing, - which in those days was somewhat<br />
of a tricky experiment - cross polarization in<br />
solids - which did not work till we moved into a<br />
more spacious laboratory in a new building, allowing<br />
more elbow space. We switched transmitters and<br />
suddenly the experiment worked. Ernst was quite<br />
pleased and gave me a small raise. Around that<br />
time a young student, Luciano Miiller, joined our<br />
group for his Ph.D. and I initiated him into crosspolarization<br />
experiments. He grew a fine crystal of<br />
ferrocene and we observed oscillations in the crosspolarization<br />
dynamics which was later published in<br />
Physical Review Letters. Dedicated minicomputers<br />
attached to experimental set-ups were novelties<br />
those days and it was fun programming them<br />
into their little languages and then making modifi-<br />
cations directly into machine language - you could<br />
almost see how computers worked and interpreted<br />
your commands. Using these, I did a series of pulsed<br />
cross-polarization experiments, and presented the<br />
results in a conference in England in the summer<br />
of 1974.<br />
During February 1974, I received an urgent message<br />
from my father asking me to make a quick trip<br />
to India. I told Ernst, "I am going for two weeks",<br />
but returned three weeks later after getting married.<br />
Ernst and all members of the group had hearty<br />
laughs at the idea of getting married to someone<br />
you have hardly seen. Visa for my wife took some<br />
bother, as Switzerland was in the midst of another of<br />
their many referendums on controlling the number<br />
of foreigners. I remember Ernst making a special<br />
trip to foreigner's office in Zurich convincing them<br />
that it was important that I stayed in Switzerland. I<br />
had been to Ernst's home in Winterthur for a group<br />
party, but had another exclusive one after Padma's<br />
arrival in May 1974.<br />
Jean Jeener of Belgium in a summer school held<br />
in Pule, Yugoslavia in 1971 had proposed an esotoric<br />
looking idea of two-dimensional NMR and, it<br />
seems, promptly forgot about it. I remember Ernst<br />
discussing with me sometimes during 1973 that he<br />
would like to continue on the theme but did not<br />
want to step-toe on Jeener if he is continuing on<br />
it - a case of high and these days rare scientific<br />
ethics. I was of the opinion that a two year period<br />
is long enough. However, Ernst is made of finer<br />
stuff. He used the idea in an experiment which is<br />
completely different from what Jeener had in mind.<br />
The story is as follows. Paul Lauterbur of USA had<br />
in 1972 described a technique of obtaining images of<br />
small objects using steady field gradients and NMR.<br />
Ernst thought of doing imaging using pulsed gradients<br />
and two-dimensional Fourier analysis. Dieter<br />
Welti wrote some subroutines and I did the experiment.<br />
I still remember the little teletype tick-ticking<br />
printing blanks, dots, numbers and a few alphabets,<br />
spitting out a crude image of two tubes of water<br />
placed in a magnet. We laughed at the experiment,
34 Bulletin of Magnetic Resonance<br />
thought nothing will ever come out of it and decided<br />
that it was not worth patenting. What shortsightedness?<br />
In fact not only we but many others<br />
did not think much about the idea and the Swiss National<br />
Science Foundation turned down a proposal<br />
from Ernst for further work on NMR imaging.<br />
We then turned all our attention to twodimensional<br />
NMR spectroscopy. Luciano and I did<br />
the first experiment, which was a simple one, resolving<br />
a complex spectrum into components. I remember<br />
a visit to our lab by Kurt Wiithrich. On seeing<br />
the spectrum he took his head in his hands and sat<br />
down. The potential of the technique seem to have<br />
hit him. He later collaborated with Ernst in exploiting<br />
the applications of it in biomolecules and revolutionized<br />
the applications. Enrico Bartholdi worked<br />
on the theory, Walter Aue on protons and Luciano<br />
and myself on carbon-proton two-dimensional experiments.<br />
Many developments were made and a<br />
quiet revolution was taking place without our ever<br />
realizing it. Perhaps I should add, without fear of<br />
contradiction, that the work looked nothing different<br />
from extremely routine laboratory work, full of<br />
frustrations and slow progress, without any special<br />
excitement and anxiety - except for some occasional<br />
worry such as a visit by a couple, both scientists.<br />
We had observed some unexpected modulations of<br />
carbon echoes and after a lot of explaining we convinced<br />
them of our observations. As soon as they<br />
left Ernst and myself exchanged worried glances and<br />
we immediately wrote-up a short account for Chemical<br />
Physics Letters. Four months later Ernst received<br />
a preprint from the couple saying they have<br />
also observed the effect.<br />
During our stay in Europe we travelled extensively.<br />
Padma insisted that I take her back to all the<br />
places I had visited before her arrival. In addition<br />
we visited many places including a skiing trip with<br />
research-mates in the Swiss Alps. Many places were<br />
visited for attending conferences. In one of these<br />
(Colloque Ampere in Heidelberg, Germany, 1976)<br />
Ernst was invited to give a plenary lecture on Twodimensional<br />
NMR. For some reason he was not able<br />
to go and instead asked me to give the talk. It was<br />
my first major lecture and I was a bit nervous but<br />
it went off well. During this conference a boat ride<br />
down the Necker river with many famous scientists<br />
was particularly memorable. During a conference in<br />
Kenderstag, a town in Swiss mountains, Ernst was<br />
the expert tracking guide.<br />
Although Ernst had told me that I could stay<br />
in his research group as long as I wanted, I had<br />
to look for a position of my own. I therefore put<br />
an ad in Physics Today with a box number. Ernst<br />
noticed it and remarked that this is the person he<br />
wants in his lab, but soon realized that he already<br />
had him. Ernst recommonded my name to several<br />
places and I went for an exploratory lecture trip to<br />
University of Lausanne. Though a beautiful city, my<br />
lack of knowledge of French must have upset me and<br />
I showed little interest in that position (presently<br />
occupied by Geoffrey Bodenhausen). When the offer<br />
of a position came from Bangalore I accepted it<br />
without even looking at the details. We returned to<br />
India in late 1976 and I joined the Indian Institute of<br />
Science in January 1977. Two and a half years later,<br />
after the birth of our daughter, we went back to<br />
Zurich for one more year to apply two-dimensional<br />
NMR to biomolecules, in a joint project of Ernst and<br />
Wiithrich. The work carried out during that period<br />
proved to be a turning point in the application and<br />
growth of two-dimensional NMR.<br />
Life has many turning points which are often recognized<br />
years later. It is always possible to go and<br />
work with a famous person - a nobel laurate - but<br />
to do so before he becomes famous and to take part<br />
in some of the exciting things are the more pleasant<br />
parts of life. It becomes more so when the person<br />
is a thorough gentleman and highly cultured.<br />
Ernst enjoys western classical music and is a lover<br />
of fine arts. He has a large collection of Tibetan<br />
Tankas (hand made religious scroll paintings). His<br />
wife once remarked, when they did not own a car<br />
in early seventies, that whenever they had enough<br />
money he goes out and buys a painting. I wonder<br />
what he did with the Nobel money!
Vol. 16, No. 1/2 35<br />
Contents<br />
Emphasizing the Role of Time<br />
in Quantum Dynamics<br />
J. Jeener<br />
Universite Libre de Bruxelles (CP-232)<br />
Campus Plaine, B-1050 Brussels, Belgium<br />
I. Introduction 35<br />
II. Bases and Representations 36<br />
1. Single basis, single date 36<br />
2. Single basis, two dates (or more) 37<br />
3. Two bases, two dates (or more) 37<br />
III. Time Derivatives As Seen From Different Bases 38<br />
IV. Quantum Dynamics As Seen From Different Bases 39<br />
1. Laboratory frame 39<br />
2. Rotating frame 40<br />
3. Interaction representation 41<br />
V. Acknowledgments<br />
VI. References<br />
I. Introduction<br />
Richard Ernst begins his Nobel Lecture entitled<br />
"Nuclear Magnetic Resonance Fourier Transform<br />
Spectroscopy" (1) with the remark that NMR<br />
is one of the first fields in which quantum theory<br />
and experiments have been discussed with time (and<br />
not energy or frequency) as the essential explicit<br />
variable, eventually leading to the general concept<br />
of "coherent spectroscopy." Again and again, when<br />
teaching the elementary aspects of quantum dynamics<br />
and pulsed NMR, I felt dissatisfied with the traditional<br />
way of handling the time-related variables<br />
and transformations, and I progressively developed<br />
an alternative presentation which leads to the same<br />
conclusions in a somewhat different way. It is a real<br />
pleasure to present these ideas in this issue of the<br />
Bulletin of Magnetic Resonance as a tribute to a<br />
very good friend, Richard Ernst.<br />
One customary weakness is to use the same name<br />
("time"), and similar typographic symbols, for dates<br />
and for durations (i.e. time intervals). Of course,<br />
this does not disturb or confuse the experts, but it<br />
is inconvenient and misleading for beginners, and<br />
intolerable if one tries to get systematic help from a<br />
symbolic manipulation program. Solving this problem<br />
is just a matter of care in the choice of words,<br />
symbols and notation.<br />
Another, more subtle, traditional weakness has<br />
to do with the comparison or combination of quantum<br />
objects defined at different dates, as involved<br />
in the definition of time-derivatives for instance. To<br />
illustrate this point, let us examine the seemingly<br />
obvious notion of a constant ket, taking as a prototype<br />
one of the kets forming the basis b in current<br />
use in ket space. If we should be taking the<br />
ideas of "rotating frame" or "toggling frame" literally,<br />
we would be using different bases in ket space<br />
associated with the different "frames", and these<br />
bases would be moving with respect to each other.<br />
Clearly, a ket which appears as immobile or con-<br />
41<br />
42
36 Bulletin of Magnetic Resonance<br />
stant with respect to one of these bases will, in<br />
general, appear as time-dependent with respect to<br />
other bases. "Absolute rest" is not a valid concept<br />
in quantum state space any more than in ordinary<br />
configuration space. With this situation in mind,<br />
the traditional presentation of quantum dynamics<br />
appears as strongly tied to a particular choice of<br />
basis in ket space, a choice on which attention is<br />
usually not drawn explicitly. If we want to avoid<br />
this limitation, for the sake of generality and uniformity,<br />
or in order to retain full freedom in the<br />
final choice of basis for the evaluation of traces, we<br />
should mention the reference basis explicitly, whenever<br />
relevant, and formulate quantum dynamics in<br />
such a way that the reference basis can be changed<br />
at will, while keeping the same abstract quantum<br />
objects for the description of the physical situation<br />
under investigation. As we shall see, this does not<br />
require any major change in notation or logic, and<br />
tends to make the quantum engineering more systematic<br />
and transparent [see, for instance, ref. (2)].<br />
Consequences of dropping the tacit notion of absolute<br />
rest are that, for instance,<br />
(a) all kets will carry a date tag and operations<br />
on kets like linear combination or scalar product will<br />
be meaningful only if the kets involved are all defined<br />
at the same date,<br />
(b) changing the date tag(s) of a quantum object<br />
will appear as an important transformation in itself,<br />
(c) time-derivatives of quantum objects will be<br />
labelled by the basis in which they are evaluated,<br />
(d) c-number objects, like matrix elements or<br />
traces, have a date-dependence which is not related<br />
to any particular choice of basis, hence providing<br />
a convenient tool for linking objects with different<br />
basis labels.<br />
The ideas and techniques which are discussed in<br />
the present paper for the "ket-bra-operator" presentation<br />
of quantum mechanics can be extended to<br />
the "Liouville" presentation in a particularly simple<br />
way if Liouville space objects are introduced,<br />
which are the direct counterparts of kets, bras and<br />
operators [see, for instance, ref. (3)]. The resulting<br />
limitation to superkets and superbras which do<br />
not change the date, hence to superoperators which<br />
involve two dates at most, does not seem to be a<br />
hindrance, at least for NMR applications.<br />
For simplicity, the discussion will be limited to<br />
non-relativistic problems which can be described in<br />
terms of discrete bases in ket space. No attempt will<br />
be made towards more generality.<br />
II. Bases and Representations<br />
For clarity in the present paper, we shall write<br />
explicitly, for each quantum object, all the arguments<br />
which are date tags, and no other. If other<br />
arguments were necessary, the typography should<br />
clearly separate date tag(s) from other arguments.<br />
As a starting point, we choose a basis b in ket<br />
space, which is a collection of kets \h(t)) which, at<br />
any date t, satisfies the orthonormality condition<br />
and the closure relation<br />
= 6j<br />
jtk<br />
where 1 denotes the unit or identity operator (note<br />
that this operator is denned without reference to<br />
any specific basis or date, hence a date tag would<br />
be irrelevant).<br />
1. Single basis, single date<br />
As long as a single date t is involved, no deviation<br />
from the traditional procedures is necessary:<br />
Any ket \ip(t)) can be expressed ("represented") as a<br />
linear combination of the kets of the basis {\bi(t))}<br />
by the usual multiplication from the left with the<br />
closure relation eqn. 2<br />
This procedure is easily extended to linear operators<br />
Aft) involving a single date, which are defined<br />
by the linear relation between \i/)(t)) and \
Vol. 16, No. 1/2 37<br />
2. Single basis, two dates (or more)<br />
As a first example involving two dates, let us<br />
consider the operator Pb,i(ti,t0) = |6j(ti))(&j(io)|,<br />
which has the obvious property Pb,i(ti,to)\bi(ta)) =<br />
\bi(ti)) whenever \bi(to)) is normalized. The action<br />
of this operator to its right on a ket |a) is denned<br />
only if the date tag of this ket is i0, and the result<br />
is then the ket |/3) = Pb,i{ti,to)\a(to)) with date tag<br />
t\. Of course, \Q(t\)) may also depend implicitly on<br />
to-<br />
Conversely, the action of P;))i(ti,io) to its left on<br />
a bra is defined only if the date tag of the bra is t\,<br />
and the result is then a bra with date tag £ Summarizing,<br />
the operator Pb,i(ti,to) has date tags t\<br />
on its left and to on its right, as indicated explicitly<br />
by the typography (t\, to) of the pair of date tags.<br />
Clearly, such date-changing operators can be<br />
added together (only) if they have the same pair<br />
of date tags, and they can be multiplied together<br />
(only) if the sides which are in contact have the<br />
same date tag. For instance, one can easily verify<br />
that Pbti(t2,t0) = A,i(t2,*i)^,i(ti,to).<br />
The ket \ip(t)) will be called immobile as seen<br />
from basis b if all its projections on this basis are<br />
independent of the date t, hence<br />
E i<br />
E bi(t))(bi(t0 (5)<br />
where to is some fixed date, and the unitary date<br />
displacement operator associated with basis 6,<br />
Ub(t,tQ) = (6)<br />
has all the usual properties of evolution operators,<br />
including the group property for connected date<br />
pairs<br />
Ub(t2,t0) =<br />
and the relations<br />
Ub(t,t) = l<br />
and<br />
(7)<br />
= Ub(tQ,t). (8)<br />
Note that the definition of the inverse, as the solu-<br />
/ N - 1<br />
tion of the equation \Ub(t,t0)\ Ub(t,t0) = 1 with<br />
a unit operator involving a single date, implies that<br />
the inverse has the date tags t on the right and t0 on<br />
the left, hence the unit operator has the tacit date<br />
tag t0.<br />
The operator B{t) involving a single date will<br />
be called immobile as seen from basis b if all its<br />
matrix elements (&j(t)|i?(t)|£>fc(t)) in this basis are<br />
independent of t. Such an operator can be expressed<br />
for any date t in terms of the operator at a fixed date<br />
to and the characteristic evolution operator Ub(to, t)<br />
of basis b as<br />
= Ub{t,t0)B{t0)Ub{t0,t). (9)<br />
After introducing the explicit notion of datechanging<br />
operator, in contrast to operators involving<br />
a single date, it is worth stressing that "taking<br />
the trace" is a valid operation only when applied to<br />
operators which do not change the date, for instance<br />
Tr[^4ftj]. Of course, A may be expressed as a product<br />
involving a number of date-changing operators,<br />
but this product itself must have the same date tag<br />
on either side. .<br />
3. Two bases, two dates (or more)<br />
Let us now consider a second basis {|cj(i))} with<br />
characteristic evolution operator Uc(t,to). At any<br />
single date t, basis c is related to basis b by the<br />
unitary transformation Wcb(t), such that, for any i,<br />
where<br />
has the usual properties<br />
and<br />
Wbb(t) = 1<br />
(10)<br />
(11)<br />
Wcb{t)) ] = (Wcb(t)) X = Wbc{t). (12)<br />
Of course, basis kets are immobile as seen from their<br />
own basis, so that we can use eqn. 5 to obtain<br />
the relations \ck(t))= Uc(t,t0)\ck(t0)) and (bk(t)\ =<br />
(bk(to)\Ub(to,t), which we can insert in eqn. 11 to<br />
derive the useful transformation rules
38 Bulletin of Magnetic Resonance<br />
and<br />
Uc(t,t0) = Wcb{t)Ub(t,t0)Wbc(t0)<br />
Wcb(t) = Uc{t, to)Wcb(to)Ub(tQ, t). (13)<br />
If more than two bases are involved, (11) immediately<br />
leads to the relation<br />
Wdc(t)Wcb(t) = Wdb(t). (14)<br />
Consider now the particular case of a basis c<br />
such that all its basis kets |cj(t)) are immobile with<br />
respect to basis b, hence |cj(t)) = Ub(t,to)\ci(to))<br />
for all i. Combining this with the definition eqn. 5<br />
for Uc(t,to), we conclude that Ub(t,to) = Uc(t,to).<br />
Hence, two bases which are immobile with respect<br />
to each other have exactly the same characteristic<br />
evolution operator.<br />
III. Time Derivatives As<br />
Prom Different Bases<br />
Seen<br />
In the present perspective, the naive definition of<br />
the time derivative of an arbitrary ket (not necessarily<br />
mobile or immobile with respect to any specified<br />
basis) as the limit of [\ip(t + At)) - \ 0 has to be supplemented with a procedure<br />
for comparing (subtracting) kets defined at different<br />
dates. With basis b chosen as reference, a natural<br />
way out of this problem is to interpret |
Vol. 16, No. 1/2 39<br />
ih {^) Mt) = i*[ : k) A(t)-\Dcbit),Ait)\.<br />
dt dt)<br />
(19)<br />
Permuting the roles of the bases, and using eqns. 12,<br />
14, 17 and 19 in the perspective of multiple bases,<br />
one can easily verify that<br />
and<br />
IV.<br />
Dbc(t) = -<br />
(20)<br />
Quantum Dynamics As Seen<br />
From Different Bases<br />
1. Laboratory frame<br />
We choose basis b as the conventional reference<br />
basis in which the equation of motion for the density<br />
operator p(t), which describes the state of the<br />
physical system, is the usual von Neumann equation<br />
(21)<br />
where the Hermitian operator H(t) is the Hamiltonian<br />
of the system. We shall assume, as usual, that<br />
the Hamiltonian and all other relevant observables<br />
of the system are well known in terms of their action<br />
on the basis kets of the reference basis b. In general,<br />
basis b and the "basic" observables are introduced,<br />
according to the standard quantization rules, starting<br />
from classical quantities denned in a particular<br />
classical frame of reference (called "laboratory<br />
frame" in the NMR literature). If this frame is inertial,<br />
then H(t) is both the generator of motion with<br />
respect to basis b, as shown by eqn. 21, and the<br />
energy observable suitable for discussing thermodynamics<br />
in this classical frame.<br />
Combining eqns. 19 and 21, we see immediately<br />
that pit) is immobile in any basis d such that<br />
Ddbit) = Hit), hence, using eqn. 9, we have<br />
The characteristic evolution operator Udit, to) of basis<br />
d can be evaluated by solving its equation of motion<br />
(23)<br />
directly, with the initial condition Ud(to,to) = 1, or<br />
by solving the equation of motion for the unitary<br />
transformation Wdb{t),<br />
= Hit)Wdbit), (24)<br />
with a suitable unitary initial condition and using<br />
eqn. 13.<br />
A useful step towards approximate solutions of<br />
eqns. 23 or 24 for short delays is to reformulate the<br />
problem as an equivalent integral equation. For instance,<br />
we can use the version of eqn. 15 for operators<br />
to cast eqn. 24 under the form<br />
+ At) = Ub{t + At, t)Wdbit)Ubit, t + At)<br />
+ At Hit)Wdbit)<br />
(25)<br />
in the limit of At —>• 0. This process of infinitesimal<br />
date change can be iterated, leading to the simple<br />
integral equation version of eqn. 24, including the<br />
initial condition:<br />
= Ubit,to)Wdb(to)Ubito,t)<br />
to<br />
(26)<br />
Eqn. 26 can be used recursively to derive the usual<br />
formal series expansion<br />
Wait) = Ubit,to)Waito)UbitQ,t)<br />
-\ / dtiUbi<br />
in Jto<br />
^ ( 2 , ) ( f l , ( ) ^ ( )<br />
(27)<br />
In the case of Udit, to), similar calculations lead from<br />
eqn. 23 to<br />
in t0<br />
/ i \ 2 A<br />
—<br />
dt2Ubit,ti)Hiti)x<br />
\inj Jt0 Ubit1,t2)Hit2)Ub(t2,t0) + ...<br />
(28)
40 Bulletin of Magnetic Resonance<br />
The analogous expression for pit) in terms of p(to)<br />
involves nested commutators with the Hamiltonian<br />
taken at different dates, also with Uf, operators<br />
bridging the "gaps" between different date tags.<br />
As usual, the difficulties involved in deriving a<br />
compact version of these formal series expansions<br />
depend crucially on the commutation properties of<br />
H(t) with itself taken at different dates. In the<br />
present formalism, the simple case is when<br />
H(ti),J7b(ti,t2)H(t2)l76(t2,ti) =0 (29)<br />
for any pair of dates ti and t
Vol. 16, No. 1/2 41<br />
hence<br />
= {wcb(t)B(t)Wbc(t)}<br />
= {uc(t,to)B(to)Uc(tQ,t)},<br />
B{t) = Wbc(t){wcb(t)B(t)Wbc(t)}wcb(t)<br />
= Wbc(t)BW(t)Wcb(t).<br />
(36)<br />
(37)<br />
Pursuing in the same direction, we shall find that<br />
the final evaluation of the trace in eqn. 31 will also<br />
be simplified by the use of basis c or some basis<br />
immobile with respect to basis c.<br />
The procedure indicated in this section is perfectly<br />
practical and has the major advantages of being<br />
the exact analogue of the general idea of one<br />
same experiment (involving the system under investigation,<br />
"external actions," and measuring instruments)<br />
being examined and discussed by various observers<br />
who try to choose the most convenient point<br />
of view. Of course, this procedure has the minor<br />
drawback of an unusual typography: time derivatives<br />
are indexed by the relevant basis, a new set of<br />
basic operators is introduced for each new basis,...<br />
If we are willing to drop the major advantage of<br />
physical clarity mentioned above, we can very easily<br />
translate the many-bases procedure into the conventional<br />
single-basis "interaction representation" technique.<br />
3. Interaction representation<br />
In the rotating frame procedure outlined above,<br />
the "original" operators (density operator, Hamiltonian,<br />
observables, evolution operator,...) are discussed<br />
with reference to the "not-original" basis c.<br />
If we apply the transformation Wbc(t) to all these<br />
quantum objects, basis c is transformed into basis<br />
b, each operator is transformed into its l 6c l transform<br />
(note the rule for date changing operators),<br />
= Wbc(t)A{t)Wcb(t),<br />
= Wbc(t)K(t,t0)Wcb(t0),<br />
(38)<br />
time derivatives with respect to basis c are transformed<br />
into time derivatives with respect to basis<br />
b, hence eqn. 34 is transformed into an equation of<br />
motion for p^ bc \t), formulated in basis 6,<br />
The solution of eqn. 39 can be written as<br />
where<br />
and<br />
(39)<br />
(40)<br />
i(t,t0) = W (41)<br />
(42)<br />
Of course, average values can be evaluated from the<br />
transformed versions of the relevant operators:<br />
A(t))=Tr{A(t)p(t)}=Tr )}• (43)<br />
As far as practical calculations are concerned, including<br />
the introduction of suitable approximations,<br />
the interaction representation method described by<br />
eqns. 32-33 and eqns. 38-43, and the rotating frame<br />
method described by eqns. 32-37, are equivalent because<br />
they only differ by minor details of notation,<br />
as shown above. The purpose of the rather clumsy<br />
notation used in this paragraph is to clarify the relation<br />
between the quantum objects which describe<br />
the same physical object in the two methods, hence<br />
helping to combine the more intuitive visualisation<br />
provided by the rotating frame with the traditional<br />
convenience of interaction representations.<br />
V. Acknowledgments<br />
Discussions with P. Broekaert and F. Henin<br />
helped to clarify many aspects of the present text.<br />
This work was supported, in part, by "Loterie<br />
Nationale" and FRSM, and by "Communaute<br />
Frangaise de Belgique" (contrat ARC 91/96-149).
42 Bulletin of Magnetic Resonance<br />
VI. References<br />
1<br />
see, for instance, R. R. Ernst, Bull. Magn.<br />
Reson. 16, 5-32 (1994).<br />
2<br />
J. Jeener and F. Henin, Phys. Rev. A34, 4897<br />
(1986), Appendix D. In this reference, (D33) must<br />
be corrected by replacing 1 by Ui,(t,to).<br />
3<br />
J. Jeener, Adv. Magn. Reson. 10, 1 (1982).
Vol. 16, No. 1/2 43<br />
Contents<br />
A Novel Contour Plot Algorithm<br />
for the Processing of 2D and 3D NMR Spectra<br />
J. Weber 1 , F. Herrmann 2 , P. Rosch 2 and A. Wokaun 1<br />
1 Physikalische Chemie II and 2 Lehrstuhl fur Biopolymere<br />
University of Bayreuth, D - W - 8580 Bayreuth, Germany<br />
I. Introduction 43<br />
II. The 'ribbon' contour plot algorithm 43<br />
1. Peak identification 44<br />
2. The contour 44<br />
III. Discussion 46<br />
IV. Environment for the reduction and representation of data from 2D and 3D NMR<br />
experiments—the 'NDEE' program package 46<br />
V. References 48<br />
I. Introduction<br />
Elucidation of the conformation of peptides and<br />
proteins in solution by NMR (nuclear magnetic resonance)<br />
methods requires efficient and versatile data<br />
processing capabilities. Especially for the handling<br />
and for a convenient display of large two- or threedimensional<br />
data matrices, sophisticated codes are<br />
being developed.<br />
A conventional 2D NMR spectrum typically consists<br />
of 512 * 4096 4 byte floating point data values,<br />
equivalent to 8 MByte. An impressive variety of 3D<br />
NMR experiments has been conceived and realized<br />
to this date (1-7). The introduction of the third<br />
dimension considerably increases the data size. At<br />
present, data matrices consisting of 256 * 256 * 512<br />
or of 128 * 128 * 2048 floating point data values,<br />
i.e. 134 MByte, can be handled with medium-sized<br />
work stations (8).<br />
Provided that highly resolved spectra of the<br />
molecule can be recorded, the next decisive step<br />
in structural investigation is the assignment of the<br />
spectra. In this process, a major task consists in<br />
identification of NOE connectivities. Short range<br />
connectivity information is required for the sequential<br />
assignment, while the long-range NOE contacts<br />
serve as the crucial input for the distance geometry<br />
and restrained molecular dynamics calculations<br />
(9-14).<br />
Several efforts have been reported (15-19) to automate<br />
the assignment of 2D spectra. However, neither<br />
for 2D nor for 3D spectra of proteins, a decisive<br />
breakthrough in this computational problem<br />
has been made yet. As a prerequisite for any assignment<br />
algorithm, be it by eye or by computer,<br />
several requirements must be met, i.e. the capability<br />
of handling large data matrices, the identification<br />
of cross peaks, and the extraction of their specific<br />
coordinates. As a tool for the solution of this<br />
problem, a new contour plot algorithm, called the<br />
'ribbon' method, is reported in this communication,<br />
which provides several advantages as compared to<br />
conventional grid search methods.<br />
II. The 'ribbon' contour plot algorithm<br />
The algorithm extracts all pixels belonging to a<br />
contour, and stores the coordinates of the contour
44 Bulletin of Magnetic Resonance<br />
in a sequence proceeding around the circumference<br />
of the peak. Furthermore, the peak volume and the<br />
center of mass coordinates are computed.<br />
1. Peak identification<br />
At the onset, the process of drawing a contour in<br />
the two-dimensional data matrix representing a 2D<br />
spectrum is reviewed. Once the intensity level has<br />
been set, a peak is defined as a set of data points<br />
fulfilling the condition that all points with intensities<br />
higher than the predetermined level are immediately<br />
adjacent along rows and/or columns of<br />
the 2D matrix. First, the original data matrix is<br />
searched for 'transitions' across the preset contour<br />
level. To avoid border problems, the data matrix is<br />
extended by one row and one column of zeroes on either<br />
side of the data. Starting from coordinates (0,<br />
0), the 2D spectrum is searched for up-transitions<br />
(preceding point has a lower intensity than the contour,<br />
while intensity of the next point is higher than<br />
the contour level) and for down-transitions, both in<br />
horizontal and vertical direction. The two types of<br />
transition are stored as distinct flags.<br />
All points belonging to one peak are extracted<br />
from the 'transition matrix.' This might be envisaged<br />
as a 'flood fill' were the peaks are protruding<br />
from an ocean of constant height, corresponding<br />
to the contour level. In a search along the rows,<br />
all points between the first up-transition and the<br />
corresponding down-transition are marked as 'horizontally<br />
connected' and stored as 'to be searched<br />
vertically.' Starting from these points, a vertical<br />
search along the columns is performed, and 'vertically<br />
connected' points are marked and stored as<br />
'to be searched horizontally.' This procedure is repeated<br />
until no more points remain 'to be searched.'<br />
The connected points identified in this manner are<br />
written into a peak matrix.<br />
2. The contour<br />
The coordinates of the peak contour are collected<br />
in an ordered array (i.e., sequentially along<br />
the contour line starting at any point) by means of<br />
a virtual 'ribbon' that surrounds the peak in the corresponding<br />
matrix. First, the band is placed at the<br />
smallest rectangle surrounding the peak. The idea,<br />
illustrated in Figure 1, is to shrink the ribbon until<br />
it touches the contours of the peak everywhere. For<br />
this purpose one has to define, for every segment of<br />
the elastic ribbon, the direction in which it is going<br />
to contract. With all other segments fixed, one<br />
point of the ribbon is moved inwards until a transition<br />
is found. If more than one step is required,<br />
new points are inserted into the ribbon from which<br />
a search perpendicular to the original one has to be<br />
performed subsequently.<br />
Once the searching tip has arrived at a transition,<br />
it is anchored there, and develops sprouts in<br />
the two perpendicular directions. At this point it is<br />
important to test immediately whether it is possible<br />
to go 'around the corner' from the present contour<br />
point (Figure 2). Staying with the image of a flood<br />
fill, this test ensures that one reaches the inside of<br />
any lagoons or coves around the borders of the peak.<br />
If, in the course of the search, any two points<br />
of the ribbon meet with opposite search directions,<br />
a connection is made, the points in between are<br />
deleted, and the rubber band shrinks accordingly.<br />
When all points with their specific search directions<br />
have been anchored in this manner, the ribbon adheres<br />
correctly around the contour of the peak, and<br />
the points in the contour are connected sequentially,<br />
which is of advantage for the graphical output.<br />
One has to consider the case illustrated in Figure<br />
3 that there might be a 'lake' hidden within<br />
the peak. If transitions are indeed found within<br />
the peak, the outer contour is stored and then removed,<br />
and the sign of the inner transitions is inverted<br />
(down becomes up and vice versa). Thereafter,<br />
a restart of the ribbon search method will correctly<br />
yield the inner contour.<br />
Evidently one might think of a peak surrounded<br />
by another peak (an island within the lake in the<br />
picture of the flood fill, cf. Figure 3). This case is<br />
treated by storing and deleting the contour of the<br />
'lake,' such that every interior peak is consequently<br />
found. Of course, the entire procedure must now<br />
be repeated over the entire integer matrix of 'transitions,'<br />
until all contours have been drawn.<br />
Thus far the points of the contours are associated<br />
with the indices of the data points. Finally the<br />
accurate coordinates of every point of the contour<br />
are calculated by interpolation.
Vol. 16, No. 1/2<br />
-1 .-1<br />
\<br />
Figure 1: Principle of the 'ribbon' method used to define the contour of a peak. In (a), the fully expanded<br />
ribbon surrounds the 'peak' as represented by the integer 'transition matrix.' The search directions of the<br />
ribbon elements are indicated by horizontal or vertical dashes. After a two-step search (b), four new ribbon<br />
elements with perpendicular search directions have been inserted.<br />
V<br />
Figure 2: 'Corner test' used to reach the inside of a 'cove.' A triple of new ribbon elements is inserted after<br />
every successful step around a corner (a). The triple inside the cove shown in (b) serves to attach the ribbon<br />
to the inner wall (c).<br />
V<br />
45
46 Bulletin of Magnetic Resonance<br />
Figure 3: Complex peak structures. In the model of a flood fill, a peak may contain a 'lake' (a), or even a<br />
second peak ('island') within the lake (b).<br />
III. Discussion<br />
A conventional grid search results in pairs of<br />
points to be connected, i.e. the individual elements<br />
of a line. In contrast, the present contour plot algorithm<br />
yields all the points contributing to the contour<br />
of a given peak in sequential order. These contours<br />
are easily stored, and can be conveniently displayed<br />
with graphics standards such as X-Windows<br />
(20), GL (21) or PEX (22).<br />
As a consequence of this graphic advantage, it<br />
is possible to overlay the results of several different<br />
experiments on the screen or display device. Of particular<br />
interest is the option for a visual or graphical<br />
comparison of the spectra resulting from different<br />
types of experiments (i.e., pulse sequences).<br />
Such spectra will, in general, have been acquired<br />
using different spectrometer frequencies, carrier offsets,<br />
and sweep widths. Prior to a direct overlay,<br />
the various spectra must therefore be scaled individually;<br />
this option has been implemented in our<br />
program.<br />
As an example a comparison of TOCSY and<br />
NOESY type experiments is shown in Figure 4.<br />
With the present algorithm, an exact calculation<br />
of the peak volume (integral) is straightforward, as<br />
all points inside the contour are clearly identified.<br />
At the same time, the center of mass coordinates of<br />
the peak may be obtained. By comparison, several<br />
programs in current use (23 - 26) calculate the integral<br />
over the smallest rectangle surrounding the<br />
peak; the coordinates of the peak, set equal to the<br />
center of the rectangle, consequently do not precisely<br />
correspond to the center of mass. The accuracy<br />
gained with the present algorithm is a promising<br />
starting point for automated data evaluation.<br />
The amount of data is considerably reduced to a list<br />
of coordinates and integrals of the peaks. Again,<br />
complementary information from various types of<br />
experiments may be used as an input. This possibility<br />
is being explored in ongoing work in our laboratories.<br />
IV. Environment for the reduction<br />
and representation of<br />
data from 2D and 3D NMR<br />
experiments - the 'NDEE 9<br />
program package<br />
The contour plot algorithm described is part<br />
of a program system that manages all operations<br />
which need to be performed during the reduction<br />
of a two- or three-dimensional NMR spectrum, i.e.<br />
baseline subtraction, fast Fourier transformation,<br />
2D or 3D phase correction, and graphical display.<br />
These operations have been implemented in a program<br />
package termed 'NDEE.' The code was developed<br />
to meet the requirements of NMR research<br />
groups, i.e. processing of 2D and 3D data files, fast<br />
performance, portability, and ease of handling via<br />
a self-explanatory user interface. Particular attention<br />
was paid to the problems and needs met in the<br />
structural determination of biopolymers.
Vol. 16, No. 1/2<br />
;:
48 Bulletin of Magnetic Resonance<br />
Figure 5: A 3D data cube from a 15 N-HMQC<br />
TOCSY experiment performed on EIAV-Tat (30).<br />
nient interface to standard molecular dynamics programs<br />
has been realized. The on-screen edited NOE<br />
and J constraints are converted, by a single menuprompted<br />
switch, into a formatted file for use with<br />
codes such as XPLOR (27) or GROMOS (28).<br />
The contour plot algorithm implemented in the<br />
NDEE program package is a promising platform for<br />
tackling the problem of pattern recognition and automated<br />
assignment of protein spectra.<br />
A demo version of the program is available from<br />
the author (F. Herrmann) and via the anonymous<br />
ftp of Bayreuth University (132.180.8.29).<br />
V. References<br />
1 G.W. Vuister, R. Boelens, J.<br />
1987, 73, 328.<br />
2 C. Griesinger, O.W. S0rensen,<br />
J. Magn. Reson. 1987, 73, 574.<br />
3 H. Oschkinat, C. Griesinger,<br />
O.W. S0rensen, R.R. Ernst, A.M.<br />
G.M. Clore, Nature 1988, 332, 374.<br />
4 C. Griesinger, O.W. S0rensen,<br />
J. Magn. Reson. 1989, 84, 14.<br />
5 S.W. Fesik, E.R.P. Zuiderweg, J.<br />
1988, 78, 588.<br />
6 L.E. Kay, D. Marion, A. Bax, J.<br />
1989, 84, 72.<br />
Magn. Reson.<br />
R.R. Ernst,<br />
P.J. Kraulis,<br />
Gronenborn,<br />
R.R. Ernst,<br />
Magn. Reson.<br />
Magn. Reson.<br />
7 M. Ikura, L.E. Kay, A. Bax, Biochemistry 1990,<br />
29 4659.<br />
8 R.E. Hoffman, G.C. Levy, Prog. NMR Spect.<br />
1991, 23, 211.<br />
9 T. Havel, I.D. Kuntz, G.M. Crippen,<br />
Bull. Math. Biol. 1983, 45, 665.<br />
10 W. Braun, N. Go, J. Mol. Biol. 1985, 186,<br />
611 . U T.F. Havel, K. Wuthrich, Bull. Math. Biol.<br />
1984, 46, 673 . 12 J.A. McCammon, S.H. Harvey,<br />
Dynamics of proteins and nucleic acids Cambridge<br />
University Press, New York 1987.<br />
13 M. Karplus, G.A. Petsko, Nature 1990, 347,<br />
631 . 14 W.F. van Gunsteren, A.E. Mark, Eur. J.<br />
Biochem. 1992, 204, 947.<br />
15 B.U. Meier, Z.L, Madi, R.R. Ernst,<br />
J. Magn. Reson. 1987, 74, 565 . 16 H. Grahn, F. Delaglio,<br />
M.A. Delsuc, G.C. Levy, J. Magn. Reson.<br />
1988, 77, 294 . 17 L. Emsley, G. Bodenhausen, J.<br />
Am. Chem. Soc. 1991, 113, 3309.<br />
18 D.S. Garret, R. Powers, A.M. Gronenborn,<br />
G.M. Clore, J. Magn. Reson. 1991, 95, 214.<br />
19 M. Kjaer, F.M. Poulsen, J. Magn. Reson.<br />
1991, 94, 659 . 20 The X Window System Series,<br />
Vol. 1-7, O'Reilly & Associates, Inc., Sebastopol,<br />
1988.<br />
21 Graphics Library, Silicon Graphics, Inc.; Cali-<br />
fornia.<br />
22 PHIGS Extension to X, Evans k Sutherland<br />
Workstations Reference Manual.<br />
23 NMRZ, Tripos Inc.<br />
24 FELIX, Biosym Technologies Inc.<br />
25 UXNMR and AURELIA, Bruker Analytische<br />
Mefitechnik, Karlsruhe.<br />
26 EASY, J. Biomol. NMR 1991, 1, 111.<br />
27 A.T. Briinger, Methods and Applications in<br />
Crystallographic Computing (N. Isaacs, ed.) Oxford<br />
Press, Oxford, Great Britain, 1987, 613.<br />
28 W.F. Van Gunsteren, R. Kaptein,<br />
E.R.P. Zuiderweg, Nucleic acid conformation and<br />
dynamics (W.K. Olson, ed.) pp. 79-92, Report of<br />
NATO/CECAM Workshop, Orsay, France, 1983.<br />
29 U. Marx, S. Austermann, W.-G. Forssmann,<br />
F. Herrmann, P. Rosch, to be published.<br />
30 D. Willbold, P. Bayer, Rosin-Ardesfeld,<br />
A. Gazit, A. Yaniv, F. Herrmann, P. Rosch, to be<br />
published.
Vol. 16, No. 1/2 49<br />
Contents<br />
I. Introduction<br />
Selective Rotations Using Non-Selective<br />
Pulses and Heteronuclear Couplings<br />
Ole Winneche S0rensen<br />
Novo Nordisk, 2880 Bagsvterd, Denmark<br />
II. Heteronuclear Bilinear ir/2 and -K Rotations in Spin Systems with a Single<br />
III. Selective Rotations where None are Possible<br />
IV. Discussion and Conclusions<br />
V. References<br />
I. Introduction<br />
The pulse sequence kit for construction of multidimensional<br />
NMR pulse sequences contains many<br />
elements for effecting selective or seemingly selective<br />
rotations. They are employed for suppression of entire<br />
cross or diagonal peak multiplets or for blocking<br />
certain coherence transfers with the purpose of obtaining<br />
simplified multiplet patterns.<br />
This paper will describe some known and some<br />
novel pulse sequence elements within multidimensional<br />
liquid state NMR. In general, the optimum<br />
choice of element depends on several conditions related<br />
to the exact application as for example (i)<br />
whether the element shall be part of a preparation or<br />
a mixing sequence, (ii) whether relevant spins are active<br />
or passive or both, (iii) whether there are orders<br />
of magnitude differences between the sizes of pertinent<br />
J coupling constants that can be exploited, and<br />
(iv) whether the selectivity must be obtained in a<br />
single step or a linear combination of experiments is<br />
acceptable.<br />
II. Heteronuclear Bilinear TT/2<br />
and TT Rotations in Spin Systems<br />
with a Single 1 Ji$<br />
In this section we consider selective rotations<br />
in the presence of only one large one-bond coupling,<br />
1 Jls, per molecule. That would apply for S = 13 C or<br />
15 N at the natural abundance level but also for S =<br />
15 N in fully 13 C, 15 N-labeled proteins since 1 JCH can<br />
be suppressed. A thesis written in a local dialect (1)<br />
suggested the following two sequences for broadband<br />
selective excitation of S satellites in I = 1 H spectra:<br />
A:m -^-<br />
— — T —<br />
- r -<br />
with r = (2Jis) 1 - In addition, sequence B with<br />
r = (2Jcc)^ X an d exclusively 13 C pulses throughout<br />
was proposed as a "poor mans" INADEQUATE<br />
for observation of 13 C satellites in 13 C spectra (1).<br />
Nowadays sequence B is known as TANGO (2) and<br />
sequence A has been referred to as a purging sandwich<br />
in 13 C editing experiments (3,4).<br />
The rationale behind sequence A is to apply the<br />
equivalent of y and —y rotations to the satellites corresponding<br />
to spin S in a and (3 spin state, respectively.<br />
This is illustrated in Figure la, which shows<br />
that the parent signal is not excited at all since it<br />
occurs at the zero crossing of positive and negative<br />
rotations. That, of course, also follows from the<br />
propagator behind the sequence:<br />
371-<br />
49<br />
49<br />
51<br />
53<br />
53
50 Bulletin of Magnetic Resonance<br />
(a) (b)<br />
Figure 1: Graphical illustration of the basic ideas behind the excitation profiles for discrimination between<br />
IS and isolated I spin systems. 6 is the rotation angle and the zero on the abscissa represents the refocused<br />
chemical shifts: (a) sequence A; (b) sequence B. Note that these diagrams only illustrate the ideas and that<br />
in practice J-dependent phases and amplitudes occur using sequence B and its derived sequences.<br />
-i02IySz<br />
_ e = eif I -if Ix<br />
(1)<br />
where insertion of two ir pulses results in sequence<br />
A. The idea of formulating the aim of a pulse sequence<br />
in terms of selective rotations and then expanding<br />
the propagator to end up with a sequence<br />
employing only non-selective pulses has been used<br />
in refs. (5,6) and exploited extensively in ref. (7).<br />
For the rare occasions where the antiphase character<br />
of the signals resulting from sequence A is not<br />
acceptable the sequence can be extended with the<br />
spin echo<br />
and possibly terminated by a 7r/2 purging pulse (8)<br />
on the S channel. The same effect can be obtained<br />
with less pulses using sequence B.<br />
That sequence corresponds to the profile in Figure<br />
lb. However, an expansion procedure equivalent<br />
to eqn. 1 is not immediately possible because<br />
the propagator for the selective rotations is equal to<br />
the propagator for a non-selective excitation:<br />
6 — 6 { £ J<br />
Hence a simple "expansion" like eqn. 2 does not<br />
have a built-in guarantee for zero excitation of the<br />
parent signals as did sequence A. It is necessary to<br />
add another idea that exploits an interaction present<br />
only in the IS spin system and not in the isolated I<br />
spin system. Obviously this interaction can only be<br />
the Jis coupling:<br />
(3)<br />
where \J/ is a parameter explained below. In analogy<br />
to sequence A the parent signal is at the zero<br />
crossing for the z rotation.<br />
A (\P + TX)X pulse followed by a ixz rotation is<br />
equivalent to a — (^ + TT)X pulse. Thus for an overall<br />
(TT/2)X rotation ^f must be set according to<br />
0 = -<br />
J7T<br />
= — (4a)<br />
4t<br />
Sequence B in fact corresponds to a (n/2)-x rotation:<br />
6 = -(* + TT) + (TT -*) = _- =>* = - (46)<br />
The it refocusing pulse is pulled out of (\? + ir)x to<br />
yield<br />
B' : - r -<br />
So far we have implied TT/2 rotations but the general<br />
sequence B' also allows an easy derivation of a<br />
IT rotation according to a modified version of eqn. 4:
Vol. 16, No. 1/2 51<br />
= - 2 * = 7T<br />
That leads to the sequence<br />
C: ~\ - T -<br />
7T<br />
= ± 2<br />
which is commonly referred to as BIRD (9). Note<br />
that the only difference between sequences A and C<br />
is the interpulse delay resulting in TT/2 and n rotations,<br />
respectively.<br />
The opposite situation of rotating isolated I spin<br />
systems while not affecting or doing something different<br />
to IS systems also occurs. Sequences for that<br />
purpose can easily be derived from those above.<br />
Sequence A corresponds to a 2TT rotation for isolated<br />
I spins so, for example, a (ir/2)y pulse can be<br />
appended for excitation. That turns the antiphase<br />
IS magnetization to the z axis; this antiphase character<br />
of the IS z magnetization is normally of no<br />
concern.<br />
The resulting sequence may be simplified according<br />
to<br />
e 2 x e 2 ye 2 = e~ "2 y<br />
(5)<br />
(6)<br />
where the z rotation was added for simplification<br />
purposes. Combined with sequence A we obtain:<br />
W * ~ 2 - Ujv<br />
A 7r rotation of the isolated I spin is obtained by<br />
adding a (7r)_x I pulse to sequence A:<br />
E:m -1-<br />
This sequence results in transverse antiphase IS<br />
magnetization (as does sequence A) which might or<br />
might not represent a problem depending on the application.<br />
The IS spin systems can be left invariant if the<br />
opposite sequences are based on sequence B and C<br />
instead of sequence A. Then TT/2 and ir rotations are<br />
and<br />
respectively. Another sequence related to F acts as<br />
a (n) 1 pulse in IS systems:<br />
F': - ~r-<br />
Sequence G is used as part of the preparation<br />
sequence in multidimensional NMR experiments<br />
where a subsequent delay ensures that the magnetization<br />
of non-hetero-labeled molecules largely vanishes<br />
at the starting point of the actual experiment<br />
(10). It has also been used as a refocusing pulse in<br />
evolution periods (11, 12).<br />
For selective excitation of isolated I spin systems<br />
as part of a preparation period sequence D offers<br />
itself. However, a better approach is based on lowpass<br />
J filtering (13) because the spins of interest<br />
experience less pulses. Simple first order low-pass J<br />
filters are<br />
V2') S<br />
2/ ±x<br />
G' : - - A - (n) b<br />
where the two experiments indicated for G are coadded<br />
while G' requires coaddition of two experiments<br />
with A = r = (2Jis)~ x and A = 0, respectively.<br />
Alternatively, pulsed field gradients can be<br />
combined with sequence G in order to effect the filter<br />
in a single step.<br />
In connection with mixing processes in multidimensional<br />
experiments the most useful sequence is<br />
A. It can, for example, be employed for coherence<br />
transfer from 15 N to the directly bonded protons<br />
while leaving the a protons unperturbed (14), a<br />
crucial feature in experiments for measurement of J<br />
coupling constants via E.COSY type multiplet patterns<br />
(15-17).<br />
We return to the sequences of this section in Section<br />
III covering small-angle bilinear rotations.<br />
III. Selective Rotations where<br />
None are Possible<br />
This self-contradictory title covers the situations<br />
where no J couplings can be exploited to different i-
52 Bulletin of Magnetic Resonance<br />
ate between spins that consequently all experience<br />
the same perturbation. Nevertheless it is still possible<br />
to obtain an apparent selectivity by employing a<br />
small-angle rotation or by suppressing the spectral<br />
traces of lack of selectivity. These tricks are only<br />
of interest in connection with mixing processes and<br />
are completely irrelevant for preparation sequences.<br />
The concept of small-angle rotations is intimately<br />
connected with the notion of active and passive<br />
spins. For given coherences, active spins are<br />
those that are transverse before or after (including<br />
before and after) the mixing process whereas passive<br />
spins are longitudinal in both periods surrounding<br />
the pertinent mixing sequence.<br />
As far as active spins are concerned, variation in<br />
the rotation angle fundamentally causes an amplitude<br />
modulation. On the other hand, passive spins<br />
either stay in the spin state they are in or get inverted<br />
which is expressed by the intensity distribution<br />
within multidimensional multiplets. Small<br />
rotation angles leave passive spins largely unperturbed<br />
(18,19) thus emphasizing the multiplet components<br />
corresponding to preserved spin states of<br />
passive spins. However, perfect preservation of spin<br />
states only occurs in the limit of a vanishing perturbation<br />
where also the amplitude factor from the<br />
active spins vanishes except for the trivial case of<br />
diagonal peaks.<br />
The E.COSY and TR (20) techniques are the<br />
outcome of the challenge to obtain multiplets corresponding<br />
to 100% preservation of passive spin states<br />
while maintaining significant amplitude factors for<br />
the active ones. However, in particular in connection<br />
with heteronuclear NMR satisfactory performance<br />
is obtained by just applying a small-angle<br />
pulse.<br />
Small-angle bilinear rotations have been employed<br />
in homonuclear proton NMR (21,22) but so<br />
far only one application (23) of small-angle heteronuclear<br />
bilinear rotations based on sequences of<br />
the type described in the preceding section has appeared.<br />
They are relevant in connection with molecules<br />
containing more than one heteronuclear spin<br />
isotope of the same type, like for example 13 Clabeled<br />
proteins.<br />
A small-angle version of sequence A is<br />
where the small angle comes from a short delay rg.<br />
Sequence A^ does not have an opposite equivalent<br />
because the major part of IS spin systems behave<br />
as isolated I spin systems for short TQ delays.<br />
In contrast, both versions are possible by modifications<br />
of sequence B because here the interpulse<br />
delay must be constant and the small angles j3 are<br />
obtained by adjustment of pulse angles.<br />
Analytical derivations are possible based on the<br />
equivalents of eqns. 3 and 4:<br />
That results in the sequence<br />
- (7)<br />
which effects a j3 pulse in the IS spin systems while<br />
leaving the isolated I spins invariant. Another sequence<br />
that rotates by (TT — j3) in IS spin systems<br />
but inverts isolated I spins follows immediately from<br />
sequence H:<br />
P P<br />
The opposite sequences where the isolated I spins<br />
experience a (3 pulse can in analogy to eqn. 3 and<br />
sequence B' be written on the general form<br />
Because the flip angle for the isolated I spins is invariant<br />
to ^ the flip angle in the IS spin systems<br />
can be selected independently in analogy to eqn. 4:<br />
= /?-2* (8)<br />
For 6 = 0 and TT, respectively, we obtain the sequences<br />
and<br />
- 7T
Vol. 16, No. 1/2 53<br />
All sequences with a total interpulse delay 2r =<br />
(Jis)" 1 described so far in the paper are special<br />
cases of sequence I and could have been derived from<br />
that one using eqn. 8. It should also be mentioned<br />
that phase shifts have been ignored because they<br />
normally are immaterial; for example sequence J is<br />
not an invariant operation in IS spin systems but<br />
rather a (TT)Z rotation. Finally, we suggest that the<br />
small angle or /?-TANGO sequences be referred to<br />
as BANGO.<br />
IV. Discussion and Conclusions<br />
The paper has described pulse sequences for selective<br />
rotations where dominant one-bond heteronuclear<br />
coupling constants are responsible for the selectivity.<br />
It has been shown how such sequences<br />
are derived; originally the simple vector model with<br />
rotations of vectors in three-dimensional space was<br />
employed and this level of sophistication is still completely<br />
adequate for all sequences above.<br />
A novel general class of pulse sequences were introduced:<br />
f} 1 and /3 IS are the desired flip angles for isolated I<br />
spin systems and IS spin systems, respectively, and<br />
r is (2JIS)- 1 .<br />
Selective pulse sequences of the type described in<br />
this paper have been used mainly as part of preparation<br />
periods in multidimensional experiments but<br />
it seems that their potential in mixing sequences has<br />
not been fully exploited in particular in connection<br />
with experiments generating E.COSY type multiplet<br />
patterns.<br />
V. References<br />
X<br />
O. W. S0rensen, Thesis, University of Aarhus,<br />
1981.<br />
2<br />
S. Wimperis and R. Freeman, J. Magn. Reson.<br />
58, 348 (1984).<br />
3<br />
O. W. S0rensen, S. D0nstrup, H. Bilds0e, and<br />
H. J. Jakobsen, J. Magn. Reson. 55, 347 (1983).<br />
4<br />
U. B. S0rensen, H. Bilds0e, H. J. Jakobsen, and<br />
O. W. S0rensen, J. Magn. Reson. 65, 222 (1985).<br />
5 H. Hatanaka and C. S. Yannoni, J. Magn. Re-<br />
son. 42, 330 (1981).<br />
6 O. W. S0rensen, G. W. Eich, M. H. Levitt, G.<br />
Bodenhausen, and R. R. Ernst, Prog. NMR Spectrosc.<br />
16, 163 (1983).<br />
7 O. W. S0rensen, Prog. NMR Spectrosc. 21, 503<br />
(1989).<br />
8 O. W. S0rensen and R. R. Ernst, J. Magn. Re-<br />
son. 51, 477 (1983).<br />
9 J. R. Garbow, D. P. Weitekamp, and A. Pines,<br />
Chem. Phys. Lett. 93, 504 (1982).<br />
10 A. Bax and S. Subramanian, J. Magn. Reson.<br />
67, 565 (1986).<br />
U A. Bax, J. Magn. Reson. 53, 517 (1983).<br />
12 V. Rutar, J. Magn. Reson. 56, 87 (1984).<br />
13 H. Kogler, O. W. S0rensen, G. Bodenhausen,<br />
and R. R. Ernst, J. Magn. Reson. 55, 157 (1983).<br />
14 O. W. S0rensen, J. Magn. Reson. 90, 433<br />
(1990).<br />
15 C. Griesinger, O. W. S0rensen, and R. R.<br />
Ernst, J. Am. Chem. Soc. 107, 6394 (1985).<br />
16 C. Griesinger, O. W. S0rensen, and R. R.<br />
Ernst, J. Chem. Phys. 85, 6837 (1986).<br />
17 C. Griesinger, O. W. S0rensen, and R. R.<br />
Ernst, J. Magn. Reson. 75, 474 (1987).<br />
18 W. P. Aue, E. Bartholdi, and R. R. Ernst, J.<br />
Chem. Phys. 64, 2229 (1976).<br />
19 A. Bax and R. Freeman, J. Magn. Reson. 44,<br />
542 (1981).<br />
20 C. Griesinger, O. W. S0rensen, and R. R.<br />
Ernst, J. Am. Chem. Soc. 107, 7778 (1985).<br />
21 M. H. Levitt, C. Radloff, and R. R. Ernst,<br />
Chem. Phys. Lett. 114, 435 (1985).<br />
22 T. Schulte-Herbruggen, Z. L. Madi, O. W.<br />
S0rensen, and R. R. Ernst, Mol. Phys. 72, 847<br />
(1991).<br />
23 H. B. Olsen, S. Ludvigsen, and O. W. S0rensen,<br />
J. Magn. Reson. 104, 226 (1993).
54 Bulletin of Magnetic Resonance<br />
Contents<br />
I. Introduction<br />
II. Theory<br />
Sensitivity Improvement in Multi-Dimensional<br />
NMR Spectroscopy<br />
Mark Ranee<br />
Department of Molecular Biology<br />
The Scripps Research Institute<br />
10666 North Torrey Pines Road<br />
La Jolla, California 92037 U.S.A.<br />
III. Applications 60<br />
1. TOCSY Experiments 61<br />
2. 3D TOCSY-HMQC Experiment 61<br />
3. 3D NOESY-HMQC Experiment 61<br />
4. Heteronuclear Relaxation Experiments ...... 62<br />
5. Additional Applications 64<br />
IV. Conclusion<br />
V. Acknowledgments<br />
VI. References<br />
I. Introduction<br />
A critical concern in many applications of nuclear<br />
magnetic resonance spectroscopy is the sensitivity<br />
of the measurements, as determined by the<br />
achievable signal-to-noise ratio for a given experiment<br />
duration. The sensitivity of a NMR measurement<br />
is affected by many factors (1-3), and numerous<br />
schemes have been described over the years for<br />
improving the sensitivity. These schemes can generally<br />
be categorized into one or more of three broad<br />
areas: (i) modification of experimental techniques<br />
(i.e. spin physics); (ii) advancements in spectrometer<br />
hardware; and (iii) utilization of new data processing<br />
procedures. The present paper describes a<br />
novel methodology, falling under category (i), for<br />
providing a factor of up to y/2 improvement in sensitivity<br />
for a variety of multi-dimensional NMR experiments.<br />
The principle upon which this new method-<br />
54<br />
54<br />
65<br />
66<br />
ology is based will be reviewed below, followed by a<br />
brief description of a few practical applications.<br />
II. Theory<br />
In order to explain the basis of the sensitivity improvement<br />
scheme for multi-dimensional NMR spectroscopy,<br />
it would perhaps be useful first to mention<br />
a somewhat analogous method which involves<br />
a hardware modification rather than a direct manipulation<br />
of the spin system, and is applicable in<br />
any NMR experiment. Some time ago Hoult and coworkers<br />
(4) pointed out that, at least in principle,<br />
a y/2 improvement in sensitivity can be achieved in<br />
NMR measurements by using two orthogonal detection<br />
coils rather than the single coil normally<br />
employed. If the two rf coils are orthogonally positioned<br />
but otherwise identical, the NMR signals<br />
66
Vol. 16, No. 1/2 55<br />
+2<br />
-2<br />
\\\\\\\\\\\\\\\\\\\\\\\v\>\\\\v<<br />
'ss/rsssssssss/s/ss/sssss/sssssss/j<br />
Ix<br />
Y:<br />
Sx<br />
Iz<br />
\<br />
Sz<br />
Ix,<br />
Figure 1: Pulse sequence, a diagram of the coherence<br />
transfer pathway, and the relevant density operator<br />
terms for a sensitivity-enhanced 2D TOCSY<br />
experiment (34). The pulse sequence itself is identical<br />
to the z-filtered TOCSY experiment in common<br />
use (8,9); the sensitivity enhancement is achieved by<br />
separating the conventional phase-cycling into two<br />
halves and recording the data separately.<br />
detected in each will be identical except for a relative<br />
phase shift of 90°; thus, after correcting for<br />
the relative phase shift, the two NMR signals can<br />
be combined to double the size of the detected signal.<br />
On the other hand, the thermal noise generated<br />
in the two receiver circuits (probe coils plus<br />
preamplifiers) will be statistically independent, and<br />
thus when combined will increase the rms noise voltage<br />
by only a factor of \/2- The net result of this<br />
scheme therefore is a \[2 improvement in the overall<br />
sensitivity of the NMR experiment. Unfortunately,<br />
this concept has been difficult to implement due to<br />
practical problems in designing an efficient, crossedcoil<br />
probe. The sensitivity improvement scheme described<br />
below is essentially an analogue of crosscoil<br />
detection for evolution periods (5) in multidimensional<br />
NMR experiments.<br />
To explain the basic principle underlying the sensitivity<br />
enhancement scheme, the response of an isolated<br />
spin-1/2 nucleus to the pulse sequence shown<br />
in Figure 1 will be described; application of this<br />
pulse sequence to a coupled spin system produces<br />
a 2D TOCSY spectrum (6-9), but for present purposes<br />
it can be viewed as simply producing a 2D<br />
chemical shift-resolved spectrum of the uncoupled<br />
spin-1/2 nuclei. All relaxation effects are ignored.<br />
Starting from the equilibrium magnetization of the<br />
spin-1/2, the first 90° pulse creates transverse magnetization<br />
which then evolves under the influence of<br />
the chemical shift/resonance offset, O, to:<br />
a{t\) = Ix sin — Iy (1)<br />
where for convenience the single spin angular momentum<br />
operators are used to indicate the relevant<br />
state of the spin system, and constants of proportionality<br />
have been omitted. The 90°^ pulse at the<br />
beginning of the mixing period produces the following:<br />
56 Bulletin of Magnetic Resonance<br />
Ix[(fx(Tm) cos Qt2 + fz(Tm) sin Qt2) sin Qti<br />
+a(gx(T~m) cos Qt2 + gz( T m) sin Qt2) cos Qt<br />
+Iy[(fx(Tm) sinttt2 - fz(Tm) cosQt2) sin fl<br />
+a.(gx(Tm)s'mQt2 - gz(rm) cos9,t2) cosfii (5)<br />
Inspection of eqn. 5 indicates that for some arbitrary<br />
mixing sequence, a 2D Fourier transformation of the<br />
time-domain NMR signal will result in complicated<br />
lineshapes in the 2D spectrum.<br />
To proceed, assume that instead of some arbitrary<br />
mixing sequence being applied, a so-called<br />
'isotropic' sequence is employed (6). One of the<br />
properties of an isotropic mixing sequence is that<br />
the total spin angular momentum Ia (a= x,y or z)<br />
is conserved (10). Thus, eqn. 5 simplifies to:<br />
0a(*l> T m,*2) =<br />
Ix[fx{Tm) sin fiii cos 9,t2 + agz(Tm) cos Qti sin Q,t2]<br />
+Iy[fx(Tm) sin Clti sin Q,t2 — agz(Tm) cos Vtt\ cos Ut2]<br />
2D Fourier transformation of the NMR signal represented<br />
by eqn. 6 will still produce spectral peaks<br />
with a highly undesirable phase-twist (11,12). This<br />
phase twist can be removed, however, if either an additive<br />
or subtractive combination is made of the two<br />
data sets collected separately for
Vol. 16, No. 1/2 57<br />
detected dimension does not affect the conclusion<br />
regarding signal intensity. To determine whether<br />
or not a sensitivity improvement is realized by the<br />
modified experimental procedures it is necessary to<br />
consider the behaviour of the spectral noise when<br />
making the combination indicated by eqn. 10; it<br />
will be shown below that the random noise in a +<br />
is uncorrelated to that in CT~, and thus the combination<br />
which doubles the NMR signal intensity only<br />
increases the noise by a factor of \/2, resulting therefore<br />
in a \/2 improvement in sensitivity.<br />
As illustrated by the trivial example described<br />
above, the general procedure and requisite conditions<br />
for implementing the sensitivity enhanced<br />
scheme in a 2D NMR experiment can be stated as<br />
follows. The pulse sequence must be designed to<br />
retain the signals originating from both of the orthogonal<br />
magnetization components, or higher order<br />
spin operator terms, generated during the evolution<br />
period by the chemical shift interaction; in conventional<br />
experiments one of these two components is<br />
eliminated either as an inherent feature of the pulse<br />
sequence or by specific design to purge the 2D spectrum<br />
of undesirable features (12,13). The sensitivity<br />
enhancement scheme is applicable only to experiments<br />
in which the mixing sequence causes the relevant,<br />
orthogonal spin operator terms generated during<br />
the evolution period to have sufficiently similar<br />
transfer functions to observable magnetization components<br />
during the detection period; in the example<br />
above this would require that /x(rm) & gz(Tm) so<br />
that the data in eqn. 11 would combine constructively<br />
to enhance the signal strength. Some experiments<br />
are easily adapted to incorporate the sensitivity<br />
improvement scheme, such as the z-filtered<br />
TOCSY sequence discussed above, while other experiments<br />
can be modified to fulfill the necessary<br />
conditions. Some pulse techniques, however, have<br />
segments which inherently require a unique coherence<br />
transfer pathway (20,21), such as 2D labframe<br />
(22) or rotating-frame (23) NOE experiments<br />
(NOESY or ROESY, respectively), and thus the<br />
sensitivity enhancement scheme is inapplicable for<br />
the evolution periods preceding the 'bottleneck'.<br />
Since the sensitivity enhancement scheme relies<br />
on the ability to retain and combine essentially<br />
equivalent information from two orthogonal, coherence<br />
transfer pathways in a suitable NMR experiment,<br />
it will for convenience be referred to below<br />
as PEP (Preservation of Equivalent Pathways) technology.<br />
Also for convenience much of the discussion<br />
will refer to 2D experiments, but it should be realized<br />
that the PEP methodology is applicable in<br />
experiments of higher dimensionality as well (vide<br />
infra).<br />
To implement the sensitivity enhancement<br />
scheme for a suitable NMR experiment, it is first<br />
necessary to ensure that the propagator for the relevant<br />
portion of the pulse sequence, i.e. the portion<br />
between the relevant evolution period and the detection<br />
period, transforms the appropriate, orthogonal<br />
spin operator terms present at the end of the<br />
evolution period to observable magnetization terms<br />
with approximately equal efficiency (but not necessarily<br />
along exactly equivalent coherence transfer<br />
pathways). To accomplish this it may be necessary<br />
to re-design part of the pulse sequence; in a 2D experiment<br />
this part consists of just the mixing period,<br />
while in experiments of higher dimensionality it is<br />
necessary to consider all the intervening mixing and<br />
evolution periods. In addition, the PEP scheme requires<br />
the elimination of the phase-cycling normally<br />
employed to select one of the two relevant, orthogonal<br />
spin operator terms at the end of the appropriate<br />
evolution period; instead, two experiments are<br />
run in which the appropriate selection pulse (e.g.<br />
the second 90° pulse in the example above) is inverted<br />
in phase between the two experiments and<br />
the data sets are accumulated separately. After the<br />
acquisition is completed, additive and subtractive<br />
combinations of the two raw data sets are made to<br />
generate the sine and cosine, amplitude-modulated<br />
data sets, as in eqns. 8. These two new data sets<br />
can be treated in either of two ways. First, the two<br />
data sets can be independently processed to produce<br />
separate 2D (or higher dimensional) spectra; as indicated<br />
above, there will be a relative phase shift<br />
of 90° in both frequency dimensions (detection dimension<br />
and relevant, indirect dimension), and it is<br />
therefore necessary to correct for this relative phase<br />
shift. The two spectra can then be added together<br />
to enhance the signal intensity. While this first procedure<br />
for handling the data provides the ability for<br />
spectral editing in some heteronuclear experiments<br />
(vide infra), it is often more convenient to do all of<br />
the required data manipulation on the time domain<br />
data. The 90° phase shift in the detection dimension<br />
of either the additive or subtractive data set is
58 Bulletin of Magnetic Resonance<br />
trivially accomplished by simply interchanging the<br />
real and imaginary parts of the complex free induction<br />
decays. If the data has been collected using<br />
the so-called 'hypercomplex' (12-15) method for sign<br />
discrimination in the relevant, indirectly detected<br />
frequency dimension, then the necessary 90° phase<br />
shift in this dimension is trivially accomplished by<br />
swapping the two free induction decays collected for<br />
each time increment (i.e. t\ point in a 2D experiment)<br />
as part of the 'hypercomplex' procedure; this<br />
swap is usually done on the same data set, either<br />
additive or subtractive, as was subjected to the 90°<br />
phase shift in the detection dimension. The doubly<br />
phase-shifted time domain data set is then combined<br />
with the second, unshifted data set (whether added<br />
to or subtracted from is best determined by trial and<br />
error) to produce a single, signal enhanced data set<br />
which is then processed to a 2D spectrum as desired.<br />
As implied in the above discussion, performing the<br />
phase shifts in the time domain requires that the x<br />
and y components of the free induction decays be<br />
digitized at simultaneous time points and that the<br />
hypercomplex method, not TPPI, be used for sign<br />
discrimination in the relevant, indirect dimension.<br />
To summarize in brief form, the PEP data handling<br />
procedure is as follows, assuming hypercomplex<br />
data collection:<br />
(la) Collect two separate data sets ux(ti,t2) and<br />
vx{ti, *2) which are identically recorded except<br />
for an inversion of the relevant phase selection<br />
pulse for the PEP scheme.<br />
(lb) Collect a second pair of data sets uy(ti,t2) and<br />
vy(ti,t2) similarly to the first, as part of the<br />
hypercomplex procedure (12-15). (The acquisition<br />
of the four data sets ux, vx, uy and vy is<br />
normally interleaved so that four FIDs are collected<br />
before the parameter t% is incremented).<br />
(2) Make the combinations ax = ux + vx, sx =<br />
ux - vx, ay = uy + vy and sy = uy - vy.<br />
(3) Effect a 90° phase shift in the detection dimension<br />
to create a new data set sx, sy:<br />
real(sx)=imag(s:c), imag(sx)=real(sa;), and<br />
the same for sy (sx and sy were arbitrarily<br />
chosen over ax and ay).<br />
(4) Effect a 90° phase shift in the indirect dimension<br />
to create a new data set sx, sy: sx=sy<br />
and sy=-sx.<br />
(5) Make the combinations cx = ax + sx and<br />
cy = ay + sy (subtractive combination may<br />
be necessary instead, the uncertainty is due<br />
to hardware and pulse sequence details).<br />
(6) Process the data cx(ti,t2), cy(t\,t2) as appropriate<br />
for a hypercomplex data set. If the<br />
TPPI procedure is used for uj\ sign discrimination<br />
or if certain spectral editing capabilities<br />
need to be retained, then it is necessary to<br />
process the two data sets a{ti,t2) and s(ti, £2)<br />
separately and combine them afterward if desired.<br />
In order to determine the sensitivity enhancement<br />
achievable using PEP methodology, it is necessary<br />
to analyze the behaviour of the signal noise<br />
(24) in these experiments. A general analysis of the<br />
noise behaviour can be performed by considering the<br />
consequences of the PEP procedure in the frequency<br />
domain. The additive and subtractive combinations<br />
of the raw, time domain data sets are made as indicated<br />
in step (2) above; no assumption is necessary<br />
regarding how the data is digitized or LO\ frequency<br />
discrimination is achieved. The resulting two data<br />
sets are then processed separately but identically to<br />
produce two, 2D spectra, A{u>i,u>2) and S(OJI,OJ2)<br />
(assume that only the real data has been retained<br />
and that A(UJI,OJ2) is phased as desired). According<br />
to the PEP protocol it is necessary to perform a 90°<br />
phase shift in each of the two frequency dimensions<br />
of one of the spectra before combining the spectra.<br />
As Ernst has pointed out (25,26), a 90° phase shift<br />
is equivalent to performing a Hilbert transformation<br />
of the data, due to the causality principle. Thus, the<br />
combined spectrum C{LUI,OJ2) can be written as:<br />
C(wi,w2) = i4(a;i,a;2)+5(a;i,W2) (12)<br />
Eqn. 12 can be rewritten in expanded terms as:<br />
C(u1,UJ2) = [U(iOi,0J2) +V(ujX,uJ2)}<br />
+ {U{cul,uj2)-V(io1,uJ2)} (13)<br />
where U(u)\,LO2) and V{w\,oj2) are the 2D spectra<br />
produced by identical processing of the original, raw<br />
data sets u[t\, t2) and v{t\, t2). Rearranging eqn. 13<br />
gives<br />
(14)
Vol. 16, No. 1/2 59<br />
Assume that the raw data consists only of random<br />
noise. In order to determine the behaviour of the<br />
spectral noise when combined according to eqn. 14,<br />
it is sufficient to calculate the cross-correlation function<br />
Ruty(ai,a2), where<br />
(15)<br />
and £ represents the mean value of the function in<br />
brackets, averaged over io\ and UJ2, and it is assumed<br />
that the spectral noise is stationary. The 2D Hilbert<br />
transform of U(u>i,uj2) is given by (19):<br />
oo oc<br />
_ l r da r<br />
n 2 J fa - a) J<br />
fa -a) J fa - P)<br />
U(P,*)<br />
dj3 (16)<br />
where for simplicity it is assumed that U(UJI,LJ2) is a<br />
continuous function and that the integration limits<br />
can be extended to infinity. Inserting eqn. 16 into<br />
eqn. 15 gives:<br />
Making the substitutions r\ = (3 —<br />
leads to<br />
and 7 = a — OJ2<br />
Assuming that the order of integrations can be interchanged,<br />
eqn. 18 can be expressed as:<br />
oo oo<br />
1 f C?7 f<br />
^ J (a2-7)/<br />
d7<br />
^dr,<br />
- 7) - V)<br />
dr]<br />
(19)<br />
Eqn. 19 indicates that the cross-correlation function<br />
of U(uiiiU)2) and its 2D Hilbert transform U(UJI,U>2)<br />
is equal to the Hilbert transform of the autocorrelation<br />
function of U(001,0)2); this relationship is well<br />
known for functions of one variable (27,28). It is<br />
trivial to prove that Ruu(^1,^2) is an odd function<br />
in both 2) and its<br />
2D Hilbert transform are uncorrelated, as is well<br />
known for ID Hilbert transform pairs (27,29). Thus,<br />
in making the combination U + 0 in eqn. 17 the<br />
rms noise level increases only by a factor of y/2,<br />
and the same of course is true for V — V. The net<br />
result therefore is that the PEP procedure increases<br />
the spectral rms noise level by a factor of y/2 over<br />
that for a conventional spectrum (corresponding to<br />
either the U + V or U — V combinations in eqn. 13);<br />
if the NMR signal is doubled in a PEP-modified<br />
experiment, then an improvement in sensitivity by<br />
a factor of y/2 will be realized.<br />
Perhaps the earliest example of PEP methodology<br />
was in the work of Bachmann et al. (12)<br />
on phase separation in two-dimensional spectroscopy.<br />
Two techniques were described for obtaining<br />
pure phase, 2D resolved spectra; the first technique<br />
achieved phase separation by reversed precession,<br />
while the second relied on the use of phase selection<br />
pulses between the evolution and detection periods.<br />
The reversed precession technique is really a PEP<br />
scheme, and as mentioned by Bachmann et al., provides<br />
a factor of y/2 sensitivity enhancement over<br />
the phase selection method.<br />
Before proceeding on to describe some recent applications<br />
of PEP methodology, it would perhaps be<br />
useful to point out the existence of somewhat related<br />
experiments. The PEP scheme is based on designing<br />
a pulse sequence so that the two orthogonal<br />
magnetization components present during the evolution<br />
period follow more or less equivalent coherence<br />
transfer pathways to the detection period and therefore<br />
provide essentially identical information. Other<br />
schemes have been proposed in the past which also
60 Bulletin of Magnetic Resonance<br />
H<br />
2<br />
3<br />
=X,-X<br />
= X, X, X, X / -X, -X, -X, -X (collect data separately)<br />
= x, x, -x, -x<br />
Figure 2: Pulse sequence for recording 3D<br />
sensitivity-enhanced TOCSY-HMQC spectra (38).<br />
The isotropic mixing is performed using the DIPSI-<br />
2 pulse sequence (35) or other, suitable sequences.<br />
The thin and thick vertical lines represent 90° and<br />
180° pulses, respectively, applied to the H (proton)<br />
or X (heteronucleus) spins. The delay r is set to<br />
1/(2JHX)- Decoupling of the X spins during acquisition<br />
is accomplished using GARP-1 (54) or other<br />
appropriate composite pulse sequences. Quadrature<br />
detection in the OJ\ and cu2 dimensions can be<br />
achieved via either the TPPI (13,16-18) or hypercomplex<br />
(12-15) methods. After the data is collected<br />
with the basic four step phase cycle (plus any<br />
additional cycling desired), the phase fo is inverted<br />
and the resulting data set is stored separately from<br />
the first.<br />
retain signals originating from the two orthogonal<br />
components in the evolution period; the difference<br />
in these schemes is that the information provided<br />
by the two signals is not the same, and thus cannot<br />
be combined to achieve a sensitivity enhancement<br />
as it is normally denned. However, when the techniques<br />
are applicable they can provide a substantial<br />
increase in the information recorded per unit<br />
measuring time. One example of such techniques<br />
is the COSY-NOESY (30) or COCONOSY (31) experiment,<br />
in which a COSY data set is recorded<br />
during the mixing time of a NOESY experiment.<br />
H<br />
•, x<br />
*! =X,-X<br />
x y<br />
2 = X, X, -X, -X / -X, -X, X, X (collect data<br />
separately)<br />
% = y,y,-y,-y<br />
rec = x, -x, -x, x<br />
Figure 3: Pulse sequence for recording 3D<br />
sensitivity-enhanced NOESY-HMQC spectra (38).<br />
The thin and thick vertical lines represent 90° and<br />
180° pulses, respectively, applied to the H (proton)<br />
or X (heteronucleus) spins. The delay r is set to<br />
1/(2JHX), while rm is the NOE mixing period. Decoupling<br />
of the X spins during acquisition is accomplished<br />
using GARP-1 (54) or other appropriate<br />
composite pulse sequences. Quadrature detection in<br />
the toi and o>2 dimensions can be achieved via either<br />
the TPPI (13,16-18) or hypercomplex (12-15)<br />
methods. After the data is collected with the basic<br />
four step phase cycle (plus any additional cycling<br />
desired), the phase 2 is inverted and the resulting<br />
data set is stored separately from the first.<br />
Another, closely related example is the combined<br />
relayed NOESY-TOCSY experiment (32).<br />
III. Applications<br />
PEP technology can be applied to a wide variety<br />
of experiments (33). Brief descriptions will be given<br />
in the following sections for some representative examples<br />
of sensitivity-enhanced, solution-state NMR<br />
experiments.
Vol. 16, No. 1/2 61<br />
1. TOCSY Experiments<br />
Aside from the trivial case of a 2D chemical<br />
shift-resolved experiment, perhaps the simplest<br />
example of the application of PEP technology is<br />
a sensitivity-enhanced, 2D homonuclear TOCSY<br />
experiment (34). The pulse sequence for the<br />
sensitivity-enhanced TOCSY experiment is shown<br />
in Fig. 1; this sequence is just the z-filtered TOCSY<br />
experiment proposed some time ago (8,9), but with<br />
modified phase-cycling and data acquisition. Instead<br />
of phase-cycling the second 90° pulse to select<br />
for the z magnetization during the isotropic mixing<br />
period, both the z and x magnetization components<br />
are retained by performing two experiments with<br />
the phase-cycle of fa inverted between them and the<br />
data collected separately. The two data sets are then<br />
processed according to the PEP procedure, as described<br />
above. The key to achieving sensitivity enhancement<br />
in the TOCSY experiment is to employ a<br />
mixing sequence which promotes coherence transfer<br />
with equal efficiency for the z and x magnetization<br />
components present at the beginning of the mixing<br />
period. A so-called 'isotropic' mixing sequence,<br />
such as the DIPSI-2 sequence described by Shaka et<br />
al. (35), is ideal for use in the sensitivity-enhanced<br />
TOCSY experiment; the defining characteristic of<br />
an isotropic mixing sequence is that it creates an effective<br />
Hamiltonian consisting only of the isotropic<br />
scalar coupling terms. Under such a Hamiltonian<br />
each of the orthogonal magnetization components<br />
is conserved (neglecting relaxation), since they commute<br />
with the effective Hamiltonian; thus, there is<br />
no mixing of the terms arising from the z and x<br />
magnetization present at the beginning of the mixing<br />
period. As indicated schematically in Fig. 1,<br />
z magnetization starting on one spin can be transferred<br />
to z magnetization of another spin belonging<br />
to the same coupling network, and likewise for x<br />
magnetization. In a conventional TOCSY experiment<br />
(6-9), one of these two components is intentionally<br />
destroyed in order to purge the 2D spectra<br />
of undesirable phase characteristics. With the PEP<br />
procedure, however, it has been demonstrated (34)<br />
that pure phase TOCSY spectra can be recorded<br />
with an improvement in sensitivity by a factor of<br />
2. 3D TOCSY-HMQC Experiment<br />
The PEP sensitivity enhancement scheme can be<br />
applied in principle to a NMR experiment of any dimensionality.<br />
For example, by concatenating the 2D<br />
sensitivity-enhanced TOCSY pulse sequence with a<br />
conventional heteronuclear HMQC sequence (36,37)<br />
it is possible to create a 3D, sensitivity-enhanced<br />
TOCSY-HMQC experiment (38); this pulse sequence<br />
is shown in Fig. 2. An analysis of this relatively<br />
simple experiment shows that the two, orthogonal<br />
magnetization components created by evolution<br />
under the chemical shift interaction during the<br />
t\ period undergo essentially identical transformations<br />
during the rest of the pulse sequence, and lead<br />
to observable signals containing equivalent information.<br />
According to the PEP prescription, two data<br />
sets are collected for each increment of t\, with fa<br />
being inverted between the two experiments. Data<br />
reduction is most conveniently accomplished in the<br />
time domain as the data is being accumulated.<br />
3. 3D NOESY-HMQC Experiment<br />
The 2D TOCSY experiment shown in Fig. 1<br />
and the 3D TOCSY-HMQC experiment presented<br />
in Fig. 2 are examples of PEP applications in which<br />
no change in the actual pulse sequences of the corresponding,<br />
conventional experiments are required; in<br />
these cases the only changes necessary in the experimental<br />
protocol are to the phase-cycling and to the<br />
data collection procedure. This simplicity is largely<br />
due to the inherent characteristic of an isotropic<br />
mixing sequence to act on orthogonal magnetization<br />
components with equal efficiency and identical<br />
effect; in the TOCSY experiments the two equivalent<br />
coherence transfer pathways required for the<br />
PEP scheme come as a natural part of the conventional<br />
pulse sequence. However, most other multidimensional<br />
NMR experiments have one or more<br />
segments which normally treat differently the orthogonal<br />
components present at the end of a given<br />
evolution period. For example, in a 2D NOESY experiment<br />
only one of the orthogonal magnetization<br />
components present at the end of the evolution period<br />
can be converted to the longitudinal magnetization<br />
required during the NOE mixing period; the<br />
second, transverse component must be eliminated<br />
to remove coherence transfer artifacts. Thus, it is<br />
not possible to apply the PEP scheme for any evolu-
62 Bulletin of Magnetic Resonance<br />
tion period which precedes a NOESY mixing period<br />
or, by analogy, a ROESY spin-lock period; however,<br />
it may be possible to apply the PEP technique to<br />
subsequent evolution periods.<br />
Fig. 3 shows a pulse sequence for a sensitivityenhanced,<br />
3D NOESY-HMQC experiment (38).<br />
Unlike the TOCSY experiments, it is necessary<br />
in this case to modify the conventional sequence<br />
for this popular experiment. A detailed analysis<br />
(39,40) of the conventional HMQC experiment indicates<br />
that the two relevant, orthogonal spin operator<br />
terms present at the end of the evolution period<br />
(*2 period in Fig. 3) are not transformed equivalently<br />
following the evolution period; one term is converted<br />
to anti-phase proton coherence which evolves into<br />
in-phase magnetization observable during the detection<br />
period, while the second term is left as unobservable<br />
multi-spin coherence and is therefore lost.<br />
However, by modifying the pulse sequence (39,40)<br />
(adding the pulses after the 90^2 pulse in Fig. 3), it<br />
is possible to have both of the relevant spin operator<br />
terms from the evolution period transformed to observable<br />
magnetization for IS spin systems. While<br />
the resulting propagator does not cause the orthogonal<br />
terms to follow exactly equivalent pathways,<br />
under suitable conditions a substantial sensitivity<br />
enhancement can be achieved (39); the degree of<br />
non-equivalence is dependent on various relaxation<br />
rates. A modification analogous to that shown in<br />
Fig. 3 has also been described (39,40) for the HSQC<br />
experiment (41).<br />
The modifications to the HMQC and HSQC experiments<br />
only allow sensitivity enhancement for<br />
IS spin systems, i.e. heteronuclear spin systems in<br />
which only one proton is directly coupled to the heteronucleus.<br />
In applications where both IS and InS<br />
(n>l) spin systems are present, it is sometimes useful<br />
to process separately the two data sets recorded<br />
as part of the PEP procedure; by doing so one of<br />
the two spectra will only contain resonances from<br />
the IS spin systems, while the other will contain all<br />
the resonances, thus allowing easy distinction of IS<br />
from InS spin systems.<br />
4. Heteronuclear Relaxation Experiments<br />
Over the past several years there has been<br />
a resurgence of interest in measuring heteronuclear<br />
relaxation rate constants and heteronuclear<br />
NOEs for use in studying the internal dynamics of<br />
biomolecules (42). This renaissance is due partly<br />
to the availability of methods for biosynthetically<br />
enriching biomolecules with 13 C and/or 15 N nuclei<br />
and partly due to the development of methods<br />
for indirectly measuring the heteronuclear relaxation<br />
rate constants and { 1 H}-X NOEs with proton<br />
signal detection. The general scheme of the proton<br />
detection methods is to concatenate a conventional<br />
heteronuclear relaxation experiment with a<br />
HSQC experiment. For example, an experiment for<br />
measuring heteronuclear spin-spin relaxation rate<br />
constants (43,44) consists of a refocussed-INEPT<br />
(45,46) segment to enhance the sensitivity by transferring<br />
the larger proton equilibrium magnetization<br />
to the heteronuclei, a CPMG sequence (47,48) with<br />
a parametrically varied length T, and a HSQC type<br />
2D sequence (omitting the initial INEPT segment<br />
since the desired heteronuclear coherence has already<br />
been created) to record the data. A series<br />
of 2D experiments are collected as T is varied, and<br />
a plot of the cross-peak intensities in the 2D spectra<br />
as a function of T can be analyzed as usual for<br />
CPMG experiments. If the improved resolution of a<br />
2D correlation spectrum is unnecessary, then a simple<br />
reverse, refocussed-INEPT sequence can be used<br />
in place of the HSQC segment.<br />
Multi-dimensional, heteronuclear NMR experiments<br />
which contain a reverse polarization transfer<br />
step lend themselves well for application of the<br />
PEP scheme (39,40). An example of a sensitivityenhanced<br />
pulse sequence for measuring heteronuclear<br />
spin-spin relaxation rate constants is shown<br />
in Fig. 4. The section leading up to and including<br />
the t\ evolution period is a conventional sequence,<br />
with the initial refocussed-INEPT segment,<br />
the CPMG sequence modified so that dipolar-CSA<br />
cross-correlation effects are eliminated (43,44), and<br />
the t\ evolution period for frequency labelling the<br />
X nucleus coherences. In a conventional experiment<br />
the evolution period would be followed by a reverse<br />
polarization transfer sequence such as refocussed-<br />
INEPT or DEPT (49); these sequences transfer only<br />
one of the two, orthogonal magnetization components<br />
present at the end of the evolution period to<br />
observable proton signals. However, with relatively<br />
simple modifications (39,50), these sequences can<br />
be made to transfer both components with approximately<br />
equal efficiency to observable proton magne-
Vol. 16, No. 1/2<br />
H<br />
X<br />
) c<br />
-e-<br />
1<br />
A A A A<br />
X<br />
^ =X,-X<br />
T<br />
_ ^_<br />
) ( )<br />
X T<br />
—T-<br />
:<br />
X<br />
^<br />
n<br />
t<br />
1<br />
A A A A A A<br />
2<br />
><br />
y<br />
X<br />
y<br />
t2<br />
I GARP i<br />
64 Bulletin of Magnetic Resonance<br />
4.8 4.0<br />
1 H (ppm)<br />
3.2 4.8 4.0<br />
1 H (ppm)<br />
Figure 5: Contour plots of the Ca-Ha region of 13 C- 1 H 2D correlation spectra for a sample of 15% fractionally<br />
13 C-enriched calbindin Dgk, recorded using the sensitivity-enhanced pulse sequence of Figure 4 for measuring<br />
13 C spin-spin relaxation time constants. The two sets of data recorded during the experiment were added<br />
together to produce plot (a) and subtracted to produce plot (b); all processing and plotting parameters were<br />
identical for the two plots except for a 90° relative phase shift in both frequency dimensions (i.e. the zeroth<br />
order phase corrections necessary for spectrum (b) were shifted by 90° from the parameters used for spectrum<br />
(a)). The length of the CPMG cycle employed in this experiment was 4 ms. All data processing was done<br />
using the FTNMR software from Hare Research.<br />
for all slices, which required that the combined data<br />
be reduced in size by a factor of v 2 before plotting<br />
with the same scaling factors as the additive and<br />
subtractive data. The sensitivity enhancement expected<br />
for the PEP scheme is clearly demonstrated<br />
by the data in Fig. 6.<br />
5. Additional Applications<br />
The PEP scheme is a general concept, not a specific<br />
design. In addition to the examples described<br />
above and presented in detail elsewhere (33,34,38-<br />
40), many other applications are possible. Kay and<br />
coworkers (51) have recently reported the use of<br />
PEP technology in pulsed field gradient versions<br />
of the HSQC experiment. Their new method allows<br />
pure absorption heteronuclear correlation spec-<br />
3.2<br />
tra to be recorded with the use of pulsed field gradients<br />
for eliminating undesired coherence transfer<br />
pathways. PEP technology is employed in the<br />
gradient-enhanced experiment to extract separate<br />
signals which are cosine- and sine-modulated as a<br />
function of the evolution time t\\ this data can then<br />
be processed with a hypercomplex Fourier transformation<br />
to yield a pure absorption spectrum with<br />
u>i frequency discrimination. Madsen and S0rensen<br />
(52) have recently described very useful modifications<br />
to a variety of constant-time experiments for<br />
achieving optimal spectral resolution; PEP technology<br />
was incorporated into these experiments to enhance<br />
the sensitivity. Similarly, Madsen et al. (53)<br />
have employed the PEP scheme in designing new<br />
pulse sequences for measuring coupling constants in<br />
13 C, 15 N-labelled proteins.
Vol. 16, No. 1/2 65<br />
ppm<br />
Figure 6: One-dimensional slices taken parallel to the w2 frequency axis (proton chemical shift) from 13 C-<br />
X H 2D correlation spectra for the 15% fractionally 13 C-enriched calbindin D9k; the 2D spectra were recorded<br />
using the sensitivity-enhanced pulse sequence of Figure 4 for measuring heteronuclear spin-spin relaxation<br />
time constants. The length of the CPMG cycle employed in this experiment was 108 ms. The two data sets<br />
recorded during the experiment were added together to produce the 2D spectrum from which slice (a) was<br />
taken; slice (b) is from the 2D spectrum resulting from the subtractive combination; and slice (c) is the result<br />
of co-adding slices (a) and (b). The data are plotted such that the rms noise level appears the same for all<br />
slices; this required slice (c) to be reduced in absolute terms by a factor of A/2- The slices intersect peaks for<br />
the Ca-HQ correlations of Val 61 (5.10 ppm), Thr 45 (4.43 ppm), Tyr 13 (4.00 ppm), and Lys 25 (3.46 ppm).<br />
IV. Conclusion<br />
The general scheme of the PEP methodology<br />
for obtaining sensitivity improvements in multidimensional<br />
NMR experiments is simple. However,<br />
its implementation in practice may or may not be<br />
straightforward. The basic requirement which must<br />
be satisfied in order to exploit PEP technology is<br />
that the relevant, orthogonal spin operator components<br />
generated by the chemical shift/resonance offset<br />
precession during an evolution period be transformed<br />
to observable NMR signals along suitably<br />
equivalent coherence transfer pathways with approximately<br />
equal efficiency. In some applications<br />
no change in the actual pulse sequence is necessary<br />
in order to implement the PEP scheme, while other<br />
applications require some segments of the conven-<br />
add<br />
sub<br />
com<br />
tional pulse sequence to be re-engineered to meet<br />
the requisite conditions. It should be anticipated<br />
that PEP technology will be applicable in additional<br />
classes of experiments not specifically addressed in<br />
this paper. The maximum achievable sensitivity enhancement<br />
factor for PEP technology applied to one<br />
evolution period of a multi-dimensional NMR experiment<br />
is V2) which of course translates to a reduction<br />
by a factor of two in the measuring time<br />
required to record a data set with a given S/N ratio.<br />
Such improvement is extremely important in<br />
applications where the sensitivity is limited by practical<br />
factors such as low sample concentrations or<br />
inherent features such as the requirement for large<br />
numbers of individual free induction decays in 3D<br />
or 4D experiments or in relaxation rate measurements.<br />
Sensitivity improvements are also extremely
66 Bulletin of Magnetic Resonance<br />
useful in experiments which require the data to be<br />
collected in a limited period of time.<br />
V. Acknowledgments<br />
I would like to acknowledge the fundamental<br />
contributions of Dr. John Cavanagh and Prof.<br />
Arthur Palmer to the development of the sensitivityenhanced<br />
NMR experiments and the collaboration<br />
with Dr. R. Andrew Byrd on extending the original<br />
techniques to 3D applications. Helpful discussions<br />
during the course of the research with Dr.<br />
Malcolm Levitt, Prof. Geoffrey Bodenhausen and<br />
Dr. Ole S0rensen are also gratefully acknowledged.<br />
This work was supported by the National Institutes<br />
of Health (RO1-GM40089).<br />
VI. References<br />
X<br />
R.R. Ernst, Adv. Magn. Reson., vol. 2, Academic<br />
Press, New York, 1966, pp. 1-135.<br />
2<br />
W.P. Aue, P. Bachmann, A. Wokaun and R.R.<br />
Ernst, J. Magn. Reson. 29, 523 (1978).<br />
3<br />
M.H. Levitt, G. Bodenhausen and R.R. Ernst,<br />
J. Magn. Reson. 58, 462 (1984).<br />
4<br />
C.-N. Chen, D.I. Hoult and V.J. Sank, J. Magn.<br />
Reson. 54, 324 (1983).<br />
5<br />
W.P. Aue, E. Bartholdi and R.R. Ernst, J.<br />
Chem. Phys. 64, 2229 (1976).<br />
6<br />
L. Braunschweiler and R.R. Ernst, J. Magn.<br />
Reson. 53, 521 (1983).<br />
7<br />
A. Bax and D.G. Davis, J. Magn. Reson. 65,<br />
355 (1985).<br />
8<br />
M. Ranee, J. Magn. Reson. 74, 557 (1987).<br />
9<br />
R. Bazzo and I.D. Campbell, J. Magn. Reson.<br />
76, 358 (1988).<br />
10<br />
M. Ranee, Chem. Phys. Lett. 154, 242 (1989).<br />
n<br />
G. Bodenhausen, R. Freeman, R. Niedermeyer<br />
and D.L. Turner, J. Magn. Reson. 26, 133 (1977).<br />
12<br />
P. Bachmann, W.P. Aue, L. Miiller and R.R.<br />
Ernst, J. Magn. Reson. 28, 29 (1977).<br />
13<br />
J. Keeler and D. Neuhaus, J. Magn. Reson.<br />
63, 454 (1985).<br />
14<br />
L. Miiller and R.R. Ernst, Mol. Phys. 38, 963<br />
(1979).<br />
15<br />
D.J. States, R.A. Haberkorn and D.J. Ruben,<br />
J. Magn. Reson. 48, 286 (1982).<br />
16 G. Drobny, A. Pines, S. Sinton, D. Weitekamp<br />
and D. Wemmer, Symp. Faraday Soc. 13, 49<br />
(1979).<br />
17 G. Bodenhausen, R.L. Void and R.R. Void, J.<br />
Magn. Reson. 37, 93 (1980).<br />
18 D. Marion and K. Wiithrich, Biochem. Biophys.<br />
Res. Commun. 113, 967 (1983).<br />
19 R.N. Bracewell, The Fourier Transform and<br />
Its Applications, 2nd Ed., McGraw-Hill, New York,<br />
1986.<br />
20 G. Bodenhausen, H. Kogler and R.R. Ernst, J.<br />
Magn. Reson. 58, 370 (1984).<br />
21 A.D. Bain, J. Magn. Reson. 56, 418 (1984).<br />
22 J. Jeener, B.H. Meier, P. Bachmann and R.R.<br />
Ernst, J. Chem. Phys. 71, 4546 (1979).<br />
23 A.A. Bothner-By, R.L. Stephens, J. Lee, CD.<br />
Warren and R.W. Jeanloz, J. Am. Chem. Soc. 106,<br />
811 (1984).<br />
24 R.R. Ernst, Rev. Sci. Instrum. 36, 1689<br />
(1965).<br />
25 R.R. Ernst, J. Magn. Reson. 1, 7 (1969).<br />
26 E. Bartholdi and R.R. Ernst, J. Magn. Reson.<br />
11, 9 (1973).<br />
27 R. Deutsch, Nonlinear Transformations of<br />
Random Processes, Prentice-Hall, Englewood Cliffs,<br />
New Jersey, 1962.<br />
28 J.S. Bendat and A.G. Piersol, Random Data,<br />
2nd Ed., John Wiley and Sons, New York, 1986.<br />
29 R.R. Ernst and H. Primas, Helv. Phys. Ada<br />
36, 583 (1963).<br />
30 A.Z. Gurevich, I.L. Barsukov, A.S. Arseniev<br />
and V.F. Bystrov, J. Magn. Reson. 56, 471 (1984).<br />
31 C.A.G. Haasnoot, F.J.M. van de Ven and C.W.<br />
Hilbers, J. Magn. Reson. 56, 343 (1984).<br />
32 J. Cavanagh and M. Ranee, J. Magn. Reson.<br />
87, 408 (1990).<br />
33<br />
J. Cavanagh and M. Ranee, Ann. Reports<br />
NMR Sped. 27, 1 (1993).<br />
34<br />
J. Cavanagh and M. Ranee, J. Magn. Reson.<br />
88, 72 (1990).<br />
35 (a) A.J. Shaka, C.J. Lee and A. Pines, J. Magn.<br />
Reson. 77, 274 (1988); (b) S.P. Rucker and A.J.<br />
Shaka, Mol. Phys. 68, 509 (1989).<br />
36 M.R. Bendall, D.T. Pegg and D.M. Doddrell,<br />
J. Magn. Reson. 52, 81 (1983).<br />
37 A. Bax, R.H. Griffey and B.L. Hawkins, J.<br />
Magn. Reson. 55, 301 (1983).<br />
38 A.G. Palmer, III, J. Cavanagh, R.A. Byrd and<br />
M. Ranee, J. Magn. Reson. 96, 416 (1992).
Vol. 16, No. 1/2 67<br />
39 A.G. Palmer, III, J. Cavanagh, P.E. Wright<br />
and M. Ranee, J. Magn. Reson. 93, 151 (1991).<br />
40 J. Cavanagh, A.G. Palmer, III, P.E. Wright<br />
and M. Ranee, J. Magn. Reson. 91, 429 (1991).<br />
41 G. Bodenhausen and D. J. Ruben, Chem. Phys.<br />
Lett. 69, 185 (1980).<br />
42 A.G. Palmer, III, Current Opinion in Biotech-<br />
nology, 4, 385 (1993).<br />
43 A.G. Palmer, III, N.J. Skelton, W.J. Chazin,<br />
P.E. Wright and M. Ranee, Mol. Phys. 75, 699<br />
(1992).<br />
44 L.E. Kay, L.K. Nicholson, F. Delagio, A. Bax<br />
and D.A. Torchia, J. Magn. Reson. 97, 359 (1992).<br />
45 G.A. Morris and R. Freeman, J. Am. Chem.<br />
Soc. 101, 760 (1979).<br />
46 D.P. Burum and R.R. Ernst, J. Magn. Reson.<br />
39, 163 (1980).<br />
47<br />
H.Y. Carr and E.M. Purcell, Phys. Rev. 94,<br />
630 (1954).<br />
48<br />
S. Meiboom and D. Gill, Rev. Sci. Instrum.<br />
29, 688 (1958).<br />
49 D.M. Doddrell, D.T. Pegg and M.R. Bendall,<br />
J. Magn. Reson. 48, 323 (1982).<br />
50 N.J. Skelton, A.G. Palmer, III, M. Akke, J.<br />
Kordel, M. Ranee and W.J. Chazin, J. Magn. Reson.,<br />
Ser. B, 102, (in press, 1993).<br />
51 L.E. Kay, P. Keifer and T. Saarinen, J. Am.<br />
Chem. Soc. 114, 10663 (1992).<br />
52 J.C. Madsen and O.W. S0rensen, J. Magn. Re-<br />
son. 100, 431 (1992).<br />
53 J.C. Madsen, O.W. S0rensen, P. S0rensen and<br />
F.M. Poulsen, J. Biomol. NMR 3, 239 (1993).<br />
54 A.J. Shaka, P.B. Barker and R. Freeman, J.<br />
Magn. Reson. 64, 547 (1985).
68 Bulletin of Magnetic Resonance<br />
Cross Polarization and Dynamic-Angle<br />
Spinning of 17 O in L-Alanine<br />
S. L. Gann, J. H. Baltisberger,* E. W. Wooten,^ H. Zimmermann, 0 and A. Pines<br />
Materials Sciences Division, Lawrence Berkeley Laboratory and<br />
Department of Chemistry, University of California, Berkeley, CA 94720<br />
* Current address: Department of Chemistry, Berea College, Berea, KY 40404<br />
'Current address: Biophysics Research Division, The University of Michigan, Ann Arbor, MI 4.8109<br />
°Permanent Address: Max-Planck-Institut Fur Medizinische Forschung,<br />
Arbeitsgruppe Molekulkristalle, Jahnstrasse 29, D-6900 Heidelberg, Germany<br />
Contents<br />
I. Introduction<br />
II. Experimental<br />
III. Results and Discussion<br />
IV. Acknowledgments<br />
V. References<br />
I. Introduction<br />
The study of biologically active and other organic<br />
compounds by solid-state NMR has for the<br />
most part been limited to spin-1/2 nuclei such as<br />
1 H, 13 C, 15 N, 19 F, and 31 P. The study of 17 O, a<br />
quadrupolar nucleus (S = 5/2), in solid organic compounds<br />
has been limited due to its low natural abundance,<br />
low magnetogyric ratio, and strong secondorder<br />
quadrupolar interactions. The first two difficulties<br />
can be alleviated to some extent through isotopic<br />
substitution, the use of high magnetic fields,<br />
and through cross polarization (CP) (1) from 1 H<br />
to the central (1/2 —1/2) 17 O transition. For a<br />
static sample, it is theoretically possible to achieve<br />
a one-shot sensitivity enhancement of 7.3 (assuming<br />
a large excess of *H compared to 17 O). An alternative<br />
approach involving adiabatic slow passage<br />
to transfer magnetization from the satellite transitions<br />
to the central transition of 17 O could be used<br />
to generate an enhancement factor of 5.0 (2). However,<br />
when the sample is spun about an axis inclined<br />
with respect to the magnetic field, there can be a<br />
significant decrease in CP efficiency (3) because the<br />
time dependence of the first-order quadrupolar interaction<br />
interferes with Hartmann-Hahn matching.<br />
Cross polarization while spinning the sample at an<br />
angle of 0° (parallel) with respect to the magnetic<br />
field is tantamount to operating under static conditions<br />
and maximum CP efficiency can be achieved.<br />
As shown recently (4,5), the effects of strong<br />
quadrupolar interactions can also be averaged coherently<br />
by spinning the sample about two axes.<br />
For the central transition of quadrupolar nuclei of<br />
half-integer spin, the chemical shift anisotropy and<br />
the second-order quadrupolar interactions are generally<br />
the dominant broadening mechanisms; the<br />
quadrupolar coupling constant, e 2 qQ/h, of 17 O in<br />
organic molecules typically ranges from 5 to 12<br />
MHz. Solid-state line narrowing techniques such<br />
as magic-angle spinning (MAS) do not fully average<br />
second-order interactions and, therefore, generally<br />
do not give sufficiently narrowed spectra, unless<br />
the coupling constant is less than about 0.5<br />
MHz. However, in dynamic-angle spinning, the ef-<br />
68<br />
69<br />
70<br />
71<br />
72
Vol. 16, No. 1/2 69<br />
'H<br />
X<br />
0(t)<br />
90* 9O.A 90,<br />
J -*<br />
90x 90. nx<br />
CP t,/6 40ms 2xr 51,/6<br />
0 u<br />
SLV<br />
63.43 U<br />
v v<br />
2 Y X Y X X Y X Y Y X Y X X Y X Y<br />
4>3 X X X X Y Y Y Y X X X X Y Y Y Y<br />
70 Bulletin of Magnetic Resonance<br />
CP efficiency per scan (signal compared to a single<br />
pulse FID on oxygen with hydrogen spin decoupling)<br />
of approximately 200%. The theoretical maximum<br />
was not achieved because of short rotating frame relaxation<br />
times. Ti relaxation times were 750 ms for<br />
l R and 2.5 s for 17 O.<br />
DAS experiments at a field strength of 11.7 T<br />
(67.797 MHz) were performed on a CMX spectrometer<br />
using the single-tuned DAS probe described in<br />
ref. (10). No decoupling or cross-polarization was<br />
performed at this field.<br />
III. Results and Discussion<br />
The structure of this amino acid, shown in Figure<br />
2, has been determined previously by x-ray crystallography<br />
and neutron diffraction (8,12) and indicates<br />
two inequivalent O sites due to a difference in<br />
hydrogen bonding of the two oxygen atoms (12), so<br />
the spectrum should consist of two overlapping powder<br />
patterns. Figure 3 shows the 17 O MAS and DAS<br />
spectra of L-alanine taken at 11.7 T, both without<br />
spin decoupling. The MAS spectrum shows a broad<br />
powder pattern with a number of singularities. In<br />
addition, sidebands complicate the powder pattern,<br />
resulting in a spectrum that is difficult to simulate.<br />
In contrast, the DAS spectrum shows a separated<br />
isotropic peak and sideband pattern. The two sites<br />
in alanine are not clearly resolved in this spectrum<br />
and appear as one peak. The isotropic position is<br />
assigned to 200±7 ppm by comparison with a spectrum<br />
taken at a different spinning speed.<br />
Figure 4 shows the 2D-CP/DAS spectrum of alanine,<br />
along with the projection of the isotropic shift<br />
dimension, recorded at 7.0 T. Spin decoupling of<br />
X H resulted in lines significantly narrower than that<br />
of the experiment without decoupling in Figure 3.<br />
The two sites are clearly resolved and are assigned<br />
to 51±4 and 80±4 ppm by comparison to a spectrum<br />
taken at a different spinning speed. The advantages<br />
of using cross polarization are, first of all,<br />
that the signal intensity per scan is approximately<br />
twice that seen in an experiment without cross polarization.<br />
Secondly, the recycle time is determined<br />
by the Ti of 1 H rather than that of 17 O, resulting<br />
in an increase in the signal-to-noise ratio by a factor<br />
of two, giving an overall four-fold increase in the<br />
signal-to-noise ratio. As mentioned above, cross polarizing<br />
from X H to 17 O can result in an increase in<br />
Figure 2: Structure of L-alanine showing differences<br />
in hydrogen bonding of the two oxygen sites.<br />
MAS<br />
100 200 300 400<br />
17/<br />
Frequency (ppm from H2 O)<br />
and<br />
Figure 3: Magic-angle spinning (MAS) auu<br />
dynamic-angle spinning (DAS) spectra of 17 O in Lalanine<br />
at 11.7 T (67.797 MHz), without proton spin<br />
decoupling. The spectra are referenced to 17 O labeled<br />
H2O.
Vol. 16, No. 1/2<br />
-600<br />
-400<br />
-200<br />
200<br />
400<br />
•400 200 0 -200 -400<br />
Frequency (ppm from H2 17 O)<br />
-600<br />
Figure 4: Two-dimensional DAS with cross polarization<br />
(CP/DAS) and proton spin decoupling spectrum<br />
of 17 O in L-alanine at 7.04 T. The projection<br />
of the isotropic shift dimension is shown at the top.<br />
The spectrum is referenced to 17 O labeled H2O.<br />
intensity by a factor of 7.3, so with favorable relaxation<br />
times the enhancement of the signal-to-noise<br />
ratio can be considerable and in fact could be crucial<br />
in rendering an experiment feasible.<br />
Using the results of the experiments at the two<br />
different fields, the isotropic chemical shifts and<br />
quadrupolar coupling products can be calculated<br />
(13) by solving a system of simultaneous linear equations,<br />
with the results given in Table 1. The observed<br />
isotropic shift (in ppm), 6obs, is related to<br />
the isotropic chemical shifts, 6iSOtCS, and quadrupolar<br />
coupling product, PQ, by<br />
&obs —<br />
Hso,cs<br />
3 x 10 6 41(1 + 1) - 3<br />
(1)<br />
The quadrupolar coupling product, PQ, is given by<br />
h<br />
where I is the spin, LOQ is the Larmor frequency, and<br />
T]Q is the quadrupolar asymmetry parameter. The<br />
values for the quadrupolar coupling product are in<br />
good agreement with the quadrupolar coupling constant<br />
measured for the carboxyl oxygen atoms in<br />
similar compounds using NQR (14). Due to the<br />
similarities of the sites, it is not possible to assign<br />
the spectra to particular 17 O sites. However, further<br />
work on amino acids might reveal trends in isotropic<br />
chemical shift and quadrupolar coupling products<br />
which allow for the assignment of sites.<br />
NMR of 17 O in L-alanine has been performed<br />
previously by Goc, et al. (15), in which the static<br />
lineshape of a polycrystalline sample was simulated.<br />
Their simulation assumed that there was only a single<br />
17 O site, while our work and the crystal structure<br />
are consistent with two inequivalent sites. The reported<br />
values for e 2 qQ/h of 6.6 MHz and for TJQ of<br />
0.55, which were reported to be precise to 20% (15),<br />
give a PQ from their data of 6.9 MHz, which agrees<br />
(to within 20%) with our calculations for either site.<br />
Both Figures 3 and 4 show the disadvantages of<br />
insufficient spinning speeds. While the sidebands<br />
are clearly separated from the isotropic peaks in<br />
these spectra, in general, the large number of sidebands<br />
normally present in 17 O NMR of organic compounds<br />
can be a considerable problem. The types of<br />
compounds one would like to study with solid-state<br />
NMR, such as small peptides or carbohydrates, will<br />
typically have numerous inequivalent sites. However,<br />
fast spinning speeds are becoming easier to<br />
achieve in DAS experiments resulting in fewer sidebands.<br />
In addition, such techniques as dynamicangle<br />
hopping (DAH) (16) can eliminate sidebands<br />
altogether in cases where adequate spinning speeds<br />
cannot be obtained.<br />
IV. Acknowledgments<br />
This work was supported by the Director of<br />
the Office of Energy Research, Office of Basic Energy<br />
Sciences, Materials Sciences Division of the U.<br />
S. Department of Energy under Contract No. DE-<br />
AC03-76SF00098. J.H.B. was supported by a NSF<br />
71<br />
(2)
72 Bulletin of Magnetic Resonance<br />
Table 1: Isotropic shifts and quadrupolar coupling products for L-alanine.<br />
Site ^ T fll.7T<br />
°obs<br />
graduate fellowship. E.W.W. was supported by a<br />
NIH postdoctoral fellowship.<br />
V. References<br />
U ISO,CS<br />
1 51±4 ppm 200±7 ppm 8.1±0.3 MHz 285±8 ppm<br />
2 80±4 ppm 200±7 ppm 7.2±0.3 MHz 268±8 ppm<br />
X A. Pines, M. G. Gibby, and J. S. Waugh, J.<br />
Chem. Phys. 59, 569-590 (1973).<br />
2 J. Haase and M. S. Conradi, Chem. Phys. Lett.<br />
209, 287-291 (1993).<br />
3<br />
A. J. Vega, Solid State NMR 1, 17-32 (1992).<br />
4<br />
A. Llor and J. Virlet, Chem. Phys. Lett. 152,<br />
248-253 (1988).<br />
5<br />
A. Samoson, E. Lippmaa, and A. Pines, Mol.<br />
Phys. 65, 1013-1018 (1988).<br />
6 K. T. Mueller, B. Q. Sun, G. C. Chingas, J. W.<br />
Zwanziger, T. Terao, and A. Pines, J. Magn. Reson.<br />
86, 470-487 (1990).<br />
7 S. L. Gann, J. H. Baltisberger, P. J.<br />
Grandinetti, E. W. Wooten, and A. Pines, Poster<br />
81, 34th Experimental Nuclear Magnetic Resonance<br />
Conference, St. Louis, Missouri, March 14-18, 1993.<br />
8 H. J. Simpson Jr. and R. E. Marsh, Ada Cryst.<br />
20, 550-555 (1966).<br />
9 P. J. Grandinetti, J. H. Baltisberger, A. Llor, Y.<br />
K. Lee, U. Werner, M. A. Eastman, and A. Pines,<br />
J. Magn. Reson. A 103, 72-81 (1993).<br />
10 K. T. Mueller, G. C. Chingas, and A. Pines,<br />
Rev. Sci. lustrum. 62, 1445-1452 (1991).<br />
U F. D. Doty, T. J. Connick, X. Z. Ni, and M. N.<br />
Clingan, J. Magn. Reson. 77, 536-549 (1988).<br />
12 M. S. Lehmann, T. F. Koetzle, and W. C.<br />
Hamilton, J. Am. Chem. Soc. 94, 2657-2660<br />
(1972).<br />
13 J. H. Baltisberger, S. L. Gann, E. W. Wooten,<br />
T. H. Chang, K. T. Mueller, and A. Pines, J. Am.<br />
Chem. Soc. 114, 7489-4793 (1992).<br />
14 H. Chihara and N. Nakamura, "Nuclear<br />
Quadrupolar Resonance Spectroscopy Data", K.-<br />
H. Hellwege and A. M. Hellwege (Eds.), Landolt-<br />
Bornstein Numerical Data and Functional Relationships<br />
in Science and Technology, New Series, Group<br />
III, Vol. 20a, O. Madelung (Ed. in Chief), Springer-<br />
Verlag, Berlin, 1987.<br />
15 R. Goc, E. Ponnusamy, J. Tritt-Goc, and D.<br />
Fiat, Int. J. Peptide Protein Res. 31, 130-136<br />
(1988).<br />
16 S. L. Gann, J. H. Baltisberger, and A. Pines,<br />
Chem. Phys. Lett. 210, 405-410 (1993).
Vol. 16, No. 1/2 73<br />
Influence of Slow Internal Motion in Proteins on Cross-Relaxation<br />
Rates Determined by Two-Dimensional Exchange Spectroscopy<br />
Contents<br />
Slobodan Macura* 1 , Jasna Fejzo* 2 , William M. Westler # , and John L. Markley*<br />
* Department of Biochemistry and Molecular Biology,<br />
Mayo Graduate School<br />
Mayo Foundation,<br />
Rochester, MN 55905<br />
and<br />
& Department of Biochemistry,<br />
University of Wisconsin,<br />
420 Henry Mall, Madison, WI 53706<br />
I. Introduction 73<br />
II. Theory 74<br />
1. Two Groups of Equivalent Spins 76<br />
2. Three-Spin Systems 78<br />
3. Four-Spin Systems 80<br />
III. Internal Motions and Full Matrix Analysis 85<br />
IV. Internal Motion and Initial-build-up Rate Analysis 86<br />
V. Experimental Examples 87<br />
VI. Conclusions 89<br />
VII. Acknowledgments 92<br />
VIII. References 92<br />
I. Introduction<br />
Two-dimensional exchange spectroscopy (1-4) has<br />
become a very popular tool for the study of dynamic<br />
processes in liquids. Originally, chemical exchange<br />
(1,5) and cross-relaxation (6,7) were considered to<br />
be separate processes. Interference between the two<br />
processes (chemical exchange and cross-relaxation)<br />
was recognized early (7), but active treatment of<br />
the problem (8) was possible only following the development<br />
of exchange spectroscopy in the rotating<br />
1 Author to whom correspondence should be sent.<br />
Present address: Harvard Medical School, Department of<br />
Biological Chemistry and Molecular Pharmacology, Boston,<br />
MA 02115<br />
frame (9,10). Subsequently, a full class of exchange<br />
experiments has been developed that enable the two<br />
processes to be identified and separated (11-13).<br />
Two-dimensional cross-relaxation spectroscopy<br />
in the laboratory frame (NOESY) and in the rotating<br />
frame (ROESY) have taken experimental precedence<br />
over 2D chemical exchange spectroscopy because<br />
information from cross-relaxation provides the<br />
basis for the determination of structures of macromolecules<br />
in solution (14). The basic tenet of the<br />
original method for structure determination from<br />
NOE data is that the macromolecule is rigid. How-
74 Bulletin of Magnetic Resonance<br />
ever, many macromolecules have internal mobility<br />
in forms that produce chemical exchange artifacts<br />
in cross-relaxation spectra.<br />
If misinterpreted, chemical exchange effects can<br />
degrade calculated structures by distorting input<br />
distances. When chemical exchange rates are commensurate<br />
with cross-relaxation rates, then they can<br />
only be recognized and evaluated from their direct<br />
effects on cross-peak volumes. Chemical exchange<br />
effects contribute to the volumes of corresponding<br />
cross peaks, and, if not identified, lead to underestimation<br />
of interproton distances. This direct effect,<br />
however, is easy to identify. Whenever chemical<br />
exchange is much faster than cross-relaxation,<br />
the indirect effects of chemical exchange also must<br />
be considered (15). When k >> o (where k is the<br />
chemical-exchange rate constant, and a is the crossrelaxation<br />
rate constant) chemical exchange acts<br />
as a short-circuiting device for magnetization exchange.<br />
It transfers magnetization between chemically<br />
exchanging spins instantly, compared to crossrelaxation.<br />
Chemically exchanging spins become involved<br />
in cross-relaxation with their spatial neighbors;<br />
thus chemical exchange partners can enter into<br />
cross-relaxation networks that are spatially distant.<br />
In NOESY spectra, a chemical exchange pathway<br />
acts like any other cross-relaxation pathway. An<br />
important difference, however, is that chemical exchange<br />
is physically unrelated to cross-relaxation<br />
and, therefore, chemical exchange rates can easily<br />
exceed cross-relaxation rates by orders of magnitude.<br />
This possibility that a competing magnetization<br />
exchange pathway can occur at a rate up to two<br />
orders of magnitude faster than the one one wishes<br />
to measure, drastically changes the way the system<br />
can be approximated in the analysis. Except for full<br />
matrix analysis (FMA), all approaches use (implicitly<br />
or explicitly) some degree of approximation.<br />
The most widely used approach for structural<br />
studies of proteins is the initial-build-up rate approximation.<br />
Chemical exchange effects can lead to<br />
serious problems in such an analysis. For example,<br />
when k ^> a the initial-build-up rate approximation<br />
may be valid only for extremely short mixing<br />
times (krm < 1). However, under these conditions,<br />
the intensities of regular cross-relaxation cross peaks<br />
become vanishingly small. The initial-build-up rate<br />
approximation holds for cross-relaxation magnetization<br />
transfer rates such that arm < 1. If chemical<br />
exchange is rapid, however, this approximation will<br />
break down for spins involved in chemical exchange<br />
since then krm > 1. Ignorance of this breakdown<br />
in the initial-build-up rate approximation can introduce<br />
serious errors in the determination of interproton<br />
distances.<br />
Full matrix analysis (FMA) theoretically does<br />
not depend on the magnitude of dynamic matrix<br />
elements. However, when the nature of experimental<br />
errors is taken into account, one recognizes that<br />
FMA is as vulnerable as any other method. For example,<br />
when krm > 1 the cross and diagonal peaks<br />
corresponding to direct processes are of similar magnitude,<br />
and, if their difference is within experimental<br />
error, k cannot be determined properly. Chemical<br />
exchange leads to the equalization of the intensities<br />
of cross peaks affected by the exchange process.<br />
If the intensity (volume) differences are less than<br />
the experimental errors, full matrix analysis fails<br />
(16,17). Another difficulty with full matrix analysis<br />
is that it requires the knowledge of the intensities<br />
of all cross and diagonal peaks, which in many<br />
instances are unavailable. Another disadvantage is<br />
that FMA does not allow partial analysis of the exchange<br />
network.<br />
The similar effects of fast magnetization transfer<br />
that arise from strong cross-relaxation (spin<br />
diffusion) are already well recognized (16,18-20).<br />
The combined effects of cross-relaxation and chemical<br />
exchange have been described theoretically<br />
and demonstrated experimentally in relation to<br />
the transferred nuclear Overhauser effect (TRNOE)<br />
(21-26). Also, the influence of internal mobility on<br />
the accuracy of a protein structure determination<br />
has been demonstrated experimentally (15).<br />
II. Theory<br />
Chemical exchange and cross relaxation are incoherent<br />
magnetization transfer processes driven by<br />
random molecular motion. The transfer can be described<br />
by a system of N coupled linear differential<br />
equations (3,27)<br />
dm(rm)<br />
drm<br />
with the formal solution<br />
= Lm(rn<br />
m(rm) = exp(Lrm)m(0)<br />
(1)<br />
(2)
Vol. 16, No. 1/2 75<br />
(a)<br />
(c)<br />
2.5-<br />
1.5<br />
0.5-<br />
m L12<br />
1 ^ 2<br />
O 1 O<br />
n2L21<br />
"-—-——<br />
^--—<br />
0.5<br />
31<br />
32<br />
33<br />
21<br />
22<br />
23<br />
11<br />
12<br />
13<br />
1<br />
0.9<br />
0.8<br />
0.7<br />
(b)<br />
}/<br />
(d)<br />
\21<br />
0.6<br />
H<br />
0.5<br />
/ s 'W 9?<br />
\31,22\/<br />
C/^32.<br />
0.4<br />
\32\. "///<br />
Figure 1: Two-spin systems composed of two groups of equivalent spins:<br />
a) The magnetization exchange network consists of two spin groups with populations (ni = na, n2 = nt,) and<br />
exchange rates (niLi2 = n2L2i).<br />
•b) An experimental example: water protons in chemical exchange and/or cross relaxation with a hydroxyl<br />
proton of a protein.<br />
c) Build-up curves for ni = 1, 2, 3 and n2 = 1, 2, 3. Diagonals start from the integer equal to nx- The<br />
numbers indicate the values of ni and 112. Cross-peaks start from zero with slopes proportional to nix n2d)<br />
Two ways of normalizing cross- and/or diagonal-peak volumes provide useful means of obtaining magnetization<br />
exchange rate constants per single spin, Lo- In the first<br />
an 12<br />
0.3<br />
0.2<br />
0.1 -<br />
\1<br />
"V<br />
\<br />
0.5<br />
(nx+ n2)(an- 2n1n2<br />
the initial linear slope extends to much longer mixing times than that of ai2 itself (Figure lc) and is proportional<br />
to Lo, irrespective of the number of spins involved. In the second,<br />
an 11 2<br />
h<br />
n2<br />
112<br />
the curves start from different levels, a"1(0) = 2/(ni + n2), but have the same initial slope —Lo.<br />
H-O<br />
11 /
76 Bulletin of Magnetic Resonance<br />
The vector m has elements niXjirii, where rii is the<br />
number of equivalent spins, x; is the mole fraction,<br />
and m; is the deviation from thermal equilibrium<br />
of magnetization at site i. The dynamic matrix L<br />
contains all information about exchange rates in a<br />
given system. In general, L is a linear combination<br />
of the kinetic matrix, K, and the relaxation matrix,<br />
R<br />
or, in scalar form,<br />
L = K-R<br />
Ly — ky 2 is the same as the rate<br />
2 -> 1, i.e.:<br />
= n2L 2i<br />
(3)<br />
(4)<br />
or in other words, the exchange rates per single spin<br />
are equal:<br />
The exchange matrix is<br />
or with regard to eqn. 6<br />
L12 _ L21<br />
n2 ni = Lo (6)<br />
L = ( ~ki2 L21<br />
\ L12 — L21<br />
The population matrix is<br />
-n2<br />
n2<br />
0<br />
m(0) = m0<br />
V 0 n2<br />
Eqn. 1 can be solved easily, and one obtains (7)<br />
(7)<br />
(8)<br />
(9)<br />
an(rm) = —~~\~ + exp[-(ni+n2)Lorm]><br />
ni+n2tn2<br />
J<br />
(10a)<br />
, v nin2 fn2 r , . ,1<br />
a22(rm) = —-—
Vol. 16, No. 1/2 77<br />
0.5 1<br />
CJi2Tm<br />
Figure 2: Three-spin systems:<br />
a) Magnetization exchange networks. Single lines indicate cross-relaxation and double lines chemical exchange<br />
pathways.<br />
b) Typical example - (doubly deuterated) tyrosine ring and arbitrarily placed third proton.<br />
c) Build-up curves, a23(rm), a33(rm) according to eqns. 14c and 14f. Numbers represent the ratio 012/^23 with<br />
O"13 = 0.<br />
d) Build-up curves for ai2(Tm) and ai3(rm), according to eqns. 14a and 14b (solid lines). Dotted lines represent<br />
build-up curves of cross peaks in the limit where 0, according to eqns. 18. Again, numbers on<br />
each solid line represent the ratio 012^23. With increases in either the chemical exchange rate constant or<br />
the mixing time, cross-peak volumes ai2(rm) and ai3(rm) converge toward their average value l/2[a^2(Tm) +<br />
(a^3(Tm)], as shown by eqn. 18a.<br />
frame (NOESY) and in the rotating frame (ROESY)<br />
(8). Cross-relaxation can be eliminated from chemical<br />
exchange by a modified NOESY experiment<br />
(clean-EXCSY) (11,12). The clean-EXCSY spectrum<br />
contains contributions from only chemical exchange<br />
while cross-relaxation is completely eliminated.<br />
Then, the cross-relaxation can be evaluated<br />
by "subtraction" of the chemical exchange part from<br />
a normal exchange (NOESY) spectrum. An alternative<br />
experiment, which directly eliminates the effects<br />
of a selected chemical exchange pathway, has been<br />
proposed recently (17). Its main limitation is that it<br />
eliminates chemical exchange paths originating from<br />
one selected spin only. In spite of this, the exper-
78<br />
iment can be of great value for the study of crossrelaxation<br />
between water and protein protons (34-<br />
37). With exchangeable protein protons (OH, NH)<br />
water protons exhibit cross-relaxation and chemical<br />
exchange simultaneously. Separation of the two effects<br />
is crucial for the proper placement of water<br />
molecules in and around a protein molecule.<br />
2. Three-Spin Systems<br />
A three-spin system is the simplest system<br />
that exhibits the problem of indirect magnetization<br />
transfer. This effect has been studied extensively<br />
by quadratic approximation (7), full matrix simulations<br />
(18,20), or partial analytical solution (16).<br />
Here we give explicit expressions for magnetization<br />
exchange in a three-spin system as revealed by 2D<br />
exchange spectroscopy.<br />
Representative magnetization exchange networks<br />
in a three-spin system are depicted in Figure<br />
2a. The exchange matrix for a general three-spin<br />
system with magnetization exchange rate constants<br />
L12, L13, and L23 is<br />
It has the general solutions<br />
au(rm) = -<br />
where<br />
L12<br />
— (L12 + L23)<br />
L23<br />
A3<br />
exp(A2rm)<br />
A2 — A3<br />
'Lij + A2<br />
exp( A3rn<br />
\ 7<br />
A3 — A2<br />
(12a)<br />
ij + Lik) + 2A3<br />
, \<br />
exp(A2rm)<br />
A3 — A2<br />
3(Lij + La) + 2A2<br />
.[exp(A 3r m) (12b)<br />
A2 - A3 J<br />
J [<br />
Ao 3= - L12 + L13 + L23<br />
±\ '(L12 - L13) 2 + (L13 - L23) 2 + (L23 - L12)2<br />
Bulletin of Magnetic Resonance<br />
= 1,2,3, (13)<br />
Again, overall relaxation has been neglected. If<br />
all the spins have the same (external) relaxation<br />
rate, p, then this can easily be taken into account<br />
by multiplying each aij with exp(—prm).<br />
Eqns. 12 describe magnetization transfer in an<br />
arbitrary three spin system. However, these equations<br />
are complicated, and many relevant properties<br />
are not immediately obvious from them. For<br />
the sake of clarity, we consider a special three-spin<br />
system where L12 =
Vol. 16, No. 1/2 79<br />
(b)<br />
(c) (d)<br />
Figure 3: Four-spin system G^:<br />
a) Magnetization exchange network consisting of four nodes and six paths. Double lines indicate chemical<br />
exchange, and single lines denote cross-relaxation pathways. The system is highly symmetric; the exchange<br />
rates are pairwise equal, i.e., u\2 = 034;
80 Bulletin of Magnetic Resonance<br />
Their dependence on the ratio crn/^-23 is relatively<br />
complex, but the fast-exchange limit, where<br />
CT i2/k23 —> 0, can be easily assessed analytically. In<br />
this case, the system of eqns. 14 simplifies to:<br />
H2\<br />
a 22V T m) —<br />
l-expl-3-—rm)| (16a)<br />
, 1<br />
2<br />
- -<br />
~ 2<br />
-3^rm<br />
-exp(-2k23Tm)<br />
(16b)<br />
o °l2 .)] (16d)<br />
The superscript k denotes that eqns. 16 are valid in<br />
the fast-exchange limit.<br />
Fast chemical exchange quickly equilibrates magnetization<br />
between spins 2 and 3, rendering their<br />
diagonal and mutual cross peaks equal, even at the<br />
shortest mixing times r^ for which cross-relaxation<br />
can be measured. When CT<strong>^T</strong>^ < 1 1 then the<br />
individual exchange rates (Lik, Ljk) cannot be determined.<br />
Instead, one can find their average by<br />
full matrix analysis by replacing the original groups<br />
i,j by a new group ij with population ny = n; + n.j:<br />
3. Four-Spin Systems<br />
(njL ik (20)<br />
Magnetization exchange in a symmetric fourspin<br />
system can be expressed in a relatively compact<br />
form. We have chosen two simple cases, which<br />
we label according to their magnetization exchange<br />
graphs: GP)qjtl represents a graph with p-nodes and<br />
q-lines; n is the index of the p,q graph if more than<br />
one such exists (38).<br />
A G^fi system comprises four nodes and six lines,<br />
i.e., four spins with six magnetization-exchange<br />
paths (Figure 3a). The symmetry of the system renders<br />
ki4 = k4i = k23 = k32,
Vol. 16, No. 1/2 81<br />
where<br />
an(rm) =<br />
L = (21)<br />
= O\2 + CT13 + ki4 (22)<br />
+exp[-2(ai2 + ki4)rm<br />
= ^ 11 - exp[-2(cr12 -f al3)rm]<br />
k14)r<br />
(23a)<br />
+exp[-2(
82<br />
Bulletin of Magnetic Resonance<br />
Figure 4: Four-spin system G^^<br />
a) Magnetization exchange network consisting of four nodes and three paths. Cross-relaxation rates oX2 =<br />
a 3 4 ~ a ' i • -j-i,<br />
b) Experimental example: ring protons of a partially deuterated rotating tyrosine ring in cross relaxation with<br />
two equally distant neighbors.<br />
c) Build-up curves according to eqns. 27a, 27b, and 27f, at different ratios a/k as indicated beside the curves;<br />
a22(Tm), a23(rm) - full lines; an(rm) - dashed lines. Since it is only remotely related to chemical exchange,<br />
an(rm) changes only slightly with a hundred-fold change in k.<br />
d) Build-up curves ai2(rm), ai3(Tm) (full lines) and ai4(rm) (dashed lines) according to eqns. 27c, 27d and 27e.<br />
With increases in either the chemical exchange rate constant or the mixing time, curves ai2(rm) and ai3(rm)<br />
converge toward their average value; ai4(rm) also rises but much more slowly since it is of second order with<br />
respect to cross-relaxation. Dotted lines represent linear combinations, according to eqns. 29a and 29b, that<br />
are invariant to chemical exchange.<br />
A second specialized four-spin system, G4]3i2, depicted<br />
in Fig. 4a, has two spin pairs with identical<br />
cross-relaxation rates (012 = C34 = a ) tnat are con "<br />
nected by a single chemical exchange path (k23 =<br />
k). The interaction of a rotating tyrosine ring with<br />
its neighbors can be approximated by such a system<br />
as is indicated in Fig. 4b. This system has been analyzed<br />
numerically (40). To get better insight into<br />
the interplay between the two processes, we present<br />
an analytical solution:
Vol. 16, No. 1/2 83<br />
The dynamic matrix is<br />
with solutions of the system<br />
where<br />
an (Tin) = a44(rm)<br />
a33(rm)<br />
a34(rm)<br />
ai3(rm)<br />
ai4(rm)<br />
a23(rm)<br />
A2 = -2cr<br />
A3j4 = -(a<br />
(26)<br />
1 + exp(A2rm) + (1 - - ) exp(A3rm) + (1 + - ) exp(A4rm)<br />
(<br />
k\ / k\<br />
1 + - exp(A3rm) + I 1 - -r I exp(A4rm)<br />
V) V & J<br />
1 - exp(A2rm) - -exp(A3rm) + -exp(A4rm)<br />
u u<br />
1 - exp(A2rm) + ^exp(A3rm) - -exp(A4rm)<br />
(28)<br />
Build-up curves, according to eqns. 27, are shown<br />
in Figure 4 c,d. As in the previous cases, an increase<br />
in the chemical exchange rate equalizes two<br />
unrelated processes. Here, when krm 3> 1, cross<br />
peak volumes ai2(rm) and ai3(rm) become very similar,<br />
although the respective cross-relaxation rates<br />
are quite different: a 12 = &, ^13 = 0. This is also<br />
evident from eqns. 27c and 27d, where the terms<br />
with A3 and A4 vanish when kr^ S> 1. Then,<br />
ai2(7"in) ~ a i3(r,^). As with the G46 system, the<br />
same linear combinations of cross-peak volumes are<br />
invariant with regard to chemical exchange due to<br />
the symmetry of the system:<br />
ai2(rm<br />
an(r<br />
a13(rm) = -<br />
ai4(rm) =<br />
- exp(-2crrm)<br />
+ exp(-2
84 Bulletin of Magnetic Resonance<br />
0k =<br />
(b)<br />
0k =<br />
024 + 034 0°+ 0 + 0+0° 00<br />
= = _<br />
0k<br />
n2=2<br />
014 + 024 + 023 °23 0°<br />
Figure 5: Reduction of the four-spin system G^^<br />
into a three- group and a two-group system by fast<br />
(chemical) exchange:<br />
a) Fast (chemical) exchange between spins 2 and 3<br />
equalizes magnetization in the respective sites and<br />
makes spins 2 and 3 equivalent in their exchange<br />
with surrounding spins, even if they have different<br />
individual exchange rates. Their own cross peaks<br />
are practically equal to the diagonal peaks, indicating<br />
that krm ^> 1. If the difference between the cross<br />
and the diagonal peaks is no larger than experimental<br />
error, then k cannot be determined. Spins 2 and<br />
3 behave like components of a group of two equivalent<br />
spins. Although they are distinct, fast chemical<br />
exchange makes them apparently equivalent; see<br />
eqn. 34. In the system G^^, symmetry makes spins<br />
1 and 3 equivalent, and the system reduces further<br />
to two groups of two equivalent spins.<br />
b) If fast (chemical) exchange equalizes spins (1, 2)<br />
and (3, 4) then eqns. 27 reduce directly to those for<br />
a system of two groups of two equivalent spins, as<br />
given by eqns. 10, where ni = n2 = 2 and L° = cr°/4.<br />
= Jim [a14(rm)] (33)<br />
Finding limits from eqns. 30-33 one obtains:<br />
a 12( r m) — a 23( T m) — ~^<br />
a k 3«) = 7<br />
+exp(-2a
Vol. 16, No. 1/2 85<br />
III. Internal Motions and Full<br />
Matrix Analysis<br />
Solution of the master equation, eqn. 1, yields<br />
the time dependence of various magnetization components<br />
(cross and diagonal peaks) which are also<br />
a function of exchange rate constants, eqn. 2. Full<br />
matrix analysis expresses exchange rate constants<br />
(matrix L) as a function of cross- and diagonal-peak<br />
volumes at a given mixing time. Since we are dealing<br />
with systems for which solutions of the master<br />
equation can be expressed explicitly in terms of exchange<br />
rate constants, we can also explicitly perform<br />
a full matrix analysis on them. For the sake of simplicity<br />
we restrict our analysis to four spin systems<br />
G4)6 and G4i3)2.<br />
From eqns. 23, one easily finds exchange rate constants<br />
in the G4i6 system:<br />
47V,<br />
•In (an + ai2 + a13 +<br />
! - ai3 - ai4)<br />
(an -<br />
(an - a12<br />
(an<br />
•In<br />
(an<br />
-a14)<br />
- ax4)<br />
111 ""12 **13 ~<br />
(an + ai2 — ai3 — aj4)<br />
(an - - ai4)<br />
ai4)<br />
(37a)<br />
(37b)<br />
Owing to the symmetry of the system (Fig 3a),<br />
similar expressions can be derived for other cross<br />
and diagonal peaks:<br />
k=l<br />
an — a22 = a33 = a44<br />
ai4 = a4x = a23 = a32<br />
a-12 = a 2i = a34 = a43<br />
a i3 = a3i = a24 = a42<br />
i = 1,2,3,4 (38)<br />
As far as the values
exchange rate constant. This comes from the fact<br />
that peak volumes a^ and ai4 (also ai2 and ai3)<br />
are added in eqn. 40a, contrary to eqn. 37b where<br />
they are subtracted. An increase in the chemical exchange<br />
rate constant changes their difference quickly<br />
(for k —> oo, (an—au) ~* 0) but does not influence<br />
their sum at all. The price for increased stability of<br />
the value for the cross-relaxation rate is paid by the<br />
loss of the individual values of
Figure 6: Part of the x-ray structure (43) of turkey<br />
ovomucoid third domain (0MTKY3) showing the<br />
Tyr 31 ring and its immediate neighbors. Ring protons<br />
1 H* 1 and iH* 2 (and also x H £l and X H £2 ) exchange<br />
magnetization by ring rotation about the<br />
C^-C 7 bond. Owing to close proximity, direct<br />
cross-relaxation can be observed among the protons<br />
(Tyr 31 1 H* 1 , Tyr 31 1 E El ), (Tyr 31 H 52 , Tyr 31<br />
(Ala 40 1 H^, Tyr 31 1 E sl ), and (Lys 29<br />
X H £2 ).<br />
rate constant shortens the useful mixing time range<br />
accordingly. Since a lower limit of the mixing time<br />
is predetermined by the existing signal-to-noise level<br />
(or peak volume error Aa), fast chemical exchange<br />
can render build-up rate analysis useless. Again,<br />
if build-up rate analysis is performed over suitably<br />
combined cross peaks, then a linear combination of<br />
the respective exchange rates can be obtained. In<br />
that case, the build-up curves are independent of<br />
the chemical exchange rate constant as can easily<br />
be derived from eqns. 18, 25, and 34.<br />
V. Experimental Examples<br />
As an experimental demonstration of the effects<br />
of fast chemical exchange on 2D exchange spectra<br />
and on the determination of cross-relaxation<br />
rates, we have chosen internal rotation of a tyrosine<br />
ring in turkey ovomucoid third domain (0MTKY3).<br />
The x-ray and NMR structures of the protein are<br />
known (43,44), and internal rotation of the Tyr 31<br />
ring is well documented (11,15). The relevant part<br />
of the 0MTKY3 x-ray structure (43) is shown in<br />
Figure 6. Tyrosine ring (Tyr 31 ) rotates around its<br />
C@ — C 7 bond with a rate which can be controlled<br />
by the sample temperature. In a 2D exchange spectrum,<br />
ring rotation generates cross-peaks (Tyr 31<br />
1 R S1 , Tyr 31 l E 62 ) and (Tyr 31 1 H el , Tyr 31 l E e2 ).<br />
Because of the proximity of residues Ala 40 and<br />
Lys 29 to the Tyr 31 ring, direct cross-relaxation peaks<br />
(Tyr 31 x H £l , Ala 40 l YiP) and (Tyr 31 1 W 2 , Lys 29<br />
*EP 2 ) can be observed as well. Also, cross relaxation<br />
peaks (Tyr 31 l E 6 \ Tyr 31 1 E El ) and (Tyr 31<br />
l E 62 , Tyr 31 1 W 2 ) are present. This simple picture<br />
(superposition of direct cross peaks) exists only at<br />
short mixing times and at temperatures low enough<br />
(T < 265K) to slow down the ring rotation so that<br />
k < a (Figure 7a). At higher temperatures, where<br />
k ^> a, fast chemical exchange gives rise to additional<br />
chemical-exchange-mediated spin-diffusion<br />
peaks (Figure 7b,c). For example, at T = 278 K<br />
(Figure 7c), cross peaks (Tyr 31 1 H E2 , Tyr 31 1 1T 51 ),<br />
and (Tyr 31 1 H e2 , Ala 40 1 H /3 ) are brought up by<br />
two-step magnetization transfer: Cross-relaxation<br />
+ chemical exchange (Tyr 31 X W 2 - a -> Tyr 31<br />
- k -> Tyr 31 l E 61 ) and (Tyr - k<br />
Tyr 31 x H £l - a -> Tyr 31 1 H (5i ). Since chemical exchange<br />
is the much faster process, two-step magnetization<br />
transfer mediated by chemical exchange<br />
could not be distinguished from a single-step process<br />
(cf. ai3(rm) in eqns. 14b and 16a). In eqn. 16a,<br />
due to fast chemical exchange, a^3(rm) has all the<br />
properties of a direct driven process, although 1^3<br />
= 0.<br />
In addition to creating new spin diffusion crosspeaks,<br />
fast chemical exchange also reduces the volumes<br />
of peaks originating from direct magnetization<br />
transfer. This reduction of peak volumes comes<br />
from the redistribution of magnetization by fast exchange.<br />
Instead of having one strong peak (direct<br />
exchange) and one weak peak (or no peak at all because<br />
of the absence of direct exchange) fast chemical<br />
exchange redistributes magnetization, creating<br />
two almost identical cross peaks with a total volume<br />
identical to the volume of the single peak in the absence<br />
of the exchange. For example, fast chemical<br />
r 31<br />
87
(a) T=265 K (b) T=273 K (c) T=278 K<br />
Y31 € 2 Y31 € 2 Y31 €1 Y31 € 2<br />
G)2 /ppm<br />
Bulletin of Magnetic Resonance<br />
Figure 7: Low temperature 2D exchange spectra of turkey ovomucoid third domain (0MTKY3) at 500 MHz:<br />
a) In 30% glycerol-d6/70% 2 H2O, pH* = 8.1, T = 265 K, rm = 20 ms; cr61e2/kel£2 « 2. The low temperature<br />
and short mixing time keep chemically-mediated spin diffusion low. One should notice the absence of cross<br />
peaks (A40^, Y31 e2 ) in accordance with their relatively long distance.<br />
b) OMTKY3 in 30% glycerol-d6/70% 2 H2O, pH* = 8.1, T = 273 K, rm = 50 ms; aSi,ei/Kie2 « 0.3. At this<br />
increased temperature the cross-relaxation rates are reduced (shortened correlation time) and the chemical<br />
exchange rate is increased. With the increase in the k/a ratio, indirect magnetization transfer becomes<br />
noticeable. Indirect cross-peaks (A40^, Y31 E2 ) and (Y31 51 , Y31 £2 ) are comparable to direct cross peaks<br />
(A40^, Y31 e2 ).<br />
c) OMTKY3 in 2 H2O, pH* = 8.1, T = 278 K, rm - 50 ms; a6iei/Kie2 ~ 0.1. Here chemical exchange is much<br />
faster than cross-relaxation and indirect transfer cross peaks are of the same intensity as the corresponding<br />
direct peaks. For example, indirect peak (Y31 51 , Y31 e2 ) is of the same intensity as the direct peak (Y31 52 ,<br />
Y31 e2 ).<br />
exchange (Tyr 31 1 H fil , Tyr 31 1 H 52 ) and (Tyr 31 1 H el ,<br />
Tyr 31 1 H e2 ) gives rise to peaks (Tyr 31 X H 61 , Tyr 31<br />
X H E2 ) and (Tyr 31 1 H 62 , Tyr 31 l R £l ) even if a61}£2 is<br />
negligibly small (a6he2 = • oo to the one half of the actual volume) may<br />
not be noticeable if a spectrum is inspected qualitatively.<br />
In a quantitative interpretation of 2D exchange<br />
spectra, however, the volume reduction can<br />
be easily observed. If not taken into account, it<br />
can lead to the apparent increase of the interproton<br />
distance derived from the (reduced) cross-peak<br />
volume. Although the distance increase is not very<br />
large (10% for a 50% volume reduction) it may be<br />
important, for example, if the distorted distance is<br />
used for calibration purposes. (Ring protons are<br />
suitable for distance calibrations since their geometry<br />
is fixed (r = 2.49 A) and because their chemical<br />
shifts often are well resolved). In the present example,<br />
fast chemical exchange (Tyr 31 1 H 61 , Tyr 31 1 H 52 )
Vol. 16, No. 1/2 89<br />
and (Tyr 31 1 H el , Tyr 31 1 H e2 ) reduces the volumes<br />
of peaks (Tyr 31 X H 51 , Tyr 31 1 H el ) and (Tyr 31 1 H 52 ,<br />
Tyr 31 1 H e2 ) which otherwise might be used for distance<br />
calibration. However, as indicated in eqn. 24,<br />
the sum of the cross-peaks [(Tyr 31 1 H e2 , Tyr 31 X H 52 )<br />
plus (Tyr 31 x H e2 , Tyr 31 1 E S1 )} does not depend on<br />
the exchange rate constant and may well serve the<br />
calibration purpose.<br />
The effects of fast chemical exchange can be best<br />
illustrated on experimental systems to which some<br />
of derived equations can be applied. Suitable threeand<br />
four-spin systems are seldom isolated as required<br />
by all the equations derived above. As a good<br />
approximation, one can take desired groups of three<br />
or four spins from a multispin system and treat their<br />
interaction with the spins outside the groups as "external"<br />
. Then these interactions and the real relaxation<br />
of the magnetization are taken into account<br />
by the hybrid relaxation rate, p*. The value of p*<br />
is determined empirically in the following manner.<br />
The sum of magnetization components of the spin<br />
at one site (diagonal and all cross peaks from that<br />
diagonal) is multiplied by exp (+/?*rm) at all mixing<br />
times. The p* value is chosen such that the total<br />
magnetization of the chosen spin does not change as<br />
a function of mixing time. Experimental data modified<br />
in this fashion are suitable for analysis by the<br />
equations derived in this paper.<br />
As a three-spin system we have chosen a group<br />
of protons Ala 40 1 E^- Tyr 31 iff 1 - Tyr 31 1 H e2 ;<br />
and, as a four-spin system, we have selected protons<br />
of the Tyr 31 ring:<br />
Their build-up curves and experimental peak volumes<br />
(multiplied by exp(+p*Tm) are shown in Figures<br />
8 and 9. All the parameters are given in the<br />
figure captions. No attempt has been made to fit<br />
experimental data to the analytical curves owing to<br />
the large scattering of the low-temperature data.<br />
However, all parameters common to the two systems<br />
(for example, the chemical exchange rate constants)<br />
are the same, except p*, which depends on<br />
the system itself as well as on the temperature. (In<br />
the four-spin system, spins Tyr 31 1 H 51 and 1 H 52 are<br />
internal, and in the three-spin system, they are external.<br />
Therefore, at the same temperature p* is not<br />
the same for the two systems).<br />
At low temperature, T = 265K, both systems<br />
(Fig. 8a, 9a) have distinct peak volumes for different<br />
processes. Chemical exchange is relatively slow<br />
so that direct and indirect cross peaks have different<br />
volumes. The systems, within the limits of experimental<br />
error, can be well described by either fullmatrix<br />
analysis or build-up analysis. At a higher<br />
temperature (T = 278K, Figs. 8b and 9b) chemical<br />
exchange is the dominant dynamic process. It<br />
effectively short-circuits the exchanging spin sites<br />
making them equivalent as seen from the surrounding<br />
spins. Thus, direct and indirect peaks (o\2 and<br />
CT13) become equal within experimental error. The<br />
individual cross-relaxation rates (a 12 and a\z) cannot<br />
be recovered. However, their arithmetic mean<br />
can be determined from the build-up curves of the<br />
combined peaks (ai2 + &i3)-<br />
VI. Conclusions<br />
We have used analytical descriptions of a few<br />
simple multispin systems to clarify general properties<br />
of multispin systems that are not obvious from<br />
a matrix treatment of the problem. For example,<br />
from consideration of the explicit expressions for exchange<br />
rate constants in different systems, eqns. 37,<br />
40 and 41, one can depict how full matrix analysis<br />
(FMA) works. As seen from these equations,<br />
in the FMA approach magnetization exchange rates<br />
are calculated from the logarithm of various combinations<br />
of cross- and diagonal-peak volumes. FMA<br />
fails if the argument of the logarithmic function is<br />
equal to or less than zero. In the ideal case, this<br />
happens only when the difference between peak volumes<br />
is close to the precision of the computer. In<br />
real cases, however, this condition occurs whenever<br />
the difference between peak volumes is close to or<br />
less than the error in experimental peak volumes.<br />
Since, during the mixing time, cross- and<br />
diagonal-peak volumes converge toward common<br />
values before decaying to zero by relaxation, this<br />
happens at increasing values of rm. At the other extreme,<br />
where rm is short, the diagonal peaks dominate;<br />
linear combinations of cross peak volumes are<br />
always positive; and FMA is stable. Further shortening<br />
of the mixing time makes second- and higherorder<br />
cross-peak volumes disappear and makes firstorder<br />
peaks become vanishingly small. Then the<br />
product in the argument of the logarithmic function<br />
tends to unity, and the function itself toward<br />
zero; here the logarithmic function can be safely replaced<br />
by its linear approximation, (ln(l+x) ft* x),
90 Bulletin of Magnetic Resonance<br />
T=265 K T=278 K<br />
1*<br />
0.9<br />
0.8<br />
0.7<br />
0.6<br />
0.5<br />
0.4<br />
0.3<br />
0.2<br />
0.1<br />
1 P<br />
oA40<br />
2 A n3<br />
a33 Y31 £1 Y31 £2<br />
ai3 .<br />
a-i2 '. J •<br />
! >£<br />
0.2 0.4<br />
Figure 8: Build-up curves for the three-spin system (Ala 40 1 H' 3 - Tyr 31 x H el - Tyr 31 1 H e2 ) of 0MTKY3 at<br />
two different temperatures. Solid lines are drawn according to eqns. 14a-14f. Dotted lines represents the sum,<br />
a i2( r m)+ a i3( T m)- The horizontal axis is set dimensionless by multiplying the mixing time by ag£. Then, all<br />
exchange processes are normalized to the cross-relaxation rate between the 1 H S and X H £ ring protons and can<br />
be compared irrespective of the temperature. Experimental points (cross-peak volumes) are multiplied by<br />
exp(+p*Tm) to take into account the fact that the observed spins are not isolated. The rate constant p* was<br />
chosen so as to make the sum of the cross and diagonal peaks independent of the mixing time, ^j aij = 1:<br />
+ -ai2(rm)<br />
° -ai3(rm),a33(rm)<br />
* - a23(rm).<br />
•- [ai2(rm) + ai3(rm)];<br />
since the sum is almost independent of k23, points from both temperatures are displayed along with the<br />
build-up curve.<br />
a) At T = 265 K in 30% glycerol-d6/70% 2 H2O; rm = 10,15,17,20 ms; aSe = 20<br />
10 s" 1 ; p* = 19 s" 1 = 6.7 s"<br />
; rc = 87 ns. Chemical exchange is relatively slow; ai2(rm)<br />
1 ; k23 =<br />
ai3(rm) indicates close<br />
proximity of the protons (Ala 40 1 H /3 , Tyr 31 1 H el ), but not that of (Ala 40 1 H /3 , Tyr 31 1 H e2 )<br />
b) At T = 278 K in 2 H2O; rm = 20,40,60 ms; aSe = 3 s" 1 ; a12 = 1 s" 1 ; k23 = 30 s" 1 ; p* = 5 s" 1 ; rc = 13<br />
ns. Fast chemical exchange mixes magnetization between sites 2 and 3 (Tyr 31 1 H el , Tyr 31 x H e2 ) so that their<br />
interactions with a third spin, 1, (Ala 40 X H^) appear almost identical. Cross peaks ai2(rm) and ai3(rm) have<br />
similar intensities. The first one is smaller than it would be in the absence of chemical exchange whereas the<br />
second one is larger. If chemical exchange is not taken into account, the similarity of their cross-peaks may<br />
lead to the erroneous conclusion that protons Tyr 31 x H el and Tyr 31 1 H e2 are at the same distance from Ala 40
Vol. 16, No. 1/2 91<br />
0.9<br />
0.8<br />
0.7<br />
0.6<br />
0.5<br />
0.4<br />
0.3<br />
0.2<br />
0.1<br />
(a) T=265 K T=278 K<br />
Figure 9: Build-up curves for the four-spin system, Tyr 31 ( 1 H
92 Bulletin of Magnetic Resonance<br />
stants are proportional to average errors in peak volumes<br />
and inversely proportional to the mixing time.<br />
In addition, the error is proportional to the sum of<br />
positive exponentials of the mixing time and all the<br />
exchange rate constants related to the observed spin<br />
(the constants for all exchange processes found on<br />
the same row and column of the exchange matrix).<br />
Whenever at least one exchange rate constant fulfills<br />
the condition, LijTm > 1, the respective exponential<br />
term may become dominant and the error<br />
increases exponentially with the mixing time. The<br />
larger the Ly term, the earlier the error starts to<br />
increase. Therefore, the largest element in the magnetization<br />
exchange network determines the upper<br />
limit to the mixing time. In addition, the largest exchange<br />
rate constant determines the error limit for<br />
all the other constants in the same network.<br />
At the other extreme, when rm —» 0, all exponential<br />
terms become independent of the actual exchange<br />
rate constants. Absolute errors in the exchange<br />
rate constants are proportional to errors in<br />
peak volumes and inversely proportional to the mixing<br />
time. Therefore, the lower limit of the mixing<br />
time is determined only by errors in peak volumes,<br />
i.e., by the background noise level. The important<br />
conclusion with regard to its application is that<br />
FMA can be utilized safely only in a range of mixing<br />
times longer than the lower limit imposed by experimental<br />
conditions (noise) and shorter than the<br />
upper limit imposed by the system itself (LyTm).<br />
Finally, comparison of eqns. 37 and 40 provides<br />
a clue as to how the influence of fast chemical exchange<br />
can be eliminated by linear combination of<br />
the corresponding cross and diagonal peaks. Fast<br />
chemical exchange tends to equalize the peak volumes<br />
of direct and indirect processes taking place<br />
among chemically exchanging spins and their surrounding<br />
spins. In the direct approach, the exchange<br />
rate constant is calculated from the difference<br />
in intensities of peaks that are equalized by<br />
fast chemical exchange. In the linear combination<br />
approach, however, peaks that are equalized by the<br />
fast exchange process are added. Since their sum<br />
is invariant to the chemical exchange rate they produce<br />
a good value for the average cross-relaxation<br />
rates irrespective of the rate of chemical exchange.<br />
In summary, by explicit calculations of magnetization<br />
exchange in two-, three-, and some fourspin<br />
systems, we have analyzed the influence of fast<br />
chemical exchange processes on strategies for determining<br />
cross-relaxation rates and have shown that<br />
in the extreme cases when even full matrix analysis<br />
cannot be performed, by suitable data manipulation,<br />
one can obtain average values of the crossrelaxation<br />
rates.<br />
VII. Acknowledgments<br />
This study was carried out at the National Magnetic<br />
Resonance Facility at Madison under support<br />
from NIH grants LM04958 and RR02301. Equipment<br />
in the Facility was purchased with funds from<br />
the University of Wisconsin, the NSF Biological<br />
Instrumentation Program (grant DMB-8415048),<br />
the NIH Biomedical Research Technology Program<br />
(grant RR02301), NIH Shared Instrumentation Program<br />
(grant RR02781), and the U. S. Department<br />
of Agriculture.<br />
The authors are thankful to Mr. V. Likic for help<br />
in calculations, Mr. C. G. Hoogstraten for critical<br />
reading and Ms. S. van Hook and Mrs. K. Ivanovic-<br />
Likic for careful preparation of the manuscript.<br />
VIII. References<br />
X B.H. Meier and R.R. Ernst, J. Am. Chem. Soc.<br />
101, 6441-6442 (1979).<br />
2<br />
J. Jeener, B.H. Meier, P. Bachmann and R.R.<br />
Ernst, J. Chem. Phys. 71, 4546-4553 (1979).<br />
3<br />
Ernst, R.R., Bodenhausen, G. and Wokaun, A.<br />
Principles of Nuclear Magnetic Resonance in One<br />
and Two Dimensions, New York: Oxford University<br />
Press, 1987.<br />
4<br />
R.R. Ernst, Angew. Chem. Int. Ed. Engl. 31,<br />
805-823 (1992).<br />
5<br />
Y. Huang, S. Macura and R.R. Ernst, J. Am.<br />
Chem. Soc. 103, 5327-5333 (1981).<br />
6<br />
A. Kumar, R.R. Ernst and K. Wiithrich,<br />
Biochem. Biophys. Res. Commun. 95, 1-6 (1980).<br />
7<br />
S. Macura and R.R. Ernst, Mol. Phys. 41, 95-<br />
117 (1980).<br />
8 D.G. Davis and A. Bax, J. Magn. Reson. 64,<br />
533-535 (1985).<br />
9 A.A. Bothner-By, R.L. Stephens, J. Lee, C.D.<br />
Warren and R.W. Jeanloz, J. Am. Chem. Soc. 106,<br />
811-813 (1984).<br />
10 A. Bax and D.G. Davis, J. Magn. Reson. 63,<br />
207-213 (1985).
Vol. 16, No. 1/2 93<br />
U<br />
J. Fejzo, W.M. Westler, S. Macura and J.L.<br />
Markley, J. Am. Chem. Soc. 112, 2574-2577<br />
(1990).<br />
12<br />
J. Fejzo, W.M. Westler, S. Macura and J.L.<br />
Markley, J. Magn. Reson. 92, 20-29 (1991).<br />
13<br />
J. Fejzo, W.M. Westler, S. Macura and J.L.<br />
Markley, /. Magn. Reson. 92, 195-202 (1991).<br />
14<br />
Wuthrich, K. NMR of Proteins and Nucleic<br />
Acids, New York: John Wiley & Sons, 1986.<br />
15<br />
j. Fejzo, A.M. Krezel, W.M. Westler, S.<br />
Macura and J.L. Markley, Biochemistry 30, 3807-<br />
3811 (1991).<br />
16<br />
S.B. Landy and B.D.N. Rao, J. Magn. Reson.<br />
83, 29-43 (1989).<br />
17<br />
S. Macura, W.M. Westler and J.L. Markley,<br />
Methods Enzymol. in press.<br />
18<br />
J.W. Keepers and T.L. James, J. Magn. Reson.<br />
57, 404-426 (1984).<br />
19<br />
C.B. Post, R.P. Meadows and D.G. Gorenstein,<br />
J. Am. Chem. Soc. 112, 6796-6803 (1990).<br />
20<br />
R.P. Meadows, K. Kaluarachchi, C.B. Post and<br />
D.G. Gorenstein, Bull. Magn. Reson. 14, 22-48<br />
(1191).<br />
21<br />
G.M. Clore, G.C.K. Roberts, A. Gronenborn,<br />
B. Birdsall and J. Feeney, J. Magn. Reson. 45,<br />
151-161 (1981).<br />
22<br />
G.M. Clore and A.M. Gronenborn, J. Magn.<br />
Reson. 48, 402-417 (1982).<br />
23<br />
S.B. Landy and B.D.N. Rao, J. Magn. Reson.<br />
81, 371-377 (1989).<br />
24<br />
W. Lee and N.R. Krishna, J. Magn. Reson.<br />
98, 36-48 (1992).<br />
25<br />
G.M. Lippens, C. Cerf and K. Hallenga, J.<br />
Magn. Reson. 99, 268-281 (1992).<br />
26<br />
N.R. Nirmala, G.M. Lippens and K. Hallenga,<br />
J. Magn. Reson. 100, 25-42 (1992).<br />
27<br />
I. Solomon, Phys. Rev. 99, 559-565 (1955).<br />
28<br />
T.L. James, E.-I. Suzuki, N. Pattabiraman and<br />
G. Zon, Bull. Magn. Reson. 8, 152-157 (1987).<br />
29<br />
B.A. Borgias and T.L. James, J. Magn. Reson.<br />
79, 493-512 (1988).<br />
30<br />
B.A. Borgias and T.L. James, J. Magn. Reson.<br />
87, 475-487 (1990).<br />
31<br />
R. Boelens, T.M.G. Koning and R. Kaptein, J.<br />
Mol. Struct. 173, 299-311 (1988).<br />
32<br />
R. Boelens, T.M.G. Koning, G.A. Van der<br />
Marel, J.H. Van Boom and R. Kaptein, J. Magn.<br />
Reson. 82, 290-308 (1989).<br />
33<br />
J.A.C. Rullmann, R.M.J.N. Lamerichs, C.<br />
Gonzalez, T.M.G. Koning, R. Boelens and R.<br />
Kaptein, Stud. Phys. Theor. Chem. 71, 703-710<br />
(1990).<br />
34<br />
G. Otting, E. Liepinsh, B.T. Farmer,II and K.<br />
Wiithrich, J. Biomolecular NMR 1, 209-215 (1991).<br />
35<br />
K. Wiithrich, G. Otting and E. Liepinsh, Faraday<br />
Discuss. 93, 35-45 (1992).<br />
36<br />
K. Wiithrich and G. Otting, Int. J. of Quan.<br />
Chem. 42, 1553-1561 (1993).<br />
37<br />
M.G. Kubinec and D.E. Wemmer, Current<br />
Opinion in Structural Biology 2, 828-831 (1992).<br />
38<br />
Harary, F. Graph Theory, Reading: Addison-<br />
Wesley, 1972.<br />
39<br />
B. Choe, G.W. Cook and N.R. Krishna, J.<br />
Magn. Reson. 94, 387-393 (1991).<br />
40<br />
Kaptein, R., Koning, T.M.G. and Boelens, R.<br />
in: Computational Aspects of the Study of Biological<br />
Macromolecules by Nuclear Magnetic Resonance<br />
Spectroscopy, edited by Hoch, J.C., Poulsen, F.M.<br />
and Redfield, C. New York: Plenum Press, 1991, p.<br />
349-359.<br />
41<br />
Bevington, P.R. Data Reduction and Error<br />
Analysis for the Physical Sciences, New York:<br />
McGraw-Hill, 1969.<br />
42<br />
S. Macura, J. Magn. Reson. submitted.<br />
43<br />
M. Fujinaga, A.R. Sielecki, R.J. Read, W.<br />
Ardelt, M. Laskowski, Jr. and M.N.G. James, J.<br />
Mol. Biol. 195, 397-418 (1987).<br />
44<br />
Krezel, A.M., Ph.D. Thesis; University of Wis-<br />
consin, Madison 1991.
94 Bulletin of Magnetic Resonance<br />
Contents<br />
The Homogeneous Master Equation and<br />
the Manipulation of Relaxation Networks 1<br />
Malcolm H. Levitt" and Lorenzo Di Bari 6<br />
a Physical Chemistry Division, Arrhenius Laboratory, Stockholm University, SI0691 Sweden<br />
b Dipartimento di Chimica, via Risorgimento 35, 1-56126 Pisa, Italy<br />
I. Introduction 94<br />
II. The Inhomogeneous Master Equation (IME) 95<br />
III. The Homogeneous Master Equation (HME) 97<br />
IV. Application A: vr pulses on the I-spins 98<br />
1. Dynamics in the gerade subspace 100<br />
2. Dynamics in the ungerade subspace 100<br />
V. Application B: n pulses on both I and S-spins 101<br />
1. Dynamics in the ungerade subspace 104<br />
2. Dynamics in the gerade subspace 104<br />
VI. Discussion 105<br />
VII. Acknowledgments 108<br />
VIII. Appendix A: The HME in the rotating frame 108<br />
IX. Appendix B: The thermal correction 0 109<br />
X. Appendix C: Continuous rf fields 110<br />
XI. Appendix D: Numerical calculations with the HME 111<br />
XII. Appendix E: The HME and phase cycling 111<br />
XIII. References 112<br />
I. Introduction<br />
Recently, we presented a novel method for calculating<br />
NMR spin dynamics (1). This involves a<br />
homogenous master equation (HME) and is particularly<br />
suitable for treating the interplay of incoherent<br />
relaxation processes and coherent effects such<br />
as those involving applied rf fields. The new theory<br />
1 Presented in part at 5th Chianti Workshop, San Miniato,<br />
Italy, May 1993.<br />
provides a unified framework within which a very<br />
wide range of magnetic resonance experiments may<br />
be described. A point of special interest is the treatment<br />
of the long-term behavior of the spin system,<br />
such as the steady-state established under extensive<br />
repetition of some pulse sequence. In reference<br />
(1), we demonstrated an unusual effect: If<br />
a two-spin system is exposed to a repetitive se-
Vol. 16, No. 1/2 95<br />
quence of non-selective IT pulses, correlations between<br />
the nuclear spin polarizations are gradually<br />
established even where none existed before. This<br />
is manifested as a build-up of two-spin longitudinal<br />
order < 2IZSZ >. The creation of two-spin order is<br />
the result of cross-correlated relaxation mechanisms,<br />
and is unconnected with the J-coupling between the<br />
spins. It runs counter to the naive expectation that<br />
a closely-spaced sequence of n pulses should saturate<br />
the spin system (destroying all order) if applied for<br />
long enough.<br />
In this article, we re-examine the HME and its<br />
consequences in a more physical and less formal<br />
light. We also emphasize another consequence of<br />
the HME: Carefully-chosen sequences of rf pulses<br />
may be used to simplify interconnected relaxation<br />
pathways. This is important in a number of situations<br />
(2-13): An example is the suppression of unwanted<br />
"spin diffusion" pathways in the relaxation<br />
of many-spin systems, as demonstrated by a number<br />
of groups (4,7-12). We show results here for<br />
the analogous problem of the selection of weak relaxation<br />
pathways driven by weak cross-correlation<br />
effects, in the presence of stronger autocorrelation<br />
effects. Although such experiments may also be<br />
treated within the framework of the ordinary master<br />
equation, we hope to demonstrate that the HME<br />
gives a more general and powerful insight.<br />
II. The Inhomogeneous Master<br />
Equation (IME)<br />
The ordinary "master equation" for the evolution<br />
of the spin density operator a has the following form:<br />
—a = - aeq) (1)<br />
The spin Hamiltonian Hcoh contains the "coherent"<br />
influences on the spin ensemble, i.e. those which are<br />
the same for all ensemble members. This includes<br />
external magnetic fields as well as the time-average<br />
of microscopic spin interactions such as chemical<br />
shifts and spin-spin couplings. The relaxation superoperator<br />
F encodes the incoherent interactions<br />
which are inhomogeneous over the spin ensemble<br />
and fluctuate in time. The master equation is valid<br />
in the "Redfield regime" of rapid fmctations (14)<br />
(assumed for the rest of this article). The elements<br />
of F can be written in terms of the spectral densities<br />
of the fluctuating incoherent interactions.<br />
The term aeq is of particular concern. It does<br />
not appear in the unmodified Redfield theory, which<br />
uses a clean division between spin system and environment,<br />
with the states of the environment or bath<br />
implicitly uncorrelated with the nuclear spin states.<br />
As is well-known, this approximation leads to disagreement<br />
with experiment, predicting that the nuclear<br />
spin order tends to zero at long times. In fact<br />
the nuclear spin system is polarized by the contact<br />
with the environment, which has a finite temperature.<br />
The master equation is patched up by including<br />
the phenomonological correction term ae
96<br />
(CHCI3). The X H spin will be denoted I and the 13 C<br />
spin 5. Each spin has a chemical shift anisotropy<br />
(CSA), and the two spins have a through-space magnetic<br />
dipole-dipole interaction (DD). Relaxation of<br />
the spin-pair system results from a combination of<br />
fluctuations in the three interactions WQSA' ^CSA<br />
and TipD (19-22). Since all have a molecular origin,<br />
all are modulated in synchrony as the molecule rotates,<br />
resulting in a finite cross-correlation between<br />
pairs of interactions (19,20,23-29). At any given<br />
time t, ensemble averages such as<br />
) (5)<br />
do not vanish in general. The relaxation of the spin<br />
system is characterized by autocorrelation functions<br />
of the individual interactions, for example<br />
D(0) (6)<br />
and cross-correlation functions between pairs of interactions,<br />
for example<br />
») CO<br />
In the absence of applied rf fields, the IME leads<br />
to three coupled differential equations for the singlespin<br />
Zeeman polarizations :<br />
A<br />
-\ A<br />
at » A<br />
aIS - / A<br />
A<br />
-prs J \ A<br />
(8)'<br />
where A< fi > indicates the deviation of the expectation<br />
value of a spin operator Q from its thermal<br />
equilibrium value:<br />
- eq<br />
f2} - Tr{creqO} . (9)<br />
These are known as the extended Solomon equations<br />
(20,27,29); explicit expressions for the equilibration<br />
rate constants pj, ps, pis, the cross-relaxation rate<br />
constant pis, and the CSA/DD cross-correlation<br />
transfer rate constants 6j and 63 can be found, for<br />
example, in ref.(29).<br />
This equation indicates a dynamic coupling of<br />
the expectation values of the three Cartesian product<br />
operators Iz, Sz and 2IZSZ. The system may<br />
be pictured as three coupled "reservoirs," each containing<br />
"difference order" (deviation of the expectation<br />
value from thermal equilibrium). The difference<br />
reservoirs "leak" with rate constants pi, ps<br />
Bulletin of Magnetic Resonance<br />
Figure 1: Physical interpretation of the extended<br />
Solomon equations for a heteronuclear 2-spin system<br />
Eqn. 8. The deviations from thermal equilibrium of<br />
the expectation values of the three spin operators<br />
form a set of coupled reservoirs.<br />
and pis, and are connected by "pipes" corresponding<br />
to the cross-relaxation rate constants 075, Si<br />
and 8s (Figure 1). This picture should, however, be<br />
used cautiously: The "liquid" in each reservoir may<br />
have either sign, and the cross-relaxation rate constants<br />
may be negative, indicating that the "liquid"<br />
is changed in sign on transferring from one reservoir<br />
to another.<br />
Nevertheless, the "reservoir" picture does give<br />
a clear image of the dynamic interdependence of<br />
the three expectation values. By a careful study<br />
of the trajectories of all three expectation values after<br />
some initial perturbation, it is possible in principle<br />
to derive all the various rate constants (20).<br />
However, this is not very accurate for small rate<br />
constants, which have only a minor influence on the<br />
dynamics of the system. This problem is of course<br />
much worse for larger spin systems, where the interconnections<br />
between the expectation values are<br />
more complex still.<br />
The measurement of small rate constants (for example,<br />
the 6 terms in the above system), would be<br />
facilitated if the relaxation dynamics could be simplified,<br />
isolating selected "subnetworks." It is nat-
Vol. 16, No. 1/2 97<br />
ural to try to accomplish this using rf pulse sequences.<br />
Analogous techniques are well-established<br />
for the simplification of spin Hamiltonians. For example,<br />
in decoupling experiments, large couplings<br />
between different spin species are effectively removed<br />
by applying a suitably modulated rf field to<br />
one of the species (30-33): small interactions of the<br />
non-irradiated spins are revealed even in the presence<br />
of much larger heteronuclear spin couplings.<br />
The problem of observing weak relaxation processes<br />
in the presence of stronger ones seems related.<br />
There is, however, a theoretical difficulty in describing<br />
experiments in which rf pulses (coherent<br />
perturbations) interfere with relaxation networks<br />
(incoherent processes). In the inhomogeneous master<br />
equation, the rf fields act on the full spin density<br />
operator a, while the relaxation applies to the<br />
difference from thermal equilibrium a — aeq. It is<br />
not obvious how to mix these two worlds. In the<br />
framework of the IME, it is difficult to construct an<br />
average Liouvillian analogous to the average Hamiltonian<br />
(30-35) so successful in treating the coherent<br />
response.<br />
III. The Homogeneous Master<br />
Equation (HME)<br />
The awkward aeq term is avoided by using a<br />
homogeneous master equation (HME). This was<br />
first suggested by Jeener (36). A slightly different<br />
derivation, and some interesting applications, were<br />
sketched in (1). In this article we will concentrate<br />
on the consequences of the HME.<br />
The rotating-frame HME (see Appendix A) has<br />
the form<br />
—a = -i[HCoh, cr] + To- ,<br />
at<br />
(10)<br />
where the thermally-corrected relaxation superoperator<br />
T is given by<br />
T=f+0, (11)<br />
and Ti-coh ls the ordinary rotating-frame Hamiltonian.<br />
Instead of including aeq, the ordinary relaxation<br />
superoperator F is adjusted by adding a "thermal<br />
correction" ©. Eqn. 10 has the mathematical<br />
form of a homogeneous first-order differential equation.<br />
This is best illustrated by example. The HME<br />
for the relaxing 2-spin system, in the absence of rf<br />
fields, looks like<br />
0 0 0<br />
Qi —pi — a is —Si<br />
0s -vis -Ps -6s<br />
'is SI - of this operator represents<br />
the amount of spin disorder. The other expectation<br />
values < Iz > ... are much smaller by a<br />
factor ~ LJJTQ (assuming ordinary thermal nuclear<br />
spin polarization). Nevertheless, all interesting experimental<br />
observations are associated with these<br />
small quantities.<br />
Since the top row of the new relaxation matrix<br />
contains only zeros, < |1 > remains constant independent<br />
of the other expectation values. From<br />
Eqn. 4, the constant value is<br />
(14)<br />
The dynamic independence of < ^ 1 > is an approximation<br />
valid for weak spin polarization. In addition,<br />
Eqn. 11 assumes a high nuclear spin temperature,<br />
and the expressions for the elements of © (Eqn. 13)<br />
assume that the interaction with the static field is<br />
much larger than the other spin interactions (strong<br />
field limit). These approximations are discussed in<br />
Appendix B and are well-satisfied under ordinary<br />
circumstances.<br />
The eigenvalues of T are the same as F, although<br />
the eigenvectors are different. This means that the<br />
thermal correction terms do not change the characteristic<br />
relaxation rates, only the position of the<br />
eventual equilibrium.<br />
In Appendix B, it is shown that the elements of<br />
© in Eqn. 13 may be written down by the following<br />
procedure:
98 Bulletin of Magnetic Resonance<br />
1. Write down the usual Redfield relaxation matrix<br />
in a basis of Cartesian product operators<br />
(in the above case, this corresponds to the extended<br />
Solomon equations).<br />
2. For columns corresponding to the Zeeman polarization<br />
< Ijz > of the spin Ij, multiply all<br />
elements by the factor ^LU<strong>^T</strong>Q, where LO°- is the<br />
Larmor frequency of spin Ij.<br />
3. Multiply columns .corresponding to other polarizations<br />
(such as < 2IjzIkz > ... < Ijx > ...)<br />
by zero.<br />
4. Sum the elements in each row to get the corresponding<br />
element of O.<br />
For example, in the current case, the second row<br />
of the Solomon matrix reads<br />
<br />
<br />
-ps<br />
(15)<br />
After multiplying by the appropriate factors, we get<br />
<br />
\ -l \psu o sTd 0 (16)<br />
Summing the row gives the correct thermal correction<br />
(17)<br />
This procedure is general for spin-1/2 systems<br />
within the approximations mentioned above.<br />
A pictorial representation of Eqn. 12 is shown in<br />
Figure 2. The relaxation dynamics appears as a unidirectional<br />
flow from left to right in the picture. The<br />
physical significance of this "flow" is as follows: The<br />
three "reservoirs" enclosed by a dotted line contain<br />
the "spin order," which can be redistributed internally<br />
by the a and 6 terms. The object on the left<br />
contains the large < ^1 > term, i.e. the disorder<br />
of the spin system. The three arrows labelled #/,<br />
6s and Qi$ indicate the conversion of spin disorder<br />
into spin order, i.e. a decrease in spin entropy due<br />
to the polarizing influence of the finite-temperature<br />
molecular environment. These three terms therefore<br />
take into account the spin-bath correlations. The<br />
three wiggly arrows marked pi, ps and pjs indicate<br />
the dissipation of spin order, i.e. the creation of<br />
spin entropy. These arrows do not need to "go anywhere"<br />
: The destruction of order is an irreversible<br />
process which need not be balanced out somewhere<br />
else. Figure 2 is an authentic representation of the<br />
spin system as an open system, acting as a channel<br />
for the creation of entropy in the universe. Thermal<br />
equilibrium is established when the expectation values<br />
, and < 2IZSZ > have values such<br />
that a steady flow is maintained, and as much spin<br />
entropy is created as is destroyed.<br />
IV. Application A: IT pulses on<br />
the I-spins<br />
So far the HME does not appear to be much of a<br />
simplification. Its power is only revealed when relaxation<br />
and pulses are mixed together. Since the HME<br />
relaxation superoperator T applies to the complete<br />
spin density operator, not just to the deviation from<br />
thermal equilibrium, pulse superoperators and relaxation<br />
superoperators may be combined at will.<br />
The interaction between them may be elucidated<br />
using well-known techniques.<br />
As an example, consider a sequence of evenlyspaced<br />
strong n pulses, separated by an interval r/2,<br />
applied to the I-spins. The relevant pulse sequence<br />
segment<br />
T<br />
-<br />
T<br />
7T, - •£<br />
(18)<br />
has total duration r.<br />
If each iK pulse is short and ideal, it transforms<br />
the four spin operators as follows:<br />
1<br />
Sz<br />
2IZSZ<br />
1<br />
-I*<br />
(19)<br />
These equations refer to transformation properties<br />
such as<br />
exp{-mlx}lz<br />
(20)
Vol. 16, No. 1/2 99<br />
Figure 2: Physical interpretation of the HME for the 2-spin system Eqn. 12. The expectation values of the<br />
four spin operators |1, Iz, Sz and 2IZSZ constitute reservoirs. The three terms #/, 6 s and 9is represent the<br />
creation of spin order by polarization from the environment.<br />
In superoperator form, the pulse can be written<br />
11/=<br />
'I<br />
-1/<br />
\<br />
(21)<br />
The four spin operators are classified according to<br />
their parity under 11/: The two operators |1 and<br />
Sz are unchanged in sign under ft/, and are termed<br />
gerade. The two operators Iz and 2IZSZ are changed<br />
in sign, and are termed ungerade.<br />
In the absence of rf fields, the evolution of the<br />
spin density operator from time to to time t\ is given<br />
by<br />
= exp{(ti - t0) T}cr(t0) (22)<br />
It follows that the evolution of the density operator<br />
over the entire sequence CA can be written<br />
where<br />
= CAa(t0) (23)<br />
CA = exp{T ~T} 11/ exp{f ^ ft/ exp{f U<br />
(24)<br />
This corresponds to<br />
where<br />
CA = exp{f ~T} exp{f 'K) exp{f K] (25)<br />
f' = ft/f ft/ . (26)<br />
The matrix representation of the transformed superoperator<br />
T' is the same as that of T, except that<br />
elements connecting operators of opposite parity are<br />
changed in sign:<br />
f' =<br />
0<br />
-0i<br />
0s<br />
•Ois<br />
0<br />
-Pi<br />
O~IS<br />
-Si<br />
0<br />
CIS<br />
-ps<br />
Ss<br />
0 ><br />
-Si<br />
Ss<br />
-Pis)<br />
(27)<br />
It is convenient (but not essential) to take the<br />
limit of a cycle duration r short compared to the<br />
relaxation time constants. An approximation to<br />
Eqn. 25 is then:<br />
(28)<br />
(This is equivalent to taking the first term in a Magnus<br />
expansion of the interaction frame Liouvillian;
100 Bulletin of Magnetic Resonance<br />
by symmetry, the second term in the Magnus expansion<br />
vanishes (30-35)). The propagator for the entire<br />
sequence, including both relaxation and pulses,<br />
is therefore<br />
^ exp{TAr} , (29)<br />
where the effective relaxation superoperator TA has<br />
a matrix representation<br />
0<br />
0<br />
0<br />
0<br />
-pi<br />
0<br />
-Si<br />
0<br />
0<br />
-Ps<br />
0<br />
0<br />
-Si<br />
0<br />
-pis<br />
(30)<br />
Thus, for rapid pulsing, the system separates dynamically<br />
into independent gerade and ungerade<br />
subspaces:<br />
with<br />
and<br />
TA = f 9 A<br />
(31)<br />
(32)<br />
(33)<br />
This is shown visually in Figure 3.<br />
We now consider individually the dynamics in<br />
the two subspaces.<br />
1. Dynamics in the gerade subspace<br />
The dynamics in the gerade subspace are very<br />
simple. The expectation value < Sz> is polarized<br />
at the constant rate 9 s < |1 > and dissipates at<br />
the rate ps < Sz >. There is a single exponential<br />
approach to a steady-state value of S-spin polarization.<br />
If pulse cycles are CA are repeated one after<br />
the other, the value of S-spin polarization after N<br />
repetitions is<br />
(NT)= SS<br />
+ (0 - SS ) exp{-psNr}<br />
(34)<br />
where the initial S-spin polarization is < Sz >o and<br />
its steady-state value is<br />
This evaluates to<br />
«=li!^ = iL. (35)<br />
< 5. > ec i<br />
PS<br />
= 1 +<br />
using the thermal equilibrium expectation value<br />
(36)<br />
< Sz > ef *= Tr{aeqSz } = - \ (37)<br />
4<br />
Eqn. 36 describes the steady-state nuclear Overhauser<br />
enhancement of the S-spin magnetization on<br />
applying radio-frequency fields to the I-spin (22,37).<br />
Although this effect is well-known, its interpretation<br />
in the HME formalism is unusual and revealing.<br />
The NOE arises because the rf fields are able<br />
to stem the leakage of S-spin polarization into the Ispin-order<br />
and two-spin-order terms. The applied<br />
fields merely turn off unwanted relaxation pathways,<br />
allowing a build-up of S-spin order under the<br />
favourable $s term.<br />
2. Dynamics in the ungerade subspace<br />
The dynamics in the ungerade subspace are also<br />
of interest. The central feature is that transfer of order<br />
takes place between I-spin Zeeman polarization<br />
and 2-spin order within a dynamically<br />
simple two-dimensional subsystem. The weak<br />
cross-correlation pathway connecting the two terms<br />
is isolated, allowing a more accurate experimental<br />
measurement.<br />
We have examined dynamic isolation of the<br />
cross-correlation pathway using the pulse sequences<br />
shown in Figure 4. The sequence in Figure 4a is<br />
used to examine the unmanipulated transfer of order<br />
from < Iz> into < Sz> and < 2IZSZ >. Initial<br />
thermal equilibrium is disturbed by two TT/2 pulses<br />
applied to the I-spins, which can have different relative<br />
phases. After a time T, a TT/2 pulse is applied<br />
to the S-spins and the signal detected. Signal from<br />
experiments in which the two I-spin TT/2 pulses have<br />
the same phase are subtracted from those in which<br />
the two I-spin 7r/2 pulses have opposite phase. As<br />
discussed in Appendix E, thermal polarization effects<br />
in the subsequent evolution may then be ignored.<br />
The contributions to < Sz> and < 2IZSZ >
Vol. 16, No. 1/2 101<br />
Figure 3: Relaxation dynamics in the presence of rapid vr pulses on the I-spins. The effective relaxation superoperator<br />
is factored into a gerade subspace \,\ and an ungerade subspace {, }.<br />
through cross-relaxation from < Iz > over the interval<br />
r are deduced by Fourier transforming the<br />
signal and manipulating the intensities of the two<br />
lines in the J-coupled multiplet in the usual way<br />
(38,39). The experiment is repeated for a range of<br />
cross-relaxation intervals r.<br />
The r-dependence of < Sz > and < 2IZSZ ><br />
are shown in Figure 5a. The predominant process,<br />
as expected, is the rapid creation of < Sz ><br />
under the dominant autocorrelation ajs pathway.<br />
< Sz > is negative since the cross-relaxation rate<br />
constant ajs is positive for this small molecule.<br />
< 2IZSZ > is also created, but in this experiment<br />
it is not easy to tell how much of this is due to direct<br />
< Iz >—>< 2IZSZ > transfer and how much to a<br />
two-step process —>—>.<br />
With one n pulse on the I-spins in the middle of<br />
the mixing time (Figure 4b), the < Iz >—>< Sz ><br />
transfer is greatly suppressed (Figure 5b). The<br />
< Iz >—>< 2IZSZ > transfer is also attenuated at<br />
long times, indicating the removal of two-step contributions<br />
(the change in sign on the right-hand side<br />
of Figure 5b is due to the inverting effect of the single<br />
TT pulse on the ungerade spin operators).<br />
By placing two n pulses at times r/4 and 3r/4,<br />
the autocorrelation pathway — j > is elim-<br />
inated and the observed polarization of < 2IZSZ ><br />
can be attributed to an essentially uncontaminated<br />
6j cross-correlation term. The r-dependences of<br />
< 2IZSZ > in Figure 5(b,c) are essentially mirrorimages,<br />
indicating that pulse imperfections are negligible.<br />
In Figure 6 we show the difference between<br />
the curves in Figure 5a and Figure 5c on<br />
an expanded scale. This curve indicates the influence<br />
of multiple-step transfers in the unmanipulated<br />
experiment. Although in principle the derivative of<br />
the curve is zero at r = 0, the steep rise would make<br />
an "initial rate" analysis problematic.<br />
The transfer curves could be analyzed to obtain<br />
the value 6j = —1.65 x 10~ 2 s" 1 . We have strong evidence<br />
(not discussed here) that this result is more<br />
accurate than that obtained from a previous dynamical<br />
analysis of the full relaxation network, performed<br />
with the aid of two-dimensional spectroscopy<br />
(28).<br />
V. Application B: ir pulses on<br />
both I and S-spins<br />
Interesting results are also obtained if the HME<br />
is used to analyze an experiment in which simulta-
102<br />
b<br />
T/2 T/2<br />
II<br />
1<br />
T/4 T/2 T/4<br />
1<br />
Bulletin of Magnetic Resonance<br />
Figure 4: Pulse sequence for exploring the dynamics in the ungerade subspace. The experiments begin with<br />
two phase-cycled TT/2 pulses on the I-spins: These select the contribution from initial polarization at the<br />
beginning of the mixing period r. A TT/2 pulse on the S-spins at the end of r and observation of the J-coupled<br />
multiplet allows detection of cross-relaxed < Sz > and < 2IZSZ > at the end of r. (a) No manipulations of the<br />
relaxation network, (b) One I-spin vr pulse at the centre of r (c) Two I-spin vr pulses at r/4 and 3r/4. The<br />
relative pulse lengths are greatly exaggerated with respect to the delays. In practice, composite TT pulses were<br />
used.<br />
neous (or nearly simultaneous) vr pulses are applied<br />
to both I- and S-spin species. The relevant pulse<br />
sequence is<br />
T T T<br />
CB = - - 7T/7TS - - - 7T/7TS - - (38)<br />
which again has a total duration r.<br />
The operators are re-classified according to their<br />
parity under the two TT rotations:<br />
sz<br />
2IZSZ<br />
~sz<br />
(39)<br />
indicating transformation properties such as<br />
exp{-i7r (Ix + SX)}2IZSZ expjivr (Ix + Sx)} = 2IZSZ.<br />
(40)<br />
The simultaneous TT pulse pair can therefore be represented<br />
by a rotating-frame superoperator<br />
/I<br />
-1<br />
-1<br />
1/<br />
(41)<br />
This time both one-spin Zeeman operators Iz and<br />
Sz are ungerade, while the two-spin-order operator<br />
2IZSZ and the normalized unit operator |1 are gerade.
Vol. 16, No. 1/2 103<br />
< 2lzSz ><br />
T/S<br />
Figure 5: Experimental results for 13 C-labelled chloroform at a proton frequency of 200 MHz. Rows a, b<br />
and c correspond to the experiments in Figure 4. Left column: Cross-relaxed . Right column: Crossrelaxed<br />
< 2IZSZ >. Vertical axes normalized to < Sz > eq . Note the different scales. In c, the suppression of<br />
cross-relaxed indicates the isolation of the ungerade subspace.<br />
shown in Figure 5a and Figure 5c, on an<br />
expanded scale. The solid line has no theoretical significance. The curve has zero derivative at r = 0, but<br />
rises steeply.
104 Bulletin of Magnetic Resonance<br />
If the arguments given above are repeated, we<br />
get an overall superoperator for the pulse sequence<br />
= exp{Tsr} , (42)<br />
where the effective relaxation superoperator, as<br />
modified by the rf fields, is<br />
tB = f % + f B . (43)<br />
The matrix representations of the gerade and ungerade<br />
subspace relaxation superoperators are<br />
and<br />
T u R —<br />
0 0 0 0<br />
0 0 0 0<br />
0 0 0 0<br />
Jis 0 0 -PIS,<br />
0<br />
-pi<br />
0<br />
0 0\<br />
-vis 0<br />
-ps 0<br />
0 0/<br />
A visual representation is shown in Figure 7.<br />
1. Dynamics in the ungerade subspace<br />
(44)<br />
(45)<br />
The dynamics in the ungerade subspace are, as<br />
before, purely dissipative: order is transferred from<br />
< Iz > to < Sz > with the autocorrelation crossrelaxation<br />
rate constant cris, accompanied by dissipation<br />
of the Zeeman orders with rate constants<br />
pi and ps- This describes a normal transient nuclear<br />
Overhauser effect experiment (20), with the<br />
minor difference that the participation of crosscorrelation<br />
pathways is eliminated. This experiment<br />
could therefore be used to avoid potential errors<br />
in distance estimation due to non-negligible crosscorrelation<br />
effects (40,41), as demonstrated elsewhere<br />
(42). The method is analogous to the suppression<br />
of cross-correlation effects in measurements<br />
of relaxation time constants (3,43).<br />
2. Dynamics in the gerade subspace<br />
The gerade subspace in this experiment throws<br />
up a real surprise. It is naively expected that longterm<br />
irradiation by non-selective vr pulses should<br />
saturate the spin system, equalizing all populations<br />
and destroying all spin order. The HME analysis<br />
shows that on the contrary a dense sequence of nonselective<br />
7T pulses polarizes the multiple-spin-order<br />
terms, providing the relaxation mechanisms display<br />
suitable cross-correlation (1). By repeating the arguments<br />
used in the previous section, a steady-state<br />
of 2-spin-order can be predicted:<br />
(46)<br />
sz<br />
It should be emphasized that the vr pulses do<br />
not merely preserve any existing two-spin order, but<br />
establish the conditions for its creation. Two-spin<br />
order develops even when the ir pulses are applied<br />
to a spin system which is totally saturated.<br />
The effect is demonstrated by the sequence<br />
shown in Figure 8a. N repetitions of the cycle<br />
CB (Eqn. 38) are applied to the 13 C- 1 H system,<br />
starting from thermal equilibrium. The total irradiation<br />
time is T — NT. Composite n pulses<br />
(TT/2)Q (2vr)27r/3 (vr/2)0 were used throughout in order<br />
to reduce pulse imperfections (44). At the end<br />
of the long vr pulse train, a TT/2 pulse was applied to<br />
either the I-spins or the S-spins, and the free induction<br />
decays recorded. Fourier transformation gives<br />
J-coupled doublets in the I-spin or S-spin spectra,<br />
from which the values of < Iz > (T), < Sz > (T)<br />
and < 2IZSZ > (T) may be extracted (20,38,39).<br />
The trajectories of the three expectation values under<br />
the TT pulse train are shown in Figure 9. As<br />
expected, the one-spin Zeeman orders < Iz > and<br />
< Sz > saturate under the n pulse sequence, while<br />
negative two-spin-order grows in, eventually attaining<br />
a steady state of around —18% of the thermal<br />
equilibrium S-spin Zeeman polarization. The magnitude<br />
of the steady-state agrees quantitatively with<br />
the cross-correlation rate constants derived by the<br />
experiment in the previous section.<br />
It is also possible to demonstrate this effect in<br />
homonuclear spin systems, using the pulse sequence<br />
shown in Figure 8b. Strong non-selective TT pulses<br />
are used, affecting all spins in the sample. At the<br />
end of the TT pulse train, a strong vr/4 pulse is applied<br />
and the spectrum recorded. (A TT/2 pulse<br />
would be unsuitable, since two-spin order would<br />
be completely converted into unobservable multiplequantum<br />
coherence). The TT/4 pulse partially converts<br />
two-spin Zeeman order into observable singlequantum<br />
coherence, with the lines appearing in a<br />
characteristic antiphase pattern.
Vol. 16, No. 1/2<br />
\<br />
J<br />
r IS<br />
Figure 7: Relaxation dynamics in the presence of rapid ir pulses on both I and S-spins. The effective relaxation<br />
superoperator is factored into a gerade subspace j,\ and an ungerade subspace<br />
{}<br />
Figure 10 shows a series of experimental X H spectra<br />
for a sample of exifone,<br />
HO 9 H<br />
a system already used by the Lausanne group for<br />
studying cross-correlation effects (45). The normal<br />
X H spectrum (lowest plot) shows a four-line AX pattern<br />
from the ortho and meta protons on one of the<br />
aromatic rings and a strong singlet from the two<br />
equivalent ortho protons on the other ring. When a<br />
long series of vr pulses is applied, the singlet gradually<br />
saturates, while the four AX lines eventually<br />
assume an antiphase character. The topmost spectrum<br />
is in the steady-state, after the application of<br />
many hundreds of vr pulses. The two-spin order is<br />
105<br />
small but certainly not negligible. We report elsewhere<br />
a quantitative analysis at a set of different<br />
magnetic fields, including a treatment of pulse imperfections.<br />
These results indicate that the steadystate<br />
provides a reliable estimate of CSA-DD crosscorrelation,<br />
possibly superior to the usual methods.<br />
Burghardt et al. (46) previously observed<br />
steady-state two-spin order effects in simulations of<br />
synchronous nutation experiments (5,6) using the<br />
conventional master equation.<br />
VI. Discussion<br />
In the above discussion, the HME was written<br />
implicitly in the rotating reference frame. The use<br />
of the rotating frame in the context of the HME,<br />
and spin-lattice relaxation in general, is discussed<br />
in Appendix A.<br />
The theory of the thermal correction to the relaxation<br />
superoperator is given in Appendix B.<br />
The above treatment was restricted to situations<br />
in which the rf fields implemented perfect, short,<br />
7T pulses. The treatment could then be restricted<br />
to a small Liouville subspace, making for a simple<br />
physical situation amenable to physical insight.
106<br />
1 VW////W/A<br />
V//////////M<br />
T=Nx<br />
71/4<br />
Bulletin of Magnetic Resonance<br />
Figure 8: Pulse sequences for exploring steady-state effects in the gerade subspace, in the presence of nonselective<br />
7T pulses, (a) Heteronuclear experiment. 2N simultaneous TT pulses are applied over a time T = NT.<br />
A TT/2 pulse on one of the spin species generates the signal, (b) Homonuclear experiment. 2N non-selective vr<br />
pulses are applied over a time T = NT before a TT/4 pulse is used to convert the polarizations into observable<br />
signals.<br />
0.4<br />
o<br />
o<br />
< ^ 0 JL T « QiO<br />
> A<br />
Z > *<br />
A A<br />
Figure 9: Experimental results for 13 C-labelled chloroform at a proton frequency of 200 MHz, using the<br />
experimental sequence in Figure 8a. Composite vr pulses were actually used. The cycle period was r = 200 ms.<br />
The horizontal axis is the total irradiation time T. The vertical axis is normalized to < Sz > eq . Note the<br />
build-up of .
Vol. 16, No. 1/2 107<br />
Figure 10: Experimental 1 H spectra for exifone at a frequency of 300 MHz, using the sequence in Figure 8b.<br />
The cycle period was r = 50 ms.<br />
Another simple case is when frequency-selective<br />
vr pulses are used. Providing the pulses operate perfectly,<br />
and relaxation during the pulse is neglected,<br />
the spin operators may be classified as ungerade or<br />
gerade with respect to the selective spin inversions.<br />
There is considerable freedom in the classification<br />
of the operators, limited only by the ease of experimental<br />
implementation on the required timescale.<br />
The interposition of selective ?r pulses in the mixing<br />
period can therefore be used to restrict relaxation to<br />
an almost freely-chosen group of one-spin or multispin<br />
operators. For example, cross-relaxation pathways<br />
involving spins falling in a given spectral range<br />
may be suppressed (10), or cross-relaxation may only<br />
be allowed between spins falling within two freelychosen<br />
spectral ranges (4,12).<br />
Similar results may also be obtained using continuous<br />
rf fields, rather than selective n pulses (5-<br />
8). Such experiments are also amenable to HME<br />
analysis, although a larger Liouville subspace of orthogonal<br />
spin operators must be used. This involves<br />
no particular difficulties, although calculations can<br />
become cumbersome. A simple example is given in<br />
Appendix C.<br />
The HME is well-suited for numerical simulation<br />
(47). It provides an attractive alternative to<br />
the methods developed by Ravikumar et al. (48),<br />
who took into account thermal polarization effects<br />
in a different way. Their method involves a separate<br />
estimation of the steady-state during each element<br />
of the pulse sequence, using the conventional master<br />
equation. In contrast, HME calculations simply<br />
require the usual numerical diagonalization of the<br />
matrix representation of T. The asymmetry of the<br />
matrix representation involves no special problems.<br />
A short cut is available for periods where rf fields<br />
are absent, as discussed in Appendix D.<br />
Griesinger et al. (49) developed a technique<br />
known as "invariant trajectories" to analyze the averaging<br />
of relaxation rates under general multiplepulse<br />
trains. The same results follow from a<br />
straightforward HME calculation in the interaction<br />
frame, followed by the average Liouvillian approximation.<br />
Such calculations are useful for deriving<br />
"average relaxation rates" in the presence of rf fields,<br />
for example in the manipulation of spin diffusion
108 Bulletin of Magnetic Resonance<br />
(4,7-12). The HME includes thermal polarization<br />
and nuclear Overhauser effects omitted from most<br />
other analyses.<br />
Many results arising from the HME can also be<br />
derived from the conventional master equation, albeit<br />
with more trouble. For many experiments involving<br />
phase cycling or difference spectroscopy, the<br />
thermal correction term © may actually be omitted,<br />
without generating incorrect results. This property<br />
is extremely important, since otherwise, a great<br />
body of NMR experiments would have to be reinterpreted.<br />
This is discussed in Appendix E.<br />
In summary, the HME establishes a much needed<br />
link between incoherent and coherent averaging experiments.<br />
The simplification of relaxation networks<br />
may be treated on an equal footing with the<br />
simplification of spin-spin coupling networks (i.e.<br />
decoupling experiments). The extensive literature<br />
on coherent averaging (30-35) becomes directly applicable<br />
to incoherent averaging experiments. The<br />
HME provides a strong physical insight, representing<br />
the spin ensemble as an open system, exchanging<br />
energy and entropy with the surrounding molecular<br />
environment.<br />
VII. Acknowledgments<br />
M.H.L. acknowledges support from the Swedish<br />
Natural Science Foundation. We would like to thank<br />
J. Kowalewski, J. Jeener, L. Maler, A. Vega and<br />
D. Sodickson for communications, help and discussions.<br />
We would also like to thank I. Burghardt for<br />
a copy of her doctoral thesis, and G. Bodenhausen<br />
for discussions and the sample of Exifone..<br />
VIII. Appendix A: The HME in<br />
the rotating frame<br />
The HME is normally used in the rotating frame,<br />
where the dynamics under radio-frequency fields appear<br />
particularly simple. However, there is scope for<br />
confusion as to the correct expression for the relaxation<br />
equations in the rotating frame, and numerous<br />
errors in the literature can be found. The problem is<br />
that the spin system exchanges energy with the lattice,<br />
which is indifferent to the rotating frame used<br />
to analyze the spins. The comment of Abragam may<br />
be recalled (15): "spin and lattice temperatures are<br />
defined in two different frames of reference and there<br />
is danger of being led astray by intuitive physical arguments<br />
in this unfamiliar situation."<br />
The main problems center around the use of the<br />
term "rotating-frame Hamiltonian," i.e. the operator<br />
which generates the spin dynamics, as corrected<br />
for illusory forces arising from the motion of the<br />
frame (50). For example the equation of motion (neglecting<br />
relaxation) of a rotating-frame spin density<br />
operator defined by<br />
is<br />
a R (t) = a(t)<br />
dt a = ~ 1 t Wc °h' CT 1<br />
with the "rotating-frame Hamiltonian"<br />
(48)<br />
(49)<br />
Hfoh = exp{iu)tlz} Hcoh exp{-iutlz} -LOIZ . (50)<br />
This type of "rotating-frame Hamiltonian" is so<br />
familiar in NMR theory that it is often forgotten<br />
that it is not a real Hamiltonian at all. It is a sort<br />
of "pseudo-Hamiltonian" which fulfils the dynamic<br />
but not the energetic function of a true Hamiltonian.<br />
In particular, < H^oh > is not the energy of the spin<br />
system (51), and W^,h cannot be used in statistical<br />
thermodynamical expressions involving the spin system<br />
energy. For example, the steady-state density<br />
operator in the presence of a field has no relationship<br />
with the "rotating-frame Hamiltonian":<br />
a* + Z- 1 exp{-Wfohr4 . (51)<br />
Erroneous statements to the contrary can unfortunately<br />
be found in many textbooks and papers.<br />
A false impression is also left by the unfortunate<br />
terminology "spin-lattice relaxation in the rotating<br />
frame" and "rotating-frame nuclear Overhauser effect."<br />
These phenomena involve relaxation dynamics<br />
in the presence of rf fields, and have no particular<br />
connection with the use of a rotating frame.<br />
To elucidate the role of the rotating frame, consider<br />
the (lab frame!) HME in the presence of an<br />
applied rf field:<br />
a(t) = f (*)) a(t) , (52)<br />
dt<br />
where 7Ycoh is the commutation superoperator with<br />
the time-dependent coherent Hamiltonian<br />
, ft] ,<br />
(53)
Vol. 16, No. 1/2 109<br />
and the coherent Hamiltonian is assumed to have a<br />
large, time-independent, component Ho and a small,<br />
time-dependent component Hi:<br />
= Ho + H\(t) (54)<br />
In principle, the relaxation superoperator is also<br />
time-dependent, since the eigenstates and energies<br />
of the spin system are affected by the modulation<br />
of Ticoh- However, if H\ is much smaller than Ho,<br />
and the fluctuations in the incoherent interactions<br />
are rapid compared to the magnitude of Hi, the<br />
effect of Hi on Y may be ignored and the HME<br />
approximated as<br />
to) (55)<br />
where To is the relaxation superoperator in the absence<br />
of the rf field.<br />
By using a transformed density operator of the<br />
form Eqn. 48, the HME becomes<br />
dt aR (t)= I - (56)<br />
where, for a proper choice of frame, the "pseudo-<br />
Hamiltonian" H^oh in Eqn. 50 can be made timeindependent.<br />
This is the most useful form of the<br />
HME: Normally the rotating-frame is assumed and<br />
the superscripts "R" and subscript "0" dropped.<br />
IX. Appendix B: The thermal<br />
correction ©<br />
Since the lattice has a finite temperature, the<br />
probability of the nuclear spin system making a<br />
transition \r> —• \s> differs slightly from that for<br />
the reverse transition \s> —• \r> according to the<br />
relative energy of the two states. Elementary considerations<br />
of this kind lead to an "improved" relaxation<br />
superoperator of the form<br />
f = f exp{wr4 (57)<br />
where the superoperator Co has the property<br />
= ]T uirttrr\r> of the main part<br />
of the coherent (lab frame!) Hamiltonian<br />
Ho r > = u>r\r> . (59)<br />
Thus CJ projects out the "secular" components of<br />
an operator Q, weighting each component with the<br />
energy of the corresponding spin state.<br />
For high nuclear spin temperature, the exponential<br />
in Eqn. 57 can be approximated by the first two<br />
terms in a series, giving<br />
with<br />
(60)<br />
(61)<br />
This looks simple but gives rise to rather complicated<br />
expressions.<br />
Consider therefore the projection superoperator<br />
P-j which removes all traceless components of its<br />
argument operator:<br />
= n~ l Tr{0} 1 . (62)<br />
This can be used to decompose the density operator<br />
into a non-traceless and a traceless component:<br />
The HME can therefore be written<br />
d<br />
—a = ( —1<br />
h + f J a + TUJP^ are<br />
Yd) I 1 — Pj ) (JTg.<br />
(63)<br />
(64)<br />
Since the traceless part of the density operator is<br />
much smaller than the non-traceless part, by a factor<br />
of the order of ||(Dr^||, the last term is proportional<br />
to ||O)T^|| 2 and can be ignored. The thermal<br />
correction is<br />
(65)<br />
which proves easier to handle.<br />
An expression for the elements of 6 in a<br />
base of normalized Cartesian product operators<br />
(38,39) can be derived as follows: Consider a<br />
spin system with n eigenstates. A suitable set<br />
of product operators is denned by {Q11Q2 • • •} =<br />
271" 1 / 2 { § 1, Ilz, I2z • • • *hzhz •••}• The operators<br />
are normalized such that<br />
Tr{QjQk} = 6j (66)<br />
Now all elements 9jk = Tv{QjQQk} with k ^ 1 vanish<br />
since Qk>i are traceless. Similarly, all elements
110 Bulletin of Magnetic Resonance<br />
Oik vanish since f is symmetrical and f 1 = 0. We<br />
are left with the elements in the first column, 9j\<br />
with j ^ 1. These may be written as follows:<br />
9jX=<br />
Since P-jQi = Qi, this becomes<br />
(67)<br />
(68)<br />
Using the definition of a), and Qi = n" 1 ' 2 ^, we get<br />
rk<br />
(69)<br />
introducing the elements of the ordinary relaxation<br />
matrix in the Cartesian product basis<br />
= Tr{QjtQk} , (70)<br />
and the matrix elements of spin operators<br />
Qk, in the eigenbase of the coherent Hamiltonian.<br />
Now in high field, the energies uir are very<br />
close to the eigenvalues of the pure Zeeman Hamiltonian<br />
defined by<br />
T/0 V^ 0 T /rr-i \<br />
where uf^ is the Larmor frequency of spin /^, ignoring<br />
chemical shifts and spin-spin couplings. Hence<br />
the thermal correction elements can be written<br />
rk<br />
(72)<br />
Since 7i°z is diagonal for a spin system in high field<br />
(this is true even for strongly-coupled systems), this<br />
can be written in turn<br />
or more explicitly<br />
(73)<br />
(74)<br />
Since for spins-1/2, Tr{/^} = n/4, this equation<br />
encodes the simple step-by-step procedure given in<br />
the text for the thermal correction elements (Eqns.<br />
15-17).<br />
X. Appendix C: Continuous rf<br />
fields<br />
We give one example of the HME in a situation<br />
where additional operators must be included in the<br />
relevant Liouville subspace. Consider a heteronuclear<br />
two-spin system with continuous, on-resonance<br />
rf irradiation of the S-spin. This has been treated<br />
by Boulat and Bodenhausen (52) who showed that<br />
a naive application of the Solomon equations for the<br />
spin state populations fails. It is necessary to take<br />
into account the full spin dynamics, including the<br />
creation of spin coherences by the rf field.<br />
The rotating-frame HME in the presence of the<br />
rf field is<br />
where p^ is the transverse relaxation rate constant<br />
of S-spin coherences, and cross-correlation effects<br />
are neglected this time. The rf field is considered<br />
to have magnitude oj\ in frequency units and phase<br />
vr/2. The Liouville subspace is extended by one row<br />
and one column, in order to encompass the mixing<br />
of the rotating-frame expectation values and<br />
< Sx > by the rf field.<br />
Eqn. 75 contains the full dynamical behaviour of<br />
the system, which could in principle be extracted<br />
by diagonalizing the 4x4 matrix A in the equation<br />
above. Let us just concentrate on the steady-state<br />
behaviour. The steady-state expectation values of<br />
the spin system form a vector vs which lies in the<br />
nullspace of A i.e.<br />
Avw = 0 .<br />
(76)<br />
The nullspace is the set of eigenvectors with zero<br />
eigenvalue (53).<br />
In the present case, the actual steady state is<br />
that nullspace vector with < |1 >= ^. Explicit calculation,<br />
or computer algebra (54) gives the result<br />
immediately:<br />
X (A 2 p t sL0°ITe<br />
X<br />
/ + OISU)%)<br />
\<br />
(77)
Vol. 16, No. 1/2 111<br />
where<br />
and<br />
= pips -<br />
-i<br />
(78)<br />
(79)<br />
In the limit of UJ\ much greater than the relaxation<br />
rates, and neglecting second-order effects, the<br />
expression reduces to<br />
\<br />
Since the thermal equilibrium value of S-spin Zeeman<br />
polarization is given by<br />
\<br />
(80)<br />
(81)<br />
the steady-state value of the transverse S-spin polarization<br />
in the presence of the rf field is<br />
SS , A 2<br />
(82)<br />
and the steady-state nuclear Overhauser enhancement<br />
of the longitudinal I-spin polarization is described<br />
by<br />
>eq<br />
(83)<br />
i.e. the same as when TT pulses are used. These<br />
results are in agreement with the calculation by<br />
Boulat and Bodenhausen (52).<br />
XI. Appendix D: Numerical calculations<br />
with the HME<br />
The HME may be used for numerical spindynamical<br />
calculations involving simultaneous relaxation<br />
and rf fields. In general, this can be done<br />
one pulse sequence element at a time. The evolution<br />
superoperator under a pulse sequence element<br />
B has the form<br />
B= (84)<br />
where r is the pulse sequence element duration and<br />
C is the effect of rf fields and relaxation, without the<br />
thermal correction:<br />
c = -mcoh + r<br />
(85)<br />
The exponential in Eqn. 84 can be calculated numerically<br />
in the usual way, by forming a matrix representation<br />
of the superoperator and diagonalizing.<br />
The asymmetry of the matrix representation generates<br />
no particular problems.<br />
We point out here a special feature of Eqn. 84.<br />
Since £1 = 0, we have €>£ = G 2 = 6. Hence<br />
£ + e) = £ 2 + £6<br />
(86)<br />
and so on. It follows that the exponent can be written<br />
e (87)<br />
The evolution superoperator is itself the sum of a<br />
"normal" superoperator and a thermal correction<br />
term. This has important consequences (see Appendix<br />
E). Furthermore, in the special case of "free<br />
precession periods" where no rf fields are applied,<br />
Eqn. 87 may be set in the form<br />
exp{(£0<br />
= exp{£or}<br />
For free precession, the thermally corrected evolution<br />
superoperator may be derived from the nonthermally<br />
corrected superoperator, in just the same<br />
way as T can be derived from F.<br />
XII. Appendix E: The HME and<br />
phase cycling<br />
Many magnetic resonance experiments involve<br />
taking a linear combination of results from related<br />
but slightly different experiments. A typical example<br />
is phase cycling, in which the experiments only<br />
differ in the relative phase of some of the pulses.<br />
The signals from the phase-shifted experiments are<br />
multiplied by complex phase factors and combined<br />
in the processing device.
112<br />
For many experiments of this kind the thermal<br />
correction terms 0 may be omitted from at least<br />
part of the calculation. This is fortunate, since it<br />
has been common practice to disregard the thermal<br />
polarization effects when convenient. A formal justification<br />
in the context of the HME may be useful.<br />
In the treatment by Ernst and co-workers (38),<br />
phase cycling is represented by an instantaneous<br />
projection of the density operator onto a subspace<br />
of operators with particular rotational properties,<br />
i.e. coherences of particular orders. This is very<br />
convenient for calculations. All elements of the density<br />
operator which do not belong to coherences of<br />
a given order are simply removed and the calculation<br />
carried further using only the elements which<br />
do have the "right" order.<br />
The basis for this procedure is awkward in terms<br />
of the ordinary master equation since the aeq terms<br />
get in the way (55). It also not obvious what happens<br />
in the case of extended rf fields. In the HME,<br />
the treatment of phase cycling is more straightforward.<br />
Suppose a pulse sequence consists of two<br />
parts, A and B. The B part is performed in two<br />
versions, B\ and _B2, and the NMR signals s\ and<br />
s-2 combined with complex factors c\ and c2. In the<br />
HME, the individual NMR signals can be written<br />
Sl(t) =<br />
s2(t) = > ( 89 )<br />
where O is the observable operator and UQ the initial<br />
density operator, assumed identical in the two<br />
experiments. The combined signal c\S\(t) +<br />
can be written<br />
where<br />
s(t) = Tr{Q+ exp{C0t}BAa0}<br />
B = + c2B2 .<br />
(90)<br />
(91)<br />
Thus the superoperators of different pulse sequences<br />
are combined linearly. In phase cycling, the experiments<br />
are selected such that the averaged superoperator<br />
behaves according to:<br />
= BPM<br />
(92)<br />
where PM projects out operator terms belonging to<br />
spin coherences of a particular order M, or set of<br />
orders.<br />
Bulletin of Magnetic Resonance<br />
From Eqn. 87, the superoperator including phase<br />
cycling, for ¥/0, is<br />
exp{(£ + 6) T}PM = exp{£r}PM • (93)<br />
The "thermal correction" vanishes since P-j PM = 0.<br />
It follows that if phase cycling is used to select<br />
coherences of some non-zero order M at a particular<br />
point in a pulse sequence, the thermal correction<br />
terms may safely be omitted from all subsequent<br />
pulse sequence elements. Similar conclusions apply<br />
to other forms of difference spectroscopy.<br />
XIII. References<br />
*M. H. Levitt and L. Di Bari, Phys. Rev. Lett.<br />
69, 3124 (1992).<br />
2<br />
T. E. Bull, J. Magn. Reson. 93, 596 (1991).<br />
3<br />
L. E. Kay, L. K. Nicholson, F. Delaglio, A. Bax<br />
and D. A. Torchia, J. Magn. Reson. 97, 359<br />
(1992).<br />
4<br />
G. Bodenhausen, 5th Chianti Workshop, San<br />
Miniato, Italy, May 1993.<br />
5<br />
B. Boulat, I. Burghardt and G. Bodenhausen,<br />
J. Am. Chem. Soc. 114, 10679 (1992).<br />
6<br />
I. Burghardt, R. Konrat, B. Boulat, S. J. F.<br />
Vincent and G. Bodenhausen, J. Chem. Phys. 98,<br />
1721 (1993).<br />
7<br />
E. T. Olejniczak, R. T. Gampe and S. W. Fesik,<br />
J. Magn. Reson. 67, 28 (1986).<br />
8<br />
W. Massefski and A. G. Redfleld, J. Magn.<br />
Reson. 78, 150 (1988).<br />
9<br />
J. Fejzo, W. M. Westler, S. Macura and<br />
J. L. Markley, J. Magn. Reson. 92, 20 (1991).<br />
10<br />
J. Fejzo, W. M. Westler, S. Macura and<br />
J. L. Markley, J. Magn. Reson. 92, 195 (1991).<br />
11<br />
J. Fejzo, W. M. Westler, J. L. Markley and<br />
S. Macura, J. Am. Chem. Soc. 114, 1523(1992).<br />
12<br />
C. Zwahlen, S. J. F. Vincent, L. Di Bari,<br />
M. H. Levitt and G. Bodenhausen, J. Am. Chem.<br />
Soc., in press.<br />
13<br />
I. Burghardt, R. Konrat and G. Bodenhausen,<br />
Mol. Phys. 75, 467 (1992).<br />
14<br />
A. G. Redfield, Adv. Magn. Reson. 1, 1<br />
(1965).<br />
15<br />
A. Abragam, "The Principles of Nuclear Magnetism",<br />
(Clarendon Press, Oxford, 1961).<br />
16<br />
A. J. Vega and D. Fiat, Pure. Appl. Chem.<br />
40, 181 (1974);
Vol. 16, No. 1/2 113<br />
A. J. Vega and D. Fiat, J. Magn. Reson. 13, 260<br />
(1974);<br />
A. J. Vega and D. Fiat, J. Chem. Phys. 60, 579<br />
(1974);<br />
A. J. Vega and D. Fiat, J. Magn. Reson. 19, 21<br />
(1975).<br />
17 D. H. Jones, N. D. Kurur and D. P. Weitekamp,<br />
Bull. Magn. Reson. 14, 214 (1992).<br />
18 F. A. L. Anet and D. I. Freedberg, Chem.<br />
Phys. Lett. 208, 187 (1993).<br />
19 L. G. Werbelow and D. M. Grant, Adv. Magn.<br />
Reson. 9, 189 (1977).<br />
20 D. Canet, Prog. NMR Spectrosc. 21, 237<br />
(1989).<br />
21 J. McConnell, "The theory of NMR Spin Relaxation<br />
in Liquids", (Cambridge University Press,<br />
Cambridge, 1987).<br />
22 D. Neuhaus and M. P. Williamson, "The Nuclear<br />
Overhauser Effect in Structural k, Conformational<br />
Analysis", (VCH, Cambridge, 1989).<br />
23 M. Gue'ron, J. L. Leroy and R. H. Griffey,<br />
J. Am. Chem. Soc. 105, 7262 (1983).<br />
24 M. Goldman, J. Magn. Reson. 60, 437<br />
(1984).<br />
25 R. Bruschweiler, C. Griesinger and R. R.<br />
Ernst, J. Am. Chem. Soc. Ill, 8034 (1989).<br />
26 R. Bruschweiler and R. R. Ernst, J. Chem.<br />
Phys. 96, 1758 (1992).<br />
27 C. Dalvit and G. Bodenhausen, Adv. Magn.<br />
Reson. 14, 1 (1990).<br />
28 L. Maler and J. Kowalewski, Chem. Phys.<br />
Lett. 190, 241 (1992).<br />
29 C. Dalvit and G. Bodenhausen, Chem. Phys.<br />
Lett. 161, 554 (1989).<br />
30 M. H. Levitt and R. Freeman, J. Magn. Re-<br />
son. 43, 502 (1981).<br />
31 J. S. Waugh, J. Magn. Reson. 50, 30<br />
(1982).<br />
32 J. S. Waugh, J. Magn. Reson. 49, 517<br />
(1982).<br />
33 A. J. Shaka and J. Keeler, Prog. Nucl. Magn.<br />
Reson. Spectrosc. 19, 47 (1987).<br />
34 U. Haeberlen and J. S. Waugh, Phys. Rev.<br />
175, 453 (1968).<br />
35 U. Haeberlen, "High Resolution NMR in<br />
Solids. Selective Averaging", (Academic, New York,<br />
1976).<br />
36 J. Jeener, Adv. Magn. Reson. 10, 1<br />
(1982).<br />
37 I. Solomon, Phys. Rev. 99, 559 (1955).<br />
38 R. R. Ernst, G. Bodenhausen and A. Wokaun,<br />
"Principles of Nuclear Magnetic Resonance in One<br />
and Two Dimensions", (Clarendon Press, Oxford,<br />
1987).<br />
39 O. W. S0rensen, G. W. Eich, M. H. Levitt,<br />
G. Bodenhausen and R. R. Ernst, Prog. NMR Spectrosc.<br />
16, 163 (1983).<br />
40 V. V. Krishnan and Anil Kumar, J. Magn.<br />
Reson. 92, 293 (1991).<br />
41 Anil Kumar, 5th Chianti Workshop, San<br />
Miniato, Italy, May 1993.<br />
42 L. Di Bari and M. H. Levitt, to be published.<br />
43 A. G. Palmer III, N. J. Skelton, W. J. Chazin,<br />
P. E. Wright and M. Ranee, Mol. Phys. 75, 699<br />
(1992).<br />
44 M. H. Levitt, Prog. NMR Spectrosc. 18, 61<br />
(1986).<br />
45 L. Di Bari, J. Kowalewski and G. Bodenhausen,<br />
J. Chem. Phys. 93, 7698 (1990).<br />
46 I. Burghardt, Doctoral Thesis, University of<br />
Lausanne, 1991.<br />
47 S. Szymanski, A. M. Gryff-Keller and G. Binsch,<br />
J. Magn. Reson. 68, 399 (1986).<br />
48 M. Ravikumar, R. Shukla and A. A. Bothner-<br />
By, J. Chem. Phys. 95, 3092 (1991).<br />
49 C. Griesinger and R. R. Ernst, Chem. Phys.<br />
Lett. 152, 239 (1988).<br />
50 A lucid description of the rotating frame transformation<br />
can be found in Appendix D of J. Jeener<br />
and F. Henin, Phys. Rev. A 34, 4897 (1986).<br />
51 A. G. Redfield, Phys. Rev. 98, 1787 (1955),<br />
note 29. In this influential early paper, Redfield indicates<br />
that Eqn. 51 is incorrect because "the electrons,<br />
which are responsible for the relaxation are almost<br />
completely unaffected by the rf field" (p.1796)<br />
[this is the case of nuclear relaxation by metallic<br />
conduction electrons]. This argument is too weak.<br />
A much stronger justification is that < 7~t^oh > is not<br />
the spin energy, and cannot be used in statistical calculations<br />
involving combinations of lattice and spin<br />
energies. A truly energetic role of the "rotatingframe<br />
Hamiltonian" is inadmissable in principle.<br />
52 B. Boulat and G. Bodenhausen, J. Chem.<br />
Phys. 97, 6040 (1992).<br />
53 G. Strang, "Linear Algebra and its Applications",<br />
(Harcourt Brace Jovanovich, San Diego,<br />
1988).<br />
54 S. Wolfram, "Mathematical A System for Do-
114 Bulletin of Magnetic Resonance<br />
ing Mathematics by Computer", (Addison-Wesley,<br />
New York, 1991).<br />
55 see ref. (38), p.288.
Vol. 16, No. 1/2 115<br />
Contents<br />
I. Introduction<br />
Effects of Cross-Correlations in 2D NOE Experiments 1<br />
P.K. Madhu*, R. Christy Rani Grace* and Anil Kumar* 1<br />
* Department of Physics and ^Sophisticated Instruments Facility<br />
Indian Institute of Science, Bangalore - 560 012, INDIA<br />
II. Theory<br />
1. Net effect due to dipolar cross-correlations in a homonuclear three spin system<br />
III. Conclusions<br />
IV. References<br />
I. Introduction<br />
The development of two dimensional Fourier<br />
transform NMR techniques by Professor Ernst during<br />
the Seventies and Eighties created a revolution<br />
in the study of biomolecules by NMR. The ubiquitous<br />
COSY experiment and its many variants, especially<br />
the DQFC and TOCSY experiments made<br />
it possible to obtain assignments of resonances of<br />
molecules containing several hundreds of protons - a<br />
task which was considered "impossible" before the<br />
development of 2D NMR. Similarly the impact of<br />
the 2D NOE experiment was "electrifying". It made<br />
it possible to obtain the structures of biomolecules<br />
in solution, a task which was considered "very difficult"<br />
before the application of this experiment (1-5).<br />
The revolutionary developments of Fourier transform<br />
NMR spectroscopy in one and multidimensions<br />
by Professor Ernst, with literally hundreds of<br />
new experiments developed by him during these two<br />
decades, leading to an explosion of research in this<br />
area by many workers, have culminated in his receiving<br />
the 1991 Nobel Prize in Chemistry.<br />
The success of the 2D NOE experiment has made<br />
it an "object-la-focus" on which much attention has<br />
been paid. In order to extract as much information<br />
as possible from this experiment, it is performed in<br />
the realm of the initial-rate approximation, build-up<br />
1 Presented in part at 5 th Chianti workshop on Magnetic<br />
Resonance Nuclear and Electron Relaxation, held at San<br />
Miniato, Italy, June 1993.<br />
115<br />
116<br />
. 118<br />
122<br />
123<br />
curves and long mixing times, subjecting the data<br />
respectively to the two-spin approximation, buildup<br />
rates and full relaxation-matrix analyses. Several<br />
attempts are underway to obtain "accuratedistances"<br />
(not just distance estimates) from the 2D<br />
NOE data. Simultaneously there have been many<br />
concerns regarding the systematic errors in the distance<br />
estimates from 2D NOE data. These are, effects<br />
of internal motions (6-9), anisotropy of motion<br />
(10-13), spin diffusion (14-19), sources of relaxation<br />
other than intra-molecular dipolar interactions,<br />
and cross-correlations between different pathways<br />
of relaxation of a spin. While many attempts<br />
are underway to include the effects of internal motions,<br />
anisotropy of reorientation, spin diffusion<br />
and other relaxation processes, cross-correlations<br />
present somewhat of an insurmountable problem.<br />
The problem, as succinctly pointed out by Bull (20),<br />
is that if one wants to include cross-correlations for<br />
N number of relaxation coupled spins, the dimension<br />
of the relaxation matrix goes up exponentially<br />
to 2^ x 2 N as against a linear N x N increase if<br />
one neglects cross-correlations. For example, for 10<br />
relaxation coupled spins one needs a 1024 x 1024 relaxation<br />
matrix with cross-correlations and a 10 x 10<br />
matrix without cross-correlations. Therefore the<br />
question, whether one can discard cross-correlations<br />
without making much error, becomes very pertinent.<br />
In this paper the effects of cross-correlations
d<br />
"dt<br />
116 Bulletin of Magnetic Resonance<br />
and their influence in the 2D NOE experiments are<br />
examined in some detail, especially with respect to<br />
their influence on the net NOE.<br />
II. Theory<br />
The longitudinal relaxation of N relaxation coupled<br />
spins is in general described by the rate equation<br />
(4)<br />
dP(t)<br />
dt = W(P(t) - (1)<br />
where P(t) is a vector of populations of various levels<br />
at a time 't' and P° is their equilibrium value.<br />
W is the longitudinal relaxation rate matrix. The<br />
dimension of P is 2 iV and that of W is 2 W x2.<br />
If one neglects the cross-correlations a simpler rate<br />
equation describing the magnetization of each spin<br />
is obtained as (14,21)<br />
dlz(t)<br />
dt<br />
= R(£(*) - (2)<br />
This later equation is the generalized Solomon's<br />
equation in which Iz(t) describes the longitudinal<br />
magnetization of various spins at time 't', their equilibrium<br />
values 1^ and the rate matrix R whose diagonal<br />
elements describe the self relaxation of a spin<br />
and the off-diagonal elements the cross-relaxation<br />
Az<br />
Mz<br />
Xz<br />
2AZMZ<br />
2AZXZ<br />
2MZXZ<br />
4AZMZXZ<br />
PA O~AX<br />
0<br />
SA<br />
PM<br />
&AX &MX PX<br />
AM A AM<br />
fix<br />
AAM<br />
0<br />
PAM<br />
+ *MX<br />
Vol. 16, No. 1/2 117<br />
Figure 1.<br />
Az(r) Mz(r) Xz(r)<br />
The presence of multispin modes creates unequal<br />
intensities for the various transitions of a spin. For<br />
example, the intensities of the four transitions of<br />
spin A in an AMX spin system are given by<br />
Ax = (1/4)[AZ + 2AZMZ + 2AZXZ + 4AZMZXZ]<br />
A2 = (1/4){AZ-2AZMZ + 2AZXZ-4AZMZXZ\<br />
A3 = (1/4)[AZ + 2AZMZ-2AZXZ~4AZMZXZ]<br />
A4 = (l/4)[Az~2AzMz-2AzXz+4AzMzXz\<br />
(4)<br />
The net intensity of the spin is the sum of all<br />
four transitions, and is given by the single spin mode<br />
Az. If the four transitions are not resolved (J=0) or<br />
if one uses a 90° measuring pulse (which does not<br />
measure the multispin modes) one only sees the net<br />
effect. However, the net effect will be different, when<br />
cross-correlations are present, from that predicted<br />
by eqn. 2. The net effect is independent of the value<br />
of J, within the weak coupling limit.<br />
In a 2D NOE experiment on uncoupled or weakly<br />
coupled spins using the [90 — t\ — 90 — rm — a] sequence,<br />
each cross-section parallel to Fi is equivalent<br />
to a ID transient NOE experiment in which<br />
the spin (or all the transitions of the spin) on the<br />
diagonal, is inverted at rm = 0 (27-29). This means<br />
that in each cross-section, a single spin mode is created<br />
and all the other modes are zero at rTO = 0.<br />
From eqn. 3 it is seen that this single spin mode<br />
then evolves, in the initial rate approximation, into<br />
single spin modes of other spins (NOE) through<br />
cross-relaxation (
118 Bulletin of Magnetic Resonance<br />
15 sec<br />
.0 sec<br />
3.8 sec<br />
0 0<br />
***v<br />
x8<br />
x8<br />
.4 sec *«*»*?+*, x8<br />
3.0sec<br />
0 -01 sec-<br />
Figure 2: The AX part of the inversion-recovery<br />
spectra of coumarine dissolved in CDCI3, recorded<br />
with a measuring pulse of 20°, for recovery times<br />
indicated in the diagram. Some of the spectra are<br />
multiplied 4 or 8 times as indicated. The spectra<br />
were recorded on an AMX-400 spectrometer.<br />
This paper, on the other hand, concentrates on<br />
the net effect arising from the cross-correlations. For<br />
this purpose a three spin system is considered, the<br />
discussion being restricted to dipole-dipole crosscorrelations.<br />
It has been earlier shown that there<br />
is a significant multiplet effect in such a spin system<br />
especially in a linear geometry and that the NOE<br />
and the multiplet effect are sensitive to the geometric<br />
disposition of the three spins (39).<br />
1. Net effect due to dipolar crosscorrelations<br />
in a homonuclear three<br />
spin system<br />
Three geometries of the relaxation coupled<br />
three spin system, without or with weak J couplings<br />
(AMX ) considered are, (i) equilateral triangle (ii)<br />
isosceles triangle with a right angle and (iii) a linear<br />
arrangement of the three spins, keeping the distance<br />
between 'AM' and' MX' equal. The magnitude of<br />
the geometric factor of the AM-MX dipole-dipole<br />
cross-correlation compared to AM-AM auto correlation<br />
for the homonuclear system is given by<br />
r(3cos 2 f9-l) (5)<br />
where ri is the distance between A and M spins,<br />
i2 the distance between M and X spins and 9 is the<br />
angle between these two vectors (Figure 3). For ri =<br />
r2, this ratio is —1/8, —1/2, and 1 respectively for<br />
equilateral triangle, isosceles triangle and a linear<br />
arrangement of the spins. Thus the cross-correlation<br />
is extremely sensitive to the geometric disposition of<br />
the three spins with the linear arrangement having<br />
maximum cross-correlation.
Vol. 16, No. 1/2 119<br />
-60<br />
[A (T<br />
u z v m<br />
io SEC go<br />
Figure 4: Calculated net NOE in percentage on spin A, after selective inversion of spin M at rm = 0 is shown<br />
as a function of rm for three geometries; (a) equilateral (b) isosceles and (c) linear, for three values of LUTC<br />
in each case. In the left hand diagrams the dashed curves represent the calculated net NOE without crosscorrelations<br />
and the solid curves with cross-correlations. In the right hand diagrams the difference between<br />
these two calculated NOE's are shown by solid curves.<br />
The calculated net NOE on spin A [Az(Tm)] for<br />
the selective inversion of spin M (equal to the intensity<br />
of AM cross peak in a cross-section parallel<br />
to i
120 Bulletin of Magnetic Resonance<br />
-30 -<br />
-60<br />
Figure 4: continued. 0<br />
[Afr-J/A ]%<br />
NOE calculated with and without cross-correlations<br />
has a direct consequence in the distance estimation<br />
from the 2D NOE data. The neglect of crosscorrelations<br />
causes a systematic error in the distance<br />
measurement. However, the error builds-up at large<br />
mixing times since it is due to the second-order effect<br />
of cross-correlations. One redeeming factor is<br />
that these mixing times are much larger than the<br />
mixing times usually employed in 2D NOE experiments.<br />
Never-the-less these errors are significant,<br />
and are due to opening up of additional relaxation<br />
pathways of the spin by the cross-correlations. This<br />
is discussed in more detail in the following.<br />
SEC 10 0 T m 10 SEC 20<br />
The cross-correlation 6M transfers some of<br />
M magnetization to the three spin order term<br />
(AAZMZXZ) which then leaks to Az or Xz via 8A<br />
or 8x respectively or comes back to Mz via 6M-<br />
These additional pathways cause the changes in the<br />
net NOE. In equilateral and isosceles triangle cases<br />
all the 6's are small. As a result these additional<br />
pathways are insignificant. However in the linear<br />
case the geometric factor of the AM-MX crosscorrelation<br />
is as significant as AM-AM or MX-MX<br />
auto-correlation. Thus in the linear case the dominant<br />
additional pathway is (8M, &M) (Figure 5).<br />
The NOE from spin M to spin A is affected by two
Vol. 16, No. 1/2 121<br />
Figure 4: continued.<br />
15 -<br />
0 -<br />
-5 4<br />
-30 -I<br />
-60<br />
/ \ \<br />
/ x \<br />
1 WTC=O.<br />
pathways one involving (6M, 8M, &AM) path and<br />
the other involving (8M, 8A) path (Figure 6). In the<br />
UTC = 1.118 limit (JAM ~ 0 and the net NOE to A<br />
spin comes only through cross-correlations using the<br />
path (8M, 8A)- Since 8A is small this NOE is small<br />
(Figure 4c). However when U>TC ^> 1 (urc = 10),<br />
&AM is large along with 8M and the path (8M, 8M,<br />
a AM) contributes significantly to the net NOE on<br />
A and the difference in net NOE calculated with or<br />
without cross-correlation is significant (Figure 4c).<br />
Identical results are obtained for the X spin in this<br />
case due to symmetry and are not shown.<br />
The self-relaxation of spin M is also affected by<br />
\<br />
I<br />
10<br />
io SEC 20<br />
the presence of cross-correlations (Figure 7). The<br />
self-relaxation of a spin can be monitored as the decay<br />
of the diagonal peak in the 2D NOE experiment<br />
or by a selective-inversion-recovery experiment. The<br />
self-relaxation of spin M shows a very large effect of<br />
cross-correlations as has also been pointed out by<br />
early workers in this field (40-42). The pathways<br />
affecting the self relaxation of spin M are indicated<br />
in Figure 8. Of these the dominant path due to<br />
cross-correlations is again the path (8M, 8M)- For<br />
UITC = 1.118 the other paths are cut off and this is<br />
the only path left.<br />
The NOE from spin A to M and X and its self-
122 Bulletin of Magnetic Resonance<br />
Figure 5.<br />
Figure 6.<br />
AAZMZXZ<br />
8M 8M<br />
=> 4AZMZXZ<br />
&AM<br />
relaxation is considered next. Since 8A is small<br />
the conversion of Az to 4AZMZX- is weak. Figure<br />
9 shows the net NOE from spin A to M and<br />
X for various correlation times. This figure shows<br />
that the differences are smaller than Figure 4 but<br />
are not negligible. In the short correlation limit<br />
(UJTC < 1) the net NOE to X is small and the difference<br />
with and without cross-correlation is also<br />
small. The calculated net NOE on M and X spins<br />
without cross-correlations is zero for U>TC = 1.118.<br />
The pathways contributing to the net NOE on M<br />
and X spins are shown in Figure 10. For WTC =<br />
1.118 when
Vol. 16, No. 1/2 123<br />
-100 -<br />
-200<br />
-100 -<br />
-200<br />
-100 -<br />
-200<br />
[Mz(rm)/M ]%<br />
SEC 20<br />
Figure 7: The calculated net magnetization in percentage of spin M is shown as a function of rm, after a<br />
selective inversion of spin M at rm=0 for the linear geometry of the three spins AMX for three different values<br />
of WTC. In the left hand diagrams, the dashed curves represent the calculated magnetization without crosscorrelations<br />
and the solid curves with cross-correlations. In the right hand diagrams the differences between<br />
these two calculated magnetizations are shown by solid curves.<br />
correlations are small. The CSA-dipole crosscorrelation<br />
for protons are also usually small and<br />
perhaps can be ignored. The CSA-dipole crosscorrelation<br />
is significant for other spin 1/2 nuclei<br />
such as 19 F, 13 C, 31 P and 15 N and may<br />
not be ignored. More work is required to assess<br />
whether proton-proton dipole-dipole crosscorrelations<br />
should be included in biomolecular<br />
NOE studies of large molecules.<br />
IV. References<br />
P. Aue, E. Bartholdi and R. R. Ernst, J.<br />
Chem. Phys. 64, 2229-2245 (1976).<br />
2 Anil Kumar, R. R. Ernst and K. Wiithrich,<br />
Biochem. Biophys. Res. Commun. 95, 1-6 (1980).<br />
3 K. Wiithrich, "NMR of Proteins and Nucleic<br />
Acids", John Wiley and Sons, New York (1986).
124<br />
Figure 8.<br />
-60<br />
[M(<br />
GAM &AX<br />
4AZMZXZ<br />
u -<br />
5 -<br />
0 -<br />
-20 -<br />
Xz<br />
M s-<br />
1 «Tc=0<br />
-^<br />
X<br />
Bulletin of Magnetic Resonance<br />
.1<br />
\ .<br />
. •<br />
10 20<br />
0 T m 5 SEC io 0 T m 10 SEC 20<br />
Figure 9: Calculated net NOE in percentage on spins M and X, after a selective inversion of spin A at<br />
rm — 0, for the linear geometry. The remaining details are same as in Figure 4.
Vol. 16, No. 1/2 125<br />
Figure 10.<br />
&AX<br />
4<br />
R. R. Ernst, G. Bodenhausen and A. Wokaun,<br />
"Principles of Nuclear Magnetic Resonance in One<br />
and Two Dimensions", Oxford Science Publication,<br />
London, 1987.<br />
5<br />
R. R. Ernst, Angew. Chem. Int. Ed. Engl. 31,<br />
805-930 (1992).<br />
6<br />
D. E. Woessner, J. Chem. Phys. 42, 1855-1859<br />
(1965).<br />
7<br />
J. W. Keepers and T. L. James, J. Magn. Re-<br />
son. 57, 402-426 (1984).<br />
8 L. E. Kay and J. H. Prestegard, J. Am. Chem.<br />
Soc. 109, 3829-3835 (1987).<br />
9<br />
V. V. Krishnan, S. C. Shekar and Anil Kumar,<br />
J. Am. Chem. Soc. 113, 7542-7550 (1991).<br />
10<br />
D. E. Woessner, J. Chem. Phys. 36, 1-4<br />
(1963).<br />
U<br />
R. L. Void and R. R. Void, Prog. Nucl. Mag.<br />
Res. Spec. 12, 79-133 (1978)<br />
12 T. Bluhm, Mol. Phys. 47, 475-486 (1982).<br />
13 E. Konigsberger and H. Stark, J. Chem. Phys.<br />
83, 2723-2726 (1985).<br />
14 A. Kalk and H. J. C. Berendsen, J. Magn. Re-<br />
son. 24, 343-366 (1976).<br />
15<br />
Anil Kumar, G. Wagner, R. R. Ernst and K.<br />
Wuthrich, J. Am. Chem. Soc. 103, 3654 (1981).<br />
16<br />
E. T. Olejniczak, R. T. Gampe, Jr., and S. W.<br />
Fesik, J. Magn. Reson. 67, 28-41 (1986).<br />
17<br />
V. V. Krishnan, N. Murali and Anil Kumar, J.<br />
Magn. Reson. 84, 255-267 (1989).<br />
18<br />
A. Majumdar and R. V. Hosur, J. Magn. Reson.<br />
88, 284-304 (1990).<br />
19<br />
V. V. Krishnan, U. Hegde and Anil Kumar, J.<br />
Magn. Reson. 94,605-611 (1991)<br />
20<br />
T. E. Bull, J. Magn. Reson. 72, 397-413<br />
(1987).<br />
21 J. Solomon, Phys. Rev. 99, 559-565 (1955).<br />
22 N. C. Pyper, Mol. Phys. 21, 1-33 (1971).<br />
Mz<br />
23<br />
N. C. Pyper, Mol. Phys. 22, 433-458 (1972)<br />
24<br />
L. G. Werbelow and D. M. Grant, Adv. Mag.<br />
Res. 9, 189-299 (1977).<br />
25<br />
D. Canet, Prog. NMR. Spectrosc. 21, 237-291<br />
(1989).<br />
26<br />
C. Dalvit and G. Bodenhausen, Adv. Mag.<br />
Res. 14, 1-32 (1990).<br />
27<br />
R. C. R. Grace and Anil Kumar, J. Magn. Reson.<br />
97, 184-191 (1992).<br />
28<br />
R. C. R. Grace and Anil Kumar, J. Magn. Reson.<br />
99, 81-98 (1992).<br />
29<br />
R. C. R. Grace and Anil Kumar, Bulletin<br />
Magn. Reson. 14, 42-56 (1992).<br />
30<br />
G. Jaccard, S. Wimperis and G. Bodenhausen,<br />
Chem. Phys. Lett. 138, 601-606 (1987).<br />
31<br />
C. Dalvitt and G. Bodenhausen, Chem. Phys.<br />
Lett, 161, 554-560 (1989).<br />
32<br />
H. Oschkinat, D. Limat, L. Emsley and G. Bodenhausen,<br />
J. Magn. Reson. 81, 13-42 (1989).<br />
33<br />
C. Dalvitt, J. Magn. Reson. 95, 410-416<br />
(1991).<br />
34<br />
V. A. Daragan and K. H. Mayo, Chem. Phys.<br />
Lett. 206, 393-400 (1993).<br />
35<br />
R. Bruschweiler, C. Griesinger and R. R. Ernst,<br />
J. Am. Chem. Soc. 111,8034-8035 (1984).<br />
36<br />
C. Dalvitt and G. Bodenhausen, J. Am. Chem.<br />
Soc. 110,7924 (1988).<br />
37<br />
S. Wimperis, J. M. Bohlen and G. Bodenhausen,<br />
J. Magn. Reson. 77, 589-595 (1988).<br />
38<br />
M. Ernst and R. R. Ernst, Fifth Chianti Workshop<br />
on Magnetic Resonance, San Miniato, Italy,<br />
June, 1993.<br />
39<br />
V. V. Krishnan and Anil Kumar, J. Magn. Reson.<br />
92, 293-311 (1991).<br />
40<br />
V. A. Daragan, T. N. Khazanovich and A. U.<br />
Stepanyants, Chem. Phys. Lett. 26, 89-92 (1974).
126<br />
41<br />
L. G. Werbelow and D. M. Grant, J. Chem.<br />
Phys. 63, 544-556 (1975).<br />
42<br />
J. Courtieu, P. E. Fagerness, D. M. Grant, J.<br />
Chem. Phys. 65, 1202-1205 (1976).<br />
43<br />
L. Di. Bari, J. Kowaleswski and G. Bodenhausen,<br />
J. Chem. Phys. 93, 7698-7705 (1990).<br />
44<br />
I. Burghardt, R. Konrat and G. Bodenhausen,<br />
Mol. Phys. 75, 467-486 (1992).<br />
Bulletin of Magnetic Resonance
Vol. 16, No. 1/2 127<br />
Contents<br />
Detection of Two-Quantum Nuclear Coherence by Nuclear<br />
Quadrupole Induced Electric Polarization<br />
I. Introduction<br />
II. Nuclear Electric Resonance Detection<br />
III. Experimental Results<br />
IV. Conclusions<br />
V. Acknowledgments<br />
VI. References<br />
I. Introduction<br />
The Nobel Prize in Chemistry for 1991 was conferred<br />
upon Richard Ernst for his development of<br />
elegant NMR techniques and fundamental theory<br />
applicable to various types of physical and chemical<br />
analysis. These include in particular specific<br />
innovations and extensions of pulse Fourier transform<br />
methods for NMR high resolution spectroscopy<br />
and MRI. We of the NMR community especially<br />
salute and congratulate Ernst because the<br />
Prize brings honor as well upon all of us who have<br />
had so much fun in a field that has yielded many innovations<br />
over a time period much longer than many<br />
of us expected. The field of NMR in its development<br />
reached a stage where one could hardly distinguish<br />
whether chemists or physicists were doing NMR.<br />
Now the chemists, or rather the physical chemists<br />
and biologists, have taken over the field of NMR,<br />
and they are doing most of the "physics" nowadays.<br />
As a consequence, because chemical technology is<br />
more "up front" in the public and commercial eye,<br />
people know more about NMR than ever before.<br />
Also MRI has had an impact upon the public in the<br />
1 Present address: MRSC, Department of Radiology,<br />
UCSF, San Francisco, California 94143<br />
David C. Newitt 1 and Erwin L. Hahn<br />
Physics Department<br />
University of California<br />
Berkeley, California, 94720<br />
127<br />
127<br />
129<br />
131<br />
132<br />
132<br />
medical and health world, and in scientific research<br />
the analytic techniques made possible by NMR have<br />
been applied in one form or another to investigations<br />
in many disciplines.<br />
In contrast to the utilitarian revelations of the<br />
works of Richard Ernst, the authors of this article<br />
present in his honor the results of an experiment<br />
of the opposite sort, which they hope is acceptable,<br />
because most likely the reader will not find our experiment<br />
particularly useful. As will be seen in what<br />
follows, the electric resonance detection experiment<br />
is an interesting exercise in proving that nature will<br />
yield the reciprocal of a given effect if one goes to<br />
the trouble to expose it. In the course of interpreting<br />
such experiments one is forced to improve his<br />
understanding of things he thought he understood<br />
but in fact did not.<br />
II. Nuclear Electric Resonance<br />
Detection<br />
Magnetic one-quantum signal detection of the<br />
evolution of multiquantum nuclear spin coherence
128 Bulletin of Magnetic Resonance<br />
always requires the transfer of multiquantum superposition<br />
states into one-quantum superposition<br />
states (1). A directly observed two-quantum nuclear<br />
electric quadrupole radiation signal is conceivable<br />
theoretically but beyond observation experimentally<br />
(2), since it would be of the order of 10~~ 9 the size<br />
of an average NMR signal. In this gedanken experiment<br />
one would place the sample in a quadrupole<br />
capacitor to detect the direct two-quantum nuclear<br />
quadrupole radiation signal. However, for nuclear<br />
quadrupole moments located at noncentrosymmetric<br />
crystal sites, as in the case of As and Ga in<br />
GaAs, net local electric-dipole moments are induced<br />
in neighboring atoms by the electric quadrupole field<br />
of the nucleus. In this report we assume the "stick<br />
and ball model" (3). The electric field due to the<br />
nuclear quadrupole falls off as r~ 4 , where r is the distance<br />
between the point nuclear quadrupole and the<br />
point neighboring polarizable atom. The summation<br />
of quadrupole induced dipole moments over the<br />
set of nearest-neighbor atoms and over the spin ensemble<br />
yields a detectable macroscopic polarization.<br />
The polarizability of the local atomic environment<br />
effectively magnifies (3) the otherwise unobservable<br />
direct quadrupole radiation signal by a factor on the<br />
order of 10 +6 , so that a direct electric signal may be<br />
observed by placing the sample between the plates<br />
of a capacitor.<br />
In a previous experiment (3), nuclear electric<br />
resonance detection (NERD) was first demonstrated<br />
using the 30 MHz transition of 35 C1 in NaC103. In<br />
that experiment a small magnetic field was applied<br />
to remove the degeneracy of the m = ±1/2, ±3/2<br />
states. The resulting mixed m = ±1/2 states allow<br />
the development of a detectable electric polarization<br />
FID signal after a single pulse. The electric<br />
signal was characterized by a beating of different<br />
| Am | = 1,2 transition frequencies between the<br />
mixed m = ±1/2 states and the m = ±3/2 states,<br />
distinguishable from the beat frequency signature<br />
produced by stray pickup of a direct nuclear magnetic<br />
signal at the same Larmor frequency. In GaAs<br />
the observation of a pure |Am| = 2 transition from<br />
75 As at the sharply tuned frequency 2u is free of<br />
any nuclear magnetic signal at frequency to. However,<br />
there is a small reactive signal pickup transient<br />
from the transmitter pulses at frequency u>.<br />
In general the observation of a one-quantum or<br />
two-quantum electric signal requires that the expec-<br />
tation values<br />
I±Iz> = , Tr{p(IzI<br />
(1)<br />
be finite, which occurs only if the density matrix<br />
p is nonlinear in the nuclear spin operators. Thus<br />
in any system with equally spaced levels (including<br />
the degenerate NQR 35 > 37 C1 levels in NaC103), it is<br />
not possible to observe a NERD signal if the initial<br />
density matrix p is specified by a high temperature<br />
population distribution proportional to Iz, in which<br />
case the above traces of odd operators are zero. The<br />
requirement of a nonlinear p is met in the case of<br />
the zinc-blende structure, including GaAs and most<br />
other III—V semiconductors, by applying an external<br />
static electric field which produces a quadrupole<br />
shift due to the linear Stark effect (4). In the special<br />
case of NaClO3 the electric FID signal is observed<br />
immediately after a single pulse because initial<br />
signals which beat with one another, associated<br />
with different frequencies, have different amplitudes,<br />
which is not the case for GaAs where a minimum of<br />
two RF pulses is required.<br />
The NERD-induced polarization effect may be<br />
denned as the inverse of the linear Stark effect,<br />
where the former involves oscillating off-diagonal<br />
elements, and the latter involves on-diagonal elements<br />
which account for quadrupole frequency<br />
shifts. Both effects are expressed by the following<br />
Hamiltonian perturbation in dyadic form (3): with<br />
electric field gradients. The stick and ball description<br />
assumes that a nuclear quadrupole point source<br />
electric field induces polarization in nearest neighbor<br />
point atoms. This cannot account for the polarization<br />
spread over charge distributions and covalent<br />
bonds. Hence the definition of the "stick" distance<br />
is a vague one. Although one can only predict orders<br />
of magnitude of signal amplitudes by this approach,<br />
it is most valuable for predicting the signature and<br />
the sample orientation dependence of pulse transient<br />
signals which characterize the NERD phenomena.<br />
A rough estimate of the NERD signal strength is<br />
obtained by expressing the local quadrupole electric<br />
field<br />
HQ Q = — PQ • E — E<br />
Q •<br />
Q (2)<br />
The macroscopic polarization induced by the precessing<br />
local quadrupole electric field EQ is given
Vol. 16, No. 1/2 129<br />
by PQ = N/3a- EQ, where a is the atomic polarizability<br />
tensor. The Boltzmann factor j3 pertains to<br />
N participating quadrupole spins in the crystal. The<br />
electric field and corresponding oscillating voltage V<br />
on the capacitor plates are given by V = (E-n)d =<br />
47r(PQ-n)d, where n is normal to the capacitor plate<br />
and d is the plate separation. The alternative form<br />
of HQ, applicable to the dc linear Stark effect, defines<br />
E as the externally applied static electric field,<br />
where PE = N/3o;E for an isotropic polarizability a.<br />
Here one views the applied electric field as inducing<br />
internal atomic dipole moments which interact with<br />
local nuclear quadrupole electric fields EQ.<br />
The above model is a less rigorous equivalent of<br />
the usual analysis in terms of the quadrupole interaction<br />
as EQ = eQS/r 4 , where S = 25 is taken as the<br />
Sternheimer antishielding factor, the 75 As gyromagnetic<br />
ratio 7 = 0.73 MHz/kG, Q = 0.3 • 10" 24 cm 2 ,<br />
a = 10 24 cm 3 (assumed isotropic), ro = 1.2 • 10~ 8<br />
cm (estimated as one-half the As—Ga lattice distance,<br />
at the center of the covalent bond), and<br />
N = 10 22 cm" 3 . Upon application of typical circuit<br />
parameters, scaled from the estimate given in<br />
detail in ref. (3), one obtains an approximate ratio of<br />
the 75 As NERD signal to the conventional magnetic<br />
NMR signal in the present experiment of about 1/10<br />
to 1/100.<br />
III. Experimental Results<br />
The arrangement for a two-quantum NERD experiment<br />
consists of two independent resonant circuits:<br />
an RF transmitter coil tuned to frequency<br />
w/2ir, inside of which is contained the sample,<br />
housed between two plates of a receiver capacitor<br />
tuned to frequency 2w/2vr = 13 MHz. The receiver<br />
is one used in a typical pulsed NMR system. For<br />
our measurements a single crystal of semi-insulating<br />
GaAs with dimensions 1.4 x 1.4 x 0.1 cm 3 is placed<br />
with the (111) crystal planes parallel to the capacitor<br />
plates and transmitter coil axis. The circuits<br />
are cooled to 77 K to reduce noise and ensure high<br />
resistivity of the GaAs sample.<br />
Applying the stick and ball model to the structure<br />
around an As atom shown in Figure 1, using<br />
isotropic polarizabilities for the four nearest neighbors,<br />
results in an induced polarization<br />
aeQ5 . 2<br />
Pind = "J^Q 8111 6 £> + (£» (3)<br />
for the (111) crystal orientation described above,<br />
where 0 is the angle between the static polarizing<br />
magnetic field Ho and the Stark field Eo. The polarization<br />
P;nci is summed over the spin ensemble to<br />
obtain the macroscopic polarization PQ expressed<br />
in eqn. 2, which is proportional to the signal voltage<br />
V.<br />
A DC electric field on the order of |E0 =<br />
20 kV/cm is applied to the capacitor to provide<br />
the linear Stark shifts. The Stark-induced electric<br />
field gradient for this orientation is given by eq =<br />
2R|Eo|/3, where R = 1.9 x 10 10 cm" 1 is the linear<br />
Stark coefficient (4) for 75 As. The resulting quadrupole<br />
frequency shift is<br />
3 cos 6 — 1 (4)<br />
The angle 8 = 90° is chosen to provide the maximum<br />
NERD signal and an wq of the order of 7 kHz for<br />
the 75 As nuclei. Figure 1 shows the energy-level<br />
diagram and the NMR and NERD spectra for this<br />
system.<br />
Figure 2 shows 75 As two-quantum FID and echo<br />
signals and the interference between them for a two<br />
pulse 90x — r — 90~)-x sequence. The inverses of all<br />
RF pulse widths exceed level broadening and electric<br />
Stark shifts. The second pulse alternates in phase by<br />
180° from one two-pulse sequence to the next. The<br />
alternate data runs are added and subtracted from<br />
the signal average so that the nuclear signals add but<br />
the reactive pickup signals from the constant phase<br />
transmitter pulse cancel out. As the pulse spacing<br />
time r is increased, the emergence of the electric<br />
quadrupole echo at t—2r may be seen, although it<br />
is rapidly attenuated by dephasing due to magnetic<br />
inhomogenaeties and dipolar interactions.<br />
The prediction of FID and echo signals may be<br />
carried out by use of the Majorana formula (5) to<br />
evaluate spin wave functions and expectation values,<br />
or a density matrix technique such as that devised<br />
by Bowden and Hutchison (6) may be used.<br />
Since the spin levels are broadened by both electric<br />
quadrupole and magnetic dipolar perturbations,<br />
we assume for simplicity that the broadenings due<br />
to these perturbations are independent of one another.<br />
The echo refocusing of electric strain inhomogeneous<br />
isochromats in this picture accounts for
130 Bulletin of Magnetic Resonance<br />
CD<br />
i—l<br />
c<br />
ID<br />
£_<br />
0<br />
i l-Quantum NMR<br />
*<br />
i<br />
i<br />
i<br />
i<br />
i<br />
i<br />
i<br />
i<br />
i<br />
1<br />
i 1<br />
i /<br />
2-Quantura NERD<br />
A<br />
/ '<br />
\<br />
/ ' \ M\<br />
/ ' M<br />
;<br />
A<br />
-20 -10 0 10<br />
Frequency Offset (kHz)<br />
20<br />
2co-coa<br />
2co+coa<br />
Figure 1: Tetrahedral structure of the four nearest neighbors in the zinc-blende structure, with the resulting<br />
energy-level diagram and NMR and NERD spectra for a spin 1=3/2 nucleus subject to a Stark-induced<br />
quadrupole shift. In the bottom plot the dotted line shows the spectrum of a normal NMR experiment on<br />
Stark shifted 75 As in GaAs, while the solid line shows the spectrum of a two-quantum NERD experiment on<br />
the same sample.<br />
observed NERD echo signals. As we are detecting<br />
a two-quantum coherence, the magnetic broadening<br />
isochromats do not refocus at the same time as the<br />
quadrupole interactions for a two pulse sequence.<br />
Therefore the NERD echo amplitude lifetimes T2e<br />
remain very short, on the order of a millisecond, because<br />
of the defocusing caused by inhomogeneous<br />
and homogeneous magnetic broadening. The quadrupole<br />
echo is visible because the quadrupole dephasing<br />
time, T£Q = 50 /xs, is significantly less than<br />
the magnetic dephasing time, TgM = 200 us.<br />
The dotted lines in Figure 2 are fits to the data<br />
according to this simple model of independent magnetic<br />
and quadrupolar broadening, where only the<br />
pulse separation time t is varied. The inverse of<br />
the quadrupole broadening of the system varied between<br />
T20 — 40 and 50 /zs during the data runs<br />
because of progressive damage to the sample caused<br />
by the applied high voltage. We believe this damage<br />
is caused by the migration of charged defects<br />
or impurities, which over time produces changes in<br />
bulk strain and results in charge layers at the (111)
Vol. 16, No. 1/2 131<br />
en<br />
-i—i<br />
cz<br />
~*<br />
(Arb.<br />
r—\<br />
CD<br />
C<br />
CD<br />
~—4<br />
1<br />
w<br />
X<br />
-100 0 100<br />
Time<br />
\y<br />
200<br />
(US)<br />
55<br />
20<br />
320<br />
240<br />
• ^ —<br />
jiS<br />
US<br />
300 400<br />
Figure 2: The detected two-quantum NERD signals following two 90° pulses. The time r between the two<br />
pulses is shown for each run and the runs have been offset so the second pulse is at t = 0 on the horizontal<br />
axis. The dotted lines are fits to the experimental data, as described in the text.<br />
surfaces. We have found that a fixed electric field<br />
ranging up to lkV/cm caused by these charge layers<br />
opposes the applied field Eo. This fixed field can be<br />
removed by warming the sample to room temperature<br />
for several hours, which then yields an increase<br />
of T^Q to 80-90 [is.<br />
A clearer measurement of the two-quantum<br />
NERD echo may be obtained by observing the<br />
echoes produced by a three pulse sequence, as this<br />
allows simultaneous or near-simultaneous refocusing<br />
of the magnetic and electric isochromats. For<br />
spin 1 = 3/2 nuclei the first two pulses generate<br />
one-, two-, and three-quantum coherences among<br />
the spin levels, and the third pulse in turn transfers<br />
these prepared coherences among the levels<br />
to provide observable two-quantum electric signals.<br />
Figure 3 shows two sets of data obtained from a<br />
90x — Ti — 90-tx ~ T 2 ~ 90x sequence. In the top<br />
trace T\ = 50 [is, which is relatively short compared<br />
to the inhomogeneous dephasing time T^Q = 70 fis.<br />
A portion of the two-quantum coherence seen as an<br />
FID following the second pulse is recreated after the<br />
third pulse as an echo at time t = 2T2 = 1 /is. In this<br />
case both the electric and the magnetic isochromats<br />
refocus at approximately the same time. The bottom<br />
trace shows the multiple echoes formed by refocusing<br />
of the electric isochromats when T\ = 200 /xs<br />
and T2 = 600 [is are both longer than T^Q. We<br />
observe the three echoes labeled El, E2, and E3 at<br />
times predicted by the inhomogeneous broadening<br />
model, but cannot achieve a reasonable fit to the<br />
signal amplitudes for the different echoes for these<br />
three pulse sequences.<br />
IV. Conclusions<br />
The direct detection of electric two-quantum coherence<br />
signals from an I = 3/2 spin system has<br />
been demonstrated without the need for an extra<br />
RF pulse to transfer unobservable two-quantum coherence<br />
to one-quantum coherence as required in
132 Bulletin of Magnetic Resonance<br />
CO<br />
-I-J<br />
cz<br />
en<br />
-i—i<br />
CO<br />
RF Pulses<br />
RF Pulses<br />
500 1000<br />
Time (|is)<br />
E2 E3<br />
^ .. A A ,<br />
1500<br />
Figure 3: Two-quantum NERD FID and echo signals<br />
from three 90° x-axis pulses. Pulses are applied<br />
at t = 0, 50 and 550 /is for the top trace and t = 0,<br />
200 and 800 /xs for the bottom. The stronger signals<br />
after the second pulse in each trace are scaled<br />
down by a factor of five relative to the signals after<br />
the third pulse, and the lower trace is scaled up by<br />
a factor of two relative to the upper trace. Three<br />
quadrupole echoes, centered at t = 1000, 1200, and<br />
1400 /xs, labeled El, E2, and E3, are visible in the<br />
bottom trace.<br />
NMR multiquantum methods. The time evolution<br />
of the two-quantum coherence is mapped out in one<br />
"shot," whereas for NMR an additional inspection<br />
pulse must be applied for successive times in repeated<br />
pulse sequences to map out the two-quantum<br />
coherence.<br />
Our echo analysis does not take into account the<br />
complicated magnetic dipolar echo-dephasing effects<br />
caused by the pulse reorientation of local dipolar<br />
fields. Many of the predicted echoes which occur<br />
following three pulses not only interfere with FID<br />
transients, but interfere among themselves if they<br />
are to be observed at all because the echo decay lifetimes<br />
are too short to always clearly resolve them.<br />
In some instances a predicted echo cannot be seen,<br />
or an echo predicted to be canceled out by the applied<br />
pulse sequence phase cycling is clearly visible.<br />
We do not understand this at present and hope to<br />
resolve it in a later report.<br />
Given a fixed number of pulse excited spins over<br />
the entire spin spectrum, the initial FID amplitude<br />
of the electric polarization depends only upon the<br />
local distance and polarizability of atomic bonds<br />
and electrons in the vicinity of precessing nuclear<br />
quadrupole moments. On the other hand the initial<br />
FID signal in a conventional pulsed NMR experiment<br />
would be independent of these properties. One<br />
may conceive of experiments in which variations of<br />
these properties may be studied in terms of observed<br />
changes in the initial electric signal. Applications of<br />
external pressure, acoustic vibrations, and electric<br />
fields which induce charge layers in semiconductor<br />
structures or charge density waves in special systems<br />
are examples for future investigations.<br />
Beyond the two-quantum case in NMR, an advanced<br />
and rigorous review of multiple quantum<br />
NMR spectroscopy techniques is provided in a<br />
highly comprehensive account (7) of modern NMR<br />
techniques by Ernst and co-authors. Under one<br />
cover, this account as a book includes descriptions<br />
of the important researches by Ernst and his collaborators<br />
at the ETH, Zurich which were recognized<br />
by the Nobel Prize.<br />
V. Acknowledgments<br />
We gratefully acknowledge helpful discussions<br />
with John Keltner, Larry Wald, and Charles Pennington<br />
and the support of the National Science<br />
Foundation.<br />
VI. References<br />
1<br />
C P. Slichter, "Principles of Magnetic Resonance,"<br />
3rd ed., Chapter 9, Springer-Verlag, New<br />
York/Berlin 1990.<br />
2<br />
M. Bloom and M. A. LeGros, Can. J. Phys.<br />
64, 1522 (1986).<br />
3<br />
T. Sleator, E. L. Hahn, M. B. Heaney, C. Hilbert<br />
and J. Clarke, Phys. Rev. B 38, 8609 (1988).<br />
4<br />
N. Bloembergen, in "Proceedings, XI Colloque<br />
Ampere Conference on Electric and Magnetic Resonance,<br />
Eindthoven, 1962" (J. Smidt, Ed.), p. 39
Vol. 16, No. 1/2 133<br />
North-Holland, Amsterdam, 1963; F.A. Collins and<br />
N. Bloembergen, J. Chem. Phys. 40, 3479 (1961).<br />
5<br />
E. Majorana, Nuovo Cimento 9, 43 (1932); F.<br />
Bloch and I. I. Rabi, Rev. Mod. Phys. 17, 237<br />
(1945).<br />
6<br />
G. J. Bowden and W. D. Hutchison, J. Magn.<br />
Reson. 67, 403 (1966).<br />
7<br />
R. R. Ernst, G. Bodenhausen and A. Wokaun,<br />
"Principles of Nuclear Magnetic Resonance in One<br />
and Two Dimension," Chapter 5, Clarendon Press,<br />
Oxford, 1990.
134<br />
Calender of Forthcoming<br />
Conferences in Magnetic<br />
Resonance<br />
April 9-10, 1994<br />
Symposium on In Vivo Magnetic Resonance<br />
Spectroscopy VII, San Francisco, California<br />
The Symposium is designed to be a participatory<br />
workshop in which many of the attendees will<br />
make presentations concerning their recent experimental<br />
work. The Symposium will emphasize experimental<br />
methods and techniques directed towards in<br />
vivo magnetic resonance spectroscopy.<br />
The Symposium is being held just prior to the<br />
35th ENC meeting, which is also being held in the<br />
Monterey area at Asilomar. Thus, the Symposium<br />
is scheduled to facilitate attending both the Symposium<br />
and the ENC conference.<br />
The deadline for receiving abstracts is<br />
March 4, 1994.<br />
For further information, please contact:<br />
Radiology Postgraduate Education<br />
Room C-324<br />
University of California School of Medicine<br />
San Francisco, CA 94143-0628 USA<br />
Phone: 415-476-5731<br />
Fax: 415-476-9213<br />
For Registration, please call:<br />
Phone: 415-476-5808<br />
Fax: 415-476-0318<br />
April 10-15, 1994<br />
35th Experimental Nuclear Magnetic Resonance<br />
Conference, The Asilomar Conference Center, Pacific<br />
Grove, CA (USA)<br />
For information contact:<br />
ENC<br />
815 Don Gaspar Avenue<br />
Santa Fe, NM 87501<br />
Phone: 505-989-4573<br />
Fax: 505-989-1073<br />
Bulletin of Magnetic Resonance<br />
June 5-10, 1994<br />
12th European Experimental NMR Conference,<br />
Oulu, Finland<br />
The scientific program will be arranged by the<br />
Local Organizing Committee with the support of<br />
national NMR specialists and the EENC International<br />
Committee. Following the traditions of these<br />
conferences a selected group of leading experts will<br />
be invited to give talks on the most recent topics in<br />
experimental NMR spectroscopy. In addition to the<br />
lecture program two poster sessions will take place.<br />
A limited number of contributions will be selected<br />
for oral presentation on the basis of the submitted<br />
abstracts. The organizers will endeavor to create<br />
a setting in which new ideas and critical discussion<br />
will provide a good basis for innovative thinking and<br />
practical conclusions.<br />
The scientific program includes the following<br />
topics:<br />
-New experimental NMR techniques<br />
-Multidimensional NMR techniques<br />
-Relaxation and molecular dynamics<br />
-NMR application to organic and inorganic<br />
chemistry<br />
-NMR in liquid crystals and polymers<br />
-NMR in solids<br />
-NMR in biological systems<br />
-In-vivo NMR spectroscopy<br />
-NMR microscopy and imaging in material sciences<br />
-Data analysis<br />
For scientific and general information contact:<br />
Prof. Jukka Jokisaari<br />
University of Oulu<br />
Department of Physics<br />
FIN-90570 Oulu FINLAND<br />
Phone: +358-81-553 1308<br />
Fax: +358-81-553 1287<br />
E-mail: FYS-JJ@Finou.Oulu.Fi<br />
Lab. Manager Petri Ingman<br />
University of Oulu<br />
Department of Physics<br />
FIN-90570 Oulu FINLAND<br />
Phone: +358-81-553 1622<br />
Fax: +358-81-553 1603<br />
E-mail: Pingman@Phoenix.Oulu.Fi
Vol. 16, No.1/2 135<br />
July 16-21, 1995<br />
International Society of Magnetic Resonance<br />
Conference, Sydney, Australia<br />
The venue will be the University of Sydney,<br />
where there is low-cost student accomodation in addition<br />
to many local hotels and "serviced apartments."<br />
The project already has strong support<br />
from the University, State and Federal authorities.<br />
A particular effort is planned to raise money for<br />
student bursaries to help younger scientists participate<br />
in the meeting. The <strong>ISMAR</strong> conference will be<br />
combined with the Australian Magnetic Resonance<br />
meeting which is usually well attended. It is proposed<br />
to commemorate the 50th anniversary of the<br />
discovery of NMR at this meeting.<br />
The <strong>ISMAR</strong>-95 Committee:<br />
Leslie D. Field (Chairman), David Doddrell<br />
(Convenor), William Bubb (Secretary), Frances<br />
Separovic (Treasurer), Peter Barron, Michael Batley,<br />
Graham Bowden, Paul Callaghan, Bruce Cornell,<br />
John Hanna, Garry King, Glenn King, Philip<br />
Kuchel, Bridget Mabbutt, George Mendz, Barbara<br />
Messerle, Carolyn Mountford, Jim Pope, and Graham<br />
Town.<br />
For further details contact:<br />
Dr. Les Field, Chair <strong>ISMAR</strong>-95<br />
Department of Organic Chemistry<br />
University of Sydney<br />
Sydney NSW 2006 Australia<br />
Phone: 612-692-2060<br />
Fax: 612-692-3329<br />
E-mail: ismar-95@biochem.su.oz.au<br />
The editor would be pleased to receive<br />
notices of future meetings in the field of<br />
magnetic resonance so that they could be<br />
recorded in this column.
136<br />
Recent Magnetic Resonance Books<br />
1 Magnetic Resonance of Carbonaceous Solids<br />
(1993). Edited by Robert E. Botto and Yuzo<br />
Sanads. American Chemical Society, Washington,<br />
D.C., 664 p. (Advances in Chemistry Series).<br />
1 Chemical Society Reviews Volume 22 No. 5<br />
(1993). Contents: Bruker Lecture: The nuclear Zeeman<br />
interaction in electron resonance. The EPR<br />
spectra of organic radical ions. On the possibility of<br />
an insulator-metal transition in alkali metal-doped<br />
zeolites. Some aspects of the electron paramagnetic<br />
resonance spectroscopy of a d-transition metal compounds.<br />
Why can transient free radicals be observed<br />
in solution using ESR techniques? Progressive saturation<br />
and saturation transfer ESR for measuring<br />
exchange processes of spin-labelled lipids and<br />
proteins in membranes. Polarized positive muons<br />
probing free radicals: A variant of magnetic resonance.<br />
The chemistry of cyclopropylmethyl and<br />
related radicals.<br />
l 2D NMR: Density Matrix and Product Operator<br />
Treatment by Gheorghe D. Mateescu and Adrian<br />
Valeriu, Case Western Reserve University (1993).<br />
ISBN 0-13-013368-x, 200 pp.<br />
1 Basic One- and Two-Dimensional NMR Spectroscopy,<br />
Second, Enlarged Edition by Horst<br />
Friebolin, Organic Chemical Institute, Heidelberg,<br />
Germany (1993). VCH Publishers, Inc., New York.<br />
ISBN 1-56081-796-8.<br />
1 Structure Elucidation by NMR in Organic<br />
Chemistry - A Practical Guide by Eberhard Breitmaier<br />
(1993). John Wiley k Sons, New York, NY.<br />
Hardback: ISBN 0-471-93745-2, $63.95; Paperback:<br />
ISBN 0-471-93381-3, $35.00.<br />
1 Progress in Biophysics and Molecular Biology<br />
Volume 59 No. 3 (1993). Contents: Hydration and<br />
heat stability effects on protein unfolding. Derivation<br />
of locally accurate spatical protein structure<br />
from NMR data.<br />
1 Progress in Nuclear Magnetic Resonance Spectroscopy<br />
Volume 25 No. 1-3(1993). Contents: NMR<br />
and fractal properties of polymeric liquids and gels.<br />
x New additions to the list.<br />
Bulletin of Magnetic Resonance<br />
1 Progress in Nuclear Magnetic Resonance Spectroscopy<br />
Volume 25 No. 4(1993). Contents: Sulfur-<br />
33 NMR. Photo-CIDNP of biopolymers.<br />
1 Progress in Nuclear Magnetic Resonance Spectroscopy<br />
Volume 25 No. 5 (1993). Contents: NMR<br />
studies of drug-DNA interactions. NMR studies of<br />
dynamics in nucleic acids.<br />
1 Progress in Nuclear Magnetic Resonance Spectroscopy<br />
Volume 25 No. 6 (1993). Contents:<br />
Density dependence of rotational and translational<br />
molecular dynamics in liquids studied by high pressure<br />
NMR.<br />
1 Annual Reports on NMR Spectroscopy Volume<br />
26 (1993). Contents: Applications of NMR to food<br />
science. Structural studies of peptides and polypeptides<br />
in the solid state by nitrogen-15 NMR. Application<br />
of high-resolution NMR spectroscopy to polymer<br />
chemistry. The application of cation NMR to<br />
living systems: Multinuclear NMR of azo dyestuffs.<br />
1 Biological Magnetic Resonance: NMR of Paramagnetic<br />
Molecules Volume 12 (1993). Contents:<br />
NMR methodology for paramagnetic proteins. Nuclear<br />
relaxation in paramagnetic metalloproteins.<br />
Paramagnetic relaxation of water protons: effects<br />
of nonbonded interactions, electron spin relaxation,<br />
and rotational immobilization. Proton NMR spectroscopy<br />
of model hemes. Proton NMR studies of<br />
selected paramagnetic heme proteins. Heteronuclear<br />
magnetic resonance: applications to biological<br />
and related paramagnetic molecules. NMR of polymetallic<br />
systems in proteins.<br />
Fundamentals of Nuclear Magnetic Resonance<br />
by J. W. Hennel and J. Klinowski (1993). Contents:<br />
Elements of quantum mechanics, magnetic properties<br />
of the nucleus, nuclear paramagnetism, motion<br />
of pagnetization, continuous wave NMR, pulsed<br />
NMR, NMR liquids, the dipolar interaction, and nuclear<br />
magnetic relaxation. ISBN 0-582-06703-0.<br />
1 Biological Magnetic Resonance: Carbohydrates<br />
and Nucleic Acids (1992). Contents: Highresolution<br />
X H-NMR spectroscopy of oligosaccharidealditols<br />
released from muncin-type O-glycoproteins.<br />
NMR studies of nucleic acids and their complexes.
Vol. 16, No.1/2 137<br />
1 Progress in Nuclear Magnetic Resonance Spectroscopy<br />
Volume 24 No. 6 (1992). Contents: Solid<br />
state NMR studies of vanadia based catalysts. NMR<br />
studies of superionic conductors.<br />
1 Biological Magnetic Resonance: In Vivo Spectroscopy<br />
Volume 11 (1992). Contents: Localization<br />
in clinical NMR spectroscopy. Off-resonance frame<br />
spin-lattice relaxation: Theory, and in vivo MRS<br />
and MRI applications. NMR methods in studies<br />
of brain ischemia. Shift-reagent-aided 23 Na NMR<br />
spectroscopy in cellular, tissue, and whole-organ<br />
systems. In vivo 19 F NMR. In vivo 2 H NMR studies<br />
of cellular metabolism. Some applications of ESR to<br />
in vivo animal studies and EPR imaging.<br />
1 Magnetic Resonance Microscopy: Methods and<br />
application in materials science, agriculture and<br />
biomedicine (1992). Edited by Bernhard Blumich<br />
and Winfried Kuhn. VCH, New York, 604 p.<br />
Progress in Nuclear Magnetic Resonance Spectroscopy<br />
Volume 24 No. 4 (1992). Contents:<br />
Multiple-quantum NMR methods.<br />
Advances in Magnetic and Optical Resonance<br />
Volume 17 (1992). Contents: Nonlinear incoherent<br />
spectroscopy. NOESY. Zero-field spin dynamics<br />
and relaxation.<br />
Carbohydrate and Nucleic Acid Structure by<br />
Magnetic Resonance Spectroscopy, Biological Magnetic<br />
Resonance Volume 10 (1992). Edited by<br />
Lawrence J. Berliner and Jacques Reuben, Plenum<br />
Publishing Corp., New York.<br />
In-Vivo Spectroscopy, Biological Magnetic Resonance<br />
Volume 11 (1992). Edited by Lawrence J.<br />
Berliner and Jacques Reuben, Plenum Publishing<br />
Corp., New York.<br />
Progress in Nuclear Magnetic Resonance Spectroscopy<br />
Volume 24 No. 5 (1992). Contents: Relaxation<br />
in the rotating frame in liquids. Sodium magnetic<br />
resonance imaging and chemical shift imaging.<br />
Quadrupolar effects transferred to spin-1/2 magicangle<br />
spinning spectra of solids.<br />
Magnetic Resonance Spectroscopy in Biology<br />
*New additions to the list.<br />
and Medicine (1992). Edited by J. D. De Certaines,<br />
W. M. M. J. Bovee and F. Podo. Contents: Presents<br />
the experimental and basic aspects of functional and<br />
pathological tissue characterization of MRS. A balance<br />
is drawn between the basic science, practical<br />
technologies and biomedical applications. Covers<br />
recent developments in the field: localization, 2D<br />
NMR, spectroscopic imaging, data quantification<br />
and quality assessment, as well as the basic principles<br />
of magnetic resonance spectroscopy. Pergamon<br />
Press, ISBN 0-08-0410170 (flexicover) $70.00; ISBN<br />
0-08-0410189 (hardcover) $170.00.<br />
In Vivo Magnetic Resonance Spectroscopy I.<br />
Probeheads and Radiofrequency Pulses, Spectrum<br />
Analysis (1992). Edited by M. Rudin, Springer, 345<br />
pp. ISBN 0-387-54547-6 (hardcover) $119.00.<br />
In Vivo Magnetic Resonance Spectroscopy II.<br />
Localization and Spectral Editing (1992). Edited by<br />
M. Rudin and J. Seelig, Springer, 368 pp. ISBN<br />
0-387-55022-4 (hardcover) $119.00.<br />
In Vivo Magnetic Resonance Spectroscopy III.<br />
In Vivo MR Spectroscopy: Potential and Limitations<br />
(1992). Edited by M. Rudin and J. Seelig,<br />
Springer, 293 pp. ISBN 0-387-55029-1 (hardcover)<br />
$98.00.<br />
Annual Reports on NMR Spectroscopy. Volume<br />
24 (1992). Contents: Developments in solid state<br />
NMR. Solid state NMR imaging. NMR studies of<br />
interfacial phenomena. NMR measurements of intracellular<br />
ions in living systems. 199 Hg NMR parameters.<br />
Applications of NMR methods in coal<br />
research.<br />
Progress in Nuclear Magnetic Resonance Spectroscopy.<br />
Volume 24 No. 3 (1992). Contents: Structural<br />
characterization of noncrystalline solids and<br />
glasses using solid state NMR.<br />
Progress in Nuclear Magnetic Resonance Spectroscopy.<br />
Volume 24 No. 2 (1992). Contents: 129 Xe<br />
NMR as a probe for the study of microporous solids:<br />
A critical review. Simulation of 2D NMR spectra for<br />
determination of solution conformations of nucleic<br />
acids.<br />
Progress in Biophysics & Molecular Biology.<br />
Volume 57 No. 1 (1992). Contents: ENDOR and
138<br />
EPR of metalloproteins. Free energy transduction<br />
in polypeptides and proteins based on inverse temperature<br />
transitions.<br />
Progress in Nuclear Magnetic Resonance Spectroscopy.<br />
Volume 24 No. 1 (1992). Contents: 13 C<br />
NMR spectroscopy of oleanane triterpenoids.<br />
1 Nuclear Magnetic Resonance. Volume 22<br />
(1991/1992). Contents: NMR books and reviews.<br />
Theoretical and physical aspects of nuclear shielding.<br />
Applications of nuclear shielding. Theoretical<br />
aspects of spin-spin couplings. Applications of spinspin<br />
couplings. Nuclear spin relaxation in liquids.<br />
Solid state NMR. Multiple pulse NMR. Natural<br />
macromolecules. Synthetic macromolecules. Confer<br />
mational analysis. Nuclear magnetic resonance<br />
spectroscopy of living systems. Nuclear magnetic<br />
resonance imaging. NMR of paramagnetic species.<br />
NMR of liquid crystals and micellar solutions.<br />
^Electron Spin Resonance Volume 13A (1991).<br />
Contents: Organic radicals in solution. Organic radicals<br />
in solid matrices. Organic radicals in solids.<br />
Fluorescence detected magnetic resonance. Theoretical<br />
and physical aspects of ESR. Applications of<br />
ESR in polymer chemistry. Industrial applications<br />
of ESR spectrometry.<br />
l NMR Basic Principles and Progress: NMR at<br />
Very High Field Volume 25 (1991). Contents: A<br />
brief history of high resolution NMR. Molecular<br />
orientation in high-field high-resolution NMR. Behavior<br />
of the NMR relaxation parameters at high<br />
fields. Structural studies of biomolecules at high<br />
field. Solid state NMR in high and very high magnetic<br />
fields.<br />
NMR Basic Principles and Progress: High Pressure<br />
NMR Volume 24 (1991). Contents: Solid state<br />
NMR studies at high pressure. High pressure NMR<br />
investigations of motion and phase transitions in<br />
molecular systems. High pressure NMR studies on<br />
water and aqueous solutions. High resolution variable<br />
pressure NMR for chemical kinetics. Glass<br />
cell method for high pressure, high-resolution NMR<br />
measurements. Applications to the studies of pressure<br />
effects of molecular confirmation and structure.<br />
x New additions to the list.<br />
Bulletin of Magnetic Resonance<br />
NMR Basic Principles and Progress: Deuterium<br />
and Shift Calculation Volume 23 (1991). Contents:<br />
Deuterium NMR in the study of site-specific<br />
natural isotope fractionation (SNIF-NMR) dynamic<br />
NMR spectroscopy in the presence of kinetic hydrogen/deuterium<br />
isotope effects. The IGLOO-<br />
Method: Ab-initio calculation and interpretation of<br />
NMR chemical shifts and magnetic susceptibilities.<br />
Principles of Nuclear Magnetic Resonance Microscopy<br />
(1991). Clarendon Press (Oxford University).<br />
New York, 492 p.<br />
NMR at Very High Field (1991). Guest editor:<br />
J. B. Robert, Springer, 168 pp. ISBN 0-387-52946-2<br />
(hardcover) $79.00.<br />
Transition Metal Nuclear Magnetic Resonance<br />
(1991). Edited by P. S. Pregosin. Contents: The<br />
book contains a collection of review articles concerned<br />
with measuring, understanding and using the<br />
nuclear magnetic resonance spectra of the metals of<br />
Groups 3-12. The reader is provided with a view<br />
on how these nuclei are currently being approached,<br />
and what information can be obtained. The authors<br />
have liberally reproduced spectra as well as correlations<br />
relating metal-NMR data to different physical<br />
characteristics of their molecules. 364 pp. ISBN<br />
0-444-88176-X $169.00.<br />
Chemical Reviews. Volume 91 No. 7 (1991).<br />
Contents: Low-temperature solid-state NMR of proteins.<br />
Structure and dynamics of solid polymers<br />
from 2D- and 3D-NMR. NMR under high gas pressure.<br />
Nuclear magnetic resonance at high temperature.<br />
Gas-phase NMR spectroscopy. Selective<br />
excitation in high-resolution NMR. Application of<br />
the linear prediction method to NMR spectroscopy.<br />
High-resolution fluorine-19 magnetic resonance of<br />
solids. NMR determination of enantiomeric purity.<br />
Solid-state NMR studies of molecular sieve<br />
catalysis. Pulsed electron-nuclear double resonance<br />
methodology. Multidimensional NMR and data processing.<br />
One- and two-dimensional high-resolution<br />
solid-state NMR studies of zeolite lattice structures.<br />
Solid-state NMR studies of DNA structure and dynamics.<br />
Spin-lattice relaxation of coupled nuclear<br />
spins with applications to molecular motion in liquids.
Vol. 16, No. 1/2 139<br />
Progress in Nuclear Magnetic Resonance Spectroscopy.<br />
Volume 23 No. 2 (1991). Contents: Solvent<br />
signal suppression in NMR.<br />
Progress in Nuclear Magnetic Resonance Spectroscopy.<br />
Volume 23 No. 3 (1991). Contents: Modern<br />
methods of NMR data processing and data evaluation.<br />
H NMR magic angle spinning (MAS) studies<br />
of heterogenous catalysis.<br />
NMR - Basic Principles and Progress. Volume<br />
23: Deuterium and Shift Calculation (1991).<br />
Eds.: P. Diehl, E. Fluck, H. Gunther, R. Kosfeld,<br />
J. Seelig. Contents: M.L. Martin, G.J. Martin,<br />
Nantes, France: Deuterium NMR in the Study of<br />
Site-Specific Natural Isotope Fractionation (SNIF-<br />
NMR); H.-H. Limbach, Freiburg, FRG: Dynamic<br />
NMR Spectroscopy in the Presence of Kinetic Hydrogen/Deuterium<br />
Isotope Effects; W. Kutzelnigg,<br />
U. Fleischer, M. Schindler, Bochum, FRG: The<br />
IGLO-Method: Ab-initio Calculation and Interpretation<br />
of NMR Chemical Shifts and Magnetic Susceptibilities.<br />
Approx. 270 pp. 92 figs. 45 tabs.<br />
ISBN 3-540-52949-7.<br />
NMR - Basic Principles and Progress. Volume<br />
24: High Pressure NMR (1991). Eds.: P. Diehl,<br />
E. Fluck, H. Gunther, R. Kosfeld, J. Seelig, J.<br />
Jonas, University of Illinois, Urbana, IL (Guest-<br />
Ed.). Contents: D. Brinkmann, Zurich, Switzerland:<br />
Solid-State NMR Studies at High Pressure;<br />
K.O. Prins, Amsterdam, The Netherlands: High<br />
Pressure NMR Investigations of Motion and Phase<br />
Transitions in Molecular Systems; J. Jonas, Urbana,<br />
IL: High Pressure NMR Studies of the Dynamics<br />
in Liquids and Complex Systems; E.W. Lang, H.-<br />
D. Liidemann, Regensburg, FRG: High Pressure<br />
NMR Studies on Water and Aqueous Solutions;<br />
J.W. Akitt, A.E. Merbach, Lausanne, Switzerland:<br />
High Resolution Variable Pressure NMR for Chemical<br />
Kinetics; H. Yamada, Kobe, Japan: Glass Cell<br />
Method for High-Pressure, High-Resolution NMR<br />
Measurements. Applications to the Studies of Pressure<br />
Effects on Molecular Conformation and Structure.<br />
Approx. 270 pp. 148 figs. 28 tabs. ISBN<br />
3-540-52938-1.<br />
NMR - Basic Principles and Progress. Volume<br />
25: NMR at Very High Field (1991). Eds.: P. Diehl,<br />
E. Fluck, H. Gunther, R. Kosfeld, J. Seelig, J.B.<br />
Robert, CNRS, Grenoble, France (Guest-Ed.). Contents:<br />
R. Freeman, Cambridge, UK, J.B. Robert,<br />
Grenoble, France: A Brief History of High Resolution<br />
NMR; E.W. Bastiaan, C. MacLean, Amsterdam,<br />
The Netherlands: Molecular Orientation<br />
in High-Field High-Resolution NMR; D. Canet,<br />
Vandoeuvre-les-Nancy, France, J.B. Robert, Grenoble,<br />
France: Behaviour of the NMR Relaxation Parameters<br />
at High Fields; D. Marion, Orl ans, France:<br />
Structural Studies of Biomolecules at High Field; U.<br />
Haeberlen, Heidelberg, FRG: Solid State NMR in<br />
High and Very High Magnetic Fields. Approx. 175<br />
pp. 44 figs. 10 tabs. ISBN 3-540-52946-2.<br />
Modern NMR Techniques and Their Application<br />
in Chemistry (Practical Spectroscopy Series Volume<br />
11). Edited by Alexander I. Popov and Klaas Hallenga,<br />
Marcel Dekker, Inc. (1991). ISBN 0-8247-<br />
8332-8<br />
Annual Reports of NMR Spectroscopy. Volume<br />
23 (1991). Contents: NMR studies of isolated spin<br />
pairs in the solid state. The oxidation-state dependence<br />
of transition-metal shieldings. The Cinderella<br />
nuclei. Permutation symmetry in NMR relaxation<br />
and exchange. Nuclear spin relaxation in organic<br />
systems and solutions of macromolecules and aggregations.<br />
NMR of coals and coal products.<br />
Progress in Nuclear Magnetic Resonance Spectroscopy.<br />
Volume 23 No. 1 (1991). Contents:<br />
Nuclear magnetic resonance imaging in the solid<br />
state. Applications of three-and four-dimensional<br />
heteronuclear NMR spectroscopy to protein structure<br />
determination. Angiography and perfusion<br />
measurements by NMR.<br />
EPR Imaging and in vivo EPR (1991). Edited<br />
by Gareth R. Eaton, Sandra S. Eaton, and Keiichi<br />
Ohno, CRC Press, Boca Raton, FL. 320 pages,<br />
$89.95, ISBN: 0-8493-4923-0.<br />
Basic One-and Two-dimensional NMR Spectroscopy<br />
by Horst Friebolin (1991). VCH, New York.<br />
344 pages.<br />
Advances in Magnetic and Optical Resonance<br />
Volume 16 (1991). Contents: Laser excitation and<br />
detection of magnetic resonance. Deuterium relaxation<br />
in molecular solids. On the growth of multiple
140<br />
spin coherences in NMR of solids.<br />
Progress in Biophysics & Molecular Biology Volume<br />
56 No. 1 (1991). Contents: An evaluation of<br />
computational strategies for use in the determination<br />
of protein structure from distance constraints<br />
obtained by nuclear magnetic resonance.<br />
Radiospectroscopy of Natural Substances by B.<br />
F. Alekseev, Y. V. Bogachev, V. Z. Drapkin, A. S.<br />
Serdjuk, N. B. Strakhov and S. G. Fedin, Engl. Tr.<br />
Norell Pr., New Jersey, 1991.<br />
Nuclear Magnetic Resonance Volume 21 (1990/<br />
1991). Contents: Theoretical and physical aspects<br />
of nuclear shielding. Applications of nuclear shielding.<br />
Theoretical aspects of spin-spin couplings. Applications<br />
of spin-spin couplings. Nuclear spin relaxation<br />
in liquids. Solid state NMR. Multiple pulse<br />
NMR. Natural macromolecules. Synthetic macromolecules.<br />
Conformational analysis. Nuclear magnetic<br />
resonance spectroscopy of living systems. Nuclear<br />
magnetic resonance imaging. Oriented molecules.<br />
Heterogeneous systems.<br />
NMR Applications in Biopolymers (1990).<br />
Edited by J. W. Finley, S. J. Schmidt, and A. S.<br />
Serianni. Plenum Press, New York. 515 pages.<br />
Fourier Transforms in NMR, Optical, and Mass<br />
Spectrometry, a User's Handbook (1990). Alan G.<br />
Marshall and Francis R. Verdun. Elsevier, Amsterdam<br />
and New York. 450 pages. Paperback, $49.95.<br />
ISBN 0-444-87412-7.<br />
Nuclear Magnetic Resonance Volume 19, Specialist<br />
Periodical Reports (1990). G. A. Webb, Senior<br />
Reporter. Royal Society of Chemistry, London.<br />
591 pages. $252.00. ISBN: 0-85186-422-8.<br />
A Compilation of Chemical Shift Anisotropies<br />
(1990). T. Michael Duncan. The Farragut Press,<br />
Madison, Wisconsin. 158 pages. $24.95, paperback;<br />
$39.95, hardcover. ISBN: 0-917903-01-3.<br />
NMR, Basic Principles and Progress Volume<br />
22, Isotope Effects in NMR Spectroscopy (1990).<br />
Edited by P. Diehl, E. Fluck, H. Giinther, R.<br />
Kosfeld, and J. Seelig. Springer-Verlag, New<br />
York/Berlin. 173 pages. $75.00. ISBN: 0-387-<br />
51286-1.<br />
Bulletin of Magnetic Resonance<br />
Electron Paramagnetic Resonance of Exchange<br />
Coupled Systems by A. Bencini and D. Gatteschi,<br />
Springer Verlag, Berlin, 1990.<br />
Modern Pulsed and Continuous Wave Electron<br />
Spin Resonance by L. Kevan and M. K. Bowman<br />
(1990). Wiley, New York.<br />
Transition Ion Electron Paramagnetic Resonance<br />
by J. R. Pilbrow, Clarendon Press, Oxford,<br />
1990.<br />
Electron Paramagnetic Resonance of Exchange<br />
Coupled Systems by A. Bencini and D. Gattechi<br />
(1990). Springer, 287 pp. ISBN 0-387-50944-5<br />
(hardcover) $83.00.<br />
Isotope Effects in NMR Spectroscopy by S.<br />
Berger, J. M. Risley, N. M. Sergeyev and<br />
R. L. Van Etten (1990). Springer, 173 pp. ISBN<br />
0-387-51286-1 (hardcover) $83.00.<br />
17 O NMR Spectroscopy in Organic Chemistry<br />
(1990). Edited by David W. Boykin. This book provides<br />
a comprehensive review of the application of<br />
17 O NMR spectroscopy to organic chemistry. Topics<br />
include the theoretical aspects of chemical shift,<br />
quadrupolar and J coupling; 17 O enrichment; the<br />
effect of steric interactions on I7 O chemical shifts of<br />
functional groups in flexible and rigid systems; the<br />
application of 17 O NMR spectroscopy to hydrogen<br />
bonding investigations; mechanistic problems in organic<br />
and bioorganic chemistry; and 17 O NMR spectroscopy<br />
of oxygen monocoordinated to carbon in<br />
alcohols, ethers, and derivatives. CRC Press, Inc.,<br />
Florida. ISBN: 0-8493-4867-6.<br />
Advances in Magnetic and Optical Resonance.<br />
Volume 15 (1990). Contents: Iterative methods in<br />
the design of pulse sequences for NMR excitation.<br />
Electron-nuclear polarization transfer in the nuclear<br />
rotating frame. Multipole NMR. Solid state and solution<br />
NMR of nonclassical transition metal polyhydrides.<br />
Low-frequency magnetic resonance with<br />
a dc SQUID.<br />
Advances in, Biophysical Chemistry. Volume 1<br />
(1990). Contents: Stable-isotope-assisted protein<br />
NMR spectroscopy in solution. 31 P and H twodimensional<br />
NMR and NOESY-distance restrained<br />
molecular dynamics methodologies for defining
Vol. 16, No.1/2 141<br />
sequence-specific variations in duplex oligonucleotides:<br />
A comparison of NOESY two-spin approximation<br />
and the relaxation matrix analyses.<br />
NMR study of B- and Z-DNA hairpins of d[(CG)3]<br />
in solution. Molecular dynamics simulations of carbohydrate<br />
molecules. Diversity in the structure of<br />
hemes.<br />
Biological Magnetic Resonance. Volume 9<br />
(1990). Contents: Phosphorus NMR of membranes.<br />
Investigation of ribosomal 5S ribonucleic acid solution<br />
structure and dynamics by means of highresolution<br />
nuclear magnetic resonance spectroscopy.<br />
Structure determination via complete relaxation<br />
matrix analysis (CORMA) of two-dimensional nuclear<br />
overhauser effect spectra: DNA fragments.<br />
Methods of proton resonance assignment for proteins.<br />
Solid-state NMR spectroscopy of proteins.<br />
Methods for suppression of the H2O signal in proton<br />
FT/NMR spectroscopy: A review.<br />
Progress in Nuclear Magnetic Resonance Spectroscopy.<br />
Vol. 25 pt. 5 (1990). Contents: Solid<br />
state NMR techniques for the study of surface phenomena.<br />
A primer on isotopic labeling in NMR investigations<br />
of biopolymers. Vanadium-51 NMR.<br />
One-dimensional and Two-dimensional NMR<br />
Spectra by Modern Pulse Techniques. Koji Nakanishi.<br />
(1990). University Science Books, Mill Valley,<br />
CA. 234 p.<br />
Annual Reports on NMR Spectroscopy. Volume<br />
22 (1990). Contents: Metal-ion NMR studies of ion<br />
binding. NMR studies of ligand-macromolecule interactions.<br />
Applications of NMR in the analysis of<br />
agrochemicals and pesticides. NMR nuclear shielding<br />
and the electronic structures of macromolecules.<br />
207 Pb-NMR parameters. Nuclear spin relaxation in<br />
diamagnetic fluids part 1. General aspects and inorganic<br />
applications.<br />
Progress in Nuclear Magnetic Resonance Spectroscopy.<br />
Volume 22, pt. 1 (1990). Contents: Scaling<br />
in one and two dimensional NMR spectroscopy<br />
in liquids. Oligosaccharide conformations: Application<br />
of NMR and energy calculations. Relaxation<br />
matrix analysis of 2D NMR data.<br />
Progress in Magnetic Resonance Spectroscopy.<br />
Volume 22, Part 3 (1990). Contents: NMR parameters<br />
of alkynes. Improved methods for quantitative<br />
spectral analysis of NMR data.<br />
Advances in Magnetic Resonance. Volume 14<br />
(1990). Contents: Measurement of dipole-dipole<br />
cross correlation by triple-quantum filtered twodimensional<br />
exchange spectroscopy. Assessment<br />
and optimization of pulse sequences for homonuclear<br />
isotropic mixing. Spin-1/2 description of spins 3/2.<br />
Optical pumping measurements of nuclear cross relaxation<br />
and electrix doublets.<br />
Quarterly Review of Biophysics. Volume 23<br />
(Number 1) February 1990. Contents: Biosynthetic<br />
incorporation of 15 N and 13 C for assignment and interpretation<br />
of nuclear magnetic resonance spectra<br />
of proteins. Heteronuclear filters in two-dimensional<br />
[1H, 1H]- NMR spectroscopy: combined use with<br />
isotope labelling for studies of macromolecular conformation<br />
and intermolecular interactions.<br />
Quarterly Reviews of Biophysics. Volume 23<br />
(Number 2) May 1990. Contents: Heteronuclear<br />
three-dimensional NMR spectroscopy of isotopically<br />
labelled bioilogical macromolecules. Deuterium labelling<br />
in NMR structural analysis of larger proteins.<br />
Use of deuterium labelling in NMR studies of<br />
antibody combining site structure.<br />
Principles of Nuclear Magnetic Resonance in<br />
One and Two Dimensions. Richard R. Ernst and<br />
Geoffrey Bodenhausen. Oxford University Press.<br />
1990. 640 pp. paper $39.95<br />
A Dictionary of Concepts in NMR. S.W.<br />
Homans. Oxford University Press. 1990. 352 pp.<br />
$80.00<br />
Nuclear Magnetic Resonance: Principles and<br />
Theory. Ryozo Kitamaru. Elsevier, New York,<br />
1990.<br />
Quantum Description of High-Resolution NMR<br />
in Liquids. Maurice Goldman. Oxford University<br />
Press. 1990. 288 pp. $65.00<br />
Modern Pulsed and Continuous-wave Electron<br />
Spin Resonance. Edited by Larry Kevan and<br />
Michael K. Bowman. Wiley, New York, 1990. 440<br />
P-
142<br />
Principles of Magnetic Resonance, Second Ed.<br />
by C. P. Slichter, Springer, New York, 1990. 655 p.<br />
Soviet Scientific Reviews Section B: Chemistry<br />
Reviews. Volume 14, Part 2 (1990). Contents:<br />
Pulsed NMR study of molecular motion in solids.<br />
Progress in Nuclear Magnetic Resonance Spectroscopy,<br />
Volume 22 No. 6 1990. Contents: Fieldcycling<br />
relaxometry of protein solutions and tissue.<br />
Implications for MRI. Solid state NMR studies of<br />
local motions in polymers.<br />
Nuclear Magnetic Resonance, Volume 20 1989/<br />
1990. Contents: NMR books and reviews. Theoretical<br />
and physical aspects of nuclear shielding. Applications<br />
of nuclear shielding. Theoretical aspects<br />
of spin-spin couplings. Applications of spin-spin<br />
couplings. Nuclear spin relaxation in liquids and<br />
gases. Solid state NMR Multiple pulse NMR Natural<br />
macromolecules. Synthetic macromolecules.<br />
Conformational analysis. Nuclear magnetic resonance<br />
spectroscopy of living systems. Nuclear magnetic<br />
resonance imaging of living systems. NMR of<br />
paramagnetic species. NMR of liquid crystals and<br />
micellar solutions.<br />
Modern NMR Spectroscopy. A Workbook of<br />
Chemical Problems (1989). Jeremy K. M. Sanders,<br />
Edwin C. Constable, and Brian K. Hunter. Oxford<br />
University Press, Oxford and New York. 119 pages.<br />
Paperback, $19.95. ISBN 0-19-855287-4.<br />
Instrumental Effects in Homodyne Electron<br />
Paramagnetic Resonance Spectrometers (1989). R.<br />
Czoch and A. Francik. Translation by Anna Fidzinska.<br />
Wiley, New York. $69.95. ISBN 0-470-20897-<br />
X.<br />
Spin Labeling: Theory and Applications. Edited<br />
by L. J. Berliner and J. Reuben, Academic Press,<br />
New York, Vol. 3, 1989.<br />
Advanced EPR: Applications in Biology and Biochemistry.<br />
Edited by A. J. Hoff, Elsevier, Amsterdam,<br />
1989.<br />
Pulsed EPR: A New Field of Applications.<br />
Edited by C. P. Keijzers, E. J. Reijerse and J.<br />
Schmidt, North Holland, Amsterdam, 1989.<br />
Bulletin of Magnetic Resonance<br />
Electron Spin Resonance, Specialist Periodical<br />
Report, Vol. 11B, Royal Chemical Society, London,<br />
1989.<br />
Nuclear Magnetic Resonance: Structure and<br />
Mechanism. Edited by Norman J. Oppenheimer and<br />
Thomas L. James, Academic Press, New York, 1989.<br />
507 p. (Methods in Enzymology).<br />
NMR Spectroscopy and Polymer Micro structure.<br />
The Conformation Connection. Alan E. Tonelli.<br />
VCH, New York, 1989. x 252 pp., illus. $69.50.<br />
Methods in Stereochemical Analysis.<br />
Annual Reports on NMR Spectroscopy, Vol. 21.<br />
Edited by G. A. Webb, Academic Press, London,<br />
1989. ISBN: 0-12-505321-5.<br />
EPR of Exchange-Coupled Systems. Alessandro<br />
Bencini and Dante Gatteschi. Springer-Verlag,<br />
Berlin, 1989. 287 pages. ISBN: 0-387-50944-5.<br />
Nuclear Magnetic Resonance, Vol. 18, Specialist<br />
Periodical Reports, G. A. Webb, Senior Reporter,<br />
Royal Society of Chemistry, London, 1989. 511<br />
pages. ISBN: 0-85186-412-0.<br />
Advances in Magnetic Resonance Imaging.<br />
Edited by Ephraim Feig, IBM Research Division,<br />
Thomas J. Watson Research Center. Ablex Publishing<br />
Corporation. 1989. 272 pp. $55.00
Vol. 16, No. 1/2 143<br />
Instructions for Authors<br />
Because of the ever increasing difficulty of keeping<br />
up with the literature there is a growing need for<br />
critical, balanced reviews covering well-defined areas<br />
of magnetic resonance. To be useful these must<br />
be written at a level that can be comprehended by<br />
workers in related fields, although it is not the intention<br />
thereby to restrict the depth of the review.<br />
In order to reduce the amount of time authors must<br />
spend in writing we will encourage short, concise<br />
reviews, the main object of which is to inform nonexperts<br />
about recent developments in interesting aspects<br />
of magnetic resonance.<br />
The editor and members of the editorial board<br />
invite reviews from authorities on subjects of current<br />
interest. Unsolicited reviews may also be accepted,<br />
but prospective authors are requested to<br />
contact the editor prior to writing in order to avoid<br />
duplication of effort. Reviews will be subject to critical<br />
scrutiny by experts in the field and must be<br />
submitted in English. Manuscripts should be sent<br />
to the editor, Dr. David G. Gorenstein, Chemistry<br />
Department, Purdue University, West Lafayette, Indiana<br />
47906, USA. (317) 494 7851. Fax No. 317 494<br />
0239.<br />
MANUSCRIPTS must be submitted in triplicate<br />
(one copy should be the original), on approximately<br />
22x28 cm paper, type-written on one side<br />
of the paper, and double spaced throughout. If the<br />
manuscript cannot be submitted on computer tapes,<br />
floppy disks, or electronically (see below), please<br />
type with a carbon ribbon using either courier 10<br />
or 12, gothic 12, or prestige elite type face with 10<br />
or 12 pitch. All pages are to be numbered consecutively,<br />
including references, tables, and captions to<br />
figures, which are to be placed at the end of the<br />
review.<br />
ARRANGEMENT: Considerable thought<br />
should be given to a logical ordering of the subject<br />
matter and the review should be divided into<br />
appropriate major sections, and subsections, using<br />
Roman numerals, capital letters, and Arabic numerals<br />
respectively. A table of contents should be included.<br />
TABLES: These are to be numbered consecutively<br />
in the text with Arabic numerals. Their place<br />
of insertion should be mentioned in the text, but<br />
they are to be placed in order at the end of the<br />
paper, each typed on a separate sheet. Each table<br />
should be supplied with a title. Footnotes to tables<br />
should be placed consecutively, using lower case letters<br />
as superscripts.<br />
FIGURES are also to be numbered consecutively<br />
using Arabic numerals and the place of insertion<br />
mentioned in the manuscript. The figures are<br />
to be grouped in order at the end of the text and<br />
should be clearly marked along the edge or on the<br />
back with figure number and authors' names. Each<br />
figure should bear a caption, and these should be<br />
arranged in order and placed at the end of the text.<br />
Figures should be carefully prepared in black ink<br />
to draftsman's standards with proper care to lettering<br />
(typewritten or freehand lettering is not acceptable).<br />
Graphs should include numerical scales<br />
and units on both axes, and all figures and lettering<br />
should be large enough to be legible after reduction<br />
by 50-60%. Figures should be generally placed on<br />
sheets of the same size as the typescript and larger<br />
originals may be handled by supplying high-contrast<br />
photographic reductions. One set of original figures<br />
must be supplied; reproduction cannot be made<br />
from photocopies. Two additional copies of each figure<br />
are required. Complex molecular formula should<br />
be supplied as ink drawings.<br />
REFERENCES to the literature should be<br />
cited in order of appearance in the text by numbers<br />
on the line, in parentheses. The reference list is to be<br />
placed on separate sheets in numerical order at the<br />
end of the paper. References to journals should follow<br />
the order: author's (or authors') initials, name,<br />
name of journal, volume number, page, and year of<br />
publication. The abbreviation of the journal follows<br />
that used in the Chemical Abstracts Service Source<br />
Index. References to books should include in order:<br />
author's (or authors') initials, name, title of book,<br />
volume, edition if other than the first, publisher,<br />
address, date of publication, and pages.<br />
FOOTNOTES should be used sparingly and<br />
only in those cases in which the insertion of the<br />
information in the text would break the train of<br />
thought. Their position in the text should be<br />
marked with a superscript Arabic numeral and the<br />
footnotes should be typed at the bottom of the relevant<br />
page in the text, separated from the latter by<br />
a line.<br />
SYMBOLS AND ABBREVIATIONS:<br />
Mathematical symbols should be typewritten wher-
144<br />
ever possible. Greek letters should be identified in<br />
pencil in the margin. In reviews containing a number<br />
of mathematical equations and symbols, the author<br />
is urged to supply a list of these on a separate<br />
sheet for the assistance of the printer; this will not<br />
appear in print. Standard abbreviations will follow<br />
the American Chemical Society's HANDBOOK<br />
FOR AUTHORS names and symbols for units.<br />
PERMISSIONS: It is the responsibility of the<br />
author to obtain all permissions concerned with the<br />
reproduction of figures, tables, etc, from copyrighted<br />
publications. Written permission must be obtained<br />
from the publisher (not the author or editor) of the<br />
journal or book. The publication from which the<br />
figure or table is taken must be referred to in the<br />
reference list and due acknowledgement made, e.g.<br />
reprinted by permission from ref. (00).<br />
REPRINTS: Thirty reprints of a review will<br />
be supplied free to its senior author and additional<br />
reprints may be purchased in lots of 100.<br />
INSTRUCTIONS FOR SUBMITTING<br />
MANUSCRIPTS ON FLOPPY DISKS<br />
OR ELECTRONICALLY: If you have used a<br />
word processor to type your manuscript, please forward<br />
your manuscript after review and revision, in<br />
a computer readable form. Floppy disks or tapes<br />
readable on IBM, DEC, SUN, Silicon Graphics, or<br />
Macintosh computers are acceptable. For direct<br />
submission over the phone lines use 300 - 2400 baud<br />
ASCII transmission. Submission via INTERNET<br />
(address David@chem.purdue.edu) is also recommended.<br />
Additional details will be provided for the<br />
appropriate hand-shake requirements. Please supply<br />
us with the code for interpreting superscripts,<br />
greeks, etc. on your word processor.<br />
Bulletin of Magnetic Resonance
INTERNATIONAL SOCIETY OF MAGNETIC RESONANCE<br />
(<strong>ISMAR</strong>)<br />
MEMBERSHIP APPLICATION AND CALL FOR DUES<br />
Name and Address (Telephone & Fax numbers, e-mail) of <strong>ISMAR</strong> Member<br />
If this is a new membership application, please check box<br />
If you wish to be registered as a member of the Division of Biology and Medicine,<br />
in addition to <strong>ISMAR</strong> itself at no extra charge, please check box.<br />
Regular Member<br />
Bona Fide Student<br />
MEMBERSHIP DUES (Yearly)<br />
$20.00<br />
$10.00<br />
1992<br />
1993<br />
1994<br />
1995<br />
1996<br />
SUBSCRIPTION TO "BULLETIN OF MAGNETIC RESONANCE" (Yearly)<br />
<strong>ISMAR</strong> Members<br />
Non-Members<br />
Libraries<br />
$25.00<br />
$80.00<br />
$80.00<br />
Send this completed form with<br />
your check made payable to:<br />
International Society of Magnetic Resonance<br />
Professor Regitze R. Void, Treasurer<br />
Department of Chemistry<br />
University of California, San Diego<br />
9500 Gilman Drive<br />
La Jolla, CA 92093-0340 U.S.A.<br />
(619) 534-0200; Fax (619) 534-6174<br />
e-mail: rrvold@ucsd.edu<br />
Volume 14 (1992)<br />
Volume 15 (1993)<br />
Volume 16 (1994)<br />
Volume 17 (1995)<br />
Volume 18 (1996)<br />
TOTAL<br />
$<br />
$<br />
$<br />
$<br />
$<br />
$<br />
$<br />
$<br />
$<br />
$<br />
$<br />
•<br />
•<br />
or Wire Funds (in $US) to:<br />
International Society of Magnetic Resonance<br />
Acct. #122200526-050103927<br />
San Diego Trust and Savings Bank<br />
7733 Girard Avenue<br />
La Jolla, CA 92037-5140 U.S.A.<br />
(619) 454-8037
o<br />
re<br />
2 s<br />
©<br />
65<br />
n<br />
65<br />
TO<br />
re<br />
71<br />
O<br />
I ft<br />
n<br />
o •,: >•'<br />
The future of EPR, S. S. Eaton and G. R. Eaton . . . . . .:. . , •/ , . . v3. . . ., . ; 149<br />
Review of the EPR Data on ns^Centers in Crystals, S. V. Nistor,<br />
D. Schoemaker and I. Ursu . .... ... . 193<br />
Survey of the EPR Community on the EPR Database and Related Projects,<br />
C. Rudowicz - 224<br />
Electron Paramagnetic Resonance Investigations of the Cu 2+ ion in a Variety<br />
of H o s t Lattices - A Review, R. M. Krishna and S. K. Gupta .......... 239<br />
Calendar of Forthcoming Conferences 292<br />
Recent Magnetic Resonance Books . . . . ... ,]\-_',. -;•'., ; -,Z..--.:-29&-[<br />
Instructions for Authors . . -.-.,-.''-.... : .:.^w; :• -%\ ; .,-.,298:.<br />
Addendum to D.C: Newitt and E.L. Hahn,<br />
V o l . 1 6 , 1 2 7 ( 1 9 9 4 ) .... ... ..... . . . . . . . . . . . . . , . . ;; v . . . 2 9 9 i
BULLETIN OF MAGNETIC RESONANCE<br />
E.R. ANDREW<br />
University of Florida<br />
Gainesville, Florida, U.S.A.<br />
H. CHIHARA<br />
Osaka University<br />
Toyonaka, Japan<br />
SHIZUO FUJIWARA<br />
University of Tokyo<br />
Bunkyo-Ku, Tokyo, Japan<br />
M. MIK PINTAR<br />
University of Waterloo<br />
Waterloo, Ontario, Canada<br />
The Quarterly Review Journal of the<br />
International Society of Magnetic Resonance<br />
Editor:<br />
DAVID G. GORENSTEIN<br />
NMR Center<br />
The University of Texas Medical Branch<br />
Galveston, Texas 77555-1157 U.S.A.<br />
Phone: 409-747-6800<br />
Fax: 409-747-6850<br />
INTERNET: david@nmr. utmb. edu<br />
Editorial Board:<br />
LAWRENCE BERLINER<br />
Ohio State University<br />
Columbus, Ohio, U.S.A.<br />
GARETH R. EATON<br />
University of Denver<br />
Denver, Colorado, U.S.A.<br />
DAVID GRANT<br />
University of Utah<br />
Salt Lake City, Utah, U.S.A.<br />
CHARLES P. POOLE, JR.<br />
University of South Carolina<br />
Columbia, South Carolina, U.S.A.<br />
ROBERT BLINC<br />
University of Ljubljana<br />
Ljubljana, Slovenia<br />
DANIEL FIAT<br />
University of Illinois at Chicago<br />
Chicago, Illinois, U.S.A.<br />
ALEXANDER PINES<br />
University of California<br />
Berkeley, California, U.S.A.<br />
BRIAN SYKES<br />
University of Alberta<br />
Edmonton, Alberta, Canada<br />
The Bulletin of Magnetic Resonance is a quarterly review journal by the International Society of<br />
Magnetic Resonance. Reviews cover all parts of the broad field of magnetic resonance, viz.. the<br />
theory and practice of nuclear magnetic resonance, electron paramagnetic resonance, and nuclear<br />
quadrupole resonance spectroscopy including applications in physics, chemistry, biology, and<br />
medicine. The BULLETIN also acts as a house journal for the International Society of Magnetic<br />
Resonance.<br />
CODEN: BUMRDT ISSN: 0163-559X<br />
Bulletin of Magnetic Resonance, The Quarterly Journal of International Society of Magnetic<br />
Resonance. 1994 copyright by the International Society of Magnetic Resonance. Rates: Libraries<br />
and non-<strong>ISMAR</strong> members $80.00, members of <strong>ISMAR</strong>, $25.00. All subscriptions are for a volume<br />
year. All rights reserved. No part of this journal may be reproduced in any form for any purpose or by<br />
any means, abstracted, or entered into any data base, electronic or otherwise, without specific<br />
permission in writing from the publisher.
J. ANGLISTER<br />
Israel<br />
G. BODENHAUSEN<br />
Switzerland<br />
R. DESLAURIERS<br />
Canada<br />
E.L. HAHN<br />
U.S.A.<br />
H-J. JAKOBSEN<br />
Denmark<br />
C.L. KHETRAPAL<br />
India<br />
H.C. PANEPUCCI<br />
Brazil<br />
M. PUNKKINEN<br />
Finland<br />
V. SKLENAR<br />
Czechoslovakia<br />
H.W. SPIESS<br />
Germany<br />
J.S. WAUGH<br />
U.S.A.<br />
K. WUTHRICH<br />
Switzerland<br />
Council of the International Society of Magnetic Resonance<br />
President: A. PINES, U.S.A.<br />
Vice-President: M. GOLDMAN, France<br />
Founding Chairman: D. FIAT, U.S.A.<br />
Secretary-General: P. SERVOZ-GAVIN, France<br />
Treasurer: R.R. VOLD, U.S.A.<br />
Past President: R. FREEMAN, England<br />
E.D. BECKER<br />
U.S.A.<br />
P.T. CALLAGHAN<br />
New Zealand<br />
S. FORSEN<br />
Sweden<br />
R.K. HARRIS<br />
England<br />
R. KAPTEIN<br />
The Netherlands<br />
B. MARAVIGLIA<br />
Italy<br />
V. PETROSIAN<br />
C.I.S.<br />
J. REISSE<br />
Belgium<br />
C.P. SLICHTER<br />
U.S.A.<br />
H. STERK<br />
Austria<br />
A.B. WIECKOWSKI<br />
Poland<br />
C.S. YANNONI<br />
U.S.A.<br />
M.R. BEND ALL<br />
Australia<br />
S. CLOUGH<br />
England<br />
C. FYFE<br />
Canada<br />
M.J.R. HOCH<br />
5. Africa<br />
D. KELLY<br />
Australia<br />
M. MEHRING<br />
Germany<br />
M.M. PINTAR<br />
Canada<br />
G.C.K. ROBERTS<br />
England<br />
P. SOHAR<br />
Hungary<br />
T. TERAO<br />
Japan<br />
X-W. WU<br />
CTM'/UZ<br />
The aims of the International Society of Magnetic Resonance are to advance and diffuse knowledge<br />
of magnetic resonance and its applications in physics, chemistry, biology, and medicine, and to<br />
encourage and develop international contacts between scientists.<br />
The Society sponsors international meetings and schools in magnetic resonance and its applications<br />
and publishes the quarterly review journal. The Bulletin of Magnetic Resonance, the house journal of<br />
<strong>ISMAR</strong>.<br />
The annual fee for <strong>ISMAR</strong> membership is $20 plus $25 for a member subscription to the Bulletin of<br />
Magnetic Resonance.<br />
Send subscription to: International Society of Magnetic Resonance<br />
Professor Regitze R. Void, Treasurer<br />
Department of Chemistry & Biochemistry<br />
University of California, San Diego<br />
9500 Gilman Drive<br />
La Jolla, CA 92093-0359<br />
(619) 534-0200; FAX (619) 534-6174<br />
e-mail: rrvold@ucsd.edu
Contents<br />
The Future of EPR<br />
Sandra S. Eaton and Gareth R. Eaton<br />
Department of Chemistry<br />
University of Denver<br />
Denver, Colorado 80208<br />
I. Introduction 150<br />
A. Results of the 1987 Workshop 151<br />
B. Research Advances 152<br />
C. Goals for the 1992 Workshop 153<br />
D. A Perspective on EPR 154<br />
E. Current Themes in EPR 155<br />
F. Software 155<br />
G. Applications of EPR 155<br />
H. The Literature of Magnetic Resonance 157<br />
II. State of the Art Lecture - New EPR Methodologies: James S. Hyde 159<br />
A. Q-Band EPR 160<br />
B. Pseudomodulation 161<br />
C. Multiquantum EPR 161<br />
D. Respondent - Melvin P. Klein 162<br />
E. Discussion 163<br />
III. State of the Art Lecture - In Vivo EPR: Harold M. Swartz 163<br />
A. The Scope of In Vivo EPR 163<br />
B. Respondent - Lawrence Berliner 165<br />
C. Discussion 165<br />
IV. State of The Art Lecture - FT EPR and High-Field EPR: Jack H. Freed 166<br />
A. Comparison with NMR 166<br />
B. FT EPR 166<br />
C. High Frequency EPR 167<br />
D. Respondent - Linn Belford 169<br />
E. Discussion 169<br />
V. State of The Art Lecture - Pulsed EPR: Arthur Schweiger 169<br />
A. Comparison with NMR 169<br />
B. New EPR Detection Schemes 170<br />
C. Recent Instrumental Innovations in Pulsed EPR 173<br />
D. Respondent - David Singel 173<br />
E. Discussion 174<br />
VI. Panel Discussion - High resolution EPR 174<br />
A. Kinetics 174<br />
B. Longitudinal Detection 175<br />
C. Signal to noise 175<br />
149
150 Bulletin of Magnetic Resonance<br />
D. Ex Vivo EPR; Aqueous Samples in Flat Cells 175<br />
E. Dielectric Resonators 175<br />
F. Small and/or Dedicated EPR Spectrometers 176<br />
VII. Panel Discussion — In Vivo EPR and Imaging 176<br />
A. The Question of Sample Size 176<br />
B. Frequency Scaling 176<br />
C. Interpretation of In Vivo Spectra 177<br />
D. Magnetic Field and Magnetic Field Gradient Control 177<br />
E. Low Frequency and Imaging Spectrometers 177<br />
F. Nitric Oxide In Vivo 177<br />
G. Noise in FT EPR, EPR Imaging and In Vivo EPR 178<br />
VIII. Panel Discussion — New Perspectives on Spins 179<br />
A. SQUIDs in EPR 179<br />
B. Multiquantum EPR 179<br />
C. Microwave Source Phase Noise 179<br />
D. Pulsed ENDOR 180<br />
E. Dissemination of Modern Techniques 180<br />
F. Software for Visualization of EPR Data 180<br />
IX. Summary on Instrumentation and Methodology 181<br />
X. The Funding Agency Perspective 181<br />
A. Questions Regarding Funding of EPR in the USA 181<br />
B. Information from the Presentation by John Beisler, DRG, NIH 182<br />
XI. The Vendor Perspective 183<br />
A. Bruker (Dieter Schmalbein) 183<br />
B. JEOL (Jack Francis) 184<br />
C. Micro-Now (Clarence Arnow) 184<br />
D. Oxford Instruments (Mark Woolfrey) 184<br />
XII. Summary Perspective 184<br />
A. The Horizons of EPR 185<br />
B. Where EPR is Today 185<br />
C. The Future 186<br />
XIII. Acknowledgment 186<br />
XIV. References 187
Vol. 16, No. 3/4 151<br />
I. Introduction<br />
An NIH-sponsored Workshop on the Future of<br />
EPR was held in Denver, Colorado, August 7, 1992,<br />
following the 15th International EPR Symposium.<br />
Participants in the Workshop included about 65 researchers<br />
from several countries, representatives of<br />
six corporations, and a representative of NIH. This<br />
review of the state of EPR and expression of concerns,<br />
hopes, and predictions for the future is based<br />
on the contributions of the participants in the Workshop.<br />
Those who presented state-of-the-art lectures,<br />
served as respondents, or participated in panel discussions,<br />
are identified in appropriate places in the<br />
text. When a comment/question from another participant<br />
in the Workshop presented information that<br />
should be identified with that person, the person is<br />
identified in the text. Otherwise, the questions and<br />
answers are summarized rather than quoted. The<br />
panel members, and Colin Mailer, Keith Madden,<br />
Carmen Arroyo, Ralph Weber, Francisco Jent, Ron<br />
Mason, and Peter Hofer were particularly active in<br />
the discussions.<br />
Some references to the literature have been provided<br />
to lead the reader to more extensive discussions.<br />
In addition to the well-known review series in<br />
magnetic resonance, five recent books provide summaries<br />
of individual topics in EPR (1-5).<br />
A Workshop on the Future of EPR has a lot to<br />
cover because EPR is such an extensive field. Our<br />
focus for this Workshop is a vision of the future.<br />
Scientists should not shy away from predicting the<br />
future of their field. In fact, scientists have to be<br />
better at this than the self-styled futurists. It is<br />
their profession - scientists spend much of their time<br />
preserving the best of the past and creating a better<br />
future.<br />
A. Results of the 1987 Workshop<br />
Five years ago researchers gathered to say what<br />
the cutting edge results from research laboratories<br />
implied for the future needs of EPR spectroscopy<br />
(6,7). At the first Workshop in 1987 there was a<br />
lot of controversy and a lot of discussion, but there<br />
emerged from the Workshop a fairly clear statement<br />
that the EPR field as it was then certainly needed<br />
the very best sensitivity and signal-to-noise (S/N)<br />
that one could get in the standard X-band region<br />
of the spectrum. This was a very high priority.<br />
Also important, was to exploit the information that<br />
could come from broadband EPR. Researchers really<br />
wanted a frequency range of 60 MHz to greater<br />
than 250 GHz, but suggested that 1-18 GHz would<br />
be a nice goal for the commercial instruments that<br />
would end up in all laboratories. As a short term<br />
matter the goal was narrowed to 3-15 GHz. In summary,<br />
the designs that emerged from the 1987 Workshop<br />
included two types of spectrometer, with the<br />
features listed: First, a 9-9.6 GHz EPR optimized<br />
for sensitivity and S/N. Second, a broadband EPR<br />
spectrometer, with the features:<br />
• 3-15 GHz (1-18 GHz preferred; ultimately, 60<br />
MHz to >250 GHz)<br />
• not an automatic frequency control (AFC)locked<br />
cavity system (except for in vivo studies)<br />
• encode the data from the whole modulation<br />
cycle<br />
• solid state microwave source<br />
• resonators designed specifically for applications<br />
• open architecture<br />
• computer control (with human interface);<br />
• standard computer interface<br />
• computer(s) integrated with the hardware to<br />
run the spectrometer<br />
• attached workstation<br />
• two bridges: continuous wave (CW) and saturation<br />
recovery (SR) electron-spin-echo (ESE)<br />
and Fourier transform (FT)<br />
• 1-2 GHz and 35 GHz accessories<br />
• electromagnet-based<br />
There were a number of issues and concerns with<br />
these choices:<br />
• narrow-band components versus broadband<br />
components<br />
• loss of sensitivity with broadband components
152 Bulletin of Magnetic Resonance<br />
• loss of magnetic field homogeneity away from<br />
the center field<br />
• maybe there would need to be a g=2 spectrometer<br />
and a metals spectrometer<br />
There was vigorous debate in 1987 about<br />
whether the limited R&D effort available for EPR<br />
should be applied to ultimate sensitivity X-band<br />
CW; broadband EPR; or pulsed EPR.<br />
In 1987 many other needs were expressed, from<br />
need for a better high-power travelling-wave-tube<br />
amplifier (TWT), to need for a better measure of<br />
what the temperature really is at the sample, to<br />
needs relating to educating the next generation of<br />
scientists who will apply EPR to solving important<br />
problems in materials science and biomedical problems.<br />
Some of the additional needs expressed in<br />
1987 were discussed in the report on that Workshop<br />
(6).<br />
The design criteria for an instructional EPR<br />
spectrometer synopsizing the desires expressed in<br />
1987 would be:<br />
• a 3 or 4-inch electromagnet, with power supply<br />
that could be run from a standard 110 V wall<br />
outlet;<br />
• no cooling water required for operation for up<br />
to 3 hours at 3400 G;<br />
• >600 G scan range;<br />
• 100-150 mG homogeneity over the sample;<br />
• microwave performance of the Bruker EMS<br />
104;<br />
• data output in a format that students could<br />
take home to work with on a PC or Mac.<br />
While variable-temperature, etc., are nice, as a<br />
practical matter one would not do much of this in<br />
an undergraduate lab. The principles of rigid vs.<br />
fluid solution can be demonstrated with two samples,<br />
rather than freezing one sample. Membrane<br />
melting can even be done with two different samples<br />
rather than one sample as a function of temperature.<br />
With regard to proposals concerning instructional<br />
and routine spectrometers, there was controversy:<br />
some people think there should not be a large<br />
"low tech" market for EPR (as there is in NMR) because<br />
of the relative spectral anisotropies, and the<br />
attendant spectral interpretation difficulty.<br />
1. Progress Since 1987<br />
In spite of the gap between aspirations and reality,<br />
there has been an incredible amount of progress<br />
in the past five years (Table 1). The prototype<br />
of the Bruker ESP380 pulsed EPR spectrometer<br />
was on display at the Symposium the week of the<br />
1987 Workshop. Now this has matured into an instrument<br />
that can revolutionize EPR spectroscopy<br />
for those who rely upon commercial instruments.<br />
Bruker also responded to the needs expressed at the<br />
first Workshop for a low-cost instrument with the<br />
ECS 106. Bruker has produced the EMS 104, the first<br />
EPR designed for quantitative analysis. JEOL has<br />
produced a pulsed EPR spectrometer also, and has<br />
developed low-noise solid state microwave sources so<br />
that they do not use klystrons in their spectrometers.<br />
A small EPR spectrometer developed in Russia<br />
is being marketed by Norell in the USA. Sumitomo<br />
Special Metals has two versions of very small EPR<br />
spectrometers for instructional use. A small EPR<br />
which nearly matches the specifications set forth in<br />
1987 for an instructional EPR spectrometer was on<br />
display by Micro-Now at the Symposium immediately<br />
preceding the Workshop. Note that these criteria<br />
were strictly for a CW spectrometer. There<br />
is need to introduce time-domain techniques to students<br />
if EPR is to prosper. Software specifically for<br />
EPR has been enhanced greatly by the efforts of<br />
Bruker and of Scientific Software Services. Oxford<br />
Instruments introduced new products for temperature<br />
control in response to needs expressed at the<br />
first Workshop.<br />
Progress since 1987 Workshop has been striking.<br />
EPR spectroscopists recognized the benefits of better<br />
communication, and an enhanced community of<br />
users, with the result that the International EPR<br />
(ESR) Society formed. It now has ca. 1000 members<br />
in >35 countries.<br />
B. Research Advances<br />
The advances in EPR during the past five years<br />
have been phenomenal. A totally new branch of<br />
EPR, multiquantum EPR (MQEPR), has been developed<br />
by James S. Hyde and his colleagues, so<br />
now we should categorize EPR in three modes: CW,<br />
pulse and multiquantum.<br />
There has been a rebirth of spin labeling (a technique<br />
which had become thought of as "the old
Vol. 16, No. 3/4 153<br />
Bruker<br />
JEOL<br />
Norell<br />
Table 1: Summary of Commercial EPR Products<br />
ECS-106 low-cost EPR<br />
ESP 300E fully computer-controlled research spectrometer<br />
ESP 380 pulsed ESE and FTEPR, first demonstrated in 1987<br />
EMS 104 first EPR designed for quantitative analysis<br />
Pulsed ENDOR and stochastic ENDOR<br />
pulsed EPR<br />
L-band EPR<br />
PC-based EPR data station<br />
low-noise Gunn diode source<br />
cavity for aqueous samples<br />
small EPR built by St. Petersburg Instruments, Ltd.<br />
Micro-Now<br />
Model 8400 on display at the 1992 EPR Symposium<br />
Sumitomo Special Metals - Spin-X and Spin-XX<br />
Scientific Software Services<br />
PC-based acquisition/manipulation software for Bruker, Varian, and Micro-Now spectrometers<br />
Medical Advances - resonators, and development effort on an S-band bridge<br />
Oxford Instruments - variable temperature accessories<br />
ESR900 can now use nitrogen as well as helium<br />
automatic transfer lines<br />
CF935 dewars for wide range of S- to Q-band cavities<br />
sensor to measure temperature at the sample position<br />
Wilmad Glass - quartzware accessories<br />
high precision EPR tubes<br />
a standard sample for EPR<br />
stuff') due to combinations of loop gap resonators<br />
(LGRs) and site-directed mutagenesis.<br />
Both academic and industrial laboratories have<br />
developed lower noise oscillators.<br />
Indeed, there have been so many major advances<br />
in EPR since 1987 Workshop that there is room only<br />
to list a few keywords (Table 2). The vendors of<br />
EPR equipment and software have an almost impossible<br />
task of predicting the needs of those who<br />
develop and those who use EPR. Part of the purpose<br />
of this Workshop was to have researchers share<br />
their aspirations with manufacturers.<br />
C. Goals for the 1992 Workshop<br />
With this background, the goals for the 1992<br />
Workshop were:<br />
• Participants would learn about the power of<br />
new spectroscopic techniques that they could<br />
apply in their research.<br />
• Critique the predictions and desires expressed<br />
during the first Workshop in 1987.<br />
• Provide a new, updated, perspective on the<br />
EPR instrumentation needs of research.<br />
• Present a new set of predictions and criteria.
154<br />
Table 2: Listing of Recent Research Advances<br />
Bulletin of Magnetic Resonance<br />
multiquantum EPR<br />
multiple resonance<br />
(especially pulsed ENDOR and multiquantum ENDOR)<br />
multifrequency<br />
saturation recovery<br />
ENDOR (especially high frequency CW ENDOR)<br />
high-field EPR and high-frequency EPR<br />
low frequency EPR<br />
spin echo at frequencies other than X-band<br />
new types of resonators<br />
LGR and bridged LGR, dielectric resonator<br />
multidimensional imaging<br />
in vivo EPR<br />
detection of radical adducts in biological fluids<br />
rebirth of spin labeling via<br />
site specific mutagenesis and oximetry<br />
many new pulsed EPR techniques<br />
FT-EPR (Bruker pulsed FTEPR)<br />
pulsed field gradients<br />
pulsed electron nuclear double resonance (ENDOR) using Davies sequence<br />
FT-electron-electron double resonance (FT-ELDOR)<br />
electron spin transient nutation<br />
ESEEM sequences for improved modulation depths, etc.<br />
ENDOR signals in small, lossy protein crystals<br />
low phase noise oscillators<br />
low noise microwave preamplifiers<br />
digital oscilloscopes for signal processing<br />
useful level of computer power at each spectrometer<br />
much more sophisticated data acquisition and analysis software available<br />
pseudomodulation - modeling of the transfer characteristics of an instrument<br />
rebirth of solutions to biological problems by applying the above advances<br />
To focus discussion, the Workshop was organized<br />
around seeking answers to two questions:<br />
• What are the EPR instrumental or software<br />
limits to important experiments in science?<br />
• What are the technology limits on instrumentation<br />
and software for EPR?<br />
These goals were not as crisply addressed as was<br />
hoped in advance, in part because some participants<br />
were too focused on what they had accomplished<br />
with limited resources. In addition, EPR spectroscopists<br />
have become acculturated to cleverly working<br />
within boundary conditions imposed by commercial<br />
instruments and funding, and had difficulty<br />
expressing what these limits are.<br />
D. A Perspective on EPR<br />
As an overall perspective on EPR, consider that so<br />
far most EPR has been CW, and most studies have
Vol. 16, No. 3/4 155<br />
been done in the linear response region, using homogeneous<br />
magnetic fields, using magnetic field scans,<br />
and almost all of this has been done in TE102 cavities<br />
(Table 3). Most of what we celebrate as benchmark<br />
results are exceptions to this generalization.<br />
EPR is becoming (as was revealed at the 15th International<br />
EPR Symposium in the days preceding<br />
the Workshop) multi-frequency, multi-dimensional,<br />
multi-everything; it is non-linear, time-domain;<br />
most of the experiments now are being done with<br />
home-built resonators designed specifically for the<br />
purpose; often experiments are being done in gradient<br />
fields for imaging or in vivo (Table 4). These<br />
changes are becoming necessary because of the<br />
many applications for EPR.<br />
E. Current Themes in EPR<br />
Pulsed, fourier transform, non-linear CW, imaging,<br />
and in vivo techniques are increasingly important.<br />
Resonators are being designed to fit the needs<br />
of the experiment, rather than fitting the experimental<br />
design to the resonator (or deciding not<br />
to do the experiment). Very low (e.g., 250 MHz)<br />
and very high (e.g., 250 GHz) frequency EPR have<br />
expanded our view of spins. Multiple pulse techniques<br />
are bringing to EPR powerful insights analogous<br />
to those that are becoming commonplace in<br />
NMR. Imaging and in vivo techniques are letting us<br />
see EPR spectra at each location in space, permitting<br />
us to perform, for example, oximetry in living<br />
animals. EPR without magnetic field modulation<br />
opens new vistas, in saturation recovery EPR, fastresponse<br />
EPR, and multiple-quantum EPR. These,<br />
and other current themes in EPR are listed in Table<br />
5.<br />
F. Software<br />
In modern EPR, software is so important that it<br />
deserves special emphasis in this report. One must<br />
pay as much attention to the quality of the software<br />
as to the hardware. Increasingly scientists see<br />
that software is a central and crucial part of EPR<br />
spectroscopy. Color graphics displays can help visualization<br />
of the information content of the EPR<br />
data, but can also deflect attention from the computational<br />
artifacts. The field needs a series of wellposed<br />
problems against which new software can be<br />
tested. For example, in the field of image analy-<br />
sis there are standard problems such as the Shepp-<br />
Logan head phantom, against which each new algorithm<br />
is tested.<br />
The crucial issues with regard to quality of EPR<br />
software are highlighted in Table 6.<br />
G. Applications of EPR<br />
There are many fascinating aspects of spin physics<br />
to be explored, and impressive new tools with which<br />
to explore them. However, the funding needed for<br />
these exploratory voyages will come largely because<br />
the insights to be gained have such important applications.<br />
To emphasize the immediate relevance of EPR to<br />
biomedical research, some of the applications in Table<br />
7 are categorized by NIH Institute. Far beyond<br />
the simple characterization of organic free radicals<br />
and transition metal complexes, there are applications<br />
in dental research, research on aging, research<br />
on the eye, etc. The list is of things that people have<br />
already done. This Workshop was more concerned<br />
to look toward the future - applications that are not<br />
well-known yet.<br />
Consider for a moment the EPR spectrum in Figure<br />
1. The spectrum in Figure 1 has terrible S/N,<br />
but it is an important sample - a sample of brain<br />
tissue. The purpose in showing it is not to discuss<br />
the questions of artifacts, etc., but to point out that<br />
the interpretation would be enormously improved if<br />
one could achieve at least an order of magnitude improvement<br />
in S/N. Then, consider how much more<br />
meaningful it would be if it were in vivo instead<br />
of dissected tissue. Then consider potential applications<br />
to heart, lung, etc. As we look toward the<br />
future, we should envision making this measurement<br />
of the EPR spectrum of brain tissue not on excised<br />
tissue but in vivo, localized, with at least an order of<br />
magnitude improvement in S/N, using the panoply<br />
of EPR spectroscopy techniques that have been reported<br />
at the EPR Symposium.<br />
H. The Literature of Magnetic Resonance<br />
According to information provided by Chemical<br />
Abstracts, about 4 times as many NMR as EPR<br />
papers were cited in CA in 1991. In 1986 the ratio<br />
was 3.2. It is possible that the leveling off in recent<br />
years reflects a maturing of CW EPR techniques to
156 Bulletin of Magnetic Resonance<br />
Table 3<br />
EPR has been<br />
CW<br />
LINEAR RESPONSE REGION<br />
MAGNETIC FIELD SCAN<br />
HOMOGENEOUS MAGNETIC FIELD<br />
TE102 CAVITY<br />
Table 4<br />
EPR is becoming<br />
MULTI-FREQUENCY<br />
MULTI-DIMENSIONAL<br />
NON-LINEAR<br />
TIME DOMAIN<br />
PURPOSE-BUILT RESONATORS<br />
HETEROGENEOUS SAMPLES<br />
GRADIENT FIELDS<br />
3225.0 3235.0 3245.0 3255.0 3265.0 3275.0 3285.0 3295.0 3305.0 3315.0 3325.0<br />
Figure 1: X-band EPR spectrum of a piece of excised brain tissue, frozen and kept at ca. -70°C until the<br />
EPR spectrum was recorded at — 160°C.
Vol. 16, No. 3/4 157<br />
Table 5: Current Themes in EPR<br />
Multifrequency and multi-dimensional EPR.<br />
Very low frequency EPR.<br />
Low-frequency in vivo spectroscopy.<br />
Very high frequency EPR.<br />
High-magnetic-field EPR.<br />
Non-linear CW EPR.<br />
EPR imaging.<br />
Oximetry combined with imaging.<br />
EPR without magnetic field modulation.<br />
Multiple-quantum EPR.<br />
Saturation recovery EPR.<br />
Fast-response EPR.<br />
Emphasis on the time domain as well as on the frequency domain.<br />
Pulsed EPR.<br />
Multiple pulse techniques.<br />
Fourier transform EPR.<br />
New EPR pulse sequences.<br />
Magnetic field dependence in ESEEM studies.<br />
Multiple frequency electron spin echo.<br />
Applications of ESEEM to metalloenzymes.<br />
Practical aspects of spectrometer construction.<br />
Resonators designed to fit the needs of the experiment.<br />
Slow-wave and non-resonant microwave structures.<br />
Design and construction of loop-gap resonators.<br />
In vivo EPR.<br />
Spin-trapping studies in vivo.<br />
ENDOR of metal ions.<br />
Software standards and portability in the EPR community.<br />
Calculational and experimental aspects of molecular motion.<br />
Mathematical methods for the interpretation of time-domain EPR.<br />
Interpreting electron spin echo data.<br />
EPR simulation problems.<br />
the point that EPR does not get mentioned in the<br />
title or abstract, even though it was central to the<br />
paper.<br />
There is a troubling concern among EPR spectroscopists<br />
about financial support. Many people<br />
feel that the applications of EPR are more important<br />
than has become common knowledge. One perspective<br />
uses number of published papers as a measure<br />
of the overall importance to science. Table 8<br />
compares numbers of papers published in that part<br />
of science that explores electron spins and that part<br />
of science that uses other analytical methodologies.<br />
These numbers are just for the topics covered in<br />
Chemical Abstracts, which covers only about 12,000<br />
journals (a small subset of science). Over a fiveyear<br />
period EPR has grown but some other topics<br />
are growing very rapidly. Vendor decisions about<br />
their allocation of effort and resources, and funding<br />
agencies deciding upon allocation of resources, are<br />
responses to perceptions of whether this quantification<br />
of journal articles also reflects importance.<br />
C. P. Poole, in Vol 4, no. 2 of the EPR Newslet-
158 Bulletin of Magnetic Resonance<br />
'(Some would like to add "infallibility" to this list!)<br />
ter, (August 1992) reviewed the EPR (ESR) literature<br />
covered in Physical Abstracts, Georef, Medline,<br />
Chemical Abstracts, etc. His review reveals<br />
that there are some 55,000 papers that have EPR<br />
or ESR in the title or abstract. Only a hundred of<br />
them are about ELDOR. But ELDOR is very important.<br />
One can't apply these numbers directly to<br />
inform funding decisions. However, the numbers are<br />
readily available, and will be used (and misused),<br />
so people concerned about planning for the future<br />
should be aware of them and learn to use them in<br />
an intelligent way.<br />
II. State of the Art Lecture<br />
- New EPR Methodologies:<br />
James S. Hyde<br />
Since the 1987 Workshop there has been a major<br />
advance in Q-band (35 GHz) EPR technology (8,<br />
9). In the past Hyde has focused the community on<br />
going to lower frequency (S-band or L-band) (10-<br />
14), but at this Workshop Hyde presented an emphasis<br />
on going to higher frequency. The message<br />
is the same - there are advantages in doing EPR<br />
away from X-band. The vendors should lead with<br />
appropriate products for research. Multifrequency<br />
capability should be widely available.<br />
A. Q-Band EPR<br />
A recent paper in RSI (9) brought several recent<br />
advances together to greatly improve Q-band performance.<br />
The contributing advances were each first<br />
Table 6: Software Issues a<br />
Function (applicability, boundary conditions)<br />
Performance (accuracy, speed, throughput)<br />
Operational Characteristics (user friendly?!)<br />
Installability<br />
Data Security and Protection<br />
Compatibility (and migratability)<br />
Serviceability (updating, etc.)<br />
Documentation<br />
Support (especially when "locally written")<br />
developed for or demonstrated at a lower EPR frequency,<br />
but now they jointly revolutionize Q-band<br />
EPR. The key contributors are low-noise microwave<br />
sources, loop-gap resonators, low-noise GaAsFET<br />
microwave preamplifiers, and pseudomodulation for<br />
resolution enhancement. The basic ideas were expressed<br />
at the Workshop 5 years ago. When taking<br />
advantage of modern low-noise GaAsFET microwave<br />
amplifiers, overall system improvement requires<br />
also decreasing the phase noise of the oscillator<br />
(15, 16, 17). The improved Q-band spectrometer<br />
incorporates two essential components - a<br />
GaAsFET preamplifier and a Gunn diode source.<br />
There is also a physically small 125 cm long reference<br />
arm electrical length equalizer that was created<br />
in a block by making two halves with a numerically<br />
controlled mill and screwing them together. The<br />
following equation, from the book by Robbins (18),<br />
summarizes the phase noise problem, as the phase<br />
noise density to carrier ratio:<br />
N, op 1 FkT /fo\ 2<br />
P 2P4QUW<br />
where Nop is the phase noise at frequency fm relative<br />
to a reference frequency fo; F is the noise figure<br />
characteristic of the device, Q is the quality factor of<br />
the tank to which the device is coupled. The power<br />
P is on both sides of the equation. The key message<br />
from this equation is that the phase noise increases<br />
as the square of the microwave frequency, and decreases<br />
as the square of the Q of the cavity to which<br />
the device is coupled.<br />
Hyde used a high-Q TEQH cavity with the Gunn
Vol. 16, No. 3/4 159<br />
Table 7: Applications of EPR<br />
Materials Sciences<br />
Magnetic interactions<br />
polymer super-paramagnets<br />
ferrimagnets<br />
ferromagnets<br />
anti-ferromagnets<br />
Superconductivity<br />
Conducting polymers<br />
Chemistry and Physics<br />
Determination and characterization<br />
Spin distributions<br />
Orbital interpretations<br />
Kinetics<br />
Spin trapping<br />
Topics arranged in accordance with NIH Institutes:<br />
General Biomedical<br />
Study normal and abnormal physiological function and disease states<br />
as directly, and as non-invasively as possible.<br />
Characterize metalloproteins, motion of biomolecules, free radical production, etc.<br />
Measurement of O2 in each organ system.<br />
Spin labeling to study organ-specific macromolecules and reactions.<br />
Heart, Lung, and Blood<br />
Oxidative reactions - ischemia and reperfusion injury<br />
Study directly the free radicals in heart tissue<br />
Radical generation during cardiac surgery<br />
Oxidative damage of lipoproteins<br />
Radicals in phototherapy<br />
Detection of NO2 exposure<br />
Diabetes and Digestive and Kidney Diseases<br />
Diabetes mellitus, Type I<br />
Ischemia-reperfusion gastric lesions<br />
The liver and kidney, along with the heart, contain the highest<br />
concentrations of free radicals (other than pigmented tissue).<br />
Halocarbon metabolism<br />
Arthritis and Musculoskeletal and Skin Diseases<br />
Inflammation<br />
Magnetic resonance imaging of extremities<br />
Characterization of contrast agents for MRI<br />
Spin labeling study of muscle function
160 Bulletin of Magnetic Resonance<br />
Table 7: Applications of EPR (continued)<br />
Cancer<br />
Free radical generation - cancer initiation and promotion<br />
Vascularization and tumor necrosis<br />
In vivo measurement of oxygen concentration, as a function<br />
of growth of tumors, and in relation to therapy<br />
Toxicity of anticancer drugs (e.g., AZQ)<br />
Neurological Disorders and Stroke<br />
Brain ischemia<br />
Membrane studies<br />
The Parkinson-like impact of MPTP has been postulated to involve free radicals.<br />
Role of neuromelanin in Parkinson's disease<br />
Aging<br />
Radical reactions in the aging process<br />
Free radical reactions implicated in Alzheimer's disease.<br />
Dental Research<br />
Radiation-induced defects in teeth<br />
Free radicals in diseased teeth<br />
Dosimetry based on radiation-induced radicals in teeth<br />
Eye Institute<br />
Structure and dynamics of rod outer segments, rhodopsin, etc.<br />
Free radicals in Green's melanoma<br />
Subject<br />
Table 8 a<br />
atomic spectroscopy<br />
gas chromatography<br />
high performance liquid chromatography<br />
infrared spectroscopy (organic aspects)<br />
infrared spectroscopy (physicochemical aspects)<br />
mass spectrometry<br />
Raman spectroscopy<br />
ultraviolet and visible spectroscopy<br />
X-ray analysis and spectroscopy<br />
carbon & heteroatom NMR<br />
proton magnetic resonance<br />
solid state NMR<br />
electron spin resonance (chemical aspects)<br />
Number of abstracts<br />
1986<br />
4742<br />
2819<br />
3738<br />
2271<br />
5454<br />
2840<br />
2793<br />
4140<br />
4055<br />
4329<br />
6250<br />
3329<br />
1991<br />
4885<br />
2762<br />
4264<br />
2406<br />
6915<br />
4746<br />
3590<br />
4326<br />
4483<br />
5615<br />
8707<br />
895<br />
3834<br />
a The data in this table were provided by Chemical Abstracts Service and are based on the number of abstracts<br />
in their CA Selects categories.
Vol. 16, No. 3/4 161<br />
diode oscillator. The phase noise turned out to be<br />
about 23 dB lower than that of the klystron used in<br />
the Varian Q-band EPR spectrometers. To make an<br />
oscillator a functional unit of a spectrometer one has<br />
to have it respond to the 70 kHz AFC (automatic<br />
frequency control) system. This was accomplished<br />
with piezoelectric devices, since the displacements<br />
needed at Q-band are very small.<br />
Another aspect of phase noise is that its impact<br />
on the overall system can be reduced by decreasing<br />
the demodulation of phase noise by the resonator.<br />
This can be done by using a low-Q resonator, such<br />
as a LGR.<br />
The LGR implementation used at Q-band is coupled<br />
to the waveguide via an iris. The microwaves<br />
are coupled into the large hole of the LGR first, and<br />
then into the small hole, so the coupling is effectively<br />
a 2-step transformer. The LGR holds ca. 30<br />
nL of liquid sample. The phase noise contribution<br />
to the noise in the detected EPR signal is 13 dB<br />
better with the LGR than with the standard TEon<br />
cavity at Q-band.<br />
The Varian detection system had a higher noise<br />
figure than had been realized, and when the lownoise<br />
preamplifier was used a factor of 10 to 20 improvement<br />
was realized over a wide range of conditions.<br />
At high power the noise is from the oscillator.<br />
At low power the signal is 25 dB higher<br />
(due to the GaAsFET), but the noise is only 14 dB<br />
higher. Note that with the low noise amplifier the<br />
system becomes more sensitive to phase noise, because<br />
other noise sources are less important.<br />
Table 9 (9) contains the main lessons from this<br />
work: the power was adjusted to get the largest signal<br />
from the sample. The best geometry known at<br />
X-band yielded S/N = 1815. The best geometry<br />
known at Q-band yielded S/N = 86, about 20 times<br />
worse. The minimum number of spins detected was<br />
reduced by a factor of 200 from X- to Q-band. On<br />
a molarity basis nothing beats a flat cell in a TM<br />
cavity at X-band - it is 200 times better than the optimum<br />
at Q-band on a molarity basis. These swings<br />
of 200 either way create opportunities to optimize<br />
an EPR measurement for a particular problem. The<br />
improvements in the Q-band system have made it<br />
about 10 times better than the old system for detecting<br />
nitroxyl radicals in aqueous solution.<br />
In a Q-band saturation transfer EPR (STEPR)<br />
study Johnson and Hyde noted that in the disper-<br />
sion mode the signal intensity increased by a factor<br />
of 10, and the noise increased by a factor of 10 (20).<br />
The resultant S/N was about 10 times worse than<br />
had been demonstrated at X-band. With the recent<br />
improvements in the Q-band S/N, it can now be predicted<br />
that one should be able to achieve equivalent<br />
S/N in STEPR experiments at X-band and Q-band.<br />
B. Pseudomodulation<br />
The use of pseudomodulation (21, 22) to provide<br />
more features in the spectrum that can be parameterized,<br />
combined with dispersion mode STEPR in<br />
the new Q-band system, make possible major advances<br />
in the use of STEPR. Pseudomodulation is<br />
the convolution of a sinusoidally modulated delta<br />
function with the digitized data.<br />
fn(x, t) = f(x) * 6(x — (ax/2)cosu;t) = Efn(x)ncosnu;xtfn(x)<br />
These terms are derivative-like terms convoluted by<br />
filter functions:<br />
This filter function is rather like a Gaussian filter<br />
- it is sharp in one domain and doesn't ring in the<br />
other domain.<br />
This is a formal expression of what happens when<br />
one has field modulation in an EPR spectrometer.<br />
When one uses pseudomodulation one gets<br />
the derivative effect of the modulation simultaneous<br />
with filtering, with a distortion that is about the<br />
same as would be caused by the field modulation<br />
itself.<br />
C. Multiquantum EPR<br />
Multiquantum EPR (MQEPR) (23-28) is an exciting<br />
new opportunity. It looks especially promising<br />
for Q-band because operation of Q-band EPR<br />
systems at liquid He temperature is very difficult<br />
with 100 KHz magnetic field modulation. Magnetic<br />
field modulation is a severe technical problem for the<br />
design of EPR resonators. For the future one should
162 Bulletin of Magnetic Resonance<br />
P(mW) a<br />
S/N<br />
active volume<br />
of sample (//L)<br />
no. of spins in<br />
the active volume<br />
minimum detectable<br />
concentration (M)<br />
minimum detectable<br />
no. of spins b<br />
Table 9: CW EPR Sensitivity Comparisons<br />
X-Band<br />
TMno cavity<br />
with flat cell<br />
65<br />
1815<br />
162<br />
1.6xlO 14<br />
8.8xlO~ 10<br />
8.8xlO 10<br />
LGR<br />
1<br />
186<br />
1.42<br />
1.4xlO 12<br />
8.6xlO~ 9<br />
7.5xlO 9<br />
Q-Band<br />
TEon cavity<br />
4.1<br />
103<br />
0.31<br />
3xlO u<br />
1.5xlO~ 8<br />
2.9xlO 9<br />
LGR<br />
0.16<br />
86<br />
0.031<br />
3xlO 10<br />
1.9xlO" 8<br />
3.5xlO 8<br />
a Incident power yielding most intense signal<br />
b Extrapolated to S/N = 1. For a single line (note that this data is for the 15 N doublet) the minimum<br />
detectable number of spins would be 50% of the value in the table.<br />
consider multiquantum EPR as a practical alternative<br />
to magnetic field modulation. One could pseudomodulate<br />
to get the normal derivative display. Indeed,<br />
multiquantum EPR (MQEPR) is proposed for<br />
many types of experiments, such as high pressure,<br />
low temperature, etc., where it is technically difficult<br />
to get modulation to the sample.<br />
The bridge for MQEPR uses two sources locked<br />
a specific frequency apart. Irradiation with two microwave<br />
frequencies is equivalent to irradiating with<br />
a single frequency that has been sinusoidally modulated.<br />
Non-linear response of the spin system can<br />
result in intermodulation sidebands, which can be<br />
detected. The outputs are the multiquantum transitions,<br />
which can be combined in various ways to get<br />
useful displays. MQEPR may be a useful methodology<br />
in the future of Q-band EPR.<br />
Multifrequency saturation-recovery (SR) EPR<br />
measurements of Ti of nitroxyl radicals in fluid solution<br />
have been measured from ca. 2.5 GHz to 18<br />
GHz. Ti has been found to be linearly dependent on<br />
microwave frequency. If the lengthening continues<br />
to 35 GHz many EPR experiments (SR, STEPR,<br />
MQEPR) will work better at Q-band than at lower<br />
frequencies. Everything is handier for liquid phase<br />
EPR if the Tis get longer. The construction of a<br />
SR EPR spectrometer at Q-band is now practical<br />
because pin diode switches and other components<br />
have improved enough.<br />
All of these advances taken together (low phase<br />
noise sources, low-noise preamplifiers, MQEPR, and<br />
pseudomodulation) lead to the prediction that in the<br />
next five years Q-band EPR will increase in significance.<br />
Hyde designed the Varian Q-band system in 1962<br />
in the V-line series of spectrometers. In 1970 this<br />
was converted to the E-line series of spectrometers.<br />
About 10 of these were sold each year, making a<br />
commercial success within the small EPR market.<br />
The new Q-band design produced in Hyde's lab is<br />
close to a commercial design. Drawings have been<br />
distributed to labs that have requested them. This<br />
has been produced with federal grant funding associated<br />
with the mission of the National Biomedical<br />
ESR Center.<br />
D. Respondent - Melvin P. Klein<br />
In photosynthesis research EPR signals extend<br />
over thousands of gauss and have to be observed<br />
at temperatures below 10 K. G-anisotropy and exchange<br />
coupling cause signals to be spread over wide<br />
magnetic field ranges. Much of biological spectroscopy<br />
has to be done at very low temperature. With
Vol. 16, No. 3/4 163<br />
present Q-band systems it is difficult to get below<br />
20 K. The variable temperature technology is an important<br />
current effort in which there is need for a lot<br />
of development. There is a severe problem getting<br />
magnetic field modulation to the sample - with one<br />
dewar assembly Klein could get only a few mG of<br />
modulation at the sample. Since the spectra extend<br />
over a couple of kG, the very small magnetic field<br />
modulation does not provide much S/N. The idea of<br />
multiquantum spectroscopy to enable one to scan a<br />
true absorption curve is very attractive for studying<br />
these broad signals.<br />
The critical factors in the development of the<br />
NMR field were the use of multiple resonance (e.g.,<br />
13 C while irradiating 1 H), then the FT techniques,<br />
and now the various multiple pulse technologies. We<br />
now see a parallel evolution going on in EPR - for<br />
example, in the recent work of the Freed laboratory<br />
and the Schweiger laboratory. An important question<br />
is the extent to which these techniques can be<br />
combined with the MQEPR Hyde is developing to<br />
get even better insights. Most of the work of the<br />
Hyde laboratory has addressed CW and SR EPR.<br />
Pulsed methods have a very important future, including<br />
at high frequency.<br />
It is always helpful to be able to use smaller samples,<br />
so new resonators that can be more efficient<br />
and more effective are very important.<br />
Higher-Q resonators have been made using superconducting<br />
materials. Possibly the use of high-<br />
Tc materials will help stabilize solid-state sources.<br />
E. Discussion<br />
For earlier types of EPR spectrometers, Harvey<br />
Buckmaster and coworkers (29, 30) analyzed<br />
the relation between noise and balance of microwave<br />
bridges that incorporate a magic T. They also measured<br />
the characteristics of crystal detectors and<br />
the improvements obtainable with phase-lock microwave<br />
frequency stabilizers. The sensitivity in<br />
1967 of a spectrometer in Buckmaster's lab at 35<br />
GHz was the same as at 9 GHz.<br />
Buckmaster has always used oscillator synchronizers<br />
to decrease the source phase noise. The spectral<br />
purity of the sources is better than 10 Hz at 35<br />
GHz. In his spectrometers, the use of a circulator<br />
in a bridge does not give enough bridge balance to<br />
achieve the needed phase noise. To achieve the 100<br />
dB balance needed it was necessary to use a magic<br />
T, adjust the impedance of the arms, and use critical<br />
coupling to the resonator. The bridge balance<br />
depends on the Q of the resonator. Most commercial<br />
oscillator synchronizers cannot be used with 100<br />
kHz magnetic field modulation; one has to use much<br />
lower frequencies, of the order of 1 to 10 kHz. Proof<br />
that this system works well is the fact that up to the<br />
available 1 W source power the S/N is proportional<br />
to power. The system does not have a microwave<br />
preamplifier. Description of the 35 GHz system was<br />
not published because it was done exactly the same<br />
way the 9 GHz work was done, with comparable<br />
results.<br />
Twenty years ago Roger Isaacson had results<br />
with oscillator synchronizers similar to those reported<br />
here by Buckmaster. Isaacson emphasized<br />
that the key goal is to decrease klystron noise. It is<br />
easy to stabilize klystrons with crystal-locked oscillators.<br />
Beginning many years ago they have performed<br />
EPR with 4 Hz modulation frequency of<br />
light in photosynthesis, where long signal decay<br />
times don't allow higher frequencies. They were able<br />
to get the noise figure quite low by using a crystal oscillator<br />
lock on the klystron. Jack Freed uses phase<br />
locked oscillators to produce low noise at 250 GHz.<br />
Hyde disagrees with the statement that a circulator<br />
cannot be used to achieve low phase noise.<br />
Roger Isaacson also agrees that a magic T is not<br />
needed. D. A. Knoll in Hyde's lab worked on improving<br />
isolation in circulators (38). Instinctively,<br />
one wants to improve the isolation of the circulator<br />
by the amount of the gain of the GaAsFET amplifier.<br />
This is not attained by most commercial<br />
circulators. Colin Mailer reported that he recently<br />
bought an X-band circulator with high isolation at<br />
9.0 GHz (Pacific Microwave Technology, Camarillo,<br />
CA XYG1044-50).<br />
III. State of the Art Lecture - In<br />
Vivo EPR: Harold M. Swartz<br />
A. The Scope of In Vivo EPR<br />
Exciting in vivo EPR is being done in many<br />
laboratories around the world (4, 39-49). Some<br />
3'ears ago it appeared that in vivo EPR imaging was<br />
not going to be worthwhile, but it is now providing<br />
important new information. Unlike NMR imaging,<br />
where the high proton density in the body can
164 Bulletin of Magnetic Resonance<br />
be used for the image, in most cases EPR imaging<br />
requires adding spins to the biological system.<br />
This apparent disadvantage is an advantage in some<br />
classes of experiments, since there is no background<br />
interfering signal. Thus, one can know what is<br />
added, and sometimes direct it to the location in<br />
the body where one wants it.<br />
The scope of in vivo EPR encompasses (4):<br />
• low frequency, low resolution, EPR imaging in<br />
vivo<br />
• high resolution microscopic imaging in vitro<br />
• in vivo spectroscopy, with and without spatial<br />
localization<br />
Important information can be obtained from in<br />
vivo imaging even if the resolution is low. The key is<br />
to keep in mind the biological goals of the measurement.<br />
High resolution microscopic imaging of biological<br />
systems is difficult to do at frequencies below<br />
9 GHz. A useful perspective on in vivo EPR is that<br />
imaging and high resolution spectroscopy are different<br />
ends of a continuum of multidimensional spectroscopy.<br />
For a particular problem one optimizes a<br />
tradeoff between spatial resolution and spectral resolution.<br />
This is an important problem that needs to<br />
be addressed over the next few years.<br />
There are a variety of detector configurations for<br />
in vivo EPR. The best detector is the one that gives<br />
the best result for a particular experiment. The<br />
optimum might be a surface coil, a cavity, a LGR,<br />
a coupled loop, an implanted loop or antenna, etc.<br />
Increasingly, the information one can expect to<br />
get from in vivo EPR is the full spectrum that one<br />
can get from non-in vivo EPR of model systems. In<br />
addition, one gets information that is pertinent to<br />
complex tissues. This includes:<br />
• oximetry<br />
• distribution of MRI contrast agents<br />
• distribution of spin-labeled drugs<br />
• redox metabolism<br />
• detecting reactive intermediates via spin trapping<br />
• biophysical measurements such as fluidity<br />
In vivo EPR can be accomplished with a straightforward<br />
L-band bridge and resonator interfaced to a<br />
commercial spectrometer. The main technical problem<br />
is water. There is no optimum microwave frequency<br />
- high frequency is desired for S/N and low<br />
frequency is desired for penetration of the body. A<br />
wide range of frequencies needs to be available so<br />
one can select for a particular application. The 250<br />
MHz spectrometer in Halpern's laboratory is probably<br />
as low as will give useful S/N for in vivo EPR<br />
for small animals.<br />
Naturally occurring radicals are not at high<br />
enough concentration to be studied with current<br />
EPR technology. Added radicals are of two types:<br />
(1) soluble radicals such as nitroxides, which distribute<br />
more or less uniformly, albeit with some<br />
targeting possible though not yet well exploited;<br />
and (2) particulate species, which are well localized.<br />
Each has advantages and disadvantages. The optimum<br />
type of paramagnetic material will depend on<br />
the experiment. Nitroxides continue to be important<br />
because there is a lot of flexibility in design and<br />
a lot of information has been accumulated about nitroxides.<br />
As the focus on specific targeting of spin<br />
labels increases, there will be increasing dependence<br />
on organic chemists to construct the specific labels<br />
needed.<br />
By using nitroxide radicals and surface coils, one<br />
can monitor accumulation in organs such as liver<br />
and bladder, and one can monitor redox metabolism<br />
as well. In addition to pharmacokinetics, one can<br />
study, via the effect on the EPR signal, temperature<br />
and oxygen concentration. The future of measurement<br />
of temperature and oxygen concentration in<br />
vivo by EPR is bright. EPR is probably the best<br />
technique available for oximetry in vivo. The measurement<br />
of oxygen concentration is very important<br />
medically, and the existing methods do not give the<br />
needed information, especially at medically significant<br />
low levels.<br />
New particulate probes for oxygen concentration<br />
based on lithium phthalocyanine, fusinite, or carbohydrate<br />
chars report oxygen concentrations, via<br />
EPR line broadening, at very low oxygen levels (42,<br />
43, 46-48). They appear to be largely inert (nontoxic)<br />
in vivo. The EPR linewidth response to oxygen<br />
of a fusinite sample has been shown to be reversible<br />
in vivo over a period of six months. Measurements<br />
of oxygen concentration in heart mus-
Vol. 16, No. 3/4 165<br />
cle have been performed. The potential is clearly<br />
present for oximetry of tumors to provide clinically<br />
relevant parameters to tailor radiation therapy and<br />
chemotherapy.<br />
Aspirations for the future include performing simultaneous<br />
assays of multiple sites using magnetic<br />
field gradients. The possibility of this has been established.<br />
The use of EPR to measure oxygen concentration<br />
may be the first to reach routine clinical<br />
application.<br />
The main focus for in vivo EPR in the future is<br />
likely to be in the areas listed below. These are areas<br />
in which EPR is likely to provide useful information,<br />
and information that is not likely to be as readily<br />
accessible by other techniques.<br />
• biophysical parameters, similar to those used<br />
for in vitro systems<br />
• pharmacokinetics, using the paramagnetic<br />
species as the tracer<br />
• redox metabolism, using metabolism of nitroxides<br />
as the parameter<br />
• oximetry, emphasizing repeated non-invasive<br />
measurements in tissues<br />
• viability of cells<br />
• temperature and distribution of temperature<br />
B. Respondent - Lawrence Berliner<br />
In vivo spectroscopy involves engineers, chemists,<br />
and medical professionals. The future depends<br />
rather strongly on the chemists, because in solving<br />
specific biomedical problems a major difficulty<br />
is producing a specific paramagnetic probe.<br />
L-band is the more appropriate frequency if you<br />
want to put a small animal into a spectrometer. In<br />
vivo EPR is a wonderful technique for studying the<br />
health of mice or rats, and it has the potential of<br />
being applied to larger animals and, perhaps, patients.<br />
Ex vivo EPR, e.g., on biopsy samples, on<br />
blood, or on fluid emissions already can yield important<br />
results for larger animals (humans). Depending<br />
upon sample size, one might use X-band, Sband,<br />
or L-band spectroscopy. Unfortunately, these<br />
applications are limited so far to labs that have<br />
enough engineering support to build their own resonators,<br />
since commercial instrument vendors are<br />
not supporting the instrumentation needs of this<br />
area. JEOL is working with a few labs in Japan,<br />
but no such industrial collaborations are known in<br />
the US.<br />
An important problem in in vivo EPR is coupling<br />
the microwaves with the sample. It is helpful<br />
to communicate with medical personnel to use<br />
the word "detector" to describe the EPR resonator,<br />
since this is the nomenclature familiar from radiology-<br />
Low resolution EPR imaging is also a chemical<br />
problem. The more specifically targeted the spin label,<br />
the higher resolution EPR imaging that is possible.<br />
There are lots of biological problems with the<br />
use of nitroxides, especially with regard to their<br />
metabolism. However, the pharmacokinetics will<br />
teach us about redox metabolism. There will be<br />
advantages to starting with a non-radical precursor<br />
which could be biologically reduced to a free radical.<br />
The use of solid particle probes, such as fusinite<br />
or lithium phthalocyanine, is limited at present because<br />
they have to be placed physically in the tissue.<br />
However, once they are in place they can provide information<br />
without further invasive procedures. It is<br />
attractive to contemplate the analogy with MRI of<br />
the use of magnetite coupled to antibodies as the<br />
future of this type of probe. Oximetry by any of<br />
these means holds great promise - the vision for the<br />
future is clinical application.<br />
C. Discussion<br />
One problem with in vivo spectroscopy so far is<br />
that researchers have not been able to achieve S/N<br />
any where near as good as one can with a flat cell<br />
in a TM cavity. Many have tried unsuccessfully to<br />
detect radical adducts in vivo. The Swartz lab has<br />
detected EPR of melanin in frog skin. Because free<br />
radical based lung damage is an important human<br />
health problem, the use of EPR oximetry to monitor<br />
oxygen in the lungs is a goal worth pursuing. Digestive<br />
track and fecal material should be a source<br />
of EPR signals for the study of biological systems.<br />
Unfortunately, these desired target tissues and other<br />
materials do not have radicals in high enough concentration<br />
for current spectrometers.<br />
In vivo could mean plants as well as animals.<br />
Lawrence Berliner has published examples of EPR<br />
imaging in plants (49). There are interesting prob-
166 Bulletin of Magnetic Resonance<br />
lems, but research in the US is driven by funding<br />
sources, and most of the funds available are not oriented<br />
toward study of plants.<br />
Using the organic chemistry developed by Leonid<br />
Volodarsky, it is possible to use diamagnetic molecules<br />
which will become paramagnetic in vivo.<br />
The reason Howard Halpern is using 250 MHz<br />
EPR is to be able to apply it to humans. Penetration<br />
of the microwaves into the body is necessary.<br />
Even at 250.MHz the skin depth is only 7 cm in<br />
muscle and a bit deeper in fat. Limited penetration<br />
depth is not a barrier to all in vivo applications of<br />
EPR. For example, human skin is an important organ.<br />
The EPR of skin of living humans, even EPR<br />
imaging of skin, is accessible to X-band EPR.<br />
Because of the limitations of current spectrometers<br />
much of the discussion emphasized the great<br />
efforts to obtain even a simple CW EPR spectrum of<br />
these in vivo samples. Consider the insights possible<br />
if one could use, for example, FT EPR on these<br />
samples. As noted later, there is no advantage of<br />
FT if one is observing a single-line resonance unless<br />
the data acquisition rate can be increased.<br />
IV. State of the Art Lecture<br />
- FT EPR and High-Field<br />
EPR: Jack H. Freed<br />
A. Comparison with NMR<br />
The developments in the last 15 years in NMR<br />
that have led to the revolutionary importance of<br />
NMR in many branches of science include:<br />
• NMR: high resolution via high magnetic fields<br />
and associated frequencies - e.g. from 100<br />
MHz up to 750 MHz; EPR has available an<br />
even larger jump in frequency, from 9 GHz to<br />
250 GHz.<br />
• FT NMR and 2D FT NMR; EPR - analogous<br />
developments have been realized.<br />
• MRI and its applications to both materials<br />
science and medicine; EPR imaging has not<br />
been applied to humans yet, but already has<br />
many applications in materials science and<br />
biomedicine.<br />
B. FT EPR<br />
Work in the Freed lab has been driven by a<br />
need for better techniques for improved resolution<br />
in dynamics and structure in the chemical physics<br />
of biophysical problems. Five years ago at the Workshop<br />
some very new results in these areas were introduced.<br />
There has been a great deal of progress<br />
since then, including 2D FT EPR (50, 51). The S/N<br />
achievable in FT EPR is illustrated with a 0.75 mM<br />
sample of perdeuterated tempone in 16 microliters<br />
of a smectic liquid crystal. The effective decay rate<br />
of the FID following a microwave pulse for this sample<br />
is 200 ns. This is T?J - it includes both homogeneous<br />
and inhomogeneous broadening. With pulse<br />
widths of 5.5 ns and time resolution of 5 ns, some<br />
40,000 FIDs can be averaged in 6 s. The FID can<br />
be observed for more than 10 times the T£. Figure<br />
2 shows the sensitivity possible with FT EPR.<br />
In addition to the possibilities for enhanced S/N,<br />
FT EPR can also be applied to the study of transient<br />
species (52, 53). One can measure radicals<br />
with submicrosecond lifetimes, generated for example<br />
by a laser pulse, by recording the single pulse<br />
FID and performing Fourier transforms.<br />
The modern era in FT EPR, including initial realization<br />
of 2D FT EPR starts in about 1986 (54).<br />
Applications of 2D FT EPR in the short interval<br />
since then include:<br />
• nationally narrowed - FT EPR, 2D ELDOR;<br />
diffusion in liquid crystals and model membranes<br />
(55);<br />
• viscous fluids and powders - experiments are<br />
more challenging but they yield more microscopic<br />
details about motion - applicable techniques<br />
include 2D ESE, 2D FT, SECSY, 2D<br />
ELDOR; these techniques are also useful for<br />
structural studies via nuclear modulation.<br />
• 2D FT EPR imaging with pulsed field gradients<br />
- spatially resolved 2D FT EPR (56, 57);<br />
Now one can with 2D FT EPR obtain nuclear<br />
spin flip rates, Heisenberg exchange rates, and from<br />
them molecular rotational and translational diffusion<br />
coefficients. All of these are measured simultaneously<br />
on the same sample, so there is no problem<br />
with comparisons due to sample preparation or sample<br />
conditions - and, they are obtained quickly.
Vol. .16, No. 3/4 167<br />
Ld<br />
Q<br />
q<br />
cs<br />
168 Bulletin of Magnetic Resonance<br />
1GPC/P0PC ELDOR 66C T-200nj silt 16PC/POPC ELDOfl 66C T-60Onf ellt<br />
taPC/POPC ELOOR 66C T-1200ni «lfw<br />
16PC/POPC ELOOR 66C T-2000ns elfv<br />
Figure 3: 2D-FT-ESR spectra of nitroxide radicals in lipid dispersions. For this sample, Tj is ca. 20-30 ns.<br />
Cross peaks in the upper left spectrum (for short mixing times) result from electron-nuclear dipolar interactions.<br />
At longer mixing times (lower right-hand spectrum) Heisenberg exchange dominates. Unpublished<br />
results provided by Jack Freed.<br />
play due to cross relaxation can be observed growing<br />
in as a function of mixing time.<br />
The technical challenge with performing pulsed<br />
FT EPR imaging was creating pulsed magnetic field<br />
gradients of 100 G/cm that persist for less than 100<br />
ns. All of the advantages of FT NMR imaging become<br />
available to research on electron spins via this<br />
FT EPR and pulsed field gradient technology. Spatially<br />
resolved 2D FT EPR (thus three dimensions)<br />
has been demonstrated for samples containing 15 N<br />
and 14 N nitroxides.<br />
C. High Frequency EPR<br />
High frequency EPR yields:<br />
• higher g-factor resolution - one can read the<br />
three nitroxyl g-values directly from the spectrum<br />
at 250 GHz; even for the nearly free electrons<br />
trapped in solids the g-tensors can be<br />
measured.<br />
• greater sensitivity to dynamics - one can measure<br />
picosecond motions, since the sensitivity<br />
of line widths to motion is about a thousand
Vol. 16, No. 3/4 169<br />
times greater at 250 GHz than at 9 GHz;<br />
• transition metal spectra with large zero-field<br />
splittings (ZFS) (63) - e.g., a Mn(II) complex<br />
with a ZFS of 5800 G can be analyzed in terms<br />
of second order perturbation theory.<br />
• better absolute sensitivity will eventually<br />
be realized, once spectrometer upgrades described<br />
elsewhere are made.<br />
The transition to high frequency EPR brings<br />
a new vocabulary to EPR. The spectrometers are<br />
built using quasioptics, and techniques are those of<br />
far infrared not microwave technology. Both hardware<br />
and software have to be developed to perform<br />
and interpret these experiments (64-67).<br />
Although the above techniques are available to<br />
others (visitors are encouraged to come to Cornell to<br />
learn about unpublished details), they are not fully<br />
developed, since there has been little funding for<br />
this work. There are definite needs to improve the<br />
technology. The most important technical problem<br />
in FT EPR is spectrometer deadtime. With 1 KW<br />
pulses the current deadtime is 60 ns. The ringing<br />
time of the low-Q resonator used implies one should<br />
be able to reach a deadtime of 25 ns. It is also important<br />
to extend these techniques to multi-frequencies,<br />
because there are advantages and disadvantages for<br />
various experiments at different frequencies.<br />
D. Respondent - Linn Belford<br />
These 2D FT EPR techniques are beautiful.<br />
There are benefits to high-field high-frequency<br />
that come principally from having the high frequency,<br />
and other benefits that come from having<br />
the very high magnetic fields. One advantage of high<br />
frequency is that one can cover large ZFSs. One<br />
expects extensive applications to important problems<br />
in metalloproteins. The high sensitivity expected<br />
at high frequency holds out the possibility<br />
of studying very small samples. The benefits from<br />
high field EPR come from the fact that the importance<br />
of the Zeeman term relative to the ZFS terms<br />
in the Hamiltonian increases at high field. The more<br />
nearly first-order spectra at high field increase the<br />
chance of interpretation of the spectra.<br />
Very few high frequency EPR spectrometers are<br />
available in the world. There are spectrometers in<br />
Russia, France, Germany, Netherlands, Japan, and<br />
the US. The highest frequency at which conventional<br />
resistive magnets are useful is 60-70 GHz. At higher<br />
frequencies than this there are four spectrometers in<br />
the US, the far-infrared spectrometer at the Naval<br />
Research Laboratory, the 95 GHz spectrometer at<br />
Illinois, the 140 GHz spectrometer at the MIT Bitter<br />
Magnet Laboratory and the 250 GHz spectrometer<br />
at Cornell.<br />
Some questions posed regarding high-frequency<br />
EPR instrumentation:<br />
• why are there not more spectrometers<br />
in the 30-70 GHz region, where nonsuperconducting<br />
magnets can be used?<br />
• should frequencies >250 GHz be pursued vigorously?<br />
• is it reasonable to expect that high frequency<br />
(millimeter range) EPR spectrometers could<br />
become viable commercial products?<br />
• can the difficulty of sweeping the supercon<br />
magnets be overcome?<br />
• is there possibility of using modern FT IR instruments<br />
with magnets installed for Zeeman<br />
splitting (66-68)?<br />
• can the sensitivity (especially for aqueous<br />
samples) be enhanced by new resonator designs?<br />
E. Discussion<br />
Jack Freed at Cornell had access to a far infrared<br />
laser with the same lines as are being used at Grenoble,<br />
but the work was quickly abandoned because<br />
the lasers did not provide the degree of spectral purity<br />
and stability that EPR spectroscopy uses in the<br />
microwave region. The instability of Bitter magnets<br />
is also a problem. Consequently, the high frequency<br />
spectrometer at Grenoble performs low resolution<br />
EPR relative to what is needed for molecular dynamics<br />
studies.<br />
In the Cornell system, a second supercon magnet<br />
may readily be swept ±500 G about the center field.<br />
This is adequate for studying organic species, but it<br />
is clearly inadequate for studying inorganic species,<br />
for which the main magnet is swept.
170 Bulletin of Magnetic Resonance<br />
V. State of the Art Lecture —<br />
Pulsed EPR: Arthur Schweiger<br />
A. Comparison with NMR<br />
Until recently, conventional CW methods of<br />
measurement prevailed in EPR spectroscopy. This<br />
contrasts with the situation in NMR spectroscopy<br />
where the CW techniques have been superseded almost<br />
entirely by an impressive variety of elegant<br />
pulse techniques. Although pulse methods were introduced<br />
in EPR at about the same time as in NMR,<br />
only a small number of research groups applied pulse<br />
techniques to EPR in the first three decades (69, 70).<br />
The slow growth of pulsed EPR is probably due to<br />
the expensive instrumentation that was needed, and<br />
to the lack of digital electronics sufficiently fast for<br />
any but a restricted range of experiments. However,<br />
the situation has changed radically within the<br />
past few years, and pulsed EPR is undergoing extraordinary<br />
rapid development. New instrumental<br />
capabilities and new pulse techniques make it possible<br />
to reduce the measurement times, to increase<br />
sensitivity, to improve resolution, and to simplify<br />
complicated spectra.<br />
Today almost all topic areas of EPR spectroscopy<br />
are, or will soon be, affected by various pulse<br />
methods. Techniques of particular importance include<br />
time-resolved EPR spectroscopy, methods for<br />
measuring relaxation times, techniques for studying<br />
molecular motions, methods for the indirect detection<br />
of nuclear transition frequencies, electronnuclear<br />
double resonance, and EPR imaging.<br />
B. New EPR Detection Schemes<br />
The following topics and references will focus on<br />
EPR of materials in the solid state. The State of the<br />
Art Lecture by Freed provided references to ID and<br />
2D EPR techniques applied to species in solution.<br />
The annotated list of references provides very brief<br />
comments on the new EPR techniques introduced<br />
in the last couple of years.<br />
1. Electron Spin Echo<br />
Following an initial emphasis on saturation recovery<br />
measurements (71), the majority of recent pulse<br />
EPR experiments in the solid state measure the resonance<br />
phenomena via the electron spin echo (1-5,<br />
69, 70, 72-76).<br />
The popularity of the electron spin echo approach<br />
is due to the fact that, with a very few exceptions,<br />
the EPR lines of solids are strongly inhomogeneously<br />
broadened. As a consequence, the transverse<br />
magnetization caused by a microwave pulse,<br />
called the free induction decay (FID), rapidly decays.<br />
The instrumental deadtime usually prevents<br />
observation of the FID in solids, and the dephasing<br />
of the transverse magnetization has to be refocused<br />
by performing an electron spin echo (ESE) experiment.<br />
2. FID detected hole burning<br />
In FID-detected hole-burning (77-81), a transient<br />
spectral hole burnt into an inhomogeneously broadened<br />
EPR line by means of a selective microwave<br />
pulse is shifted or broadened by various types of<br />
perturbations (radio-frequency field, Bo-field jump,<br />
electric field, sample rotation, etc.), and is subsequently<br />
recorded in a single experiment via an FID<br />
following a nonselective microwave pulse. The FIDdetected<br />
hole-burning experiment can be applied to<br />
any EPR spectrum with inhomogeneously broadened<br />
lines, provided the relaxation times are sufficiently<br />
long. Many of the well-known ESE pulse<br />
sequences have an analogous FID-detected holeburning<br />
sequence that is often superior to the ESE<br />
experiment.<br />
3. CW Detection<br />
The detection schemes described above involve<br />
monitoring the transient signals (echoes, FIDs)<br />
emitted by the sample after pulsed excitation. An<br />
alternative approach is to get information about the<br />
perturbed spin system by measuring on-resonance<br />
magnetization of the spin ensemble by using weak<br />
CW microwave irradiation (78, 82-84).<br />
4. Longitudinal Detection<br />
Longitudinal detection (85, 86) is based on the<br />
observation of rapid changes in the z-magnetization<br />
effected by microwave pulses. Pickup coils with<br />
their normal oriented parallel to the static magnetic<br />
field are used to record the time-dependent<br />
z-magnetization during the pulse sequence. Longitudinal<br />
detection is free of artifacts caused by the<br />
instrumental dead-time.
Vol. 16, No. 3/4 171<br />
5. New Methods for the Measurement of<br />
the Nuclear Modulation Effect<br />
The standard electron spin echo envelope modulation<br />
(ESEEM) experiments suffer from several disadvantages.<br />
A number of pulse schemes have been<br />
developed recently to improve resolution and sensitivity,<br />
to separate overlapping ESEEM spectra, and<br />
to overcome various types of instrumental distortions<br />
(76, 78, 87).<br />
6. ESEEM at Frequencies Other Than X-<br />
Band<br />
Going to lower or higher microwave frequencies<br />
than X-band (88-94) may increase the depth of the<br />
modulation and reduce or eliminate the dispersion<br />
of nuclear frequencies. This ESEEM cancellation<br />
effect has been analyzed (91-94).<br />
7. Phase-Shifted Excitation<br />
The modulation depth may be increased by<br />
eliminating the decay caused by dipolar interaction<br />
among unpaired electrons (95).<br />
8. 5-Pulse ESEEM<br />
With the 5-pulse ESEEM sequence (96), the<br />
modulation amplitude can be up to a factor of eight<br />
larger than in the corresponding 3-pulse experiment.<br />
The echo signal contains no unmodulated part.<br />
9. Extended Time Excitation<br />
The entire two-pulse echo modulation can be<br />
obtained by a single experiment using a coherent, a<br />
stochastic, or a pulse-burst stimulation followed by<br />
a strong refocusing pulse (97,98).<br />
10. Coherent Raman Beats<br />
This experiment allows one to record the entire<br />
three-pulse modulation in a single experiment<br />
by detecting nuclear coherences with a weak probe<br />
pulse (84).<br />
11. Soft ESEEM<br />
By using two microwave frequencies, ESEEM can<br />
be accomplished with low microwave power (milliwatts<br />
instead of watts). Because of the use of two<br />
microwave frequencies one does not have to excite<br />
allowed and forbidden transitions simultaneously to<br />
get echo modulation. "Soft" ESEEM (99, 100) does<br />
not suffer from blind spot artifacts and the modulation<br />
frequency is not limited by the pulse bandwidth.<br />
12. Remote Echo Detection<br />
In this pulse scheme transverse magnetization<br />
representing the echo is converted into longitudinal<br />
magnetization (101). A two-pulse echo sequence is<br />
then used to read this magnetization. The procedure<br />
is insensitive to the deadtime of the spectrometer.<br />
13. Echo Modulation Echoes<br />
With this special three-pulse sequence the shape<br />
of broad hyperfine lines can be restored (102).<br />
14. 4-Pulse ESEEM<br />
The ESEEM peaks that correspond to sums<br />
of frequencies contain important information about<br />
the magnetic parameters of the nuclei. The 4-pulse<br />
ESEEM approach allows one to measure highly resolved<br />
sum peak spectra of disordered systems (76,<br />
98, 103).<br />
15. HYSCORE<br />
DOR<br />
Hyperflne Selected EN-<br />
HYSCORE (hyperfine sublevel correlation spectroscopy)<br />
is a very powerful technique to study weak<br />
hyperfine interactions, in particular in disordered<br />
systems (94, 104-107). The technique is distinguished<br />
by a high spectral resolution in both dimensions<br />
and allows one to disentangle the correlation<br />
features over two quadrants of the 2D frequency domain.<br />
16. 2D FT-EPR in Solids<br />
For EPR spectra covering a small field range, as is<br />
often the case for radicals, 2D FT-EPR techniques<br />
have been applied successfully for the measurement<br />
of the nuclear modulation effect (60, 108).
172 Bulletin of Magnetic Resonance<br />
17. Fourier Transform EPR-Detected NMR<br />
FT-EPR detected NMR is based on the burning<br />
of transient holes into the EPR line by exciting<br />
forbidden EPR transitions and detecting the entire<br />
hole pattern via an FID (81). The procedure allows<br />
the observation of all nuclear transition frequencies<br />
in a single experiment. The sensitivity may exceed<br />
that of an ESEEM experiment by up to an order of<br />
magnitude.<br />
18. Phase Cycling<br />
Phase cycling is of great importance in pulsed<br />
EPR to record undistorted echo or FID signals (105,<br />
109).<br />
19. Double Resonance Experiments<br />
Along with the rapid developments in pulsed EPR<br />
spectroscopy, there has also been a fast-growing interest<br />
in pulsed ENDOR and related double resonance<br />
techniques (87, 110-115). There have been<br />
several recent reviews of the field.<br />
20. Optimized ENDOR<br />
By using a new mixing scheme the polarization<br />
transfer between nuclear and electron spins is<br />
improved, and an optimum ENDOR efficiency is<br />
achieved (116).<br />
21. Triple Resonance<br />
In a triple resonance experiment, nuclear transitions<br />
are excited with two rf pulses of different frequencies<br />
(110). The technique is used to determine<br />
relative signs of hyperfine coupling constants and to<br />
separate overlapping ENDOR spectra.<br />
22. Hyperfine-Selective ENDOR<br />
The procedure allows the measurement of EN-<br />
DOR subspectra originating exclusively from nuclei<br />
with a predetermined hyperfine coupling constant<br />
(117, 118).<br />
23. Radio-Frequency Driven ESEEM<br />
The radio-frequency driven ESEEM pulse scheme<br />
can create echo modulations in paramagnetic sys-<br />
terns that do not contain nonsecular hyperfine interactions<br />
(e.g., liquid solutions) (119).<br />
24. EPR-Detected Nuclear Transient Nutations<br />
and Multiple Quantum ENDOR<br />
EPR-detected nuclear transient nutations and<br />
multiple quantum ENDOR are closely related techniques<br />
(82, 113, 120). They can be applied to determine<br />
the multiplicity in ENDOR spectra as well as<br />
the hyperfine spectral density in different sections<br />
of an ENDOR spectrum.<br />
25. Time-Domain ENDOR<br />
Strong rf pulses used in the technique of timedomain<br />
ENDOR excite a spectral width of about 1<br />
MHz (121, 122). The FID of the nuclear spins is<br />
recorded via an electron spin echo. The sensitivity<br />
and resolution achieved with this pulse sequence<br />
may exceed that obtained with standard pulse techniques.<br />
26. Coherence Transfer ENDOR<br />
Coherence transfer ENDOR is an interesting<br />
experiment from the point of view of spin dynamics<br />
(123, 124). However, the technique suffers from<br />
poor spectral resolution and is therefore not of very<br />
general practical use.<br />
27. SEDOR-ENDOR Spectroscopy<br />
SEDOR-ENDOR is basically a SEDOR experiment<br />
for the nuclear spins (125). The electron spins<br />
are used only for the polarization of the nuclei and<br />
for detection. The technique allows the measurement<br />
of nuclear-nuclear dipole couplings.<br />
28. Fourier-Transform Hyperfine Spectroscopy<br />
Fourier-transform hyperfine spectroscopy is based<br />
on the FID-detected hole-burning approach (80). In<br />
the spectrum obtained each group of equivalent nuclei<br />
is represented by one peak at the hyperfine frequency,<br />
independent of the nuclear spin quantum<br />
number.
Vol. 16, No. 3/4 173<br />
29. ENDOR-Edited-ESEEM Spectroscopy<br />
A combined ENDOR-ESEEM experiment allows<br />
the correlation of different nuclei (126).<br />
30. 2+1 Pulse Train ESE<br />
The ESE pulse sequence termed "2+1" can be<br />
used to determine electron dipole-electron dipole interactions<br />
between paramagnetic centers (127-130).<br />
31. ID and 2D Pulsed ELDOR<br />
Pulsed ELDOR uses either two microwave frequencies,<br />
or a jump in the magnetic field strength,<br />
for the measurement of relaxation times, spatial distributions<br />
of paramagnetic centers, and magnetization<br />
transfer (131-137).<br />
32. EPR Imaging<br />
Although early EPR imaging experiments were<br />
performed with CW techniques, pulsed EPR techniques<br />
recently have become important in EPR<br />
imaging (56, 57, 138-142).<br />
33. Resolution Enhancement of Field-<br />
Swept EPR<br />
A number of methods are under development<br />
to disentangle field swept EPR spectra using pulsed<br />
EPR techniques (143).<br />
34. Electron-Zeeman-Resolved EPR<br />
An EPR spectrum can be resolved in a second<br />
dimension based on differences in the electron Zeeman<br />
interaction of different paramagnetic centers or<br />
different orientations in a disordered system (79).<br />
35. Anisotropy-Resolved EPR<br />
Methods have been developed to make use of<br />
the anisotropy of the magnetic parameters to disentangle<br />
powder EPR spectra by rapidly changing the<br />
orientation between the static field and the sample<br />
(144, 145).<br />
36. Electron Spin Transient Nutations<br />
Transient nutation techniques are applied to separate<br />
overlapped EPR spectra, to determine spin<br />
quantum numbers and to study photoinduced electronic<br />
states (78, 83, 146-148).<br />
C. Recent Instrumental Innovations in<br />
Pulsed EPR<br />
Over the past few years instrumentation in pulsed<br />
EPR has made enormous progress. The following<br />
discussion is restricted to resonator design and<br />
to spectrometers working at microwave frequencies<br />
other than X-band.<br />
1. Resonator Design<br />
The most significant innovation in resonator design<br />
(124, 149-154) in recent years is the introduction<br />
of the EPR loop-gap resonator (LGR) by Hyde<br />
and coworkers (149, 150), and the development of<br />
related structures for different types of pulsed EPR<br />
experiments, including pulsed ENDOR, and magnetic<br />
field jumps (144). In addition to lumpedcircuit<br />
resonators of the LGR type, increasingly dielectric<br />
resonators are finding application in EPR<br />
(155-157).<br />
2. Spectrometer Frequency<br />
Most pulsed EPR spectrometers operate with a<br />
microwave frequency of ca. 9 GHz. The developments<br />
up to 1987 were reviewed in (160). Recently<br />
several pulse EPR spectrometers operating at higher<br />
or lower frequencies (88, 90, 158, 159) have been described,<br />
including ENDOR at 97 GHz (161-163).<br />
Other innovations in instrumentation over the last<br />
few years include:<br />
• miniaturization of spectrometers, e.g., for<br />
studying irradiated foods, dosimetry, etc.<br />
(164, 165)<br />
• Fabry-Perot resonator design (64)<br />
D. Respondent - David Singel<br />
There have been many illustrations of the utility<br />
of multifrequency ESEEM during the Workshop<br />
and the preceding Symposium. Ultimately, varying<br />
the magnetic field and using some of the new pulse<br />
techniques may accomplish much the same thing in<br />
sorting out nuclear hyperfine and quadrupole frequencies.<br />
The balance between nuclear Zeeman and<br />
hyperfine interactions determines the amplitude of
174 Bulletin of Magnetic Resonance<br />
the modulation effect. Some of the new pulse techniques<br />
may change this balance, but the effect depends<br />
on a resonant phenomenon, so the experimental<br />
magnetic field strength is very important. The<br />
Hyscore and echo-modulation-echo pulse sequences<br />
are ways to deal with broad lines. Ways to get rid<br />
of broad lines include cancellation of hyperfine and<br />
Zeeinan interactions and cancellation of first order<br />
linewidths that show up in the 14 N double quantum<br />
frequencies.<br />
Assignment of frequencies to a particular nucleus<br />
can be made by observing the field dependence of<br />
the frequencies. See for example the recent study of<br />
pyruvate kinase by Peisach in which distinction between<br />
coordination by N or P was made (166). The<br />
sum combination peak shift is inversely proportional<br />
to frequency; this suggests important applications of<br />
S-band ESEEM.<br />
E. Discussion<br />
The 2D FT EPR spectrometer developed by<br />
Freed and coworkers at Cornell has been described<br />
in a review article (51). Recently developed high<br />
power microwave switches have not been published<br />
- the inventor at Cornell is applying for a patent,<br />
and they lack funds and time to do some of the<br />
characterizing experiments needed to write a paper<br />
about the switches. Freed invites people to come to<br />
the lab to learn about these things.<br />
The real question about these new 2D FT experiments<br />
is whether new information can be obtained.<br />
For example, is there any evidence for angular<br />
dependences of nuclear relaxation? These are<br />
just the type of questions to which these techniques<br />
were applied by Freed and coworkers in 1989, where<br />
they demonstrated anisotropy of the nuclear spin<br />
relaxation and interpreted it in terms of molecular<br />
dynamics. An experimental and theoretical study<br />
of Heisenberg exchange in oriented liquid crystals<br />
showed that there is no reason to expect much<br />
anisotropy (55, 167). Currently, ESEEM as a function<br />
of frequency is often necessary to make the<br />
spectral patterns comprehensible. Are there new<br />
pulse sequences that could make the frequency dependence<br />
measurements unnecessary? The 5-pulse<br />
experiment can be continued with more and more<br />
pulses to increase the modulation depth. However,<br />
with more pulses there are limits on relaxation times<br />
that can be studied and one loses sensitivity. FID<br />
detected hole burning also gives deeper modulation,<br />
sometimes even in cases where one would not see<br />
modulation in normal 2- or 3-pulse ESEEM. If the<br />
Ti trend observed by Hyde continues and Ti is<br />
longer at Q-band and higher frequency, then some<br />
of the pulse sequences demonstrated at X-band are<br />
even more useful at higher frequency. Work is in<br />
progress in the Schweiger lab on pulsed Q-band.<br />
Applications of high-field EPR would appear to<br />
be extensive for species whose spectral linewidths<br />
do not scale with field, where one is removing, for<br />
example, second-order fine structure broadening. It<br />
is not obvious that the spectrum of a Cu(II) complex<br />
will be improved at high frequency.<br />
The major application of high field EPR to<br />
metalloproteins will likely be for those that have<br />
large ZFS, including non-Kramers even-spin systems.<br />
Even though the lines may be broad, highfield<br />
EPR will be important if a transition is observed<br />
at all, since they cannot be seen at X-band.<br />
To see a signal that one could not otherwise see<br />
is an enormously good reason for doing high frequency<br />
EPR. G-strain is considerably larger at high<br />
frequency for something like Cu(II) in frozen solution.<br />
For example, in the Cu(II) species that have<br />
been studied at 250 GHz at Cornell, g-strain scaled<br />
with field, so there was no improvement in resolution.<br />
Hyperfine structure resolution can even get<br />
worse at high frequency. Despite the g-strain linebroadening<br />
with increasing frequency, there are examples<br />
(see, e.g., Nilges, et al., in previous EPR<br />
Symposia) of considerably enhanced spectral information<br />
content for powdered Cu(II) specimens at<br />
95 GHz. The prospects for such enhancement are<br />
very case-dependent, in the experience of the Illinois<br />
group.<br />
Often the incentive for going to higher field is to<br />
get better g-tensor information. One expects sensitivity<br />
to scale roughly as frequency squared, with<br />
maybe + or — 1/2 in the exponent. One problem is<br />
that as the frequency increases and the spectra get<br />
broader, the magnetic field modulation amplitude as<br />
a fraction of linewidth decreases, so sensitivity does<br />
not improve as much for the normal phase-sensitive<br />
detected CW spectrum when the lines are broad.
Vol. 16, No. 3/4 175<br />
VI. Panel Discussion - High resolution<br />
EPR<br />
Panel Members: Jack Freed, Ronald Mason,<br />
Roger Isaacson, Lowell Kispert, Arthur Heiss<br />
(Bruker Instruments), Clarence Arnow (Micro-<br />
Now), Philip Morse (Scientific Software), Mark<br />
Woolfrey (Oxford Instruments).<br />
The topic "High Resolution EPR" for the purposes<br />
of this review encompasses most of the applications<br />
of "normal" CW EPR, whether to organic<br />
radicals or metals, in solid phase or in solution.<br />
Issues include: research and instructional,<br />
portable and application-dedicated, multifrequency,<br />
S/N, data manipulation, simulation, visualization.<br />
The following paragraphs summarize comments<br />
and questions from the audience and the panel.<br />
A. Kinetics<br />
Real-time kinetics measurements of radicals is an<br />
important and expanding area of EPR, and one to<br />
which FT EPR is making important contributions.<br />
See for example the work of van Willigen, Turro,<br />
Dinse, etc. Microsecond kinetics can be studied,<br />
because in this time one can obtain an FID.<br />
Fast-response conventional (CW) EPR is also being<br />
developed. Bruker has a microwave transient<br />
bridge which, combined with a split-ring resonator<br />
in a matched condition (critically coupled, not overcoupled)<br />
with a low Q, results in a system with<br />
200 MHz bandwidth for these types of experiments.<br />
This bridge has many of the components of the pulse<br />
bridge, without the switches.<br />
B. Longitudinal Detection<br />
The sensitivity for longitudinal detection is about<br />
a factor of 10 worse than normal detection. The<br />
detection coil is resonant at the frequency of the<br />
repetition rate of the pulse experiment.<br />
C. Signal to noise<br />
Although EPR is more sensitive than NMR on a<br />
per spin basis, the species of interest in biomedical<br />
fields are not very abundant. Therefore, there is a<br />
very serious S/N problem, especially for samples of,<br />
e.g., a microliter of protein solution. In the biomed-<br />
ical area one of the key priorities is improved S/N.<br />
Spectrometer improvements are needed.<br />
Concerns were expressed that the treatment of<br />
noise in FT EPR may not yet fully reflect the nature<br />
of the experiment. For example, is it possible<br />
to define the noise in a time-domain experiment and<br />
apply it in an unbiased fashion to the FT spectrum?<br />
Based on the discussion of noise in FT NMR by<br />
Ernst in 1966 (168), Freed discussed some aspects<br />
of noise in FT EPR (51). One problem with S/N<br />
enhancement via FT in EPR relative to NMR is the<br />
need in EPR to decrease the resonator Q (to ca. 40)<br />
in order to get adequate bandwidth (e.g., 100 MHz<br />
at 9 GHz). One expects that the signal loss is proportional<br />
to Q. On the other hand, NMR has to have<br />
slow pulse repetition rates because of the long nuclear<br />
Ti values. In EPR, Ti is short enough in most<br />
cases that some S/N improvement relative to NMR<br />
can be regained by faster data collection. However,<br />
no commercial digitizer can accept repetition rates<br />
as fast as EPR Tis would permit.<br />
D. Ex Vivo EPR; Aqueous Samples in<br />
Flat Cells<br />
Ex vivo EPR got a bad reputation a long time ago<br />
because of artifacts created by grinding or lyophylizing<br />
the sample. However, these problems are now<br />
recognized and ex vivo EPR studies can be done reliably.<br />
For example, bile or urine can be studied<br />
in flat cells in TM cavities, via cannulae if desired.<br />
S/N is a problem for in vivo EPR, even with spin<br />
traps.<br />
It has been reported that the surface of normal<br />
flat cells is rough enough that it introduces vortexing<br />
and resultant noise in some spectra when used<br />
as a flow cell. Specially made cells with smoother<br />
interior construction work better, but are more expensive.<br />
A newly redesigned flat cell with much<br />
tighter tolerances on flatness gives much better performance<br />
than the older flat cells. Wilmad is working<br />
on a redesigned flat cell, which should be available<br />
in a few months, to solve this problem at a<br />
reasonable cost.<br />
Loop gap resonators are worth considering for<br />
pulsed EPR studies of aqueous samples because<br />
there is fairly good separation of B and E fields in<br />
a LGR, especially relative to a cavity resonator. In<br />
addition, the Q used for pulsed EPR is low enough<br />
that a large amount of water can be put in the res-
176 Bulletin of Magnetic Resonance<br />
onator without having much further effect on the<br />
Q.<br />
E. Dielectric Resonators<br />
During the Symposium preceding the Workshop,<br />
results presented by Roger Isaacson emphasized<br />
the desirability of using dielectric resonators<br />
to get even better separation of B and E field, while<br />
retaining the benefit of a higher Q where it can be<br />
used. Bruker markets a dielectric resonator at Xband<br />
in the Flex-line resonator series. This Bruker<br />
resonator uses sapphire in the dielectric resonators<br />
because other materials have too many impurities<br />
to be useful for CW EPR. Sapphire cut in the right<br />
direction, and turned in the right direction in the<br />
EPR probe, provides a magnetic field region of ca.<br />
200 G in which there are no impurity signals. If<br />
you cool the sapphire resonator, lines from impurity<br />
levels of Fe, Cr, etc., will increase in intensity, but<br />
not so much that they will distort the spectrum. In<br />
pulsed EPR these impurities do not interfere with<br />
the signal at all because they are in such low abundance<br />
and their relaxation times are so short. For<br />
aqueous solutions in a small cylindrical capillary a<br />
dielectric resonator yields a factor of 6.7 improvement<br />
in S/N relative to a standard resonator. The<br />
dielectric resonator is slightly better in this regard<br />
than the LGRs with which it has been compared. If<br />
enough sample is available, better S/N will be obtained<br />
for aqueous samples in a large flat cell in a<br />
TM cavity.<br />
Peter Hofer reported that tests at Stuttgart<br />
showed that UV light did not have any effect on<br />
the sapphire resonator, but gamma radiation was<br />
not tested.<br />
F. Small and/or Dedicated EPR Spectrometers<br />
The EPR field has been looking for a long<br />
time for a market for dedicated EPR spectrometers.<br />
The largest market that ever occurred was the sale<br />
of about 50 FRAT (by Syva; Syntex-Varian) spectrometers<br />
for drug testing, but other techniques replaced<br />
the use of EPR for that application. Diamond<br />
companies have purchased a portable EPR<br />
to screen for synthetic diamonds. Varian produced<br />
two 1 GHz spectrometers, and Micro-Now produced<br />
three 1 GHz spectrometers, for screening crude oil<br />
for vanadium many years ago.<br />
Dosimetry is a possible market. An ASTM committee<br />
is working on a standard that will permit<br />
EPR use in dosimetry. The Bruker EMS104 was developed<br />
for radiation dosimetry and is being tested<br />
for monitoring irradiated food in Europe.<br />
Clinical oximetry is a likely application for an<br />
EPR spectrometer. This will probably have to be<br />
a portable, low frequency spectrometer, not just a<br />
version of a standard spectrometer.<br />
VII. Panel Discussion — In Vivo<br />
EPR and Imaging<br />
Panel Members: Lawrence Berliner, Harold<br />
Swartz, Howard Halpern, Sandra Eaton, Dieter<br />
Schmalbein (Bruker), Mark Woolfrey (Oxford Instruments).<br />
A. The Question of Sample Size<br />
The hardware and software issues for in vivo EPR<br />
and EPR imaging are very different from those for<br />
the standard high-resolution experiment. Thus, we<br />
discuss together "high resolution" spectra in vivo<br />
and multidimensional imaging. The colloquial question<br />
is "When can we get the elephant into the EPR<br />
spectrometer?" That is, how do we get to real applications<br />
with samples bigger than mm size, or mouse<br />
size?<br />
In counterpoint, Hal Swartz asserts that the<br />
question is wrong - people are too pessimistic. With<br />
the existing technology and relatively simple development<br />
one can do a large fraction of what needs<br />
to be done. One can look at the elephant if only<br />
the first cm or so of the elephant is to be examined.<br />
Many interesting things are within that surface<br />
layer. At 250 MHz 80-90% of the things one is<br />
interested in from a clinical point of view are already<br />
accessible. The problems remaining are not fundamental,<br />
but merely the nitty gritty things that need<br />
to be sorted out. No one significant break-through<br />
is needed.<br />
For information on the use of surface resonators<br />
(e.g., the volume sensitivity), for cases in which the<br />
sample is too large to put into a resonator, see (44,<br />
172).<br />
Larry Berliner suggests another point of view<br />
- Why don't we try to put the EPR spectrome-
Vol. 16, No. 3/4 177<br />
ter inside the elephant? The hardware development<br />
needed is miniaturization such that the probe could<br />
be inserted by catheterization.<br />
B. Frequency Scaling<br />
Clearly, while the in vivo and imaging experiments<br />
are stimulating creative approaches to solving exciting<br />
problems, there remain some very fundamental<br />
questions. For example, it is not obvious what frequency<br />
scaling is appropriate to these experiments<br />
on complex living tissue. In NMR the penetration<br />
seems to scale nearly linearly with frequency, and<br />
not according to the square law that early literature<br />
would lead one to expect. One should not read conflict<br />
into the decision to perform imaging at different<br />
frequencies in different labs. Since most experiments<br />
were started with little or no funding, each<br />
lab worked with what was available. The Halpern<br />
spectrometer at 250 MHz is widely viewed as a close<br />
to optimum choice. Work in other labs at higher frequency<br />
than 250 MHz is not a statement that higher<br />
frequency is better - it is what is available and is giving<br />
good results on an important set of problems. It<br />
is a mistake to assume that one cannot obtain EPR<br />
spectra on almost all except the trunk of a human<br />
being, if one works at 250 MHz.<br />
C. Interpretation of In Vivo Spectra<br />
Extracting information from in vivo spectra probably<br />
requires a spectral fitting approach (169, 170).<br />
A reasonable fit hypothesis can be used to focus the<br />
entire spectral information on the few parameters<br />
associated with the hypothesis. This approach allows<br />
one to determine very small variations between<br />
very noisy spectra.<br />
One of the main problems with animal imaging<br />
experiments is suppressing the noise caused by<br />
movement of the animal. Attempts to capture the<br />
motional information electronically to be able to use<br />
it for corrections gives the side benefit that there is<br />
now a record of, e.g., the depth of respiration of the<br />
animal.<br />
D. Magnetic Field and Magnetic Field<br />
Gradient Control<br />
One of the main challenges for imaging experiments<br />
is the magnetic field control. In systems that<br />
use Hall probes, the current practice is laborious<br />
positioning to put the Hall probe in a nodal plane<br />
of the imaging gradient field. This becomes very<br />
difficult for more than one imaging dimension.<br />
A related problem is the quality of the gradient<br />
field. At the very high gradients used in EPR<br />
imaging, great care must be taken to ensure linearity<br />
of the gradient over the sample volume of interest.<br />
At very low RF frequencies the gradient coils<br />
would produce a larger field than the main Zeeman<br />
field. In the 250 MHz imaging spectrometer, the<br />
Helmholtz coils used to create the Zeeman field are<br />
splayed to create the gradient field (40, 171).<br />
It is attractive to use current control of copper<br />
Helmholtz coils to avoid the problems of Hall probe<br />
positioning on iron-core electromagnets (hysteresis<br />
problems prevent current control of iron-core magnets).<br />
However, the perturbations of the field by<br />
ferromagnetic materials in the vicinity is a problem.<br />
One has to keep ferromagnetic materials far away;<br />
even an infusion pump used to inject the spin probe<br />
into the animal can cause interference with the spectrometer.<br />
E. Low Frequency and Imaging Spectrometers<br />
Dieter Schmalbein reported that Bruker is watching<br />
the EPR imaging field, but until a clear application<br />
market develops they cannot afford the development<br />
costs. It would require several million<br />
dollars to develop a professional EPR imaging system.<br />
They have made several experiments, and tentatively<br />
would expect to use a frequency below 1<br />
GHz, and would expect to design a resonator that<br />
would accommodate a whole rat. However, it is<br />
judged premature to build a commercial product.<br />
The current market for the Bruker L-band EPR<br />
bridge is near zero. A new 2 to 8 GHz multifrequency<br />
bridge has been built using the most modern<br />
microwave equipment available. It has much better<br />
sensitivity than the L-band system, which was designed<br />
about 10 years ago. Until a commercial instrument<br />
becomes available, researchers who want<br />
to enter this field need to obtain information from<br />
one of the labs that developed instrumentation and<br />
software for imaging. The NIH-funded Illinois ESR<br />
Center (which now has a branch at Dartmouth) is<br />
happy to assist people, or to put them in touch with<br />
a lab that can assist with a specific problem outside
178 Bulletin of Magnetic Resonance<br />
the experience of the Illinois Center.<br />
F. Nitric Oxide In Vivo<br />
There is much current interest in measuring NO<br />
in vivo, but estimated concentrations of NO in the<br />
body are less than micromolar. As the simple diatomic<br />
molecule it cannot be studied by EPR in<br />
vivo. Possibly it could be studied via its paramagnetic<br />
effect, analogous to oxygen, or by trapping it.<br />
But are either of these approaches likely to produce<br />
an image? Harold Swartz has unpublished demonstrations<br />
that one can trap NO with lithium phthalocyanine.<br />
Hemoglobin is a naturally occurring<br />
trap for NO. It seems very unlikely that it will be<br />
possible to monitor NO in vivo by EPR, let alone<br />
image it. If it could be done, the importance of NO<br />
in the body makes monitoring NO by EPR a likely<br />
clinical application of EPR (173).<br />
At the Lovelace Institute human volunteers<br />
breathed NO2, then their lungs were washed with<br />
saline and the cells studied by EPR. Heme-NO was<br />
observed with good enough S/N to serve as a monitor<br />
of NO2 exposure (174).<br />
G. Noise in FT EPR, EPR Imaging and<br />
In Vivo EPR<br />
Multiple fast scan vs. slow scan data collection is<br />
one of the key decisions for in vivo EPR imaging experiments.<br />
This is one of the data collection parameters<br />
that is optimized against the rates of motion<br />
of the animal, and other inherent time constants of<br />
the system. In the current 250 MHz imaging system,<br />
typically 15 sec scans are used. The current<br />
limit is the monitoring of the frequency of the fieldfrequency<br />
lock system, and the fact that IEEE488<br />
communication is used.<br />
Colin Mailer emphasized that talk about improving<br />
S/N to do in vivo imaging should face the reality<br />
that the signal relates to two parameters - the<br />
number of spins and Bi. In current technology there<br />
is a tradeoff between sample volume and Bi - the<br />
larger the resonator the smaller the Bi at the sample.<br />
With LGRs the technology appears to be close<br />
to the fundamental limit.<br />
The key to solving the S/N problem is to understand<br />
the noise source. For in vivo EPR, the noise<br />
source is likely to be the animal. Beyond the limits<br />
just discussed, there are problems such as how to<br />
make the resonator less sensitive to animal motions.<br />
Use of a dielectric resonator to further decouple the<br />
animal from the resonator might help.<br />
If the problem of animal motion is solved, one<br />
still has to work to decrease other noise sources, such<br />
as the source and the detection system. The recent<br />
introduction of a balun between the transmission<br />
line and the resonator in the 250 MHz imaging system<br />
decreased the noise by a factor of 4. The system<br />
is not fully optimized yet.<br />
The fundamental limits discussed by Colin<br />
Mailer have yet to be approached by the 250 MHz<br />
EPR system in Halpern's lab. The primary reason<br />
is animal motion. If one operates under conditions<br />
optimized for the nitroxide radical, magnetic field<br />
modulation amplitudes of 0.5 to 1 G can be used.<br />
With an input power of 100 mW, it is estimated<br />
that the Bi in the animal is ca. 0.3 G, a value<br />
that approaches saturation of the spin system. (If<br />
the deuterated form of the nitroxide is used, different<br />
conditions - e.g., Bi = ca. 0.01 to 0.03 G<br />
- are required for optimization, because of narrower<br />
linewidths.) Under these conditions, surface<br />
currents (eddy currents) induced by the magnetic<br />
field modulation and by the RF are further modulated<br />
by the animal-motion-induced microphonics.<br />
These contributions increase the breathing-related<br />
artifact. A balanced power delivery system is one<br />
possible approach to electronic suppression of this<br />
artifact. About two orders of magnitude noise suppression<br />
will be required before encountering the<br />
limits referred to by Colin Mailer.<br />
The value of Bi that is useful in CW imaging is<br />
limited by the relaxation time of the electron spins.<br />
Possibly there is an application for contrast reagents<br />
to shorten the relaxation times in EPR so that larger<br />
Bi can be applied without saturating the spin system.<br />
Ernst's analysis for NMR was that there would<br />
be little advantage to performing FT spectroscopy<br />
for single-line spectra. The imaging experiment inherently<br />
is not a single line. FT EPR or rapid scan<br />
spectroscopy followed by mathematical deconvolution<br />
(which was useful in NMR just before FT NMR<br />
was developed) might be used to advantage in EPR.<br />
100 MHz spectral width at 9 GHz requires a Q of<br />
ca. 40. If the center frequency drops by a factor of<br />
ten, but the bandwidth stays the same, then the Q<br />
required is 8. If the focus were on a narrower line,
Vol. 16, No. 3/4 179<br />
so that the Q could remain at 80, then the issue<br />
becomes one of sensitivity. It is not clear that the<br />
choice of FT vs. CW in this case is a black and<br />
white issue. Among the tradeoffs are the relation<br />
of Q to the amount of aqueous sample that can be<br />
put in the resonator, the repetition rate that can<br />
be used, etc. Imaging is an additional perturbation<br />
on the judgment. At low frequencies the bandwidth<br />
needed for even narrow lines necessitates substantial<br />
power.<br />
In any non-pulsed experiment we throw away<br />
a lot of information because we only look at one<br />
Fourier coefficient of the EPR signal. More sensitivity<br />
could be obtained by stacking synchronous<br />
demodulators. Some years ago Hyde taught us (175)<br />
that we should digitize the entire 100 kHz modulation<br />
signal and try to get all of the information out<br />
of each modulation cycle. Bruker markets preamplifiers<br />
and digitizers that have adequate speed to<br />
perform this type of analysis.<br />
VIII. Panel Discussion - New<br />
Perspectives on Spins<br />
Panel Members: James Hyde, Melvin Klein,<br />
Arthur Schweiger, Bruce Robinson, Harvey Buckmaster,<br />
Edward Reijerse, Hans Thomann, Dieter<br />
Schmalbein (Bruker).<br />
Arbitrarily gathered under this umbrella are a<br />
wide variety of pulse, time-domain, multiple resonance,<br />
and multiple modulation techniques that<br />
share the feature of exploiting non-linear behavior<br />
and relaxation phenomena.<br />
A. SQUIDs in EPR<br />
SQUID devices are almost noiseless detectors, so<br />
they are attractive wherever they can be used. In<br />
NMR SQUIDs are superior detectors up to about<br />
30 MHz, but at higher frequencies the standard<br />
methods are better. This severely limits the type<br />
of EPR experiment for which they could be useful.<br />
It is attractive to consider using a SQUID for zerofield<br />
EPR. Zero-field measurements would eliminate<br />
some of the anisotropy problems often encountered<br />
in EPR.<br />
B. Multiquantum EPR<br />
Modern microwave technology permits the generation<br />
of multiple CW frequencies with a common<br />
timebase. In principle, the same irradiation frequencies<br />
could be generated by suitable time-modulation<br />
of a single frequency, but summing of distinct frequencies<br />
seems technologically preferable. Multiquantum<br />
EPR is readily generalized from two or<br />
three frequencies (as in Hyde's papers so far), to<br />
N frequencies. The potential is very great. There<br />
are two general thrusts: as a practical alternative<br />
to magnetic field modulation for improved system<br />
stability, and as a way to obtain information on relaxation<br />
rates.<br />
Among the many applications envisaged, few<br />
have been explored yet, since the technique is so<br />
new. EPR imaging is one potential application.<br />
Image reconstruction algorithms require absorption<br />
spectra (not derivative spectra). The fact that MQ<br />
EPR yields absorption spectra directly makes it attractive<br />
to consider MQ EPR imaging. The need for<br />
absorption spectra is another reason for the use of<br />
FT EPR imaging instead of CW EPR imaging. Alternatives<br />
to CW for EPR imaging are imperative.<br />
C. Microwave Source Phase Noise<br />
What EPR applications would there be for a<br />
microwave source with 20-40 dB lower phase noise?<br />
At low frequency the wideband tunable microwave<br />
sources have poor phase noise, and with a<br />
low noise GaAsFET amplifier in the detection system<br />
one finds that the source noise dominates. This<br />
is a case in which reducing the phase noise of the<br />
source would be important. Lower phase noise at<br />
lower modulation frequency could be important -<br />
e.g., Roger Isaacson used 4 Hz modulation for experiments<br />
where the EPR signals under study will<br />
not respond rapidly. Also, with the increased use<br />
of microwave preamplifiers the 1/f noise of the crystal<br />
detector is overcome, and in many experiments<br />
one can more advantageously use field modulation<br />
in the region of 100-25,000 Hz.<br />
Does phase noise scale with frequency? There<br />
seems to be little comparison data, but the usual<br />
assumption is that phase noise at all frequencies<br />
relative to the center frequency scales with the<br />
microwave frequency. This may not be true for<br />
klystrons, where there could be mechanical vibra-
180 Bulletin of Magnetic Resonance<br />
tions at particular frequencies. However, at 100<br />
KHz away from the carrier, phase noise appears to<br />
scale for klystrons. During the Symposium Mark<br />
Nilges showed curves for a 100 GHz oscillator, and<br />
some of them look like they are not scaling.<br />
In many cases 100 kHz modulation is no longer<br />
necessary, and for species with long relaxation times<br />
100 KHz modulation is not desirable. Lower modulation<br />
frequencies are likely to become more commonly<br />
used. Thus, phase noise at 100 KHz may not<br />
be the best comparison to make.<br />
One should be aware that using phase locking<br />
techniques may introduce new sources of noise. The<br />
reference oscillator has to be a very clean source,<br />
or it could become the limiting noise source in the<br />
system. This occurred in some cases in Buckmaster's<br />
lab when a synthesizer was used to phase-lock<br />
a source.<br />
James Hyde encouraged reference to Robins'<br />
book (18), which considers ways of handling phase<br />
noise. With incomplete data available regarding<br />
phase noise characteristics of various microwave<br />
sources, an overall impression is that currently<br />
phase-locking to a quartz oscillator is preferable below<br />
about 4 or 5 GHz, and a fundamental oscillator<br />
locked to a high-Q tank circuit is preferable at<br />
higher frequencies.<br />
A comprehensive search of the literature by Hyde<br />
did not uncover a device at Q-band that had better<br />
phase noise than the one he described (9).<br />
One has to build the right system even to test<br />
the phase noise - no commercial spectrum analyzer<br />
is satisfactory for the measurement.<br />
D. Pulsed ENDOR<br />
In CW ENDOR the rule of thumb is that the CW<br />
EPR spectrum S/N should be greater than 100:1 to<br />
get reasonable ENDOR results. Also one usually<br />
assumes that ca. 1 mM solutions are needed. In<br />
contrast, if one can see a pulsed EPR signal (echo)<br />
one can obtain pulsed ENDOR for the sample. In<br />
ideal cases one can invert the spins and get a 100%<br />
ENDOR effect using pulsed EPR techniques. However,<br />
the pulsed EPR signal usually has poorer S/N<br />
than the CW EPR signal, so a 100% ENDOR effect<br />
may not result in better S/N than the smaller effect<br />
observed in CW ENDOR.<br />
Typically for metalloprotein solutions one observes<br />
about a 5-10% ENDOR effect. How much<br />
signal is lost during the polarization transfer period<br />
depends on cross relaxation and other relaxation<br />
times. Cu(II) proteins at liquid He temperature<br />
typically have cross relaxation times of 10 ms<br />
or less. Tis are several hundred microsec. One does<br />
not want a high spin concentration, since then the<br />
phase relaxation time becomes short. For Cu proteins<br />
shortening of the phase relaxation time can<br />
be observed starting at about 1 mM, depending on<br />
where the metal is in the protein - when they are<br />
about 20 A apart one starts to see effects. Overall,<br />
the sensitivity is roughly a factor of 5 lower than for<br />
CW EPR.<br />
E. Dissemination of Modern Techniques<br />
A colleague once commented to Hyde with regard<br />
to a lecture presentation of exciting new techniques,<br />
"another experiment I cannot do." Engineers<br />
are not available in all labs to implement<br />
new techniques. Of the techniques that Hyde has<br />
developed, the most generally applied, because it<br />
can be implemented on largely standard spectrometers,<br />
is STEPR. Possibly a double-quantum EPR<br />
experiment using double sideband/suppressed carrier<br />
techniques could be implemented with a simple<br />
accessory. Commercial suppliers cannot do everything,<br />
but some things can be done, even though<br />
not financially justified by themselves, because they<br />
help carry the main product line. One possibility<br />
for introducing new techniques would be for groups<br />
of investigators to submit a joint proposal to a funding<br />
agency to purchase x number of accessories, and<br />
have the vendor produce a batch of x of them at<br />
one time. Another approach'would be to have, as<br />
an outgrowth of a Workshop such as this, an international<br />
commission make a recommendation between<br />
competing alternative demands on the limited development<br />
resources available.<br />
Many of the techniques can be done with existing<br />
commercial boxes if one knows how to put the boxes<br />
together in the right way. Maybe someone should<br />
publish the details of how to do these experiments<br />
with existing boxes.<br />
F. Software for Visualization of EPR<br />
Data<br />
Often software is the key to success. Without a<br />
combined hardware/software system one won't get
Vol. 16, No. 3/4 181<br />
many results. It used to be that when a lab needed<br />
software, someone just went home and wrote it at<br />
night, but now software needs are too sophisticated<br />
for this approach.<br />
There are some thorny issues about software.<br />
For example, even if you can write it in a night, it<br />
will take a week to document it in such a way that<br />
someone can use it. There is a lesson in commercial<br />
spread-sheet software. Sometimes it is better<br />
to force an application into some documented and<br />
supported commercial software rather than writing<br />
your own special-purpose software. It is difficult<br />
to make excellent general-purpose software. Maybe<br />
the emphasis should be on subroutine libraries, and<br />
easily modified software.<br />
The new EPR spectrometers and experimental<br />
methodologies described at the Symposium and<br />
Workshop will provide enormous amounts of information<br />
(or at least raw data that somehow must<br />
become information). Relative to slow-scan CW<br />
EPR, the new EPR technologies produce data at<br />
such a prodigious rate that data storage and subsequent<br />
manipulation becomes a larger problem than<br />
EPR labs have had to deal within the past. Although<br />
trivial by comparison with data generation<br />
rates in other fields of science (e.g., MRI, particle<br />
physics, or the space program), the amounts of<br />
data require qualitatively different computational<br />
approaches than are available in most EPR labs.<br />
Some labs already approach this problem by using<br />
data compression techniques, which can make<br />
the data storage requirements modest. For example,<br />
Jack Freed's FT EPR can produce a few 1 MB<br />
spectra per hour of spectrometer operation. Huge<br />
amounts of data are transferred to a supercomputer<br />
for the most substantive analyses. Linear predictive<br />
methods are used to reduce the volume of data for<br />
storage. Specialized software is needed for visualization<br />
of the multidimensional information that now<br />
can be generated so quickly, in order that it be communicated<br />
to human beings. Another approach is to<br />
recognize that the result of an experiment may be a<br />
series of Fourier coefficients, and these are what one<br />
would store, not all of the raw data. Others might<br />
be uncomfortable with the irreversible interim interpretation<br />
imposed on the data by these approaches.<br />
Now that EPR has a standard (Bruker BES 3 T)<br />
for storage and transfer of EPR data we need to<br />
consider how to present the data for visualization.<br />
This is a major problem. The solutions in other<br />
areas of science, where the visualization problem is<br />
analogous, are very large software packages which<br />
are very expensive because of the development effort<br />
to create them. A key issue is whether the EPR<br />
community will be able to support the effort needed<br />
to develop this software.<br />
Reef Morse pointed out that Scientific Software<br />
Services from the beginning has always provided<br />
source code for the marketed software. Customers<br />
make significant modifications. Dieter Schmalbein<br />
pointed out that the software provided with the<br />
Bruker ESP380 pulse spectrometer represents 32<br />
man-years of effort. More sophisticated software<br />
could be developed, but Bruker is limited in the<br />
effort that can be invested in EPR software by the<br />
profits that can be made in the EPR business. More<br />
than 90% of the EPR spectrometers are delivered to<br />
universities or government institutes. In contrast,<br />
80-90% of the customers for NMR spectrometers<br />
are in industry. In the NMR field a professional<br />
software package can be sold to industry for a reasonable<br />
amount of money, because industry can see<br />
the cost savings in terms of time saved by the software.<br />
IX. Summary on Instrumentation<br />
and Methodology<br />
The horizons of new EPR techniques are phenomenal.<br />
References were given above to many ways to<br />
apply pulses to spins. Many of the techniques are<br />
very expensive to implement. The excitement is in<br />
applying these techniques to problems that are now<br />
only being approached by the use of CW EPR. A<br />
lot of the discussion at this or other meetings about<br />
applying EPR is about just getting a CW spectrum.<br />
The S/N problem is bad enough for some samples<br />
that we sometimes struggle just getting a spectrum,<br />
sometimes for days at a time. But problem solving,<br />
in systems to which ways of studying electron spins<br />
can be applied, requires some of these new techniques.<br />
How soon can we get there? What is in our<br />
way? The general response at the Workshop was -<br />
Money. So now let us consider the money aspects.
182 Bulletin of Magnetic Resonance<br />
X. The Funding Agency Perspective<br />
Once upon a time there was to be a fourth panel,<br />
but the government ran out of money and funding<br />
agency representatives could not attend the Workshop.<br />
Dr. John Beisler, Executive Secretary, Biophysical<br />
Chemistry Study Section, Division of Research<br />
Grants, NIH, was the only person invited who<br />
could attend.<br />
A. Questions Regarding Funding of EPR<br />
in the USA<br />
The questions posed regarding funding are:<br />
1. What funding is available for the new research<br />
opportunities presented at this workshop, and<br />
for solving the instrumentation and software<br />
problems highlighted?<br />
2. How many EPR spectrometers were funded<br />
in recent years? What is the average dollar<br />
amount of such grants? Is there an historical<br />
trend?<br />
3. What characterizes a successful EPR instrumentation<br />
proposal?<br />
4. What types of referee comments characterize<br />
EPR instrumentation proposals that are not<br />
funded?<br />
5. How many grants (and what dollar volume)<br />
have been awarded in which a major focus of<br />
the research proposed is the development of<br />
EPR instrumentation and/or methodology?<br />
6. How many grants (and what dollar volume)<br />
have been awarded in which EPR is an important<br />
technique even if not a major focus of<br />
the grant?<br />
7. There is a tendency to compare funding of<br />
EPR with funding of NMR, since they are<br />
both magnetic resonance techniques. Does the<br />
structure of instrumentation grant programs<br />
make funding of an NMR proposal more probable<br />
than funding of an EPR proposal?<br />
8. What do the long-range planning processes<br />
on-going at the federal funding agencies portend<br />
for research in or using EPR?<br />
B. Information from the Presentation by<br />
John Beisler, DRG, NIH<br />
The CRISP data base at NIH is the source of the<br />
factual information he presented. He also provided<br />
his observations and perspective as Executive Secretary<br />
of the Biophysical Chemistry Study Section<br />
at NIH.<br />
The most recent fiscal year for which data was<br />
available is FY92 (ended June 30, 1992). To query<br />
the data base one has to use terms that are in its<br />
thesaurus. The terms used were electron spin resonance<br />
spectroscopy, electron nuclear double resonance,<br />
and nuclear magnetic resonance spectroscopy.<br />
The number of grants includes RO1, PO1,<br />
P41, etc., types. Grants are listed as having e.g.,<br />
EPR as the primary, secondary, or tertiary thrust.<br />
In FY92 General Medical Sciences funded 179<br />
projects (43% of the total awarded) in EPR. The<br />
Heart Institute, with 50 awards, is far in second<br />
place. The Cancer Institute made 24 awards. The<br />
Aging Institute made only three awards in the two<br />
fiscal years examined. There is a lot of opportunity<br />
for applications of EPR in some of the other<br />
Institutes.<br />
In the shared instrument program in FY87 about<br />
2/3 of the proposals were funded, but this was unusual.<br />
Because of the small number of applications for<br />
EPR spectrometers, they get reviewed by a panel<br />
for "other spectroscopy." This results in relatively<br />
few of the reviewers being expert in EPR, which is<br />
viewed by some researchers as a liability, but in a<br />
homogeneous review panel as for NMR, there is a<br />
tendency to rank all of the applications.<br />
Most EPR-related proposals tend to be reviewed<br />
by three study sections, Physical Biochemistry, Biophysical<br />
Chemistry, and Metallobiochemistry. Of<br />
the roughly 80 applications per review cycle in biophysical<br />
chemistry, about 24 are in NMR, 24 in crystallography,<br />
and a few in EPR. There is usually one<br />
person with specialization in EPR and a few others<br />
knowledgeable about EPR on the study section.<br />
Dr. Beisler asked various other people at NIH<br />
and members of study sections (past and present)<br />
about some of the questions asked for this Workshop.<br />
Some of the impressions and opinions offered<br />
were:
Vol. 16, No. 3/4 183<br />
FY87<br />
FY92<br />
EPR<br />
EPR<br />
NMR<br />
Table<br />
327 awards<br />
$45 8M total<br />
415 grants<br />
$57.3M total<br />
1763 grants<br />
1U<br />
16% primary, 80% tertiary<br />
15% primary, 81% tertiary<br />
20% primary, 77% tertiary<br />
Table 11: NIH Shared Instrument Program<br />
FY87<br />
NMR 51 applications reviewed, 31 funded, $7.9M total<br />
EPR 3 applications reviewed, 2 funded, $356K total<br />
FY92<br />
In FY92 the shared instrumentation program was cut from $32M/year to ca. $8M/year.<br />
3 awards for EPR, $600K total<br />
1. NMR and EPR proposals fare about equally<br />
well.<br />
2. The perception is that the real richness of EPR<br />
applications to lipid or membrane research has<br />
been mined. There is a low opinion of EPR in<br />
lipid research.<br />
3. EPR proposals need to emphasize what information<br />
on a particular problem EPR can give<br />
that other techniques such as NMR, fluorescence,<br />
X-ray, etc., cannot.<br />
4. For greater success, put EPR in the broader<br />
context of other spectroscopies. How does<br />
it complement the information available from<br />
other spectroscopies? For structural biochemistry,<br />
for example, what does EPR reveal<br />
about distances, angles, etc.<br />
5. Remember to speak to the reviewers rather<br />
than making assumptions that they have a<br />
background in EPR.<br />
6. The advantages EPR has relative to NMR are<br />
small sample size and high sensitivity relative<br />
to NMR.<br />
7. In the context of discussion about new hardware<br />
development, it is well to keep in mind<br />
that one can often get very reasonable data<br />
from a 15-year-old Varian spectrometer. Elegant<br />
solutions to problems can often be done<br />
with very simple instruments.<br />
Many scientists, hearing this opinion attributed<br />
to peer reviewers, wish to communicate the larger<br />
message of this workshop, that elegant new EPR<br />
tools are now available for more powerful problemsolving<br />
than was possible with the older EPR techniques.<br />
XI. The Vendor Perspective<br />
At the close of the Workshop the community<br />
sought the response of instrument and software vendors<br />
to the challenges and opportunities presented.<br />
A. Bruker (Dieter Schmalbein)<br />
As a manufacturer, Bruker finds Q-band unprofitable<br />
but has decided not to discontinue it! The<br />
Bruker Q-band system has switched from klystrons,<br />
which are no longer available, to Gunn oscillators,
184 Bulletin of Magnetic Resonance<br />
and the sensitivity is about the same. With the<br />
new helium FlexLine cryostat, which is also used<br />
by the L-, S- and pulsed X-band systems, the Qband<br />
system can operate to 1.8 K, with magnetic<br />
field modulation from 1.5 KHz to 100 KHz without<br />
problem.<br />
Bruker continues to offer a diverse range of microwave<br />
bridges for many specific applications. The<br />
phase noise of X-band sources (klystron and Gunn<br />
oscillator) is suppressed 130-140 dB at 10 KHz<br />
from the carrier. The high output 2-8 GHz Multi-<br />
Frequency Bridge should meet the needs of many<br />
researchers.<br />
Over the seven-year period, 1985-1992, 37% of<br />
the EPR spectrometers produced by Bruker were<br />
delivered in the US, 19.4% in Germany, 6.5% Japan,<br />
4.4% England, in terms of dollars, not number of<br />
spectrometers. In the past 12 months the situation<br />
has changed, and 59% of EPR sales (in dollars) have<br />
been to Europe, 20% to Japan, and only 10% to the<br />
US. This may change in the near future.<br />
Since EPR is a very low volume market, Bruker<br />
has to be very careful in selecting the areas in which<br />
to invest development effort and capital. In the<br />
recent past they have put this effort into developing<br />
the most advanced spectrometers that are possible<br />
in a commercial market, culminating in the<br />
ESP380E. About 40 of these have been sold so far<br />
(only five in the US). Bruker has the impression that<br />
the ESP380E is ahead of the users - people cannot<br />
exploit the capabilities of the ESP380E. There is a<br />
need for more institutes around the world to teach<br />
people how to use non-stationary EPR techniques<br />
and to provide service to people to help them start<br />
using these techniques. No EPR service center in<br />
the US (e.g., NIH Research Resource Centers) has a<br />
modern commercial pulsed EPR spectrometer. Before<br />
Bruker can invest in making these spectrometers<br />
even more complicated, with capabilities such<br />
as pulsed ENDOR, multifrequency pulsed EPR, and<br />
pulsed EPR imaging, there has to be more use of<br />
the existing capabilities of the spectrometer. Then,<br />
Bruker can consider the commercial implementation<br />
of these new techniques.<br />
Up to now Bruker has not charged for EPR software<br />
- it was delivered as part of the spectrometer.<br />
Now there is evident need for much more professional,<br />
sophisticated, and diversified software, and<br />
Bruker anticipates having to hire more programmers<br />
and hence to have to charge for the software.<br />
Bruker has tried very hard to listen to what the<br />
researchers and other customers say they want in an<br />
EPR instrument. In the past everyone wanted the<br />
best spectrometer possible, and the specifications<br />
of the spectrometer were very important. Recently,<br />
this has changed in a few markets, especially in the<br />
US. In the US people seem to want the lowest price<br />
spectrometer, and the specifications usually are a<br />
minor consideration. In Europe price/performance<br />
is the most important consideration. In Japan, however,<br />
performance is most important. Bruker has to<br />
decide whether to develop two types of spectrometers,<br />
one with the highest possible performance and<br />
sophistication for part of the market, and another<br />
spectrometer at the lowest possible price. During<br />
the Workshop scientists have expressed desire to<br />
have spectrometers with higher performance and<br />
to have hardware and software from the manufacturer.<br />
But the part of the market not represented at<br />
the Workshop may require Bruker to put its development<br />
effort not into spectrometers for advanced<br />
techniques but into spectrometers at lower prices.<br />
Bruker will continue to improve the FT spectrometers.<br />
Pulsed ENDOR will come on the market<br />
next year. They will experiment with imaging techniques.<br />
At the moment there are no plans to go<br />
into high-field EPR, because they cannot foresee a<br />
market in this area.<br />
B. JEOL (Jack Francis)<br />
JEOL will be involved in the development and<br />
marketing of EPR spectrometers for a long time,<br />
and hopes to be more involved in conferences like<br />
this by next year, and possibly add a bit to what is<br />
being discussed.<br />
C. Micro-Now (Clarence Arnow)<br />
Micro-Now has been involved in EPR instrumentation<br />
for over 25 years, mostly with accessories.<br />
They built an L-band spectrometer and a Q-band<br />
spectrometer about 20-25 years ago. In the last 5<br />
years they have put more effort into building EPR<br />
spectrometers. They have built four types of spectrometers<br />
- for teaching, for dosimetry, a more complete<br />
system in modular form, and a new spectrometer,<br />
demonstrated at the Symposium this year. This<br />
new spectrometer incorporates a magnet built in
Vol. 16, No. 3/4 185<br />
Russia, and is very portable. The spectrometer uses<br />
a Gunn source.<br />
Their effort will generally be in the direction of<br />
spectrometers such as this new one, which essentially<br />
address the part of the market that once was<br />
served by the Varian E-4.<br />
D. Oxford Instruments (Mark Woolfrey)<br />
There has been no comment at the Workshop<br />
of limits to research due to the performance<br />
of cryostats, in contrast to the discussion in 1987.<br />
Special versions of cryostats can be made whenever<br />
modification of the standard cryostats would<br />
be helpful.<br />
XII. Summary Perspective<br />
A. The Horizons of EPR<br />
Much of the discussion of commercial instrumentation,<br />
and of NIH funding, even at this Workshop<br />
has been about relatively standard CW, linear,<br />
single-frequency (X-band), field swept EPR. The<br />
horizons of EPR are much different. The funding<br />
situation is as if you were looking East from Denver,<br />
and the reality of research needs is as if you<br />
were looking west from Denver. There is a lot of<br />
difficult terrain to get through to do such things<br />
as pulsed magnetic field jump, pulsed ENDOR, or<br />
multiquantum EPR.<br />
It is surprising, maybe even distressing, that<br />
changes in EPR as practiced in most laboratories<br />
and as described in most spectroscopy texts are so<br />
much slower than some of the other changes going<br />
on in society, especially internationally. If one looks<br />
back at the design criteria set forth by the 1987<br />
Workshop, one would make relatively few changes<br />
today. The priorities remain about the same.<br />
One can hope that some time not too far in<br />
the future at another Workshop the focus will have<br />
changed to the now largely unexplored regions of<br />
EPR spectroscopy: 4D, multiquantum, multifrequency,<br />
etc. What will be possible when we can<br />
see EPR spectra of brain tissue, in vivo, localized<br />
in a living animal, using all of the advanced EPR<br />
techniques we learned about at the Symposium and<br />
Workshop? This is where EPR is really going to be<br />
able to solve problems. The future has some exciting<br />
possibilities. Some day we will look back on the<br />
current S/N and wonder why people say, as they<br />
have for at least 20 years, that EPR is near the theoretical<br />
limits. Almost nothing that was reported<br />
today could have been done even a few years ago.<br />
Harold Swartz from time to time reminds us (and<br />
himself) that some years ago he declared that "the<br />
problem with EPR imaging is that there is nothing<br />
to image and no way to image it." At the Symposium<br />
and the Workshop he was a strong advocate of<br />
the current research and imminent clinical application<br />
of EPR imaging. His earlier comments, along<br />
with such famous quotations as "I think there is a<br />
world market for about five computers" (Thomas<br />
Watson, 1943) should be engraved on the portals of<br />
NIH to serve as a reminder to those who serve on<br />
study sections.<br />
B. Where EPR is Today<br />
The EPR perspective on a problem is very broad<br />
indeed (Table 12). Even though, as stated at the<br />
outset, much of what has been done has been CW,<br />
linear response, field swept, in homogeneous magnetic<br />
fields, and in one dimension, a few labs have<br />
shown the way with pulsed time domain EPR, extending<br />
into 2 and 3 dimensions. Hyde has recently<br />
opened our eyes to the possibilities of multiquantum<br />
EPR.<br />
The goals set in 1987 were ambitiously forwardlooking.<br />
With all of the exciting new developments<br />
in EPR, instrumentation and software are still way<br />
behind the needs of researchers. In fact we haven't<br />
come very far in five years toward the goals set in<br />
1987. This statement, which is true with respect<br />
to the full scope of the demonstrated possibilities of<br />
EPR, is not meant to in any way detract from the<br />
almost revolutionary advances made by instrument<br />
vendors in the past five years. The Bruker ESP380E<br />
has capabilities for pulsed X-band EPR that users<br />
have not yet learned to exploit. The Micro-Now<br />
8400 bench-top EPR makes it possible to expand<br />
the applications (and importantly the instruction)<br />
of CW X-band EPR into labs that previously could<br />
not afford a spectrometer. The Bruker EMS 104 is<br />
the first spectrometer built for quantitative EPR,<br />
a severely under-exploited area. The software becoming<br />
available is of a sophistication well beyond<br />
anything even dreamed of a few years ago. The<br />
hopes for extracting information from spectra in the<br />
near future are very bright. At the time of the 1987
186 Bulletin of Magnetic Resonance<br />
Table 12: The EPR Perspective<br />
CW ID 2D 3D 4D<br />
multifrequency (MHz to THz)<br />
multiresonance (ELDOR, ENDOR, TRIPLE)<br />
field-swept, frequency-swept<br />
linear<br />
non-linear (ST-EPR, saturated)<br />
ODMR, etc.<br />
pulsed<br />
multifrequency<br />
ESE (Ti, T2)<br />
saturation recovery<br />
FT-EPR<br />
pulsed ENDOR<br />
pulsed magnetic field<br />
multiquantum<br />
mult ifrequency<br />
Workshop it was a valid point of view to declare that<br />
the "new" spectrometers of the day were not enough<br />
of an improvement over existing spectrometers to<br />
justify replacement of a functioning old spectrometer.<br />
Now, these new instrumentation and software<br />
capabilities change the situation entirely.<br />
The extreme importance of multifrequency, multidimensional<br />
(and, we project, multiquantum)<br />
EPR leaves many regions of the matrix of EPR observables<br />
not served by commercial instrumentation.<br />
The crucial issues expressed in 1987 remain - for<br />
example, should the limited R&D effort that is available<br />
in EPR be applied to creating the ultimate Xband<br />
CW EPR, should it be applied to broadband<br />
EPR, should it be applied to pulsed EPR? In this regard<br />
it should be recognized that the total R&D effort<br />
by commercial EPR instrument manufacturers<br />
is about the same as (maybe less than) the instrumentation<br />
research effort in the handful of leadingresearch<br />
labs around the world. In the USA in particular,<br />
Bruker and MicroNow are investing in EPR<br />
as strongly as they can prudently do so considering<br />
the magnitude of the EPR instrumentation market<br />
as it exists today. Given the severe limitations on<br />
research funding, it is not surprising that there is<br />
a "lowest bidder" attitude among purchasers, but<br />
this very attitude causes the capability limitations<br />
about which people complain.<br />
These companies cannot invest enough to lead in<br />
all areas of EPR. The task for the EPR community<br />
is to set some priorities on how the EPR perspective<br />
should advance to fill out the matrix of possible<br />
experiments to enhance problem solving in science.<br />
Guiding the selection of research progress for commercialization<br />
requires a collective wisdom for the<br />
good of science - and for the good of the fields in<br />
which the results of EPR will be applied. These<br />
Workshops are a small step toward channeling the<br />
best ideas of workers in EPR to guide priorities for<br />
our future.<br />
C. The Future<br />
It is clear that some applications need techniques<br />
for identifying many electron spin sites in complex<br />
physical or biological structures. A specific example<br />
is photosynthetic reaction centers. It is also clear<br />
that simulation and visualization of experimental results<br />
lag behind the ability to acquire data.<br />
A fundamental quandary for researchers is that
Vol. 16, No. 3/4 187<br />
marketing of spectrometers is demand-driven, but<br />
research is resource-driven. We hope that the aggregate<br />
market will permit manufacturers of EPR<br />
spectrometers to provide some leadership via marketing<br />
of spectrometers with capabilities that many<br />
researchers don't yet know that they need. The<br />
Bruker ESP380E is such an example - it has more<br />
functionality for pulsed X-band EPR than most purchasers<br />
have been able to exploit.<br />
XIII. Acknowledgment<br />
In this paper GRE and SSE serve as reporters/reviewers<br />
of the information (some of it unpublished)<br />
and opinions presented at the Workshop.<br />
Where researchers' names are associated with particular<br />
sections, they reviewed the section before<br />
the draft was submitted for publication. Numerous<br />
comments, corrections, and additions by Melvin<br />
Klein, Roger Isaacson, Arthur Heiss, Ralph Weber,<br />
Philip Morse, Linn Belford, Ron Mason, Harvey<br />
Buckmaster, and Howard Halpern helped transform<br />
tape recordings and notes from a meeting into this<br />
written report. Especially helpful comments and<br />
additional references were provided by Jack Freed,<br />
Arthur Schweiger, James Hyde, and Harold Swartz.<br />
In some places the wording is nearly verbatim as<br />
stated by a presenter or a discussant in the audience,<br />
or as provided by a participant after the<br />
Workshop. In other parts, the report is a synopsis<br />
and even a rearrangement of order from the oral<br />
presentation. The comments and references in the<br />
section on pulsed EPR are largely as provided by<br />
Arthur Schweiger. Without the extensive contributions<br />
of many people this report would be less complete.<br />
However, SSE and GRE are responsible for<br />
the final version and the overall focus and emphasis<br />
of this prospective on the future of EPR.<br />
Partial support of the Workshop was provided<br />
by NIH grant GM46669. Support of the preceding<br />
15th International EPR Symposium by Bruker Instruments<br />
Inc., Medical Advances Inc., Norell Inc.,<br />
Wilmad Glass Inc., Scientific Software Services, and<br />
Micro-Now Instruments Inc. also contributed to the<br />
success of the Workshop.<br />
XIV. References<br />
1<br />
"Pulsed EPR: A new field of applications," C. P.<br />
Keijzers, E. J. Reijerse, and J. Schmidt, eds., North<br />
Holland, Amsterdam, 1989.<br />
2<br />
"Advanced EPR: Applications in Biology and<br />
Biochemistry," A. J. Hoff, ed., Elsevier, Amsterdam,<br />
1989.<br />
3<br />
"Modern Pulsed and Continuous-Wave Electron<br />
Spin Resonance," L. Kevan and M. K. Bowman,<br />
eds., Wiley, New York, 1990.<br />
4<br />
"EPR Imaging and In Vivo EPR," G. R. Eaton,<br />
S. S. Eaton, and K. Ohno, eds., CRC Press, Boca<br />
Raton, Florida, 1991.<br />
5<br />
S. A. Dikanov and Yu. D. Tsvetkov, "Electron<br />
Spin Echo Envelope Modulation (ESEEM) Spectroscopy,"<br />
CRC Press, Boca Raton, Florida, 1992.<br />
6<br />
G. R. Eaton and S. S. Eaton, Bull. Magn. Reson.<br />
10, 3 (1988).<br />
7<br />
G. R. Eaton and S. S. Eaton, Spectroscopy 3,<br />
34 (1988). Also republished in Spectroscopy International.<br />
8<br />
W. Froncisz, T. Oles, and J. S. Hyde, Rev. Sci.<br />
lustrum. 57, 1095 (1986).<br />
9<br />
J. S. Hyde, M. E. Newton, R. A. Strangeway, T.<br />
G. Camenisch, and W. Froncisz, Rev. Sci. Instrum.<br />
62, 2969 (1991).<br />
10<br />
J. S. Hyde and W. Froncisz, National Electronics<br />
Conf. Proc. 35, 602 (1981).<br />
U<br />
J. S. Hyde and W. Froncisz, Ann. Rev. Biophys.<br />
Bioeng. 11, 391 (1982).<br />
12<br />
J. S. Hyde, W. E. Antholine, and R. Basosi,<br />
"Sensitivity Analysis in Multifrequency EPR Spectroscopy,<br />
Biological and Inorganic Copper Chemistry,"<br />
K. D. Karlin and J. Zubieta eds., Adenine<br />
Press, 1985, page 239.<br />
13<br />
W. K. Subczynski, S. Lukiewicz, and J. S.<br />
Hyde, Magn. Reson. Med. 3, 747 (1986).<br />
14<br />
J. S. Hyde, M. Pasenkiewicz-Gierula, R. Basosi,<br />
W. Froncisz, and W. E. Antholine, J. Magn.<br />
Reson. 82, 63 (1989).<br />
15<br />
R. A. Strangeway, T. K. Ishii, and J. S. Hyde,<br />
IEEE Trans. Microwave Theory & Technique 36,<br />
792 (1988).<br />
16<br />
P. Lesniewski and J. S. Hyde, Rev. Sci. Instrum.<br />
61, 2248 (1990).<br />
17<br />
T. Oles, R. A. Strangeway, J. Luglio, W. Froncisz,<br />
and J. S. Hyde, Rev. Sci. Instrum. 63, 4010<br />
(1992).
188 Bulletin of Magnetic Resonance<br />
18 W. P. Robins, "Phase Noise in Signal Sources<br />
(Theory and Applications)," Peter Peregrinus Ltd.<br />
on behalf of the Institute of Electrical Engineers,<br />
London, 1982, equation 5.27, p. 53.<br />
19 W. Froncisz, T. Oles, and J. S. Hyde, Rev. Sci.<br />
lustrum. 57, 1095 (1986).<br />
20 M. E. Johnson and J. S. Hyde, Biochemistry<br />
20, 2875 (1981).<br />
21<br />
J. S. Hyde, M. Pasenkiewicz-Gierula, A. Jesmanowicz,<br />
and W. E. Antholine, Appl. Mqgn. Reson.<br />
1, 483 (1990).<br />
22<br />
J. S. Hyde, A. Jesmanowicz, J. J. Ratke, and<br />
W. E. Antholine, J. Magn. Reson. 96, 1 (1992).<br />
23<br />
J. S. Hyde, P. B. Sczaniecki, and W. Froncisz,<br />
J. Chem. Soc. Faraday Trans. 7 85, 3901 (1989).<br />
24<br />
W. Froncisz, P. B. Sczaniecki, and J. S. Hyde,<br />
Physica Medica 5, 163 (1989).<br />
25<br />
P. B. Sczaniecki, J. S. Hyde and W. Froncisz,<br />
J. Chem. Phys. 93, 3891 (1990).<br />
26<br />
P. B. Sczaniecki, J. S. Hyde and W. Froncisz,<br />
J. Chem. Phys. 94, 5907 (1991).<br />
27<br />
H. S. Mchaourab and J. S. Hyde, J. Chem.<br />
Phys. 98, 1786 (1993).<br />
28<br />
H. S. Mchaourab, S. Pfenninger, W. E. Antholine,<br />
J. S. Hyde, and P. M. H. Kroneck, Biophys. J.<br />
64, 1576 (1993).<br />
29<br />
H. A. Buckmaster and J. C. Dering, IEEE<br />
Trans. lustrum. Meas. IM-16, 13 (1967).<br />
30<br />
H. A. Buckmaster and M. J. Kloza, IEEE<br />
Trans. lustrum. Meas. IM-18, 237 (1969).<br />
31<br />
H. A. Buckmaster and J. C. Dering, Can. J.<br />
Phys. 43, 1088 (1965).<br />
32<br />
H. A. Buckmaster and J. C. Dering, Can. J.<br />
Phys. 45, 107 (1967).<br />
33<br />
H. A. Buckmaster and J. C. Dering, J. Sci.<br />
lustrum. 43, 554 (1966).<br />
34<br />
H. A. Buckmaster and J. C. Dering, Proceedings<br />
of the XlVth Colloque Ampere, Ljubljana,<br />
1966, p. 1017, North Holland Publ., 1967.<br />
35<br />
H. A. Buckmaster and R. S. Rathie, Can. J.<br />
Phys. 49, 853 (1971).<br />
36<br />
H. A. Buckmaster and J. D. Skirrow, Can. J.<br />
Phys. 50, 1092 (1972).<br />
37<br />
G. Feher, R. A. Isaacson, and J. D. McElroy,<br />
Rev. Sci. lustrum. 40, 1640 (1969). This paper<br />
was reproduced starting on page 341 of "Advanced<br />
EPR: Applications in Biology and Chemistry," A.<br />
J. Hoff, ed., Elsevier, Amsterdam, 1989.<br />
38<br />
Douglas A. Knoll, M.S. Thesis, Marquette University,<br />
March 1989.<br />
39<br />
L. Berliner, "The Scope of In Vivo EPR in<br />
EPR Imaging and In Vivo EPR," G. R. Eaton, S. S.<br />
Eaton, and K. Ohno, eds., CRC Press, Boca Raton,<br />
Florida, 1991.<br />
40<br />
H. J. Halpern and M. K. Bowman, Low-<br />
Frequency EPR Spectrometers: MHz Region, Chapter<br />
6 in "EPR Imaging and In Vivo EPR," G. R.<br />
Eaton, S. S. Eaton, and K. Ohno, eds., CRC Press,<br />
Boca Raton, Florida, 1991.<br />
41<br />
L. Berliner and J. Koscielniak, Low Frequency<br />
EPR Spectrometers: L-Band, Chapter 7 in "EPR<br />
Imaging and In Vivo EPR," G. R. Eaton, S. S.<br />
Eaton, and K. Ohno, eds., CRC Press, Boca Raton,<br />
Florida, 1991.<br />
42<br />
H. M. Swartz and J. F. Glockner, Measurement<br />
of Oxygen by EPRI and EPRS, chapter 24<br />
in "EPR Imaging and In Vivo EPR," G. R. Eaton,<br />
S. S. Eaton, and K. Ohno, eds., CRC Press, Boca<br />
Raton, Florida, 1991.<br />
43<br />
H. M. Swartz and J. F. Glockner, Measurements<br />
of the Concentration of Oxygen in Biological<br />
Systems Using EPR Techniques, Chapter 21 in<br />
"Advanced EPR: Applications to Biology and Biochemistry,"<br />
A. J. Hoff, ed., Elsevier, Amsterdam,<br />
1989.<br />
44<br />
L. Berliner, Applications of In Vivo EPR,<br />
Chapter 25 in "EPR Imaging and In Vivo EPR,"<br />
G. R. Eaton, S. S. Eaton, and K. Ohno, eds., CRC<br />
Press, Boca Raton, Florida, 1991.<br />
45<br />
G. Bacic, M. J. Nilges, R. L. Magin, T. Walczak,<br />
and H. M. Swartz, Magn. Reson. Med. 10,<br />
266 (1989).<br />
46<br />
H. M. Swartz, S. Boyer, P. Gast, J. F. Glockner,<br />
H. Hu, K. J. Liu, M. Moussavi, S. W. Norby,<br />
N. Vahidi, T. Walczak, M. Wu, and R. B. Clarkson,<br />
Magn. Reson. Med. 20, 333 (1991).<br />
47<br />
H. M. Swartz, S. Boyer, D. Brown, K. Chang,<br />
P. Gast, J. F. Glockner, H. Hu, K. J. Liu, M. Moussavi,<br />
M. Nilges, S. W. Norby, A. Smirnov, N. Vahidi,<br />
T. Walczak, M. Wu, and R. B. Clarkson, The Use<br />
of EPR for the Measurement of the Concentration<br />
of Oxygen In Vivo In Tissues Under Physiologically<br />
Pertinent Conditions and Concentrations, in "Oxygen<br />
Transport to Tissue XIV," W. Erdmann and<br />
D. F. Bruley (eds.), Plenum Publishing Corp., New<br />
York, 1992, p. 221.<br />
48<br />
K. J. Liu, P. Gast, M. Moussavi, S. W. Norby,
Vol. 16, No. 3/4 189<br />
N. Vahidi, M. Wu, and H. M. Swartz, Proc. Natl.<br />
Acad. Sci. U.S.A. 90, 5438 (1993).<br />
49 L. J. Berliner and H. Fujii, Science 227, 517<br />
(1985).<br />
50 J. Gorcester and J. H. Freed, J. Chem. Phys.<br />
88, 4678 (1988).<br />
51 J. Gorcester, G. L. Milhauser, and J. H.<br />
Freed, Two-Dimensional Electron Spin Resonance,<br />
in "Modern Pulsed and Continuous-Wave Electron<br />
Spin Resonance," L. Kevan and M. K. Bowman,<br />
eds., Wiley-Interscience, 1990.<br />
52 K. P. Dinse, M. Pluschau, G. Kroll, T. Prisner,<br />
and H. van Willigen, Bull. Magn. Reson. 11, 174<br />
(1989).<br />
53 A. Angerhofer, M. Toporowicz, M. K. Bowman,<br />
J. R. Norris, and H. Levanon, J. Phys. Chem.<br />
92, 7164 (1988).<br />
54 J. Gorcester and J. H. Freed, J. Chem. Phys.<br />
85, 5375 (1986).<br />
55 J. Gorcester, S. B. Rananavare, and J. H.<br />
Freed, J. Chem. Phys. 90, 5764 (1989).<br />
56 U. Ewert, R. H. Crepeau, C. R. Dunnam, D.<br />
Xu, S.-Y. Lee, and J. H. Freed, Chem. Phys. Lett.<br />
184, 25 (1991).<br />
57 U. Ewert, R. H. Crepeau, S.-Y. Lee, C. R. Dunnam,<br />
D. Xu, and J. H. Freed, Chem. Phys. Lett.<br />
184, 34 (1991).<br />
58 B. R. Patyal, R. H. Crepeau, D. Gambiel, and<br />
J. H. Freed, Chem. Phys. Lett. 173, 443 (1990).<br />
59 B. R. Patyal, R. H. Crepeau, D. Gambiel, and<br />
J. H. Freed, Chem. Phys. Lett. 175, 453 (1990).<br />
60 S.-Y. Lee, B. R. Patyal, and J. H. Freed, A J.<br />
Chem. Phys. 221, 397 (1993).<br />
61 D. H. Shin, J. L. Dye, D. E. Budil, K. A. Earle,<br />
and J. H. Freed, J. Chem. Phys. 97, 1213 (1993).<br />
62 D. E. Budil, K. E. Earle, and J. H. Freed, J.<br />
Chem. Phys. 97, 1294 (1993).<br />
63 D. E. Budil, K. A. Earle, W. B. Lynch, and<br />
J. H. Freed, Electron Paramagnetic Resonance at 1<br />
Millimeter Wavelengths, in "Advanced EPR: Applications<br />
in Biology and Chemistry," A. J. Hoff, ed.,<br />
Elsevier, Amsterdam, 1989.<br />
64 W. B. Lynch, K. A. Earle, and J. H. Freed,<br />
Rev. Sci. lustrum. 59, 1345 (1988).<br />
65 J. H. Freed, J. Chem. Soc. Faraday Trans. 86,<br />
3173 (1990).<br />
66 "Proceedings of the National High Magnetic<br />
Field Laboratory Workshop on Nuclear Magnetic<br />
Resonance," edited by E. R. Andrew, T. Mareci,<br />
and N. S. Sullivan, Published by the University of<br />
Florida, Gainesville, Florida, 1992. This book contains<br />
contributions on high-field EPR by J. H. Freed,<br />
G. R. Eaton and R. Weber.<br />
67 S. S. Eaton and G. R. Eaton, Magn. Reson.<br />
Rev. 16, 157 (1993).<br />
68 P. L. Richards, W. S. Caughey, H.<br />
Eberspaecher, G. Feher, and M. Malley, J. Chem.<br />
Phys. 47, 1187 (1967).<br />
69 W. B. Minis, Electron Spin Echoes, in "Electron<br />
Paramagnetic Resonance," S. Geschwind, ed.,<br />
Plenum, New York, 1972, p. 263.<br />
70 K. M. Salikhov, A. G. Seminov, and Yu. D.<br />
Tsvetkov, "Electron spin echoes and their applications,"<br />
Nauka, Novosibirsk, 1976 (in Russian).<br />
71 K. J. Standley and R. A. Vaughan, "Electron<br />
Spin Relaxation Phenomena in Solids," Plenum<br />
Press, New York, 1969.<br />
72 H. Thomann, L. R. Dalton, and L. A. Dalton,<br />
Biol. Magn. Reson. 6, 143 (1984).<br />
73 H. Thomann and W. B. Mims, Pulsed electronnuclear<br />
spectroscopy and the study of metalloprotein<br />
active sites, in "Pulsed Magnetic Resonance:<br />
NMR, ESR, and Optics," D. M. S. Bagguley, ed.,<br />
Clarendon Press, Oxford, 1992, p. 362.<br />
74 Yu. D. Tsvetkov and S. A. Dikanov, Met. Ions.<br />
Biol. Syst. 22, 207 (1987).<br />
75 S. A. Dikanov and Yu. D. Tsvetkov, J. Struct.<br />
Chem. 26, 766 (1985).<br />
76 A. Schweiger, Angew. Chem. Int. Ed. Engl.<br />
30, 265 (1991).<br />
77 Th. Wacker, G. A. Sierra, and A. Schweiger,<br />
Isr. J. Chem. 32, 305 (1993).<br />
78 A. Schweiger, Pure Appl. Chem. 64, 809<br />
(1992).<br />
79 G. A. Sierra, A. Schweiger, and R. R. Ernst,<br />
Chem. Phys. Lett. 184, 363 (1991).<br />
80 Th. Wacker and A. Schweiger, Chem. Phys.<br />
Lett. 191, 136 (1992).<br />
81 Th. Wacker and A. Schweiger, Chem. Phys.<br />
Lett. 186, 27 (1991).<br />
82 C. Gemperle, A. Schweiger, and R. R. Ernst,<br />
Chem. Phys. Lett. 145, 1 (1988).<br />
83 A. V. Astashkin and A. Schweiger, Chem.<br />
Phys. Lett. 174, 595 (1990).<br />
84 M. K. Bowman, R. J. Massoth, and C. S. Yannoni,<br />
Coherent Raman Beats in Electron Paramagnetic<br />
Resonance Spectroscopy, in "Pulsed Magnetic<br />
Resonance: NMR, ESR, and Optics," D. M. S. Bag-
190 Bulletin of Magnetic Resonance<br />
guley, ed., Clarendon Press, 1992, p. 423.<br />
85 A. Schweiger and R. R. Ernst, J. Magn. Reson.<br />
77, 512 (1988).<br />
86 A. Calligiani, M. Giordano, D. Leporini, M.<br />
Lucchesi, M. Martinelli, L. Pardi, and S. Santucci,<br />
Appl. Magn. Reson. 3, 107 (1992).<br />
87 K. P. Dinse, Pulsed ENDOR, Chapter 17 in<br />
"Advanced EPR. Applications in Biology and Biochemistry,"<br />
A. J. Hoff, ed., Elsevier, Amsterdam,<br />
1989.<br />
88 R. B. Clarkson, M. D. Timken, D. R. Brown,<br />
H. C. Crookham, and R. L. Belford, Chem. Phys.<br />
Lett. 163, 277 (1989).<br />
89 R. B. Clarkson, D. R. Brown, J. B. Cornelius,<br />
H. C. Crookham, W.-J. Shi, and R. L. Belford, Pure<br />
Appl. Chem. 64, 893 (1992).<br />
90 B. E. Sturgeon and D. M. Britt, Rev. Set. In-<br />
strum. 63, 2187 (1992).<br />
91 G. J. Gerfen and D. J. Singel, J. Phys. Chem.<br />
93, 4571 (1990).<br />
92 D. J. Singel, Multifrequency ESEEM: Perspectives<br />
and Applications, in "Advanced EPR: Applications<br />
in Biology and Biochemistry," A. J. Hoff,<br />
ed., Elsevier, Amsterdam, 1989, p. 119.<br />
93 R. G. Larsen, G. J. Gerfen, and D. J. Singel,<br />
Appl. Magn. Reson. 3, 369 (1992).<br />
94 E. J. Reijerse and S. A. Dikanov, Pure Appl.<br />
Chem. 64, 789 (1992).<br />
95 S. L. Tan, J. S. Waugh, and W. H. Orme-<br />
Johnson, J. Chem. Phys. 81, 576 (1984).<br />
96 C. Gemperle, A. Schweiger, and R. R. Ernst,<br />
Chem. Phys. Lett. 178, 565 (1991).<br />
97 A. Schweiger, L. Braunschweiler, J.-M. Fauth,<br />
and R. R. Ernst, Phys. Rev. Lett. 54, 1241 (1985).<br />
98 A. Schweiger, New Trends in Pulsed Electron<br />
Spin-Resonance Methodology, in "Modern Pulsed<br />
and Continuous-Wave Electron Spin Resonance," L.<br />
Kevan and M. K. Bowman, eds., Wiley-Interscience.<br />
New York, 1990, p. 43.<br />
99 A. Schweiger, C. Gemperle, and R. R. Ernst,<br />
J. Magn. Reson. 86, 70 (1990).<br />
100 E. J. Hustedt, A. Schweiger, and R. R. Ernst,<br />
J. Chem. Phys. 96, 4954 (1992).<br />
101 H. Cho, S. Pfenninger, C. Gemperle, A.<br />
Schweiger, and R. R. Ernst, Chem. Phys. Lett.<br />
160, 31 (1989).<br />
102 J.-M. Fauth, A. Schweiger, and R. R. Ernst,<br />
J. Magn. Reson. 81, 262 (1989).<br />
103 C. Gemperle, Thesis, ETH 1992.<br />
104<br />
P. Hofer, A. Grupp, H. Nebenfuhr, and M.<br />
Mehring, Chem. Phys. Lett. 132, 279 (1986).<br />
105<br />
C. Gemperle, G. Aebli, A. Schweiger, and R.<br />
R. Ernst, J. Magn. Reson. 88, 241 (1990).<br />
106<br />
P. Hofer, Experimental Aspects of 2D ESEEM<br />
Techniques, Proceedings EMARDIS 91, World Scientific<br />
Publ., Singapore, 1991, p. 1.<br />
107<br />
J. J. Shane, P. Hofer, E. J. Reijerse, and E.<br />
de Boer, J. Magn. Reson. 99, 596 (1992).<br />
108<br />
D. Gamiel and J. H. Freed, J. Magn. Reson.<br />
89, 60 (1990).<br />
109<br />
J. M. Fauth, A. Schweiger, L. Braunschweiler,<br />
J. Forrer, and R. R. Ernst, J. Magn. Reson. 66, 74<br />
(1986).<br />
110<br />
M. Mehring, P. Hofer, and A. Grupp, Phys.<br />
Chem. 91, 1132 (1987).<br />
111<br />
A. Grupp and M. Mehring, Pulsed ENDOR<br />
Spectroscopy in Solids, in "Modern Pulsed and<br />
Continuous-Wave Electron Spin Resonance," L. Kevan<br />
and M. K. Bowman, eds., Wiley-Interscience,<br />
New York, 1990, p. 195.<br />
112<br />
C. Gemperle and A. Schweiger, Chem. Rev.<br />
91, 1481 (1991).<br />
113<br />
H. Thomann and M. Bernardo, Isr. J. Chem.<br />
32, 323 (1993).<br />
114<br />
H. Thomann and M. Bernardo, Spectrosc. Int.<br />
8, 119 (1990).<br />
115<br />
H. Thomann and M. Bernardo, Advances in<br />
Electron Nuclear Double Resonance Spectroscopy,<br />
Chapter 4 in "Magnetic Resonance of Carbonaceous<br />
Solids," R.E. Botto and Y. Sanada, eds., ACS<br />
Symposium Series 229, American Chemical Society,<br />
Washington, D.C., 1993, pp. 65-90.<br />
116<br />
C. Gemperle, O. W. Sorensen, A. Schweiger,<br />
and R. R. Ernst, J. Magn. Reson. 87, 502 (1990).<br />
U7<br />
C. Buhlman, A. Schweiger, and R. R. Ernst,<br />
Chem. Phys. Lett. 154, 285 (1989).<br />
U8<br />
H. Thomann and M. Bernardo, Chem. Phys.<br />
Lett. 169, 5 (1990).<br />
119<br />
H. Cho, S. Pfenninger, J. Forrer, and A.<br />
Schweiger, Chem. Phys. Lett. 180, 198 (1991).<br />
120<br />
M. Mehring, P. Hofer, H. Kaas, and A. Grupp,<br />
Europhys. Lett. 6, 463 (1988).<br />
121<br />
P. Hofer, A. Grupp, and M. Mehring, Phys.<br />
Rev. A33, 3519 (1986).<br />
122<br />
H. Cho, J. Chem. Phys. 94, 2482 (1991).<br />
123<br />
M. Mehring, P. Hofer, and A. Grupp, Phys.<br />
Rev. A33, 3523 (1986).
Vol. 16, No. 3/4 191<br />
124<br />
J. Forrer, S. Pfenninger, J. Eisenegger, and A.<br />
Schweiger, Rev. Sci. lustrum. 61, 3360 (1990).<br />
125<br />
H. Thomann and M. Bernardo, unpublished<br />
results.<br />
126<br />
H. Thomann and M. Bernardo, Methods En-<br />
zymol. 227, 118 (1993).<br />
127 V. V. Kurshev, A. Raitsimring, and Ytf. D.<br />
Tsvetkov, J. Magn. Reson. 81,441 (1989).<br />
128 Z. Levi, A. Raitsimring, and D. Goldfarb, J.<br />
Phys. Chem. 95, 7830 (1991).<br />
129 V. V. Kurshev, A. M. Raitsimring, and T.<br />
Ichikawa, J. Phys. Chem. 95, 3564 (1991). Note<br />
that this paper corrected a few errors in the equations<br />
presented in previous papers.<br />
130 A. Raitsimring, J. Peisach, H. C. Lee, and X.<br />
Chen, J. Phys. Chem. 96, 3526 (1992).<br />
131 J. S. Hyde, W. Froncisz, and C. Mottley,<br />
Chem. Phys. Lett. 110, 621 (1984).<br />
132 J. P. Hornak and J. H. Freed, Chem. Phys.<br />
Lett. 101, 115 (1983).<br />
133<br />
S. K. Rengen, V. R. Bhagat, V. S. S. Sastry,<br />
and B. Venkataraman, J. Magn. Reson. 33, 227<br />
(1979).<br />
134<br />
A. D. Milov, K. M. Salikhov, and M. D. Shchirov,<br />
Sov. Phys. Solid State 23, 565 (1981).<br />
135<br />
G. Volkel, S. A. Dzuba, A. Bartl, W. Brunner,<br />
and J. Frohner, Phys. Stat. Sol. 85, 257 (1984).<br />
136<br />
P. Dirksen, A. Henstra, and W. Th. Wenkebach,<br />
J. Phys. Condens. Matter 1, 8535 (1989).<br />
137<br />
C. G. Maresch, M. Weber, A. A. Dubinskii,<br />
and H. W. Spoess, Chem. Phys. Lett. 193, 134<br />
(1992).<br />
138<br />
S. S. Eaton and G. R. Eaton, Electron<br />
Spin Resonance Imaging, in "Modern Pulsed and<br />
Continuous-Wave Electron Spin Resonance," L. Kevan<br />
and M. K. Bowman, eds., Wiley-Interscience,<br />
New York, 1990, p. 405.<br />
139<br />
S. S. Eaton and G. R. Eaton, Pulsed EPR<br />
Imaging, in "EPR Imaging and In Vivo EPR," G.<br />
R. Eaton, S. S. Eaton, and K. Ohno, eds., CRC<br />
Press, Boca Raton, 1991, p. 73.<br />
140<br />
D. J. Sloop, H.-L. Yu, and T.-S. Lin, Chem.<br />
Phys. Lett. 124, 456 (1986).<br />
141<br />
A. D. Milov, A. Yu. Pusep, S. A. Dzuba, and<br />
Yu. D. Tsvetkov, Chem. Phys. Lett. 119, 421<br />
(1985).<br />
142<br />
G. R. Eaton and S. S. Eaton, J. Magn. Reson.<br />
67, 73 (1986).<br />
143 J.-L. Du, K. M. More, S. S. Eaton, and G. R.<br />
Eaton, Isr. J. Chem. 32, 351 (1993).<br />
144 S. Pfenninger, A. Schweiger, J. Forrer, and R.<br />
R. Ernst, Chem. Phys. Lett. 151, 199 (1988).<br />
145 G. A. Sierra, A. Schweiger, and R. R.<br />
Ernst, Anisotropy-Resolved EPR, Proceedings 26th<br />
Congress Ampere, Athens, 1992, p. 270.<br />
146 D. Stehlik, C. H. Bock, and M. C. Thurnauer,<br />
Transient EPR - Spectroscopy of Photoinduced<br />
Electronic Spin States in Rigid Matrices, in<br />
"Advanced EPR: Applications in Biology and Biochemistry,"<br />
A. J. Hoff, ed., Elsevier, Amsterdam,<br />
1989, p. 371.<br />
147 J. Fessmann, N. Rosch, E. Ohmes, and G.<br />
Kothe, Chem. Phys. Lett. 152, 491 (1988).<br />
148 J. Isoya, H. Kanda, J. R. Norris, J. Tang, and<br />
M. K. Bowman, Phys. Rev. B41, 3905 (1990).<br />
149 W. Froncisz and J. S. Hyde, J. Magn. Reson.<br />
47, 515 (1982).<br />
150 J. S. Hyde and W. Froncisz, Loop Gap Resonators,<br />
in "Advanced EPR: Applications in Biology<br />
and Biochemistry," A. J. Hoff, ed., Elsevier,<br />
Amsterdam, 1989, p. 277.<br />
151 S. Pfenninger, J. Forrer, and A. Schweiger,<br />
Rev. Sci. lustrum. 59, 752 (1988).<br />
152 J. Forrer, S. Pfenninger, B. Wagner, and Th.<br />
Weiland, Pure Appl. Chem. 64, 865 (1992).<br />
153 M. Mehring and E. Freysoldt, J. Phys. E: Sci.<br />
lustrum. 13, 894 (1980).<br />
154 J. P. Hornak and and J. H. Freed, J. Magn.<br />
Reson. 62, 311 (1985).<br />
155 R. W. Dykstra and G. D. Markham, J. Magn.<br />
Reson. 69, 350 (1986).<br />
156 W. M. Walsh and L. W. Rupp, Jr., Rev. Sci.<br />
lustrum. 57, 2278 (1986).<br />
157 P. Hofer, Bruker's Dielectric Resonator for<br />
FT-EPR, Bruker Report 2/1989, p. 4.<br />
158 R. T. Weber, J. A. M. Disselhorst, L. J. Prevo,<br />
J. Schmidt, and Th. Wenkenbach, J. Magn. Reson.<br />
81, 129 (1989).<br />
159 A. Yu. Bresgunov, A. A. Dubinskii, V. N.<br />
Krimov, Yu. G. Petrov, O. G. Poluektov, and Ya.<br />
S. Lebedev, Appl. Magn. Reson. 2, 715 (1987).<br />
160 R. W. Quine, G. R. Eaton, and S. S. Eaton,<br />
Rev. Sci. lustrum. 58, 1709 (1987).<br />
161 O. Burghaus, A. Toth-Kischkat, R. Klette,<br />
and K. Mobius, J. Magn. Reson. 80, 383 (1988).<br />
162 O. Burghaus, M. Rohrer, T. Gotzinger, M.<br />
Plato, and K. Mobius, Meas. Sci. Technol. 3, 765
192<br />
(1992).<br />
163 O. Burghaus, M. Plato, D. Bumann, B. Neumann,<br />
W. Lubitz, and K. Mobius, Chem. Phys.<br />
Lett. 185, 381 (1991).<br />
164 T. Kojima, Y. Haruyama, H. Tachibana, R.<br />
Tanaka, J. Okamoto, H. Hara, and Y. Yamamoto,<br />
Appl. Rad. Isotopes 44, 361 (1993).<br />
165 D. Maier and D. Schmalbein, Appl. Rad. Isotopes<br />
44, 345 (1993). A description of the Bruker<br />
EMS 104 spectrometer. See also, Bruker Report<br />
91/92.<br />
166 P. A. Tipton, J. McCracken, J. B. Cornelius,<br />
and J. Peisach, Biochemistry 28, 5720 (1989).<br />
167 A. Nayeem, S. B. Rananavare, V. S. S. Sastry,<br />
and J. H. Freed, J. Chem. Phys. 91, 6889 (1989).<br />
168 R. R. Ernst, Adv. Magn. Reson. 2, 1, 1966.<br />
169 B. L. Bales, J. Magn. Reson. 38, 193 (1980).<br />
170 H. J. Halpern, M. Peric, T-D. Nguyen, D.<br />
Spencer, B. A. Teicher, Y. J. Lin, and M. K. Bowman,<br />
J. Magn. Reson. 90, 40 (1990).<br />
m H. J. Halpern, D. P. Spencer, J. vanPolen, M.<br />
K. Bowman, A. C. Nelson, E. M. Dowey, and B. A.<br />
Teicher, Rev. Sci. Instrum. 60, 1040 (1989).<br />
172 M. J. Nilges, T. Walczak, H. M. Swartz, Phys-<br />
ica Medica 5, 195 (1989).<br />
173 J. S. Stamler, D. J. Singel, and J. Loscalzo,<br />
Science 258, 1898 (1992).<br />
174 K. R. Maples, T. Sandstroem, Y. F. Su, and<br />
R. Henderson, Am. J. Respir. Cell Mol. Biol. 4,<br />
538 (1991).<br />
175 J. S. Hyde and J. Gajdzinski, Rev. Sci. In-<br />
strum. 59, 1352 (1988).<br />
Bulletin of Magnetic Resonance
Vol. 16, No. 3/4 193<br />
Contents<br />
I. Introduction<br />
Review of the EPR Data on ns^Centers in Crystals<br />
S. V. Nistor 1 and D. Schoemaker<br />
Physics Department<br />
University of Antwerp (U.I. A.)<br />
B-2610 Wilrijk-Antwerpen, Belgium<br />
I. Ursu 1<br />
International Center for Theoretical Physics<br />
34100 Trieste, Italy<br />
II. Production and Structure of the ns^Centers<br />
III. Theory of the EPR Spectra 196<br />
A. The spin Hamiltonian of the ns 1 -centers 196<br />
B. The superhyperfine interaction 200<br />
IV. EPR Results 201<br />
A. Trapped electron ns^centers 201<br />
1. The IB-group (Cu°, Ag°, Au°) 201<br />
2. The IIB-group (Zn+, Cd+, Hg+) 205<br />
B. Trapped hole ns 1 -centers 209<br />
1. The IIIA-group (Ga 2+ , In 2+ , Tl 2+ ) 209<br />
2. The IVA-group (Ge 3+ , Sn 3+ , Pb 3+ ) 211<br />
V. Concluding Remarks 216<br />
VI. References 219<br />
I. Introduction<br />
Several reviews concerning the EPR of the paramagnetic<br />
transition-metal ions in crystals are now<br />
available, either as periodic reports published in the<br />
Magnetic Resonance Review, or in books [1,2,3] and<br />
review papers [4, 5]. Such paramagnetic centers are<br />
usually observed in the as grown crystals, the paramagnetic<br />
state being the normal valency state of the<br />
impurity in the crystal-host lattice.<br />
The present review focuses on a different type<br />
of paramagnetic centers, the so-called ns^centers.<br />
1 On leave from the Institute of Atomic Physics, Bucuresti,<br />
Roumania.<br />
193<br />
194<br />
Such centers, consisting mainly of a paramagnetic<br />
ion with the ns 1 (n > 2) outer electron configuration<br />
(Table 1), are seldom observed in the as grown<br />
crystals. They are produced in crystals containing<br />
cationic impurities by the trapping of electrons or<br />
holes induced by irradiation, as well as by additive<br />
or electrolytic coloring. In many cases several paramagnetic<br />
centers with different spin Hamiltonian<br />
parameters were reported for the same impuritycrystal<br />
host system. The differences are due to<br />
the various locations of the paramagnetic ion in the<br />
crystal lattice, as well as to the presence of neighboring<br />
defects such as vacancies, interstitials or impurity<br />
anions.
194 Bulletin of Magnetic Resonance<br />
Table 1: Paramagnetic ions with the ns 1 — 1 S1/2 electron configuration observed in crystals by EPR. The usual<br />
valency state of the impurity ion in the as grown ionic crystals is shown between brackets.<br />
Electron<br />
configuration<br />
(Ar)3d lo 4s 1<br />
(Kr^d^s 1 •<br />
(Xe)5d lo 6s 1<br />
Centers produced by<br />
electron trapping<br />
IB IIB<br />
Cu°(+l,+2) Zn+(+2)<br />
Ag°(+1) Cd+(+2)<br />
Au°(+1) Hg+(+2)<br />
The objective of the present article is to present<br />
a comprehensive picture of the EPR studies of such<br />
centers in inorganic crystals. The review is based on<br />
a literature survey of various reference sources carried<br />
out during several years when the authors were<br />
involved in the study of such centers. Although efforts<br />
have been made to include all relevant references<br />
until the end of 1992, it is still possible that<br />
omissions due to inadvertent oversight may occur.<br />
The paper is divided into four main parts. The<br />
first is a short survey of the production and structure<br />
of the ns 1 -centers, which is far from trivial,<br />
and is essential in understanding their structure and<br />
EPR spectral properties.<br />
The second part contains a short review of the<br />
theory of EPR spectra for systems with 5 = 1/2 and<br />
I > 1/2, including the case of a dominant hyperfine<br />
interaction, which is the appropriate one in many<br />
cases. Although the case has been discussed in a<br />
unified form [6], several approaches are to be found<br />
in the literature devoted to the ns 1 -centers. The<br />
present survey is mainly an attempt to put together<br />
the various approaches.<br />
The third and main part is a presentation of the<br />
EPR studies on ns^centers reported so far, the accent<br />
being not on chronology and priority aspects<br />
but on the general features connected with the formation<br />
and structure of the resulting centers under<br />
various conditions (temperature, optical treatments,<br />
etc.). The understanding of the structure<br />
and formation mechanism of the ns 1 -centers has<br />
markedly improved in the last decade as a result<br />
of the studies performed on the similar np 1 -centers,<br />
which are much more sensitive to the surrounding<br />
crystal fields.<br />
Centers produced by<br />
hole trapping<br />
IIIA IVA<br />
Ga 2+ (+l) Ge 3 +(+2)<br />
In 2+ (+l) Sn 3+ (+2)<br />
Tl 2+ (+l) Pb 3 +(+2)<br />
The paper also contains a set of tables in which<br />
the spin Hamiltonian parameters of the various ns 1 -<br />
centers in inorganic crystals reported until the end<br />
of 1992 are presented.<br />
II. Production and Structure of<br />
the ns^Centers<br />
The ns 1 -centers have been extensively studied<br />
in alkali halides (mainly chlorides), where a large<br />
body of data are available. The real understanding<br />
of their production started with the observation<br />
[7] that doping KC1 with certain impurities, such as<br />
Tl + , Ag + or Pb 2+ , strongly enhances both the rate<br />
of formation and the final concentration of the selftrapped<br />
hole centers (Vk centers) produced by irradiation<br />
with ionizing radiation at low (T < 100K)<br />
temperatures. It has been suggested that such impurity<br />
ions act as efficient electron-trapping centers<br />
(resulting in the trapped electron centers Tl°, Ag°<br />
or Pb + ), strongly reducing the recombination of the<br />
electrons and holes produced by irradiation. Many<br />
of the impurity ions act as efficient hole traps too.<br />
Consequently, by warming such a low temperature<br />
irradiated crystal to temperatures where the holes<br />
become mobile (T > 170K in KC1) it is possible to<br />
obtain high concentrations of the trapped-hole centers<br />
Tl 2+ , Ag 2+ or Pb 3+ . The various hole and electron<br />
trapping reactions have been extensively studied<br />
in KC1:T1+ and KCl:Ag + crystals [8, 9]. Further<br />
evidence concerning the structure of these centers<br />
has been obtained from the EPR studies of the<br />
isostructural np 1 -centers [8, 10, 11].<br />
The formation and structure of the ns 1 -centers<br />
is determined to a large extent by the vacancies,
Vol. 16, No. 3/4 195<br />
present in the host lattice before irradiation as<br />
charge compensating cation vacancies of the divalent<br />
IIB or IVA impurity cations, or produced by irradiation<br />
in the form of anion vacancies. Their presence<br />
in the neighborhood of the ns 1 paramagnetic<br />
ions results in the lowering of the symmetry of the<br />
local crystal field, which is, however, little reflected<br />
in the EPR spectra of the ns^centers, due to the<br />
s-like character of their wave function. The usual<br />
absence of a resolved superhyperfine (shf) structure<br />
for the vacancy-associated ns 1 -centers makes it an<br />
extremely difficult task to determine their structure.<br />
For this reason the structural models of the various<br />
ns 1 -centers are based, in many cases, on indirect<br />
evidence.<br />
The main bulk of data concerning the production<br />
and structure of the ns^centers refers to the<br />
alkali halides. As suggested from earlier EPR studies<br />
on transition metal ions in alkali halides [4, 5],<br />
the monovalent cation impurities are located substitutionally<br />
at cation sites of the cubic lattice. In<br />
the case of substitutional divalent cation impurities<br />
an equal number of charge compensating vacancies<br />
are present in the lattice host, usually located in<br />
the nearest- neighbor (NN) or next-nearest-neighbor<br />
(NNN) positions.<br />
The irradiation of alkali halides at low temperatures<br />
(T < 100K) with ionizing radiation, or even<br />
with UV-light close to the band gap value (5-10 eV),<br />
produces electrons, holes and excitons, the last being<br />
subsequently involved in the production of anion<br />
vacancies and interstitials [12, 13]. The electrons<br />
(e~), which are mobile, are trapped either by the<br />
anion vacancies (va) resulting in F centers, or by<br />
the monovalent or divalent cation impurities (M +<br />
or Me 2+ ). The holes (h + ) are self-trapped forming<br />
\4 centers. The reactions of interest here are:<br />
M+ + e~ -» M° (M = Cu, Ag, Au) (1)<br />
(X = C1, Br, (2)<br />
Me 2 c + vc + e' -f Me+vc (Me = Zn, Cd, Hg) (3)<br />
where the subscript indicates the occupation site<br />
of the ion/atom (c-cation site, a-anion site, iinterstitial),<br />
and vc represents the neighboring<br />
cation vacancy.<br />
Upon warming the irradiated crystal several processes<br />
take place. The Vk centers become mobile<br />
(above 170K in KC1), a large fraction of them being<br />
trapped at the impurity ions, resulting in trapped<br />
hole ns 1 -centers, according to the reactions:<br />
(M = Ga, In, Tl) (4)<br />
Mei + vc+Vk Me 3 c + vc+2X~ (Me = Ge, Sn, Pb)<br />
(5)<br />
At even higher temperatures, where vacancies become<br />
mobile, they can be either trapped at or released<br />
from the ns 1 -centers. In the case of the cation<br />
vacancies the following reactions can take place:<br />
Mr + v. T>Ta M 2 c + vc<br />
Me<br />
(M = Ga, In, Tl) (6)<br />
(Me = Zn, Cd, Hg) (7)<br />
(Me = Ge, Sn, Pb)<br />
(8)<br />
where Ta is the activation temperature for the movement<br />
of vacancies (Ta = 220K for both vc and va in<br />
KC1 or RbCl [10, 11, 14]).<br />
As initially suggested [15, 16] in the case of the<br />
atomic Ag°(5s 1 ) center in KC1, the atomic ns 1 -<br />
centers can trap anion vacancies forming the socalled<br />
A% centers:<br />
M°c<br />
M°cva{A°F) (M = Cu, Ag, Au) (9)<br />
Such centers are produced in even larger concentrations<br />
by optically bleaching at T > Ta, in the<br />
-F-band, the crystals previously irradiated at lower<br />
temperatures. The analogy with a similar process<br />
previously observed in alkali halide crystals doped<br />
with alkali impurities [17], by which FA centers, (i.e.<br />
F centers next to alkali impurities) were obtained,<br />
has been initially the main argument supporting the<br />
reaction (9). The direct demonstration of the validity<br />
of reaction (9) came later from the studies<br />
[10, 18] of the isostructural M°(l)-np 1 centers (M =<br />
Ga, In, Tl), which have shown that such centers can<br />
be also produced by the reactions:<br />
M+<br />
T>Ta<br />
M°cva = A% =<br />
(10)<br />
(11)<br />
Reaction (10) is also valid for M = Cd, resulting in<br />
the co-called A~p centers. By irradiation with ionizing<br />
radiation at temperatures where vacancies are<br />
mobile, besides the Ap centers, various other centers<br />
are produced. Of special interest are the negative<br />
ions. The existence of such ions, supposed to be
196 Bulletin of Magnetic Resonance<br />
located at anionic sites of the lattice, has been earlier<br />
proposed [19, 20] from optical studies on additively<br />
or electrolytically colored alkali halides doped<br />
with copper, silver or thallium. Their production<br />
by X-ray irradiation at RT is now supported by<br />
the EPR observation of the Sn" [11], Pb~ [21] and<br />
Bi° [22, 23] centers in KC1 crystals. The mechanism<br />
through which they are produced has been under<br />
debate since then [24]. By optical bleaching at<br />
300K in the negative ions optical absorption band<br />
(B-band), a new ns 1 -center called Ag^ has been observed<br />
[15, 16] in KCl:Ag + crystals. The proposed<br />
production mechanism of this center, suggested to<br />
be a Ag° atom at an anion site, consists of a simple<br />
ionization step:<br />
Ag" (12)<br />
Based on the positive identification by EPR spectroscopy<br />
of the Ag°, Ag^ and Ag° centers, the<br />
following sequence of reactions has been proposed<br />
[15, 16] to explain the production of negative ions:<br />
(A) Ag+ H<br />
(B) Ag°H<br />
(C) Ag^a<br />
(D) Ag-<br />
hv{Ag°F)<br />
—^Aga<br />
(13)<br />
where (A) and (B) correspond to reactions (1) and<br />
(9), respectively. Reactions (B) and (C) take place<br />
by optical excitation in the F and Kg°F absorption<br />
bands, respectively. Reactions (B) and (D)<br />
are thermally activated. Reaction (C) has been<br />
found to take place even at low temperatures, suggesting<br />
a tunneling process. The above set of reactions<br />
exclude the interstitialization of the silver<br />
atom [25, 26, 27]. Its general character remains to<br />
be confirmed from the study of other ions and lattice<br />
hosts. Although no Cu^ centers have been observed<br />
yet, the reactions (13) are considered to determine<br />
the formation of the Cu~ negative ions too<br />
[28]. Supporting evidence for the general character<br />
of reactions (13) comes from the identification of the<br />
M°, M°F and M° centers (M = Ga, In, Tl) in KC1<br />
and NaCl crystals after X-ray irradiation at room<br />
temperature [18, 29].<br />
us -centers have been also observed in mixed alkali<br />
halides. Such centers exhibit a characteristic<br />
shf pattern due to the presence in the first neighborhood<br />
of the second type of anion.<br />
The production properties and structure of the<br />
ns 1 -centers in other lattice hosts are less known.<br />
Such centers were observed after irradiation with<br />
ionizing radiation, but very little effort has been<br />
devoted towards the study of their production and<br />
structural properties. It is, however, expected that<br />
in other ionic crystals the accompanying lattice defects<br />
would behave in a similar way as in alkali chlorides.<br />
In certain oxides and semiconductors, the<br />
ns 1 -type of paramagnetic centers have been already<br />
observed in the as grown crystals. In the latter case<br />
the concentration of the ns 1 -centers could be drastically<br />
changed by illumination in the band gap as a<br />
result of trapping the resulting free electrons/holes.<br />
III. Theory of the EPR Spectra<br />
A. The spin Hamiltonian of the ns 1 -<br />
centers<br />
The EPR spectra of the ns 1 ( 1 5) paramagnetic<br />
centers can be described by the general spin Hamiltonian<br />
H = g-S + S-A-I- gNfiNH • I<br />
(14)<br />
with the usual notations [1, 2], Here 5 = 1/2 and /<br />
may have one or more values, corresponding to the<br />
nuclear isotopes of the ns 2 -impurity involved (Table<br />
2). I n is the nuclear spin of the neighboring ligands.<br />
The spin Hamiltonian (14) contains terms describing<br />
the electronic Zeeman, hyperfine (hf), nuclear<br />
Zeeman, nuclear quadrupole (7 >l/2) and superhyperfine<br />
(shf) interactions, respectively.<br />
Due to the strong s—character of the electron<br />
wave function it is considered that the main contribution<br />
to the hf parameter A comes from the<br />
isotropic Fermi contact term<br />
—<br />
(15)<br />
where | 4>ns{ty | 2 represents the ns-wave function<br />
density at the central nucleus. A contribution to the<br />
isotropic hf parameter through the exchange polarization<br />
mechanism of the ns-electron with the inner<br />
electronic shells is expected to occur [2]. However,
Vol. 16, No. 3/4 197<br />
Table 2: Characteristic parameters of the naturally abundant nuclear isotopes with spin / ^ 0 occuring in<br />
the ns^centers.<br />
Nucleus<br />
63 Cu<br />
65 Cu<br />
67 Zn<br />
69 Ga<br />
71 Ga<br />
73 Ge<br />
107 Ag<br />
109 A g<br />
m Cd<br />
U3 Cd<br />
113In<br />
115In<br />
115 Sn<br />
117 Sn<br />
119 Sn<br />
197 Au<br />
199 Hg<br />
201 Hg<br />
205^<br />
207pb<br />
Abund.(%) a<br />
69.09<br />
30.91<br />
4.11<br />
60.40<br />
39.60<br />
7.76<br />
51.82<br />
48.18<br />
12.75<br />
12.26<br />
4.28<br />
95.72<br />
0.35<br />
7.61<br />
8.58<br />
100<br />
16.84<br />
13.22<br />
29.50<br />
70.50<br />
22.6<br />
I(h)<br />
3/2<br />
3/2<br />
5/2<br />
3/2<br />
3/2<br />
9/2<br />
1/2<br />
1/2<br />
1/2<br />
1/2<br />
9/2<br />
9/2<br />
1/2<br />
1/2<br />
1/2<br />
3/2<br />
1/2<br />
3/2<br />
1/2<br />
1/2<br />
1/2<br />
9Nl*N 1 MHz\a<br />
h \ kG ><br />
1.1285<br />
1.2090<br />
0.2664<br />
1.0219<br />
1.2984<br />
-0.1485<br />
-0.1723<br />
-0.1981<br />
-0.9028<br />
-0.9444<br />
0.9310<br />
0.9329<br />
-1.392<br />
-1.517<br />
-1.587<br />
0.0731<br />
0.760<br />
-0.280<br />
2.433<br />
2.457<br />
0.8899<br />
* 2 (0)(au- 3 ) 6<br />
4.617<br />
4.617<br />
6.739<br />
10.18<br />
10.18<br />
13.40<br />
7.170<br />
7.170<br />
10.03<br />
10.03<br />
14.06<br />
14.06<br />
17.64<br />
17.64<br />
17.64<br />
12.86<br />
17.37<br />
17.37<br />
22.97<br />
22.97<br />
27.96<br />
^(MHz) 6<br />
5,995<br />
6,423 d<br />
2,087 e<br />
12,210<br />
15,514 d<br />
-2,363<br />
-1,593 d<br />
-1,831<br />
-13,650<br />
-14,279 d<br />
20,139 d<br />
20,180<br />
-38,523 d<br />
-41,938 d<br />
-43,920<br />
2,876<br />
41,880<br />
-15,429 d<br />
182,005 d<br />
183,800<br />
81,510<br />
A) xp (ymz)<br />
5,866.91 C<br />
-1,976.94/<br />
-14,3853<br />
-15,385 9<br />
3,053.5^<br />
40,507^<br />
-14,995*<br />
175,90(P<br />
77,900 fc<br />
a<br />
Based on data published in Handb. of Chem. and Phys., 55th ed., CRC Press, Cleveland, 1974 and by<br />
Varian Assoc, Palo Alto, 1972.<br />
6<br />
Reference [30].<br />
c<br />
Reference [31].<br />
d<br />
Calculated by multiplying the value for the other isotope with the ratio of the corresponding nuclear mo-<br />
ments.<br />
e Reference [32].<br />
/ Reference [33].<br />
9 Reference [34].<br />
h Reference [35].<br />
{ Reference [36].<br />
j Reference [37].<br />
k Reference [38].<br />
in the analysis of the hf parameter of the ns 1 centers<br />
this contribution is not explicitely considered, being<br />
either neglected or formally included in the contact<br />
term.<br />
Theoretical evaluations, as well as experimental<br />
data obtained from magnetic resonance measurements<br />
on ion beams or ions (atoms) trapped in inert<br />
gas matrices show (Table 2) that several I ^ 0<br />
isotopes exhibit large hf splittings (A 3> g/j,BH), at<br />
least in the microwave X-band (9 GHz) in which the
198 Bulletin of Magnetic Resonance<br />
EPR measurements are usually performed. For this<br />
reason, in many cases, the spin Hamiltonian parameters<br />
are now determined by fitting the experimental<br />
magnetic field values of the EPR transitions with<br />
the corresponding values obtained from a numerical<br />
diagonalization of the spin Hamiltonian (14).<br />
In several particular cases accurate values of the<br />
spin Hamiltonian parameters have been obtained<br />
by fitting the transition fields with analytical solutions<br />
corresponding to the diagonalization of the<br />
spin Hamiltonian (14) in various approximations. In<br />
all cases the energy levels are mainly determined by<br />
the first two terms, which are the largest.<br />
The nuclear quadrupole interaction term has<br />
been considered only in a very few cases. It vanishes<br />
for / < 1/2. In other cases it is either too<br />
small, or it is difficult to determine, being a second<br />
order phenomena.<br />
The superhyperfine (shf) interaction with the<br />
nuclei of the neighboring ligands has been taken<br />
into consideration only in those cases when the corresponding<br />
structure in the EPR spectrum is resolved.<br />
Its theoretical treatment will be discussed<br />
separately.<br />
In the high symmetry crystal-lattice hosts, such<br />
as alkali halides, the EPR spectra, of the n5 1 -centers<br />
are isotropic, or there is a small anisotropy (~ 1%)<br />
in g and A, which is neglected. The EPR spectra<br />
are then described by the simple spin Hamiltonian<br />
H = -S + AS-I- I (16)<br />
The eigenvalues of (16) are given by the Breit-Rabi<br />
formula<br />
E(F,mF) = —— -<br />
±- AW 1 +<br />
Am p<br />
21 + 1<br />
1/2<br />
(17)<br />
where F — S + I,mF = m ± ^,x =<br />
gfiB)H/AW = gTfiBH/AW, AW = (A/2)(2I + 1).<br />
In the zero magnetic field there are only two levels<br />
with energies (A/2)I and -(A/2)(I + 1), separated<br />
by AW. Two types of transitions are observed,<br />
corresponding to the selection rules in the<br />
extreme cases:<br />
> A: AF = ±1, AmF = ±1<br />
(AM = ±l,Am = 0)<br />
< A: AF = 0, AmF = ±1<br />
(18)<br />
(19)<br />
In the strong magnetic field approximation [formula<br />
(18)] the intensity of the transitions are ~<br />
jg 2 HBH 2 , where Hi is the microwave magnetic field<br />
component. For such transitions the spin Hamiltonian<br />
parameters can be determined with the aid of<br />
the following general formulae:<br />
21+1<br />
-A(2mgTfiBH) - (hu +<br />
-(gTiiBH) 2 = 0<br />
9T \ A )<br />
V A<br />
hv +<br />
V<br />
(20)<br />
where v is the microwave frequency of the ESR transitions.<br />
In the g^BH S> A case, a perturbation solution<br />
of the spin Hamiltonian (16) in the third order<br />
of approximation gives the following formula for the<br />
magnetic field at resonance [40]:<br />
hv A I 1 A A<br />
gfj,B<br />
I A A 2<br />
Ag/j,B(hv)<br />
-m 2 gp,B hv<br />
\<br />
H 7<br />
A<br />
A A<br />
g\xB<br />
(21)<br />
In the case of a weak magnetic field the spin<br />
Hamiltonian parameters can be determined from the<br />
following formula:<br />
A 2<br />
1 / r, ,, U \ 2<br />
— | I<br />
+(hv ± gNiiNH) 2 + = 0 (22)<br />
For some of the ns 1 -centers, such as Pb 3+ or Tl 2+ ,<br />
two transitions corresponding to the selection rules<br />
(19) are observed at the magnetic fields H\ and H2.<br />
The spin Hamiltonian parameters are then obtained<br />
in a good approximation with the simple formulae:<br />
2hv(hv + A) 2hv(hv - A)<br />
9 = (2hu (2hv -<br />
(23)
Vol. 16, No. 3/4 199<br />
A =<br />
(24)<br />
Additional transitions, corresponding to the selection<br />
rules AM +_ 2, Am = 0, ±1, normally forbidden<br />
in the high field limit, can be observed in intermediate<br />
cases with intensities lower by a factor of<br />
(A/g^sH) 2 compared to the normally allowed ones.<br />
In many crystal lattices with lower symmetry the<br />
EPR spectrum of the ns x -centers exhibits a clear<br />
anisotropy, which was attributed [41] to the presence<br />
of an odd crystal field component which mixes the<br />
excited 2 P state into the ground 2 S state.<br />
The exact solutions of the anisotropic spin<br />
Hamiltonian (14), from which the last two terms<br />
were neglected, have been reported earlier [42, 43,<br />
44] for the case of the magnetic field along one of<br />
the principal axes, when 5 = 7 = 1/2. In the case<br />
of H || z they are:<br />
= ^ ± \<br />
\{AX -<br />
(25)<br />
\(AX + Ay)2<br />
(26)<br />
The solutions for H \\ x and H \\ y are obtained<br />
by cyclic permutations of gi and Ax. Similar expressions<br />
have been reported for the 5 = 1/2, I = 5/2<br />
system [45, 32].<br />
Approximate solutions to the secular equation,<br />
for moderately anisotropic spectra were obtained<br />
[46] by considering the anisotropy as a perturbation<br />
added to (16). The starting point is the expression<br />
of the magnetic field transition for the isotropic case<br />
written as,<br />
where<br />
/ _<br />
/\2<br />
and<br />
Hm = H'm (for gNfiN = 0)<br />
Formula (27) is valid for all positive solutions and,<br />
in particular, for all values of<br />
/u/» (A/2) (21+1).<br />
The corrections to the EPR transitions, at fixed<br />
m, in the first order of perturbation associated with<br />
the anisotropy in the spin Hamiltonian are given by<br />
where<br />
coszm+i]<br />
m+-J coszm+± (28)<br />
1/2<br />
1/2<br />
sin 2.<br />
(29)<br />
and<br />
m<br />
Pm =<br />
(30)<br />
1 + 1/2<br />
In a different approach [47] the spin Hamiltonian<br />
(14) has been expressed in a reference frame associated<br />
to the magnetic field. Afterwards, only the<br />
following part of the rotated Hamiltonian has been<br />
diagonalized:<br />
ASZIZ<br />
1 (AzAxy + AxAy<br />
Axy<br />
(S+I- + S-I+) + [{QX COS 2 ip + Qy sin 2<br />
sin 2 6 + Qz cos 2 6] II - gNpNHIz<br />
(31)<br />
Here g and A have the usual [1] angular dependence<br />
of the polar angles 0 and ip of the magnetic field, in<br />
the frame associated to the principal axes of the g, A<br />
and Q tensors, considered coaxial. Assuming small<br />
anisotropies, the rest of the terms were neglected.<br />
Analytical expressions for the energy levels, wave<br />
functions and transition probabilities were obtained<br />
for I > 1/2, S = 1/2.<br />
Solutions for the first two terms of the spin<br />
Hamiltonian (14) with rhombic symmetry, for S =
200 Bulletin of Magnetic Resonance<br />
I = 1/2, have been obtained [48] by rewriting it in<br />
a coordinate system associated with the magnetic<br />
field (H || C):<br />
Ho<br />
Hi<br />
H2<br />
H3<br />
— Ho + Hi + H2 + H3<br />
= gPHSt + KStl?<br />
= KiS+I?+KtS-I?<br />
— A20+J4- + A2O-i-<br />
— 1\3J + 1— + JX-iO — l^-<br />
(32)<br />
(33)<br />
(34)<br />
(35)<br />
(36)<br />
where K{ are polynomial expressions of g,, A, and<br />
orientation angles of H. The relative contribution<br />
of Hj's to 7is differs from center to center, but Hi<br />
is considered to be the smallest, at least for centers<br />
with large hf coupling.<br />
B. The superhyperflne interaction<br />
The interaction of the s-electron with the magnetic<br />
momenta of the neighboring ligands is considered<br />
as a perturbation, producing the shf splitting<br />
of the EPR lines. However, for the majority of the<br />
ns -centers its contribution consists only in an inhomogeneous<br />
broadening of the EPR lines. Neglecting<br />
the shf interaction in determining the spin Hamiltonian<br />
parameters might result in significant errors if<br />
a low field transition with energy comparable to the<br />
shf splitting is considered.<br />
Due to the usually isotropic character of the ns 1 -<br />
type EPR spectra the shf structure represents the<br />
main source of information concerning the structure<br />
of the involved center.<br />
The number and the intensity of the various components<br />
of the shf structure are obtained by the binomial<br />
rules [2, 40]. The shift of each component<br />
from the center of the EPR line is given by<br />
[{A\f cos 2 6 + {A\) 2 sin 2 d\^ (37)<br />
where 9 is the angle between the direction of the<br />
magnetic field and the bond direction, and mn represents<br />
the nuclear magnetic moment of the n-th ligand.<br />
Formula (37) can be rewritten by introducing<br />
the isotropic (AJ) and anisotropic (A") components<br />
of the shf tensor A n ;<br />
= A n s<br />
(38)<br />
The isotropic part (As) is considered to be mainly<br />
due to a Fermi-type interaction of the s-electron<br />
with the ligand nucleus. The anisotropic part (Aa)<br />
is a sum of two contributions: the anisotropic interaction<br />
of the p-orbitals (Ap) and the dipole-dipole<br />
magnetic interaction {Ap) between the paramagnetic<br />
electron and the ligand nucleus:<br />
A — A AD (39)<br />
The quantitative analysis of the shf parameters<br />
is usually performed [2, 49] by admixing the n's and<br />
n'p orbitals from the neighboring ligands into the<br />
central ns orbital. By considering covalency effects<br />
it is possible to explain the large positive Ag shift<br />
and the decrease of the hf constant A, compared to<br />
the free ion value Af. The same molecular orbital<br />
(MO) model in a covalency calculation offers a consistent<br />
interpretation of the optical absorption spectra<br />
of the ns 2 - and ns ^centers in crystals [50, 51].<br />
According to the MO model, initially applied<br />
to octahedral [52] coordination (MX6 clusters) and<br />
tetrahedral [53] coordination (MX4 clusters) of ligands,<br />
the wave function of the paramagnetic electron<br />
is written as:<br />
where<br />
(40)<br />
(41)<br />
^s is the ns orbital of the central ion. Xs and X<br />
the linear combinations of atomic orbitals (LCAO)<br />
of the neighboring ligands with the same symmetry<br />
properties i.e., the a\g and a\ representations of the<br />
Oh and Td symmetry groups, respectively [49, 54].<br />
Neglecting the overlap of the atomic orbitals, the<br />
hf constant is given in both cases by:<br />
A = N 2 Af<br />
where Aj is the free nsMon (atom) hf constant.<br />
The shf constants are given by:<br />
A, = HNX.fA",<br />
AD =<br />
(42)<br />
(43)<br />
where / is 1/6 and 1/4 for the MX6 and MX4 clusters,<br />
respectively. A® and A® represent the free ligand<br />
ion hyperfme parameters,<br />
2<br />
~-3\<br />
5* /n'p<br />
(44)
Vol. 16, No. 3/4 201<br />
The Ag shift is given by the following formula,<br />
valid for both coordinations [53]:<br />
= ~N 2 [\l + XaXsmR{3px \x\3s)<br />
xAE(p- s)Ti~ lAE<br />
(45)<br />
where m is the electronic mass, R is the distance<br />
to the ligand, AE(p — s) is the energy separation<br />
between the n'p and n's orbitals, ((r) is the spinorbit<br />
interaction constant of the n'p electron and<br />
AE is the energy separation between the ground<br />
antibonding a\g orbital and the nonbonding t\g orbital,<br />
which can be determined from optical spectra.<br />
Formula (45) explains the large Ag shift observed<br />
for the ns 1 -centers in crystals with strong covalent<br />
bonding and offers the possibility of connecting the<br />
EPR and optical spectra.<br />
The relevant free-atom values in the above formulae<br />
were calculated [30] for elements from thallium<br />
to bismuth, using Hartree-Fock-Slater atomic<br />
orbitals [55]. Formula (42) shows a decrease of the<br />
hf-constant with an increase of the covalency. The<br />
consistency of the MO model has been checked for<br />
various ns 1 -centers by fitting the covalency parameters<br />
As and \a to the measured shf constants and<br />
afterwards calculating the hf constant A, according<br />
to formulae (44). The calculation usually results in<br />
a smaller hf-constant. Better results were obtained<br />
by considering [56] the overlap of the orbitals. The<br />
theory of Watanabe has been further refined [57],<br />
by choosing the wave functions which diagonalize<br />
the spin-orbit interaction as the basis wave functions.<br />
Such an approach takes a better account of<br />
the larger spin-orbit interaction in the progression<br />
of ligands from S, Se to Te.<br />
IV. EPR Results<br />
A. Trapped electron ns^centers<br />
Trapped electron ns -centers are easily produced<br />
by irradiating with ionizing radiation crystals doped<br />
with IB or IIB cation impurities, as well as by subsequent<br />
optical bleaching and/or pulse anneal at various<br />
temperatures. The corresponding trapped electron<br />
ns 1 -centers have been mainly observed in alkali<br />
halide crystals.<br />
1. The IB-group (Cu°, Ag°, Au°)<br />
With very few exceptions, the ns^centers associated<br />
with the IB-group impurity cations have been<br />
reported in copper and silver doped alkali halides.<br />
Gold centers were less studied, mostly due to the<br />
difficulties in doping (Tables 3-5). It is worthwhile<br />
mentioning that the IB-group cations, with<br />
d 10 outer electron configuration, can also trap holes<br />
resulting in paramagnetic d? transition ions.<br />
The alkali halide crystals employed in these studies<br />
were grown from melt, with about 0.1 to 0.2<br />
mol% of the impurity halide added. Both copper<br />
and silver halides being stable at high temperatures,<br />
large amounts of the corresponding Cu + or Ag + impurity<br />
ions are found in the crystals grown from melt<br />
(about 10% of the initial concentration). Due to<br />
the thermal instability of the gold halides, the doping<br />
with gold was done by adding the metal to the<br />
melt, under a chlorine atmosphere.<br />
The trapping of electrons by the Ag + and Cu +<br />
ions in alkali halides has been earlier suggested<br />
[25, 58] to explain the new optical absorption bands<br />
observed after X-ray irradiation.<br />
The first EPR spectrum of a ns 1 —center(Ag°)<br />
has been observed [9] in a KCl:Ag crystal after<br />
electron-irradiation at 77K. It consisted of two transitions<br />
attributed to the superposition of the hf components<br />
from the two silver isotopes with 7=1/2<br />
(Table 2). The interpretation of the well resolved<br />
shf structure confirmed the substitutional localization<br />
in a regular six-fold octahedral coordination,<br />
which suggests that the center is produced according<br />
to the reaction (1). The substitutional model of<br />
the Ag° centers in KC1 and NaCl, has been latter<br />
confirmed by ENDOR measurements [71, 72].<br />
Cu° centers in alkali chlorides [31, 61] and Au°<br />
centers [59] in NaCl and KC1, have been also observed<br />
after X-ray irradiation at 77K. Their EPR<br />
spectra exhibit a more or less resolved shf structure<br />
and were interpreted with the spin Hamiltonian (16)<br />
to which the shf interaction was added.<br />
Due to the presence of two isotopes with I =<br />
3/2 (Table 2), the X-band EPR spectra of the Cu°<br />
centers consist of a pair of lines for each isotope,<br />
attributed to the (F = l,mF = -1) (F =<br />
2,mF = -2) and {F = 2,mF = -2) (F =<br />
2, mp = — 1) transitions (A > g(5H approximation).<br />
Gold has only one natural isotope with nuclear<br />
spin / = 3/2 and hf splitting A ~ g(5H (Table 2).
202 Bulletin of Magnetic Resonance<br />
Table 3: The EPR parameters of the Cu°—type centers at 77K. The hf parameter A and the shf parameters<br />
As and Ap for the NN anion ligands are given in MHz.<br />
Center<br />
Cu^ in LiCl<br />
Cu° in NaCl<br />
Cu° in KCl<br />
Cu° in KCl<br />
Cu° in RbCl<br />
Cu£ in NaCl<br />
Cu°, in KCl<br />
Cu°(I") in KCl<br />
Cu°(I) in quartz a<br />
Cu°(II) in quartz"<br />
Cu°(III) in quartz a<br />
g<br />
1.999<br />
1.997<br />
2.000<br />
1.9992<br />
2.004<br />
1.995<br />
1.998<br />
5x=2.004<br />
5y=1.998<br />
5z=2.004<br />
p2=2.004<br />
52=2.006<br />
5,876<br />
5,566<br />
4,844<br />
4,858.1<br />
4,405<br />
2,380<br />
2,578<br />
4,800<br />
Ax=3,191<br />
^=3,186<br />
Az=3,130<br />
A2=3,029<br />
A2=3,464<br />
a Measured at 120K. Shf interaction with one 29 Si ligand.<br />
Three EPR transitions were observed [59] in the Xband.<br />
It has been mentioned [59] that before X-ray irradiation<br />
the alkali chlorides doped with copper or<br />
gold had to be annealed at high temperatures and<br />
quenched to 77K. This observation suggests that a<br />
certain amount of the two impurities enters the lattice<br />
in a higher valency state (+2, +3), resulting in<br />
impurity-cation vacancy aggregates which have to<br />
be thermally dispersed.<br />
From the analysis of the isotropic shf constant As<br />
of the Cu° and Ag° centers in alkali chlorides and<br />
in KBr, it has been found [66] a significant outward<br />
relaxation (between 14% and 27%) of the nearest ligands.<br />
This effect has been explained as an accommodation<br />
effect of the larger Cu° and Ag° atoms,<br />
compared to the host lattice cations.<br />
A strong temperature dependence of both hf constant<br />
A and isotropic shf constant As, has been observed<br />
at low temperatures, for the Ag° and Cu°<br />
centers in LiCl, NaCl and KCl [67], and for the Cu°<br />
centers in RbCl [61]. With the exception of the Cu°<br />
in KCl and RbCl, for all other centers both parameters<br />
decrease by increasing the temperature. No<br />
As<br />
75<br />
67<br />
31<br />
36<br />
28<br />
28<br />
503<br />
Ap<br />
5.6<br />
5.6<br />
2.8<br />
A,(r)=560<br />
28.3<br />
References<br />
[31]<br />
[31]<br />
[31]<br />
[60]<br />
[61]<br />
[62]<br />
[63]<br />
[64]<br />
[65]<br />
[65]<br />
[65]<br />
quantitative interpretation of the above results has<br />
been given yet.<br />
The quantitative evaluation [70] of the isotropic<br />
shf constant As for the Cu° and Ag° centers and<br />
of the hf constant A for the Ag° center in alkali<br />
chlorides, in the frame of the Adrian theory [68],<br />
resulted in a good fitting with the experimental data<br />
only for the Ag° centers in KCl and RbCl.<br />
An unusual behavior of the shf structure of the<br />
Cu° center in KCl at very low temperatures (T <<br />
20K) has been reported [60]. By lowering the temperature,<br />
the observed shf structure, characteristic<br />
for an interaction with six equivalent chlorine nuclei,<br />
becomes unresolved at T < 40K. Below 20K<br />
the shf structure is again resolved, but its interpretation<br />
shows that the Cu° atom is now displaced to<br />
an off-center position, along a (111) direction. A<br />
theoretical analysis of the shf parameters temperature<br />
dependence shows [69] that in the 30-40K range<br />
the interaction constant of the Cu° atom increases<br />
2.8 times for the nearest ligand lying in the direction<br />
of the off-center displacement and decreases for the<br />
other NN ligands.<br />
It has been suggested [61] that the similar tem-
Vol. 16, No. 3/4 203<br />
Table 4: The EPR parameters of the Ag°—type of centers at 77K. The hf parameter A and the shf parameters<br />
As and Ap for the NN anion ligands are given in MHz.<br />
Center<br />
Ag" in LiCl<br />
Ag° in NaCl<br />
Ag° in NaCl a<br />
Ag° in KCl<br />
Ag° in KCl a<br />
Ag° in RbCl<br />
Ag° in KBr<br />
Ag° in KI<br />
Ag£, in LiCl<br />
Ag^ in NaCl<br />
Ag£ in KCl<br />
Ag£ in RbCl<br />
Ag°(I") in KCl<br />
Ag^(Br-) in KCl<br />
Ag° in SrCl2<br />
Ag° in KCl<br />
Ag° in L1KSO4<br />
Ag° in (NH4)2SO4 b<br />
Ag° in K2SO4 c<br />
Ag° in K2SO4 d<br />
Ag°(I) in quartz e<br />
Ag°(II) in quartz 6<br />
Ag°(III) in quartz 6<br />
g<br />
2.001<br />
1.999<br />
1.9951<br />
2.000<br />
1.9963<br />
2.001<br />
1.987<br />
1.966<br />
1.996<br />
1.996<br />
1.998<br />
1.994<br />
1.989<br />
1.996<br />
1.9934<br />
1.997<br />
2.0012<br />
2.002<br />
2.001<br />
#x=2.0002<br />
3y=1.9935<br />
fir2=2.0000<br />
52=1.9955<br />
02=1.9957<br />
\ im A\<br />
1,927<br />
1,870-<br />
1,883<br />
1,890<br />
1,889<br />
1,878<br />
1,870<br />
1,855<br />
1,395<br />
1,835<br />
1,305<br />
1,285<br />
1,838<br />
1,323<br />
1,444<br />
2,025<br />
1,966<br />
2,133<br />
2,136<br />
^=1,300<br />
Ay=1,304<br />
A2=l,251<br />
^2=1,316<br />
4*=1,386<br />
ENDOR measurements.<br />
Measured at 290K.<br />
X-ray irradiated at 77K.<br />
X-ray irradiated at 300K.<br />
Measured at 120K. Shf interaction with one 29 Si ligand.<br />
perature dependence of the hf constant A observed<br />
for the Cu° center in KCl and RbCl must be due to<br />
the same off-center displacement of the Cu° atom.<br />
Another type of ns 1 -centers, called PSp centers,<br />
have been observed [75, 15] in silver doped alkali<br />
chlorides after X-ray irradiation at RT followed by<br />
optical bleaching in the F-band. Such centers have<br />
been latter obtained [63, 62] in copper doped NaCl<br />
and KCl, directly by X-ray irradiation at RT. Their<br />
As<br />
79.2<br />
68.3<br />
68.99<br />
37.2<br />
37.8<br />
29.4<br />
219<br />
269<br />
29.8<br />
35.7<br />
53.9<br />
351.7<br />
Ap<br />
2.8<br />
5.6<br />
4.0<br />
2.8<br />
3.89<br />
20<br />
>ls(I-)=404<br />
As(Br")=267<br />
6.1<br />
17.7<br />
References<br />
[70]<br />
[70]<br />
[71, 72]<br />
[70, 9]<br />
[71]<br />
[70]<br />
[73]<br />
[73]<br />
[74]<br />
[74]<br />
[74, 75, 15]<br />
[74]<br />
[76]<br />
[77]<br />
[78]<br />
[79, 75, 15]<br />
[78]<br />
[80]<br />
[81]<br />
[81]<br />
[65]<br />
[65]<br />
[65]<br />
concentration could be further increased by bleaching<br />
in the F-band. k°F centers have been directly<br />
observed [74] in silver doped thin films of alkali chlorides.<br />
A°F centers have not yet been reported in gold<br />
doped crystals. The corresponding spin Hamiltonian<br />
parameters are given in Tables 3 and 4. No shf<br />
structure has been observed in the EPR spectra of<br />
the A 1 ^ centers.<br />
It has been suggested [75] that the A°p center
204 Bulletin of Magnetic Resonance<br />
Table 5: The EPR parameters of the Au°—type centers at 77K. The hf parameter A and the shf parameters<br />
As and Ap for the NN anion ligands are given in MHz.<br />
Center<br />
Au^ in NaCl<br />
Au° in KC1<br />
Au£ in NaCl<br />
AuS in KC1<br />
Au£ in RbCl<br />
Au°, in NaCl<br />
Au°, in KC1<br />
Au°, in RbCl<br />
g<br />
2.001<br />
2.004<br />
2.00<br />
2.020<br />
2.024<br />
2.012<br />
2.010<br />
2.020<br />
consists of a ns 1 -atom (A = Cu°, Ag°) next to an<br />
anion vacancy. Because the unpaired electron is expected<br />
to be partly localized at the anion vacancy,<br />
it is possible to consider the A°F center as being an<br />
F-center next to the cation impurity.<br />
In the absence of a clear anisotropy of the EPR<br />
spectra, or of a resolved shf structure, the structural<br />
model of the AF centers had to be supported by<br />
indirect arguments. The proposed structural model<br />
has been initially based on the similar production of<br />
the A^ centers with the F^ centers [17].<br />
Additional arguments favoring the A°F center<br />
model, were based on the analysis of the hf constant<br />
shift 8A and of the linewidth of the various<br />
ns x -centers [75].<br />
According to formulae (15) and (42) the quantity<br />
A -Aj<br />
A~ = 8A •f (46)<br />
which is the relative shift of the hf constant A to the<br />
free atom/ion hf constant Af, represents the degree<br />
of the delocalization of the paramagnetic electron<br />
at the neighboring ligands. Due to the F-character<br />
of the unpaired electron wave function at the anion<br />
vacancy site, the A°F structural model with a<br />
neighboring anion vacancy involves a large 8A shift.<br />
By examining the hf constant of the corresponding<br />
M° and A°F center (Tables 3,4), it was found<br />
that in each particular case 8A(A°F) > 6A(M®).<br />
For example, in the case of the Ag° centers in KC1<br />
8A{A%) = 34% > 6A(Ag°) = 4.4%. This type of<br />
| i97 A|<br />
2,840<br />
2,530<br />
2,350<br />
2,170<br />
1,980<br />
2,780<br />
2,410<br />
2,160<br />
As<br />
46.2<br />
36<br />
Ap<br />
56<br />
References<br />
[59]<br />
[59]<br />
[59]<br />
[59]<br />
[59]<br />
[59]<br />
[59]<br />
[59]<br />
argument has been latter employed to identify new<br />
A°F centers.<br />
Considering the linewidth of the ns 1 -centers as<br />
being mainly determined by the isotropic shf constant<br />
As, in the case of the AF centers one has to<br />
consider the shf interaction with five anions next<br />
to the ns 1 atom and the shf interaction with five<br />
cations next to the anion vacancy. It is then expected<br />
that crystals grown with various isotopic<br />
pure cations will exhibit different linewidths of the<br />
A°F centers. Using single crystals of alkali chlorides<br />
grown from the isotopic pure cations 39 K, 41 K,<br />
85 Rb and 87 Rb, a variation in the linewidth of the<br />
Ag^ centers from 4.5 mT in 39 KC1 to 16 mT in<br />
87 RbCl was determined [82], which could be accounted<br />
for by the anion vacancy model. New<br />
ns^centers, called Cu°(X~~) and Ag°(X~), where<br />
X~ =I~ and Br~, have been observed [64, 77, 83]<br />
in mixed crystals of KCl(KI) and KCl(KBr). The<br />
structural model, inferred from the analysis of the<br />
shf structure is based on a M° model (M = Cu, Ag)<br />
with one of the six neighboring ligands replaced by<br />
an impurity anion. The larger isotropic shf constant<br />
As (X~) due to the shf interaction with the NN impurity<br />
anion, compared to the shf constant with the<br />
NN host anions, suggests a local deformation of the<br />
crystal lattice.<br />
The trapping of an anion vacancy next to a<br />
cationic substitutional neutral impurity atom is now<br />
supported by the direct observation [10, 18] of such<br />
a process in the EPR spectra of the anisotropic
Vol. 16, No. 3/4 205<br />
np 1 -M°(l) centers (M=Ga,In,Tl). An analysis of<br />
the production properties of the A°F centers [15, 75]<br />
shows that reactions (9) and (11) are involved in the<br />
formation of both M°(l) and A^ centers.<br />
Alkali chloride crystals doped with gold exhibit<br />
after X-ray irradiation at 77K, besides the cubic Au°<br />
centers, a second type of ns^centers, called Au° centers<br />
[59]. The Au° centers are converted to new Au°<br />
centers by annealing above 140K. The Au° centers<br />
exhibit the largest 6A shift and an isotropic splitting<br />
of the EPR lines in 7 equidistant components, with a<br />
maximum along a (100) direction. They are considered<br />
[59] to consist of an Au° atom at a cationic site,<br />
with a Vfc center in the NN anion site, along a (100)<br />
direction. The Au°, centers, with a 6A shift slightly<br />
larger compared to the Au° centers and with similar<br />
linewidths, are considered [59] to be Au° centers<br />
with a perturbing defect in a NNN position.<br />
The X-ray irradiation at RT of the silver doped<br />
alkali chlorides results in the formation of Ag°, Ag 2+<br />
and F-centers, with their characteristic EPR spectra,<br />
as well as of negative Ag~ ions, supposed to<br />
be localized at anion sites and identified by their<br />
optical absorption B-band [19, 20].<br />
The Ag° center, observed [15, 75] after optical<br />
bleaching at 300K, in the B-band of the KCl-Ag<br />
crystals, is considered to be a silver atom at an unperturbed<br />
anion site, produced according to reaction<br />
(12). In the absence of a resolved shf structure<br />
the anion localization of the silver atom is suggested<br />
by the smaller linewidth; 2.1 mT for the Ag° centers<br />
in KC1, compared to 4.1 mT for the Ag^ centers,<br />
both at 300K. Because they are produced at temperatures<br />
where the vacancies are mobile, the presence<br />
of vacancies in the neighborhood of the Ag~ or Ag°<br />
centers cannot be however completely excluded.<br />
The observed linewidth and hf constant increase<br />
with temperature of the Ag^ centers, for T < 100K,<br />
has been explained [79] by an off-center displacement<br />
in a (111) direction, by analogy with the Cu°<br />
centers in RbCL<br />
The production of a dimer-type of trapped electron<br />
center has been reported [84] in KCl:Ag crystals,<br />
after long X-ray irradiation at RT. The resulting<br />
Agj" center exhibits an isotropic EPR spectrum<br />
with ^=1.986, suggesting the unpaired electron to<br />
be localized in a s-type orbital. A well resolved shf<br />
structure could be observed in samples doped with<br />
silver enriched in the 109 Ag isotope. It has been sug-<br />
gested that the Ag j" center consists of two Ag + ions<br />
in a cation site, which have trapped an electron.<br />
Ag° centers have been reported in X-ray irradiated<br />
SrCl2 and LiKSC-4 crystals doped with silver<br />
[78]. A partly resolved shf structure has been observed<br />
for the SrCl2 crystals, suggesting a cationic<br />
localization of the Ag° atom, but no detailed analysis<br />
has been reported. Atomic Ag° centers have<br />
been also observed [85, 81] after X-ray irradiation<br />
at RT of silver doped (NH4)2SO4 and K2SO4 crystals,<br />
both exhibiting low symmetry crystal lattice<br />
and structural phase (SP) transitions.<br />
2. The IIB-group (Zn+, Cd+, Hg+)<br />
The elements of the IIB-group are expected to<br />
enter the crystal lattice in their +2 valency state. In<br />
the case of the alkali halides, in which the resulting<br />
ns 1 -centers were mainly reported, several effects are<br />
to be expected:<br />
• The segregation coefficient during the growth of<br />
such doped crystals is larger than in the case of the<br />
doping with monovalent impurities. Consequently<br />
a smaller concentrations of IIB-group impurities is<br />
found in the resulting crystals. For example, the<br />
concentration of cadmium in the KBr crystals was<br />
found to be 200 times smaller than in the melt [86].<br />
• The IIB-group impurities enter the lattice accompanied<br />
by an equal number of charge compensating<br />
cation vacancies, usually at NN lattice sites.<br />
• The impurity-charge compensating vacancy<br />
pairs have the tendency to aggregate, even at RT.<br />
Consequently, before producing ns^centers by irradiation<br />
the samples have to be annealed at temperatures<br />
close to the melting point and quenched at RT<br />
or even at lower temperatures, in order to achieve<br />
their dispersion.<br />
The presence of trapped electron ns 1 -centers in<br />
crystals doped with IIB impurities has been initially<br />
suggested [87] from optical studies on additively colored<br />
KChCd crystals.<br />
Cubic Cd,f centers have been observed by EPR in<br />
alkali chlorides [88, 89] after X-ray irradiation at RT,<br />
or after X-ray irradiation at 77K followed by warming<br />
up to temperatures close to RT, where the initially<br />
bound cation vacancy could move away. Cubic
206 Bulletin of Magnetic Resonance<br />
Zn+ centers in NaCl and cubic rlg^ centers in LiCl,<br />
NaCl and KC1 were obtained by similar production<br />
procedures [90]. They all exhibit well resolved shf<br />
structures, characteristic for a substitutional Me +<br />
(Me = Zn, Cd, Hg) ion in a regular octahedral coordination<br />
of chlorine ligands.<br />
The EPR spectra of the Zn+ centers in NaCl<br />
exhibit only one transition at g ~ 2, due to the even<br />
isotopes. The hf transitions from the 67 Zn isotope,<br />
with 7 = 5/2 and natural abundance of 4.16%, could<br />
be observed [90] only in crystals doped with 88%<br />
enriched 67 Zn isotope.<br />
Natural cadmium contains six isotopes, of which<br />
four are even isotopes (7 = 0) and only two exhibit<br />
nuclear moments ^jv > 0 (Table 2). The X-band<br />
spectrum of the Cd + centers consists of a line at<br />
g ~ 2, from the even isotopes and two pairs of lines<br />
due to the hf transitions of the odd isotopes,<br />
and<br />
(F = l,mF = 1) (F = 0,mF = 0)<br />
(F=l,mF = = l,mF =<br />
Natural mercury contains, besides the even isotopes<br />
with 7 = 0, two isotopes with 7 = 1/2 and<br />
3/2 and nuclear momenta of opposite sign (Table<br />
2). Consequently, the X-band EPR spectra exhibit,<br />
besides the g ~ 2 line, two lines from the hf transitions,<br />
and<br />
(F = l,mF = -1) (F = l,mF = 0)<br />
(F = 1, mF = 0) *—> (F = 1, mF = 1)<br />
of the 199 Hg isotope and one line from the hf transition,<br />
(F = 2, mF = 1)
Vol. 16, No. 3/4 207<br />
Table 6: The EPR parameters of the Zn + -type centers at 77K. The hf parameter A and the shf parameters<br />
As and Ap for the NN anion ligands are given in MHz.<br />
Center<br />
Zn+ in NaCl<br />
Zn+ in CaCO-3<br />
Zn+ in K2SO4<br />
site I<br />
Zn + in K2SO4<br />
site II<br />
g<br />
1.999<br />
311=2.0008<br />
5x=1.9965<br />
^=1.9975<br />
3y=1.9965<br />
p2=2.0010<br />
3x=l-999<br />
^=2.004<br />
gz=2.005<br />
RT irradiation. The resolved shf structure has been<br />
interpreted with a substitutional model in which the<br />
Cd + ion is surrounded by a regular cube of eight F~<br />
ligands.<br />
EPR spectra attributed to Cd + centers have<br />
been reported in Cd 2+ doped f3—K2SO4 crystals<br />
[94] and Cd 2+ doped (NH4)2SO4 crystals [95, 96] after<br />
X-ray irradiation at RT. The two rhombic EPR<br />
spectra (Table 7) have been attributed to Cd + ions<br />
at the two inequivalent cation sites with Cs symmetry,<br />
which are distinguished by their different coordination.<br />
It has been reported [94] that the Cd +<br />
centers are not produced in the /3—K2SO4 crystals<br />
by X-ray irradiation at 77K. No shf structure has<br />
been reported for these centers.<br />
Anisotropic EPR spectra attributed to Zn + type<br />
centers have been reported in irradiated CaCO3<br />
(calcite) [32] and K2SO4 crystals [45]. The EPR<br />
spectrum, observed after 7-ray irradiation at RT of<br />
natural calcite crystals containing 0.05% zinc, exhibits<br />
axial symmetry, characteristic for a Zn + ion at<br />
a Ca 2+ site. The strong intensity of the EPR spectrum<br />
made possible the observation of the hf structure<br />
of the 67 Zn isotope. The observed six hf components<br />
were attributed to the AF — 1, Amp = 0<br />
transitions. The spectral parameters (Table 6) were<br />
determined by using the following analytical expressions<br />
of the resonance fields for the axial case [32]:<br />
hv<br />
\ 67 A<br />
2,030<br />
A||=l,444<br />
A_L=1,412<br />
As=l,569<br />
Ay=l,568<br />
Az=l,595<br />
i4x=l,730<br />
Aj,=l,750<br />
^=1,750<br />
Aa<br />
56<br />
5/?3,4 = T^<br />
where<br />
Ap<br />
5.6<br />
for H || (111), and<br />
References |<br />
[90]<br />
[32]<br />
[45]<br />
[45]<br />
= 9\\,<br />
A=z:A \\<br />
a = 2 142]<br />
9 = 9±,<br />
a = 4 [{hvf - I^i]<br />
a + ^a 2 \ ' hv (49)<br />
a I hv<br />
16<br />
for HI (111).<br />
The number of the Zn + centers observed in<br />
K2SO4 crystals after irradiation at RT depends on<br />
the nature of radiation [45]. Eight centers have been<br />
observed after X-ray irradiation and four centers after<br />
7-ray irradiation. No EPR spectra attributed to<br />
Zn + centers could be observed after irradiation at<br />
77K. Two of the Zn + centers, called I and II, and<br />
considered to be situated substitutionally at the two<br />
K + sites, were found to be the most stable, their<br />
concentration increasing by subsequent warm-up to<br />
400K, an effect also reported in alkali chloride crystals<br />
[91]. EPR spectra were recorded in both X and
208 Bulletin of Magnetic Resonance<br />
Table 7: The EPR parameters of the Cd + —type centers at 77K. The hf parameter A and the shf parameters<br />
As and Ap for the NN anion ligands are given in MHz.<br />
Center<br />
Cd+ in LiCl<br />
Cd+ in NaCl<br />
Cd+ in KCl<br />
Cd+ in LiCl<br />
Cd+(I) in NaCl<br />
CdJ(II) in NaCl<br />
Cd+(III) in NaCl<br />
Cd+(I) in KCl<br />
Cd+(II) in KCl<br />
Cd£ in LiCl<br />
Cd+ in NaCl<br />
Cd+ in KCl<br />
Cd+ in CaF2<br />
Cd+ in SrF2<br />
Cd+ in BaF2<br />
Cd+(I) in /3-K2SO4<br />
Cd + (II) in /3-K2SO4<br />
Cd+ in (NH4)2SO4 a<br />
site I<br />
Cd+ in (NH4)2SO4 a<br />
site II<br />
Measuring temperature 290K.<br />
g 1 r AI<br />
1.998<br />
1.996<br />
1.996<br />
1.998<br />
1.995<br />
1.998<br />
2.000<br />
1.998<br />
1.998<br />
1.993<br />
1.990<br />
2.00<br />
1.9984<br />
1.9965<br />
1.9896<br />
1.999<br />
0X=1.996<br />
5y=1.998<br />
c/2=2.000<br />
gx=l.9975<br />
gy=1.9972<br />
5z=2.0002<br />
Vol. 16, No. 3/4 209<br />
Table 8: The EPR parameters of the Hg + —type of centers. The hf parameter A and the shf parameters As<br />
and Ap for the NN ligand are given in MHz.<br />
Center<br />
Hg+ in LiCl<br />
Hg+ in NaCl<br />
Hg+ in KCl<br />
Hg+ in (NH4)2SO4<br />
site I<br />
Hg+ in (NH4)2SO4<br />
site II<br />
Hg+ in KH2PO4<br />
Hg+ in NH4H2PO4<br />
T(K)<br />
77<br />
77<br />
77<br />
290<br />
290<br />
300<br />
300<br />
g<br />
1.997<br />
1.999<br />
1.998<br />
0X=1.9959<br />
gy=1.9948<br />
gz=1.9927<br />
5X=1.9941<br />
5y=1.9941<br />
&=1.9967<br />
5||=1.9965<br />
pj.=1.9972<br />
511=1.9959<br />
5±=1.9950<br />
148K, the phase transition temperature to the ferroelectric<br />
phase of NH4H2PO4. The shf structure<br />
has been attributed to the interaction with protons<br />
(7=1/2).<br />
B. Trapped hole ns^centers<br />
The trapped hole n^-centers are easily produced<br />
by irradiating with ionizing radiation crystals<br />
doped with IIIA or IVA cation impurities. However,<br />
in studying their production properties one should<br />
take into consideration that such cations can also<br />
act as electron traps, resulting in paramagnetic np 1 -<br />
type centers [98]. The trapped hole ns 1 -centers have<br />
been observed not only in alkali halides but also in<br />
many other ionic and semiconducting crystals.<br />
1. The IIIA-group (Ga 2+ , In 2+ , Tl 2+ )<br />
The IIIA-group cations enter the alkali halides lattice<br />
mainly as monovalent ions. Consequently, it is<br />
possible to grow doped crystals containing relatively<br />
large concentrations of such impurities, especially<br />
thallium. It seems that in gallium or indium doped<br />
alkali halide crystals a certain amount of impurities<br />
are in a higher valency state (+3). This could explain<br />
the increased concentration of the ns 1 -centers<br />
32,690<br />
32,100<br />
32,790<br />
Ax=34,046<br />
Ay=M,08Q<br />
A2=34,060<br />
Ax=34,043<br />
Ay=33,962<br />
Az=34,009<br />
A||=34,174<br />
A±=33,994<br />
A||=33,944<br />
^x=33,973<br />
54.2<br />
47.2<br />
38.0<br />
13.4<br />
13.0<br />
Av<br />
13.4<br />
11.4<br />
8.94<br />
References<br />
[90]<br />
[90]<br />
[90]<br />
[95]<br />
[95]<br />
[36]<br />
[36]<br />
obtained in samples annealed at high temperatures<br />
before irradiation, as well as the presence of new<br />
ns 1 -centers with cation vacancies in their structure<br />
after low temperature irradiation [99, 100].<br />
Cubic ns^M 24 " (M = Ga, In, Tl) centers have<br />
been obtained in alkali chloride crystals after X-ray<br />
irradiation at various temperatures. The highest<br />
concentration was obtained [52, 56, 99, 100] by irradiating<br />
at 77K and pulse-annealing at temperatures<br />
where the holes are mobile (> 170K in KCl).<br />
The resulting Ga 2 +, In 2+ and Tl 2 ," 1 " centers exhibit<br />
a well resolved shf structure for the magnetic field<br />
along the main crystal axes. The analysis of the shf<br />
structure confirms [52, 56] the regular octahedral<br />
symmetry of the surrounding ligands.<br />
Additional isotropic EPR spectra, without shf<br />
structure, attributed to noncubic n^-centers have<br />
been observed [99, 100] in gallium and indium doped<br />
KCl crystals after X-ray irradiation at 77K. The one<br />
(Ga 2+ )' and the two (In 2+ )' and (In 2+ )" centers observed<br />
in KCl have been considered to consist of a<br />
Ga 2+ and In 2+ substitutional ion, respectively, next<br />
to a cation vacancy. The presence of two noncubic<br />
In 2+ centers has been attributed [100] to the existence<br />
of two ns 1 ion-cation vacancy configurations.<br />
It is considered [100] that in the (In;? + )" centers,
210 Bulletin of Magnetic Resonance<br />
which are produced at higher temperatures than<br />
the (In 2+ )' centers and exhibit a partly resolved shf<br />
structure, the vacancy is farther away from the In 2+<br />
ion, resulting in a smaller perturbing effect.<br />
High concentrations of cubic Tl 2+ centers were<br />
produced by X-ray irradiation at 77K of double<br />
doped KCl:Tl:Pb and NaCl:Tl:Pb crystals [100].<br />
This effect has been explained by the strong electron<br />
trapping properties of the Pb 2+ ions [101, 102]. By<br />
warming up such crystals, at temperatures corresponding<br />
to the onset of motion of cation vacancies<br />
released by the Pb + centers, it has been than possible<br />
to obtain Tl 2+ vc centers according to reaction<br />
(6). The presence of such centers was reflected in<br />
the splitting of the Tl 2+ hf structure in two components<br />
with less resolved shf structure.<br />
The EPR spectra of the M 2+ (M = Ga, In, Tl)<br />
centers were described by the spin Hamiltonian (16),<br />
with or without the shf interaction term.<br />
The EPR lines of the Ga 2+ centers, observed in<br />
the X-band, were attributed to the transitions (F =<br />
2,mF = -2) (F = 2,mF = -1) and (F =<br />
\,mF — —1) *—* (F = 2, mF = —2) from the two<br />
natural isotopes 69 Ga and 71 Ga, both with nuclear<br />
spin / = 3/2 (Table 2).<br />
Indium has two natural isotopes, 113 In and 115 In,<br />
both with / = 9/2 (Table 2). The X-band EPR spectrum<br />
consists of one line, due to the transition (F =<br />
5,mF = —5) (F = 5,mF = —4), which can be<br />
seen at high magnetic fields (~ 1.5T). Another transition<br />
(F = -5,mF = -5) (F = 4,mF = -4)<br />
has been observed in the Q-band.<br />
The large zero-field splitting and the close nuclear<br />
momenta of the two thallium isotopes 203 Tl<br />
and 203 Tl, both with / = 1/2 (Table 2), yields an<br />
EPR spectrum consisting of two lines. They represent<br />
the superposition of the transitions (F =<br />
l,mF = 0) (F = l,mF = -1) and (F =<br />
l,mF = 1) (F = l,mF = 0) from the two<br />
isotopes. The spin Hamiltonian parameters can be<br />
determined with the formulae (23,24).<br />
The isotropic EPR spectrum, without shf structure,<br />
observed [103] in SrCl2:Tl crystals after X-ray<br />
irradiation at 77K, has been attributed to Tl 2+ ions<br />
with a neighboring charge compensating vacancy.<br />
By pulse annealing above 130K the vacancy moves<br />
away resulting in a partly resolved shf structure.<br />
Isotropic Ga 2+ centers [104, 105, 106], In 2+ centers<br />
[107, 105] and T1 2 + centers [105] have been ob-<br />
served in ZnS crystals by photostimulation. All centers<br />
exhibit large 5A shifts, compared to the corresponding<br />
cubic centers in alkali chlorides (see Tables<br />
8-10). Such large 6A values can be explained by the<br />
stronger covalent character of the bondings in ZnS<br />
(formula 42).<br />
Slightly anisotropic ns 1 -type EPR spectra, attributed<br />
to Ga 2+ in silicon [109], In 2+ in ZnO<br />
[110], Tl 2+ in hexagonal ZnS [105] and in K2SO4<br />
[111, 112], have been also reported. The anisotropy<br />
of the EPR spectra of the Tl 2+ centers in the orthorhombic<br />
/3-K2SO4 has been quantitatively explained<br />
[111] by the effect of the odd crystal field<br />
component at the cation sites (C5-local symmetry).<br />
By using a cluster model in deriving the effective<br />
crystal field operator, a good agreement between the<br />
calculated and the experimental spin Hamiltonian<br />
parameters has been obtained [111].<br />
The spin-lattice relaxation time T\ of the Tl 2+<br />
centers in K2SO4 has been measured in the 1.5 to<br />
25K temperature range by observing the spin-echo<br />
signal [113]. It exhibits a temperature dependence<br />
of the form:<br />
Tf 1 = LOT x 3.3 x l(T 5 T/(0/T) (50)<br />
where T is the temperature, #=120K is the Debye<br />
temperature and f(0/T) is a factor describing the<br />
deviation from a pure Raman process, attributed<br />
[113] to the large hf splitting.<br />
Tl 2+ centers produced by X-ray irradiation<br />
have been used as paramagnetic probes in studies<br />
concerning structural phase transitions, such as<br />
the paraelectric/ferroelectric transition in KD2PO4,<br />
Rb2H2PO4 and (NH4)2SO4 crystals [41, 114, 115,<br />
116, 117] and the paraelectric/antiferroelectric transition<br />
in NH4H2PO4 crystals [118]. The measured<br />
spin Hamiltonian parameters (Table 11) are slightly<br />
but clearly anisotropic, reflecting the local symmetry<br />
of the paramagnetic center and the changes in<br />
the local symmetry, such as the lowering of the symmetry<br />
by going from the paraelectric phase to a ferroelectric<br />
or antiferroelectric one.<br />
The spontaneous symmetry breaking and the local<br />
freeze-out during the transition from the paraelectric<br />
to the ferroelectric phase has been studied<br />
[117] in the KH2ASO4 crystals using both Tl 2+ and<br />
AsO4~ paramagnetic centers, simultaneously produced<br />
by X-ray irradiation at 77K. The spectra of<br />
both centers exhibit axial symmetry in the high
Vol. 16, No. 3/4 211<br />
Table 9: The EPR parameters of the Ga 2+ —type centers. The hf parameter A and the shf parameters As<br />
and Ap with the NN ligands are given in MHz.<br />
Center<br />
Ga^+ in NaCl<br />
Ga 2+ in KCl<br />
Ga 2 , + in KCl<br />
Ga 2+ in ZnS(cub)<br />
Ga 2+ in ZnS(hex)<br />
Ga 2+ in ZnS a<br />
Ga 2+ in Si<br />
a ODMR measurements.<br />
T(K).<br />
77<br />
77<br />
77<br />
20<br />
20<br />
2<br />
g<br />
2.062<br />
2.012<br />
.2.01<br />
1.9974<br />
2.0006<br />
2.001<br />
2.001<br />
5||=2.0014<br />
51=1.9973<br />
9,350<br />
8,860<br />
6,320<br />
6,076<br />
6,200<br />
Acub=6,080<br />
Ahex=Q,150<br />
A||=3,292<br />
A±=3,253<br />
As<br />
52.2<br />
47.9<br />
Ap<br />
12.1<br />
11.5<br />
References<br />
[99]<br />
[99]<br />
[99]<br />
[105, 106, 108]<br />
[105, 106, 108]<br />
[104]<br />
Table 10: The EPR parameters of the In 2+ —type centers. The hf parameter A and the shf parameters As<br />
and Ap for the NN ligands are given in MHz.<br />
Center<br />
In 2+ in KCl<br />
(In 2+ )' in KCl<br />
(In 2+ )" in KCl<br />
In 2+ in ZnS(cub)<br />
In 2+ in ZnS(hex) a<br />
In 2+ in ZnO a<br />
T(K)<br />
77<br />
77<br />
77<br />
77<br />
2<br />
2<br />
2<br />
2<br />
g<br />
1.98<br />
2.00<br />
1.98<br />
1.993<br />
0H=1.9574<br />
51=1.9562<br />
14,700<br />
12,000<br />
14,000<br />
9,362<br />
9,720<br />
9,630<br />
9,510<br />
A,|=100.24<br />
A_L=100.14<br />
As<br />
52.4<br />
49.2<br />
a ODMR measurements. The hf constants correspond to three different sites.<br />
temperature, paraelectric phase, and orthorhombic<br />
symmetry with additional splittings due to the presence<br />
of four inequivalent lattice sites, in the low temperature,<br />
ferroelectric phase. It has been observed<br />
that the temperature dependence around the transition<br />
temperature Tc of the additional line splitting<br />
due to the presence of domains of opposite polarization<br />
is different for the two paramagnetic centers.<br />
The corresponding spontaneous dynamic sym-<br />
Ap<br />
13<br />
12<br />
[109]<br />
References<br />
[100]<br />
[100]<br />
[100]<br />
[105]<br />
[107]<br />
[110]<br />
metry breaking, seen above Tc in the EPR spectra<br />
of AsO^", but not of Tl 2+ , has been explained by<br />
the different coupling of the two defects to the surrounding<br />
pseudospins.<br />
2. The IVA-group (Ge 3+ , Sn 3 +, Pb 3+ )<br />
The impurities of the IVA group of elements enter<br />
the ionic crystals mainly as divalent ions: Ge 2+ ,<br />
Sn 2+ and Pb 2+ . Consequently, monovalent lattice
212 Bulletin of Magnetic Resonance<br />
Table 11: The EPR parameters of the Tl 2+ —type centers. The hf parameter A and the shf parameters As<br />
and Ap for the NN ligands are given in MHz.<br />
Center<br />
Tl^+ in NaCl<br />
Tl 2+ in KCl<br />
Tl 2+ in RbCl<br />
Tl 2+ in KBr<br />
Tl 2+ in SrCl2<br />
T1 2 + in ZnS(cub)<br />
Tl 2+ in ZnS(hex)<br />
Tl 2+ in CdTe<br />
T1 2 + in K2SO4<br />
site I<br />
Tl 2+ in K2SO4<br />
site II<br />
Tl 2+ in NH4H2PO4 a<br />
(antiferro. phase)<br />
Tl 2+ in KH2PO4<br />
and KH2As04 b<br />
(ferro. phase)<br />
Tl 2+ in Rb2H2PO4<br />
(ferro. phase)<br />
Tl 2+ in KD2PO4<br />
(ferro. phase)<br />
Tl 2+ in (NH4)2SO4<br />
(ferro. phase)<br />
T(K)<br />
77<br />
77<br />
77<br />
77<br />
77<br />
77<br />
77<br />
77<br />
77<br />
77<br />
85<br />
77<br />
110<br />
77<br />
85<br />
g<br />
2.009<br />
2.010<br />
2.010<br />
2.067<br />
2.0120<br />
2.0095<br />
511=2.0093<br />
5_L=2.0103<br />
2.035<br />
^=1.997<br />
5y=1.995<br />
^=1.998<br />
^=1-993<br />
gy=1.994<br />
gz=1.997<br />
5^=1.988<br />
Sy=1.994<br />
gz=l.998<br />
ly=109,145<br />
A=108,103<br />
Aa<br />
45.9<br />
42.6<br />
42.6<br />
173.3<br />
697.7<br />
a Slightly different values of the hf constant are reported in Reference [121].<br />
6 As reported in Reference [16].<br />
hosts, such as alkali halides, can be doped only with<br />
relatively low concentrations (~ 10 2 ppm) of such<br />
impurities. The doping with germanium is even<br />
more difficult due to the low boiling point and thermal<br />
instability of germanium halides. The presence<br />
of the charge compensating cation vacancies is expected<br />
to have the same consequences as in the case<br />
Ap<br />
17.1<br />
15.9<br />
15.9<br />
70.2<br />
185<br />
of doping with IIB impurities.<br />
References<br />
[56]<br />
[56, 52]<br />
[56]<br />
[56]<br />
[103]<br />
[105]<br />
[105]<br />
[119]<br />
[111]<br />
[111, 112]<br />
[118]<br />
[115, 41]<br />
[114]<br />
[41]<br />
[116]<br />
Ge 3+ centers have not yet been reported in alkali<br />
halides. However, germanium doped NaCl and<br />
KCl crystals have been obtained and the electron<br />
trapped Ge + centers could be observed after X-ray<br />
irradiation [122].<br />
A Ge 3+ center, exhibiting the largest reported hf
Vol. 16, No. 3/4 213<br />
Table 12: The EPR parameters of the Ge 3+ —type centers. The hf parameter A and the shf parameters As<br />
and Ap for the NN ligands are given in MHz.<br />
Center<br />
Ge d+ in BaGeF6<br />
Ge 3+ in ZnS(cub)<br />
Ge 3+ in ZnSe<br />
Ge 3+ in ZnTe<br />
Ge 3+ in CdS<br />
Ge 3+ in CdTe<br />
Ge 3+ in quartz;<br />
A(GeLi) center<br />
Ge 3+ in quartz;<br />
C(GeLi) center<br />
Ge 3+ in quartz;<br />
(Ge(I)e~)~ center<br />
Ge 3+ in quartz;<br />
(Ge(II)e~)~ center<br />
Ge 3+ in quartz;<br />
(Ge(A)e-/Li+)°,<br />
or A, or AM+ center<br />
Ge 3+ in quartz;<br />
(Ge(A)e-/Na + )°<br />
center<br />
Ge 3+ in quartz;<br />
(Ge(C)e-/Li+),<br />
or C, or Cji/+ center<br />
Ge 3+ in quartz;<br />
(Ge(C)e-/Na+)<br />
center<br />
T(K)<br />
30<br />
77<br />
77<br />
77<br />
77<br />
20<br />
300<br />
300<br />
77<br />
77<br />
77<br />
300<br />
77<br />
300<br />
g<br />
2.0038<br />
2.0086<br />
2.4026<br />
2.1375<br />
5H=2.0021<br />
5_L=2.0059<br />
2.1451<br />
Sx=1.9913<br />
5y=1.9965<br />
5z=2.0014<br />
5X=2.0000<br />
5y=1.9973<br />
5Z=1.9962<br />
51=1.9941<br />
52=2.0012<br />
53=2.0023<br />
51=1.9936<br />
52=2.0010<br />
53=2.0015<br />
51=1.9907<br />
52=2.003<br />
53=2.0019<br />
51=1.9918<br />
52=2.0002<br />
53=2.0015<br />
51=1.9947<br />
52=1.9983<br />
53=2.0014<br />
51=1.9959<br />
52=1.9970<br />
53=2.0005<br />
| 73 A|<br />
1,779<br />
914 a<br />
782<br />
657<br />
635.6<br />
a A value of 864MHz is reported in Reference [130].<br />
A±=990<br />
615<br />
Ax=278.69<br />
Ay =295.63<br />
Az=282.06<br />
Ax=864.5<br />
Ay=823.15<br />
A2=825.3<br />
Ac=776<br />
constant, has been observed [123] in 7-ray irradiated<br />
powders of BaGeFg. The center, which seems to be<br />
a self-trapped hole, exhibits a shf structure from a<br />
regular octahedron of six NN F" ligands.<br />
The EPR spectra of the Ge 3+ centers consist of<br />
Ac=782<br />
Ac=785<br />
Ac=758<br />
Ac=845<br />
386<br />
508<br />
476<br />
573<br />
As<br />
Ac/( 29 Si)=3.6<br />
Ac,,( 29 Si)=6.7<br />
Ac»/( 29 Si)=ll<br />
Ai( 7 Li)=1.15<br />
A2( 7 Li)=2.94<br />
A3( 7 Li)=1.29<br />
yli( 23 Na)=1.71<br />
A2( 23 Na)=2.74<br />
yl3( 23 Na)=1.71<br />
Ai( 7 Li)=2.3<br />
A2( 7 Li)=-0.2<br />
A3( 7 Li)=-0.9<br />
Ai( 23 Na)=1.9<br />
^2(23Na)=2.5<br />
A3( 23 Na)=2.97<br />
Ap<br />
98.1<br />
204<br />
192<br />
170<br />
References<br />
[123]<br />
[124]<br />
[125]<br />
[126, 124]<br />
[108]<br />
[127]<br />
[126]<br />
[128, 129, 121, 46]<br />
[128, 129, 121, 46]<br />
[121]<br />
[121]<br />
[128, 121]<br />
[129, 121]<br />
[128, 121]<br />
[121]<br />
an intense line at 5 ~ 2 from the even isotopes and<br />
a weak hf structure of 10 lines from the 73 Ge isotope<br />
with / = 9/2 (Table 2). Due to the small<br />
zero-field splitting, the hf structure is due to the<br />
AM = ±l,Am = 0 transitions, described by for-
214 Bulletin of Magnetic Resonance<br />
Table 13: The EPR parameters of the Sn 3+ —type centers. The hf parameter A and the shf parameters As<br />
and Ap for the NN ligands are given in MHz.<br />
Center<br />
Sn 3+ in NaCl<br />
(Sn 3+ )' in NaCl<br />
(Sn 3+ )" in NaCl<br />
Sn 3+ in KCl<br />
(Sn 3+ )' in KCl<br />
(Sn 3+ )" in KCl<br />
(Sn 3+ )/ in KCl<br />
(Sn 3+ )// in KCl<br />
Sn 3+ in SnCl2<br />
Sn 3+ in Snl2<br />
Sn 3+ in SnSO4<br />
Sn 3+ in K2SnF6<br />
Sn 3+ in CdS<br />
Sn 3+ in CdSe<br />
Sn 3+ in CdTe<br />
Sn 3+ in ZnS(cub)<br />
Sn 3+ in ZnS(hex)<br />
Sn 3+ in ZnSe<br />
Sn 3+ in ZnTe<br />
Sn 3+ in ZnO<br />
T(K)<br />
77<br />
77<br />
77<br />
77<br />
77<br />
77<br />
35<br />
35<br />
77<br />
77<br />
77<br />
30<br />
77<br />
77<br />
20<br />
77<br />
20<br />
g<br />
2.011<br />
2.00<br />
2.00<br />
2.013<br />
2.00<br />
2.00<br />
2.011<br />
1.997<br />
2.00<br />
2.00<br />
1.993<br />
2.0011<br />
5,1=2.0024<br />
5J_=2.0031<br />
5,1=2.0059<br />
2.1012<br />
2.0057<br />
2.0075<br />
2.0176<br />
2.0251<br />
2.1001<br />
1.9877<br />
mulae (20). The spin Hamiltonian parameters of<br />
the various Ge 3+ centers are presented in Table 12.<br />
Although the 73 Ge isotope has a small abundance,<br />
the corresponding hf structure has been reported<br />
in irradiated SiO2 (quartz) [43, 46, 128, 129].<br />
Ge 3+ centers have been also observed in as grown<br />
II-VI semiconductors doped with germanium by diffusion.<br />
The concentration of the Ge 3+ centers could<br />
be drastically altered by photoexcitation with light<br />
of energy close to the band gap. The shf structure<br />
observed in ZnSe [125], ZnTe [126, 124] and CdTe<br />
[126], has been attributed to the interaction of the<br />
4s electron with the nuclei of the tetrahedrally coordinated<br />
ligands 77 Se (/ = 1/2, 7.58% abundant),<br />
123 Te (/ = 1/2, 0.9% abundant) and 125 Te (/ = 1/2,<br />
7% abundant), respectively.<br />
| 119 ^|<br />
24,600<br />
20,500<br />
25,200<br />
24,400<br />
20,100<br />
25,200<br />
19,220<br />
22,610<br />
4is=17,495<br />
As=28,676<br />
i4is=29,330<br />
29,745<br />
.4,1=15,825<br />
Ax=15,212<br />
X|,=13,663<br />
11,794<br />
15,644<br />
16,353<br />
14,780<br />
14,291<br />
12,265<br />
9,974<br />
46.1<br />
49.5<br />
51.2<br />
48.9<br />
320.6<br />
597<br />
541<br />
Ap<br />
15.2<br />
14.1<br />
20.5<br />
12.6<br />
94.5<br />
204.7<br />
224<br />
References<br />
[26]<br />
[131]<br />
[131]<br />
[26]<br />
[131]<br />
[131]<br />
[132]<br />
[132]<br />
[133]<br />
[133]<br />
[133]<br />
[123]<br />
[127]<br />
[127]<br />
[126]<br />
[130]<br />
[134]<br />
[57]<br />
[108]<br />
[126]<br />
[135]<br />
The natural tin contains, besides the even isotopes,<br />
three isotopes with nuclear spin / = 1/2, but<br />
different nuclear momenta and abundances (Table<br />
2). For this reason it is difficult to study the hf interaction<br />
of the Sn 3+ centers in crystals doped with<br />
natural tin. Various Sn 3+ centers were reported in<br />
NaCl and KCl doped with SnCl2 containing 87.8%<br />
117 Sn [26, 131], as well as in KCl doped with tin<br />
enriched in the 119 Sn isotope [132].<br />
Besides the g ~ 2 line from the even isotopes<br />
the X-band EPR spectra of the Sn 3+ exhibit at<br />
high magnetic fields two hf lines due to the AF =<br />
0, Amp = ±1 transitions. The hf constant A can<br />
be determined with the aid of formulae (23,24). The<br />
spin Hamiltonian parameters of the Sn 3+ centers reported<br />
in the literature are presented in Table 13.
Vol. 16, No. 3/4 215<br />
Sn 3+ centers with isotropic lines and well resolved<br />
shf structure were obtained [26] in KC1 and<br />
NaCl in a maximum concentration, by X-ray irradiation<br />
at 77K and pulse-annealing around 160K.<br />
Two Sn 3+ centers, called (Sn 3+ )' and (Sn 3+ )",<br />
exhibiting anisotropic high field hf transitions were<br />
observed [131] in both NaCl and KC1 after X-ray<br />
irradiation at 77K. The (Sn 3+ )" center exhibits a<br />
C2 symmetry axis, attributed to the presence of a<br />
NN cation vacancy, along a (111) direction.<br />
Other two Sn 3+ centers, called (Sn 3+ )/ and<br />
(Sn 3+ )//, with resolved shf structure at 35K, have<br />
been also reported in KC1, after X-ray irradiation<br />
at 77K and warming up at various temperatures<br />
[132]. The (Sn 3+ )/ center reaches its maximum concentration<br />
after pulse annealing at 230K. The shf<br />
structure, due to the interaction with six neighboring<br />
ligands, exhibits a (111) symmetry attributed to<br />
the presence of an interstitial Cl~ ion. The (Sn 3+ )//<br />
center reaches its maximum concentration by pulseannealing<br />
at 280K. The suggested structural model<br />
consists of a Sn 3+ ion with two neighboring cation<br />
vacancies.<br />
Sn 3+ centers, which seems to represent selftrapped<br />
holes at cationic sites, were reported in<br />
SnCl2, Snl2 and SnSO4 crystals [133] after X-ray<br />
irradiation at 77K and in K2SnFg powder after<br />
7-irradiation [123]. The Sn 3+ center observed in<br />
K2SnFg exhibits the largest reported hf constant in<br />
a crystal lattice, characteristic for a strongly ionic<br />
compound.<br />
Sn 3+ centers have been also observed in various<br />
II-VI semiconductors. With the exception of CdS<br />
and CdSe, where they exhibit axial symmetry, in all<br />
other crystals the Sn 3+ centers are isotropic.<br />
Pb 3+ centers have been reported in alkali chlorides,<br />
in alkali earth fluorides, in various oxides and<br />
in II-VI semiconductors (Table 14).<br />
Natural lead contains only one odd isotope<br />
( 207 Pb) with / = 1/2 (Table 2). Due to the large<br />
zero-field splitting, the EPR spectra of the Pb 3+<br />
centers consist of a line at g — 2 due to the even<br />
isotopes and two lines at higher magnetic fields due<br />
to the two AF — 0,Amj? = ±1 transitions. The<br />
spin Hamiltonian parameters for the isotropic case<br />
are determined by formulae (23,24).<br />
Two types of Pb 3+ centers have been observed<br />
in KCl:Pb crystals [138] after X-ray irradiation at<br />
77K and subsequent warm-up. The first one, al-<br />
ready produced after irradiation, reaches its maximum<br />
concentration by pulse-annealing at 220K. Its<br />
well resolved shf structure has been described in a<br />
good approximation by the interaction with a regular<br />
octahedron of six chlorine ligands. It has been assumed<br />
that an accompanying charge compensating<br />
cation vacancy may be present in a (2,0,0) site, or<br />
further away. The second Pb 3+ center was produced<br />
by pulse-annealing above 220K. It had the same g<br />
and A values, but a less resolved shf structure, attributed<br />
to the presence of a second cation vacancy.<br />
The source of the cation vacancies seems to be the<br />
Pb + centers, also produced by X-ray irradiation<br />
[29, 101]. Similar Pb 3+ centers have been observed<br />
in other alkali chlorides [26, 131, 136]. Two types of<br />
Pb 3+ centers have been reported [131] in KC1 and<br />
NaCl, after X-ray irradiation at 77K, and attributed<br />
to different configurations of Pb 3+ -vc pairs.<br />
Pb 3+ centers have been reported [85, 139] in lead<br />
doped CaF2 and BaF2 crystals, after X-ray irradiation<br />
at 77K or RT and in SrF2 after X-ray irradiation<br />
at 77K. The well resolved shf structure corresponds<br />
to a substitutional Pb 3+ ion surrounded by<br />
a cube of eight F~ ligands. Due to the large shf<br />
interaction the forbidden (Am/ = ±1) transitions<br />
are partly allowed. A second type of Pb 3+ centers<br />
exhibiting different shf structure has been observed<br />
[139] at T
216 Bulletin of Magnetic Resonance<br />
symmetry around the < 111 > axes and shf structure<br />
due to the interaction with one 19 F ligand<br />
nucleus, has been observed only in TI1O2 crystals<br />
grown from a PbF2 based flux. The center is considered<br />
to consist of a substitutional Pb 3+ ion, with<br />
one of the eight nearest O 2 ~ ligands substituted by<br />
an F~ ion. The presence of both Pb 3+ and Pb 3+<br />
centers was also reported [142] in as grown ThO2<br />
crystals prepared from a PbF2 based flux. In this<br />
case it has been found that their concentration is<br />
greatly enhanced by illumination with 400 nm light.<br />
Pb 3+ centers with isotropic EPR spectra, attributed<br />
to substitutional Pb 3+ ions at cubic sites<br />
have been reported in the as grown crystals of<br />
ZnO and CaO [144], Lu3Ga50i2, Y3A15O12 and<br />
Lu3Al5012 [42].<br />
Axial Pb 3+ centers, at substitutional cationic<br />
sites, in CaW04 crystals [146, 147] and CaCO3 (calcite)<br />
crystals [44, 143, 145], have been observed after<br />
X or 7-ray irradiation. The EPR spectra of the<br />
Pb 3+ centers in CaW04 exhibit a partly resolved<br />
shf structure, attributed to the interaction with the<br />
183 W nuclei (I = 1/2, 14.4% abundance). The hf<br />
constant of the Pb 3+ centers in CaCO3 exhibits [44]<br />
the same temperature dependence as the one previously<br />
observed for the Cd+ centers in KC1 (formula<br />
47). The temperature dependence of the hf constant<br />
and the large Lorentzian linewidth of the various<br />
transitions have been quantitatively explained [152]<br />
in terms of a Raman spin-lattice relaxation corresponding<br />
to a Kramers spin system with large hf<br />
interaction.<br />
Pb 3+ centers with axial symmetry were reported<br />
in as grown YPO4 and LUPO4 orthophosphates prepared<br />
from lead based fluxes [148]. In an unexpected<br />
way, the shf interaction parameters with the 31 P nuclei<br />
of the second shell of ligands has been found to<br />
be larger than for the first shell.<br />
Photosensitive Pb 3+ centers have been also observed<br />
in the II-VI semiconductors, ZnSe [150],<br />
ZnTe [27, 125, 126, 124] and CdS [133, 127] as well<br />
as in CaSe [151].<br />
The spin Hamiltonian parameters of the IVAgroup<br />
of ns 1 —centers in cubic II-VI semiconductors<br />
(Tables 12-14) exhibit specific features: large<br />
and positive Ag = g - ge shifts and large hf shifts<br />
6A. The above characteristics have been explained<br />
[53, 57] in a satisfactory manner with the holetrapped<br />
MO model. The model, briefly presented<br />
in paragraph 1.3.2., describes the wave function of<br />
the paramagnetic electron as a linear combination<br />
of the central ns wave function and the s-p orbitals<br />
of the ligands (formulae 40,41). Quantitative analysis<br />
of the experimental spin Hamiltonian parameters<br />
have been initially performed for the n5 1 -centers<br />
in zinc chalcogenides [150, 153] using Watanabe's<br />
model [53]. Further analysis, have been performed<br />
for the ns^centers in zinc chalcogenides [57], for the<br />
Ge 3+ and Pb 3+ centers in zinc chalcogenides and<br />
CdTe [149], and for the Ge 3+ , Sn 3 + and Pb 3+ centers<br />
in CdTe and ZnTe [126]. The analysis show<br />
that the increased spin-orbit coupling in the S, Se,<br />
Te sequence of ligands is responsible for the positive,<br />
increasing Ag shift, observed along the zinc or<br />
cadmium chalcogenides sequence. In the same manner<br />
the hf shift 6A decreases with the ionicity of the<br />
ligand bonds.<br />
V. Concluding Remarks<br />
The present survey shows that among the various<br />
inorganic crystal-hosts of the n5 1 -centers the<br />
interest was mainly concentrated on the cubic alkali<br />
halides. However, even inside this group of compounds<br />
there is a strong discrepancy between alkali<br />
chlorides and bromides, in which many ns^centers<br />
have been observed, the alkali iodides in which a few<br />
such centers have been observed and the alkali fluorides<br />
and cesium halides in which ns 1 -centers have<br />
not been reported yet. In this connection the study<br />
of the ns^centers in the latter crystal-hosts would<br />
be of interest regarding the validity of their production<br />
and recombination mechanisms under irradiation.<br />
Although a relatively large number of ns 1 -centers<br />
have been reported in other cubic and non-cubic<br />
crystal-lattices, only a few reports are concerned<br />
with the identification of their structural model<br />
i.e., their position in the lattice and the presence/absence<br />
of neighboring lattice defects. This is<br />
not at all surprising considering that in the absence<br />
of a resolved shf structure the structure determination<br />
is extremely difficult.<br />
Several papers have been devoted, especially in<br />
the last years, to the study of the ns 1 -centers produced<br />
in crystals with low symmetry lattice exhibit-
Vol. 16, No. 3/4 217<br />
Table 14: The EPR parameters of the Pb 3+ —type of centers. The hf parameter A and the shf parameters As<br />
and Ap for the NN ligands are given in MHz.<br />
Center<br />
Pb^ + in LiCl<br />
Pb 3+ in NaCl<br />
(Pb 3+ )' in NaCl<br />
(Pb 3+ )" in NaCl<br />
Pb 3+ vc in KCl<br />
Pb 3+ 2vc in KCl<br />
(Pb 3+ )' in KCl<br />
(Pb 3+ )" in KCl<br />
Pb 3+ in RbCl<br />
Pb 3+ in CaF2<br />
Pb 3+ in SrF2<br />
Pb 3+ in BaF2<br />
Pb 3+ in PbCO3<br />
Pb 3+ in BaPbF6<br />
Pb 3+ in PbF2<br />
Pb 3+ in ThO2<br />
Pb 3+ in ThO2<br />
Pb 3+ in CeO2<br />
Pb 3+ in CaO<br />
Pb 3+ in ZnO<br />
Pb 3+ in CaCO3<br />
(calcite)<br />
Pb 3+ in CaWC-4<br />
Pb 3+ in YPO4<br />
Pb 3+ in LuPO4<br />
Pb 3+ in Y3Ga5Oi5<br />
Pb 3+ in Lu3Ga5Oi2<br />
Pb 3 + in Y3A15O12<br />
Pb 3+ in Lu3Al50i2<br />
Pb 3+ in CdS<br />
T(K)<br />
77<br />
77<br />
77<br />
77<br />
77<br />
77<br />
77<br />
77<br />
77<br />
77<br />
77<br />
77<br />
77<br />
30<br />
77<br />
77<br />
77<br />
77<br />
1.6<br />
1.6<br />
77<br />
100<br />
300<br />
300<br />
300<br />
300<br />
300<br />
77<br />
g<br />
2.033<br />
2.034<br />
2.040<br />
2.040<br />
2.034<br />
2.034<br />
2.030<br />
2.030<br />
2.0033<br />
2.0020<br />
2.007<br />
2.0018<br />
1.9963<br />
2.00<br />
2.0023<br />
2.007<br />
1.9666<br />
5,1=1.9704<br />
5_L=1.9637<br />
1.9649<br />
1.999<br />
2.013<br />
5||=l-9704<br />
31=1.9637<br />
5H=1.9919<br />
51=1.9887<br />
5||=2.0001<br />
51=2.0002<br />
5||=2.0001<br />
31=2.0011<br />
2.002<br />
2.001<br />
2.002<br />
2.000<br />
5H=2.0020<br />
5_L=2.0049<br />
|207A|<br />
33,600<br />
33,600<br />
35,500<br />
35,500<br />
33,000<br />
33,000<br />
33,000<br />
33,000<br />
32,700<br />
52,800<br />
51,350<br />
49,580<br />
34,700<br />
47,868<br />
47,100<br />
36,875<br />
Ay=35,796<br />
^1=35,404<br />
36096<br />
32,070<br />
24,220<br />
Ay =35,796<br />
AJ_=35,404<br />
A||=38,410<br />
Aj_=38,437<br />
A{\ =48,691<br />
A±=48,810<br />
A,, =49,530<br />
Ai=49,800<br />
Ax=37,860<br />
^=37,980<br />
A2=37,790<br />
38,130<br />
40,138<br />
41,427<br />
Ay =36,800<br />
As<br />
36.4<br />
40.2<br />
87.7<br />
43.6<br />
36.3<br />
313.7<br />
381<br />
288<br />
259<br />
231<br />
39.4 a<br />
A 1 = 7.65 6<br />
A n = 37.2 fc<br />
A 1 = 6.72 6<br />
A 11 = 40.0 6<br />
Ap<br />
27.9<br />
18.3<br />
15.6<br />
20.8<br />
14.2<br />
121<br />
46.8<br />
122<br />
123<br />
126<br />
8.24 a<br />
References<br />
[136, 137]<br />
[26, 136]<br />
[131]<br />
[131]<br />
[138]<br />
[138]<br />
[131]<br />
[131]<br />
[136]<br />
[85, 133, 139]<br />
[78]<br />
[85, 139]<br />
[85, 139]<br />
[133]<br />
[123]<br />
[140]<br />
[141, 142]<br />
[141, 143, 142]<br />
[141]<br />
[144]<br />
[144]<br />
[44, 143, 145]<br />
[146, 147]<br />
[148]<br />
[148]<br />
[42]<br />
[42]<br />
[42]<br />
[42]<br />
[133, 127]
218<br />
Center<br />
Pb 3+ in CdTe<br />
Pb 3+ in ZnSe<br />
Pb 3+ in ZnTe<br />
Pb 3+ in CaSe<br />
T(K)<br />
20<br />
77<br />
77<br />
Table 14: continued.<br />
g<br />
2.2054<br />
2.0721<br />
2.167<br />
2.173<br />
a The shf parameters are referring to the 19 F ligand<br />
b The shf parameters are referring to the 31 P ligand.<br />
\' M7 A\<br />
14,642<br />
20,654<br />
15,680<br />
20,480<br />
As<br />
416.5<br />
215<br />
130<br />
Ap<br />
186<br />
110<br />
70.3<br />
Bulletin of Magnetic Resonance<br />
References<br />
[126, 149]<br />
[150]<br />
[27, 125, 126, 124]<br />
[151]<br />
Table 15: The EPR parameters attributed to the VA group of ns 1 centers. The hf parameter A for the 75 As,<br />
121 Sb and 209 Bi isotopes and the shf parameters As and Ap are given in MHz.<br />
Center j T(K)<br />
As 4+ in CsAsF6<br />
Sb 4+ in CsSbF6<br />
Bi 4+ in CsAsF6<br />
a A/( 75 As)=14,660 MHz.<br />
6 A/( 121 Sb)=35,100 MHz.<br />
c A/( 209 Bi)=77,530 MHz.<br />
30<br />
30<br />
g<br />
2.0030<br />
2.0015<br />
2.0134<br />
ing structural phase transitions (SPT). Besides producing<br />
and describing their EPR properties, the resulting<br />
ns 1 -centers have been employed in certain<br />
cases as paramagnetic probes in investigating the<br />
mechanism of the SPT. Considering the wide temperature<br />
range in which some of the n^-centers can<br />
be observed by EPR, it is expected that their use as<br />
microscopic probes in the study of the SPT will be<br />
extended.<br />
It should be also mentioned that other impurity<br />
ions, besides those presented in Table 1. are able in<br />
principle to produce new ns^centers. It is the case<br />
of the VA-group of elements (As 4+ , Sb 4+ , Bi 4+ ), as<br />
well as Al 2+ and Si 3+ .<br />
In this respect one should mention the reported<br />
observation of new EPR spectra in 7-irradiated<br />
polycrystalline samples of CsAsF6, CsSbF6 [154]<br />
and CsAsF6 doped with BiF^r [155]. Although the<br />
resulting paramagnetic species were assigned to free<br />
radicals of the type MeF|~ (Me = As. Sb, Bi), re-<br />
\A\<br />
9,403 a<br />
21,390 6<br />
36,020 c<br />
As<br />
693<br />
697<br />
414<br />
Av<br />
160<br />
153<br />
163<br />
6A<br />
0.36<br />
0.39<br />
0.55<br />
References<br />
[154]<br />
[154]<br />
[155]<br />
spectively, the parameters (Table 15) corresponding<br />
to the spin Hamiltonian (16) describing the observed<br />
spectra, strongly suggest the presence of Me 4+ (ns 1 )<br />
centers. The large hf shift 8 A and shf coupling parameters<br />
As and Ap of the observed centers result<br />
from a strong delocalization of the central ns 1 electron<br />
to the neighboring ligands, which may explain<br />
their assignment to free radicals.<br />
Acknowledgments<br />
One of the authors (I.U.) would like to express<br />
his gratitude to Professor Abdus Salam for the kind<br />
invitation to work at the ICTP-Trieste, as well as<br />
for continuous support, encouragement, advice and<br />
criticism. Financial support from the Belgian Ministry<br />
of Science Policy (DPWB) and from the University<br />
of Antwerp (U.I.A.), for one of the authors<br />
(SVN) and from the International Center for The-
Vol. 16, No. 3/4 219<br />
oretical Physics (ICTP), Trieste for another author<br />
(IU) is gratefully acknowledged.<br />
VI. References<br />
[I] I. Ursu, La Resonance Paramagnetique Electronique,<br />
Dunod, Paris, 1968 (in french).<br />
[2] A. Abragam and B. Bleaney, Electron Paramagnetic<br />
Resonance of Transition Ions, Clarendon<br />
Press, Oxford, 1970.<br />
[3] S. Altshuler and B. M. Kozyrev, Electron Paramagnetic<br />
Resonance in Compounds of Transition<br />
Elements, Wiley, New York, 1974.<br />
[4] M. Narayana, V. S. Sivasankar and S. Radhakrishna,<br />
Phys. Stat. Sol. blO5, 11 (1981).<br />
[5] G. D. Sootha and S. K. Agarwal, Phys. Stat. Sol.<br />
a5, 293 (1971).<br />
[6] C. P. Poole Jr. and H. A. Farach, The Theory<br />
of Magnetic Resonance, Interscience, New York,<br />
1972.<br />
[7] C. J. Delbecq, B. Smaller and P. H. Yuster,<br />
Phys. Rev. Ill, 1235 (1958); ibid. 121, 1043<br />
(1961).<br />
[8] C. J. Delbecq, A. K. Gosh and P. H. Yuster,<br />
Phys. Rev. 151, 599 (1966); ibid. 154, 797 (1967).<br />
[9] C. J. Delbecq, W. Hayes, M. C. M. O'Brian and<br />
P. H. Yuster, Proc. Roy. Soc. A271, 243 (1963).<br />
[10] E. Goovaerts, J. Andriessen, S. V. Nistor and<br />
D. Schoemaker, Phys. Rev. B24, 29 (1981).<br />
[II] F. Van Steen and D. Schoemaker, Phys. Rev.<br />
B19, 55 (1979).<br />
[12] F. Aggullo-Lopez, C. R. A. Catlow and P.<br />
D. Townsend, Point Defects in Materials, Acad.<br />
Press, New York, 1988.<br />
[13] N. Itoh, Adv. Phys. 31, 491 (1982).<br />
[14] C. J. Delbecq, R. Hartford, D. Schoemaker and<br />
P. H. Yuster, Phys. Rev. B31, 3631 (1976).<br />
[15] N. I. Melnikov, P. G. Baranov, R. A. Zhitnikov<br />
and N. G. Romanov, Sov. Phys. - Solid State 13,<br />
1909 (1971).<br />
[16] N. I. Melnikov, R. A. Zhitnikov and P. G. Baranov,<br />
Sov. Phys. - Solid State 14, 753 (1972).<br />
[17] F. Luty, F^-Centers in Alkali Halides, in<br />
Physics of Color Centers, ed. W. Beall Fowler,<br />
Acad. Press, New York 1968.<br />
[18] W. Van Puymbroeck, J. Andriessen and D.<br />
Schoemaker, Phys. Rev. B24, 2412 (1981).<br />
[19] V. Topa, Rev. Roum. Phys. 12, 781 (1967).<br />
[20] W. Kleeman, Z. Phys. 214, 285 (1968).<br />
[21] E. Goovaerts, S. V. Nistor and D. Schoemaker,<br />
Phys. Rev. B25, 83 (1982).<br />
[22] S. V. Nistor, Solid State Commun. 66, 995<br />
(1988).<br />
[23] E. Goovaerts, S. V. Nistor and D. Schoemaker,<br />
Phys. Rev. B42, 3810 (1990).<br />
[24] S. M. Muradov, M. H. Muradova and M. A.<br />
Elango, Sov. Phys. - Solid State 11, 2553 (1970).<br />
[25] E. Kratzig, T. Timusk and W. Martienssen,<br />
Phys. Stat. Sol. 10, 709 (1965).<br />
[26] N. I. Melnikov, R. A. Zhitnikov and V. A.<br />
Khramtsov, Sov. Phys. - Solid State 17, 2129<br />
(1976).<br />
[27] K. Suto and M. Aoki, J. Phys. Soc. Jpn. 22,<br />
1307 (1967).<br />
[28] T. Tsuboi, Phys. Rev. B21, 5846 ( 1980).<br />
[29] I. Heynderickx, E. Goovaerts, S. V. Nistor and<br />
D. Schoemaker, Phys. Stat. Sol. bl36, 69 (1986).<br />
[30] J. R. Morton and K. F. Preston, J. Magn. Res.<br />
30, 577 (1978).<br />
[31] R. A. Zhitnikov, V. B. Koltsov and N. I. Melnikov,<br />
Phys. Stat. Sol. 26, 371 (1968).<br />
[32] F. F. Popescu and V. V. Grecu, Solid State<br />
Commun. 13, 749 ( 1973).<br />
[33] G. Wessel and H. Lew, Phys. Rev. 92, 641<br />
(1953).<br />
[34] P. H. Kasai, Phys. Rev. Lett. 21, 67 (1968).<br />
[35] F. J. Major and G. Werth, Phys. Rev. Lett. 30,<br />
1155 (1973).
220 Bulletin of Magnetic Resonance<br />
[36] N. S. Dalai, D. Nettar and P. Grandinetti, J.<br />
Am. Chem. Soc. 104, 2054 (1982).<br />
[37] M. F. Crawford and A. L. Schawlow, Phys. Rev.<br />
76, 1310 (1949).<br />
[38] A. L. Schwalow, T. N. P. Hume and M. F.<br />
Crawford, Phys. Rev. 76, 1876 (1949).<br />
[39] G. Breit and I. I. Rabi, Phys. Rev. 38, 208,<br />
(1931).<br />
[40] G. E. Pake and T. L. Estle, The Physical Principles<br />
of Paramagnetic Resonance, 2 nd ed., Benjamin<br />
Inc., Reading, Mass. 1973.<br />
[41] V. N. Efimov, N. I. Silkin, V. G. Stepanov and<br />
L. A. Trofanchuk, Sov. Phys. - Solid State 21,<br />
1464 (1979).<br />
[42] B. Andlauer, J. Schneider and W. Tolksdorf,<br />
Phys. Rev. B8, 1 (1973).<br />
[43] M. I. Matta, B. D. Sukheeja and M. L.Norchal,<br />
J. Phys. Chem. Sol. 33, 2179 (1972).<br />
[44] F. F. Popescu and V. V. Grecu, Phys. Stat. Sol.<br />
b68, 595 (1975).<br />
[45] T. I. Kabakova, V. F. Krutikov, N. I. Silkin and<br />
V. G. Stepanov, Sov. Phys. - Solid State 17, 341<br />
(1975).<br />
[46] J. A. Weil, J. Magn. Res. 4, 394 (1971).<br />
[47] V. V. Grecu, F. F. Popescu and V. Popescu,<br />
Experimental Trends in Physics, p. 117, Ed. ICE-<br />
FIZ, Bucuresti, 1979.<br />
[48] H. Kawazoe, H. Hosono and J. Nishii, J. Chem.<br />
Phys. 76, 3422 (1982).<br />
[49] C. J. Ballhausen and H. B. Gray, Molecular<br />
Orbital Theory, W. A. Benjamin Inc., New York,<br />
1964.<br />
[50] D. Bramanti, M. Mancini and A. Ranfagni,<br />
Phys. Rev. B3, 3670 (1971).<br />
[51] M. Moreno, J. Phys. C12, L921 (1979); ibid.<br />
Solid State Commun. 29, 653 (1979).<br />
[52] W. Dreybrodt and D. Silber, Phys. Stat. Sol.<br />
20, 337 (1967).<br />
[53] H. Watanabe, Phys. Rev. 149, 402 (1966).<br />
[54] J. Owen and J. H. M. Thornley, Rep. Progr.<br />
Phys. 29, 675 (1966).<br />
[55] F. Herman and S. Skillman, Atomic Structure<br />
Calculations, Prentince Hall, Engelwood Cliffs,<br />
New Jersey, 1963.<br />
[56] W. Frey, R. Huss, H. Seidel and E. Werkmann,<br />
Phys. Stat. Sol. b68, 257 (1975).<br />
[57] T. Iida, J. Phys. Chem. Sol. 33, 1423 (1972).<br />
[58] H. W. Etzel and J. H. Schulman, J. Chem.<br />
Phys. 22, 1549 (1954).<br />
[59] P. G. Baranov, R. A. Zhitnikov and V. A.<br />
Khramtsov, Phys. Stat. Sol. b76, K109 (1976);<br />
ibid. Sov. Phys. - Solid State 19, 1184 (1977).<br />
[60] H. Wegerle, Phys. Lett. 27A, 87 (1968); ibid.<br />
Proc. 16th Coll. AMPERE, Bucuresti, 1970, ed.<br />
I. Ursu, Publ. House of the Acad. RSR, Bucuresti<br />
1970, p.235.<br />
[61] P. G. Baranov, R. A. Zhitnikov and N. G. Romanov,<br />
Sov. Phys. - Solid State 18, 1013 (1976).<br />
[62] N. Takeuki, K. Inabe, H. Kido and M. Adachi,<br />
J. Appl. Phys. 18, 1183 (1979).<br />
[63] P. G. Baranov, Yu. P. Veshchunov, R. A. Zhitnikov<br />
and N. G. Romanov, Phys. Stat. Sol. b79,<br />
K27 (1977).<br />
[64] P. G. Baranov, Yu. P. Veshchunov, R. A. Zhitnikov<br />
and N. G. Romanov, Opt. i Spectr. 50, 479<br />
(1981) (in russian).<br />
[65] I. K. Amanis and J. G. Kliava, Phys. Stat. Sol.<br />
a41, 385 (1977).<br />
[66] M. T. Barriuso and M. Moreno, Phys. Rev.<br />
B26, 2271 (1982).<br />
[67] P. G. Baranov, R. A. Zhitnikov and N. I. Melnikov,<br />
Phys. Stat. Sol. 33, 463 (1969).<br />
[68] F. J. Adrian, J. Chem. Phys. 32, 972 (1960).<br />
[69] A. G. Badalyan, P. G. Baranov, V. S. Vikhin,<br />
M. H. Petrosyan and V. A. Khramtsov, Sov. Phys.<br />
- Sold State 29, 268 (1987).<br />
[70] P. G. Baranov, R. A. Zhitnikov and N. I. Melnikov,<br />
Phys. Stat. Sol. 30, 851 (1968); ibid, 30,<br />
859 (1968).
Vol. 16, No. 3/4 221<br />
[71] G. E. Holmberg, W. P. Unruh and R. J. Friauf,<br />
Phys. Rev. B13, 983 (1976).<br />
[72] H. Seidel, Phys. Lett. 6, 150 (1963).<br />
[73] N. I. Melnikov, R. A. Zhitnikov and P. G. Baranov,<br />
Sov. Phys. - Solid State 13, 1117 (1971).<br />
[74] A. G. Badalyan, P. G. Baranov and R. A. Zhitnikov,<br />
Sov. Phys. - Solid State 17, 2124 (1976);<br />
ibid., 18, 2154 (1976).<br />
[75] N. I. Melnikov, P. G. Baranov and R. A. Zhitnikov,<br />
Phys. Stat. Sol. b46, K73 (1971).<br />
[76] N. I. Melnikov, R. A. Zhitnikov and P. G. Baranov,<br />
Sov. Phys. - Solid State 14, 1488 (1972).<br />
[77] I. K. Amanis, I. G. Kliava and J. J. Puranis,<br />
Phys. Stat. Sol. b89, 531 (1978).<br />
[78] Y. Ravi Sekhar and H. Bill, Phys. Stat. Sol.<br />
bl43, Kill (1987).<br />
[79] P. G. Baranov, R. A. Zhitnikov and N. I. Melnikov,<br />
Sov. Phys. - Solid State 14, 1876 (1972).<br />
[80] V. I. Krutikov, N. I. Silkin and V. G. Stepanov,<br />
in Paramagnitnii Rezonans, v.9, p.242. Izd.<br />
Kazan Univ., 1974 (in russian).<br />
[81] V. F. Krutikov, N. I. Silkin and V. G. Stepanov,<br />
Sov. Phys. - Solid State 13, 505 (1971).<br />
[82] P. G. Baranov, Sov. Phys. - Solid State 25, 507<br />
(1983).<br />
[83] N. I. Melnikov, R. A. Zhitnikov and P. G. Baranov,<br />
Sov. Phys. - Solid State 14, 1013 (1972).<br />
[84] R. A. Zhitnikov, P. G. Baranov and N. I. Melnikov,<br />
Phys. Stat. Sol. b59; Kill (1973).<br />
[85] V. F. Krutikov, N.I. Silkin and V. G. Stepanov,<br />
Sov. Phys. - Solid State 17, 2201 (1976).<br />
[86] S. C. Jain and S. Radhakrishna, Phys. Rev.<br />
172, 972 (1968).<br />
[87] L. Ben-Dor, A. Glasner and S. Zolotov. Phys.<br />
Stat. Sol. 18, 593 (1966).<br />
[88] R. A. Zhitnikov, N. I. Melnikov and P. G. Baranov,<br />
Phys. Stat. Sol. 35, K81 (1969).<br />
P. G. Baranov, R. A. Zhitnikov, N. G. Zaharov<br />
and N. G. Romanov, Sov. Phys. - Solid State 18,<br />
2099 (1976).<br />
[90] P. G. Baranov, R. A. Zhitnikov and V. A.<br />
Khramtsov, Sov. Phys. - Solid State 18, 340<br />
(1976); ibid. 19, 2105 (1977).<br />
[91] P. G. Baranov, R. A. Zhitnikov and N. I. Melnikov,<br />
Sov. Phys. - Solid State 15, 2353 (1974).<br />
[92] Y. Toyotomi and R. Onaka, j. Phys. Soc. Jpn.<br />
34, 623 (1973).<br />
[93] V. F. Krutikov, N. I. Silkin and V. G. Stepanov,<br />
Sov. Phys. - Solid State 18, 1725 (1976).<br />
[94] V. F. Krutikov, N. I. Silkin and V. G. Stepanov,<br />
Sov. Phys. - Solid State 13, 2601 (1972).<br />
[95] N. M. Grecu, Rev. Roum. Phys. 36, 875 (1991).<br />
[96] D. Barb, N. M. Grecu, V. V. Grecu and F. F.<br />
Popescu, Chem. Phys. Lett. 56, 355 (1978).<br />
[97] E. Simanek and R. Orbach, Phys. Rev. 145,<br />
191 (1966).<br />
[98] I. Ursu and S. V. Nistor, Invited lecture, Proc.<br />
23th Congr. AMPERE, Roma 1986, p.95, eds. B.<br />
Maraviglia, F. de Luca and R. Campanela, Ed.<br />
1st. Super, di Sanita, Roma, 1986.<br />
[99] P. G. Baranov and V. A. Khramtsov, Sov.<br />
Phys.- Solid State 20, 1080 (1978).<br />
[100] P. G. Baranov and V. A. Khramtsov, Sov.<br />
Phys.- Solid State 21, 839 (1979).<br />
[101] E. Goovaerts, S. V. Nistor and D. Schoemaker,<br />
Phys. Rev. B28, 3712 (1983).<br />
[102] D. Schoemaker, E. Goovaerts and S. V. Nistor,<br />
Bull. Am. Phys. Soc. 23, 200 (1970).<br />
[103] S. V. Nistor, M. Velter-Stefanescu and C. D.<br />
Mateescu, Solid State Commun. 81, 215 (1992).<br />
[104] J. J. Davies and J. E. Nicholls, J. Phys. C12,<br />
3329 (1979).<br />
[105] A. Rauber and J. Schneider, Phys. Stat. Sol.<br />
18, 125 (1966).<br />
[106] A. Rauber and J. Schneider, Phys. Rev. Lett.<br />
16, 1075 (1966).
222 Bulletin of Magnetic Resonance<br />
[107] J. E. Nicholls and J. J. Davies, J. Phys. C13,<br />
2393 (1980).<br />
[108] W. C. Holton and R. K. Watts, J. Chem.<br />
Phys. 51, 1615 (1969).<br />
[109] G. D. Watkins, in Radiation Damage in Semiconductors,<br />
Acad. Press, New York 1964, p.97.<br />
[110] D. Block, A. Herve and R. T. Cox, Phys. Rev.<br />
B52, 6049 (1982).<br />
[Ill] M. V. Eremin and N. I. Silkin, Phys. Stat. Sol.<br />
b84, 803 (1977).<br />
[112] R. L. Garifulina, V. F. Krutikov, N. I. Silkin<br />
and V. G. Stepanov, Sov. Phys. - Solid State 14,<br />
525 (1972).<br />
[113] L. K. Aminov, I. N. Kurkin, N. I. Silkin and<br />
V. I. Shlenkin, Phys. Stat. Sol. b72, 97 (1975).<br />
[114] T. B. Bogatova, I. Kh. Salikhov, V. G.<br />
Stepanova and L. A. Trofanchuk, Sov. Phys. -<br />
Solid State 25, 1591 (1983).<br />
[115] L. V.Gonzaga, I. F. Sampaio, G. M. Ribeiro,<br />
A. S. Chaves, R. Gazzinelli and R. Blinc, J. Phys.<br />
Soc. Jpn. 51, 540 (1982).<br />
[116] F. F. G. Guiares, A. S. Chaves, G. M. Ribeiro<br />
and R. Gazzinelli, J. Phys.: Condens. Mat. 4,<br />
6467 (1992).<br />
[117] G. M. Ribeiro, L. V. Gonzaga, L. V. Chaves,<br />
R. Gazzinelli, R. Blinc, P. Cevc, P. Prelovsek and<br />
N. I. Silkin, Phys. Rev. B25, 311 (1982).<br />
[118] D. N. Domingues, A. S. Chaves, G. M. Ribiero<br />
and R. Gazzinelli, Solid State Commun. 47, 665<br />
(1983).<br />
[119] R. C. Du Varney and A. K. Garrison, Phys.<br />
Rev. B12, 10 (1975).<br />
[120] V. N. Asimov, N. I. Silkin, V. G. Stepanova<br />
and L. A. Profanchuk, Sov. Phys. - Solid State<br />
21, 1464 (1979).<br />
[121] J. H. Machey, J. Chem. Phys. 39, 74 (1963).<br />
[122] A. G. Badalyan, P. G. Baranov, V. A.<br />
Khramtsov, B. Iliescu and V. Topa, Sov. Phys.<br />
- Solid State 27, 1192 (1985).<br />
[123] A. R. Boate, J. R. Morton and K. F.Preston,<br />
J. Phys. Chem. 82, 718 (1978).<br />
[124] K. Sugibuchi and Y. Mita, Phys. Rev. 147,<br />
355 (1966).<br />
[125] K. Suto and M. Aoki, J. Phys. Soc. Jpn. 24,<br />
955 (1968).<br />
[126] G. Brunthaler, W. Jantsch, U. Kaufmann and<br />
J. Schneider, Phys. Rev. B31, 1239 (1985).<br />
[127] R. Bottecher and J. Dziesiaty, Phys. Stat. Sol.<br />
31, K71 (1969).<br />
[128] J. H. Anderson and J. A. Veil, J. Chem. Phys.<br />
31, 427 (1959).<br />
[129] Y. Haven, A. Kats and J. S. Van Wieringen,<br />
Philips Res. Repts. 21, 446 (1966).<br />
[130] D. Backs and H. J. Freyer, Phys. Stat. Sol.<br />
bill, 117 (1982).<br />
[131] V. A. Khramtsov, V. A, Vetrov and P. G.<br />
Baranov, Sov. Phys. - Solid State 22, 524 (1980).<br />
[132] V. Seeman, Zh. Egemberdiev, U. Haldre, T.<br />
Lehto, K. Realo, S. Reifman and S. Zazubovich,<br />
in Proc. 22th Congr. AMPERE, ed. E. Kundla, E.<br />
Lippmaa and T. Saluvere, Springer, Berlin, 1978,<br />
p.278.<br />
[133] R. J. Booth, H. C. Starkie and M. C. R.<br />
Symons, J. Phys. Chem. 76, 141 (1972).<br />
[134] K. Sugibuchi, Phys. Rev. 153, 404 (1967).<br />
[135] A. Hausmann and P. Schreiber, Z. Phys. 245,<br />
184 (1971).<br />
[136] S. V. Nistor, A. Bouwen and D. Schoemaker,<br />
Phys. Stat. Sol. bl45, K135(1988).<br />
[137] S. V. Nistor and D. Schoemaker, Rev. Roum.<br />
Phys. 33, 781 (1988).<br />
[138] D. Schoemaker and J. L.Kolopus, Solid State<br />
Commun. 8, 435 (1970).<br />
[139] Yu. A. Mikheev and V. G. Stepanov, Sov.<br />
Phys. - Solid State 27, 1915 (1985).<br />
[140] M. Nishi, H. Hara, Y. Ueda and Y. Kazumata,<br />
J. Phys. Soc. Jpn. 42, 1900 (1977).
Vol. 16, No. 3/4 223<br />
[141] J- L. Kolopus, C. B. Finch and M. M. Abraham,<br />
Phys. Rev. B2, 2040 (1970).<br />
[142] R. Rohrig and J. Schneider, Phys. Lett. 30A,<br />
371 (1969).<br />
[143] V. F. Koryagin and B. N. Grechushnikov, Sov.<br />
Phys. - Cristallogr. 15, 857 (1971).<br />
[144] G. Born, A. Hofstaetter and A. Scharmann,<br />
Phys. Lett. 36A, 447 (1971).<br />
[145] R. M. Mineeva and L. V. Berskov, Sov. Phys.<br />
- Solid State 11, 653 (1969).<br />
[146] G. Born, A. Hofstaetter, A. Scharmann and<br />
B. Vitt, Phys. Stat. Sol. 37, 255 (1970).<br />
[147] G. Born, A. Hofstaetter and W. Tolksdorf,<br />
Phys. Stat. Sol. b66, 305 (1974).<br />
[148] M. M. Abraham, L. A. Boatner and M. Rappaz,<br />
Phys. Rev. Lett. 45, 839 (1980).<br />
[149] R. M. Bilbe, J. E. Nicholls and J. J. Davies,<br />
Phys. Stat. Sol. bl21, 339 (1984).<br />
[150] K. Suto and M. Aoki, J. Phys. Soc. Jpn. 26,<br />
287 (1969).<br />
[151] N. Yamashita and S. Asano, J. Phys. C9, 165<br />
(1976).<br />
[152] F. F. Popescu and V. V. Grecu, J. Phys. C15,<br />
1547 (1982).<br />
[153] T. Iida and H. Watanabe, Phys. Lett. A26,<br />
541 (1968).<br />
[154] A. R. Boate, J. R. Morton and K. F. Preston,<br />
Chem. Phys. Lett. 50, 65 (1977).<br />
[155] A. R. Boate, J. R. Morton and K. F. Preston,<br />
J. Chem. Phys. 67, 4302 (1977).
224 Bulletin of Magnetic Resonance<br />
Contents<br />
Survey of the EPR Community on the EPR Database<br />
and Related Projects<br />
Czeslaw Rudowicz<br />
Department of Physics- and Materials Science<br />
City Polytechnic (University from 1994/95) of Hong Kong<br />
Kowloon Hong Kong<br />
I. Introduction 224<br />
II. Questionnaires and analysis of responses 224<br />
A. EPR-Q: The Future of EPR Spectroscopy of Transition Ions 225<br />
B. P-EPR: Planning EPR-database structure 231<br />
C. ML: Membership aspects 234<br />
III. Concluding remarks 236<br />
IV. References 238<br />
I. Introduction<br />
EPR studies provide a wealth of information,<br />
which can be best utilized if available in a computersearchable<br />
form. Establishment of a computerized<br />
EPR-related database would require, among<br />
other things, standardization of notations and units.<br />
These proposals have been put forward to the International<br />
EPR (ESR) Society [IES] in the two<br />
submissions in August 1990 (1): On Unification of<br />
Notations Used in EPR and On Establishment of a<br />
Computerized EPR-related Database and the EPR<br />
community (2). A feasibility study of the EPRrelated<br />
database project followed starting in early<br />
1991. The objectives of the pilot study were: (i) to<br />
find out the opinions of the EPR community concerning<br />
the above two proposals, (ii) to investigate<br />
the users' requirements and identify the data needs,<br />
and (iii) to work out a Feasibility Study Report for<br />
consideration by the IES.<br />
The present survey and the proposed EPR<br />
database project are perceived as a service to the<br />
EPR community under the auspices of IES. The<br />
idea of an EPR database has also been discussed<br />
at the EPR meetings held in Denver [EPR Newsletter<br />
[EN] 4/3, 7 (1992); 5/2, 5 (1993)]. A poster<br />
summarizing the preliminary results of this study<br />
has been presented at the EPR Symposium in Denver<br />
(3). In this paper the results of the analysis<br />
of the 70 plus valid responses received to date are<br />
presented.<br />
II. Questionnaires<br />
of responses<br />
and analysis<br />
For a meaningful analysis of responses the pertinent<br />
background on the stages of the project and<br />
working out of the questionnaires is important. The<br />
project started with the setting up of a namelist<br />
of EPR researchers working mainly in the area of<br />
transition-metal and rare-earth ion - EPR studies in<br />
early 1991. The namelist, complied using dBASE-<br />
IV, was based on an extensive survey of literature<br />
published since 1980 onwards and supplemented<br />
with addresses received from private contacts with<br />
EPR researchers. The questionnaire, The Future<br />
of EPR Spectroscopy of Transition Ions [EPR-Q]<br />
(1,2), has served as an initial test for working out the<br />
main questionnaire, Planning EPR-database Structure<br />
[P-EPR], in mid-1991. Included in the main<br />
set [EPR-DB], apart from P-EPR, were the addi-
Vol. 16, No. 3/4 225<br />
tional questionnaires: Mailing List for Future Issues<br />
[ML] and EPR-related Conferences [EPR-Con].<br />
The full set of questionnaires, i.e. EPR-Q and<br />
EPR-DB, and the two submissions, accompanied<br />
by an Open letter to EPR community members, have<br />
been dispatched to about 800 researchers in late<br />
1991 and successively to over 100 more researchers<br />
thereafter. The paper (2), where the rationale for<br />
standardization of symbols in EPR was detailed and<br />
pertinent references were given, had also been enclosed.<br />
The analysis of responses began in mid-1992.<br />
In order to increase the number of responses a note<br />
on the project has been placed in EN [3/4, 6 (1991)]<br />
distributed in early 1992. However, it has generated<br />
but a few additional responses.<br />
The geographical distribution of responses is presented<br />
in Table 1. There are two types of responses:<br />
(i) Full, i.e. responses to the full set of questionnaires<br />
(EPR-Q and EPR-DB), and (ii) EPR-Q,<br />
i.e. responses to EPR-Q only. The rate of response<br />
(%) is calculated including both (i) and (ii) with respect<br />
to the total number of EPR-DB sets sent.<br />
Some special cases are also indicated in Table 1.<br />
In several cases the envelopes with EPR-DB have<br />
been returned as 'undelivered' mail or the person<br />
has indicated only that he/she has 'left the field' of<br />
EPR in the meantime. In a few instances 'Mailing<br />
list only'has been returned. The mailing of the<br />
EPR-DB questionnaires coincided with the major<br />
changes on the political map of Europe. Since it<br />
was difficult to accomodate these changes explicitly<br />
in our geographical listing, the new countries are<br />
considered jointly under the former name indicated<br />
by an asterisk, whereas the responses from the West<br />
and East Germany were merged. Several responses<br />
have been received after the analysis of data was<br />
completed. Including these responses would slightly<br />
increase the total response ratio in Table 1. The<br />
overall response ratio of about 8-9% is disappointingly<br />
low. We don't think, however, that this lack of<br />
attention is malicious; rather it is due to the natural<br />
tendency of (very busy) people to focus on their<br />
own immediate problems.<br />
The results of the analysis of responses are organized<br />
into three parts concerned with (A) EPR-Q<br />
- in Figures 1 to 5, (B) P-EPR - in Figures 6 to 12<br />
and Table 2 and 3, and (C) ML - only the aspects<br />
pertinent to the membership of the EPR community<br />
are included here.<br />
A. EPR-Q: The Future of EPR Spectroscopy<br />
of Transition Ions<br />
For the questions in Figure 1 the lack of answer<br />
(no answer) and the no opinion answer are<br />
merged, while the firm no answer is indicated explicitly.<br />
For the question A7.1 in Figure 2 the of<br />
minor use and negligible use answers are merged,<br />
yielding 6%, whereas the combined percentage of<br />
the very useful and useful answers is 91%. This indicates<br />
a very strong support for the idea of a comprehensive<br />
computerized EPR database. Financial<br />
viability of the EPR database looks promising gauging<br />
from the percentage of the potential subscribers:<br />
14% very likely and 65% probably. Hence the end<br />
product of the EPR database project is likely to become<br />
a saleable commodity.<br />
The overwhelming support by respondents for<br />
all other proposals dealt with in Figures 1 and 2<br />
is evident, except for the financial commitments regarding<br />
development of an all-purpose user-friendly<br />
EPR computer package [Figure 2, A6.2(ii)]. The responses<br />
indicate that a strong need exists within the<br />
EPR community for (i) the internationally accepted<br />
standards on EPR nomenclature and conventions<br />
and (ii) a glossary of terms used in EPR (Figure<br />
1) as well as (iii) an EPR computer package (Figures<br />
1 and 2). The first two proposals can only be<br />
successfully dealt with if cooperation between IS-<br />
MAR, IES and IUPAC, at a proper level, can be<br />
ensured. The author's attempts to bring about such<br />
cooperation have not been successful so far. Possibility<br />
of cooperation on these and related projects<br />
with AMPERE Society and regional EPR/ESR societies<br />
should also be investigated. The extension<br />
to the spin S>l/2 systems of the Recommendations<br />
for EPR/ESR Nomenclature and Conventions for<br />
presenting experimental data in publications [(4); cf<br />
also EN 3/1, 9 (1991)], dealing only with the S = 1/2<br />
systems, is crucial for the EPR database project<br />
(2). To the best of our knowledge, the work on<br />
this extension, planned under the auspicies of IU-<br />
PAC Commission 1.5 (5), has not continued. The<br />
lack of financial resources and manpower seems to<br />
be the major obstacle in pursuing these proposals.<br />
The situation is better with regard to the EPR<br />
computer programs, due to efforts of Prof. R. Cammack,<br />
Chairman of the IES Computer Software<br />
Committee, who has complied a database of available<br />
EPR programs [EN 4/3, 6 (1992)]. The names
226<br />
Bulletin of Magnetic Resonance<br />
GA<br />
AF<br />
AP<br />
EU<br />
LA<br />
NA<br />
Table<br />
Country<br />
South Africa<br />
Zimbabwe<br />
subtotal<br />
Australia<br />
China<br />
Hong Kong<br />
India<br />
Israel<br />
Japan<br />
New Zealand<br />
South Korea<br />
Taiwan<br />
Vietnam<br />
subtotal<br />
Belgium<br />
Bulgaria<br />
CIS (f. USSR)*<br />
Czechoslovakia*<br />
Denmark<br />
France<br />
Germany*<br />
Greece<br />
Hungary<br />
Italy<br />
Netherlands<br />
Poland<br />
Portugal<br />
Romania<br />
Spain<br />
Sweden<br />
Switzerland<br />
Turkey<br />
UK<br />
Yugoslavia*<br />
subtotal<br />
Argentina<br />
Brazil<br />
Mexico<br />
Venezuela<br />
subtotal<br />
Canada<br />
USA<br />
subtotal<br />
total<br />
': Geographical Distribution o:<br />
No.<br />
Sent<br />
1<br />
1<br />
2<br />
27<br />
16<br />
1<br />
34<br />
2<br />
78<br />
8<br />
5<br />
5<br />
1<br />
177<br />
11<br />
3<br />
128<br />
14<br />
1<br />
69<br />
65<br />
3<br />
10<br />
26<br />
38<br />
28<br />
1<br />
5<br />
28<br />
2<br />
18<br />
3<br />
36<br />
5<br />
366<br />
6<br />
21<br />
4<br />
6<br />
37<br />
23<br />
156<br />
179<br />
889<br />
Response<br />
Full<br />
0<br />
0<br />
0<br />
3<br />
3<br />
1<br />
3<br />
0<br />
2<br />
0<br />
1<br />
0<br />
0<br />
13<br />
1<br />
0<br />
12<br />
2<br />
0<br />
1<br />
1<br />
2<br />
2<br />
1<br />
2<br />
4<br />
0<br />
1<br />
3<br />
0<br />
1<br />
1<br />
2<br />
0<br />
24<br />
0<br />
1<br />
0<br />
0<br />
1<br />
1<br />
6<br />
7<br />
57<br />
EPR-Q<br />
0<br />
0<br />
0<br />
1<br />
1<br />
0<br />
2<br />
0<br />
1<br />
0<br />
0<br />
0<br />
0<br />
5<br />
0<br />
0<br />
1<br />
0<br />
0<br />
0<br />
4<br />
0<br />
0<br />
0<br />
1<br />
1<br />
0<br />
0<br />
0<br />
0<br />
0<br />
0<br />
0<br />
0<br />
6<br />
0<br />
0<br />
0<br />
0<br />
0<br />
0<br />
4<br />
4<br />
16<br />
%<br />
0.0<br />
0.0<br />
0.0<br />
14.8<br />
25.0<br />
100.0<br />
14.7<br />
0.0<br />
3.8<br />
0.0<br />
20.0<br />
0.0<br />
0.0<br />
10.2<br />
9.1<br />
0.0<br />
10.2<br />
14.3<br />
0.0<br />
1.4<br />
7.7<br />
66.7<br />
20.0<br />
3.8<br />
7.9<br />
17.9<br />
0.0<br />
20.0<br />
10.7<br />
0.0<br />
5.6<br />
33.3<br />
5.6<br />
0.0<br />
8.2<br />
0.0<br />
4.8<br />
0.0<br />
0.0<br />
2.7<br />
4.3<br />
6.4<br />
6.1<br />
8.2<br />
Responses<br />
Unde-<br />
livered<br />
0<br />
0<br />
0<br />
1<br />
1<br />
0<br />
0<br />
0<br />
7<br />
0<br />
0<br />
0<br />
0<br />
8<br />
0<br />
0<br />
7<br />
0<br />
0<br />
1<br />
0<br />
0<br />
1<br />
0<br />
7<br />
0<br />
0<br />
0<br />
0<br />
0<br />
1<br />
0<br />
2<br />
0<br />
12<br />
0<br />
0<br />
0<br />
0<br />
0<br />
1<br />
9<br />
10<br />
37<br />
Left the<br />
field<br />
0<br />
0<br />
0<br />
0<br />
1<br />
0<br />
0<br />
0<br />
0<br />
1<br />
0<br />
0<br />
0<br />
2<br />
0<br />
0<br />
0<br />
0<br />
0<br />
1<br />
1<br />
0<br />
0<br />
0<br />
0<br />
0<br />
0<br />
0<br />
0<br />
0<br />
1<br />
0<br />
1<br />
0<br />
4<br />
0<br />
0<br />
0<br />
0<br />
0<br />
0<br />
0<br />
0<br />
6<br />
Mailing<br />
list only<br />
0<br />
0<br />
0<br />
0<br />
0<br />
0<br />
0<br />
0<br />
1<br />
0<br />
0<br />
0<br />
0<br />
1<br />
0<br />
0<br />
1<br />
0<br />
0<br />
1<br />
0<br />
0<br />
0<br />
0<br />
0<br />
0<br />
0.<br />
0<br />
0<br />
0<br />
0<br />
0<br />
0<br />
0<br />
1<br />
0<br />
0<br />
0<br />
0<br />
0<br />
1<br />
2<br />
3<br />
6
Vol. 16, No. 3/4 227<br />
Compound<br />
AMX3<br />
A2MX2<br />
Table 2: Compounds by Molecular Formula or Specific Ion<br />
A2MX4<br />
[A=alkaline; M=divalent; X=O,F]<br />
ABF6-6H2O<br />
[A=Mn 2+ , Ni 2+ , Cu 2+ , Co 2+ ,<br />
Fe 2 +, Zn 2+ , Cd 2+ , Mg 2+ , Ca 2+ ;<br />
B=Si 4+ , Ge 4+ , Ti 4 +, Zr 4 +, Mg 4+ ]<br />
BGO<br />
Bi2Sr2Ca2Cr3O4<br />
BiVO4<br />
BSO<br />
CaF2, Cai_xSrxF2<br />
Ca2Fe205<br />
Ca3Ga2Ge3Oi3<br />
Ca3Ga2Ge4Oi4<br />
CaO - systems<br />
Ga2C>3 - systems<br />
GeO2 - systems<br />
CdTe<br />
Co 2+ compounds<br />
Material<br />
Apatites<br />
Biomolecular<br />
Catalysts ceramics<br />
Complex with chelate ligands<br />
Diamond like crystals<br />
Disordered solid<br />
Ferroelectric materials<br />
Fluorites<br />
Garnets<br />
Germanium<br />
Glasses<br />
Graphite intercalation compounds<br />
Halides<br />
Freq.<br />
5<br />
1<br />
2<br />
2<br />
1<br />
1<br />
3<br />
1<br />
1<br />
1<br />
1<br />
1<br />
1<br />
1<br />
1<br />
1<br />
1<br />
Compound<br />
Co2Si04<br />
Cr 3+ compounds<br />
Fe 2+ compounds<br />
Fe 3+ compounds<br />
Gd 3+ compounds<br />
LaGaC-3<br />
Li(RE)F4 [RE=Y, Yb, Dy, Er]<br />
LiH<br />
LiNbO3<br />
LiOH<br />
Mn 2+ compounds<br />
MX2<br />
NdGaO3<br />
PbTe<br />
PrGaO3<br />
Rb2MnxCr1_xCl4<br />
REnXmOt [RE=Rare earth ions]<br />
Sn_xBaxF2<br />
XmOi [X=P, V, As, Al, Ti, Nb, Si, Bi]<br />
Y2Ba2Cu307_8<br />
Table 3: Materials by Name of Specific Group<br />
Fxeq.<br />
1<br />
6<br />
1<br />
1<br />
1<br />
2<br />
3<br />
2<br />
1<br />
2<br />
2<br />
5<br />
Material<br />
Inorganic compounds<br />
Ionic crystals<br />
Magnetic materials<br />
Minerals<br />
Optoelectronic materials<br />
Organic compound<br />
Oxides<br />
Paraelectric crystals<br />
Piezoelectric crystals<br />
Free radicals<br />
Spin traps<br />
Superconducting materials<br />
Transition-metal ion compounds<br />
Freq.<br />
5<br />
2<br />
1<br />
2<br />
1<br />
T-H 4<br />
2<br />
.1<br />
4<br />
1<br />
5<br />
3<br />
Freq.<br />
1<br />
1<br />
1<br />
2<br />
1<br />
1<br />
1<br />
1<br />
3<br />
1<br />
2<br />
1<br />
1<br />
1<br />
1<br />
1<br />
1<br />
1<br />
1<br />
1
228<br />
Al<br />
A2<br />
A6.1<br />
A8.1<br />
94%" 6%<br />
90% 7%<br />
89% , 10%<br />
76% 24%<br />
10 20 30 40 50<br />
Frequency<br />
Bulletin of Magnetic Resonance<br />
60 70 80<br />
I yes no D no opinion and no answer<br />
Figure 1: Answers to Al, A2, A6.1 and A8.1.<br />
Al-Would you find it useful if there were internationally accepted standards on EPR nomenclature and<br />
conventions?<br />
A2-Do you feel the need for a glosary of terms used in EPR, containing precise definitions of basic notions?<br />
A6.1-Would you find it useful if an all-purpose user-friendly EPR computer programme package for analysis,<br />
simulation and fitting EPR spectra was available?<br />
A8.1-Would you welcome establishment of an EPR Documentation Center?<br />
of respondents who indicated some EPR/ESR programs<br />
developed in their groups (as revealed by<br />
the question Cl in ML), and which have not been<br />
listed in the 1991 edition of the ESR/EPR Software<br />
Database, have been passed on to Prof. Cammack.<br />
An EPR Documentation Center, whose establishment<br />
(Figure 1, A8.1) has received strong support<br />
(76%),.could take up a leading role in achieving the<br />
above goals, including development and on-going<br />
running of the EPR database.<br />
The results of the inquiry on the preferred (i)<br />
notation for the zero-field splitting [ZFS] terms,<br />
(ii) axis system, and (iii) unit for the ZFS parameters<br />
are presented in Figures 3, 4 and 5, respectively.<br />
The extended Stevens (ES) operators (6,7)<br />
have received majority of 'votes' (49%). There was<br />
quite a large proportion of 'undecided votes' (27%),<br />
whereas the NS, BST, and KS/BCS operator notations<br />
(for definitions and references, see ref. 7) rated<br />
at or below 8%. Among other notations suggested,<br />
apart from a few ephemeral notations, several respondents<br />
indicated as a complementary one the<br />
conventional S.D.S (and a, F) notation. Question<br />
A4 (Figure 4) appears, in retrospect, to be poorlyconstructed,<br />
since fully meaningful answers would<br />
require drawings of the crystal structures and axis<br />
systems. In Remarks several people mentioned the<br />
crystallographic, principal, and magnetic axis systems.<br />
Strong views that precise definitions should<br />
be always provided for the axis systems used in EPR<br />
studies were also expressed. This again reconfirms<br />
the need for a glossary of terms used in EPR.<br />
Assuming that our sample of respondents is representative,<br />
these results are encouraging since they<br />
reveal that a much more coherent consensus on the<br />
ZFS notations (Figure 3) as well as on the unit for<br />
the ZFS parameters (Figure 5) exists within the<br />
EPR community, contrary to what could be expected<br />
judging by the messy situation prevailing in<br />
the literature in this regard (for a detailed review,<br />
see ref. 7). Nevertheless, the question of unification<br />
and standardization of notations used for the various<br />
spin Hamiltonian terms remains a thorny issue<br />
[EN 2/3, 6 (1990); 5/2, 6 (1993)], whose solution<br />
has been seriously attempted neither by the EPR<br />
community nor EPR organizations so far. Since
A6.2(i)<br />
Vol. 16, No. 3/4 229<br />
A7.2<br />
A7.1<br />
31% 36%<br />
25% 53%<br />
14% 65%<br />
10 20 30 40 50<br />
very likely 11 probably CD not likely ^ no answer<br />
42% 49%<br />
10 20 30 40<br />
Frequency<br />
[D very useful H useful D of minor use M no answer<br />
50<br />
17%<br />
60 70 80<br />
6%<br />
60 70 80<br />
Figure 2: Answers to A6.2(i), A6.2(ii), A7.2 and A7.1.<br />
A6.2-Would you be prepared to contribute to the development of such a package, (i) by working on the<br />
project? (ii) by obtaining financial assistance through your institution?<br />
A7.2-If you would find a comprehensive EPR database useful or very useful, do you think your institution<br />
would subscribe to release of the EPR database information?<br />
A7.1-How do you preceive the usefulness of a comprehensive computerized EPR database?<br />
no answer<br />
27%<br />
KS/BCS<br />
4%<br />
ES - the extended Stevens<br />
NS - the normalized<br />
Stevens<br />
BST - the Buckmaster,<br />
Smith-Thornley<br />
KS/BCS - the Koster-Statz,<br />
Buckmaster-<br />
Chatterjee-Shing<br />
others - other notations<br />
Figure 3: Answers to A3 - preferred notation for the ZFS Hamiltonian.
230 Bulletin of Magnetic Resonance 1<br />
30<br />
25 --<br />
20 --<br />
10 --<br />
Vol. 16, No. 3/4 231<br />
1990, when the question of setting up a nomenclature<br />
committee has first been put forward to IES,<br />
"this is a continuing problem" [EN 2/3, 6 (1990)].<br />
It should be realized that the internationally accepted<br />
standards on EPR nomenclature and<br />
conventions are essential for the future of the EPR<br />
field and thus a nomenclature committee should be<br />
established as soon as it is practically possible. However,<br />
only 9% of respondents declared willingness to<br />
become members of a pertinent committee (see Figure<br />
10, BlOc).<br />
B. P-EPR: Planning EPR-database<br />
structure<br />
Since most of the results are self-explanatory, we<br />
comment briefly on the findings presented in Figures<br />
6 to 12 and Tables 2 and 3. Out of the 57<br />
full responses, the majority of respondents indicated<br />
the chemical formula, paramagnetic ion/species and<br />
the values of the ZFS and Ze parameters, including<br />
the experimental errors, as the most useful<br />
data types (Figure 6). Other data types mentioned<br />
were: stress dependence of the ZFS parameters,<br />
isotopic composition, drawings of the structural<br />
formula of the species or the immediate environment<br />
of the magnetic site, hyperfine interactions<br />
for organic radicals, environment information<br />
like solvent of liquid radical solutions, EPR spectra<br />
(which could be electronically mailed to the<br />
database in a specific format if adopted internationally),<br />
protein concentration, values of the ZFS<br />
parameters in original notations, microwave power,<br />
modulation amplitude, sweep rate (powder spectra),<br />
preparation conditions, EPR linewidth, halfwidth<br />
and its isotropic properties, and magnetic exchange<br />
interactions. This reveals a wide range of options<br />
which should be taken into account during the<br />
planning phase of the development of a full-scale<br />
EPR database. However, including the drawings of<br />
structures and the actual EPR spectra in the EPR<br />
database would require graphical capabilities and<br />
a large-scale storage media, which would increase<br />
the costs significantly. Interestingly, out of the two<br />
options: (i) the actual EPR spectra database and<br />
(ii) the database of spin Hamiltonian parameters (as<br />
proposed here), the latter option was most favoured<br />
by the participants at the EPR 1992 meeting in Denver<br />
[EN 4/3, 7 (1992)]. Most recently a discussion<br />
on these two options has been initiated by Dr P.<br />
Morse on the EPR LIST electronic network [EN 5/3,<br />
5 (1993)] starting in February 1994. Several useful<br />
ideas have been generated initially, however, quickly<br />
the interest in this topic has faded.<br />
There is no uniformity on the most important<br />
compounds/materials or ions/species. The answers<br />
are grouped into compounds by molecular formula or<br />
specific ion in Table 2 and into materials by name<br />
of specific group in Table 3, whereas the frequency<br />
distribution of ions/species, transition-metal ions,<br />
and main group ions is presented in Figures 7, 8a,<br />
and 8b, respectively. Direct listing of ions may be<br />
more meaningful. The 52 responses indicating explicitly<br />
ion/species yield the following count: 3d ions<br />
(6), transition-metal ions (8), rare-earth ions (12);<br />
V2+/4+ (2/2), Cr 2+ / 3+ / 5+ (4/15/2), Mn 2 +/ 3+ / 4 +'<br />
(25/4/3), Fe 2+ / 3+ / 4+ (7/25/1), Co 2+ (5), Ni 2+ (6),<br />
Cu 2+ (17), Eu 2+ (2), Gd 3+ (13), Mo 5+ (2), VO 2 +<br />
(3). Paramagnetic species mentioned only once are<br />
not listed here. The results reflect the various widely<br />
spread research interests of the researchers, however,<br />
a definite focus on the transition-metal ions<br />
in technologically important materials may be noticed.<br />
The latter aspect may be helpful in searching<br />
for funds for the future development of a full-scale<br />
EPR database. Support from industrial companies,<br />
which use EPR techniques and/or utilize EPR data<br />
for materials characterization, could be sought. Out<br />
of the few commercial producers of EPR equipment,<br />
strong support for the EPR database has been declared<br />
by the Bruker, who could also help with marketing<br />
the product. Question B9 (Figure 10) is<br />
strongly related to the 'chemical content' and hence<br />
is considered here. Although within the question<br />
Bl the researchers listed particular chemical structures<br />
(Table 2 and 3), the majority (70%) would<br />
like to have all chemical structures studied by EPR<br />
techniques listed in the EPR database (Figure 10,<br />
B9). Other suggestions were, e.g. 'initially crystalline<br />
systems, later all other chemical structures'<br />
and 'inorganic compounds'.<br />
It is worthwhile to mentioned here that at the<br />
EPR 1992 meeting in Denver P'rof. J. Weil volunteered<br />
to collect "inorganic" data, whereas Prof. H.<br />
Buckmaster agreed to assemble data from reprints<br />
in the way that he did in his reviews published in<br />
Mag. Reson. Rev. series [EN 4/3, 8 (1992)]. According<br />
to our informal information as of August<br />
1993, no progress has been made in this regard be-
232<br />
a - chemical formula<br />
b - doping level<br />
c - paramagnetic ion/species<br />
d- spin<br />
e - site symmetry<br />
f - spin Hamiltonian symmetry used<br />
g - definition of the axes with respect to the<br />
crystallographic ones<br />
h - frequency<br />
i - temperature range studied<br />
j - magnetic field range applied<br />
k - values of the zero-field splitting (ZFS)<br />
parameters<br />
kl - with the experimental errors included<br />
k2 - without the experimental errors included<br />
1 - values of the electronic Zeeman (Ze)<br />
parameters<br />
11 - with the experimental errors included<br />
12 - without the experimental errors included<br />
m - type of the original notation used for ZFS<br />
parameters<br />
n - bibliographical data, i.e. source reference<br />
cause of various other commitments. A more coordinated<br />
effort is needed to bring about substantial<br />
progress in the EPR database project.<br />
From the suggested list of queries (Figure 9) the<br />
most useful seem to be (i) References to EPR studies<br />
of the ion X in the compound Y, (ii) Papers on<br />
the ion X with spin Y in the site of symmetry Z,<br />
and (iii) Values of the ZFS parameter X for the ion<br />
Y at symmetry Z. Other comments on the possible<br />
queries made include requests for information on the<br />
type of phase transition, type of ligand, crystallographic<br />
classes, values of the hyperfine interaction<br />
a<br />
-<br />
b<br />
-<br />
c<br />
-<br />
d<br />
-<br />
e<br />
-<br />
f<br />
-<br />
g<br />
h<br />
i<br />
j<br />
k<br />
kl<br />
k2<br />
Figure 6: Answers to Bl - most useful data types.<br />
1<br />
11<br />
12<br />
m<br />
n<br />
Bulletin of Magnetic Resonance<br />
_ I<br />
_ ^<br />
]<br />
0<br />
1<br />
1<br />
J 1<br />
"1<br />
1 |<br />
|<br />
_ l<br />
1<br />
20 40<br />
Frequency<br />
constants, name of starting material as well as desire<br />
for a large scientific state-of-the-art database system<br />
capable of flexible information searches.<br />
Responses to questions concerning technical aspects<br />
of the database structure and organization<br />
are summarized in Figures 10 and 11. Most people<br />
(57%) want all authors and full title to be included<br />
in the bibliographical data (Figure 10, B3),<br />
whereas the minimal option is still satisfactory for<br />
some (25%). The 'votes' on a topical (30%) versus<br />
numerical (35%) database are nearly equally split,<br />
with similar number of 'undecided votes' (Figure 10,<br />
60
Vol. 16, No. 3/4 233<br />
carbon oxide ions<br />
2%<br />
rare-earth ions<br />
13%<br />
B4). The former option is less costly and easier to<br />
implement, whereas the latter one is much more 'labor<br />
intensive'. Other comments on the database<br />
structure were, e.g. "a simple topical database will<br />
be cheaper to establish and maintain, and more institutions<br />
will be able to afford the subscriptions",<br />
"small-scale, probably available on work stations or<br />
PC, high speed searches", "in order to keep the<br />
database size reasonable, the format of data storage<br />
should depend on the type of the paramagnetic<br />
species-for marketing purposes one would call this<br />
'object oriented'", "EPR spectrum + spin Hamiltonian<br />
-f Bibliographical details".<br />
There is no special preference for the type of<br />
software to be used (Figure 10, B5), which indicates<br />
most probably a lack of sufficient knowledge on<br />
the technicalities of database systems among the respondents.<br />
This is confirmed by the answers to the<br />
question B6 regarding the database systems with<br />
which people have experience. The names specified<br />
by a handful of people (numbers in brackets)<br />
included either general purpose databases, e.g.,<br />
dBASE (2), Fox-pro (2), Paradox (2), and Oracle<br />
(1) or large scientific databases, e.g., Chemical Abstracts<br />
(2), Cambridge Crystallography (3), Inspec<br />
(2), SCI (1) and CCOD (1). Similarity the listing of<br />
the database systems available at the respondents'<br />
institution (question B7) included the same names<br />
as given in the answers to the question B6 and, additionally,<br />
Dialog, SQL, and Pascal (CNRS). The<br />
opinions on the scale of the EPR database are pre-<br />
Figure 7: Frequency distribution of ions/species.<br />
mam group ions<br />
10% phosphate<br />
3%<br />
transition metal ions<br />
64%<br />
sented in Figure 11. A majority (54%) opted for a<br />
large full-scale database, comprehensive with regard<br />
to data types and literature sources.<br />
Feasibility of the development of a full-scale EPR<br />
database hinges on several factors, among others,<br />
the existence of other EPR-related databases and<br />
the level of support from EPR community, which<br />
were probed in the question BIO (Figure 10) and<br />
Bll (Figure 12), respectively. The knowledge of<br />
other EPR-related databases (Bll, Figure 12) is<br />
very low (7%). The items listed by this 7% of<br />
respondents include one EPR book (published in<br />
1965), two review article series (Mag. Reson. Rev.<br />
and Landolt-Bornstein), STDB II, 'ESR/EPR in<br />
CAS-online', and 'Bruker' (?). The only EPRrelated<br />
computer database in this listing is STDB<br />
II, which is a database for spin trapping. This confirms<br />
that no EPR-related computer database exists<br />
at present. Concerning the level of support from the<br />
EPR community, the question of the low response<br />
rate in the EPR database survey aside, a tangible<br />
support for the EPR database project has been directly<br />
shown by about a quarter of respondents who<br />
declared their willingness to share the work and to<br />
take on some aspects of the development of the EPR<br />
database (Figure 10, BlOa, b). Hence the numbers<br />
involved are enough for efficient multinational work<br />
on the project.
234 Bulletin of Magnetic Resonance<br />
A IB<br />
17% .—<br />
^ ^<br />
B<br />
VIIIB<br />
33%<br />
Group VI<br />
70%<br />
Group VII<br />
im IVB<br />
2% 2%<br />
VB<br />
3%<br />
VIB<br />
•^^^ 18%<br />
Group II<br />
Group III<br />
10%<br />
Figure 8: A) Frequency distribution of transition metal ions. B) Frequency distribution of main group ions.<br />
C. ML: Membership aspects<br />
The survey reveals the following pattern of membership<br />
of the EPR-related societies among the 25<br />
respondents who provided answers to this question<br />
(numbers in brackets): (a) International EPR Society<br />
[20], (b) <strong>ISMAR</strong> [6], (c) Ampere Group [4], (d)<br />
ESR Group of the Royal Society of Chemistry [2],<br />
(e) Others [6]. Note that one person may be a member<br />
of more than one organization, while 48 respondents<br />
did not provide any indication on their membership<br />
or returned only the EPR-Q. The organizations<br />
specified under others are: the 'country re-<br />
lated' ones, which includes three national EPR/ESR<br />
groups (Poland, Hungary, Czechoslovakia) and two<br />
probably internal Russian ones (SMRM, ISDE - ?),<br />
as well as ESR Applied Metrology, ESR Dating and<br />
Dosimetry and American Institute of Ultrasound in<br />
Medicine.<br />
The analysis of the brief description of the research<br />
interests given by the respondents provides<br />
suggestions for future amendments to the fieldsof-interest<br />
codes for members of IES [cf EN 5/2<br />
(1993)]. We have tried to categorize the research<br />
interests revealed in our survey according to the 28<br />
fields used by IES. The results are as follows (num-
Vol. 16, No. 3/4<br />
What queries would be useful to you?<br />
a - References to EPR studies of the<br />
ionX<br />
al - in the compound Y<br />
a2 - in the compound Y and the<br />
symmetry Z<br />
a3 - the symmetry Z<br />
b - Papers on the ion X with spin Y in<br />
the site of symmetry Z<br />
c - Values of the ZFS parameter X for<br />
the ion Y at symmetry Z<br />
Other useful qualifiers to be used to<br />
narrow the search,<br />
d - time period<br />
e - frequency<br />
f - temperature range<br />
bers in brackets indicate no of occurences of research<br />
interests which fall within a given IES category):<br />
1. BIOMED [8], 2. POLAR [0], 3. COAL [0], 4.<br />
COMP [14], 5. CRYST [15], 6. DMR [4], 7. FERR<br />
[2], 8. FREE [0], 9. GEOL [0], 10. EPRI [3], 11. IN-<br />
STR [2], 12. LABEL [3], 13. LIQ [2], 14. MEMBR<br />
[2], 15. ION [5], 16. METALP [2], 17. OXY [0],<br />
18. PEPR [1], 19. PHOTO [1], 20. POL [2], 21.<br />
RAD [4], 22. SOLID [20], 23. SUPERC [11], 24.<br />
SURFACE [1], 25. KINETICS [2], 26. TRAP [2],<br />
27. VIVO [0], 28. CA [0].<br />
The research interests, which do not fall within<br />
any IES code can be classified into five groups,<br />
namely, (a) EPR-related experimental techniques,<br />
(b) EPR-related theoretical aspects, (c) physical<br />
properties, (d) specific materials, and (e) other areas.<br />
The list compiled from the responses com-<br />
al<br />
a3<br />
0 10<br />
Figure 9: Answers to B2.<br />
20<br />
Frequency<br />
30 40<br />
235<br />
prises: (a) APR [1], EPR dating [1], EPR dosimetry<br />
[3], ESE (ESEEM) [2]; (b) group theory [1],<br />
Jahn-Teller effect [2], ligand field theory [3], superposition<br />
model [2]; (c) defects and impurites [13],<br />
electron spin relaxation [1], exchange interactions<br />
[1], paramagnetic centers [2], phase transitions [12],<br />
spin-lattice coupling [2]; (d) high sensitivity scintilators<br />
[1], low dimensional conductors [1], metal<br />
films [1], semiconductors [3]; (e) catalysis [1], crystallography<br />
[1], FIR [1], magnetism [1], mesoscopic<br />
systems [1], Mossbauer spectroscopy [1], NMR [3],<br />
optical spectroscopy [2], susceptibility [2]. The distribution<br />
of fields within the IES list and the above<br />
list indicate the neccessity for a more adequate coding<br />
for the fields of interest as well as for a more<br />
precise specification of the content of each code.<br />
It would be worthwile to introduce, instead of the
BIO<br />
236 Bulletin of Magnetic Resonance<br />
Figure 10: Answers to B3, B4, B5, B9 and BIO.<br />
B3-Should the bibliographical data include: [a] all authors and full title, [b] only the minimum information<br />
necessary to identify the reference, [c] no opinion.<br />
B4-Would you be satisfied with [a] a topical database which would contain references on specific paramagnetic<br />
systems (i.e. compound/ion or species) and a searchable list of topics dealt with in a given source<br />
paper, OR [b] it is essential to retrieve from the database the numerical data on the parameters describing<br />
EPR spectra (i.e. ZFS and Ze parameters)? [c] no opinion.<br />
B5-Preferred type of software to be used: [a] commercial, [b] specially developed, [c] adopted from a related<br />
database system, [d] no opinion.<br />
B9-In your opinion should the EPR-database comprise data on [a] particular chemical structures only (at<br />
least at the initial stages of development)-then please name these structures OR [b] all chemical structures<br />
studied by the EPR technique?<br />
BlO-Would you like to become a member of [a] a panel of potential EPR-database users which will work<br />
out the User Requirements Report, [b] a group which will develop and test a prototype of EPR-database, [c]<br />
a committee which will work out "Recommendations for EPR Nomenclature and Conventions pertaining to<br />
spectra of spin S>l/2 systems".<br />
present coding, a more comprehensive one based on<br />
the five groups (a-e) used above, provided it is technically<br />
feasible within the existing IES membership<br />
database.<br />
III. Concluding remarks<br />
It had been planned to produce and test a smallscale<br />
prototype at the second stage of the EPR<br />
database project. To this end a detailed study of<br />
alternative EPR database structures has been carried<br />
out using the results of the survey concerning<br />
the demands on the data structure and possi-<br />
ble query systems. Since the present feedback has<br />
been insufficient, the project could not go beyond<br />
working out the framework of a small-scale prototype<br />
database, whereas its actual implementation<br />
has been postponed. The aspects arising from this<br />
survey and pertaining to the feasibility of a fullscale<br />
EPR database as well as the database structure<br />
and organization could be discussed in detail in<br />
the Feasibility Study Report. The alternative EPR<br />
database structures as well as several scientific and<br />
technical questions pertinent to the EPR database<br />
and related projects could also be dealt with therein.<br />
The experience gained during this project can be<br />
utilized in future provided there is sufficient support
Vol. 16, No. 3/4<br />
medium<br />
22%<br />
Figure 11: Answers to B8 - the scale of the EPR-database.<br />
Figure 12: Answers to Bll - Do you know of any other EPR-related databases?<br />
from the EPR community and EPR-related organizations<br />
for the continuation of the EPR database<br />
project to its full completion. The present situation<br />
in this regard has been succinctly evaluated by Prof.<br />
G. Eaton, who has suggested [EN 5/2, 6 (1993)]:<br />
"Greater support from the membership is needed to<br />
justify the effort involved, and there should be a committee<br />
to oversee the implementation". The author's<br />
personal and open interaction with EPR researchers<br />
was helpful and supportive for the project, while the<br />
questionnaires probably tended to generate a variety<br />
of negative feelings and annoyance at yet an-<br />
other time-consuming intrusion. Thus even though<br />
the response rate was low we believe that the views<br />
expressed represent those of the EPR community<br />
members as a whole. This survey has enabled us to<br />
learn about some qualitative trends. We ended up<br />
with the strong conviction that increases in support<br />
of the EPR database and the related projects from<br />
EPR organizations are vital for the continued health<br />
of the area. The grants must be made available, the<br />
tangible support by EPR organizations must be offered,<br />
if we expect more than the present efforts.<br />
Finally, the author would welcome further re-<br />
237
238 Bulletin of Magnetic Resonance<br />
sponses as well as any comments on the EPRdatabase<br />
project and the related ones, their feasibility,<br />
resources available and/or required, and<br />
strategy for future development. Full set of the<br />
questionnaires and attachements is available from<br />
the author (FAX: 852 788-7830, Email: APCES-<br />
LAW@CITYU.HK). It is hoped that this paper will<br />
encourage wide consultations within the EPR community.<br />
Acknowledgments<br />
We thank City Polytechnic of Hong Kong for<br />
financial support for this project. We would like<br />
also to thank those researchers who took their time<br />
to complete the questionnaires. Helpful correspondence<br />
with Dr. H. Kon and Prof. J.R. Durig is<br />
gratefully acknowledged.<br />
IV. References<br />
^udowicz, C. 1990, 13th International EPR<br />
Symposium, Denver [abstract].<br />
2 Rudowicz, C. 1991, Bull. Magn. Reson. 12,<br />
174.<br />
3Rudowicz,<br />
C. 1993, 16th International EPR<br />
Symposium, Denver [abstract].<br />
4<br />
Kon, H. 1989, Pure & Appl. Chem. 61, 2195.<br />
5<br />
Durig, J.R. 1990, private communication.<br />
6<br />
Rudowicz, C. 1985, J. Phys. C18, 1415; ibidem<br />
C18, 3837.<br />
7<br />
Rudowicz, C. 1987, Magn. Res. Rev. 13, 1;<br />
1988, ibidem 13, 335.
Vol. 16, No. 3/4 239<br />
Contents<br />
Electron Paramagnetic Resonance Investigations of the<br />
Cu 2+ ion in a Variety of Host Lattices - A Review<br />
R. M. Krishna and S. K. Gupta<br />
EPR Group, Materials Characterization Division,<br />
National Physical Laboratory, New Delhi - 110 012, INDIA<br />
I. Introduction 239<br />
II. Ground State of Cu 2+ Molecular Ion 240<br />
III. Spin-Hamiltonian Analysis 240<br />
IV. Spin-Hamiltonian and Bonding Parameters 241<br />
V. Applications 242<br />
A. Determination of Spin-Lattice Relaxation (Ti) of Host Ions 242<br />
B. Bonding Parameters 242<br />
C. Phase Transition Studies 243<br />
VI. Appendix: Data Tabulation<br />
VII. Abbreviations Used<br />
VIII. Acknowledgments<br />
IX. References<br />
I. Introduction<br />
The Cu 2+ ion with the 3d 9 configuration has been<br />
of particular interest because it represents a relatively<br />
simple one magnetic hole system, which can<br />
provide information regarding the electron wavefunction<br />
in ligand fields of various symmetries. The<br />
electron paramagnetic reasonance (EPR) spectrum<br />
of this ion is the least complex among all other divalent<br />
ions, because of the simple hyperfine structure.<br />
The Cu 2+ ion has also been used as an impurity<br />
probe in a variety of host lattices, since the<br />
fine structure study of Cu 2+ ion in undiluted copper<br />
Tutton salts by Bleaney et al. [46] and the observation<br />
of hyperfine (hf) structure in magnetically<br />
dilute salts by Penrose [347]. The main emphasis<br />
of the EPR studies of Cu 2+ in different hostlattices<br />
has been in the determination of site symmetries<br />
and orientations, the study of phase transi-<br />
243<br />
243<br />
243<br />
243<br />
tions,bonding parameters and magnetic properties<br />
of the systems. Experimental results of EPR investigations<br />
of Cu 2+ in single and polycrystals prior to<br />
1988 have been reviewed earlier by Misra and Wong<br />
[293]. The extensive experimental work which has<br />
been published since then now needs compilation.<br />
The scope of this review article is concerned with<br />
the EPR experimental investigations of the cupric<br />
ion in single crystals, polycrystals as well as liquids<br />
that have appeared between 1985 and 1992. The<br />
literature survey itself is provided in the form of a<br />
table in the appendix. Every care has been taken<br />
to include all the references, and any omissions are<br />
either due to the non-availability of the article or an<br />
inadvertent oversight.
240 Bulletin of Magnetic Resonance<br />
II. Ground State of Cu 2+ Molecular<br />
Ion<br />
The electronic configuration of divalent copper<br />
(electron spin S = 1/2, nuclear spin I = 3/2 for each<br />
of the 69.09% abundant 63 Cu and the 30.91% abundant<br />
65 Cu isotope) is [Ar] 3d 9 . The ground state of<br />
this ion is the same as those of a d 1 system having<br />
a single unpaired electron. This 2 D5/2 ground state<br />
configuration can split further in different crystal<br />
field environments. As shown in Figure 1, in an octahedral<br />
crystal field the 2 D state of this ion splits<br />
into two states, a doublet 2 Eg and a triplet 2 T2g,<br />
with 2 Eg being the ground state . The separation<br />
between these two levels called 10Dq. When the<br />
symmetry is tetragonal, the triplet splits into singlet<br />
( 2 B2g) and doublet ( 2 Eg) levels for which the<br />
corresponding atomic orbitals are dixy> and diyz>,<br />
while the 2 Eg state splits into two non-degenerate<br />
2 Big and 2 Ajg levels with the respective atomic orbitals<br />
dix2-y2> and di3Z2-r2> • The ordering of these<br />
levels will depend upon whether the symmetry corresponds<br />
to that of a tetragonal compression or an<br />
elongation. A further lowering of symmetry from<br />
tetragonal to orthorhombic will lift the remaining<br />
degeneracy and perhaps mix the wave-functions corresponding<br />
to the states. A detailed discussion of<br />
the ground state wave-function has been presented<br />
by Misra and Wong [293] in their earlier review article,<br />
and we will not repeat this material here.<br />
III. Spin-Hamiltonian Analysis<br />
EPR spectra for a paramagnetic ion are traditionally<br />
interpreted using the conventional spin-<br />
Hamiltonian (SH), first introduced by Abragam and<br />
pryce [2]. The general description of each Hamiltonian<br />
term is given by Bowers and Owens [54], and by<br />
Bleaney and Abragam [47]. The SH which describes<br />
the EPR of Cu 2+ ion [47] is<br />
H = /3eH-gS + S-A-I + I-Q-I<br />
-gNj3N-H-I —• (1)<br />
where f3e is the Bohr magneton, S = 1/2 and I = 3/2<br />
for Cu 2+ . The first term represents the electronic<br />
Zeeman interaction, the second term is the interaction<br />
of the unpaired spin with the nuclear spin, the<br />
third term is the energy of interaction of the nuclearquadruple<br />
moment with the electric field gradient,<br />
and the last term represents the nuclear - Zeeman<br />
interaction between the external magnetic field and<br />
the nuclear spin. Usually the last two terms due to<br />
nuclear Zeeman and quadruple interactions are neglected<br />
as their contribution is small for the Cu 2+<br />
ion. For orthorhombic symmetry the SH of Cu 2+ in<br />
the principal axis system becomes [47]<br />
H = /3e(gzzHzSz + gxxHxSx + gyyHySy)<br />
+ A1ZS2 + BIXSX + ClySy —•+ (2)<br />
where A = Azz; B = A C = Ayy and other<br />
terms have their usual meaning. For axial symmetry<br />
(gx = gy = g±; Aj. = Ax = Ay; gz = g||; and<br />
Az = AM) the SH then becomes<br />
H =<br />
(3)<br />
Both the g- and A-tensors are assumed to be coaxial,<br />
thus permitting the use of the perturbation results<br />
to get the magnetic field resonance values as given<br />
by [241,473],<br />
2 ][A|gf/K 2 g 2<br />
= Ho - Km - [Aigi/4Hog 2 ][A|gf/K<br />
l)-m 2 )-m 2 / 2 Ho[A 2 g 2<br />
where m = 3/2,1/2, -1/2 and -3/2<br />
Ho = hi//gA,<br />
g gf 2 - gfcos 2 0<br />
(4)<br />
and '#' is the angle between the magnetic field and<br />
z- axis of the g and A tensors. Here all coupling<br />
constants are expressed in Gauss and 'i/ is the microwave<br />
resonance frequency in Hertz.<br />
EPR spectra of Cu 2+ which do not depend on<br />
the orientation of the magnetic field have been observed<br />
in solutions, powders, glasses and sometimes<br />
in single crystals also [352,43,3]. The lack of field<br />
dependence arises in these cases because of the random<br />
orientations of the molecules or complexes.
Vol. 16, No. 3/4 241<br />
Free<br />
ion<br />
-T2g V •lyz><br />
10 Dq<br />
4Dq<br />
-6Dq<br />
Octahedral<br />
coordination<br />
"B29<br />
Tetragonal<br />
elongation<br />
Ixy-<br />
2 2<br />
I3z-r<br />
Rhombic<br />
distortion<br />
Figure 1: Schematic energy level diagram of Cu 2+ in octahedral, tetragonal and rhombic crystal fields.<br />
There exists two limiting cases of field independent<br />
spectra for randomly oriented spin systems. Powders,<br />
glasses with stationary random orientations<br />
and viscous solutions having slowly tumbling molecules<br />
are at the one extreme and produce lineshapes<br />
which are powder patterns characteristic of the randomly<br />
orinted spins. Systems with rapidly tumbling<br />
molecules such as those in non-viscous solutions or<br />
in the gaseous phase are at the other limit, with<br />
anisotropic SH terms that are averaged out to zero<br />
by the rapid tumbling motion. The SH for such a<br />
spectrum reduces to [118,277]<br />
H = /3egoH • S + AOI • S (5)<br />
Here g0 and Ao are the isotropic g factor and<br />
hyperfine coupling constants. The isotropic and<br />
anisotropic g and A parameters are related by<br />
[277,220]<br />
go = (g|| + 2gJJ/3 or g0 = (gx + gy + gz)/3 — (6)<br />
Ao =<br />
or<br />
Ao = (Ax Az)/3 (7)<br />
If the tumbling motion of the complex molecules is<br />
slow, then EPR spectrum for a bulk sample results<br />
from the superposition of spectra of molecules randomly<br />
oriented in all possible directions, and the<br />
result is a broad powder like spectrum.<br />
IV. Spin-Hamiltonian and Bonding<br />
Parameters<br />
The spin-Hamiltonian parameters (SHP) are used<br />
to extract information concerning the molecular ion<br />
and its surrounding environment in the host. SHP<br />
are usually evaluated from resonant field measurements<br />
at different orientations of a single crystal.<br />
The EPR spectra in lower symmetry systems show<br />
extrema along three mutually perpendicular principal<br />
directions,the z, x and y-axes. The z- axis is defined<br />
as the direction of maximum spread, while the<br />
x-axis is the direction of minimum spread. From the<br />
resonant field measurements of allowed transitions<br />
(AMs = ±1, Ami = 0) along z, x and y-axes, one<br />
can evaluate SHP using perturbation expressions
242 Bulletin of Magnetic Resonance<br />
(for details see section (III)). If the SH has dominant<br />
fine structure terms, a perturbation treatment leads<br />
to systematic deviation from the true eigenvalues<br />
and hence from the observed spectra. The evaluation<br />
of the parameters in this case can be performed<br />
by diagonalizing the entire spin-Hamiltonian Matrix<br />
(SHM). Generally the least square fitting (LSF) procedure<br />
employing diagonalization of a SHM is used<br />
to evaluate the SHP. Misra [294-299] has reviewed<br />
a number of techniques dealing with the LSF evaluation<br />
of SHP, which can be readily applied to the<br />
Cu 2+ ion. On the other hand, from the values of<br />
the SHP and the optical absorption data one can<br />
get information about the interaction of the central<br />
molecular ion Cu 2+ with its chemical environment.<br />
The Molecular Orbital (MO) approach [268,332,<br />
254], which is more sophisticated treatment, has<br />
been applied to the bonding of the divalent copper<br />
ion. A large number of bonding parameters were<br />
reported in earlier papers [383,233,255]. Since different<br />
authors make use of different expressions, the<br />
direct comparison of MO parameters becomes very<br />
difficult. Hence, no attempt has been made here to<br />
include these parameters in the experimental data<br />
tabulations found in the appendix. Some expressions<br />
involving MO and SH parameters are given in<br />
the next section.<br />
V. Applications<br />
A. Determination of Spin-Lattice Relaxation<br />
(Ti) of Host Ions<br />
Spin-lattice relaxation (SLR) results from energy<br />
transfer from the spin system to the lattice.<br />
The EPR technique has been used widely to study<br />
SLR. The spin-echo technique which can be used to<br />
measure SLR directly is limited to very low temperature<br />
determinations because of the relatively short<br />
Cu 2+ spin-lattice relaxation times (SLRT) at high<br />
temperatures. The SLRT of host ions is also very<br />
short (particularly above 77K), making it difficult to<br />
measure directly, but it can be estimated from the<br />
observed linewidth (LW). The observation of EPR<br />
is often not possible in paramagnetic hosts because<br />
of the broadening of the EPR lines by impurity interactions.<br />
If the host SLR narrowing is effective,<br />
sharp line EPR spectra of impurity ions can become<br />
observable [330,78,389,300]. In such cases the impu-<br />
rity ion linewidth (AH) can be related to the host<br />
SLRT (Ti) as follows [301,458]<br />
Tx = (3/20) * (h/gh/?e * (8)<br />
Here H 2 d = 5.1 (gh/?en) 2 Sh(Sh + 1), gh is the g-factor<br />
of the host ion, Sh is the spin of the host ion, n<br />
is the number of host spins per cm 3 which can be<br />
calculated from crystallographic data, and AH is<br />
the EPR linewidth of the impurity ion. From the<br />
observed AH of the impurity ion, one can use this<br />
expression to estimate the host SLRT. These studies<br />
can make it possible to estimate the extremely fast<br />
SLRT at relatively higher temperatures.<br />
B. Bonding Parameters<br />
The MO parameters and electronic energy levels<br />
can be related to the g and A tensors as follows<br />
[268,332,254] (where small overlap terms are<br />
neglected).<br />
g2 = 2.0023 - [8Ao/AE( 2 Blg - 2 B2g)]<br />
{a 2 /? 2 - £09)} — (9)<br />
gz = 2.0023 -<br />
1<br />
f<br />
2 fif<br />
(g,|-2.0023)<br />
+3/7(gx - 2.0023) ± 0.04<br />
(10)<br />
(11)<br />
where p = Aoa/?i/AE( 2 Blg -> 2 B2g), a' = (1 - a 2 )^<br />
-I- aS, a 2 cu> P 2 , 0\ are the MO bonding coefficients,<br />
P (tcu/?e/?N < r~ 3 >) is the dipolar coupling term,<br />
Ao(= —828cm" 1 ) is the spin-orbit coupling constant,<br />
AE( 2 B\g —> 2 i?2g) is the energy separation<br />
between the Big ground state and the B2g excited<br />
doublet. The parameter a 2 cu denotes the in-plane<br />
cr-bonding coefficient, /3, 2 is the in-plane 7r-bonding<br />
coefficient and 0 1 is the out-of-plane 7r-bonding coefficient.<br />
The value of a 2 cu indicates the covalency<br />
of the (T-bond between copper ion and its ligands,<br />
and it has a value of 1 if the bond is totally ionic; 0.5<br />
if it is totally covalent. The value of f3\ 2 is affected<br />
by the delocalization of the electron on the ligands,<br />
and is expected to decrease as the a 2 cu value increases.<br />
The values of a 2 cu of copper complexes<br />
typically vary from 0.80 to 0.95 [268].
Vol. 16, No. 3/4 243<br />
C. Phase Transition Studies<br />
The Cu 2+ probe has been widely used to study<br />
phase transitions (PT) in a large number of host<br />
lattices [280,452,302,378,515]. The use of impurity<br />
ions in studying PT has been discussed by Muller<br />
[318] and by Owens [338]. The effects of PT on the<br />
EPR spectra are (1) a change in" the angular dependence<br />
of the spectra, (2) anomalous variations of LW<br />
and line shape near the PT temperature because<br />
LW's are sensitive to the fluctuations of the nearest<br />
neighbors, (3) observation of forbidden hf transitions:<br />
the appearance of forbidden hf transitions<br />
along a principal axis suggests either a lowering of<br />
the symmetry or a tilt of its principal axes both of<br />
which may be due to the structural phase transition,<br />
and (4) changes in the SLRT of the impurity ion<br />
[300]. PT can be identified very easily from discontinuities<br />
in the LW parameters. The LW temperature<br />
dependence has been successfully used to identify<br />
incommensurate co-operative Jahn-Teller (JT)<br />
PT's in R2PbCu(NO2)6, (R = K,Rb,Tl) compounds<br />
(149,493,335,373). Copper ions have also been used<br />
to study the PT's and molecular ordering in liquid<br />
crystals [98].<br />
VI. Appendix: Data Tabulation<br />
The survey of the literature between 1985 and<br />
1992 is given in tabular form in the Appendix. The<br />
table contains the SHP of Cu 2+ ions in liquids and<br />
single and polycrystals. Whenever g and A- parameters<br />
are isotropic, only one numerical value has been<br />
listed for each. The g- values are dimensionless.<br />
Hyperfine splitting parameters are given in units of<br />
10~ 4 cm" 1 unless otherwise indicated. The following<br />
abbreviations have been used in the appendix as<br />
well as in the text. The comments column summarizes<br />
the highlights of the investigation presented in<br />
the table.<br />
VII. Abbreviations Used<br />
absor., absorption; CaL, calculated; coeff., coefficients;<br />
Const., constant; constd., constructed;<br />
depend., depending; diff., different; dir., direction;<br />
EPR, electron paramagnetic resonance; ESR, electron<br />
spin resonance; estm., estimated; exptl., experimental;<br />
GS, ground state; GSWF, ground state<br />
wave-function; hf., hyper fine; hfs., hyperfine structure;<br />
interact., interaction; JT, Jahn-Teller; JTE,<br />
Jahn-Teller effect; LNT, liquid nitrogen temperature;<br />
LS, line shape; LSF, least square fitting; LT,<br />
low temperature; LW, linewidth; magn., magnetic;<br />
MO, molecular orbital; NMR, nuclear magnetic resonance;<br />
obsd., observed; optl., optical; PT, phase<br />
transition; reptd., reported; RT, room temperature;<br />
SH, spin-Hamiltonian; shf., superhyperfine;<br />
SHM,spin-Hamiltonian matrix; SHP, spin- Hamiltonian<br />
parameters; SLR, spin lattice relaxation;<br />
SLRT, spin lattice relaxation time; spec, spectra;<br />
sub., substitution; supercond., superconductor;<br />
temp., temperature; WF, wave-function; ZFR, zerofield<br />
resonance.<br />
VIII. Acknowledgments<br />
The authors are extremely grateful to Dr. Krishan<br />
Lai, Head, Materials Characterization Division,<br />
National Physical Laboratory; Prof. S.V.J. Lakshman,<br />
Formerly Vice-Chancellor, S.V.University,<br />
Tirupati; Prof. J. Lakshmana Rao, Department of<br />
Physics, S.V. University, Tirupati; Prof. V.P. Seth,<br />
Department of Physics, M.D. University, Rohtak<br />
and Dr. Prem Chand, Department of Physics, Indian<br />
Institute of Technology, Kanpur for their constant<br />
encouragement and suggestions in preparing<br />
the manuscript.<br />
One of the authors (RMK) is thankful to the<br />
Council of Scientific and Industrial Research (CSIR)<br />
for Scientist fellowship (No. B8552). Also RMK<br />
wish to thank his wife, Madhavi, for the various<br />
ways in which she assisted in the preparation of the<br />
manuscript.<br />
IX. References<br />
1<br />
P. Abbas, P. G. Marta, W.K. Subczynski and<br />
W.E. Antholine, J. Phys. Chem. 94, 451 (1990).<br />
2<br />
A. Abragam and M.H.L. Pryce, Proc. Roy. Soc.<br />
A 205, 135 (1951).<br />
3<br />
I.S. Ahuja and S. Tripathi, Spectrochim Ada A<br />
48, 759 (1992).<br />
4<br />
I.S. Ahuja and S. Tripathi, Spectrochim. Chim.<br />
Ada. Pt. A 47, 637 (1991).<br />
5<br />
I.S Ahuja and S.Tripathi, Indian J. Chem. A<br />
30, 1060 (1991).
244 Bulletin of Magnetic Resonance<br />
6<br />
N. Akihiko and H. Kazumi, Jpn. J. Appl. Phys.<br />
PL 2 29, L46 (1990).<br />
7<br />
I. Aksenov and S. Katsuaki, Jpn. J. Appl.<br />
Phys. Pt 1 31, 2352 (1992).<br />
8<br />
N.E. Alekseevskii,<br />
LA. Garifullin, N.N. GarifYanov, B.I. Kochelaev,<br />
A.V. Mitin, V.I. Nizhanovskii, L.R. Tagirov and<br />
E.P. Khlybov, JETP Lett. (USA) 46, 367 (1987).<br />
9<br />
N.E. Alekseevskii, LA. Garifullin,<br />
N.N. GarifYanov B.I. Kochelaev, A.V. Mitin, V.I.<br />
Nizhanovskii, L.R. Tagirov and E.P. Khlybov, Sov.<br />
Phys. JETP (USA) 67, 805 (1988).<br />
10<br />
N.E. Alekseevskii, LA. Garifullin, N.N.<br />
GarifYanov. B.I. Kochelaev, V.I. Nizhanovskii,<br />
L.R. Tagirov and E.P. Khlybov, Sov. Phys. Solid<br />
State (USA) 30, 909 (1988).<br />
U<br />
N.E. Alekseevskii, A.V. Mitin,<br />
V.I. Nizhankvskii.I.A. Garifullin, N.N. GarifYanov,<br />
G.G. Khaliullin, E.P. Khylbov, B.I. Kochelaev and<br />
L.R. Tagirov, /. Low Temp. Phys. 77, 87 (1989).<br />
12<br />
G.A. Aliev, A.V. Ivanov and M.L. Rachkovskii,<br />
Dokl. Akad. Nauk. SSSR (Phys. Chem.) 318, 606<br />
(1991).<br />
13<br />
A.A. Alybakov, V.A. Gubanova, K. Kudabaev<br />
and K. Sharsheev, Phys. Stat. Solidi (B) 146, K135<br />
(1988).<br />
14<br />
G. Amoretti,E. Buluggiu, A. Vera, G.<br />
Calestani and F.C. Matacotta, Z. Phys. B: Condensed<br />
Matter (Wg) 72, 17 (1988).<br />
15<br />
D. Andrea, G. Dante, P. Luca, B.A. Laure and<br />
B. L. Claude, Phys. Lett. 175, 589 (1990).<br />
16<br />
Y. Anjaneyulu, V.G.K.M. Pisipati, N.V.S.<br />
Rao, R.Y. Swamy and R.P. Rao, Indian J. Pure<br />
Appl. Phys. 23, 349 (1985).<br />
17<br />
Y. Anjaneyulu, N.V.S. Rao, R. Prabhakara<br />
Rao, L.N.Murthy and V.G.K.M. Pisipati, Indian J.<br />
Pure Appl. Phys. 24, 256 (1986).<br />
18<br />
Y. Anjaneyulu, V.G.K.M. Pisipati, N.V.S.<br />
Rao. L.N. Murthy and R. P. Rao, Indian J. Pure<br />
Appl. Phys. 24, 355 (1986).<br />
19<br />
Y. Anjaneyulu, N.V.S. Rao, R. P. Rao and<br />
V.G.K.M. Pisipati, Proc. Indian Acad. Sci. Chem.<br />
Sci. 97, 177 (1986).<br />
20<br />
A. Antoine, A. Bennani, C. F. Aissi, G. Wrobel,<br />
G. Michel and C.V. Jacques, J. Chem. Soc.<br />
Faraday Trans. 88, 615 (1992).<br />
21<br />
A. Antonie, A. Bennani, C.F. Aissi, G. Michel<br />
and C.V. Jacques, Chem. Mater. 4, 977 (1992).<br />
22<br />
A. K. Antoine, G. Michel, V. J. Charles, C.R.<br />
Acad. Sci. Ser. 7/313, 169 (1991).<br />
23<br />
A.K. Antoine, B. Rafeh, A. C. Faustin and G.<br />
Michel, Chem. Mater. 3, 557 (1991).<br />
24<br />
F. Apaydin and C. Kaptanoglu, Doga: Turk<br />
Fiz. Derg. 14, 321 (1990).<br />
25<br />
J.A. Aramburu and M. Moreno, J. Chem.<br />
Phys. 83, 6071 (1985).<br />
26<br />
A.R.Armstrong, R. Janes, K.K. Singh and P.P.<br />
Edwards, Bull. Mater. Sci. 14, 641 (1991).<br />
27<br />
A.M. Artyushin, L.K/ Przheval'Skaya, G.P.<br />
Epishina and V.A. Shvets, Zh. Fiz. Khim. 64,<br />
1060 (1990).<br />
28<br />
C.B. Azzoni, E.R. Mognaschi and G. Siragusa,<br />
J. Phys. C19, 1443 (1986).<br />
29<br />
D.S. Babu, G.S. Sastry, M.D. Sastry, Ag. I.<br />
Dalvi J. Phys. C 18, 6111 (1985).<br />
30<br />
R.S. Bansal, V.P. Seth and S.K. Gupta, Radiation<br />
Effects and Defects In Solids 116, 267 (1991).<br />
31<br />
R. Bartucci, E. Colavita, L. Sportelli, G.<br />
Balestrino and S. Barbanera, Phys. Rev. B 37,<br />
2313 (1988).<br />
32<br />
J. Baranowski, F. Padula, C. Goldstein, G.<br />
Kokoszka and A.R. Siedle, J. Phys. Chem. 89,<br />
1976 (1985).<br />
33<br />
R. Bechara, A. D'Huysser, C.F. Aissi, M. Guelton,<br />
J.P. Bonnelle and A. Abou-Kais, Chem. Mater.<br />
2, 522 (1990).<br />
34<br />
S. Benakki and E. Christoffel, J. Mater. Res.<br />
2, 765 (1987).<br />
35<br />
A. Bencini, C.F. Antonio, Z. Claudia and Z.<br />
Paolo, Inorg. Chem. 26, 1445 (1987).<br />
36<br />
A. Bencini, D. Gatteschi, J. Reedijk and C.<br />
Zanchini, Inorg. Chem. 24, 207 (1985).<br />
37<br />
A. Bencini, D. Gatteschi, C. Zanchini, J.C.<br />
Haasnoot, R. Prins and J. Reedijk, Inorg. Chem.<br />
24, 2812 (1985).<br />
38<br />
A. Bencini and D. Gatteschi, Mol. Phys. 54,<br />
969 (1985).<br />
39<br />
K. Bente and D. Siebert, Phys. Stat. Solidi<br />
(A) 106, K57 (1988).<br />
40<br />
K. Bente, E. Schwarzmann and D. Sibert,<br />
Phys. Stat. Solidi (A) 111, K93 (1989).<br />
41<br />
N. Bontemps, P.Y. Bertin, D. Davidov, P.<br />
Monod, C. Lacour, R. Even and V.V. Moshchalkov,<br />
Physica C (Amsterdam) 185-189, 1809 (1991).<br />
42<br />
G.I. Bersuker, V.N. Kiselev, A.N. Men and<br />
B.S. Tsukerblat, Sov. Phys. - Solid State (USA)<br />
28, 1771 (1986).
Vol. 16, No. 3/4 245<br />
43<br />
M.K. Bhide, M.D. Sastry and U.R.K. Rao,<br />
Phase Transitions 38, 237 (1992).<br />
44<br />
G. R. Bhirud and T. S. Srivastava, Inorg.<br />
Chem. Ada. 179, 125 (1991).<br />
45<br />
T.J. Bhoopathy, P. Feridoun and S. Mohan,<br />
Bull. Soc. Chim. Belg. 96, 487 (1987).<br />
46<br />
B. Bleaney, R.P. Penrose and B.J. Plumption,<br />
Proc. Roy. Soc. A 198, 406 (1949).<br />
47<br />
B. Bleaney and A. Abragam, Electron Paramagnetic<br />
Resonance Of Transition Ions, Clarendon<br />
Press, Oxford (1970).<br />
48<br />
S.V. Bogachev, G.A. Emel'Chenko, V.A. Ll'In,<br />
S.G. Konnilov, A.O. Kosogov, O.V. Kosogov,<br />
V.A.Tatarchenko and V.I. Tret'Yakov, JETP Lett.<br />
(USA) 47, 203 (1988).<br />
49<br />
L.D. Bogomolova,<br />
E.G. Grechko, V.A. Zhachkin, N.A. Krasil'Nikova<br />
and V.V. Sahkarov, J. Non-Cryst. Solids 86, 293<br />
(1986).<br />
50<br />
L.D. Bogomolova, E.G. Grechko, V.A.<br />
Zhachkin, N.A. Krasil'Nikova, V.V. Sakharov and<br />
T.V. Semenova, Fiz. Khim. Stelka (Russ.) 13, 202<br />
(1987).<br />
51<br />
R. P. Bonomo, A. J. D. Bilio and R. Francesco,<br />
Chem. Phys. Lett. 151, 208 (1988).<br />
52<br />
R. P. Bonomo, A. J. D. Bilio, and A. Giuseppe,<br />
Inorg. Chem. Ada. 161, 125 (1989).<br />
53<br />
R. P. Bonomo, R. Enrico, B. Mario and M.<br />
Antonio, Inorg. Chem. Ada. 186, 21 (1991).<br />
54<br />
K.D. Bowers and J. Owens, Rep. Progr. Phys.<br />
18, 304 (1955).<br />
55<br />
G.J. Bowden, P.R. Elliston, K.T. Wan, S.X.<br />
Dou, K.E. Easterling, A.J. Bourdillon, C.C. Sorrell,<br />
B.A. Cornell and F. Separovic, Aust. Phys. (Australia)<br />
24, 164 (1987).<br />
56<br />
O. Braddell, R.C. Barklie, D.H. Doff.<br />
N.H.J.Gangas and A. Mckimm, Z. Phys. Chem.<br />
(Munich) 151, 157 (1987).<br />
57<br />
E. Buluggiu, J. Chem. Phys. 84, 1243 (1986).<br />
58<br />
I.P. Bykov, V.V. Laguta, M.D. Glinchuk, A.A.<br />
Karmazin and P.P. Syrinkov, Sov. Phys. Solid-State<br />
(USA) 27, 1149 (1985).<br />
59<br />
I.P. Bykov, V.V. Laguta, M.D. Glinchuk, A.A.<br />
Karmazin and P.P. Syrnikov, Fiz. Tverd. Tela. 27,<br />
1908 (1985).<br />
60<br />
M. A. Carlos, N. O. Rangel, H. Kristopher and<br />
R.D. Willett, Inorg. Chem. 31, 1779 (1992).<br />
61<br />
J.H. Castilho, P.T.Venegas, G.E. Barberis, C.<br />
Rettori, R.F. Jardim, S. Gama, D. Davidov and I.<br />
Felner, Solid State Commun. 64, 1043 (1987).<br />
62<br />
M. Castillo, A. Criado, R. Guzman, J. J. Criado<br />
and B. Macias, Transition Metal. Chem. 12,<br />
225 (1987).<br />
63<br />
O. Cesare, F. Lucio and A.V. Vishnyakov,<br />
Mendeleev Commun. 3, 88 (1992).<br />
64<br />
A.Ceulemans, R. Debuyst, F. Dejehet, G.S.D.<br />
King, M. Vanhecke and L.G. Vanquickenborne,<br />
Bull. Magn. Reson. 11, 380 (1989).<br />
65<br />
S. Chaklanobis, P. Chand and D.C. Khan, Indian<br />
J. Cryog. 15, 115 (1990).<br />
66<br />
P. Chand, G.C. Upreti, M. Umar and R.J.<br />
Singh, Phys. Stat. Solidi (B) 131, 357 (1985).<br />
67<br />
P. Chand, G.C. Upreti, S.K. Misra and M.<br />
Bartkowski, J. Chem. Phys. 82, 5307 (1985).<br />
68<br />
P. Chand and M. Umar, Phys. Stat. Solidi (B)<br />
127, 279 (1985).<br />
69 P. Chand and G.C. Upreti, Indian J. Phys.<br />
59a, 395 (1985).<br />
70 P. Chand and G.C. Upreti, Solid State Com-<br />
mun. 56, 225 (1985).<br />
71 M. N. Chary, S. R. Rao, B.A. Sastry and G.<br />
Ponticelli, Indian J. Phys. A 61, 563 (1987).<br />
72 P. Chaudhuri, M. Winter , P.C. D. V. Beatriz<br />
, B. Eckhard, T. Alfred, G. Stefan, F. Peter, N. B.<br />
Hard and W. Johannes, Inorg. Chem. 30, 2148<br />
(1991).<br />
73 A.I. Cheranev, S.P. Rozov, V.S. Mironov and<br />
L.I. Barsova, Sverkhprovodimost: Fiz. Khim. Tekh<br />
3, 1009 (1990).<br />
74 S.J. Clarke and A. Harrison, J. Phys.: Con-<br />
densed Matter 4, 6217 (1992).<br />
75 J. B. Cornelius, J. Mccracken, R.B. Clarkson,<br />
R.L. Belford and J. Peisach, J. Phys. Chem. 94,<br />
6977 (1990).<br />
76 O. Cozar and I. Ardelean, J. Non-Cryst. Solids<br />
92, 278 (1987).<br />
77 E. Crusson-Blouet, A. Aboukais, C.F. Aissi<br />
and M. Guelton, Chem. Mater. 4, 1129 (1992).<br />
78 J.M. Daniels and H.A. Farach, Can. J. Phys.<br />
38, 151 (1960).<br />
79 G. Daniella and Z. Katia, Chem. Phys. Lett.<br />
171, 167 (1990).<br />
80 J.G. Darab and R.K. Mac Crone, Phys. Chem.<br />
Glasses 32, 91 (1991).<br />
81 M. Das and A.K. Pal, Indian J. Cryog. 15, 547<br />
(1990).<br />
82 D.K. De, Phys. Rev. B 34, 4651 (1986).<br />
83 D.K. De, J. Phys. C20, 5911 (1987).
246 Bulletin of Magnetic Resonance<br />
84 D.K. De, J. Phys. C21, 4481 (1988).<br />
85 B. De Castro, C. F. D. Domingues and J.<br />
Gomes, Polyhedron 10, 2541 (1991).<br />
86 F. Dejehet, R. Debuyst, W.Y. Yi, J.P. Declercq<br />
and B. Tinant, J. Chem. Phys. Phys-Chem. Biol.<br />
84, 107 (1987).<br />
87 C. Deyu, Y. Xu, Y. Chen, M. Zeng, C. Zhou<br />
and H. Sheng, Bopuxue Zazhi 8, 395 (1991).<br />
88 S. Dhanuskodi and N. Hariharan, Cryst. Latt.<br />
Def. Amorphous Mater. 11, 361 (1986).<br />
89 G. Didier, V. Daniel, D. Bruee and S. Linda,<br />
J. Mater. Chem. 1, 265 (1991).<br />
90 M. Dimitra, B. Maxime, A. J. Jacques and S.<br />
Jacques, J. Phys. Chem. 90, 1323 (1986).<br />
91 C. Dong, H. Shiying, S. Yunxia and T. W.<br />
Anbang, Gaodeng Xuexiao Huaxue Xuebao 11, 919<br />
(1990).<br />
92 L. L. Duggan and M.A. Hitchman, Aust. J.<br />
Chem. 39, 1321 (1986).<br />
93 R. Durny, J. Hautala, S. Ducharme, B. Lee,<br />
O.G. Symko, P.C. Taylor, D.J. Zheng and J.A. Xu,<br />
Phys. Rev. B 36, 2361 (1987).<br />
94 R. Edson and L. Lilian, Bull. Magn. Reson.<br />
8, 210 (1986).<br />
95 P. P. Edwards, R. Janes, R.S. Liu, P.T. Wu<br />
and C.T. Chang, Jpn. J. Appl. Phys. Pt. 2 29,<br />
L258 (1990).<br />
96 A. H. Ei- Sayed, S. Hedewy and A. Ei- Samahy,<br />
J. Phys. : Condensed Matter 1, 10515 (1989).<br />
97 E.A. Eivazov, A.F. Safarov, S.M. Atakishiev<br />
and Ya. M Abasov, Phys. Stat. Solidi (A) 117,<br />
K147 (1990).<br />
98 J. P. Fackler, J.A. Smith, J. Am. Chem. Soc.<br />
92, 5787 (1970).<br />
"A. Fainstein, M. Tovar and Z. Fisk, J. Phys.:<br />
Condensed Matter 4, 1581 (1992).<br />
100 A. Fainstein, J. Phys.: Condens Matter 4,<br />
4989 (1992).<br />
101 H. A. Farach, E. Quagliata, T. Mzoughi, M.<br />
A. Mesa and C. P. Poole Jr., Phys. Rev. B 41, 2046<br />
(1990).<br />
102 A.M. Finkel'Shtein, V.E. Kataev, E.F.<br />
Kukovitskii and G.B. TeitePBaum, Ann. N.Y.<br />
Acad. Sci. 581, 1 (1990).<br />
103 A.M. Finkel'Stein, V.E. Kataev,<br />
E.F. Kukovitskii and G.B. Teitel'Baum, Physica C<br />
(Amsterdam) 168, 370 (1990).<br />
104 C. Friebel, Proc. Conf. Coord. Chem. 13th,<br />
371 (1991).<br />
105 P. Ganguly, K. Sheedhar, A.R. Raju, G. Denazeau<br />
and P. Hazenmuller, J.Phys.: Condensed<br />
Matter 1, 213 (1989).<br />
106 L.A. Garifullin, N.N. Garifyanov, N.E. Alekseevskii<br />
and S.F. Kim, Physica C (Amsterdam) 179,<br />
9 (1991).<br />
107 I.N. Geifman, I.V. Kozlova, V.I. Konovalov,<br />
T.V. Son'Ko and N.G. Furmanova, Kristallografiya<br />
35, 732 (1990).<br />
108 A.M. Gennaro, P.R. Levstein, C.A. Steren and<br />
R. Calvo, Chem. Phys. Ill, 431 (1987).<br />
109 A.M. Gennaro and R. Calvo, J. Phys.: Con-<br />
densed Matter 1, 7061 (1989).<br />
110 A.M. Gennaro and R. Calvo, J. Phys.: Con-<br />
densed Matter 2, 2873 (1990).<br />
m<br />
J. Genossar, D. Shaltiel, V. Zerin, A.<br />
Grayevsky and B. Fisher, J. Phys.: Condensed Matter,<br />
1, 9471 (1989).<br />
112<br />
F. Gervais, P. Echegut, P. Simon, G. Hauret<br />
and H. Hrend, Phys. Lett. (Netherlands) 114a, 509<br />
(1986).<br />
113<br />
S. Gharbage, J.-C. Bissey and Y. Servant,<br />
Phys. Stat. Solidi (B), 138, 655 (1986).<br />
114<br />
M. Giordanom and D. Leporini, Mol. Phys.<br />
55, 509 (1985).<br />
U5<br />
A.A. Gippius, V.V. Moshchalkov, Yu.A. Koksharov,<br />
A.N. Tikhono and B. Mill Physica C (Amsterdam)<br />
162-164, 253 (1989).<br />
116<br />
A.A. Gippius, V.V. Moshchalkov, Yu. A.<br />
Koksharov, B.V. Bill, Ya. Zoubkova, S.V. Gudenko<br />
and A.N. Mezhuev, Sverkhprovodimost: Fiz. Khim.<br />
Tekh. 4, 1705 (1991).<br />
117<br />
G. Giugliarelli and S. Cannistraro, Chem.<br />
Phys. 98, 115 (1985).<br />
118 R.M. Golding, Applied Wave Mechanics, D.<br />
Van Nostrand Co. Ltd., London (1969).<br />
119 F. Golinska, A. Jesmanowicz, A. Lodzinska<br />
and F. Rozploch, Ser. Fiz. (Univ. In Adaman<br />
Mickiewicz Poznanio) 53, 333 (1985).<br />
120 A. B. Goodman and B. D. Mcphail, J. Chem<br />
Soc, Dalton Trans. 8, 1717 (1985).<br />
121 M.L. D. Goodgame, Y. Nishida and E.P.R.<br />
Winpenny, Bull. Chem. Soc. Jpn. 59, 344 (1986).<br />
122 N. Gopal and P.C. Srivastava, J. Inst. Chem.<br />
(India) 61, 79 (1989).<br />
123 J. Goslar and A.B. Wieckowski, J. Solid State<br />
Chem. 56, 101 (1985).<br />
124 J. Goslar, S.K. Hoffmann and M. Osman, Ser.<br />
Fiz. (Univ. In Adaman Mickiewicz Poznanio) 53,
Vol. 16, No. 3/4 247<br />
295 (1985).<br />
125 J. Goslar and P.B. Sczaniecki, Ser. Fiz.<br />
(Univ. In Adaman Mickiewicz Poznanio) 53, 301<br />
(1985).<br />
126 J. Goslar and A.B. Wieckowski, Seria Fizyka<br />
Nr (Poland) 53, 383 (1985).<br />
127 J. Goslar, P.B. Sczaniecki and M.M. Strawiak,<br />
Solid State Commun. 62, 169 (1987).<br />
128 J. Goslar, P.B. Sczaniscki and M.M. Strawiak,<br />
Solid State Commun. 62, 169 (1987).<br />
129 J. Goslar and S.K. Hoffmann, Fiz. Dielektr.<br />
Radiospektrosk 16, 137 (1990).<br />
130 J. Goslar, W. Hilczer, S.K. Hoffmann and M.<br />
Krupski, Phys. Stat. Solidi (B) 167, 291 (1991).<br />
131 S.P. Greiner, R.W. Kreilick and K.A. Kraft,<br />
J. Am. Chem. Soc. 114, 391 (1992).<br />
132 L.S. Grigoryan, Sov. Phys.- Solid State<br />
(USA) 29, 1622 (1987).<br />
133 V.S. Grunin, I.B. Patrina and<br />
M.V. Razumeenko, Electron Paramag. Rezonans<br />
V Tvrdofaz. Soed, Sverdlovsk (Russ.) 3-6 (1989)<br />
From Ref. Zh. Khim. 1990.<br />
134 L. Guangming and G. Fuxi, Guisuanyan Xue-<br />
bao 18, 430 (1990).<br />
135 S. Gudrun, S. Reinhard, R. Friedrich and L.<br />
Rainer, Z. Chem. 30, 183 (1990).<br />
136 B. Guiru, S. Guoyin and C. Xu, Bopuxue Za-<br />
zhi 7, 69 (1990).<br />
137 S. Guoyin, C. Xu and G. Bai, Phys. Stat.<br />
Solidi (B) 158, K185 (1990).<br />
138 N. Guskos, Th. Leventouri, Ch. Trikalinos<br />
and M. Calamiotou, Phys. Stat. Solidi (B) 149,<br />
K157 (1988).<br />
139 N. Guskos, M. Calamiotov, S.M. Paraskevas,<br />
A. Koufoudakis, C. Mitros, H. Gamari-Seale, J.<br />
Kuriata, L. Sadlowski and M. Wabia, Phys. Stat.<br />
Solidi (B) 162, K101 (1990).<br />
140 N. Guskos,G.P. Triberis, W. Likodimos, A.<br />
Kondos, A. Koufoudakis, C. Mitros, H. Gamari-<br />
Seale and D. Niarchos, Phys. Stat. Solidi (B) 164,<br />
K105 (1991).<br />
141 N. Guskos, G.P. Triberis, M. Calamiotov, C.<br />
Trikalinos, A. Koufoudakis, C. Mitros, M. Gamari-<br />
Seale and D. Niarchos, Phys. Stat. Solidi (B) 163,<br />
K89 (1991).<br />
142 N. Guskos, G.P. Triberis, V. Lykodimos, W.<br />
Windsch, H. Metz, A. Koufoudakis, G.P. Mitros, H.<br />
Gamari-Seale and D. Niarchos, Phys. Stat. Solidi<br />
(B) 166, 233 (1991).<br />
143 N. Guskos, M. Calamiotou, C.A. Londos, V.<br />
Likodimos, A. Koufoudakis, C. Mitros, H. Gamari-<br />
Seale and D. Niarchos, J. Phys. Chem. Solids 53,<br />
211 (1992).<br />
144 N. Guskos, C.A. Londos, V. Lykodimos, M.<br />
Calamiotou, A. Koufoudakis, C. Mitros, H. Gamari<br />
Seale and D. Niarchos, J. Phys.: Condensed Matter<br />
4, (1992) 4261<br />
145 G. P. Handreek and T. D. Smith, J. Chem.<br />
Soc. Faraday Trans. 87, 1025 (1991).<br />
146 S.P. Harish and J. Sobhanadri, Inorg. Chim.<br />
ActalO8, 147 (1985).<br />
147 S.P. Harish, Mol. Phys. (Gb) 54, 911 (1985).<br />
148 M.A. Hefni, N.M. Mcconnell, F.J. Rietmeljer,<br />
M.C.M. Gribnau and C.P. Keijzers, Mol. Phys. 57,<br />
1283 (1986).<br />
149 V. Heine and J.D.C. Mcconnell, Phys. Rev.<br />
Lett. 46, 1092 (1981); J. Phys. C 15, 2387 (1982);<br />
J. Phys. C17, 1199 (1984).<br />
150 T. Hidekazu, S. Ursula and D. S. Klaus, J.<br />
Phys. Soc. Jpn. 61, 1344 (1992).<br />
151 W. Hilczer and S,K. Hoffmann, Chem. Phys.<br />
Lett. (Netherlands) 144, 199 (1988).<br />
152 M. Hiromu, M. Fumio, H. Izumi, T. Shoji,<br />
Phys. Rev. B 43, 7871 (1991).<br />
153 M. Hiromu, M. Fumio, Y. Yasuji, S.K.H.<br />
Izumi, S. Yuh and T. Shoji, Supercond. Sci. Technol.<br />
4, S925 (1991).<br />
154 M. Hiromu, M. Fumio, Y. Yasuji, S. Kazushi,<br />
H. Izumi, S. Yuh and S. Tanaka, High Temp. Supercond.<br />
Proc. Lt-19 Satell Conf. S295 1990 (Pub.<br />
1991).<br />
155 U. Hisashi, Nippon Kagaku Kaishi 2, 202<br />
(1990).<br />
156 M. Histed, J.A. Howard, H.A. Joly and B.<br />
Mile, Chem. Phys. Lett 17'4, 411 (1990).<br />
157 M. Histed, J.A. Howard, R. Jones and M.<br />
Tomietto, J. Phys. Chem. 96, 1141 (1992).<br />
158 M. A. Hitchman, R.G. Mcdonald and D.<br />
Reinen, Inorg. Chem. 25, 519 (1986).<br />
159 M.A. Hitchman and Kwan Linda, J. Chem.<br />
Soc. Dalton Trans. 2, 457 (1987)<br />
160 O. Hitoshi, Y. Nobuyasu, M. Mitsuhiro, A.<br />
Masaki and T. Mikio, J. Phys. Soc. Jpn. 61, 3370<br />
(1992).<br />
161 O. Hitoshi, Y. Kazuhiro, M. Takashi, N.<br />
Takao, M. Mitsuhiro, K. Yamada, E. Yasuo and H.<br />
Shoichi, J. Phys. Soc. Jpn. 61, 2921 (1992).<br />
162 S.K. Hoffmann, J. Goslar, L.S. Szczepaniak
248 Bulletin of Magnetic Resonance<br />
and M. Osman, Ser. Fiz. (Univ. In Adaman Mickiewicz<br />
Poznanio) 53, 307 (1985).<br />
163 S.K. Hoffmann, J. Goslar and L.S. Szczepaniak,<br />
Ser. Fiz. (Univ. In Adaman Mickiewicza<br />
Poznanio) 54, 387 (1985).<br />
164 S.K. Hoffmann, K. T. Debra, E. H. William,<br />
P. Chaudhari and W. Karl, Inorg. Chem. 24, 1307<br />
(1985).<br />
165 S. K. Hoffmann, S. Maria and U. Irmina, J.<br />
Magn. Reson. 68, 490 (1986).<br />
166 S.K. Hoffmann, J. Goslar and L.S. Szczepaniak,<br />
Phys. Stat. Solidi (B) 133, 321 (1986).<br />
167 S.K. Hoffmann, J. Goslar and O. Maher, Ada.<br />
Phys. Pol. A 70, 43 (1986).<br />
168 S.K. Hoffmann, J. Goslar and L.S. Szczepaniak,<br />
Phys. Rev. 5 37, 7331 (1988).<br />
169 S.K. Hoffmann and M.A. Augustyniak, Ada.<br />
Phys. Pol. A 74, 651 (1988).<br />
170 S.K. Hoffmann, M. Szpakowska and I. Uruska,<br />
J. Magn. Reson. 68, 490 (1988).<br />
m S.K. Hoffmann, Z. Zimpel, M. Augustyniak,<br />
W. Hilczer and M. Szpakowska, J. Magn. Reson.<br />
98, 1 (1992).<br />
172 J.A. Howard, B. Mile, J.R. Morton, K.F. Preston<br />
and R. Sutclitte, Chem. Phys. Letts. 117, 115<br />
(1985).<br />
173 J.A. Howard, B. Mile, J.R. Morton and K.F.<br />
Preston, J. Phys. Chem. 90, 2027 (1986).<br />
174 J. S. Hwang and H. M. Sakhawat, Transition<br />
Met. Chem. 12, 214 (1987).<br />
175 J. S. Hyde, A. Jesmanowicz, J. J. Ratke and<br />
W. E. Antholine, J. Magn. Reson. 96, 1 (1992).<br />
176 A. Igor, K. Yuki and S. Katsuaki, Jpn. J.<br />
Appl. Phys. Pt. 2 31, L1009 (1992).<br />
177 S. Ikuo, Nagoya Kogyo Daigaku Gakuho 41,<br />
109 (1989) (Pub. 1990).<br />
178 N. Iordanov, G. Gochev, O. Angelova and I.<br />
Matsichek, Polyhedron 9, 2597 (1990).<br />
179 M.B. Irene, L. Daniel, B. Eckhard, W. Heiner,<br />
J. Alfredx, R. F. J. Yves, Inorg. Chem. 30, 3180<br />
(1991).<br />
180 T. Ishii and I. Yamada J. Phys.: Condensed<br />
Matter 2, 5771 (1990).<br />
181 K. Ivan, Chem. Listy. 86, 342 (1992).<br />
182 A.V. Ivanov, P.M. Solozhenkin, N.I. Kopitsya,<br />
V.B. Klyashtornyi and F.A. Shvengler, Dokl. Akad.<br />
Nauk. SSSR (Phys. Chem.) 287, 1410 (1986).<br />
183 A.V.Ivanov, P.M.Solozhenkin, M. Z. Hamkar,<br />
V.B. Klyashtornyi and F.A. Shvengler, Koord.<br />
Khim. 15, 1223 (1989).<br />
184 A.V. Ivanov, P.M. Solozhenkin and V.B.<br />
Klyashtornyi, Koord. Khim. 16, 1240 (1990).<br />
185 A.V. Ivanov and P.M. Solazhenkin, Dokl.<br />
Akad. Nauk SSSR 311, 392 (1990).<br />
186 A.V. Ivanov, P.M. Solozhenkin and V.B.<br />
Klyashtornyi, Dokl. Akad. Nauk. SSSR (Phys.<br />
Chem.) 319, 403 (1991).<br />
187 A.V. Ivanov, Koord. Khim. 17, 382 (1991).<br />
188 A.V. Ivanov and V.B. Klyashtornyi, Zh. Ne-<br />
org. Khim. 37, 1597 (1992).<br />
189 T.A. Ivanova, A.E. Usachev and Yu. V.<br />
Yablokov, Sov. Phys.-Solid State (USA) 29, 1608<br />
(1987).<br />
190 T.A. Ivanova, A.E. Usachev and Yu. V.<br />
Yablokov, Sov. Phys.-Solid State (USA) 30, 299<br />
(1988).<br />
191 R. Jablonski, Ser. Fiz. (Univ. In Adaman<br />
Mickiewicza Poznanio) 67, 237 (1991).<br />
192 V.K. Jain, V.S. Yadav, L. Pandey and D. Kumar,<br />
J. Non-Cryst. Solids 93, 426 (1987).<br />
193 V.K. Jain and V. Kapoor, Ada. Phys. Pol.<br />
A 81, 579 (1992).<br />
194 A. Janossy and R. Chicault, Physica C (Am-<br />
sterdam) 192, 399 (1992).<br />
195 B. Janusz and S. Shulamith, J. Am. Chem.<br />
Soc. 113, 3303 (1991).<br />
196 B. Janusz and S. Shulamith, J. Am. Chem.<br />
Soc. 112, 5019 (1990).<br />
197 A. Ei. Jazouli, J.L. Soubeyroux, J.M. Dance<br />
and G. Le Flem, J. Solid State Chem. (USA) 65,<br />
531 (1986).<br />
198 A.Ei. Jazouli, M. Alami, R. Brochu, J.M.<br />
Dance, G. Le Flem and P. Hagenmuller, J. Solid<br />
State Chem. (USA) 71, 444 (1987).<br />
199 D. Jean -Michel, V. J. Jacques and P. Josik,<br />
J. Non-Cryst Solids 86, 88 (1986).<br />
200 C. Juarez-Garcia, M.P. Hendrich, T.R. Holman,<br />
L. Rue and E. Munck, J. Am. Chem. Soc.<br />
113, 518 (1991).<br />
201 C. Juarez-Garcia, M.P. Hendrich, T.R. Holman,<br />
L. Rue and E. Munck, J. Am. Chem. Soc.<br />
113, 518 (1991).<br />
202 J. Julia and J. T. Boguslowa, Bull. Pol. Acad.<br />
Sci. Chem. 36, 443 (1989).<br />
203 K. Kaczmarska, E. Kwapulinska and A. Szytula,<br />
J. Less-Common. Met. 153, 229 (1989).<br />
204 K. Kaczmarska and E. Kwapulinska, J. Magn.<br />
Magn. Mater. 89, L267 (1990).
Vol. 16, No. 3/4 249<br />
205<br />
K. M. Kadish, B.G. Maiya and C. Araullo-<br />
Mcadamas J. Phys. Chem. 95, 427 (1991).<br />
206<br />
K. Kanoda., T. Takahashi, T. Kawagoe, T.<br />
Mizoguchi, S. Kagoshima and M. Hasumi, Jpn. J.<br />
Appl. Phys. Pt.l Regul. Pap. Short Notes (Jpn)<br />
26, 2018 (1987).<br />
207<br />
R. Karim, H. How, A. Widom and C. Vittoria,<br />
IEEE Trans. Magn. 26, 1439 (1990).<br />
208<br />
R. Karim, R. Seed, H. How, A. Widom, C.<br />
Vittoria, G. Balestrino and P. Paroli, J. Appl. Phys.<br />
67, 5064 (1990).<br />
209<br />
V. Kataev, G.Winkel, D. Khomskii. D.<br />
Wohlleben, W. Crump, K.F. Tebbe and J. Hahn,<br />
Solid State Commun. 83, 435 (1992).<br />
210<br />
S. Kazushi, K. Ryusuke, Y. Akagi, H.<br />
Taniguchi, Y. Nakajima and S. Kataska, Jpn. J.<br />
Appl. Phys. Pt. 1 (Supp. 26-3, Proc. Ind. Conf.<br />
Low Temp. Phys. 18th (1987) Pt. 3) 26, 2119<br />
(1987).<br />
211<br />
L. H. Keun, Bull. Korean Chem. Soc. 12,<br />
499 (1991).<br />
212<br />
R.M. Khachturyan, A.K. Petrosyan and E.G.<br />
Sharoyan, Sov. Phys. Solid-State (USA), 27, 1626<br />
(1985).<br />
213<br />
P. V. Khadikar, S. M. Ali, N. Spare and B.<br />
Pol, Ada. Chim. Hung. 125, 757 (1988).<br />
214<br />
G.V. Kharlamov, V.N. Romannikov and V.F.<br />
Anvfrienko, Kinet. Katal31, 1276 (1990).<br />
215<br />
T. Kimihito, F. Nobuo, N. Shigemitsu, Jpn.<br />
J. Appl. Phys. Pt.2 29, L2187 (1990).<br />
216<br />
T. Kimihito, Jpn. J. Appl. Phys. Pt. 1 29,<br />
656 (1990).<br />
217<br />
T. Kimihito, F. Nobuo and N. Shigemitsu,<br />
Jpn. J. Appl. Phys. Pt. 1 29, 868 (1990).<br />
218<br />
T. Kimihito, F. Nobuo and N. Shigemitsu,<br />
Jpn. J. Appl. Phys. Pt. 2 29, L757 (1990).<br />
219<br />
R. Kirmse, K. Koehler, O. R. Maria, W. Dietzsch,<br />
E. Hoyer and G. Zwanenburg, Inorg. Chem.<br />
29, 4073 (1990).<br />
220<br />
D. Kivelson, J. Chem. Phys. 33, 1094 (1960).<br />
221<br />
M. A. Klonkowski and C. W. Schlaepfer, J.<br />
Non.Cryst. Solids 149, 189 (1992).<br />
222<br />
T. Kobayashi, H. Katsuda, Y. Sakabe, K. Iwai<br />
and S. Kanba, Phase Transit. (UK) 12, 215 (1988).<br />
223<br />
T. Kobayashi, H. Katsuda, K. Hayashi, M.<br />
Tokumoto and H. Ihara, Jpn. J. Appl. Phys. Pt. 2<br />
Lett. (Jpn) 27, 670 (1988).<br />
224<br />
K. Koga, M. Suzuki and H. Yasuoka, Synth.<br />
Met. 12, 467 (1985).<br />
225<br />
J. Kohout, J. Mrozinski and M. Hvastijova, Z.<br />
Phys. Chem. (Leipzig) 270, 975 (1989).<br />
226<br />
K. Kojima, K. Ohbayashi. M. Udagawa and<br />
T. Hihara, Jpn. J. Appl. Phys. Pt.2 26, L766<br />
(1987).<br />
227<br />
Y. A. Koksharov, V.V. Moshchalkov, A.A.<br />
Gippius, B.V. Bill, J. Zoubkova, S.V. Gudenko and<br />
A.N. Mezhuev, Physica C (Amsterdam) 185-189,<br />
1151 (1991).<br />
228<br />
M. Korkmaz, B. Aktas and G. Raoult J. Phys.<br />
Chem. Solids 46, 1031 (1985).<br />
229<br />
A.A. Koshta, Yu. N. Shvachko, A.A. Romanyukha,<br />
O.Z. Kzusainov and V.V. Ustinov, Bull.<br />
Magn. Reson. 12, 89 (1990).<br />
230<br />
I. Kouacik, J. Kozisek, J. Hanusik, H.<br />
Langfelderova, V.K. Voronkova, L.V. Mosina and<br />
Y. V. Yablokov, J. Coord. Chem. 26, 45 (1992).<br />
231<br />
C. B. Krishna and M.V. Rajasekharan, Phys.<br />
Rev. 5 42, 7794(1990).<br />
232<br />
C. B. Krishna, M.V. Rajasekharan, J.L. Bott,<br />
S. Atwood and B.L. Ramakrishna, Inorg. Chem.<br />
31, 2843 (1992).<br />
233<br />
R.M. Krishna, J.L. Rao, P. Chand and S.V.J.<br />
Lakshman, Phys. Stat. Solidi (B) 151, 615 (1989).<br />
234<br />
R. M. Krishna, J. L. Rao and S.V.J. Lakshman,<br />
Spectrochim Ada. A 48, 245 (1992).<br />
235<br />
R.M. Krishna, J.L. Rao, V.V. Bhaskar and<br />
S.V.J. Lakshman, Phys. Stat. Solidi (B) 171, 227<br />
(1992).<br />
236<br />
V. M. Krishna, N.V.S. Rao and V.G.K.M.<br />
Pisipati, Indian J. Pure Appl. Phys. 24, 358 (1986).<br />
237<br />
V. M. Krishna, N.V. Rao and V.G.K.M. Pisipati,<br />
Indian. J. Pure Appl. Phys. 26, 330 (1988).<br />
238<br />
N. Kunio, T. H. Oshige So, W. N. Y. Mari<br />
and O. Heijiro, Bull. Chem. Soc. Jpn. 59, 2589<br />
(1986).<br />
239<br />
P. Kuppusamy and P.T. Manoharam, J. Indian<br />
Chem. Soc. 63, 95 (1986).<br />
240<br />
J. Kuriata, L. Sadlowski, E. Lipinski, W.<br />
Stawarczyk and N. Guskos, Ada. Phys. Polonica<br />
A 73, 543 (1988).<br />
241<br />
H.A. Kuska and M.T. Rogers, Spectroscopy<br />
In Inorganic Chemistry, Vol.11, Academic Press<br />
(1971).<br />
242<br />
S. Laly and P. Geetha, Thermochim. Ada.<br />
168, 43 (1990).<br />
243<br />
M. Lalia-Kantouri and H. Manolis, Polyhe-<br />
dron 11, 789 (1992).
250 Bulletin of Magnetic Resonance<br />
244 B. M. Laure, J. Yves, A. Bencini, D. Gatteschi<br />
and K. Olivier, Inorg. Chem. 24, 263 (1985)<br />
245 A.V. Lazuta, Physica C (Amsterdam) 181,<br />
127 (1991).<br />
246 M. Leluk, B. Jezowska-Trzebuiatowska and J.<br />
Jezierska, Polyhedron 10, 1653 (1991).<br />
247 D.L. Leslie-Pelecky and J.A. Cowen, Phys.<br />
Rev. £46, 9254 (1992).<br />
248 P.R. Levstein, C.A. Steren, A.M. Gennaro and<br />
R. Caivo, Chem. Phys. 120, 449 (1988).<br />
249 P.R. Levstein, C. Rafael, E.E. Castellano,<br />
O.E. Piro and B.E. Rivero, Inorg. Chem. 29, 3918<br />
(1990).<br />
250 Q. Lin, Bopuxue Zazhi 6, 201 (1989).<br />
251 D.M. Lindsay, G.A. Thomson and Wang<br />
Youqi, J. Phys. Chem. 91, 2630 (1987).<br />
252 B. Lingjun and C. Rongti, Jiegou Huaxue<br />
(China) 4, 275 (1985).<br />
253 D. Liqun, Z. Ke and Y. Xu, Chin. Sci. Bull.<br />
34, 523 (1989).<br />
254 D.R. Lovenz and J.R. Wasson, J. Inorg. Nucl.<br />
Chem. 37, 2297 (1975).<br />
255 S.R.W. Louro and G, Bemiki, J. Magn. Re-<br />
son. 28, 427 (1977).<br />
256 J.T. Lue, Phys. Rev. B 38, 4592 (1988).<br />
257 S.N. Lukin, Fiz. Tverd. Tela. (Leningrad)<br />
31, 244 (1989).<br />
258 S.N. Lukin, Fiz. Tverd. Tela (Leningrad) 33,<br />
47 (1991).<br />
259 D.L. Lyfar, D.P. Moiseev, A.A. Motuz, S.M.<br />
Ryabchenko and S.K. Tolpygo, Sov. J. Low Temp.<br />
Phys. (USA) 13, 876 (1987).<br />
260 B. Madhu, B.A. Sastry, S.M. Asadullah, G.<br />
Ponticelli and G. Puggioni, Indian J. Phys. A 62,<br />
539 (1988).<br />
261 B. Madhu, B.A. Sastry, G. Ponticelli and R.<br />
Pinna, Indian J. Phys. A 63, 404 (1989).<br />
262 B. Madhu, B.A. Sastry, G. Ponticelli and<br />
G.Puggioni, J. Phys. Soc. Jpn. 59, 3487 (1990).<br />
263 B. Madhu, B.A. Sastry, G. Ponticelli and G.<br />
Puggioni, J. Phys. Soc. Jpn. 59, 3483 (1990).<br />
264 K. Madhukar, B. Madhu, B.A. Sastry, G. Ponticelli<br />
and G. Puggioni, Indian J. Phys. A 62, 544<br />
(1988).<br />
265 V.M. Maevskii, N.I. Vitrikhovskii, E.V. Mozdor<br />
and A.B. Roitsin, Poverkhnost (Russ.) 11, 73<br />
(1986).<br />
266 Z. Maggie and L. Kevan, J. Phys. Chem. 96,<br />
8989 (1992).<br />
267 G. Magne, H. Bill and D. Lovy, Solid State<br />
Comrnun. 53, 661 (1985).<br />
268 A.K. Maki and B.R. Mcgarvey, J. Chem.<br />
Phys. 29, 31 (1958).<br />
269 B. Marceline and L. Kevan, J. Phys. Chem.<br />
96, 9992 (1992).<br />
270 V. Marian, M. Milan, P. Peter, V. Fedor and<br />
M. Milan, Chem. Phys. Lett. 174, 591 (1990).<br />
271 V. Marian, M. Milan, M. Harry, R.F. Bilton<br />
and P. Peter, Chem. Phys. Lett. 183, 372 (1991).<br />
272 K. Martti, M. R. Sundberg, M. Milan and M.<br />
Jerzy, Inorg. Chim. Ada. 162, 39 (1989).<br />
273 J. Martinek and B. Susla, Ser. Fiz. (Univ.In<br />
Adaman Mickiewicza Poznanio) 67, 299 (1991).<br />
274 A. Masanori and H. Toshikazu, J. Phys. Soc.<br />
Jpn. 56, 1178 (1987).<br />
275 I. Masaki, A. Tetsuo, I. Motomichi, G. Heriberto,<br />
M.B. Inove and D.V.I. Nakamura, Koord.<br />
Khim. 17, 382 (1991).<br />
276 G. Mauro, M. Stefania, G. Dante and Z. Claudia,<br />
Chem. Mater. 3, 752 (1991).<br />
277 H.M. Mcconnell, J. Chem. Phys. 25, 709<br />
(1956).<br />
278 W.R. Mckinnon, J.R. Morton, K.F. Preston<br />
and L.S. Selwyn, Solid State Commun. 65, 855<br />
(1988)<br />
279 B.D. Mcphail and B. A. Goodman, J. Chem.<br />
Res. Synop. 9, 276 (1985).<br />
280 F. Mehran, K.W.H. Stevens, M.W. Shafer and<br />
W.J. Fitzpatrck, Phys. Rev. B 32, 7083 (1985).<br />
281 F. Mehran, S.E. Barnes, T.R. Mcguire, W.J.<br />
Gallagher, R.L. Sandstrom, T.R. Dinger and D.A.<br />
Chance, Phys. Rev. B 36, 740 (1987).<br />
282 F. Mehran, S.E. Barnes, T.R. Mcguire, T.R.<br />
Dinger, D.L. Kaiser and F. Holtzberg, Solid State<br />
Commun. 66, 299 (1988).<br />
283 F. Mehran, S.E. Barnes, E.A. Giess and T.R.<br />
Mcguire, Solid State Commun. 67, 55 (1988).<br />
284 F. Mehran. S.E. Barnes, G.V. Chandrashekhr,<br />
T.R. Mcguire and M.W. Shafer, Solid<br />
State Commun. 67, 1187 (1988).<br />
285 F. Mehran, T.R. Mcguire, J.F. Bringley and<br />
B.A. Scott, Phys. Rev. B 43, 11411 (1991).<br />
286 V.F. Meshcheryakov and V.A. Murashov, Zh.<br />
Eksp. Teor. Fiz. 101, 241 (1992).<br />
287 G. Michel, W. Michel, CD. Buchecker, S. J.<br />
Pierre and B.Gerald, Inorg. Chem. Ada. 167, 157<br />
(1990).<br />
288 G. Michel, W. Michel, CD. Buchecker, S. J.
Vol. 16, No. 3/4 251<br />
Pierre and B. Gerald, Inorg. Chim. Ada. 167, 161<br />
(1990).<br />
289 J. Minge, S. Waplak and W. Wojtowicz, Ser.<br />
Fiz. (Univ. In Adaman Mickiewicza Poznanio) 54,<br />
407 (1985).<br />
290 E. Minner and H. Bill, Chem. Phys. Lett.<br />
175, 231 (1990).<br />
291 B.N. Misra and R. Kripal, Ada. Phys. Pol.<br />
76a, 869 (1989).<br />
292 B.N. Misra and R. Kripal, J. Khim. Phys.<br />
Phys.-Chim Biol. 86, 2191 (1989).<br />
293 S. K. Misra and C. Wang, Magn. Reson. Rev.<br />
14, 157 (1990).<br />
294 S.K. Misra, Physica B 121, 193 (1983).<br />
295 S.K. Misra, Physica B+C124, 53 (1984).<br />
296 S.K. Misra, J. Magn. Reson. 23, 403 (1976).<br />
297 S.K. Misra, Magn. Reson. Rev. 10, 285<br />
(1986); Magn. Reson. Rev. 12, 191 (1987).<br />
298 S.K. Misra, Physica B 151, 433 (1988).<br />
299 S.K. Misra, Arab. J. Sci. Engg. 13, 255<br />
(1988).<br />
300 S. K. Misra and J. Sun, Phys. Rev. B 44,<br />
11862 (1991).<br />
301 S.K. Misra and U. Orhun, Phys. Rev. B 39,<br />
2856 (1989).<br />
302 S. K. Misra and K. Kumar, J. Chem. Phys.<br />
84, 2514 (1986).<br />
303 S.K. Misra and K. Mojtaba, J. Chem Phys.<br />
83, 1490 (1985).<br />
304 S.K. Misra and K. Kumar, Physica (B+C)<br />
138, 171 (1986).<br />
305 S.K. Misra and C. Wang, Phys. Stat. Solidi<br />
(B) 154, 259 (1989).<br />
306 S.K. Misra and L.E. Misiak, Solid State Com-<br />
mun. 72, 117 (1989).<br />
307 S.K. Misra and C. Wang, J. Phys.: Condensed<br />
Matter 1, 771 (1989).<br />
308 S.K. Misra and C. Wang, Phys. Rev. B 41, 1<br />
(1990).<br />
309 S.K. Misra, X . Li and C. Wang, J. Phys.:<br />
Condensed Matter 3, 8479 (1991).<br />
310 S.K. Misra, K. Mojtaba and S. Z. Korczak,<br />
Physica B 182, 186 (1992).<br />
3U S.K. Misra and J. Felsteiner, Phys. Rev. B<br />
46, 11033 (1992).<br />
312 M. Mitsuhird, U. Chiaki, O. Akihiro, D.<br />
Muneyuki and Y. Kazua J. Phys. Soc. Jpn. 54,<br />
4767 (1985).<br />
313<br />
T. Mori, H. Inokuchi, A. Kobayashi, R. Kato<br />
and H. Kobayashi, Phys. Rev. B 38, 5913 (1988).<br />
314<br />
J.R. Morton, K.F. Preston and Y. Le Page, J.<br />
Magn. Reson. 66, 118 (1986).<br />
315<br />
V.C. Mouli and G.S. Sastry, Pramana, (India)<br />
26, 435 (1986).<br />
316<br />
V. C. Mouli and G. S. Sastry, Indian J. Pure<br />
Appl. Phys. 27, 101 (1989).<br />
317<br />
V. C. Mouli, R. S. Sunder and G. S. Reddy,<br />
Indian J. Pure Appl. Phys. 28, 478 (1990).<br />
318<br />
K.A. Muller, The Study Of Structural Phase<br />
Transitions Using Paramagnetic Resonance, Lecture<br />
I-III,Geilo (Norway), 1971.<br />
319<br />
V.I. Murav'Ev, Sov. Phys. -Solid State<br />
(USA) 28, 704 (1986).<br />
320<br />
V.I. Murav'Ev, J. Struct. Chem. (USA) 27,<br />
390 (1986).<br />
321<br />
A.A. Muradyan, T.A. Garibyan, K.G.<br />
Gazaryan and M.G. Arutyunyan, Sverkhprovodimost:<br />
Fiz. Khim. Tekh. 4, 1716 (1991).<br />
322<br />
A.A. Muradyan, T.A. Garibyan and M.G.<br />
Arutyunyan, Kind. Katal. 33, 605 (1992).<br />
323<br />
H. Murrieta, G. Aguilar, J. Ramirez, T.<br />
Akachi, R.A. Escudero and J. Rubio, J. Phys. C<br />
21, 4999 (1988).<br />
324<br />
K. Murthy, G. Dhanaraj, H.L. Bhat and S.V.<br />
Bhat, Mol. Phys. 65, 181 (1988).<br />
325<br />
K. Murthy, K.B.R. Varma, S.V. Bhat and<br />
C.N.R. Rao, Mod. Phys. Lett. B (Singapore) 2,<br />
1259 (1988).<br />
326<br />
K. Nagata, K. Saito, Y. Egawa, R. Liang and<br />
T. Nakamura, J. Magn. Magn. Mater. 90-91, 649<br />
(1990).<br />
327<br />
Y. N. Naidu, J. L. Rao and S.V.J. Lakshman,<br />
Phys. Stat. Solidi (B) 169, K109 (1992).<br />
328<br />
F. Nakamura, K.Senoh, T. Tamura, S.<br />
Nakada, A.Shimizij, Y. Ochiai, Y. Narahara, Adv.<br />
Supercond. 2, 551-4 (1989) Prof. Int. Synp. Supercond.<br />
2nd (Pub. 1990).<br />
329<br />
F. Nakamura, K. Senoh, T. Tamura, Y. Ochiai<br />
and Y. Narahara, Physica C (Amsterdam) 162-164,<br />
1287 (1989).<br />
330<br />
M. Narayana and G. S. Sastry, J. Magn.<br />
Magn. Mater. 8, 142 (1978).<br />
331<br />
S. Nazir, Gomal Univ. J. Res. 9, 1 (1989)<br />
(Pub. 1990).<br />
332<br />
R. Neimann and D. Kivelson, Ibid. 35, 149,<br />
156,162(1962).
252<br />
333<br />
E.I. Neimark and I.M. Zaritskii, Sverkhprovodimost.<br />
Fiz. Khim. Tekh. 2, 63 (1989).<br />
334<br />
P. Nevenka, N. L. Vesna and S. Vladinial, Z.<br />
Anorg. All. G. Chem. 613, 132 (1992).<br />
335<br />
Y. NOda, M. Mori and Y. Yamada, J. Phys.<br />
Soc. Jpn. 45, 954 (1978); J. Phys. Soc. Jpn. 48,<br />
1288 (1980); Solid State Commun. 19, 1071 (1976);<br />
Solid State Commun. 23, 247 (1977).<br />
336p Nseir) j Pietrzak, R. Krzyminiewski, Z.<br />
Kruczynski and M. Januszczyk, Ser. Fiz. (Univ.<br />
In Adaman Mickiewicza Poznanio) 67, 247 (1991).<br />
337<br />
A. Ozarowski and D. Reinen, Inorg. Chem.<br />
25, 1704 (1986).<br />
3380p j Owens In Magnetic Resonance Of Phase<br />
Transitions, Ed. F.J. Owens, C.P. Poole, Jr.<br />
and H.A. Farach, Academic Press, Inc., New York<br />
(1979).<br />
339<br />
F. J. Owens and Z. Iqbal, Solid State Commun.<br />
68, 523 (1988).<br />
340<br />
F. J. Owens, J. Supercond. 2, 409 (1989).<br />
341<br />
I. Onyszkiewicz, M. Koralewski, P. Czarnecki,<br />
R. Micnas and S. Robaszkiewicz, Physica (B+C)<br />
147, 166 (1988).<br />
342<br />
G.K. Padam, G.L. Malhotra and S.K. Gupta,<br />
Solar Energy Materials 22, 303 (1991).<br />
343<br />
B. K. Pandeya and N. R. Patel, Indian J.<br />
Biochem. Biophys. 29, 245 (1992).<br />
344<br />
B. R. Patyal, B. L. Scott and R. D. Willett,<br />
Phys. Rev. B 41, 1657 (1990).<br />
345<br />
W.B. Paul, S.E. Wang and L.G. Rowan, Phys.<br />
Rev. 5 33, 585 (1986).<br />
346<br />
P. Pelikan, M. Valko, I. Kovacik , M. Mazur<br />
and A. Stasko, Chem. Pap. 44, 477 (1990).<br />
347<br />
R.P. Penrose, Nature 163, 992 (1949).<br />
348<br />
V.G.K.M. Pisipati, N.V.S. Rao, S. Padmaja,<br />
Y. Anjaneyulu and R. Prabhakara Rao, Magn. Reson.<br />
Chem. 24, 954 (1986).<br />
349<br />
G. Plesch, O. Svajlenova, C. Friebel and J.<br />
Kratsmarsmogrovic, Proc. Conf. Coord. Chem.<br />
12th, 289 (1989).<br />
350<br />
L.D. Popov, G.I. Bondarenko, A.A. Shvets<br />
and L.N. Etmetchenko, Zh. Obshch. Khim. 61,<br />
300 (1991).<br />
351<br />
B. Prabhakar, K. L. Reddy and P. Lingaiah,<br />
Indian J. Chemistry 27a, 217 (1988).<br />
352<br />
B.S. Prabhananda, Indian J. Pure Appl.<br />
Phys. 18, 823 (1980).<br />
353<br />
B.S. Prabhananda, Pramana 34, 491 (1990).<br />
Bulletin of Magnetic Resonance<br />
354<br />
B. Prabhakar, P. Lingaiah and K. Laxma<br />
Reddy, Polyhedron 9, 805 (1990).<br />
355<br />
C. J. Pyng, S. K. Jiunn, C. J. Li, Y. Wang, L.<br />
G. Hsiang and S. K. Pyeng, J. Chin. Chem. Soc.<br />
(Taipei) 38, 549 (1991).<br />
356<br />
C. Rafael and C.G.P. Mario, J. Phys.: Condens<br />
Matter 2, 9113 (1990).<br />
357<br />
K. Rajakrishna, K.G. Mallikarjun and R. S.<br />
Naidu, Asian J. Chem. 3, 408 (1991).<br />
358<br />
Y. V. Rakitin, R.D. Kasumov, G.V. Panova<br />
and G.M. Larin, Koord. Khim. (Russ.) 12, 1188<br />
(1986).<br />
359<br />
B. Rakvin, M. Pozek and A. Dulcic, Springer<br />
Ser. Solid-State Sci. 99, 239 (1990).<br />
360<br />
B. Rakvin, M. Pozek and A. Dulcic, Physica<br />
C (Amsterdam) 170, 166 (1990).<br />
361<br />
B.L. Ramakrishna, E.W. Ong and Z. Iqbal,<br />
Solid State Commun. 68, 775 (1988).<br />
362<br />
M.V. Ramana, P.S. Lakshmi, Syed Rahman,<br />
K. Sivakumar and G.S. Sastry, Mater. Sci. Engg.<br />
B 10, 25 (1991).<br />
363<br />
A. S. Rao, J. L. Rao and S.V.J. Lakshman, J.<br />
Phys. Chem. Solids 53, 1221 (1992).<br />
364<br />
J. L. Rao, R. M. Krishna and S.V.J. Lakshman,<br />
Solid State Commun. 66, 1185 (1988).<br />
365<br />
J. L. Rao, R. M. Krishna and S.V.J. Lakshman,<br />
J. Phys. Chem. Solids 51, 323 (1990).<br />
366<br />
S.N. Rao, P. Sivaprasad, Y.P. Reddy and P.S.<br />
Rao, Radi. Effe. Defects. Solids 124, 239 (1992).<br />
367<br />
K. Ravi and L. Kevan, J. Phys. Chem. 93,<br />
1654 (1989).<br />
308<br />
R.K. Ray and G. B. Kauffman, Inorg. Chem.<br />
Ada. 174, 237 (1990).<br />
369<br />
R.K. Ray and G. B. Kauffman, Inorg. Chim.<br />
Ada 173, 207 (1990).<br />
370<br />
B.J. Reddy, P. Sreeramulu, K. Ramesh and<br />
Y.P. Reddy, An. Asoc. Quim. Argent 76, 297<br />
(1988).<br />
371<br />
K. L. Reddy, S. Shrihari and P. Lingaiah, Indian<br />
J. Chem. 24a, 318 (1985).<br />
372<br />
K.M. Reddy, A.S. Jacob and B.J. Reddy, Ferroelectr.<br />
Lett. Sect. 6, 103 (1986).<br />
373<br />
D. Reinen and Friebel, Struct. Bonding<br />
(Berlin) 37, 1 (1979).<br />
374<br />
D. Reinen, M. Atanasov, G. St. Nikolov and<br />
F. Steffens, Inorg. Chem. 27, 1678 (1988).<br />
375<br />
M. J. Riley, M. A. Hitchman and D. Reinen,<br />
Chem. Phys. 102, 11 (1986).
Vol. 16, No. 3/4 253<br />
376 M. J. Riley, M.A. Hitchman, D. Reinen and<br />
S.Gabricle, Inorg. Chem. 27, 1924 (1988).<br />
377 L. C. Robert, L. Shuang and L.K. Thomson,<br />
Inorg. Chem. 29, 85 (1990).<br />
378 A. Rockenbauer, M. Gyor and T. Szabo-<br />
Planka, J. Chem. Phys. 86, 976 (1987).<br />
379 A. Rockenbauer, M. Gyor, G. Speier and Z.<br />
Tyeklar, Inorg. Chem. 26, 3293 (1987).<br />
380 A. Rockenbauer, Ser. Fiz. (Univ. In Adaman<br />
Mickiewicza Poznanio) 67, 99 (1991).<br />
381 A. Rockenbauer, A. Janossy, L. Korecz and S.<br />
Pekker, J. Magn. Reson. 97, 540 (1992).<br />
382 A.A. Romanyukha, Yu.N.Shvachko,. V. Yu.<br />
Irkhin, M.I. Katsnclson, A.A. Koshta and V.V. Ustinov,<br />
Physica C (Amsterdam) 171, 276 (1990).<br />
383 R.K. Roy and G. B. Kauffman, Inorg. Chim.<br />
Ada 174, 257 (1990).<br />
384 R.S. Rubins and D.K. De, J. Chem. Phys.<br />
83, 4400 (1985).<br />
385 R.S. Rubins, T.D. Black and J. Barak, J.<br />
Chem. Phys. 85, 3770 (1986).<br />
386 R.S. Rubins and J. E. Drumheller, J. Chem.<br />
Phys. 86, 6660 (1987).<br />
387 K.A. Sablina and A.M. Vorotinov, Solid State<br />
Commun. 76, 453 (1990).<br />
388 R. Samanta and A.K. Pal, Indian J. Cryog.<br />
15, 529 (1990).<br />
389 B.A. Sastry and G.S. Sastry, Physica 74, 151<br />
(1974).<br />
390 B.A. Sastry, B. Balaiah, R.Subramaniam, G.<br />
Ponticelli, M. Massacesi and G. Devoto, Indian J.<br />
Pure and Appl. Phys. 23, 320 (1985).<br />
391 B.A. Sastry, B. Balaiah, R. Subramanian, G.<br />
Ponticelli, G. Devoto and M.M Massacessi, Indian<br />
J. Pure Appl. Phys. 23, 279 (1985).<br />
392 B.A. Sastry, B. Balaiah, K.V.G. Reddy, B.<br />
Madhu, S.M. Massacesi and G. Devoto, Spectrochim.<br />
Acta. A, 41, 675 (1985).<br />
393 B.A. Sastry, K.V.G. Reddy, B. Balaiah, B.<br />
Madhu and G. Ponticelli, Indian J. Pure & Appl.<br />
Phys. 24, 258 (1986).<br />
394 B.A. Sastry, B. Balaiah, K.V.G. Reddy, B.<br />
Madhu, G. Ponticelli, M. Massacessi and G. Puggioni,<br />
Indian J. Pure Appl. Phys. 24, 460 (1986).<br />
395 B.A. Sastry, B. Balaiah, K.V.G. Reddy, B.<br />
Madhu and S. Md. Asadullah Indian J. Phys. A<br />
61, 173 (1987).<br />
396 B.A. Sastry, B. Balaih, K.V.G. Reddy, B.<br />
Madhu, G. Ponticelli, G. Devoto and M. Massacesi,<br />
Indian J. Phys. A 61, 221 (1987).<br />
397<br />
B.A. Sastry, B. Madhu and K, Madhu Kar,<br />
Indian J. Phys. A 62, 463 (1988).<br />
398<br />
M.D. Sastry, A.G.I. Dalvi, Y. Babu, R.M.<br />
Kadam, J.V. Yakhmi and R.M. Iyer, Nature (UK)<br />
330, 49 (1987).<br />
399<br />
M.D. Sastry, K.S. Ajayakumar, R.M. Kadam<br />
and G.M. Phatak, Physica C (Amsterdam) 170, 41<br />
(1990).<br />
400<br />
K. Satoshi, Y. Hiroshi and I. Masamoto, Bull.<br />
Chem. Soc. Jpn. 63, 3414 (1990).<br />
401<br />
N. Satyanarayana, Mol. Phys. 55, 111 (1985).<br />
402<br />
N. Satyanarayana, J. Phys. Chem. Solids 47,<br />
55 (1986).<br />
403<br />
F. Scheerlinck, I. Francois, L.V. Bockstal, P.<br />
Janssen, G. P. De, F. Herlach and J. Witters, Physica<br />
B (Amsterdam) 177, 101 (1992).<br />
404<br />
G.E. Selyutin, A.A. Shklyaen and A.M.<br />
Shulga, Izv. Akad. Nauk. SSSR, Ser. Khim. 6,<br />
1331 (1985).<br />
405<br />
G.E. Selyutin, Izv. Akad. Nauk SSSR, Ser.<br />
Khim. 6, 1447 (1989).<br />
406<br />
K. W. Seong, K. Y. Inn and C. S. Nak, Bull.<br />
Korean Chem. Soc. 11, 85 (1990).<br />
407<br />
D. Shaltiel, S.E. Barnes, H. Bill, M. Francois,<br />
H. Hagemann, J.Jegondaz, D. Lovy, P. Monod, M.<br />
Peter Et Al Physica C (Amsterdam) 161, 13 (1989).<br />
408<br />
X. Shangda and H. Bihui, Bopuxue Zaxhi 7,<br />
215 (1990).<br />
409<br />
K.B.N. Sharma,L.R. Moorthy,B.J. Reddy<br />
and S. Vedanand, Phys. Lett. (Netherlands) 132a,<br />
293 (1988).<br />
410<br />
G.T. Sheng and Y. J. Tsu, Solid State Commun.<br />
78, 123 (1991).<br />
411<br />
S. Siddiqui and R.E. Shepherd, Inorg. Chem.<br />
25, 3869 (1986).<br />
412<br />
H. Shiying, Y. Yuangeng, Y. Xiaozeng, B.<br />
Zhenwei and D. Anbang, Huaxue Wuli Xuebao 2,<br />
53 (1989).<br />
413<br />
K.N. Shrivastava, J. Phys. C20, L789 (1987).<br />
414<br />
S. Shulamith, Nato Asi Ser., Ser. B 174, 881<br />
(1988).<br />
415<br />
A.K. Siddhanta and B.D, Bhattacharyya, Indian<br />
J. Cryog. 15, 520 (1990).<br />
416<br />
R. Sikdar and A.K. Pal, Phys. Stat. Solidi<br />
(A) 89, 243 (1985).<br />
417<br />
P. Sivaprasad, K. Ramesh and Y.P. Reddy,<br />
Phys. Stat. Solidi (B) 118, K103 (1990).
254<br />
418 P. Sivaprasad, K. Ramesh and Y.P. Reddy, J.<br />
Phys.: Condensed Matter 2, 5595 (1990).<br />
419 J. Sivy, G. Plesch, J. Kratsmar-Smogrovic, O.<br />
Svajlenova and V. Kettmann, Proc. Conf. Coord.<br />
Chem. 12th, 349 (1989).<br />
420 G. Slimane, F. M. Otman, B. J. Claude and<br />
S. Yves, Physica (B+C) 114, 200 (1987).<br />
421 V. Somasekharam, and Y.P. Reddy, Czech. J.<br />
Phys. Sect. B (Czechoslovakia) 36, 1074 (1986).<br />
422 V. Somasekharam, P.S. Prasad and Y.P.<br />
Reddy, Phys. Scr. (Sweeden) 33, 169 (1986).<br />
423 Y. Songliu, J. Sizho, C. Zhojia, C. Ning, Z.<br />
Jiaqi and G. Weiyan, Diwen Wuli Xuebao 12, 279<br />
(1990).<br />
424 Y. Songliu, J. Sizhao and C. Zhaojia, Diwen<br />
Wuli Xuebao 12, 284 (1990).<br />
425 N. Sreehari and P.T. Manoharan, Mol. Phys.<br />
63, 1077 (1988).<br />
426<br />
B. Sreedhar, J. L. Rao and S.V.J. Lakshman,<br />
J. Non-Cryst Solids 124, 216 (1990).<br />
427<br />
D. Srinivas, M.V.B.L.N. Swamy and S. Subramanian,<br />
Mol. Phys. 57, 55 (1986).<br />
428<br />
J. Stankowski, P.K. Kahol, N.S. Dalai and J.S.<br />
Moodera, Phys. Rev. B 36, 7126 (1987).<br />
429<br />
J. Stankowski, W. Kempinski and Z. Trybula,<br />
Ada. Phys. Pol. A 80, 571 (1991).<br />
430<br />
J. Stankowski, W. Kempinski and Z. Trybula,<br />
Ser. Fix. (Univ. In Adaman Mickiewicza Poznanio)<br />
67, 85 (1991).<br />
431<br />
J. Stankowski, W. Hilczer, J. Baszynski, B.<br />
Czyzak and L. Szczepamska, Solid State Commun.<br />
77, 125 (1991).<br />
432<br />
D. T. Stefaan and R. A. Schoonheydt, Zeolites<br />
11, 155 (1991).<br />
433<br />
C.A. Steren, A.M. Gennaro, P.R. Levstein and<br />
R.J. Calvo, J. Phys.: Condensed Matter 1, 637<br />
(1989).<br />
434<br />
C.A. Steven, R. Calvo, E.E. Castellano, M.S.<br />
Fabiane, and O.E. Piro, Physica B 164, 323 (1990).<br />
435<br />
K.W.H. Stevens, Czech. J. Phys. 41, 819<br />
(1991).<br />
436<br />
M. Strasak and Z. Durcova, J. Coord. Chem.<br />
22, 99 (1990).<br />
437 P. Subramanian and N. Hariharan, Phys.<br />
Stat. Solidi (B) 135, 731 (1986).<br />
438 K. Sugawara and S. Tanaka, Mod. Phys. Lett.<br />
5 6,879 (1992).<br />
439 K. Sugawara, D.J. Baar, Y. Shiohara and S.<br />
Tanaka, Mod. Phys. Lett. B 5, 779 (1991).<br />
Bulletin of Magnetic Resonance<br />
440 M. Suhara and T. Kobayashi, J. Phys. Chem.<br />
Solids 53, 27 (1992).<br />
441 M. M. Suleman, C.A. Hogarth and K.A.K.<br />
Lott, J. Mater Sci. Lett. 8, 1344 (1989).<br />
442 N.M. Suleimanov, V.E. Kataev, E.F. Kukovitskii,<br />
H. Drulis and G. Chodzynski, Sverkhprovodimost:<br />
Fiz. Khim. Tekh. 3, 608 (1990).<br />
443 N.M. Suleimanov, H. Drulis, A.D. Shengelaya<br />
and G.W. Chadzynski, Sverkhprovodimost: Fiz.<br />
Khim. Tekh. 4, 1925 (1991).<br />
444 C.S. Sunandana and K.S. Rao, Phys. Stat.<br />
Solidi (B) 90, 681 (1985).<br />
445<br />
C.S. Sunandana, Phys. Stat Solidi (A) 101,<br />
37 (1987).<br />
446<br />
C.S. Sunandana, Mater. Res. Bull. 25, 403<br />
(1990).<br />
447 W.V. Sweeney, K. D. Lavhllee and K. David,<br />
Inorg. Chem. Acta 99, L9 (1985).<br />
448 A. Syamal, Indian J. Chem. Soc. 64, 719<br />
(1987).<br />
449 A. Syamal, Rev. Roum. Chim. 34, 1887<br />
(1989).<br />
450 N. Takeuchi, K. Inabe, S. Nakamura and M.<br />
Adachi, J. Soc. Mater. Sci. Jpn. 34, 100 (1985).<br />
451 I. Takekazu, K. Keiichi, K. Kazushi and T.<br />
Toshihiro, Physica C (Amsterdam) 185-189, 1201<br />
(1991).<br />
452 H. Tanaka, K. Ito and K. Nagata, J. Phys.<br />
Soc. Jpn. 54, 4345 (1985).<br />
453 R. H. Theodore, A. A. Kevin, P. A. Oren,<br />
P. H. Michael, C.Juarez-Garcia, M. Eckard and Q.<br />
Lawrence Jr., Angew Chem. 102, 933 (1990).<br />
454 C. Tien, J.S. Karra and G. Kemmerer Phys.<br />
Rev. 5 37, 9564 (1988).<br />
455 D.V. Tolkachev, A.A. Khodak, S.P.<br />
Solodovnikov , N.N. Bubnov and M.I. Kabachnik,<br />
Izv. Akad. Nauk. SSSR, Ser. Khim. 12, 2756<br />
(1990).<br />
456 M. Ugoloey, V.L. Shestakov and A.K.<br />
Potapovich, J. Appl. Spectrosc. (USA) 43, 868<br />
(1985).<br />
457 M. M. Ugrankar and S. B. Prabhananda,<br />
Transition Metal Chem. (London) 15, 361 (1990).<br />
458 G.C. Upreti and R.S. Saraswat, Magn. Reson.<br />
Rev. 7, 215 (1982).<br />
459 M. Valko, P. Pelikan, S. Biskupic and M.<br />
Mazur, Chem. Pap. 44, 805 (1990).<br />
460 L. Van Robbroeck, A. Bouwen and D. Schoemaker,<br />
Phys. Stat. Solidi (B) 132, 565 (1985).
Vol. 16, No. 3/4 255<br />
461 L. Van Robbroeck, E. Goovaerts and D.<br />
Schoemaker, Phys. Stat. Solidi (B) 132, 179<br />
(1985).<br />
462 J. V. Tol, J.H. V. D. Waals, Chem. Phys.<br />
Lett. 194, 288 (1992).<br />
463 R.J. Van Zee and W. Jr. Waltner, Chem.<br />
Phys. Lett. 162, 437 (1989).<br />
464 A.G. Vedeshwar, H.D. Bist, S.K. Agarwal and<br />
A.V. Narlikar, Physica C (Amsterdam) 162-164,<br />
11573 (1989).<br />
465 J.K. Verma, O. Kumar and S.D. Roy, Curr.<br />
Science 57, 1236 (1988).<br />
466 D.C. Vier, S. Schultz, C. Rettori, D. Rao, S.B.<br />
Oseroff, M. Thova, Z. Fisk and S.W. Cheong, J.<br />
Appl. Phys. 69, 4872 (1991).<br />
467 G.P. Vishnevskaya, R. Sh. Safin, V.B.<br />
Kargman, V.D. Kopylova, N.I. Yurchenko and E.N.<br />
Frolova, Zh. Fiz. Khim. 65, 1023 (1991).<br />
468 M. Vithal, R. Jagannathan and C.S. Sunandana,<br />
Spectrochim Ada. Pt. A 41, 861 (1985).<br />
469 L. Vittorio and L. Kevan, J. Phys. Chem. 96,<br />
3391 (1992).<br />
470 V.K. Voronkova, L.V. Mosina, Yu. V.<br />
Yablokov, I. Kovacik and H. Langfelderova, Proc.<br />
Conf. Coord. Chem. 13th, 338 (1991).<br />
471 V.K. Voronkova, L.V. Mosina, Yu. V.<br />
Yablokov, M.A. Yampol'Skaya, G.S. Matuzenko,<br />
Yu. A. Simonov, B. Ya. Kuyavskaya, N.V. Gerbeleu<br />
and V.K. Bel'Skii, J. Struct. Chem. (USA),<br />
27, 562 (1986).<br />
472 J. Walczak, H. Debinski, B. Muraszko, J.<br />
Kuriata and L. Sadlowski, Phys. Stat. Solidi (A)<br />
97, 291 (1986).<br />
473 W.G. Waller and M.T. Rogers, J. Magn. Re-<br />
son. 18, 39 (1975).<br />
474 C. Wang, Avail. NLC. From Diss. Abstr. Int.<br />
B51, 1346 (1990).<br />
475 D.M. Wang, I. Kovacik, E.J. Reijerse and D.<br />
Boere, J. Chem. Phys. 97, 3897 (1992).<br />
476 S. Waplak, S. V. Hugo and J.E. Drumheller,<br />
Phys. Rev. B 32, 48 (1985).<br />
477 S. Waplak, V.H.<br />
Schmidt and J.E. Drumheller, Phys. Rev. B 34,<br />
6532 (1986).<br />
478 S.H. Wasfi, A.L.Rheingold, G.F. Kokoszka<br />
and A.S. Goldstein, Inorg. Chem. 26, 2934 (1987).<br />
479 A. Weselucha-Birczynska, S.K. Hoffmann, K.<br />
Dyrek and M. Labanowska, J. Mol. Struct. 219,<br />
85 (1990).<br />
480 H. Wojakowska, R. Krzyminiewski R and M.<br />
Januszczyk, Mater. Sci. 14, 127 (1988).<br />
481 W. Wojtowicz and J. Minge, Ada. Phys. Pol.<br />
A 70, 715 (1986).<br />
482 K. Wolfgang and M. Michael, J. Chem. Soc.<br />
Faraday Trans. 87, 3185 (1991).<br />
483 M. Wolfgang, V. Fritz, W. K. Peter and A.<br />
Issam, Z. Chem. 30, 297 (1990).<br />
484 J. Wqlczak, B. Muraszko, H. Debinski and J.<br />
Kuriata, Seria Fizyka NR (Poland) 53, 283 (1985).<br />
485 G. Wrzeszcz, A. Lodzinska and R. Franciszek,<br />
Pol. J. Chem. 65, 785 (1991).<br />
486 G. Wuebbeler and O.F. Schimer, Phys. Stat.<br />
Solidi (B) 174, K21 (1992).<br />
487 Y. V. Yablokov, S. J. Kratsmar, V.K.<br />
Voronkora, L.V. Mosina, O. Svajlenova and M. Zemlicka,<br />
Zh. Neorg. Khim. 31, 707 (1986).<br />
488 A. Yadav and V.P. Seth, Phys. Chem.<br />
Glasses 27, 182 (1986).<br />
489 A. Yadav and V.P. Seth, J. Mater. Science<br />
22, 239 (1987).<br />
490 A. Yadav, V.P. Seth and S.K. Gupta, J. Non-<br />
Cryst. Solids 101, 7 (1988).<br />
491 B.P. Yadava, B.P. Shukla and B. Singh, Proc.<br />
Natl. Acad. Sci. (India) Sect. A 60, 33 (1990).<br />
492 B.P. Yadava and B. Singh, Proc. Natl. Acad.<br />
Sci. (India) Sect. A 61, 293 (1991).<br />
493y Yamada In Electron-Phonon Interaction<br />
and Phase Transitions, Ed. By T. Riste, Plenum,<br />
New York, 1977.<br />
494 J. J. Yeoul and C. S. Ho, Sae Mulli. 30, 197<br />
(1990).<br />
495 L. Yomg, T. Kunihiko, I. Kazuhiko and A.<br />
Nagao, Bull. Chem. Soc. Jpn. 61, 4067 (1988).<br />
496 J.T. Yu and K.H. Lii, Solid State Commun.<br />
65, 1379 (1988).<br />
497 J.T. Yu, J. G.Hwang, T. C. Chu and K.H. Lii,<br />
Solid State Commun. 70, 167 (1989).<br />
498 R. Yu. Abdulsabirou, R. Sh. Zhdanov, Ya.S.<br />
Irygzon, S.L. Korableva, I.N. Kurkin, L.L. Sedov,<br />
I.V. Yasonov and B. Lippold, Sverkhprovodimost:<br />
Fiz. Khim. Tekh. 2, 52 (1989).<br />
499 C. Yu, C. Lai, S.A. Marshall, D.R. Yoder-<br />
Short, Y.N. Zhang, Phys. Stat. ,Solidi (B) 157,<br />
379 (1990).<br />
500 S. Yuan, Y. Wang, S. Jin, Y. Yu, X. Xiong and<br />
G. Han, Supercond. Sci. Technol. 3, 204 (1990).<br />
501 I. Yuichiro and S. Koji, J. Phys. Soc. Jpn.<br />
61, 3067 (1992).
256<br />
502 J. Yves, L. Franasco and K. Olivier, Inorg.<br />
Chem. 29, 3048 (1990).<br />
503 V.N. Zaitsev, P.M. Solozhenkin, A.L Semikopnyi,<br />
D.N. Vovk and E.A. Bokai, Ukr. Khim. Zh.<br />
(Russ. Ed) 56, 348 (1990).<br />
504 M. Zamadics, X. Chen and L. Kevan, 3. Phys.<br />
Chem. 96, 5488 (1992).<br />
505 M.M. Zaripov and V.A. Ulanov, Sov. Phys.-<br />
Solid State (USA) 30, 896 (1988).<br />
506 C.E. Zaspel, J. Appl. Phys. 67, 6011 (1990).<br />
507 Z. Wang and W. Tang, Fenzi Cuihua 3, 230<br />
(1989).<br />
508 K. Zhao and L. Yichao, Yingyong Huaxue 7,<br />
45 (1990).<br />
509<br />
M.G. Zhao, X.N. Zhao and X.L. Zheng, Z.<br />
Phys. B: Condensed Matter (Wg) 73, 1 (1988).<br />
510<br />
M.G. Zhao and Q.L. Yan, Phys. Rev. B 39,<br />
862 (1989).<br />
511<br />
Y.Y. Zhou, Phys. Stat. Solidi (B) 147, 273<br />
(1988).<br />
512 Y.Y. Zhou, Phys. Stat. Solidi (B) 142, 229<br />
(1987).<br />
513 Z. Zimpel and S.K. Hoffmann, Physica B<br />
(Amsterdam) 172, 499 (1991).<br />
514 M. A. Zoruddu, M.I. Pilo, S. Renato, P. Rebecca<br />
and B. Riccardo, Inorg. Chem. Ada 184,<br />
185 (1991).<br />
515 G. Zwanenburg, J.J.M. Michiels and E. De<br />
Boer, Phys. Rev. B 42, 7783 (1990).<br />
Bulletin of Magnetic Resonano
Vol. 16, No. 3/4 257<br />
Table 1: Appendix: Data Tabulation<br />
S.No Host Lattice Site Spin-Hamiltonian Parameters<br />
1. AgCl<br />
2. AgCl<br />
3. AgCl<br />
4. AGeO3<br />
(A=Fe,Mn,Cu)<br />
5. (2-aminomethylquinoline),<br />
s-aminomethylquinoline:Cu(II)<br />
6. Antipyrine and its derivatives<br />
7. Ampholyte ANKB-50:Cu 2+ -Ni 2+<br />
8. AsCdCl3<br />
9. (04As)CuCl3<br />
10. BaCuC-2<br />
Y2Cu2Os<br />
11. BaCuO2<br />
12. BaCuC-2<br />
Y2Cu2Os<br />
Y2BaCuO5<br />
Al2CuO4<br />
13. Ba2Cu2O5<br />
14. [Ba(HCOO)2]<br />
15. [Ba(NH2SO3)2]<br />
16. B15C5- 65 Cu(II)<br />
I<br />
II<br />
I<br />
II<br />
§Z gx gy Az Ax<br />
2.302 2.067 2.067 115 41.5 41.5<br />
1.930 2.170 2.170<br />
2.09<br />
2.20 2.12 2.08<br />
2.11<br />
2.22 2.09 2.09<br />
2.22<br />
2.362 2.076 2.071 -151 7<br />
2.385 2.083 2.047 -90 37<br />
11<br />
82<br />
2.269 2.048 2.058 170G 20G 24G<br />
2.030 2.408 2.296 10.39 5.00 3.00<br />
2.036 2.389 2.287 10.54 5.64 2.92<br />
Comments Ref,<br />
site thermally un- [460]<br />
stable at 135K, induced the<br />
decay of Cu 2+ site.<br />
Cu 2+ centres produced by UV [461]<br />
illumination at 50K.<br />
Cu 2+ superhyperfine struc. [345]<br />
EPR spectra were observed<br />
with four Cl ligands.<br />
Below 22K, ESR signal obsd. [387]<br />
and above 22K disappeared.<br />
The Cu ions forms square - [503]<br />
planar complexes with 2-amine<br />
ligands.<br />
SHP and MO coeff. of solu- [485]<br />
tions reported. Bonding<br />
lengths depends more on type<br />
of complex than on solvent.<br />
Formation of chelating ex- [467]<br />
changer characterized by ESR.<br />
At T < 235K the Cu 2+ ions [28]<br />
tetrahedrally coordinated.<br />
ZFR, SHP. [136]<br />
Due to exceptional spin-spin [55]<br />
dipolar brodening absence of<br />
EPR signal observed.<br />
EPR study for diff. cupric [496]<br />
compounds presented.<br />
LW increases and intensity [497]<br />
decreases at LT.<br />
YBCO showed no detectable [446]<br />
ESR signal either above or<br />
below Tc.<br />
Sub. for Ba 2+ sites and [66]<br />
Cu 2+ enter Inst. sites.<br />
Cu 2+ ions enter the lattice [316]<br />
interstitially.<br />
GS wavefunction is of the [495]<br />
form 3dz2.
258 Bulletin of Magnetic Resonance<br />
S.No Host Lattice Site Spin-Hamiltonian Parameters Comments Ref.<br />
17. /?" - alumina<br />
18. BiCaSrCu2Ox<br />
19.<br />
20. BiCaSrCuO<br />
21. Bi-Ca-Sr-CuO<br />
Bi(Pb)-Ca-Sr-Cu-O<br />
Tl-Ca-Ba-Cu-O<br />
Tlo.sPbo.5(Cao.8Ao.2)Sr2Cu20y<br />
22. BiCaSrCuO<br />
23. Bi2CuO4<br />
24. Biguanide derivatives:Cu(II)<br />
25. Binuclear Copper complexes<br />
26. Bi(Pb)-Sr-Ca-CuO<br />
27. Bi(Pb)-Sr-Ca-Cu-O<br />
Ca2CuO3<br />
28. Bis [cinchoninium<br />
tetrachloro-Cu(II)]-3H2O<br />
29. Bis(Glycine) CaCl2-4H2O<br />
30. Bis(metronidazole)CuCl2H2O<br />
31. Bis(2-hydroxylphenyl-<br />
Ketoxime) Cu(II)<br />
32. Bis(N-Methyl Salicylaldiminato)-<br />
Cuo.49Nio.s1<br />
33. Bis(N-CH3-2-amino-l-clycIopentenedithiocarboxylato)Cu(II)<br />
I<br />
II<br />
gx gy<br />
2.385 2.097 2.072 91<br />
Vol. 16, No. 3/4 259<br />
S.No Host Lattice Site Spin-Hamiltonian Parameters<br />
I BiPbSrCaCuO<br />
gx gy As, Ax<br />
35. Bis(2-hydroxyphenylketoxime)<br />
Cu(II)<br />
36. Bis(2,4-dimethylpyridine)Cu(II)<br />
37. BiSrCaCu2Ov<br />
38. Bi2Sr2CaCu2Oy<br />
Bi2-xPbxSr2Ca2CuOy<br />
39. Bi2(Sr,Ca)3Cu2Oy<br />
40. Bi2Sr2CaCu2O8<br />
41. Bi2Sr2CaCu2O8+x<br />
42. Bi-Sr-Ca-Cu-O films<br />
43. Blue Copper Protein azurin<br />
44. BSA-Cu(II)(l:l)<br />
BSA-Cu(II)(2:l)<br />
45. Butyl titanate polymers:<br />
Copper carboxylate<br />
46. CAeruloplasmin<br />
2.268 2.050 2.050 191 10<br />
I [2.24 -2.78]<br />
II 2.003<br />
2.227<br />
2.1<br />
2.1<br />
2.26 2.07 2.07 160G<br />
2.17 2.02 2.07 212G<br />
2.17 2.02 2.02 211G<br />
2.203 2.050 2.050 -76 -10" 3<br />
10<br />
Comments Ref.<br />
EPR spectra behaves diff. [500]<br />
below and above 104K due to diff.<br />
supercond. phases.<br />
Hf and shf spectra observed.<br />
SHP and bonding parameters<br />
estimated.<br />
[87]<br />
The measured g-factor values [170]<br />
indicate a pure Ix2-y2> groundstate.<br />
Two types of EPR signals [423]<br />
exist, one is temperature dependence<br />
and other one is temp, independent.<br />
EPR signal near 3300G ori- [424]<br />
ginate from the 85 K phase.<br />
The anisotropy of resonance [217]<br />
field observed.<br />
Single EPR signal observed [451]<br />
in both samples, g-factor<br />
indicating the dominance of<br />
Cu 2+ spins.<br />
No ESR signal detected due [273]<br />
to absence of cuprate impurities.<br />
ESR LW increases with thick- [438]<br />
ness of films.<br />
S-band EPR spectrum of blue [175]<br />
copper protein azurin explained<br />
by pseudomodulation.<br />
Two distinct EPR features [343]<br />
observed. SHP reported for diff.<br />
pH values of diff. complexes.<br />
ESR study indicates rate of<br />
electron transfer from Cu(II)<br />
titanate to substrate molecule is<br />
faster.<br />
10~ 3 SHP analysed interms of<br />
sample MO theory and Cu(II)<br />
present in plasma of human<br />
blood is discussed.<br />
47. CaBaAlF 2.320 2.055 2.055 130G 25-30G Glasses. [199]<br />
[155]<br />
[240]
260 Bulletin of Magnetic Resonance<br />
S.No Host Lattice Site Spin-Hamiltonian Parameters<br />
Comments Ref.<br />
48. Ca(C4H3O4)2 5H2O 2.033<br />
gx<br />
2.289<br />
gy<br />
2.289<br />
Az<br />
109<br />
Ax<br />
26 26 Cu 2+ -in a compressed octahedral<br />
position. GS wavefunction<br />
is of the form<br />
[317]<br />
49. CaCd(CH3COO)4-6H20<br />
50. CaCd(CH3COO)4-6H2O<br />
51. CaCd(CH3COO)4-6H2O<br />
52. CaCd(CH3COO)4-6H2O<br />
53. CaCd(CD3COO)4-6D2O<br />
54. Cadmium tartrate-5H2O<br />
55. CaF2<br />
56. Cao.sTi2(P04)3<br />
57. CdK2(SO4)2-6H2O<br />
58. Cd(NH4)2(SO4)2-6H2O<br />
59. Cd(NH4)2(SO4)2-6H2O<br />
60. Cesium trichlorocuprate<br />
61. C2Hs(CH3)2NMnCl4<br />
62. Chalcanthite<br />
63. CH2C12<br />
CH2C12 + acetone<br />
CH2C12 + Br2<br />
CH2C12 + h + acetone<br />
2.3547 2.0646<br />
2.365 2.054 2.054<br />
2.441 2.283 2.02<br />
2.0646 420<br />
MHz<br />
2.802 2.103 2.147 76<br />
2.370 2.060 2.060<br />
2.374 2.197 2.128 282.4<br />
GHz<br />
29<br />
MHz<br />
0.410 0.030<br />
GHz GHz<br />
97<br />
79.9<br />
GHz<br />
29<br />
MHz<br />
0.030<br />
GHz<br />
97<br />
137<br />
GHz<br />
Structural PT at 130 + IK [302]<br />
obsd.; SHP reported over the<br />
range 300-5.4K.<br />
New 2nd order PT observed [69]<br />
at 128K due to molecular re-<br />
arrangements between Ca 2+ [70]<br />
and Cd 2 " 1 " sites in acetate groups.<br />
Calculated EPR results indi- [511]<br />
cates Cu 2+ ions sub. for<br />
Cd 2+ sites.<br />
PT observed at 132 ± 0.5K. [310]<br />
Impurity ions play important<br />
role in occurrence of PT.<br />
SHP evaluated by LSF; weak<br />
forbidden-hf lines obsd., Cu 2+<br />
lattice sites identified as<br />
two magnetically inequivalent.<br />
EPR signal arises due to<br />
impurity phases.<br />
Ground state WF is of the<br />
form dix2-y2>. Below 823K JT<br />
distortion obsd.<br />
Cu 2+ sub. for Cd 2+ sites<br />
MO Coeff.<br />
2.355 2.172 2.054 101G 25.6G 54.77G Sub. for Cd 2+ sites. Ground<br />
state wavefunction constr.<br />
2.3613 2.0522 2.1721 0.333<br />
GHz<br />
2.172 2.05<br />
2.170 2.045<br />
2.160 2.045<br />
2.160 2.045<br />
2.05 208<br />
2.045 103<br />
2.045 110<br />
2.045 110<br />
0.151<br />
GHz<br />
15<br />
14<br />
0.074<br />
GHz<br />
90<br />
14<br />
Pseudo JTE observed.<br />
SHP reported.<br />
EPR LW study with temp, and<br />
cone, impurity ion reported.<br />
SHP and vibrational parameters<br />
discussed.<br />
SHP reported for other solvents<br />
and data attributed to<br />
the ground state dix2-y2>.<br />
[228]<br />
[505]<br />
[197]<br />
[402]<br />
[401]<br />
[308]<br />
[150]<br />
[454]<br />
[370]<br />
[404]
Vol. 16, No. 3/4 261<br />
S.No Host Lattice Site Spin-Hamiltonian Parameters<br />
64. [(-C6H4NH-)(C104)o.4H20]<br />
[(-C6H4NH-C6H4NH-)1-x -<br />
2.0027<br />
gx gy A2 Ax<br />
(-C6H4NC6H4=N-)xO.4H2Ojn<br />
[(-C6H4NH-)(C104)o.40.6H20]n<br />
65. (C59H61O8N6FeCu3)n(PP6)2n<br />
66. Cis-Cu(NH2CH2COO)2-<br />
H2O<br />
67. (Co(l-3-diaminopropane)3]<br />
CuCls-3H2O<br />
68. Cobalt Fluorosilicate<br />
hexahydrate<br />
69. Cs2C2O4H2O<br />
70. CsCuCl3<br />
71. CsH2PO4<br />
72. CsH2PO4<br />
73. Cu+, Ag+, and Au+<br />
74. [Cu(acpc)2]<br />
[Cu(L-alao)2]<br />
[Cu(DL-alao)2(H2O)]<br />
[Cu(DL-ProO)2(H2O)2]<br />
[Cu(glyo)2 H2O]<br />
75. CuAl6(PO4)4(OH)8-4H2O<br />
2.0036<br />
2.0027<br />
2.24<br />
2.216 2.103 2.073<br />
2.225<br />
2.130<br />
Comments Ref.<br />
i) EPR signal intensity [275]<br />
thermally activated temp.<br />
depend.<br />
ii) EPR signal is temp.<br />
independent for other<br />
perchlorates. If it<br />
adsorbed oxygen then<br />
signal temp, dependent.<br />
The structure of the com- [179]<br />
pound confirmed by EPR<br />
and Mossbauer studies.<br />
Single crystal EPR results [168]<br />
assigned to orthorhombic<br />
symmetry. Temp,<br />
dependence exchange<br />
coupling estimated.<br />
ESR LW changes from [346]<br />
axial to orthorhombic<br />
symmetry.<br />
The LW continuously in- [81]<br />
crease with decreasing<br />
temp.<br />
Cu 2+ enter at interstitial [193]<br />
sites. SHP reported at RT.<br />
PT at 420K; temp,<br />
dependence EPR spec,<br />
over the range<br />
120 - 560K.<br />
[453]<br />
Temp, dependence EPR [477]<br />
spectra exhibited.<br />
2.2575 2.1866 2.1866 30G 27G 27G SHP, ZFR [476]<br />
2.0023<br />
2.210<br />
2.253<br />
2.255<br />
2.263<br />
2.277<br />
2.0068<br />
2.071<br />
2.037<br />
2.041<br />
2.046<br />
2.068<br />
2.0068<br />
2.038<br />
2.057<br />
2.068<br />
2.081<br />
2.061<br />
2.305 2.112 2.034<br />
3363<br />
MHz<br />
3363.5<br />
MHz<br />
3363.5 The SHP interpreted in [463]<br />
MHz terms of orbital<br />
characteristics.<br />
Bond lengths, bonding [159]<br />
parameters reported,<br />
electronic data<br />
also presented.<br />
GS wavefunction con- [409]<br />
structed for Cu 2+ ions as<br />
dlx2-y2> •<br />
76. Copper-amino acid CORRIGENDUM [110]
262 Bulletin of Magnetic Resonance<br />
S.No Host Lattice Site Spin-Hamiltonian Parameters<br />
gx gy Az Ax<br />
77. Copper-amino acid<br />
complexes<br />
78.<br />
79.<br />
80.<br />
81.<br />
Cu(5A4-2AA)2(NO3)2+7xT<br />
Cu(AA)2(NO3)2+2xT<br />
Cu(A)5(NO3)2+5xT<br />
Cu(AA)2<br />
Cu(OX)2<br />
Cu(AA)(OX)<br />
Cu(AA)(5,7Cl-OX)<br />
Cu(AA)(5,7Br-OX)<br />
Cu(AA)(5,7I-OX)<br />
Cu(AA)(5,7NO2-OX)<br />
Cu(AA)2<br />
Cu(SA)2<br />
Cu(Cl-SA)2<br />
Cu(2Br-SA)2<br />
Cu(2I-SA)2<br />
Cu(2NO2-SA)2<br />
Cu(Acetyl-SA)2<br />
Cu(AA)(SA)<br />
Cu(AA)(Cl-SA)<br />
Cu(AA)(2I-SA)<br />
Cu(AA)(NO2-SA)<br />
Cu(AA)(Thio-SA)<br />
Cu(AA)(Acetyl-SA)<br />
Cu(AA)(2NO2-SA)<br />
CuAc2Im2<br />
Cu2Ac4(CH3-lIm)4-6H2O<br />
Cu2AC4(CH3-lIm)4-6H2O<br />
(Powder)<br />
82. Some Aliphatic Polyamine<br />
Cu(II) compounds<br />
2.203<br />
2.280<br />
2.126<br />
2.291<br />
2.244<br />
2.242<br />
2.234<br />
2.242<br />
2.242<br />
2.238<br />
2.291<br />
2.284<br />
2.280<br />
2.292<br />
2.292<br />
2.300<br />
2.280<br />
2.289<br />
2.299<br />
2.295<br />
2.296<br />
2.295<br />
2.276<br />
2.300<br />
2.263<br />
2.310<br />
2.304<br />
83. CuAlS2 2.32<br />
84. CuAlS2 [2.05-2.31]<br />
85. Cu(3-AMI)4(C1O4)2 2.278<br />
Cu(3-AMI)4(NO3)2<br />
2.274<br />
2.023<br />
2.061<br />
2.075<br />
2.042<br />
2.054<br />
2.060<br />
2.054<br />
2.059<br />
2.061<br />
2.054<br />
2.051<br />
2.057<br />
2.055<br />
2.061<br />
2.060<br />
2.064<br />
2.060<br />
2.051<br />
2.052<br />
2.051<br />
2.056<br />
2.069<br />
2.06<br />
2.072<br />
2.078<br />
2.023<br />
2.061<br />
2.075<br />
2.042<br />
2.054<br />
2.060<br />
2.054<br />
2.059<br />
2.061<br />
2.054<br />
2.051<br />
2.057<br />
2.055<br />
2.061<br />
2.060<br />
2.064<br />
2.060<br />
2.051<br />
2.052<br />
2.051<br />
2.059<br />
2.069<br />
2.06<br />
2.072<br />
2.078<br />
2.064 2.181<br />
2.051 2.166<br />
202<br />
178<br />
207<br />
159<br />
167<br />
144<br />
162<br />
159<br />
162<br />
177<br />
159<br />
142<br />
150<br />
147<br />
147<br />
141<br />
153<br />
149<br />
149<br />
149<br />
146<br />
140<br />
149<br />
144<br />
190<br />
172<br />
20<br />
16.5<br />
mT<br />
15.03<br />
mT<br />
15<br />
25<br />
32<br />
25<br />
30<br />
27<br />
14<br />
15<br />
19<br />
22<br />
19<br />
20<br />
18<br />
25<br />
11<br />
14<br />
18<br />
19<br />
11<br />
19<br />
17<br />
31<br />
13<br />
4.98<br />
mT<br />
5.23<br />
mT<br />
15<br />
25<br />
32<br />
25<br />
30<br />
27<br />
14<br />
15<br />
19<br />
22<br />
19<br />
20<br />
18<br />
25<br />
11<br />
14<br />
18<br />
19<br />
11<br />
19<br />
17<br />
31<br />
13<br />
11.04<br />
mT<br />
11.23<br />
mT<br />
Comments Ref.<br />
Two angular variation [356]<br />
of gyromagnetic factor<br />
measured by ESR in<br />
single crystals of several<br />
complexes. ESR show a single,<br />
exchange collapsed line.<br />
Structural changes of [221]<br />
Gel samples indicated by<br />
Cu(II) EPR spectra.<br />
SHP of solutions and powder [18]<br />
samples reported. MO coeff.<br />
evaluated.<br />
SHP and MO coeff. estimated [19]<br />
and assinged to an axial<br />
symmetry.<br />
The EPR pattern does not [125]<br />
show any feature characteristic<br />
for the triplet paramagnetic<br />
state.<br />
ESR LW varies with solvents. [236]<br />
The exptl. & cal. LW for diff.<br />
solutions were reported.<br />
A symmetrical line shape has [176]<br />
been observed.<br />
ESR spectra appears depen- [7]<br />
ding on annealing atmosphere.<br />
Ground state WF observed [391]<br />
with admixture of dix2-y2> and<br />
and dz2- Rhombic symmetry<br />
observed in both complexes.
Vol 16, No. 3/4 263<br />
S.No Host Lattice Site Spin-Hamiltonian Parameters<br />
-867[Cu(AMH)2] (QH)2<br />
[Cu(AMH)2] Cl2<br />
2.171<br />
2.177<br />
gx<br />
2.056<br />
2.062<br />
gy<br />
2.056<br />
2.062<br />
Az<br />
210<br />
205<br />
Ax<br />
21<br />
25<br />
[Cu(AP'UH)2] (OH)2<br />
2.175 2.058 2.058 202 24<br />
[Cu(AP'UH)2] Cl2<br />
2.179 2.054 2.054 202 17<br />
(Cu(AMEUH)] Cl2<br />
2.173 2.058 2.058 203 24<br />
[Cu(AEEUH)2] Cl2<br />
2.181 2.065 2.065 205 25<br />
87. [Cu(bPt)(CF3SO3)(H2O)]2<br />
88. Cu(benzac)2- pyridine<br />
89. Cu(II) biguanide complexes<br />
90. Cu(II)-bis (amino-acid)<br />
complexes<br />
91. Cu(BP3CA)Cl2H2O<br />
92. Cu5(BTA)6(RNC)4<br />
93. Cu(C11H12ON2)6(C104)2<br />
94. Copper Complex in the<br />
slow motion regime<br />
95. Cu 2+ complexes<br />
96. Some binary and ternary<br />
Cu(II) compounds.<br />
97. Bi- and tricyclic<br />
Cu(II) chelates<br />
98. Binary and ternary<br />
Cu(II) compounds<br />
99. Some Cu(II) complexes<br />
100. Some Cu(II) complexes<br />
101. Cu compounds<br />
2.232<br />
2.302<br />
2.055<br />
2.067<br />
2.256 2.046<br />
2.06 2.19<br />
2.051<br />
2.062<br />
2.066<br />
-492<br />
MHz<br />
-25<br />
MHz<br />
21<br />
25<br />
24<br />
17<br />
24<br />
25<br />
-25<br />
MHz<br />
2.19 0G 77G 77G<br />
Comments Ref.<br />
SHF reported for dm. solvents.<br />
MO coeff. also reported.<br />
ZFR dominant.<br />
Results of ESEEM and CWEPR<br />
reported.<br />
[36!<br />
[37]<br />
[75]<br />
SHP and MO coeff. reported. [368]<br />
Solutions SHP reported. [120]<br />
GS wavefunction is of the<br />
form of admixture of Ix2-y2><br />
and 3z2-r2.<br />
g and A values are found to<br />
be nearly independent of temp.<br />
2.3416 2.0376 2.0360 0.3656 0.870 0.0473 SHP were made up to liquid<br />
GHz GHz GHz helium temp.<br />
A fast compututional method<br />
for stimulating EPR lineshapes<br />
presented.<br />
EPR of Cu 2+ in frozen solutions<br />
is presented by a<br />
theoretical method.<br />
SHP data presented both at<br />
RT and LNT.<br />
Structural studies of chelates<br />
conformed by ESR.<br />
SHP of solution spectra and<br />
LW studies presented.<br />
SHP of diff. complexes reptd<br />
[231]<br />
[32]<br />
[303]<br />
[114]<br />
[117]<br />
[17]<br />
[358]<br />
[348]<br />
[45]<br />
SHP of polycrystalline ESR [237]<br />
exhibit axial symmetry as well<br />
as rhombic symmetry depending<br />
on the ligand environment.<br />
Covalency parameter evaluated.<br />
Relationship between the [250]<br />
correlation and structure of<br />
Cu containing compounds<br />
examined.
264 Bulletin of Magnetic Resonance<br />
S.No Host Lattice Site Spin-Hamiltonian Parameters<br />
102. Cu(II) complexes in<br />
solutions<br />
103. Cu(II)-Collagen complex<br />
104. Octacoordinated copper<br />
complexes<br />
105. Cu(II) complexes with<br />
organic liquids<br />
106.<br />
107.<br />
108.<br />
109.<br />
110.<br />
Cu(II) in square<br />
planar lattices<br />
Copper Calcium Acetate-<br />
6H20<br />
Cu(2-CA)o.5S04<br />
Cu(3-CA)2SO4<br />
Cu(4-CA)3SO4<br />
Cu(2-CP)2SO4<br />
Cu(3-CP)2SO4<br />
Cu(4-CP)2SO4<br />
(CA = Cyanoaniline)<br />
(CP = Cyanopyridine)<br />
Cu(2-CA)0.5SO4<br />
Cu(2-CA)2SO4<br />
Cu(4-CA)3SO4<br />
Cu(3-CP)2SO4<br />
Cu(2-CP)2SO4<br />
Cu(4-CP)2SO4<br />
(CA = Cyanoaniline)<br />
(CP = Cyanopyridine)<br />
CuCe oxide<br />
111. Copper Cerium oxide<br />
112.<br />
113.<br />
114.<br />
CuCe Oxide<br />
Cu(CioH2oN8)Cl2<br />
Ni(CioH2oN8)Cl2<br />
Cu(C8H8O2N)8<br />
Cu(C8H8O3N)2<br />
Cu(C9H10O3N)2<br />
Cu(C1iH8O2N)2<br />
Al<br />
A2<br />
K<br />
gx gy Az Ax<br />
2.19 2.04 2.04<br />
2.370<br />
2.404<br />
2.407<br />
2.398<br />
2.393<br />
2.336<br />
2.402<br />
2.268<br />
2.267<br />
2.284<br />
2.260<br />
2.219<br />
2.267<br />
2.2079<br />
2.1233<br />
2.2079<br />
2.248<br />
2.249<br />
2.254<br />
2.146<br />
2.070<br />
2.057<br />
2.048<br />
2.051<br />
2.036<br />
2.081<br />
2.052<br />
2.079<br />
2.060<br />
2.063<br />
2.045<br />
2.060<br />
2.079<br />
2.0403<br />
2.0403<br />
2.0403<br />
2.061<br />
2.061<br />
2.060<br />
2.073<br />
2.070<br />
2.057<br />
2.048<br />
2.051<br />
2.036<br />
2.081<br />
2.052<br />
2.079<br />
2.060<br />
2.063<br />
2.045<br />
2.060<br />
2.079<br />
2.0403<br />
2.0403<br />
2.043<br />
2.061<br />
2.061<br />
2.060<br />
2.073<br />
13mT<br />
133G<br />
113G<br />
113G<br />
126G<br />
146G<br />
120G<br />
170G<br />
82G<br />
85G<br />
150.91<br />
148.74<br />
141.62<br />
135.23<br />
1.6mT<br />
18.3G<br />
20.8G<br />
18.3G<br />
26.6G<br />
6.95G<br />
19.9G<br />
27G<br />
40G<br />
13.5G<br />
8.80<br />
7.90<br />
7.17<br />
8.06<br />
1.6ml<br />
18.3G<br />
20.8G<br />
18.3G<br />
26.6G<br />
6.95G<br />
19.9G<br />
27G<br />
40G<br />
13.5G<br />
8.80<br />
7.90<br />
7.17<br />
8.06<br />
Comments Ref.<br />
ESR LW against temp, plotted; [353]<br />
Dynamics of solvent-solution<br />
interaction.<br />
JT energy reported using<br />
EPR measurements.<br />
EPR and structural parameters<br />
presented.<br />
Structure of complexes<br />
discussed with the help of<br />
ESR data.<br />
ZFR<br />
J values presented at diff.<br />
temp, using ID, 3D models.<br />
ESR data indicate the<br />
presence of unpaired electron<br />
in the dix2-y2> orbital<br />
of the Cu(II) ion. SHP of<br />
powder samples and bonding<br />
parameters also reported.<br />
SHP reported for both solution<br />
powder complexes.<br />
SHP measurements were<br />
made both at X- and<br />
Q-band frequencies.<br />
Well resolved EPR spectrum<br />
of Cu 2+ observed in<br />
perpendicular components.<br />
Two nearly equivalent Cu 2+<br />
ions separated by an oxygen<br />
ion appears.<br />
SHP reported.<br />
Interaction of solvent with<br />
EPR spectra presented.<br />
MO coeff.<br />
[415]<br />
[129]<br />
[104]<br />
[435]<br />
[416]<br />
[432]<br />
[5]<br />
[21]<br />
[22]<br />
[20]<br />
[64]<br />
[357]
Vol. 16, No. 3/4 265<br />
S.No Host Lattice Site Spin-Hamiltonian Parameters<br />
gx gy Az Ax<br />
115. CuCi8Hi6N4Cl2<br />
116.<br />
117.<br />
118.<br />
119.<br />
120.<br />
Cu(CH3CO2)2<br />
(2,6Me2Py)2<br />
[Cu(cit)]<br />
(Cu(l-mal)]<br />
Cu/[Zn(l-mal)<br />
(H2O)2]H2O<br />
[CuMg(cit)2H_2] 4 -<br />
[CuZn(cit)2H_2] 4 -<br />
[CuPd(cit)2H_2] 4 ~<br />
Cu(2-BOP)Cl2<br />
Cu(3-BOP)Cl2<br />
Cu(4-BOP)Cl2<br />
Cu(2-BOP)2Br2<br />
Cu(3-BOP)2Br2<br />
Cu(4-BOP)2Br2<br />
[Cu(Li)2)<br />
[Cu(LiH)2]Cl2<br />
[Cu(L2)a]<br />
[Cu(L3)2]<br />
[Cu(L4)2]<br />
[Cu(L5)2]<br />
[Cu(L5H)2]Cl2<br />
Cu(ClO4)2-5ANT<br />
Cu(ClO4)2-6ANT<br />
Cu(ClO4 2-2AMFH2O<br />
121. CuCl2 - Graphite<br />
122. I/CuCl2<br />
II/Cu(NO3)2<br />
123. (CuCl2Ll)2<br />
(CuCl2-L2)2<br />
124. CuCl2-2Py<br />
CuBr2-2Py<br />
125. Cu(CN)|-<br />
Cu(CO)3<br />
Ag(CN)^<br />
Ag(CO)3<br />
126. Cu(CO)3<br />
2.248<br />
2.368<br />
2.374<br />
2.425<br />
2.297<br />
2.297<br />
2.325<br />
2.262<br />
2.247<br />
2.245<br />
2.208<br />
2.115<br />
2.108<br />
2.170<br />
2.176<br />
2.173<br />
2.174<br />
2.173<br />
2.173<br />
2.168<br />
2.4311<br />
2.4311<br />
2.3241<br />
2.061<br />
2.080<br />
2.080<br />
2.089<br />
2.062<br />
2.062<br />
2.068<br />
2.066<br />
2.051<br />
2.050<br />
2.041<br />
-<br />
-<br />
2.059<br />
2.061<br />
2.057<br />
2.061<br />
2.063<br />
2.061<br />
2.058<br />
2.0686<br />
2.0686<br />
2.0671<br />
2.061<br />
2.080<br />
2.080<br />
2.089<br />
2.062<br />
2.062<br />
2.068<br />
2.135<br />
2.080<br />
2.080<br />
2.041<br />
-<br />
-<br />
2.059<br />
2.061<br />
2.057<br />
2.061<br />
2.063<br />
2.061<br />
2.058<br />
2.0957<br />
2.0957<br />
2.0893<br />
23.6<br />
mT<br />
142<br />
140 -<br />
120<br />
173<br />
173<br />
161<br />
208<br />
207<br />
209<br />
204<br />
203<br />
203<br />
210<br />
13<br />
13<br />
17<br />
2.183 2.075 2.075 163G<br />
2.200 2.049 2.049 200G<br />
2.14<br />
2.18<br />
2.0004<br />
2.0010<br />
1.9987<br />
2.0009<br />
2.0010<br />
2.04<br />
2.04<br />
2.0049<br />
2.0029<br />
2.0035<br />
2.0009<br />
2.0036<br />
2.04<br />
2.04<br />
2.0049<br />
2.0029<br />
2.0035<br />
2.0009<br />
2.0021<br />
262<br />
MHz<br />
225<br />
MHz<br />
168<br />
MHz<br />
1586<br />
MHz<br />
225<br />
MHz<br />
3.5<br />
mT<br />
10<br />
10<br />
10<br />
12<br />
12<br />
07<br />
23<br />
22<br />
24<br />
20<br />
19<br />
19<br />
25<br />
20G<br />
53G<br />
74<br />
MHz<br />
0<br />
MHz<br />
89.5<br />
MHz<br />
1586<br />
MHz<br />
0<br />
3.5<br />
mT<br />
10<br />
10<br />
10<br />
12<br />
12<br />
07<br />
23<br />
22<br />
24<br />
20<br />
19<br />
19<br />
25<br />
20G<br />
53G<br />
74<br />
MHz<br />
0<br />
MHz<br />
89.5<br />
MHz<br />
1586<br />
MHz<br />
0<br />
Comments<br />
Ref.<br />
Non equivalent Cu(II) sites [130]<br />
obsd.; Exchange integral<br />
explained LW of EPR.<br />
Anisotropy of LW obsd. due [171]<br />
to isotropic exchange interaction.<br />
The Cu(II) ion coordination [52]<br />
environment in hetrodinuclear<br />
species is different from the<br />
Cu(II) monocitrate species.<br />
EPR data indicate the pres- [3]<br />
ence of unpaired electron in<br />
dix2-y2> orbital of Cu(II) ion<br />
in an axial symmetry.<br />
SHP of powder as well as [383]<br />
solution spectra presented.<br />
MO coeff. reported.<br />
Information concerning the [119]<br />
structure of title compound<br />
presented.<br />
EPR study reported on Cu(II) [224]<br />
Mn(II) ions.<br />
Liquid crystalline phases [90]<br />
and solid polycrystals characterized<br />
by its EPR pattern.<br />
EPR and magnetic suscepti- [377]<br />
bility data presened.<br />
EPR spectrum always reduced [336]<br />
to Lorentzian singlet.<br />
Ag(CO)3 is unique.being<br />
pyramidal where the other<br />
three are planar.<br />
Isotropic interaction increases<br />
with increasing temp.<br />
[173]<br />
[172]
266 Bulletin of Magnetic Resonance<br />
S.No Host Lattice Site Spin-Hamiltonian Parameters<br />
gx gy Az Ax<br />
127. [Cu3(C2S<br />
CH2OH)2]2C1O4<br />
2.073 2.121 2.117<br />
2.056 2.150 2.104<br />
128.<br />
129. Cu(2,5-Dimethyl<br />
Benzoxazole) (0104)2<br />
130. Cu(2,5-dimethylbenzoxazole)<br />
2 Br2<br />
131. Cu(tn)2(SCN)2<br />
[Cu(tn)2NCS]B0<br />
[Cu(tn)2NCS]C104<br />
132. [Cu(dach)2] C1O4)2<br />
[Cu(dach)Br] C1O4<br />
[Cu(dach)Br2]<br />
133. (Cu2(dien)2Cl2](C104)2<br />
134. [Cu(den)NCS)]NO3<br />
[Cu(den)NCS]B04<br />
Cu(den)2(NO3)2<br />
Cu(den)2(C104)2<br />
Cu(Pn)2(NCS)2<br />
Cu(Pn)2Br2<br />
135. Cu(II) dimers<br />
136. [Cu(dap)2]BF4<br />
137. [Cu(dpt)en](B04)2<br />
138. Cu(dtc)2<br />
Cu(Hy)2<br />
Cu(Sal)2<br />
Cu(dtc)(Hy)<br />
Cu(dtc)(Sal)<br />
I<br />
II<br />
2.26<br />
2.380<br />
2.212<br />
2.222<br />
2.274<br />
2.076<br />
2.097<br />
2.102<br />
2.232<br />
2.243<br />
2.246<br />
2.231<br />
2.203<br />
2.2145<br />
2.2506<br />
2.1985<br />
2.2020<br />
2.0480<br />
2.1074<br />
2.1201<br />
2.0758<br />
2.0767<br />
2.084<br />
2.072<br />
2.069<br />
2.050<br />
2.032<br />
2.070<br />
2.054<br />
2.058<br />
2.072<br />
2.053<br />
2.0450<br />
2.0911<br />
2.0911<br />
2.074<br />
2.072<br />
2.069<br />
2.050<br />
2.032<br />
2.070<br />
2.054<br />
2.058<br />
2.072<br />
2.053<br />
2.0768<br />
2.0111<br />
2.0111<br />
115G<br />
167.4<br />
172.0<br />
155.3<br />
91.4<br />
72.5<br />
74.2<br />
-185G<br />
-167G<br />
-175G<br />
-170G<br />
-190G<br />
-192G<br />
467<br />
MHz<br />
127.8<br />
133.1<br />
78G<br />
87.5G<br />
59.5G<br />
82.5G<br />
71.4G<br />
7.5G<br />
10.5<br />
8.2<br />
25<br />
-29G<br />
-23G<br />
-25G<br />
-10G<br />
-29G<br />
-26G<br />
94<br />
MHz<br />
29.2<br />
29.2<br />
5.5G<br />
10.5<br />
8.2<br />
25<br />
-29G<br />
-23G<br />
-25G<br />
-10G<br />
-29G<br />
-26G<br />
138<br />
MHz<br />
9.4<br />
9.4<br />
Comments<br />
Nearly rhombic distortion [502]<br />
spectra observed.<br />
EPR LW narrowing observed [97]<br />
with increasing temp, and g-factor<br />
decreases with anion S-Se<br />
substitution.<br />
Isotropic spin rotational<br />
mechanism is responsible for<br />
the residual LW.<br />
EPR study showed complexes<br />
possesses distorted octahedral<br />
units.<br />
Molecular motion is responsible<br />
for anisotropic and<br />
non-diffusional in the comlexes.<br />
SHP reported for the titled<br />
compound with various solvents.<br />
[390]<br />
[392]<br />
[71]<br />
[174]<br />
Exchange coupling parameter [151]<br />
estimated.<br />
SHP reported for solutions [264]<br />
as well as powder samples.<br />
Covalency parameter discussed.<br />
Temp, dependence ESR study [177]<br />
indicates the crystal has<br />
trigonal bipyramidal coordination.<br />
The pseudotetrahedral sturc- [288]<br />
ture of solution changes with<br />
crystalline nature.<br />
Two inequivalent molecules [262]<br />
observed. The geometry around<br />
Cu(II) ions changes due to JT<br />
distortion.<br />
LW are temp, dependent and [457]<br />
isotropic go estimated from<br />
the EPR spectra in solutions.
Vol. 16, No. 3/4 267<br />
S.No Host Lattice<br />
139. [Cu(dap)2] V!+ BF4<br />
[Cu(cat.30)] 2+ BF4<br />
Powder<br />
140. Cu(II)-diglycine complexes<br />
141. (Cu2(dien)2Cl2](C104)2<br />
142. [Cu(2,5-DMC)2]2<br />
[Cu(2,5-DMC)2](4,7-DMP)<br />
[Cu(2,5-DMC)2](2,9-DMP)<br />
143. [Cu(dmc)2(2,9-dmphen)]H2O<br />
[Cu(dmc)2(phen)]H2O<br />
[Cu(dmc)2(4,7-dmphen)]<br />
144. [Cu2(3-Et-pyr)4(dmf)2]<br />
145. [Cu(ethylenedibiguanide)]<br />
[Cu(ethylenedibiguanide)]<br />
[Cu(trimethylenedibiguanide)]<br />
[Cu(piperazinedibiguanide)]<br />
[Cu (m-phenylenedibiguanide) ]<br />
[Cu(phenylbiguanide)2]Cl2<br />
146. Cu(EDtc)2- L<br />
Cu(EDtc)2- L'<br />
147. Cu(Edtc)2-L<br />
Cu(Edtc)2-L'<br />
148. Cu2 [F2(dmpz)2(mpz)4](BF4)2<br />
Cu2 [F2(mpz)2(dmpz)4](BF4)2<br />
149. Cu(4F3NA)2Cl2-2H20<br />
Cu(4F3NA)2Br2<br />
Cu(4F3NA)2 (SCN)2 -3H2O<br />
150. [Cu-F-hect]<br />
[Cu-OH-hect]<br />
151. Cu(II)-Fe(III) complexes<br />
Site Spin-Hamiltonian Parameters<br />
gx gy Az Ax<br />
1 2.277 2.074 2.074<br />
II 2.277 2.070 2.070<br />
I 2.282 2.076 2.076<br />
II 2.281 2.078 2.078<br />
2.283 2.088 2.088<br />
I<br />
II<br />
I<br />
I<br />
II<br />
A<br />
B<br />
2.214 2.046 2.057<br />
2.40<br />
2.28<br />
2.02<br />
2.02<br />
2.276<br />
2.276<br />
2.09<br />
2.06<br />
2.31<br />
2.31<br />
2.06<br />
2.06<br />
2.09<br />
2.06<br />
2.17<br />
2.17<br />
2.06<br />
2.06<br />
2.30 2.05 2.05<br />
2.08<br />
2.19<br />
2.17<br />
2.18<br />
2.16<br />
2.16<br />
2.102<br />
2.104<br />
2.102<br />
2.104<br />
2.05<br />
2.05<br />
2.05<br />
2.05<br />
2.05<br />
2.028<br />
2.030<br />
2.028<br />
2.030<br />
2.05<br />
2.05<br />
2.05<br />
2.05<br />
2.05<br />
2.028<br />
2.030<br />
2.028<br />
2.030<br />
2.038 2.288 2.098<br />
1.978 2.320 2.055<br />
2.394<br />
2.346<br />
2.347<br />
2.388<br />
2.355<br />
2.40<br />
2.26<br />
2.26<br />
2.087<br />
2.087<br />
2.078<br />
2.06<br />
2.07<br />
2.07<br />
2.077<br />
2.077<br />
2.078<br />
2.06<br />
2.07<br />
2.07<br />
71.4G<br />
208<br />
220<br />
182<br />
169<br />
188<br />
155/<br />
166G<br />
150/<br />
161G<br />
155/<br />
166G<br />
150<br />
161G<br />
120G<br />
125G<br />
120G<br />
120G<br />
140G<br />
118<br />
50<br />
50<br />
32<br />
33<br />
36<br />
35<br />
35<br />
38G<br />
37G<br />
38G<br />
37G<br />
7G<br />
5.5G<br />
13G<br />
32<br />
33<br />
36<br />
35<br />
35<br />
38G<br />
37G<br />
38G<br />
37G<br />
5G<br />
4.5G<br />
13G<br />
Comments Ref.<br />
EPR shows the solution exist<br />
pseudotetrahedral structure<br />
because of rapid electron<br />
transfer kinetics.<br />
SHP.<br />
LW of the EPR lines strong<br />
dependent and increase linearly<br />
with temp.<br />
Resolved EPR spectra obsd.<br />
at 125K. SHP presented at<br />
RT also.<br />
Environment effect of three<br />
compounds were discussed.<br />
SHP discussed in terms of<br />
known binuclear structure.<br />
The observations of nine<br />
nitrogen Shf lines on the<br />
high field indicate the<br />
presence of four equivalent<br />
nitrogen atoms around Cu(II)<br />
ion.<br />
Structure of paramagnetic<br />
centres discussed. SHP<br />
reported for various dithiocarbomate<br />
complexes.<br />
The structural ordering<br />
described by ESR. SHP repor<br />
for various complexes.<br />
[287]<br />
[279]<br />
[164]<br />
[514]<br />
[201]<br />
[121]<br />
[448]<br />
[183]<br />
[187]<br />
Good agreement found between [148]<br />
exptl. and cal. values. GS is<br />
of the form dix2_y2>.<br />
The solvent effect on LW. [396]<br />
The GS wave function and<br />
MO coeff. evaluated.<br />
Three types of Gu(II) sites [469]<br />
observed.<br />
EPR study reported for [453]<br />
Cu(II)-Fe(III) complexes.
268 Bulletin of Magnetic Resonance<br />
S.No<br />
152.<br />
153.<br />
154.<br />
155.<br />
Host Lattice Site<br />
CuPu2-2 MeOH<br />
Powder<br />
Solution I<br />
II<br />
[Cu(Gly)A]+<br />
[Cu(Pro)A]+<br />
[Cu(Phe)A]+<br />
[Cu(Try)A]+<br />
[Cu(His)A] +<br />
[Cu(Hm)A] +<br />
[Cu(GlyGly)A]<br />
[Cu(GlyPro)A]+<br />
[Cu(GlyLeu)A]<br />
[Cu(GlyTry)A]<br />
Cu(Gly Ala) (bipy) -4H2O<br />
Cu(GlyAla)(Phen)-3H2O<br />
Cu(Gly Phe)(bipy)-4H2O<br />
Cu(GlyPhe)(phen)-3H2O<br />
Cu(GlyTyr)(bipy)-4H2O<br />
Cu(GlyTyr)(phen)-3H2O<br />
Cu(GlyTyr)(dmph)-4H2O<br />
Cu(GlyGly)(bipy)-3H2O<br />
Cu(GlyGly)(phen)-3H2O<br />
Cu(GlyGly)(dmph)-4H2O<br />
Copper Glutamate<br />
156. Cu(HCOO)2-4H2O<br />
157. (Cu-heme-SL2)<br />
158. CuH-[Al]-ZSM-5<br />
CuH-[Al]-ZSM-5<br />
CuH-[Ga]-ZSM-5<br />
159. CuH-Chab.<br />
CuH-SAPO-34<br />
160. Cu [H2NCH(CH3)2<br />
CHCO2]2H2O<br />
I<br />
II<br />
I<br />
II<br />
I<br />
II<br />
_<br />
2.342<br />
2.388<br />
2.355<br />
2.246<br />
2.282<br />
2.264<br />
2.265<br />
2.286<br />
2.286<br />
2.257<br />
2.292<br />
2.206<br />
2.204<br />
2.226<br />
2.225<br />
2.236<br />
2.231<br />
2.232<br />
2.232<br />
2.220<br />
2.243<br />
2.243<br />
2.230<br />
2.339<br />
Spin-Hamiltonian Parameters<br />
gx<br />
2.083<br />
2.082<br />
2.082<br />
2.073<br />
2.073<br />
2.061<br />
2.048<br />
2.062<br />
2.070<br />
2.044<br />
2.073<br />
2.045<br />
2.043<br />
2.078<br />
2.086<br />
2.058<br />
2.078<br />
2.064<br />
2.061<br />
2.085<br />
2.058<br />
2.057<br />
2.084<br />
2.043<br />
gy<br />
2.083<br />
2.082<br />
2.112<br />
2.073<br />
2.073<br />
2.061<br />
2.048<br />
2.062<br />
2.070<br />
2.044<br />
2.073<br />
2.045<br />
2.043<br />
2.078<br />
2.086<br />
2.058<br />
2.078<br />
2.064<br />
2.061<br />
2.085<br />
2.058<br />
2.057<br />
2.084<br />
2.083<br />
Az<br />
133<br />
147<br />
191<br />
168<br />
180<br />
176<br />
169<br />
170<br />
178<br />
153<br />
167<br />
169<br />
164<br />
169<br />
172<br />
177<br />
175<br />
172<br />
171<br />
157<br />
162<br />
170<br />
410<br />
MHz<br />
Ax<br />
Vol. 16, No. 3/4 269<br />
S.No Host Lattice Site Spin-Hamiltonian Parameters<br />
162. CuInSe2<br />
A 2.0030<br />
gx gy Az Ax Ay<br />
B 2.1642<br />
163. [CuL2(SQ)]<br />
[CuLSQ]<br />
164. CuL2L'2 (BPh4)2<br />
Powder<br />
Solution<br />
165. Cu(II)-L-Phenylalamine<br />
166. Cu(L-Leu)2<br />
167. Cu(II)-L-Serine<br />
168. CuL4:MeOH:CHCl3<br />
CuL2:Me0H:CHCl3<br />
169. Cu2L<br />
Cu2L(OH)<br />
Cu2L(OH)2<br />
170. CunL2<br />
171. Cu(L-Leucine)<br />
172. Cu(L-Met)2<br />
173. Cu(L-PHE)2<br />
174. Cu(L-Phe)2<br />
175. [Cu(MHBQ)2]<br />
I<br />
II<br />
2.0050<br />
2.0046<br />
2.2683 2.0800 2.0500 165G 10G<br />
2.2730 - - 173G 12G<br />
2.2720 2.0040 2.0940 170G 9G<br />
2.265 2.072 2.072<br />
2.281 2.053 2.053 174 13<br />
2.273 2.053 2.053 174<br />
2.00<br />
2.00<br />
2.00<br />
2.263 2.058 2.058 172<br />
2.266 2.058 2.058 168<br />
2.262 2.058 2.058<br />
2.263 2.073 2.073<br />
2.266 2.075 2.075<br />
2.24 2.05 2.07 195G<br />
18.7<br />
Comments Ref.<br />
Isotropic EPR signals obsd. [342]<br />
The spin densities on the [379]<br />
Cu and P were found to vary<br />
oppositely, which could be<br />
expected from the electron<br />
affinity.<br />
10G Square planar geometry with [261]<br />
12G N-coodinated ligands obsd.<br />
9G<br />
LW variation and isotropic [291]<br />
SHP, go and A values reported.<br />
Exchange interaction were [433]<br />
discussed between Cu(II) pairs.<br />
Spin rotational relaxation [292]<br />
mechanisms discussed; isotropic<br />
g and A values reported.<br />
13 ESR data computed to cal.<br />
complex stability constants.<br />
SHP reported for various<br />
solvents.<br />
[455]<br />
Structure of binuclear [400]<br />
Cu(II) complexes confirmed<br />
by EPR.<br />
18.7 Both complexes EPR study [12]<br />
assigned to distorted square<br />
planar coordination.<br />
Anisotropy g-factor depends [100]<br />
on temp, and external field.<br />
Two magn. non-equivalent [248]<br />
Cu(II) ions in the lattice<br />
caused by exchange interaction.<br />
Two magn. non-equivalent [108]<br />
Cu(II) sites due to the<br />
exchange interaction obsd.<br />
Spin dynamics explained by [109]<br />
exchange interaction of<br />
Cu 2+ pairs.<br />
Based on Magnetic, IR, elec- [351]<br />
tronic, PMR and ESR data the<br />
complex structure assigned.
270 Bulletin of Magnetic Resonance<br />
S.No Host Lattice Site Spin-Hamiltonian Parameters<br />
gx gy A2 Ax<br />
176. Cu88-xMni2T:<br />
177. Cu(MCMQ)2<br />
Cu(PCMQ)2<br />
Cu(MHBQ)2<br />
Cu(PHBQ)2<br />
Cu(MFQ)2(CH3COO)2<br />
Cu(PFQ)2(CH3COO)2<br />
Cu(MAQ)2(CH3COO)2<br />
Cu(PAQ)2(CH3COO)2<br />
Cu(MUQ)2(CH3COO)2<br />
Cu(PUQ)2(CH3COO)2<br />
Cu(MTUQ)2(CH3COO)2<br />
Cu(PTUQ)2(CH3COO)2<br />
178. Cu(MDtc)2Am<br />
Cu(MDtc)2MAm<br />
Cu(MDtc)2DeAm<br />
Cu(MDtc)2Py<br />
179. Cu(MDtc)2Am<br />
Cu(EDtc)2Am<br />
Cu(MDtc)2-Py<br />
Cu(EDtc)2-2Py<br />
180. Cu-methoxonitrophenolates<br />
181. [Cui_xMgx(HCO2)2]-4H2O<br />
[CUl_xZnx(HCO2)2].4H2O<br />
182. (Cuo.89Mn0.n)/copper<br />
spin glasses<br />
183. [Cu(MPQ)2(CH3COO)2]<br />
[Cu(PPQ)2(CH3COO)2]<br />
[Cu(HMP)2]<br />
[Cu(HPQ)2]<br />
184. [Cu(II)(N-CH3TPP)CF3SO3],<br />
[Cu(N-CH2C6H4NO2HTPP)]<br />
2.14<br />
2.13<br />
2.24<br />
2.23<br />
2.20<br />
2.18<br />
2.23<br />
2.22<br />
2.20<br />
2.21<br />
2.20<br />
2.21<br />
2.00<br />
2.00<br />
2.00<br />
2.00<br />
2.00<br />
2.004<br />
2.00<br />
2.003<br />
[2.36 - 2.12]<br />
[2.36 - 2.12]<br />
2.25<br />
2.28<br />
2.23<br />
2.20<br />
2.213<br />
2.220<br />
2.03<br />
2.03<br />
2.06<br />
2.05<br />
2.05<br />
2.04<br />
2.05<br />
2.04<br />
2.05<br />
2.05<br />
2.05<br />
2.05<br />
2.111<br />
2.109<br />
2.117<br />
2.118<br />
2.111<br />
2.131<br />
2.181<br />
2.114<br />
2.06<br />
2.07<br />
2.06<br />
2.05<br />
2.055<br />
2.065<br />
2.03<br />
2.03<br />
2.06<br />
2.05<br />
2.05<br />
2.04<br />
2.05<br />
2.04<br />
2.05<br />
2.05<br />
2.05<br />
2.05<br />
2.102<br />
2.091<br />
2.091<br />
2.060<br />
2.102<br />
2.094<br />
2.060<br />
2.064<br />
2.06<br />
2.07<br />
2.06<br />
2.05<br />
2.055<br />
2.065<br />
173<br />
142<br />
167<br />
173<br />
143<br />
173<br />
~26/<br />
28G<br />
~24G<br />
~24/<br />
26G<br />
~22G<br />
26/<br />
28G<br />
28G<br />
~22G<br />
23.4/<br />
25G<br />
3200<br />
MHz<br />
3300<br />
MHz<br />
3900<br />
MHz<br />
3700<br />
MHz<br />
149G<br />
142G<br />
74<br />
68<br />
87<br />
56<br />
99<br />
80<br />
95/<br />
102G<br />
102G<br />
98/<br />
105G<br />
122/<br />
131G<br />
95/<br />
102G<br />
108G<br />
122/<br />
131G<br />
122/<br />
130G<br />
600<br />
MHz<br />
200<br />
MHz<br />
300<br />
MHz<br />
700<br />
MHz<br />
_<br />
_<br />
74<br />
68<br />
87<br />
56<br />
99<br />
80<br />
84.6/<br />
90.3G<br />
85G<br />
81/<br />
87G<br />
54G<br />
84.6/<br />
90.3G<br />
86G<br />
54G<br />
58/<br />
63.8G<br />
600<br />
MHz<br />
200<br />
MHz<br />
300<br />
MHz<br />
700<br />
MHz<br />
_<br />
_<br />
Comments Ref.<br />
EPR LW explained by inverse [96]<br />
susceptibility.<br />
Based on the data,the Cu 2+ [354]<br />
complexes assigned to<br />
tetragonal or square<br />
planar geometry.<br />
SHP were detected. [186]<br />
SHP of solution reported. [188]<br />
Exchange interaction para- [471]<br />
meter estm.<br />
ESR LW at particular temp. [74]<br />
decrease with increasing<br />
dopant concentration.<br />
Increasing anisotropy as [247]<br />
spin-glass layer thickness is<br />
decreased is briefly discussed.<br />
Ground state is of the form [371]<br />
ofdix2-y2>. MO coeff. estd.<br />
Solutions. Nitrogen effect [447]<br />
on superhyperfine structure.
Vol. 16, No. 3/4 271<br />
S.No Host Lattice Site Spin-Hamiltonian Parameters<br />
185. Cu(II)N-acetyl glycinate-H2O<br />
Cu(II)N-acetyl methioninate<br />
2.149<br />
2.158<br />
gx<br />
2.080<br />
2.050<br />
gy<br />
2.080<br />
2.050<br />
Az Ax<br />
Cu(II)N-acetyl alaninate<br />
2.428 2.090 2.090<br />
Cu(II)N-acetyl valinate<br />
Cu(II)N-acetyl glutamate<br />
Cu(II)Cyanoacetate<br />
Cu(II)Thiodipropionate<br />
2.441<br />
2.265<br />
2.385<br />
2.289<br />
2.086<br />
2.104<br />
2.120<br />
2.106<br />
2.086<br />
2.104<br />
2.120<br />
2.106<br />
186. Cu(II)-N-aryl glycinate<br />
187. Cu(NO3)2- 2.5H2O<br />
Powder<br />
188. 63 Cu3 in N2 matrix<br />
189. Cu2(2-NO2C6H4COO)4(DMSO)2<br />
190. 63 Cu/Ni(Et2-dtph)2<br />
63 Cu/Ni(PrS-dtph)2<br />
191. Cu(II)-n-amine complexes<br />
192. Cu/Nafion/CDsCN<br />
193. CuNaY Zeolite<br />
(Faujasite)<br />
194. Cu(4%)Nafion/CH3CN<br />
(soaked once)<br />
Cu(100%)Nafion/CH3CN<br />
(soaked once)<br />
Cu(4%)Nafion/CH3CN<br />
(soaked twice)<br />
Cu(4%)Nafion/CH3CN<br />
(soaked once)<br />
Cu(4%)Nafion/CD3CN<br />
(soaked twice)<br />
195. Cu(NA)2Cl2<br />
Cu(NICA)2Cl2<br />
Cu(INA)2Cl2<br />
Cu(NA)2Br2<br />
Cu(NICA)2Br2<br />
Cu(INA)2Br2<br />
Cu(NA)3(SCN)2<br />
I<br />
II<br />
2.365<br />
2.400<br />
2.102<br />
2.07<br />
2.068<br />
2.07<br />
1.9769 2.0042 1.9905<br />
2.412 2.089 2.089<br />
2.1082<br />
2.1080<br />
2.1066<br />
2.0230<br />
0.0223<br />
2.0226<br />
2.0259<br />
0.0255<br />
2.0246<br />
145<br />
145.6<br />
150<br />
I 2.3931 2.074 2.074 129.7G<br />
II 2.4201 2.074 2.074 119.2G<br />
27.7<br />
28.5<br />
26.6<br />
29.9<br />
30.5<br />
28.4<br />
Comments Ref.<br />
SHP of powder as well as<br />
solutions were measured.<br />
Ground state wave function<br />
is of the form dix2-y2>-<br />
[146]<br />
LNT EPR study reported. [252]<br />
Automatic fitting procedure [113]<br />
were used for calculating the<br />
g-factors and LW.<br />
The hf interaction is nearly [251]<br />
isotropic. GS is of the form<br />
2AI-<br />
Optical, IR and Magnetic [272]<br />
properties reported.<br />
X-ray data reported and [178]<br />
confirmed by EPR.<br />
Bonding nature of the [508]<br />
amino groups presented.<br />
After cycle of soaked and [196]<br />
drying all four equivalent<br />
ligands replaced by four<br />
N2 ligands.<br />
The differences in EPR [126]<br />
results observed are attributed<br />
to migration of Cu(II)<br />
ions in aluminosilicate.<br />
2.3335 2.0720 2.0720 159 11 11 ESR parameters studied at [195]<br />
different band frequencies.<br />
2.3480 2.0794 2.0794 158 11 11<br />
2.3472 2.0749 2.0749 160 12 12<br />
2.3720 2.0830 2.0830 146 5 5<br />
2.4100 2.0770 2.0770 137 7 7<br />
2.233<br />
2.227<br />
2.252<br />
2.142<br />
2.152<br />
2.142<br />
2.159<br />
2.063<br />
2.080<br />
2.051<br />
-<br />
-<br />
-<br />
_<br />
2.063<br />
2.080<br />
2.051<br />
-<br />
-<br />
SHP reported for various<br />
complexes at room and<br />
lower temp, and GS is of<br />
the form diX2-y2><br />
or dxv.
272 Bulletin of Magnetic Resonance<br />
S.No Host Lattice Site Spin-Hamiltonian Parameters<br />
Cu(NICA)2(SCN)2<br />
Cu(INA)2(SCN)2<br />
Cu(NICA)2SO4<br />
Cu(INA)2SO4<br />
g*<br />
2.152<br />
2.149<br />
2.159<br />
2.155<br />
gx<br />
-<br />
-<br />
-<br />
-<br />
gy<br />
-<br />
-<br />
-<br />
-<br />
As Ax<br />
196. [Cu(NCN)] 2+c<br />
[Cu(NSN)] 2+d<br />
[Cu(NSN-Me)] 2+d<br />
[Cu(NCN)2] 2+c<br />
]<br />
[Cu(NSN):<br />
12+d<br />
[Cu(NSN-Me)] 2+d<br />
197. Cu(II) - Ni(II) pairs<br />
198. [Cu(NH3)4]SeO4<br />
[Cu(H2O)3(CH3NH2)]SeO4<br />
[Cu(H2O)3(C3HsNH2)]SeO4<br />
[Cu(H2O)3(C3H7NH2)]SeO4<br />
[Cu(H2O)3(C5HiiNH2)]SeO4<br />
[Cu(H2O)3(C5H5NH2)]SeO4<br />
[Cu(H2O)3(C9H7N)]SeO4<br />
[Cu(C2H8N2)2]SeO4<br />
[Cu(C3H10N2)2]SeO4<br />
[Cu(H20)2(CioH8N2)]Se04<br />
[Cu(NH3)4]WO4<br />
[Cu(C2H8N2)]WO4<br />
[Cu(C3Hi0N2)]WO4<br />
199. Cu(NH3)3Cl4<br />
200. Cu(NN)2X2<br />
201. Cu(II) with N,N-dialkyl<br />
amino acids<br />
202. (CuO)x(V205)o.55-x(Te02)0.45<br />
203. x(CuO-V2O5)(l-x)(Na2OP2O5)<br />
204. xCuO(l-x) [2P2O5-Na2O]<br />
205. Copper Oxide<br />
206. C11O4<br />
CuO2S2<br />
CuO2Se2<br />
207. Cu4OCl6(TPPO4)<br />
208. [(L')Cu(u-OH)2Cu(L')]<br />
(C1O4)2<br />
2.323<br />
2.333<br />
2.335<br />
2.306<br />
2.264<br />
2.262<br />
2.32<br />
2.32<br />
2.30<br />
2.31<br />
2.33<br />
2.32<br />
2.33<br />
2.30<br />
2.32<br />
2.32<br />
2.32<br />
2.29<br />
2.31<br />
2.074<br />
2.078<br />
2.075<br />
2.063<br />
2.053<br />
2.052<br />
2.08<br />
2.11<br />
2.06<br />
2.10<br />
2.09<br />
2.09<br />
2.11<br />
2.09<br />
2.16<br />
2.14<br />
2.12<br />
2.05<br />
2.12<br />
2.074<br />
2.078<br />
2.075<br />
2.063<br />
2.053<br />
2.052<br />
2.206 2.070 2.066<br />
161<br />
132<br />
136<br />
165<br />
183<br />
183<br />
2.426 2.089 2.089 119<br />
2.359 2.079 2.079 122G<br />
2.264 2.076 2.076 108G<br />
2.259 2.076 2.076 109G<br />
Comments Ref.<br />
12 12 12 SHP reported for diff.ligand [53]<br />
15 15 environments. Optical data<br />
17 17 17 also reported.<br />
18 18<br />
22 22<br />
22 22<br />
Method to calculate the g [38]<br />
and A tensors discussed.<br />
The g-signals are very sharp [122]<br />
and the values are temp,<br />
independent. NMR data and<br />
magnetic data also reported.<br />
SHP parameters estimated by [135]<br />
CNDO/2 technique.<br />
GS is of the form dix2-y2> • [232]<br />
ESR spectra influenced by [131]<br />
solvent and substituent diff.<br />
Glasses.<br />
Glasses.<br />
[444]<br />
[489]<br />
21 21 GS is of the form 3dxy. [76]<br />
ZFR observed at and under [408]<br />
the critical temp.(Tc).<br />
Covalency bonding increases [350]<br />
in order CuO4 < CuO2S2<br />
< CuO2Se2.<br />
Magn. dipole-dipole coupling [385]<br />
const, calculated.<br />
2.250 2.06 2.06 ZFR. [337]
Vol. 16, No. 3/4 273<br />
S.No Host Lattice Site Spin-Hamiltonian Parameters<br />
209. Cu4OX6L4<br />
2.10<br />
g* gy Az Ax<br />
210.<br />
Cu(OX)2<br />
Cu(OX)(SA)<br />
Cu(OX)(Ace-SA)<br />
Cu(OX)(Cl-SA)<br />
Cu(OX)(2Br-SA)<br />
Cu(OX)(2I-SA)<br />
Cu(OX)(2NO2-SA)<br />
Cu(OX)(Thio-SA)<br />
211. Cu(II)Polyamine and<br />
Imidazole complexes<br />
212. Cu(PPO)4(ClO4)2-H2O<br />
Zn(Cu) (PPO)! (C1O4) 2 -4H2O<br />
(Zn:Cu = 100:1)<br />
213. [Cu2(Phen)2(C2O4)(NO3)2]<br />
214. Cu(PhP)2Cl2<br />
Powder<br />
215. Cu(l-Phenylpyrazole)2Cl2<br />
216. Cu[P(OMe)3]3<br />
Cu(Pme3)3<br />
Cu(CO)3<br />
217. Cu(PBTT)2Cl2<br />
Cu(PTT)2Cl2<br />
Cu(PFTC)2Cl2<br />
Cu(DPBTB)4Cl2<br />
Cu(PBTB)2Cl2<br />
Cu(PBTT-H)2<br />
Cu(PFTC-H)2<br />
Cu(DPBTB-H)2<br />
Cu(PBTB-H)2<br />
218. 63 CuPF3<br />
63 Cu 13 CO<br />
I<br />
II<br />
2.196<br />
2.167<br />
2.160<br />
2.268<br />
2.186<br />
2.168<br />
2.204<br />
2.168<br />
2.047<br />
2.050<br />
2.052<br />
2.059<br />
2.045<br />
2.063<br />
2.088<br />
2.065<br />
2.047<br />
2.050<br />
2.052<br />
2.059<br />
2.045<br />
2.063<br />
2.055<br />
2.065<br />
162.8<br />
2.371 2.101 2.080 146<br />
2.335 2.0897 2.0795 127.5 9.69 7.73<br />
2.285<br />
2.068<br />
2.320<br />
2.206<br />
2.060<br />
2.206<br />
2.068<br />
2.206<br />
2.068 2.206 2.206<br />
2.0025<br />
2.0023<br />
2.0010<br />
2.3992<br />
2.4056<br />
2.2991<br />
2.2205<br />
2.3600<br />
2.4037<br />
2.3426<br />
2.2317<br />
2.2572<br />
1.999<br />
1.9966<br />
2.0030<br />
2.0016<br />
2.0029<br />
2.0633<br />
2.0649<br />
2.0382<br />
2.0191<br />
2.0342<br />
2.0578<br />
2.0417<br />
2.0128<br />
2.0246<br />
2.0030<br />
2.0016<br />
2.0029<br />
2.0633<br />
2.0633<br />
2.0382<br />
2.0191<br />
2.0342<br />
2.0578<br />
2.0417<br />
2.0128<br />
2.0246<br />
280<br />
MHz<br />
293<br />
MHz<br />
225<br />
MHz<br />
62.2G<br />
60.0G<br />
80.0G<br />
72.5G<br />
74.0G<br />
60G<br />
79.17G<br />
79.2G<br />
70G<br />
40<br />
MHz<br />
34<br />
MHz<br />
10G<br />
20G<br />
15G<br />
12.5G<br />
19.6G<br />
15G<br />
11.25G<br />
15G<br />
19.1G<br />
40<br />
MHz<br />
34<br />
MHz<br />
10G<br />
20G<br />
15G<br />
12.5G<br />
19.6G<br />
15G<br />
11.25G<br />
15G<br />
19.1G<br />
Comments Ref.<br />
Symmetric and skew-symmet- [57]<br />
ric parts discussed with the<br />
help of ZFR.<br />
Powder data presented. [16]<br />
Resolved at LNT.<br />
Resolved at LNT and RT.<br />
Resolved at LNT.<br />
MO coeff. For all complexes<br />
LNT data also presented.<br />
SHP were presented diff. [411]<br />
solution spectra. Axial EPR<br />
spectra exist in all the<br />
complexes.<br />
The metal-ligand length in [395]<br />
the z, x - directions in<br />
Zn(II) complexes are more<br />
longer and the bond length<br />
in Y-dir. is more shorter<br />
than the corresponding<br />
bond-lengths in Cu(II).<br />
ZFR; X-ray data presented. [35]<br />
EPR signals became single [127]<br />
line at LT.<br />
At 77K EPR signal due to<br />
magnetically ineuivalent<br />
Cu 2+ complexes collapsed<br />
into single line.<br />
Cu ions undergoes sp 2<br />
hybridization with p-ligands<br />
donating their lone-pair<br />
electrons.<br />
[128]<br />
[156]<br />
ESR signals caused by some [491]<br />
defect in the crystal.<br />
Magnetic properties and<br />
SHP reported. GS is of<br />
the form 2Ai.<br />
[157]
274 Bulletin of Magnetic Resonance<br />
S.No Host Lattice Site Spin-Hamiltonian Parameters<br />
gx gy A2 Ax<br />
219. CU2PMO11VO4O2IH2O<br />
220. Cu(PTT)2Cl2<br />
221. Cu(PU)5(ClO4)2<br />
222.<br />
223.<br />
224.<br />
225.<br />
226.<br />
227.<br />
228.<br />
229<br />
Cu(pyb)Cl2<br />
Cu(pyi)Cl2<br />
Cu(pyim)Cl2<br />
Cu(PZ)2Cl2<br />
Cu(PZ)4Br2<br />
Cu(PZ)4(ClO4)2<br />
Cu(RCO)2L2<br />
Cu2REP(u-OH)(C104)2<br />
Cu2REP(u-Cl)Cl2<br />
Cu(I) sulphide<br />
[Cu2(Sal-/3-al)2H2O]H2O<br />
Cu(2+) on silicon surface<br />
[Cu(S2CNHCHRCO2H)2]<br />
(R = Me.Et)<br />
230. Cu(SHA)2-2H2O<br />
231. Cu(Sal)2-4H2O<br />
Cu(Sal)2(2-pycar)2<br />
Cu(Sal)2(3-pycar)2<br />
232. Cu(II)-semiquinonato<br />
complexes<br />
233. Cu(salgly) L(H2O)X<br />
234. Cu(Sal)2-4H2O<br />
Cu(Sal)2(2-pycar)2<br />
Cu(Sal)2(3-pycar)2<br />
Si<br />
s2<br />
2.05<br />
2.349<br />
2.295<br />
2.307<br />
2.300<br />
2.268<br />
2.15<br />
2.61<br />
2.30<br />
2.294<br />
2.23<br />
2.20<br />
2.12<br />
2.077<br />
2.069<br />
2.090<br />
2.063<br />
2.050<br />
2.04<br />
2.053<br />
2.07<br />
2.10<br />
2.077<br />
2.069<br />
2.090<br />
2.063<br />
2.050<br />
2.05<br />
2.053<br />
120G<br />
150G<br />
158G<br />
170<br />
191<br />
166<br />
40G<br />
33G<br />
25G<br />
Mn(II) > Fe.<br />
2.310 2.065 2.065<br />
2.304 2.075 2.075<br />
2.310 2.060 2.060<br />
154. 1 12.9<br />
170 10.2<br />
12.9<br />
10.2<br />
[85]<br />
[394]<br />
[165]<br />
[355]<br />
[472]<br />
[487]<br />
[265]<br />
[62]<br />
[213]<br />
Formation of different [459]<br />
symmetries of the complexes were<br />
discussed.<br />
ZFR. [15]<br />
The complexes show moderate [349]<br />
antimicrobial activity against<br />
Fungi.<br />
SHP used for estimate MO<br />
coefficient<br />
[270]
Vol. 16, No. 3/4 275<br />
S.No Host Lattice Site Spin-Hamiltonian Parameters<br />
235. Cu(Sal-enNH2)ClO4<br />
Cu(Sal-enNH2)NO3<br />
Cu(Sal-pnNH2)ClO4<br />
Cu(Sal-pnNH2)NO3<br />
Cu(5-NO2Sal-enNH2)NO3-H2O<br />
Cu(5-NO2Sal-PnNH2)NO3-H2O<br />
236. Cu(Saox)2<br />
Cu(apox)2<br />
Cu(mpox)2<br />
Cu(ppox)2<br />
Cu(bpox)2<br />
Cu(opox)2<br />
237. CuSO4-5H2O<br />
238. CuSO4-5H2O<br />
239. [Cu2(tembma)2(bat)]<br />
(NO3)3<br />
240. [Cu2(t-Buty.py)4(N3)2]<br />
(C1O4)2<br />
241. Cu(Tl)(EDTC)2<br />
Cu(Tl)(MDTC)2<br />
Cu(Tl)(BDTC)2<br />
Cu(Ni)(EDTC)2<br />
242. Cu-(Thalocyanine)0.2<br />
243. Cu(II)with triedentate<br />
salicylaldimines<br />
244. Cu(II) trimers<br />
245. CuThO2<br />
246. Copper Thorium<br />
Oxides<br />
247. CuTl2(EDtc)4<br />
0<br />
t<br />
2.251<br />
2.251<br />
2.273<br />
2.273<br />
2.250<br />
2.276<br />
2.179<br />
2.185<br />
2.189<br />
2.190<br />
gx gy Az Ax<br />
2.060<br />
2.045<br />
2.042<br />
2.058<br />
2.045<br />
2.052<br />
2.060<br />
2.045<br />
2.042<br />
2.058<br />
2.045<br />
2.052<br />
2.130 2.063 2.190<br />
2.240 2.070 2.030<br />
2.086<br />
2.087<br />
2.087<br />
2.087<br />
2.025<br />
2.026<br />
2.025<br />
2.023<br />
2.025<br />
2.026<br />
2.025<br />
2.023<br />
2.088 2.023 2.023<br />
2.090 2.024 2.024<br />
2.089 2.027 2.027<br />
186<br />
188<br />
172<br />
172<br />
189<br />
174<br />
157<br />
157<br />
157<br />
157<br />
155/<br />
165G<br />
150/<br />
160G<br />
148/<br />
158<br />
41<br />
41<br />
41<br />
44<br />
39.4/<br />
42.2G<br />
40.9/<br />
43.8G<br />
41/<br />
44G<br />
41<br />
41<br />
41<br />
44<br />
39.4<br />
42.2G<br />
40.9/<br />
43.8G<br />
41/<br />
44G<br />
Comments Ref.<br />
ESR spectra show the depolimerization<br />
of the dimers<br />
by the polar solvents. SHP<br />
for diff. solvents reported.<br />
SHP, IR and optical data<br />
reported for several solutions.<br />
Investigation of dehydration<br />
processes.<br />
The Cu 2+ ions are magnetically<br />
equivalent. Angular<br />
dependence EPR LW discussed.<br />
ZFR.<br />
Two magnetically distinct<br />
sites observed. ZFR.<br />
GS is of the form of<br />
diX2-y2> or d/xy>.<br />
[246]<br />
[243]<br />
[484]<br />
[420]<br />
[36]<br />
[244]<br />
[182]<br />
Indirect exchange inter- [132]<br />
ation between Cu 2+ ions showed<br />
by EPR.<br />
The role of OH groups on [202]<br />
the structure of adducts<br />
analysed.<br />
EPR LW changes with temp. [506]<br />
The result of symmetric<br />
anisotropic exchange.<br />
SHP reported. [33]<br />
ESR parameters change with [21]<br />
temp, due to two non-equivalent<br />
Cu 2+ ions.<br />
Depending on temp, and [184]<br />
preparation conditions Cu-Tl<br />
complex formed.
276 Bulletin of Magnetic Resonance<br />
S.No Host Lattice Site Spin-Hamiltonian Parameters<br />
gx gy Az Ax<br />
248. [Cu(trien)en]BO4<br />
2.222 2.058 2.058 504<br />
MHz<br />
[Cu(trien)en](ClO4)2<br />
2.180 2.058 2.058<br />
249. [Cu(trien)(enMe4)](Bh4)2<br />
[Cu(trien)(enEt2)](BPh4)2<br />
250. Cu-tylacetonate;<br />
Cu-phthalocyanine<br />
251. CuX2(4-picdine)2<br />
252.<br />
253.<br />
254.<br />
CuX2(H20)2<br />
CuX2(Py)<br />
Cuo.5Zr2(P04)3<br />
63 Cu/Zn(AP)2(NO3)2<br />
255. Diaqua (15-Crown-5-Ether)<br />
Zn(II) Nitrate<br />
256. Dicyanoquinonedimino-Cu 2+<br />
257. Diopfase<br />
258. ErBaCu3O7-s<br />
HoBa2Cu3O7_s<br />
259. EuBa2Cu3O7_s<br />
260. Eu2CuO4<br />
261. [Fe(III)Cu(II)(BPMP)Cl2]<br />
(BPhy)2<br />
262. FeSi6-6H2O<br />
263. Iron Silicate Zeolite<br />
264. Garnet<br />
2.1937<br />
2.1898<br />
2.301<br />
2.318<br />
2.3919<br />
2.24<br />
2.24<br />
2.48<br />
2.0916<br />
2.0565<br />
2.005<br />
2.042<br />
2.1009<br />
2.05<br />
2.05<br />
2.01<br />
2.0516<br />
2.0465<br />
2.005<br />
2.042<br />
2.081<br />
2.05<br />
2.05<br />
2.01<br />
2.28 2.03 2.03<br />
2.380<br />
188.7<br />
188.4<br />
2.27 2.07 2.07 176G<br />
33.4<br />
28.7<br />
19.1<br />
9.5<br />
Comments Ref.<br />
For both the complexes GS is [393]<br />
of the form diX2-y2> • SHP of<br />
solutions and powders reptd.<br />
Bonding parameters estimated [263]<br />
SHP reported for diff. solvents<br />
and systems attributed<br />
to distorted compressed tetrahedral<br />
symmetry.<br />
By correlating EPR and optl. [320]<br />
data covalency parameters cal.<br />
At lower temp. diff. symme- [225]<br />
tries appeared.<br />
ZFR. [271]<br />
JT distortion below 793K. [198]<br />
-21.4 -10 d- orbital coeff. and GS-WF [427]<br />
constd.; Cu 2+ sub. for Zn 2+ .<br />
SHP reported. [86]<br />
Localized Cu 2+ spin present [313]<br />
independently of conduction<br />
electrons.<br />
SHP and crystal field para- [372]<br />
meters reported.<br />
A non-resonant absorption [215]<br />
peak observed below Tc of 93K.<br />
Significant diff. observed [143]<br />
between EPR signal of Cu 2+ in<br />
tetragonal and orthorhombic<br />
phase.<br />
Unusual ESR signal in single [466]<br />
crystal observed and disappears<br />
above ~215K.<br />
Unusual line broadening [200]<br />
observed by ESR and Moessbauer.<br />
The exchange parameter (J) [384]<br />
=(0.30 ± 0.003)cm- 1 at 4.2K.<br />
Introduction of Cu 2+ ions [214]<br />
leads to reduction of ESR<br />
signal.<br />
Cu 2+ ions orbital study in [42]<br />
octahedral surroundings.
Vol. 16, No. 3/4<br />
S.No Host Lattice Site Spin-Hamiltonian Parameters<br />
265. GdBa2Cu3Oy<br />
gz gx gy Az Ax Ay<br />
266. GdBa2Cu30y<br />
267. GdBa2Cu3O7_s<br />
268. GdBa2Cu3O7_s<br />
269. Gd2CuO4<br />
270. [(Gd0.sEuo.5)2Cu04]<br />
271. Gdo.sReo.sBa2Cu307_,<br />
272. GdT2Ge2<br />
(T=Co,Ni,Cu)<br />
273. GdT2Sn2<br />
274. GdyYi_yBa2Cu3O6+x<br />
275. (Gly)2CaCl2-4H2O<br />
276. (Gly)2CaCl2-4H2O<br />
277. (gly)3Ca(NO3)2<br />
278. HxLa18Sr0.2CuO4<br />
279. hnap-bac. ea<br />
hnap-bac. py<br />
hnap-bac<br />
hnap-acac. dea<br />
hnap-bac<br />
280. hnap.acac<br />
hnap.bac<br />
hnap.Ind.<br />
hb.benH<br />
2.021<br />
2.07<br />
2.01<br />
1.989<br />
Comments Ref.<br />
277<br />
Exchange interactions dis- [328]<br />
cussed between metal ions.<br />
Intensity and LW of EPR [329]<br />
varies with temperature.<br />
EPR spectrum intensity [141]<br />
increases with decreasing temp.<br />
Lowering the g-anisotropy [430]<br />
by the orientation provides<br />
at LT.<br />
The mechanism of supercond.<br />
discussed. Low field EPR<br />
signal observed at 260K.<br />
[399]<br />
ESR show anomalous aniso- [99]<br />
tropy for temp, below T ~ 280K<br />
of the Cu 2+ ions.<br />
Cu 2+ LW and LS were almost [142]<br />
independent.<br />
EPR LW and g-shift depend on [203]<br />
number of d-electrons.<br />
Thermal broadening of LW<br />
increases with decreasing<br />
d-electrons.<br />
LW vartion with temp, and<br />
ZFR observed.<br />
SHP reported.<br />
2.308 2.115 2.034 -73 40.1 113.4 GS-WF is of the form<br />
ala dx2—y2— b dz2 >.<br />
2.274 2.049 2.081 127 50 20 MO coeff. evaluated.<br />
2.219<br />
2.176<br />
2.245<br />
2.289<br />
2.252<br />
2.243<br />
2.252<br />
2.325<br />
2.297<br />
2.054<br />
2.061<br />
2.056<br />
2.053<br />
2.055<br />
2.055<br />
2.055<br />
2.072<br />
2.071<br />
2.054<br />
2.061<br />
2.056<br />
2.053<br />
2.055<br />
2.055<br />
2.055<br />
2.072<br />
2.071<br />
192<br />
149<br />
182<br />
179<br />
186<br />
186<br />
186<br />
148<br />
158<br />
16<br />
10<br />
21<br />
18<br />
21<br />
19<br />
21<br />
16<br />
10<br />
21<br />
18<br />
21<br />
19<br />
21<br />
Two types of Cu 2+ centres<br />
formed like single ion and<br />
cluster ions.<br />
The study of adducts and<br />
their influence on the struct<br />
of the Cu complexes in the<br />
solutions reported.<br />
SHP reported for various<br />
solvent solutions and reported<br />
data evidence of<br />
Cu(II) complexes.<br />
[204]<br />
[407]<br />
[163]<br />
[166]<br />
[169]<br />
[443]<br />
[124]<br />
[162]
278 Bulletin of Magnetic Resonance<br />
S.No Host Lattice Site Spin-Hamiltonian Parameters<br />
gx gy Az Ax<br />
281. Hydrated Monopyrazine-<br />
Zinc sulphate - Ammonium<br />
sulphate, Magnesium acetate<br />
282. K-(BEDT-TTF)2Cu[N(CN)2]Br<br />
K-(BEDT-TTF)2Cu(N(CN)2]I<br />
283. K2Cd(SO4)2-6H2O<br />
284. K2C2O4H2O<br />
285. K3Cu(CN)4<br />
286. KCuF3<br />
287. KHCO3<br />
288. Ko.73Lio.27Tao.3<br />
289. KMgClSO4- 3H2O<br />
290. KNH4SO4<br />
Powder<br />
291. K2PdCl4; K2PdBr4; CdCl2<br />
292. K2ptCu(NO2)4<br />
293. K2SeO4<br />
I<br />
II<br />
I<br />
II<br />
III<br />
2.0058 2.0020 2.0020<br />
2.0058 2.0020 2.0020<br />
2.3330 2.0721 2.0663<br />
2.2403 2.0647 2.0525<br />
2.0004 2.0049 2.0049<br />
2.295<br />
2.292<br />
0.4832<br />
GHz<br />
0.260<br />
MHz<br />
0.262<br />
MHz<br />
0.0486<br />
GHz<br />
0<br />
0.074<br />
MHz<br />
0.0504<br />
GHz<br />
0<br />
0.074<br />
MHz<br />
2.2342 2.0452 2.0452 576.6 85.9 85.9<br />
MHz MHz MHz<br />
2.330 2.030 2.242 63.05 47.41 47.24<br />
2.095<br />
2.119<br />
2.100<br />
2.073<br />
2.073<br />
2. 121<br />
2. 103<br />
2. 107<br />
2.098<br />
2.101<br />
2.121<br />
2.103<br />
2.107<br />
122G 34G 65G<br />
58.6<br />
91<br />
66.6<br />
71.3<br />
75.6<br />
54.1<br />
71.3<br />
75.6<br />
54.1<br />
2.034 2.389 2.148 23.2 118.7 45.9<br />
Comments Ref.<br />
EPR and optical data [ 474 1<br />
reported.<br />
The temperature and [209]<br />
angular dependence of<br />
the parameters of the<br />
resonance line analysed.<br />
Ground state of Cu 2+ ion [512]<br />
is of the form admixture<br />
of d-orbital.<br />
EPR showed four magnetically<br />
inequivalent Cu 2+<br />
sites, consisting two pairs<br />
of physically equivalent<br />
sites. Pseudostatic and<br />
dynamic JTE appears<br />
below above 172K.<br />
Two paramagnetic Cu 2+<br />
centers observed in t -<br />
irradiated samples EPR<br />
spectra.<br />
Temp, behaviour of the<br />
field discussed.<br />
[309]<br />
[314]<br />
[180]<br />
Resolved hfs observed and [410]<br />
LW relatively narrow. EPR<br />
data assigned to axial<br />
symmetry.<br />
Cu 2+ EPR and x-ray data [107]<br />
reported.<br />
Dynamic JTE observed. [88]<br />
Cu 2+ sub. Mg 2+ sites.<br />
Cu 2+ ions enter at K + sites. [327]<br />
GS is of the form dix2-y2> •<br />
MO coeff. estimated.<br />
Theoretical expressions [25]<br />
were presented for g, hf,<br />
shf parameters of d 9 square<br />
planar complex.<br />
Structure and orientation [92]<br />
of Cu(II) complex discussed<br />
and g and A terms are<br />
interpreted in terms of GS<br />
wave-function parameters.<br />
The splitting of resonance [515]<br />
lines depends on ml; paramagnetic<br />
centre obsd.
Vol. 16, No. 3/4 279<br />
S.No Host Lattice Site Spin-Hamiltonian Parameters<br />
294. K2SO4 - ZnSO4<br />
gz gx gy Az Ax<br />
295. K2SO4-Na2SO4-ZnSO4<br />
296.<br />
297.<br />
298.<br />
KTaO3<br />
KTaO3<br />
K2ZnF4<br />
299. K2ZnF4<br />
300. K2ZnF4<br />
301.<br />
302. La4Ba2Cu2Oio<br />
303.<br />
304.<br />
305. La2CuO4<br />
Lai.8Sro.2Cu04-y<br />
Yo.2Ba0.8Cu04-y<br />
306. La2CuO4<br />
Y2BaCuO5<br />
YBa2Cu3O7-s<br />
Bi2Sr2CaCu2O8+s<br />
307. La2CuO4<br />
308. LaCuO3-s<br />
309. La2CuO4<br />
I<br />
II<br />
I<br />
II<br />
2.238<br />
2.194<br />
2.045<br />
2.045<br />
2.014 2.381<br />
1.987 2.395<br />
2.531 2.123<br />
Comments Ref.<br />
Glasses. SHP reported.<br />
Glasses.<br />
2.045 172 172 172 Angular dependence EPR<br />
2.045 193 .<br />
GS dix2-y2> and ferromagnetic<br />
exchange interaction appears<br />
with decreasing temp.<br />
The compound shows a ferromagnetic<br />
transition at around 5K.<br />
[488]<br />
[192]<br />
[58]<br />
[59]<br />
[319]<br />
[158]<br />
[375]<br />
[152]<br />
[153]<br />
[154]<br />
EPR spectra of Cu 2+ observed [144]<br />
attributed to axial symmetry<br />
with dix2-y2> GS.<br />
Results indicate main part [259]<br />
of Cu ions in spinless Cu + state.<br />
The energy levels and g- [333]<br />
factors of Cu 2+ ion calculated<br />
with 'O' ligand field.<br />
Theory compared with<br />
exptl. data.<br />
The hydrogen effect on EPR [442]<br />
and Magn. susceptibility<br />
studied.<br />
GS wavefunction of the form [285]<br />
dlx2-y2>-<br />
EPR signal not obsd. upto [245]<br />
570K, because the presence of<br />
small number of holes in CuO2<br />
plane due to the oxygen nonstoichiometry.
280 Bulletin of Magnetic Resonance<br />
S.No Host Lattice Site Spin-Hamiltonian Parameters<br />
gx gy Az Ax<br />
2.12<br />
310. La2CuO4+s<br />
311. [L2Cu2Cu(dmg)2Br]ClO4-<br />
CH3OH<br />
312. Laponite Clay:Cupric Ion<br />
313. Lai.82Sro.i8(Cui-.xZnx)04<br />
314. Lai_xSrxCui_yZnyO4<br />
315. Lithium hydrazinium<br />
sulphate<br />
316. LiKSO4<br />
Li(NH4)SO4<br />
LiNaSO4<br />
317. LiKSO4<br />
318. LiTaO3<br />
319. Ln2Cu2O5<br />
(Ln = Rare-earth ions)<br />
320. Macrocyclic complexes<br />
321. MCuCl3<br />
(M=K, Cs, Rb, NH4)<br />
322. (2-Methylimidazole)<br />
(N-Salicylideneslycinato)Cu(II)<br />
323. Mg(CH3COO)2-4H2O<br />
324. Magnesium Potassium<br />
Phosphate hexahydrate<br />
325. MgNa2(SO4)2-4H20 I<br />
CoNa2(SO4)2-4H2O<br />
I<br />
II<br />
II<br />
2.247 2.068 2.068<br />
2.36 2.060 2.060 145<br />
2.1<br />
2.4307 2.083 2.083 116 14 14<br />
2.400<br />
2.396<br />
2.197<br />
2.320<br />
2.3738<br />
2.181<br />
2.050<br />
2.167<br />
2.075<br />
2.0960<br />
2.044<br />
2.099<br />
2.167<br />
2.018<br />
2.0960<br />
9.4<br />
mT<br />
70<br />
108<br />
2.4<br />
mT<br />
56<br />
27<br />
8.2<br />
mT<br />
50<br />
27<br />
Comments Ref.<br />
Strong Cu 2+ EPR signal obsd. [486]<br />
if the quenching of the sample<br />
fast at LT.<br />
The study indicate square- [72]<br />
pyramidal geometry around Cu 2+<br />
ions with GS dix2-y2>-<br />
The system consists poten- [367]<br />
tial catalytic significance.<br />
Significance this result [102]<br />
verifying diverse microscopic<br />
mechanism of high-Tc supercond.<br />
Common feature of all spec. [103]<br />
was a signal with an isotropic g<br />
andLW.<br />
Cu 2+ ions entered lattice [315]<br />
interstitially. Charge compen.<br />
achieved by release of protons.<br />
Room temp, dynamic isotropic [324]<br />
JT spectra, there JT systems<br />
similar to each other.<br />
The ground state is predominantly<br />
dix2-y2>.<br />
Static and dynamic JTE<br />
observed.<br />
No ESR signal observed bet.<br />
77K and 550K except Lu2Cu2O5.<br />
Superhyperfine interaction<br />
spectra observed.<br />
Temp, dependence LW, EPR<br />
spectra, g values.<br />
Cu(II) environment approx.<br />
square planar coordination.<br />
Optical and MO coeff. data,<br />
presented.<br />
[13]<br />
[212]<br />
[115]<br />
[94]<br />
[147]<br />
[419]<br />
[305]<br />
SHP and MO coeff.evaluated. [366]<br />
Cu 2+ ions assigned to tetragonal<br />
symmetry.<br />
2.3991 2.1979 2.0299 0.4430 0.2513 0.2060 Two physically equivalent [300]<br />
GHz GHz GHz magnetically inequivalent sites<br />
2.3991 2.1979 2.0299 0.4202 0.2427 0.1986 obsd. in each sample. SLRT of<br />
GHz GHz GHz Co 2+ estimated.<br />
2.4023 2.1926 2.0256 0.3678 0.2363 0.1679<br />
GHz GHz GHZ
Vol. 16, No. 3/4 281<br />
S.No Host Lattice Site Spin-Hamiltonian Parameters<br />
gx gy Az Ax<br />
326. MgNH4PO4-6H2O<br />
2.074 2.427 2.142 27 76<br />
327. MgO<br />
328. MgTl2(SO4)2-6H2O<br />
329. M'2M"(SO4)2-6H2O<br />
(M' = Rb, M" = Mg)<br />
Powder<br />
330. Mononuclear Cu(II)<br />
compounds<br />
331. N-(4-alkoxysalicylideme)-4'alkylanilines<br />
complexes<br />
332. NaCl<br />
333. NaF<br />
334. NaF<br />
335. NaF : Cu<br />
336. NaioFe4Cu4Wi807oH6-29H20<br />
337. NaNH4SO4-2H2O<br />
Powder<br />
338. NaY-Zeolite<br />
339. Na2Zn(SO4)2-4H2O<br />
340. Na2Zn(SO4)2-4H2O<br />
341. (n-Bu4N)2[Cu(dsit)2]<br />
342. [N(CH3)4]2CuCl4<br />
I<br />
II<br />
2.076 59.8<br />
2.395 2.094 2.094 106 34<br />
2.3739 2.0270 2.1182 100 57<br />
2.458 2.105 2.105<br />
[2.0-2.5]<br />
2.5665 2.093 2.093<br />
34<br />
0<br />
Comments Ref.<br />
GS is of the form dix2-y2> •<br />
electronic absorption data<br />
reported.<br />
Well resolved EPR spectra<br />
of Cu 2+ and Cu 3+ ions obsd.<br />
Powder. Cu ions sub. Mg<br />
MO coeff., EPR spectrum<br />
attributed to D2h symmetry.<br />
Structural investigations<br />
reported.<br />
SHP reported.<br />
Charge carrier trapped<br />
centres detected by EPR.<br />
JT effect observed at LT.<br />
g and A values varies with<br />
temperature.<br />
226 240 240 Cu + ion conversions into Cu°<br />
MHz MHz MHz and Cu 2+ has been investigated<br />
2.327 2.116 2.099 81 18 27 The observed EPR spectrum<br />
consisted of broad line<br />
centered and weak second line.<br />
2.345<br />
2.359<br />
2.408<br />
2.144<br />
2.144<br />
2.088<br />
2.70<br />
2.208<br />
2.088<br />
2.0195 2.145 2.392<br />
2.2740 - 2.088<br />
2.019 2.100 2.075<br />
2.080<br />
123G 38G 50G Cu 2+ ions sub. Na + sites.<br />
Mo coeff. evaluated.<br />
14.6 1.5 1.5 EPR study used for identifying<br />
Cu 2+ complexes in<br />
single crystal.<br />
Cu 2+ ions enter sub. into<br />
Zn 2+ ions. SHP reported.<br />
70.4 24.9 55.6 The amount of Ix2-y2> pre-<br />
37.5 - 82.5 sent in the GS decreases as<br />
one goes to LT.<br />
.2+<br />
[417]<br />
[405]<br />
[364]<br />
{421]<br />
[181]<br />
[276]<br />
[450]<br />
[267]<br />
1462]<br />
[290]<br />
[478]<br />
[365]<br />
[123]<br />
[24]<br />
[397]<br />
42 152 53 Two magnetically non-equiv- [219]<br />
alent anions esr spectra obsd.<br />
EPR LW decrease with temp.; [112]<br />
LW of Cu 2+ ions anomalously<br />
large.
282 Bulletin of Magnetic Resonance<br />
S.No Host Lattice Site Spin-Hamiltonian Parameters<br />
gx gy Az_ Ax<br />
343. [N(CH3)4]2CuCl4<br />
2.267 2.085 2.124<br />
344. NdBa2Cu3O7_s<br />
345. Nd1.8sCeo.x5CuO4.-v<br />
346. [NEt4]2Cu(mnt)2<br />
[NEt4]2Ni(mnt)2<br />
347. NH4CI<br />
348. [NH3)5CoImCu(dien)<br />
ImCo(NH3)s](ClO4)6-4H2O<br />
349. (NH4)3H(SO4)2<br />
350. (NH4)3H(SO4)2<br />
351. NH4I<br />
352. (NH4)3UF8<br />
353. (NH4)2(Zn(NH3)2(CrO4)2]<br />
(NH4)2[Cd(NH3)2(CrO4)2]<br />
354. N,N'-hexamethylene-bis-<br />
(2,5-dihy droxyacetophenoneiminato)Cu(II)<br />
N,N'-tetramethylene-bis-<br />
(2,5-dihydroxyacetophenoneiminato)<br />
Cu (II)<br />
N,N'-ethylene-bis-<br />
(2,5-dihydroxyacetophenoneiminato)Cu(II)<br />
355. Oxyfluoroborate<br />
356. Paramagnetic centres<br />
in crystals<br />
I<br />
II<br />
III<br />
2.52<br />
2.086<br />
2.085<br />
2.045<br />
2.0095<br />
2.021<br />
2.320<br />
2.424<br />
2.002<br />
2.018<br />
2.017<br />
2.019<br />
2.022<br />
2.256<br />
2.209<br />
2.223<br />
2.080<br />
2.090<br />
2.272<br />
2.234<br />
2.234<br />
2.021<br />
2.026<br />
2.256<br />
2.209<br />
2.223<br />
2.080<br />
2.079<br />
2.272<br />
2.214<br />
2.219<br />
162<br />
15<br />
177.9<br />
71<br />
96<br />
10.93<br />
mT<br />
0.0117<br />
GHz<br />
14.78<br />
mT<br />
15.77<br />
mT<br />
2.162 2.058 2.058 127<br />
2.223 2.050 2.050 127<br />
2.236 2.040 2.050 120<br />
39<br />
79<br />
25<br />
57<br />
20<br />
5.74<br />
mT<br />
0.0057<br />
GHz<br />
13<br />
13<br />
12<br />
39<br />
79<br />
25<br />
57<br />
20<br />
1.79<br />
mT<br />
0.0057<br />
GHz<br />
13<br />
13<br />
12<br />
Comments Ref.<br />
PT observed at 298K aniso- [440]<br />
tropy LW at LT explained by<br />
dipole-dipole interaction<br />
between Cu 2+ pairs.<br />
ESR spectra of samples were [139]<br />
explained in terms of crystal<br />
field splitting.<br />
CESR signal obsd. intensity [269]<br />
and g-factor of signal varies<br />
with temp.<br />
Axial EPR spectra observed [239]<br />
in both cases.<br />
Temp, dependence EPR spectra [376]<br />
observed and interpreted with<br />
dynamic vibronic coupling.<br />
The bonding between Cu(II) [91]<br />
and ligands is covalent. SHP<br />
reported.<br />
PT, dynamic JTE. EPR study. [29]<br />
Cu 2+ ion sub. NH4 ion and [481]<br />
coordinates six oxygen atoms<br />
from six nearest sulphate ions.<br />
PT discussed.<br />
PT. Ground state wave- [67]<br />
function is of the form<br />
di3z2_r2> at LNT.<br />
Cu 2+ EPR spectrum exhibits [43]<br />
isotropic quartet.<br />
EPR spectra showed unusual [475]<br />
temp, dependence between room<br />
to liquid helium temp.<br />
SHP. MO coeff. of diff.<br />
solvents reported.<br />
Glasses. Anisotropic hfs<br />
observed.<br />
[465]<br />
[362]<br />
Intensity properties of EPR [513]<br />
line shape discussed.
Vol. 16, No. 3/4 283<br />
S.No Host Lattice Site Spin-Hamiltonian Parameters<br />
g* gy Az Ax Ay<br />
357. t'-Pb3V2O8<br />
2.333 2.076 2.076<br />
358. Ph4AsCuCl4<br />
359. Ph3As(OH)2[CuBr4]<br />
360. Pillared Clay<br />
361. [(PipdH)2CuBr4]<br />
362. Polyacrylamide<br />
363. Polyacrylamide gels<br />
GdBa2Cu30y<br />
365. {U-(PU)2[CU2(PU)8]}(C1O4)4<br />
366.<br />
367.<br />
368.<br />
369.<br />
R2BaCuO5<br />
(R=rare earth metals)<br />
R2BaCu05<br />
(R=Rare Earth)<br />
RBa2Cu3O7-s<br />
(R=Rare earth)<br />
Rb2CdCl4<br />
370. Rb2CdCl4<br />
371. Rb2Cd(SO4)2-6H2O<br />
I<br />
II<br />
2.269 2.037 2.192<br />
2.2749 2.0788 2.0446<br />
2.045 2.290 2.063<br />
2.145<br />
2.270<br />
2.240<br />
2.216<br />
2.030<br />
2.030<br />
2.070<br />
2.355<br />
2.133<br />
2. 110<br />
2. 133<br />
2. 355<br />
1.980 1.985 1.985<br />
50.2 74.8<br />
50.2
284 Bulletin of Magnetic Resonance<br />
S.No Host Lattice Site Spin-Hamiltonian Parameters Comments<br />
Ref.<br />
gz gx gy As Ax Av<br />
372. [(R'R2P)2Cu(adcoR")<br />
Two equivalent Cu centres [482]<br />
CuPR2R')2] within one molecule give rise<br />
to diff. isotope combinations.<br />
+<br />
373. R2SO4B2O3ZnSO4<br />
(R=Li,Na,K and Cs)<br />
374. R2SO4-B2O3-CdSO4<br />
(R=Li, Na, K or Cs)<br />
375. Rb2Zn(SO4)2-6H2O<br />
376. Silica Sol.Gels I<br />
II<br />
377. Silicotungstic heteropoly acid<br />
378. Sr0.6oCao.4oCu02<br />
379. Sr(CH3COO)2l/2H2O<br />
380. SrC4H2O4-4H2O<br />
Mg(C4H3O4)2- 6H2O<br />
381. Sr(HCOO)2- 2H2O<br />
Powder<br />
382. Sr2CuO3<br />
Cao.5Sri.5Cu03<br />
Cai.5Sro.5Cu03<br />
Ca2CuO3<br />
Ba2CuO3+x<br />
383. SrCuO2<br />
Sr2CuO3<br />
384. SrCuO2<br />
385. 65TeO2-(35-x)CuO-xCuCl2<br />
386. Tetramethylammonium<br />
Manganese Chloride<br />
2.3654 2.0270 2.1114 99<br />
2.53<br />
2.47<br />
137<br />
158<br />
2.18 71G<br />
2.3721 2.0643 2.0643 386 0<br />
MHz<br />
2.294 2.072 2.072 107<br />
2.357 2.148 2.039 143 63<br />
2.399 2.100 2.077 119 25<br />
2.410 2.106 2.079 120<br />
2.078<br />
2.072<br />
2.077<br />
2.035 2.114 2.114<br />
2.0<br />
2.0<br />
Glasses. [426]<br />
MO coeff. & SHP reported.<br />
Glasses. The SHP of Cu 2+ ions [363]<br />
indicate strong tetragonaldistortion<br />
MO coeff. evaluated.<br />
52 0 EPR spectrum interpreted to [422]<br />
rhombic symmetry. MO coeff.<br />
presented.<br />
SHP reported at diff. temp. [80]<br />
and chemical and structual changes<br />
discussed.<br />
Paramagnetic Cu 2+ used as [456]<br />
probe for investigating hydrate<br />
conversions in samples.<br />
EPR spectrum consists of [501]<br />
seven hf lines associated with<br />
a pair of identical Cu ions.<br />
0 The EPR data indicate Cu 2+ [304]<br />
ions incorporated at a site,<br />
characterized by a three fold<br />
symmetry.<br />
MO coeff. reported by corre- [30]<br />
38 lating optical and EPR data.<br />
15 Eight coordination host<br />
cation sites provided for<br />
Cu 2+ impurity.<br />
[68]<br />
Compounds containing Cu-O [26]<br />
chains found ESR silent at<br />
room and at LNT.<br />
The effect of the water on [160]<br />
the samples discussed.<br />
EPR study explained by the [63]<br />
formation of defects of two<br />
neighbouring Cu 2+ ions.<br />
No hfs observed due to Cu 2+ [441]<br />
A symmetry appears in the [331]<br />
ESR LS at RT but at LT the<br />
line is more symmetry.
Vol. 16, No. 3/4 285<br />
S.No Host Lattice Site Spin-Hamiltonian Parameters<br />
387. Thiosemicarbazone<br />
complexes<br />
gx gy Az Ax<br />
388.<br />
389. Tl2Mg(SO4)2-6H2O<br />
390. Tl2Ni(SO4)2-6H2O<br />
391. Tl2Zn(SO4)2-6H2O<br />
392. [(TMpyP)H2] 4+<br />
[(TMpyP)M] 4 +<br />
(M=VO 2+ ,Cu 2+ ,Zn 2+ )<br />
393. trans-bis(a - picoline)bis<br />
(4,4,4 - trifluoro-1-<br />
(2-thenoyl)<br />
butanedione - l,3)Cu(II)<br />
394. Trans-bis(L-2-aminobutyrato)Cu(II)Trans-bis(DL-2-aminobutyrato)Cu(II)<br />
395. Triammonium hydrogen<br />
disulphate<br />
2.25<br />
2.350<br />
2.219<br />
2.348<br />
2.162<br />
2.065<br />
2.20<br />
2.125<br />
2.065<br />
2.20<br />
2.125<br />
116<br />
22G<br />
2.185 2.087 70<br />
2.346 2.079 2.075 -154<br />
2.257<br />
2.257<br />
396. Tridentate Hydroxy- [2.194-2.325]<br />
napthoyl hydrazone<br />
397. WO3<br />
398. 60 XF4-5LaF3-20BaF2-15<br />
NaF (X=Zr,Hf)<br />
399. Yo.2Bao.8CuOx<br />
2.415<br />
2.193<br />
400. YBa2Cu3O7 2.161<br />
401. YBa2Cu3O7-x 2.176<br />
2.056<br />
2.054<br />
2.056<br />
2.054<br />
2.053 2.050 99<br />
2.033 2.033<br />
2.160 2.160 700<br />
2.055 2.055 65G<br />
[212-148]<br />
50<br />
18G<br />
40<br />
50<br />
Comments Ref.<br />
Based on ESR and Magn.<br />
data all complexes assigned<br />
to square-planar structure.<br />
EPR signal obsd. below Tc.<br />
SHP and MO coeff. reported.<br />
18G Cu 2+ ions sub. Ni 2+ sites.<br />
covalency parameters indicate<br />
the Cu(II) ions more covalent<br />
character in host lattice.<br />
25 GS wavefunction constructed<br />
and Cu 2+ sub. Zn 2+ sites.<br />
The study indicate the<br />
tetracationic porphyrins interinteract<br />
with and exist as<br />
monomeric entities. SHP<br />
reported for diff. ligand<br />
environments.<br />
-26 -26 MO coeff. calculated.<br />
[242]<br />
[40]<br />
[233]<br />
[234]<br />
[235]<br />
[205]<br />
[412]<br />
GS is of the form dix2_y2> [249]<br />
observed. The role of lattice<br />
symmetry in Cu-amino acid<br />
complexes estimated.<br />
Temperature dependence EPR [289]<br />
studies reported.<br />
SHP reported for diff. sol- [167]<br />
vents and Magn. properties<br />
reported.<br />
24.5 18.9 Ground state wave function [274]<br />
of the form dix2-y2> • Two<br />
models of copper centres<br />
discussed.<br />
760<br />
Diff. composition of glass [50]<br />
SHP reported and GS is of<br />
the form of dix2-y2> •<br />
GS is of the form dix2_y2>. [281]<br />
760 Cu 2+ in anisotropic environ- [61]<br />
ment due to the presence of<br />
rapid oscillating distortions.<br />
0 Depending on both temp. [398]<br />
and microwave freq.<br />
Resonant field<br />
determined.
286 Bulletin of Magnetic Resonance<br />
S.No Host Lattice Site Spin-Hamiltonian Parameters<br />
gx gy Az Ax<br />
402. YBa2Cu3O7_x 2.2167 2.0475 2.0475 166.5G 25G 15G<br />
403. YBa2Cu3O7-*<br />
404. Y2Ba2CuOs<br />
405. Y2BaCuO5<br />
406. Y-Ba-Cu-O<br />
407. YBa2Cu3O7_s<br />
408. YBa2Cu3O6+x<br />
409. YBa2Cu307_s<br />
410. YBa2Cu3O8<br />
411. YBa2Cu3O7-x<br />
412. YBa2Cu3O8<br />
414. YBa2Cu3Ox<br />
415. YBa2Cu3O7-x<br />
2.24 2.06 2.06<br />
2.200 2.060 2.060<br />
2.047 2.05 2.05<br />
2.215 2.065 2.065<br />
413. YBa2Cu3O7_x 2.194 2.069 2.069 72G<br />
2.315<br />
[2.03-2.06]<br />
2.16 2.019<br />
2.2<br />
416. YBa2Cu3O7-x 2.224 2.051 2.051<br />
417. YBa2Cu3O7_x<br />
Comments Ref.<br />
g// value varied with temp,<br />
g ~ 2 assigned to additional<br />
weak broad EPR line.<br />
EPR directly detected small [428]<br />
superconducting domains<br />
and Cu 2+ inclusions.<br />
At RT uniaxiai EPR spectrum [226]<br />
observed for Cu 2+ ions.<br />
Cu 2+ EPR signal observed. At [206]<br />
LT the EPR line broadened<br />
and disappeared at around 20K.<br />
Non-superconducting in dis- [93]<br />
torted octahedral surroundings.<br />
Cu 2+ EPR signal existed<br />
only in fraction of samples.<br />
Electronic charge compensation [34]<br />
of copper discussed.<br />
EPR LW temp, independent.<br />
EPR signal from superconductivity<br />
phase due to<br />
small quantity of Cu 2+ ions.<br />
Localized Cu 2+ position<br />
centres established.<br />
Cu 2+ signals used for calculating<br />
the oxygen deficiency.<br />
EPR results assigned to<br />
orthorhombic symmetry.<br />
[210]<br />
[14]<br />
[9]<br />
[39]<br />
[10]<br />
Density of magnetic moments [31]<br />
decreases with temp.; increasing<br />
from LNT to superconductive<br />
transition.<br />
EPR spectrum attributed to [138]<br />
compressed rhombic symmetry.<br />
EPR signal absence from [48]<br />
Cu 2+ ions.<br />
EPR LW independent on temp. [84]<br />
EPR signal disappeared at [256]<br />
T>Tc.
Vol. 16, No. 3/4 287<br />
S.No Host Lattice Site Spin-Hamiltonian Parameters<br />
418. YBa2Cu3O7_x<br />
gz gx gy Az Ax Ay<br />
419.<br />
420.<br />
Y2BaCuO5<br />
Y2BaCuO5<br />
YBa3Cu2Oy<br />
421. Y2BaCuOs<br />
422. Y2BaCuO5<br />
423. YBa2Cu3Ox<br />
Bi2Sr2CaCu2Ox<br />
424. YBa2Cu3O7-x<br />
Y2BaCuO5<br />
425. YBa2Cu3O7-x<br />
426. Yi+xBa2_xCu3Oy<br />
427. YBa2Cu3O7_y<br />
428. YBa2Cu3O7<br />
429. YBa2Cu3O7<br />
430. Yttrium Barium Copper Oxide<br />
431. Y2BaCuO5<br />
432. YBa2Cu3O7_s<br />
I<br />
II<br />
2.075 2.086 2.086 90G 75G 75G<br />
2.23 2.09 2.09<br />
2.40<br />
2.23<br />
2.222<br />
2.208<br />
2.109<br />
2.120<br />
2.100<br />
2.05<br />
2.20<br />
2.20<br />
2.107<br />
2.09<br />
2.050<br />
2.047<br />
2.055<br />
2.050<br />
2.10<br />
2.05<br />
2.061<br />
2.09<br />
2.094<br />
2.047<br />
2.120<br />
2.050<br />
2.23<br />
2.10<br />
2.215 2.065 2.065<br />
2.20 2.10 2.10<br />
2.23 2.03 2.03<br />
Comments Ref.<br />
Resonance signal of DPPH [222]<br />
deposited on specimen shifted.<br />
Intensity of EPR signal of<br />
Cu 2+ ions measured at room<br />
temperature.<br />
Isotropic and strong EPR [282]<br />
signal observed in unannealed<br />
crystals; EPR signal absence<br />
for Cu 2+ ions in annealed<br />
crystals.<br />
Causes for EPR signal [278]<br />
absence of black phase discussed.<br />
Due to Brown and<br />
green phase impurity weak Cu 2+<br />
EPR signal observed.<br />
Temp, depedence of ratio of [223]<br />
EPR intensity to that of DPPH<br />
at room temp, reported.<br />
SHP and Magn. suceptibility [283]<br />
reported.<br />
EPR signal silence at temp. [284]<br />
of upto 570K of Cu 2+ ions.<br />
EPR LW and intensity changes [323]<br />
with temp.; JTE suggested for<br />
possible correction.<br />
EPR signal observed due to [510]<br />
impurity phases.<br />
Superconducting material. [133]<br />
EPR signal observed due to [111]<br />
dark phase: LW temp, dependence.<br />
Diminishing microwave loss [464]<br />
with increasing impurity<br />
phases.<br />
LW temp, dependence from [11]<br />
normal state to superconducting<br />
state.<br />
EPR line intensity varies [340]<br />
with temperature.<br />
Temp, dependence of the EPR [105]<br />
signal and susceptibilities<br />
discussed.<br />
The structure, electrical [498]<br />
conductivities and Magn.<br />
susceptibilities reported.
288 Bulletin of Magnetic Resonance<br />
S.No Host Lattice Site Spin-Hamiltonian Parameters<br />
gz gx gy A2 Ax Ay<br />
433. Yttrium Barium Copper<br />
Oxide (YBCO)<br />
434. YBa2Cu3O7<br />
435. YBa2Cu3O7-s<br />
YBa2(Cui_xFex)3O7-s<br />
436. YBa2Cu3O7_s<br />
437. YBa2Cu3O7-s<br />
438. YBa2Cu3O7<br />
439. YBa2Cu3O7-x<br />
Bi4/3Pb2/3Sr2CaCu2O8+x<br />
440. YBa2Cu3O7_s<br />
441. YBa2(Cu1_xFex)3O7_s<br />
442. YBa2Cu306.8±o.i<br />
443. YBa2Cu3O7_s<br />
444. Y-Ba-Cu-O<br />
445. YBa2Cu3O7_x<br />
Ca2Sr2Bi2Cu30io-x<br />
446. YBa2Cu3O7_s<br />
447. YBa2Cu2O7<br />
Bi2Sr2CaCu2O8<br />
448. YBa2Cu3O7_s<br />
Green phase 2.264 2.056 2.137<br />
Brown phase 2.262 2.038 2.038<br />
Black phase EPR signal silent<br />
2.055<br />
2.050 2.222 2.094<br />
2.223 2.091 2.091<br />
2.218 2.06 2.06<br />
Comments Ref.<br />
Low-field EPR signal is [207]<br />
non-resonant in nature.<br />
EPR spectra changes with [73]<br />
time of exposure of H2O.<br />
ESR study explained with [382]<br />
oxygen-deficiency and Fedopant.<br />
Below Tc, EPR line shifts [359]<br />
due to local fields.<br />
Comments provided on ZFR [499]<br />
and non-resonant of powders<br />
as well as single crystals.<br />
Single EPR line obsd. above [101]<br />
Tc, below it resolved into two.<br />
ESR signal is const, with [208]<br />
temp, below Tc.<br />
g-values increases with [218]<br />
temp, becomes maximum at 230K<br />
and g-values decreases, but<br />
weak signal appeared with<br />
original signal below 130K.<br />
Size and shape of signal [65]<br />
near zero-field microwave<br />
absor. analysed.<br />
SHP. [229]<br />
SHP and NMR data estimated. [360]<br />
Local Magn. flux density of<br />
sample measured by EPR probes.<br />
Cu 2+ state stabilized by<br />
five oxygen ligands.<br />
EPR signal depends on 02<br />
pressure and annealing temp.<br />
[326]<br />
[321]<br />
gav related to superposition [429]<br />
of vibronically coupled orbital<br />
states Ix2-y2> and 3z2-r2.<br />
Both compounds exhibit EPR [41]<br />
broadening at LT.<br />
gav-factor related to super- [430]<br />
position of vibronically<br />
coupled orbital states Ix2-y2><br />
and 3z2-r2.
Vol. 16, No. 3/4 289<br />
S.No Host Lattice Site Spin-Hamiltonian Parameters<br />
449. YBa2Cu3O6+y<br />
Sz gx gy Az Ax Ay<br />
450. YBa2Cu3O7_s<br />
451. YBa2Cu3O7_s<br />
452. YBa2Cu3O4<br />
453. YBa2Cu3O7_s<br />
454. YBa2Cu3Oy<br />
455. YBa2Cu3O7_x<br />
Ca2Sr2Bi2Cu3Oi0_x<br />
456. YBa2Cu3O6+y<br />
457. YBa2(Cuo.98Coo.o2)0T<br />
458. Y2Cu2Os<br />
459. Y2Cu2Os<br />
460. Yo.gEro.iBai.<br />
461. Y1_xGdxBa2Cu3O7<br />
462. Yx-xGdxBaa<br />
463. Zeolites<br />
464. Zeolites NaX<br />
Zeolites KX<br />
Zeolites KA<br />
A<br />
B<br />
A'<br />
A<br />
A'<br />
C<br />
D<br />
2.39 2.07 2.07<br />
2.270 2.020 2.020<br />
2.23<br />
2.23<br />
2.39<br />
2.03<br />
2.08 2.08<br />
2.08 2.08<br />
2.285 2.06 2.06<br />
[2-2.3]<br />
2.108<br />
2.04 2.04<br />
2.049 2.083 2.083<br />
2.062<br />
2.081<br />
2.060<br />
2.062<br />
2.060<br />
2.067<br />
2.074<br />
2.356<br />
2.406<br />
2.373<br />
2.343<br />
2.374<br />
2.385<br />
2.327<br />
2.356<br />
2.406<br />
2.373<br />
2.343<br />
2.374<br />
2.385<br />
2.327<br />
138G<br />
90G<br />
125G<br />
130G<br />
125G<br />
HOG<br />
145G<br />
Comments Ref.<br />
EPR signal observation on [380]<br />
local oxygen order.<br />
EPR study presented by diff. [431]<br />
scientists explained.<br />
Due to heat treatment pro- [106]<br />
cess amplitude of EPR signal<br />
decreases, but g-factor LW.<br />
lineshape unchanged at measured<br />
temp.<br />
LW variation studies with<br />
temp.<br />
SHP.<br />
Below Tc, shifting and<br />
broadening observed of EPR line.<br />
Low field ESR intensities<br />
of Cu 2+ studied.<br />
The ZFR depends on the<br />
crystal field.<br />
The efficiency of the method<br />
demonstrated by LT.<br />
Temp, dependence of single<br />
broad EPR line observed.<br />
For superconductivity phases<br />
associated with lattice<br />
defects weak EPR signal obsd.<br />
No EPR signal observed at<br />
any temp, because of green phase.<br />
EPR spectrum observed for<br />
Cu 2+ ions.<br />
Gd ions decoupled from Cu-O<br />
network of material.<br />
Two kinds of dipole-coupled<br />
Cu 2+ pairs existed and explained<br />
by EPR.<br />
Cu 2+ located at diff. sites<br />
in zeolites shows unique spectra.<br />
[439]<br />
[211]<br />
[286]<br />
[322]<br />
[381]<br />
[194]<br />
[361]<br />
[341]<br />
[306]<br />
[8]<br />
[494]<br />
[507]<br />
[79]
290 Bulletin of Magnetic Resonance<br />
S.No Host Lattice Site Spin-Hamiltonian Parameters<br />
gx gy Az Ax<br />
465. Zeolites and Oxides<br />
466. Zn(BDtc)2<br />
Cd(PmDtc)2<br />
Cd(MfDtc)2<br />
Zn(PmDtc)2<br />
467. Zn(II)-bis-(L-histidine)<br />
468. Zn-bis(N,N'-di-isopropyldi-<br />
Thiocarbamate)<br />
469.<br />
470.<br />
471.<br />
472.<br />
Zn(C4H4N2)SO4-3H2O<br />
Zn(Cu)(trien)I2<br />
[Cu(trien)NCS)B04<br />
Cd(Cu)(trien)I2<br />
Zinc Maleate-4H2O<br />
Powder<br />
Zn(I)-Malate Trihydrate<br />
Powder<br />
473. Zni_xMxCr2O4<br />
474. ZnO - B2O3;<br />
PbO - B2O3<br />
475. ZnSiF6-6H2O<br />
Powder<br />
476. ZnTiF6-6H2O<br />
477. ZnTiF6-6H2O<br />
I<br />
II<br />
2.087<br />
2.093<br />
2.095<br />
2.103<br />
2.085<br />
2.102<br />
2.108<br />
2.085<br />
2.103<br />
2.005<br />
2.086<br />
2.108<br />
2.278<br />
2.026<br />
2.030<br />
-<br />
2.025<br />
2.036<br />
2.026<br />
2.030<br />
2.032<br />
2.026<br />
2.028<br />
2.034<br />
-<br />
2.031<br />
2.070<br />
2.026<br />
2.030<br />
-<br />
2.025<br />
2.036<br />
2.026<br />
2.030<br />
2.032<br />
2.026<br />
2.028<br />
2.034<br />
-<br />
2.031<br />
2.070<br />
156/167G<br />
153G<br />
149G<br />
139/49G<br />
-<br />
157/168G<br />
142/152G<br />
127/136G<br />
157/168G<br />
153/164G<br />
136/146G<br />
157/168G<br />
123/132G<br />
13.9<br />
tnT<br />
2.080 2.020 2.015 32.9<br />
2.3875<br />
2.207<br />
2.201<br />
2.206<br />
2.043<br />
2.060<br />
2.4249<br />
2.423<br />
2.467<br />
2.460<br />
2.1924<br />
2.067<br />
2.374<br />
2.330<br />
2.0879<br />
2.088<br />
2.10<br />
2.114<br />
2.430 2.12<br />
2.0205<br />
2.047<br />
2.207<br />
2.210<br />
2.0879<br />
2.088<br />
2.10<br />
2.116<br />
2.12<br />
0.324<br />
GHz<br />
166.5G<br />
166G<br />
167G<br />
150G<br />
29.5<br />
-120<br />
120<br />
44G<br />
39G<br />
-<br />
9G<br />
35G<br />
45G<br />
32G<br />
22G<br />
45G<br />
35G<br />
25G<br />
-<br />
23G<br />
2.5<br />
mT<br />
44G<br />
39G<br />
-<br />
9G<br />
35G<br />
45G<br />
32G<br />
22G<br />
45G<br />
35G<br />
25G<br />
-<br />
23G<br />
2.5<br />
mT<br />
67.9 28.3<br />
0.181<br />
GHz<br />
25G<br />
46.8<br />
-11<br />
23<br />
0.104<br />
GHz<br />
15G<br />
39.7<br />
9.5<br />
23<br />
Comments Ref.<br />
g-factors and coordination<br />
sites discussed.<br />
Two types of Cu 2+ exists<br />
namely square-planar<br />
monomer and<br />
tetrahedral dimer.<br />
Solid-like and liquid-like<br />
spectra obsd. at LT.<br />
SHP reptd.<br />
[483]<br />
[185]<br />
[378]<br />
ZFR and exchange coupling [425]<br />
constant determined.<br />
Dynamic JTE observed at [307]<br />
334 ± IK.<br />
GS wavefunction constructed [260]<br />
and MO coeff. calculated.<br />
Ground state wave function [468]<br />
is of the form d2!2. Sub. for<br />
Zn 2+ sites.<br />
EPR spectrum shows [251]<br />
forbidden transitions<br />
with a normal intensity.<br />
JT distortions in tetra- [374]<br />
hedral coordination.<br />
Decrease in the interaction [490]<br />
between electron and nuclear<br />
spin moments with increasing<br />
CuO concentration.<br />
JT energy detected and pot- [258]<br />
ential barrier is 110 cm" 1 .<br />
EPR and SLR study of Cu 2+ [82]<br />
ions at different temp.<br />
EPR showed PT. PT temp. [83]<br />
decreased with increase in<br />
impurity concentration.
Vol. 16, No. 3/4 291<br />
S.No Host Lattice Site Spin-Hamiltonian Parameters Comments Ref.<br />
gz gx gy Az Ax Ay<br />
478. ZnTiF6-6H2O 2.472 2.097 2.097 107 SHP presented over the temp. [386]<br />
range 4-160K.<br />
479. ZnZ6F-6H2O Results reported in terms [257]<br />
of JT effect.<br />
480. 60ZrF4 - 5LaF3 - 2.500 2.065 2.065 80 25 25 Glasses. [49]<br />
20BaF2 - 15NaF
292 Bulletin of Magnetic Resonance<br />
Calendar of Forthcoming<br />
Conferences in Magnetic<br />
Resonance<br />
March 26-30, 1995<br />
36th Experimental Nuclear Magnetic Resonance<br />
Conference, Boston Marriott Copley Place, Boston,<br />
Massachusetts (USA)<br />
For information contact:<br />
ENC<br />
815 Don Gaspar Avenue<br />
Santa Fe, NM 87501<br />
Phone: 505-989-4573<br />
Fax: 505-989-1073<br />
May 16-19, 1995<br />
Nordic NMR Symposium "Experimental NMR<br />
in Liquids and Solids", Stockholm, Sweden<br />
Organized by the Swedish NMR Center, Mariaskolgatan<br />
83, S-104 62 Stockholm, Sweden. First<br />
circular will be sent in January. Abstract and registration<br />
deadline is March 15th.<br />
The information contact is either:<br />
Charlotta Damberg<br />
Email: csd@nmr.se<br />
Fax: +46-8-6697369<br />
Phone: +46-8-6167484<br />
or<br />
Lotta Johansson<br />
Email: lotta@nmr.se<br />
Fax: +46-8-6697369<br />
Phone: +46-8-6167483<br />
May 19-30, 1995<br />
International School of Biological Magnetic Resonance,<br />
2nd Course: "Dynamics and the Problem<br />
of Recognition in Biological Macromolecules" - Ettore<br />
Majorana Centre for Scientific Culture, Erice,<br />
Sicily, Italy<br />
An advanced graduate course devoted to the<br />
analysis of the dynamic behavior of biological<br />
macromolecules by nuclear magnetic resonance.<br />
10 days of lectures, workshops and tutorials with<br />
approximately 20 lecturers, attendance is limited to<br />
75 students. Sponsored by FEBS, NATO and the<br />
sponsors of the Ettore Majorana Centre. Registration<br />
including full room and board during the course<br />
is $1,000 US. Some partial scholarships are available.<br />
Preliminary Program and Lecturers: R. Boelens<br />
(Utrecht), C. M. Dobson (Oxford), S. W. Englander<br />
(U. Penn.), S. Forsen (Lund), C. W. Hilbers<br />
(Nijmegen), T. Holak (Munich), T. S. Jardetzky<br />
(Northwestern), O. Jardetzky (Stanford),<br />
M. Karplus (Harvard), R. Ladenstein (Stockholm),<br />
J.-F. Lefevre (Strasbourg), M. Levitt (Stanford),<br />
J. L. Markley (Wisconsin), S. J. Opella (U. Penn.),<br />
H. Oschkinat (Heidelberg), R. Rigler (Stockholm),<br />
G. C. K. Roberts (Leicester), R. G. Shulman (Yale),<br />
B. D. Sykes (Alberta) and G. Wagner (Harvard)<br />
will lecture on: Basic NMR Methods for Structure<br />
and Dynamics Studies, Simulated and Observed<br />
Molecular Dynamics, Dynamics of Polysaccharides,<br />
Protein-Small Molecule Interactions, Protein Motion<br />
and Folding, Nucleic Acids and Protein-Nucleic<br />
Acid Interactions , Protein-Protein Recognition and<br />
Protein-Lipid Interactions.<br />
For information contact:<br />
Ms. Robin Holbrook, Course Administrative<br />
Assistant<br />
Email: holbrook@camis.stanford.edu<br />
or the Directors<br />
Dr. Oleg Jardetzky<br />
Email: jardetzky@camis.stanford.edu<br />
Fax: 415-723-2253<br />
Dr. Jean-Francois Lefevre<br />
Email: lefevre@bali.u-strasbg.fr<br />
Fax: +33 88 65 53 43<br />
May 27-June 2, 1995<br />
6th Chianti Workshop on Magnetic Resonance<br />
"Nuclear and Electron Relaxation", San Miniato<br />
(Pisa), Italy
Vol. 16, No.3/4 293<br />
The present Workshop, in the spirit of the series<br />
of the Chianti Workshops, aims at bringing together<br />
scientists involved in theoretical and experimental<br />
aspects of nuclear and electron spin relaxation to<br />
study the structure and dynamics of molecules.<br />
The main topics to be discussed by NMR and<br />
EPR scientists will deal with: structure determination<br />
of biomolecules, spin polarization phenomena<br />
and processes, relaxation in paramagnetic systems,<br />
quasi-ordered phases, spin imaging, new methodologies.<br />
The program will consists of invited lectures<br />
and poster presentations.<br />
Participants intending to present posters (1 m.<br />
wide x 1.5 m. high) on work related to the topics<br />
of the Workshop are asked to submit an abstract<br />
(max. 1 page A4 format typed single-spaced) of the<br />
proposed communication not later than April 15,<br />
1995. Since the total number of participants is limited,<br />
acceptance will be on a "first come first served"<br />
basis. There is a registration fee of 250,000 Italian<br />
Lira for active participants and 120,000 Italian Lira<br />
for accompanying persons. The cost of the accomodation,<br />
based on sharing a twin-bedded room, plus<br />
all meals (including Chianti wine!) will be 700,000<br />
Italian Lira per person.<br />
For information contact:<br />
Prof. Riccardo Basosi<br />
Dept. of Chemistry<br />
University of Siena<br />
Pian dei Mantellini, 44<br />
53100 Siena, Italy<br />
Tel: 39/577-298040<br />
Fax: 39/577-280405<br />
or<br />
Prof. Claudio Luchinat<br />
Dept. of Chemistry<br />
University of Florence<br />
Via G. Capponi, 7<br />
50121 Florence, Italy<br />
Tel: 39/55-2757563<br />
Fax: 39/55-2757555<br />
or<br />
Prof. Carlo A. Veracini<br />
Dept. of Chemistry<br />
University of Pisa<br />
Via Risorgimento, 35<br />
56100 Pisa, Italy<br />
Tel: 39/50-918266<br />
or the Program Chairman<br />
Prof. Klaus Mobius<br />
Dept. of Physics<br />
Free University of Berlin<br />
Arnimalle 14<br />
D-14195 Berlin, Germany<br />
Tel: 49/30-8382770<br />
Fax: 49/30-8386046<br />
June 18-24, 1995<br />
Ampere Advanced Institute "High Resolution<br />
and Spatially Resolved NMR in Solids", Villa<br />
Monastero, Varenna sul Lago di Como, Italy<br />
Program: Nuclear spin interactions in solids;<br />
Multiple pulse NMR experiments; Multiple quatum<br />
spectroscopy; Spin dynamics; NMR imaging<br />
of solids and materials; Xenon NMR spectroscopy;<br />
New recent developments. Director of the Course:<br />
Prof. Bruno Maraviglia, La Sapienza University,<br />
Rome, Italy.<br />
Participation Fee: 1,300,000 Italian Lira for attendance,<br />
full board and lodging. Closing date for<br />
application: March 10, 1995.<br />
For information contact:<br />
Mrs. Donatella Pifferetti<br />
Centro di Cultura<br />
Villa Monastero Varenna<br />
Piazza Venini 1<br />
22050 Varenna, Italy Phone: +39-341-831261<br />
Fax: +39-341-831281<br />
June 25-28, 1995<br />
Workshop on "Structure Determination Using<br />
NMR," Pittsburgh, PA, USA<br />
Pittsburgh Supercomputing Center (PSC) is offering<br />
biomedical researchers a workshop on " Structure<br />
Determination Using NMR." The objective is<br />
to introduce participants to the different techniques
294<br />
for the elucidation of solution structures of biological<br />
macromolecules from nuclear magnetic resonance<br />
data.<br />
The workshop will consist of lectures and handson<br />
sessions. The programs AMBER, Mardigras and<br />
MidasPlus will be discussed. Hands-on sessions will<br />
be emphasized. Participants will be able to work on<br />
the examples provided or on their own experimental<br />
data. No prior supercomputing experience is necessary.<br />
Workshop Leaders are: Dr, David Case, The<br />
Scripps Research Institute; Dr. Thomas James,<br />
University of California, San Francisco; Dr. Julie<br />
Newdoll, Computer Graphics Laboratory, University<br />
of California, San Francisco; and Dr. Uli<br />
Schmitz, University of California, San Francisco.<br />
This workship is funded by a grant from the<br />
Biomedical Research Technology Program, National<br />
Center for Research Resources, National Institutes<br />
of Health. Travel, meals and hotel accommodations<br />
for researchers affiliated with U.S. academic institutions<br />
are supported by this grant. Enrollment is<br />
limited to 20.<br />
Deadline for applications is April 28, 1995.<br />
For information contact:<br />
Nancy Blankenstein<br />
Pittsburgh Supercomputing Center<br />
230C Mellon Institute<br />
4400 Fifth Avenue<br />
Pittsburgh, PA 15213<br />
Email: blankens@psc.edu<br />
Fax: 412-268-8200<br />
July 16-21, 1995<br />
International Society of Magnetic Resonance<br />
Conference, Sydney, Australia<br />
The venue will be the University of Sydney, situated<br />
within 5 kilometers of the center of the city of<br />
Sydney. Accommodations will be available in colleges<br />
at the University of Sydney or delegates may<br />
Bulletin of Magnetic Resonance<br />
choose from the extensive range of budget-priced to<br />
luxury hotels which Sydney offers. Presentations<br />
will be via plenary lectures, invited lectures, colloquia<br />
and poster sessions. There will be specially<br />
invited lectures from some of the pioneers of NMR<br />
to commemorate the 50th anniversary of its discovery.<br />
A comprehensive trade display will exhibit the<br />
latest advances in magnetic resonance hardware and<br />
software.<br />
The preliminary program includes sessions on:<br />
-Advances in imaging and microscopy<br />
-Inorganic and multinuclear NMR<br />
-Chemical applications of NMR<br />
-EPR and applications<br />
-Proteins and nucleic acids: structure and<br />
dynamics<br />
-Developments in multidimensional spectroscopy<br />
-In vivo spectroscopy and clinical applications<br />
-Solid state NMR<br />
-Membranes and liquid crystals<br />
-New technology and experimental methods<br />
-Advances in theory and computational methods<br />
The <strong>ISMAR</strong>-95 Committee:<br />
Leslie D. Field (Chairman), David Doddrell<br />
(Convenor), William Bubb (Secretary), Frances<br />
Separovic (Treasurer), Peter Barron, Michael Batley,<br />
Graham Bowden, Paul Callaghan, Bruce Cornell,<br />
John Hanna, Garry King, Glenn King, Philip<br />
Kuchel, Bridget Mabbutt, George Mendz, Barbara<br />
Messerle, Carolyn Mountford, Jim Pope, and Graham<br />
Town.<br />
For further details contact:<br />
Dr. Les D. Field<br />
Chairman <strong>ISMAR</strong>-95<br />
Department of Organic Chemistry<br />
University of Sydney<br />
Sydney NSW 2006 Australia<br />
Phone: +61-2-692-2060<br />
Fax: +61-2-692-3329<br />
email: <strong>ISMAR</strong>-95@biochem.su.oz.au<br />
July 23-28, 1995<br />
/// International Symposium on Nuclear Quadrupole<br />
Interactions, Brown University, Providence,<br />
Rhode Island, USA
Vol. 16, No. 3/4<br />
The Symposium, which is sponsored by the International<br />
Committee on Nuclear Quadrupole Interactions,<br />
will be devoted to all aspects of nuclear<br />
quadrupole interactions in solids, liquids, and<br />
gases covering both experiments and theory. Contributions<br />
are welcome in all areas involving nuclear<br />
quadrupole interactions, including (but not limited<br />
to) the following: nuclear quadrupole resonance<br />
spectroscopy, all forms of NMR and ESR spectroscopy,<br />
Mossbauer studies, NQR imaging, perturbed<br />
gamma ray angular correlation studies, microwave<br />
spectroscopy, calculations of electric field<br />
gradients, nuclear studies yielding NQI parameters,<br />
etc. Studies involving NQI in superconductors, metals,<br />
insulators, organic and inorganic compounds,<br />
polymers, biological materials, etc. are welcome.<br />
Reports on new developments in instrumentation<br />
for techniques that measure NQI will also be appreciated.<br />
The program will consist of Plenary Lectures<br />
and contributed papers for oral or poster presentations.<br />
The Proceedings of the Symposium will be<br />
published in an international journal.<br />
For further details contact:<br />
Professor Philip J. Bray<br />
Department of Physics<br />
Box 1843<br />
Brown University<br />
Providence, Rhode Island 02912 USA<br />
September 17-20, 1995<br />
International Conference on Molecular Structural<br />
Biology, Organized by the Austrian Chemical<br />
Society, Vienna, Austria<br />
Posters are invited on any of the conference topics.<br />
Outstanding posters will be selected for 20 minutes<br />
oral presentations. Abstract deadline: May 31,<br />
1995.<br />
Topics: The impact of molecular biology on<br />
structural biology<br />
Biomolecular structure determination<br />
X-ray diffraction<br />
NMR spectroscopy<br />
Dynamics and function of biomolecules<br />
Computation methods<br />
Protein engineering and desing<br />
For information contact:<br />
A. Kungl<br />
Gesellschaft Oesterreichischer Chemiker<br />
AG Biophysikalische Chemie<br />
Nibelungengasse 11<br />
A-1010 Wien, Austria<br />
Tel: 43/1-587249<br />
Fax: 43/1-587966<br />
e-mail: msb95@helix.mdy.univie.ac.at<br />
or<br />
Prof. Claudio Luchinat<br />
Dept. of Chemistry<br />
University of Florence<br />
Via G. Capponi, 7<br />
50121 Florence, Italy<br />
Tel: 39/55-2757563<br />
Fax: 39/55-2757555<br />
or<br />
Prof. Carlo A. Veracini<br />
Dept. of Chemistry<br />
University of Pisa<br />
Via Risorgimento, 35<br />
56100 Pisa, Italy<br />
Tel: 39/50-918266<br />
or the Program Chairman<br />
Prof. Klaus Mobius<br />
Dept. of Physics<br />
Free University of Berlin<br />
Arnimalle 14<br />
D-14195 Berlin, Germany<br />
Tel: 49/30-8382770<br />
Fax: 49/30-8386046<br />
295<br />
The editor would be pleased to receive<br />
notices of future meetings in the field of<br />
magnetic resonance so that they could be<br />
recorded in this column.
296<br />
Bulletin of Magnetic Resonance<br />
Recent Magnetic Resonance Books D.C., 664 p. (Advances in Chemistry Series).<br />
1 Progress in Nuclear Magnetic Resonance Spectroscopy<br />
Volume 26 No. 2 (1994). Contents:<br />
Copper-zinc superoxide dismutase: a paramagnetic<br />
protein that provides a unique frame for the NMR<br />
investigation. Variable angle sample spinning NMR<br />
in liquid crystals.<br />
1 Progress in Nuclear Magnetic Resonance Spectroscopy<br />
Volume 26 No. 3 (1994). Contents: Multinuclear<br />
and multidimensional NMR methodology<br />
for studying individual water molecules bound to<br />
peptides and proteins in solution: principles and applications.<br />
17 O NMR studies of hemoproteins and<br />
synthetic model compounds in the solution and solid<br />
states.<br />
1 Progress in Nuclear Magnetic, Resonance Spectroscopy<br />
Volume 26 No. 4 (1994). Contents: Fluorine<br />
NMR of proteins. Isotope labeling in solution<br />
protein assignment and structural analysis.<br />
1 Annual Reports on NMR Spectroscopy Volume<br />
28(1994). Contents: Application of NMR spectroscopy<br />
to the science and technology of glasses and<br />
ceramics. High-resolution solid-state NMR studies<br />
on ceramics. NMR studies of zeolites. NMR studies<br />
of higher-order structures of solid polymers. NMR<br />
studies of organic thin films.<br />
1 Handbook of Electron Spin Resonance (1994).<br />
Edited by Charles P. Poole, Jr. and Horacio A.<br />
Farach. 550 pages, including 205 tables and figures,<br />
ISBN 1-56396-044-3, cloth, List Price: $115.00.<br />
Advances in Magnetic and Optical Resonance<br />
Volume 18 (1994). Contents: Polarization transfer<br />
and spin diffusion in solid-state NMR. Fermions on<br />
a Frenkel chain: Nonlinear optical response of linear<br />
aggregates.<br />
X NMR Techniques in Catalysis (1994). Edited<br />
by Alexis T. Bell and Alexander Pines. Marcel<br />
Dekker, New York, 432 p.<br />
Magnetic Resonance of Carbonaceous Solids<br />
(1993). Edited by Robert E. Botto and Yuzo<br />
Sanads. American Chemical Society, Washington,<br />
J New additions to the list.<br />
Chemical Society Reviews Volume 22 No. 5<br />
(1993). Contents: Bruker Lecture: The nuclear Zeeman<br />
interaction in electron resonance. The EPR<br />
spectra of organic radical ions. On the possibility of<br />
an insulator-metal transition in alkali metal-doped<br />
zeolites. Some aspects of the electron paramagnetic<br />
resonance spectroscopy of a d-transition metal compounds.<br />
Why can transient free radicals be observed<br />
in solution using ESR techniques? Progressive saturation<br />
and saturation transfer ESR for measuring<br />
exchange processes of spin-labelled lipids and<br />
proteins in membranes. Polarized positive muons<br />
probing free radicals: A variant of magnetic resonance.<br />
The chemistry of cyclopropylmethyl and<br />
related radicals.<br />
2D NMR: Density Matrix and Product Operator<br />
Treatment by Gheorghe D. Mateescu and Adrian<br />
Valeriu, Case Western Reserve University (1993).<br />
ISBN 0-13-013368-x, 200 pp.<br />
Basic One- and Two-Dimensional NMR Spectroscopy,<br />
Second, Enlarged Edition by Horst<br />
Friebolin, Organic Chemical Institute, Heidelberg,<br />
Germany (1993). VCH Publishers, Inc., New York.<br />
ISBN 1-56081-796-8.<br />
Structure Elucidation by NMR in Organic<br />
Chemistry - A Practical Guide by Eberhard Breitmaier<br />
(1993). John Wiley & Sons, New York, NY.<br />
Hardback: ISBN 0-471-93745-2, $63.95; Paperback:<br />
ISBN 0-471-93381-3, $35.00.<br />
Progress in Biophysics and Molecular Biology<br />
Volume 59 No. 3 (1993). Contents: Hydration and<br />
heat stability effects on protein unfolding. Derivation<br />
of locally accurate spatical protein structure<br />
from NMR data.<br />
Progress in Nuclear Magnetic Resonance Spectroscopy<br />
Volume 25 No. 1-3(1993). Contents: NMR<br />
and fractal properties of polymeric liquids and gels.<br />
Progress in Nuclear Magnetic Resonance Spectroscopy<br />
Volume 25 No. 4(1993). Contents: Sulfur-<br />
33 NMR. Photo-CIDNP of biopolymers.<br />
Progress in Nuclear Magnetic Resonance Spectroscopy<br />
Volume 25 No. 5 (1993). Contents: NMR
Vol. 16, No.3/4 297<br />
studies of drug-DNA interactions. NMR studies of<br />
dynamics in nucleic acids.<br />
Progress in Nuclear Magnetic Resonance Spectroscopy<br />
Volume 25 No. 6 (1993). Contents:<br />
Density dependence of rotational and translational<br />
molecular dynamics in liquids studied by high pressure<br />
NMR.<br />
Annual Reports on NMR Spectroscopy Volume<br />
26 (1993). Contents: Applications of NMR to food<br />
science. Structural studies of peptides and polypeptides<br />
in the solid state by nitrogen-15 NMR. Application<br />
of high-resolution NMR spectroscopy to polymer<br />
chemistry. The application of cation NMR to<br />
living systems: Multinuclear NMR of azo dyestuffs.<br />
Biological Magnetic Resonance: NMR of Paramagnetic<br />
Molecules Volume 12 (1993). Contents:<br />
NMR methodology for paramagnetic proteins. Nuclear<br />
relaxation in paramagnetic metalloproteins.<br />
Paramagnetic relaxation of water protons: effects<br />
of nonbonded interactions, electron spin relaxation,<br />
and rotational immobilization. Proton NMR spectroscopy<br />
of model hemes. Proton NMR studies of<br />
selected paramagnetic heme proteins. Heteronuclear<br />
magnetic resonance: applications to biological<br />
and related paramagnetic molecules. NMR of polymetallic<br />
systems in proteins.<br />
Fundamentals of Nuclear Magnetic Resonance<br />
by J. W. Hennel and J. Klinowski (1993). Contents:<br />
Elements of quantum mechanics, magnetic properties<br />
of the nucleus, nuclear paramagnetism, motion<br />
of pagnetization, continuous wave NMR, pulsed<br />
NMR, NMR liquids, the dipolar interaction, and nuclear<br />
magnetic relaxation. ISBN 0-582-06703-0.<br />
Biological Magnetic Resonance: Carbohydrates<br />
and Nucleic Acids (1992). Contents: Highresolution<br />
X H-NMR spectroscopy of oligosaccharidealditols<br />
released from muncin-type O-glycoproteins.<br />
NMR studies of nucleic acids and their complexes.<br />
Progress in Nuclear Magnetic Resonance Spectroscopy<br />
Volume 24 No. 6 (1992). Contents: Solid<br />
state NMR studies of vanadia based catalysts. NMR<br />
studies of superionic conductors.<br />
Biological Magnetic Resonance: In Vivo Spec-<br />
troscopy Volume 11 (1992). Contents: Localization<br />
in clinical NMR spectroscopy. Off-resonance frame<br />
spin-lattice relaxation: Theory, and in vivo MRS<br />
and MRI applications. NMR methods in studies<br />
of brain ischemia. Shift-reagent-aided 23 Na NMR<br />
spectroscopy in cellular, tissue, and whole-organ<br />
systems. In vivo 19 F NMR. In vivo 2 H NMR studies<br />
of cellular metabolism. Some applications of ESR to<br />
in vivo animal studies and EPR imaging.<br />
Magnetic Resonance Microscopy: Methods and<br />
application in materials science, agriculture and<br />
biomedicine (1992). Edited by Bernhard Blumich<br />
and Winfried Kuhn. VCH, New York, 604 p.<br />
Progress in Nuclear Magnetic Resonance Spectroscopy<br />
Volume 24 No. 4 (1992). Contents:<br />
Multiple-quantum NMR methods.<br />
Advances in Magnetic and Optical Resonance<br />
Volume 17 (1992). Contents: Nonlinear incoherent<br />
spectroscopy. NOESY. Zero-field spin dynamics<br />
and relaxation.<br />
Carbohydrate and Nucleic Acid Structure by<br />
Magnetic Resonance Spectroscopy, Biological Magnetic<br />
Resonance Volume 10 (1992). Edited by<br />
Lawrence J. Berliner and Jacques Reuben, Plenum<br />
Publishing Corp., New York.<br />
In-Vivo Spectroscopy, Biological Magnetic Resonance<br />
Volume 11 (1992). Edited by Lawrence J.<br />
Berliner and Jacques Reuben, Plenum Publishing<br />
Corp., New York.<br />
Progress in Nuclear Magnetic Resonance Spectroscopy<br />
Volume 24 No. 5 (1992). Contents: Relaxation<br />
in the rotating frame in liquids. Sodium magnetic<br />
resonance imaging and chemical shift imaging.<br />
Quadrupolar effects transferred to spin-1/2 magicangle<br />
spinning spectra of solids.
298 Bulletin of Magnetic Resonance<br />
Instructions for Authors<br />
Because of the ever increasing difficulty of keeping<br />
up with the literature there is a growing need for<br />
critical, balanced reviews covering well-defined areas<br />
of magnetic resonance. To be useful these must<br />
be written at a level that can be comprehended by<br />
workers in related fields, although it is not the intention<br />
thereby to restrict the depth of the review.<br />
In order to reduce the amount of time authors must<br />
spend in writing we will encourage short, concise<br />
reviews, the main object of which is to inform nonexperts<br />
about recent developments in interesting aspects<br />
of magnetic resonance.<br />
The editor and members of the editorial board<br />
invite reviews from authorities on subjects of current<br />
interest. Unsolicited reviews may also be accepted,<br />
but prospective authors are requested to<br />
contact the editor prior to writing in order to avoid<br />
duplication of effort. Reviews will be subject to critical<br />
scrutiny by experts in the field and must be<br />
submitted in English. Manuscripts should be sent<br />
to the editor, Dr. David G. Gorenstein, Department<br />
of Human Biological Chemistry & Genetics,<br />
The University of Texas Medical Branch, Galveston,<br />
Texas 77555 USA. (409) 747 6800. Fax No. (409)<br />
747 6850.<br />
MANUSCRIPTS must be submitted in triplicate<br />
(one copy should be the original), on approximately<br />
22x28 cm paper, type-written on one side<br />
of the paper, and double spaced throughout. If the<br />
manuscript cannot be submitted on computer tapes,<br />
floppy disks, or electronically (see below), please<br />
type with a carbon ribbon using either courier 10<br />
or 12, gothic 12, or prestige elite type face with 10<br />
or 12 pitch. All pages are to be numbered consecutively,<br />
including references, tables, and captions to<br />
figures, which are to be placed at the end of the<br />
review.<br />
ARRANGEMENT: Considerable thought<br />
should be given to a logical ordering of the subject<br />
matter and the review should be divided into<br />
appropriate major sections, and subsections, using<br />
Roman numerals, capital letters, and Arabic numerals<br />
respectively. A table of contents should be included.<br />
TABLES: These are to be numbered consecutively<br />
in the text with Arabic numerals. Their place<br />
of insertion should be mentioned in the text, but<br />
they are to be placed in order at the end of the<br />
paper, each typed on a separate sheet. Each table<br />
should be supplied with a title. Footnotes to tables<br />
should be placed consecutively, using lower case letters<br />
as superscripts.<br />
FIGURES are also to be numbered consecutively<br />
using Arabic numerals and the place of insertion<br />
mentioned in the manuscript. The figures are<br />
to be grouped in order at the end of the text and<br />
should be clearly marked along the edge or on the •<br />
back with figure number and authors' names. Each<br />
figure should bear a caption, and these should be<br />
arranged in order and placed at the end of the text.<br />
Figures should be carefully prepared in black ink<br />
to draftsman's standards with proper care to lettering<br />
(typewritten or freehand lettering is not acceptable).<br />
Graphs should include numerical scales<br />
and units on both axes, and all figures and lettering<br />
should be large enough to be legible after reduction<br />
by 50-60%. Figures should be generally placed on<br />
sheets of the same size as the typescript and larger<br />
originals may be handled by supplying high-contrast<br />
photographic reductions. One set of original figures<br />
must be supplied; reproduction cannot be made<br />
from photocopies. Two additional copies of each figure<br />
are required. Complex molecular formula should<br />
be supplied as ink drawings.<br />
REFERENCES to the literature should be<br />
cited in order of appearance in the text by numbers<br />
on the line, in parentheses. The reference list is to be<br />
placed on separate sheets in numerical order at the<br />
end of the paper. References to journals should follow<br />
the order: author's (or authors') initials, name,<br />
name of journal, volume number, page, and year of<br />
publication. The abbreviation of the journal follows<br />
that used in the Chemical Abstracts Service Source<br />
Index. References to books should include in order:<br />
author's (or authors') initials, name, title of book,<br />
volume, edition if other than the first, publisher,<br />
address, date of publication, and pages.<br />
FOOTNOTES should be used sparingly and<br />
only in those cases in which the insertion of the<br />
information in the text would break the train of<br />
thought. Their position in the text should be<br />
marked with a superscript Arabic numeral and the<br />
footnotes should be typed at the bottom of the relevant<br />
page in the text, separated from the latter by<br />
a line.<br />
SYMBOLS AND ABBREVIATIONS:
Vol. 16, No. 3/4 299<br />
Mathematical symbols should be typewritten wherever<br />
possible. Greek letters should be identified in<br />
pencil in the margin. In reviews containing a number<br />
of mathematical equations and symbols, the author<br />
is urged to supply a list of these on a separate<br />
sheet for the assistance of the printer; this will not<br />
appear in print. Standard abbreviations will follow<br />
the American Chemical Society's HANDBOOK<br />
FOR AUTHORS names and symbols for units.<br />
PERMISSIONS: It is the responsibility of the<br />
author to obtain all permissions concerned with the<br />
reproduction of figures, tables, etc, from copyrighted<br />
publications. Written permission must be obtained<br />
from the publisher (not the author or editor) of the<br />
journal or book. The publication from which the<br />
figure or table is taken must be referred to in the<br />
reference list and due acknowledgement made, e.g.<br />
reprinted by permission from ref. (00).<br />
REPRINTS: Thirty reprints of a review will<br />
be supplied free to its senior author and additional<br />
reprints may be purchased in lots of 100.<br />
INSTRUCTIONS FOR SUBMITTING<br />
MANUSCRIPTS ON FLOPPY DISKS<br />
OR ELECTRONICALLY: If you have used a<br />
word processor to type your manuscript, please forward<br />
your manuscript after review and revision, in<br />
a computer readable form. Floppy disks or tapes<br />
readable on IBM, DEC, SUN, Silicon Graphics, or<br />
Macintosh computers are acceptable. For direct<br />
submission over the phone lines use 300 - 9600 baud<br />
ASCII transmission. Submission via e-mail (address<br />
david@nmr.utmb.edu) is also recommended. Additional<br />
details will be provided for the appropriate<br />
hand-shake requirements. Please supply us with the<br />
code for interpreting superscripts, greeks, etc. on<br />
your word processor.<br />
ADDENDUM to Detection of Two-Quantum<br />
Nuclear Coherence by Nuclear-Quadrupole-Induced<br />
Electric Polarization by David C. Newitt and Erwin<br />
L. Hahn. The Editors of J. Magn. Reson.<br />
have given permission to largely republish this article<br />
which appeared in J. Magn. Reson., A 106,<br />
140-143 (1994).
INTERNATIONAL SOCIETY OF MAGNETIC RESONANCE<br />
(<strong>ISMAR</strong>)<br />
MEMBERSHIP APPLICATION AND CALL FOR DUES<br />
Name and Address (Telephone & Fax numbers, e-mail) of <strong>ISMAR</strong> Member<br />
If this is a new membership application, please check box<br />
If you wish to be registered as a member of the Division of Biology and Medicine,<br />
in addition to <strong>ISMAR</strong> itself at no extra charge, please check box.<br />
Regular Member<br />
Bona Fide Student<br />
MEMBERSHIP DUES<br />
$20.00<br />
$10.00<br />
1993<br />
1994<br />
1995<br />
1996<br />
(Yearly)<br />
1997 $<br />
SUBSCRIPTION TO "BULLETIN OF MAGNETIC RESONANCE" (Yearly)<br />
<strong>ISMAR</strong> Members $25.00<br />
Non-Members $80.00<br />
Libraries $80.00<br />
Send this completed form with your<br />
check in US$ made payable to<br />
International Society of Magnetic Resonance<br />
Prof. Regitze R. Void, Treasurer<br />
Chemistry & Biochemistry<br />
University of California, San Diego<br />
9500 Gilman Drive<br />
La Jolla, CA 92093-0359 USA<br />
(619) 534-0200; FAX (619) 534-6174<br />
e-mail: rrvold@ucsd.edu<br />
Volume 15 (1993) $_<br />
Volume 16 (1994) $_<br />
Volume 17 (1995) $_<br />
Volume 18 (1996) $_<br />
$<br />
$<br />
$<br />
$<br />
TOTAL $_<br />
(or) Provide your<br />
Mastercard or Visa Account<br />
Account # _<br />
Expires on.<br />
Signature _<br />
•<br />
•<br />
Mastercard Visa<br />
(month/year)<br />
(Do not wire funds. They will no longer be accepted)