Proceedings World Bioenergy 2010
Proceedings World Bioenergy 2010
Proceedings World Bioenergy 2010

Create successful ePaper yourself
Turn your PDF publications into a flip-book with our unique Google optimized e-Paper software.
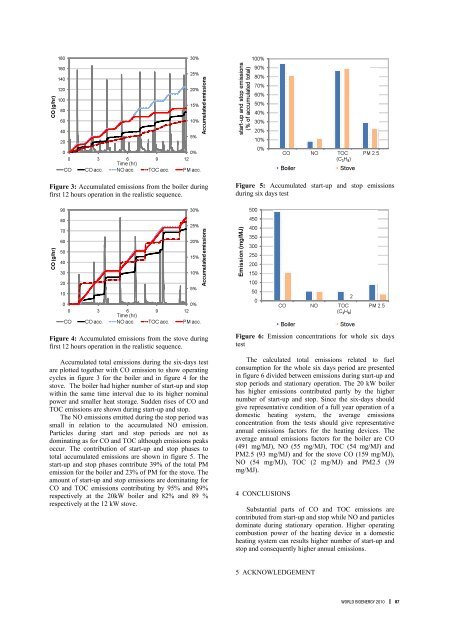
Figure 3: Accumulated emissions from the boiler during<br />
first 12 hours operation in the realistic sequence.<br />
Figure 4: Accumulated emissions from the stove during<br />
first 12 hours operation in the realistic sequence.<br />
Accumulated total emissions during the six-days test<br />
are plotted together with CO emission to show operating<br />
cycles in figure 3 for the boiler and in figure 4 for the<br />
stove. The boiler had higher number of start-up and stop<br />
within the same time interval due to its higher nominal<br />
power and smaller heat storage. Sudden rises of CO and<br />
TOC emissions are shown during start-up and stop.<br />
The NO emissions emitted during the stop period was<br />
small in relation to the accumulated NO emission.<br />
Particles during start and stop periods are not as<br />
dominating as for CO and TOC although emissions peaks<br />
occur. The contribution of start-up and stop phases to<br />
total accumulated emissions are shown in figure 5. The<br />
start-up and stop phases contribute 39% of the total PM<br />
emission for the boiler and 23% of PM for the stove. The<br />
amount of start-up and stop emissions are dominating for<br />
CO and TOC emissions contributing by 95% and 89%<br />
respectively at the 20kW boiler and 82% and 89 %<br />
respectively at the 12 kW stove.<br />
Figure 5: Accumulated start-up and stop emissions<br />
during six days test<br />
Figure 6: Emission concentrations for whole six days<br />
test<br />
The calculated total emissions related to fuel<br />
consumption for the whole six days period are presented<br />
in figure 6 divided between emissions during start-up and<br />
stop periods and stationary operation. The 20 kW boiler<br />
has higher emissions contributed partly by the higher<br />
number of start-up and stop. Since the six-days should<br />
give representative condition of a full year operation of a<br />
domestic heating system, the average emissions<br />
concentration from the tests should give representative<br />
annual emissions factors for the heating devices. The<br />
average annual emissions factors for the boiler are CO<br />
(491 mg/MJ), NO (55 mg/MJ), TOC (54 mg/MJ) and<br />
PM2.5 (93 mg/MJ) and for the stove CO (159 mg/MJ),<br />
NO (54 mg/MJ), TOC (2 mg/MJ) and PM2.5 (39<br />
mg/MJ).<br />
4 CONCLUSIONS<br />
Substantial parts of CO and TOC emissions are<br />
contributed from start-up and stop while NO and particles<br />
dominate during stationary operation. Higher operating<br />
combustion power of the heating device in a domestic<br />
heating system can results higher number of start-up and<br />
stop and consequently higher annual emissions.<br />
5 ACKNOWLEDGEMENT<br />
world bioenergy <strong>2010</strong><br />
87