Proceedings World Bioenergy 2010
Proceedings World Bioenergy 2010
Proceedings World Bioenergy 2010

Create successful ePaper yourself
Turn your PDF publications into a flip-book with our unique Google optimized e-Paper software.
(Gagnet and Unbyn) [4]. The second samples were taken<br />
in May and the first days of June 2003, before the trees<br />
started to grow, and the end of August and September<br />
after the growing season had finished. In 2003, birches<br />
were only sampled in August and September when the<br />
leaves were developed but had not started to fall. In 2004,<br />
biomass sampling from the thinned plots was done in<br />
April.<br />
2.3 Operations in the field<br />
The sample tree was cut down at a stump height of<br />
about 2 cm. DBH was marked and measured by cross<br />
callipering, starting towards the north side of the tree. All<br />
trees were measured in the same direction. The north side<br />
of the tree was also marked to aid selection of sample<br />
branches after felling. The thickness of the bark on Pinus<br />
sylvestris and Picea abies was measured using a bark<br />
gauge at the height of 1.35 m. The total length of the tree<br />
and the length of living crown were measured with a<br />
tape-measure. The living crown was defined as the first<br />
living branch, if no more than two whorls of dead<br />
branches separated the first living branch and the next<br />
living branches.<br />
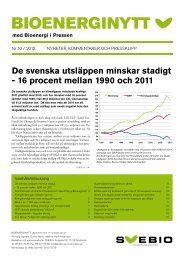
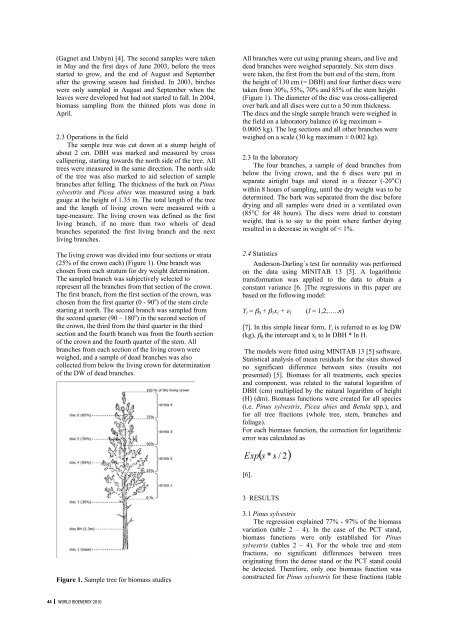
The living crown was divided into four sections or strata<br />
(25% of the crown each) (Figure 1). One branch was<br />
chosen from each stratum for dry weight determination.<br />
The sampled branch was subjectively selected to<br />
represent all the branches from that section of the crown.<br />
The first branch, from the first section of the crown, was<br />
chosen from the first quarter (0 - 90 o ) of the stem circle<br />
starting at north. The second branch was sampled from<br />
the second quarter (90 – 180 o ) in the second section of<br />
the crown, the third from the third quarter in the third<br />
section and the fourth branch was from the fourth section<br />
of the crown and the fourth quarter of the stem. All<br />
branches from each section of the living crown were<br />
weighed, and a sample of dead branches was also<br />
collected from below the living crown for determination<br />
of the DW of dead branches.<br />
Figure 1. Sample tree for biomass studies<br />
44 world bioenergy <strong>2010</strong><br />
All branches were cut using pruning shears, and live and<br />
dead branches were weighed separately. Six stem discs<br />
were taken, the first from the butt end of the stem, from<br />
the height of 130 cm (= DBH) and four further discs were<br />
taken from 30%, 55%, 70% and 85% of the stem height<br />
(Figure 1). The diameter of the disc was cross-callipered<br />
over bark and all discs were cut to a 50 mm thickness.<br />
The discs and the single sample branch were weighed in<br />
the field on a laboratory balance (6 kg maximum ±<br />
0.0005 kg). The log sections and all other branches were<br />
weighed on a scale (30 kg maximum ± 0.002 kg).<br />
2.3 In the laboratory<br />
The four branches, a sample of dead branches from<br />
below the living crown, and the 6 discs were put in<br />
separate airtight bags and stored in a freezer (-20°C)<br />
within 8 hours of sampling, until the dry weight was to be<br />
determined. The bark was separated from the disc before<br />
drying and all samples were dried in a ventilated oven<br />
(85°C for 48 hours). The discs were dried to constant<br />
weight, that is to say to the point where further drying<br />
resulted in a decrease in weight of < 1%.<br />
2.4 Statistics<br />
Anderson-Darling´s test for normality was performed<br />
on the data using MINITAB 13 [5]. A logarithmic<br />
transformation was applied to the data to obtain a<br />
constant variance [6. ]The regressions in this paper are<br />
based on the following model:<br />
Yi = β 0 + β 1x i + ε I (I = 1,2,…..n)<br />
[7]. In this simple linear form, Y i is referred to as log DW<br />
(kg), β 0 the intercept and x i to ln DBH * ln H.<br />
The models were fitted using MINITAB 13 [5] software.<br />
Statistical analysis of mean residuals for the sites showed<br />
no significant difference between sites (results not<br />
presented) [5]. Biomass for all treatments, each species<br />
and component, was related to the natural logarithm of<br />
DBH (cm) multiplied by the natural logarithm of height<br />
(H) (dm). Biomass functions were created for all species<br />
(i.e. Pinus sylvestris, Picea abies and Betula spp.), and<br />
for all tree fractions (whole tree, stem, branches and<br />
foliage).<br />
For each biomass function, the correction for logarithmic<br />
error was calculated as<br />
[6].<br />
3 RESULTS<br />
3.1 Pinus sylvestris<br />
The regression explained 77% - 97% of the biomass<br />
variation (table 2 – 4). In the case of the PCT stand,<br />
biomass functions were only established for Pinus<br />
sylvestris (tables 2 – 4). For the whole tree and stem<br />
fractions, no significant differences between trees<br />
originating from the dense stand or the PCT stand could<br />
be detected. Therefore, only one biomass function was<br />
constructed for Pinus sylvestris for these fractions (table