ecology of phasmids - KLUEDO - Universität Kaiserslautern
ecology of phasmids - KLUEDO - Universität Kaiserslautern
ecology of phasmids - KLUEDO - Universität Kaiserslautern

Create successful ePaper yourself
Turn your PDF publications into a flip-book with our unique Google optimized e-Paper software.
Adult female feeding preference & nymph performance 65<br />
Survival and growth <strong>of</strong> nymphs as key demographic traits in insect herbivores were expected to<br />
decrease with increasing defensive leaf characters. Correlation analysis <strong>of</strong> performance with leaf<br />
toughness, specific leaf weight, water and total phenol content showed no relationship to nymph growth<br />
(Figure 4-10) and survival (Figure 4-11). Considering tannin contents <strong>of</strong> leaves their effects on nymph<br />
performance remained unclear. (Leaf tannin content could not be correlated to nymph performance due<br />
to rare presence <strong>of</strong> tannins.) If tannins influenced survival plant species containing tannins should have<br />
ranged on the upper end considering nymph mortality. In contrast to this prediction 47.5 % <strong>of</strong> nymphs<br />
survived on P. marginatum (1.58 % TAE) only exceeded by survival on two other tannin-free plant<br />
species (P. dilatatum, Phil. inaequilaterum; cf. Table 4-2 and Table 4-3). Similarly survival <strong>of</strong> nymphs<br />
feeding on tannin containing leaves <strong>of</strong> P. cordulatum and P. hispidum ranged on mid levels. While<br />
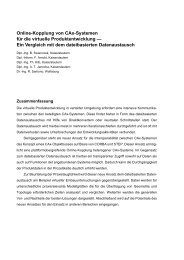
tannins seemed not to be related to nymph survival there is a clear pattern in terms <strong>of</strong> growth rates <strong>of</strong><br />
nymphs. Growth rates on all three Piper species containing tannins and fed to nymphs (P. cordulatum,<br />
P. hispidum, P. marginatum; cf. Figure 4-9 and Table 4-2) were only exceeded by nymph growth on<br />
P. peltatum (tannin-free).<br />
relative growth rate <strong>of</strong> nymphs<br />
0.20<br />
0.15<br />
0.10<br />
0.05<br />
0.00<br />
f<br />
g<br />
Dlong<br />
Mean<br />
±StDev.<br />
±1.96*StDev.<br />
c<br />
d<br />
e<br />
f<br />
Paequ<br />
a<br />
b<br />
Pcord<br />
b<br />
c<br />
Pcule<br />
e<br />
f<br />
Pdari<br />
c<br />
d<br />
e<br />
Pdil<br />
g<br />
Pgran<br />
b<br />
c<br />
d<br />
Philinae<br />
d<br />
e<br />
f<br />
g<br />
Philsp<br />
a<br />
b<br />
Phisp<br />
a a<br />
Figure 4-9: Relative growth rates <strong>of</strong> M. diocles nymphs on single food plant species (measurements after two<br />
weeks, one week later too many nymphs had died). Growth rates differed significantly depending on food source<br />
(ANOVA, F = 34.2, df = 12, P < 0.01). Identical letters indicate no significant difference (Tukeys HSD unequal N,<br />
P > 0.05).<br />
Pmarg<br />
Ppelt<br />
c<br />
d<br />
e<br />
f<br />
Preti