ecology of phasmids - KLUEDO - Universität Kaiserslautern
ecology of phasmids - KLUEDO - Universität Kaiserslautern
ecology of phasmids - KLUEDO - Universität Kaiserslautern

Create successful ePaper yourself
Turn your PDF publications into a flip-book with our unique Google optimized e-Paper software.
Life history & potential population growth 39<br />
3.3.2 Potential population growth and effects <strong>of</strong> limited hatching success<br />
As generations in M. diocles were shown not to overlap potential population growth was calculated by<br />
the model <strong>of</strong> discrete stepwise growth described by Equation 3-1.<br />
The fundamental net per capita rate <strong>of</strong> increase R (Equation 3-2) for M. diocles was 19.79 (intrinsic rate<br />
<strong>of</strong> natural increase per generation r = 2.98 and per day for females r = 0.0125). In other words: each<br />
individual <strong>of</strong> a generation contributed with a progeny <strong>of</strong> 20 individuals to the next generation.<br />
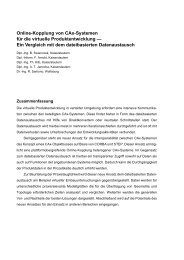
The model resulted in exponential population growth (Figure 3-3). Starting with a hypothetical<br />
population <strong>of</strong> two individuals representing the founder generation T0 (male and female) the population<br />
comprised 40 individuals in the first generation (2 * 19.79 = 39.58), multiplying to 783 individuals in<br />
the second, and 15494 individuals in the third generation (population size T4 ~ 306572; T5 > 6*10 6 ).<br />
About 90 % <strong>of</strong> the eggs hatched; 2% <strong>of</strong> embryos were killed by fungal infestations and another 8%<br />
failed to hatch for unknown reasons. The reduction in hatching success <strong>of</strong> 10 % resulted in a lowered<br />
net per capita rate <strong>of</strong> increase <strong>of</strong> R = 17.81 (r = 2.88 per generation and r = 0.0121 for females per day).<br />
Accordingly population growth was decelerated with T1 ~ 36, T2 ~ 634, T3 ~ 11299 and T4 ~ 201227<br />
individuals (Figure 3-3).<br />
Population size [ind.]<br />
16000<br />
14000<br />
12000<br />
10000<br />
500<br />
0<br />
potential population increase, R = 19.79<br />
population increase<br />
including hatching success, R = 17.81<br />
0 1 2 3<br />
Generation T<br />
Figure 3-3: Model <strong>of</strong> discrete stepwise population growth (Equation 3-1) <strong>of</strong> M. diocles for potential population<br />
growth (filled dots) and population growth decreased by reduced hatching success (white dots). Models start from<br />
a hypothetical founder generation T0 <strong>of</strong> two individuals. Net per capita rates <strong>of</strong> increase (R) are depicted in the<br />
figure legend.<br />
4