ecology of phasmids - KLUEDO - Universität Kaiserslautern
ecology of phasmids - KLUEDO - Universität Kaiserslautern
ecology of phasmids - KLUEDO - Universität Kaiserslautern

Create successful ePaper yourself
Turn your PDF publications into a flip-book with our unique Google optimized e-Paper software.
ECOLOGY OF PHASMIDS (PHASMATODEA) IN A MOIST<br />
NEOTROPICAL FOREST:<br />
A STUDY ON LIFE HISTORY, HOST-RANGE AND BOTTOM-UP VERSUS<br />
TOP-DOWN REGULATION<br />
Dissertation zur Erlangung des<br />
naturwissenschaftlichen Doktorgrades<br />
der Technischen <strong>Universität</strong> <strong>Kaiserslautern</strong><br />
vorgelegt von<br />
Jürgen Berger<br />
<strong>Kaiserslautern</strong>, im Mai 2004
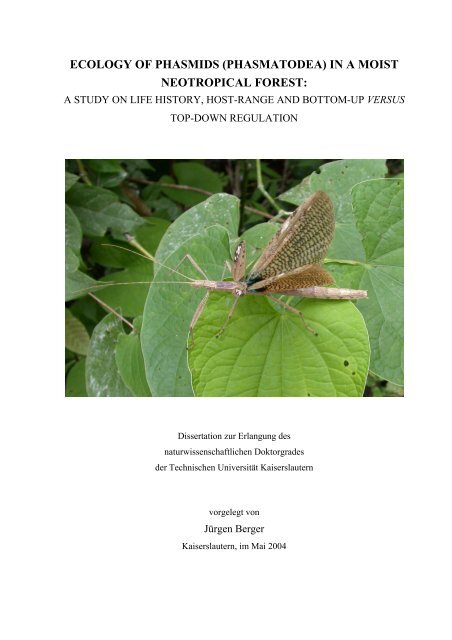
Cover: A female <strong>of</strong> Metriophasma diocles displays all its beauty (on Piper marginatum; © by the Author).
ECOLOGY OF PHASMIDS (PHASMATODEA) IN A MOIST<br />
NEOTROPICAL FOREST:<br />
A STUDY ON LIFE HISTORY, HOST-RANGE AND BOTTOM-UP VERSUS<br />
TOP-DOWN REGULATION<br />
Vom Fachbereich Biologie<br />
der Technischen <strong>Universität</strong> <strong>Kaiserslautern</strong><br />
zur Verleihung des akademischen Grades<br />
„Doktor der Naturwissenschaften“<br />
genehmigte Dissertation<br />
D 386<br />
vorgelegt von<br />
Dipl.-Biol. Jürgen Berger<br />
Betreuer der Dissertation: Pr<strong>of</strong>. Dr. Burkhard Büdel<br />
<strong>Kaiserslautern</strong> 2004
Tag der wissenschaftlichen Aussprache: 13. Juli 2004<br />
Vorsitzender der Prüfungskommission: Pr<strong>of</strong>. Dr. Helmut Joseph Schmidt<br />
1. Gutachter: Pr<strong>of</strong>. Dr. Burkhard Büdel<br />
2. Gutachter: PD Dr. Jürgen Kusch<br />
Phasmids, the most peculiar beasts,<br />
‘between the Devil and the Deep Blue Sea’<br />
(Lawton & McNeill 1979)
Acknowledgements I<br />
Acknowledgements<br />
Many people and organizations contributed to the work presented in this dissertation, and I am grateful<br />
for all <strong>of</strong> their help.<br />
I thank my advisors Rainer Wirth and Burkhard Büdel and all the members <strong>of</strong> the Department <strong>of</strong> Botany<br />
at University <strong>of</strong> <strong>Kaiserslautern</strong> for years <strong>of</strong> stimulating discussion leading to the ideas presented here.<br />
I am grateful to Donald Windsor for all <strong>of</strong> his generous support during my stay in Panamá.<br />
Tanja Lakatos, Sergio Bermudo, Manuel Redling, Florian Pankewitz, Nicole Saverschek, Britta Hartard,<br />
Sebastian Meyer and Kim Beisel never got tired in field or lab work. Jennifer Lauterbach helped making<br />
my written words sound english. Gracias.<br />
I also thank all visiting scientists, assistants and volunteers at the Smithsonian Tropical Research<br />
Institute and all staff I had the unforgettable opportunity to interact with.<br />
Special thanks go to Christiane Bröker and to my family who provided emotional, mental and physical<br />
support throughout the project. – Por la vida y el amor.<br />
Funding was provided by the Smithsonian Tropical Research Institute (STRI), the Landesgraduiertenförderung<br />
Rheinland-Pfalz (LGFG) and the German Academic Exchange Board (DAAD).
Table <strong>of</strong> Contents II<br />
Table <strong>of</strong> Contents<br />
Acknowledgements ..................................................................................................................... I<br />
Table <strong>of</strong> Contents .......................................................................................................................II<br />
List <strong>of</strong> Figures.............................................................................................................................V<br />
List <strong>of</strong> Tables ............................................................................................................................ VI<br />
List <strong>of</strong> Abbreviations ..............................................................................................................VII<br />
1 Introduction..............................................................................................................................1<br />
1.1 General aspects....................................................................................................................1<br />
1.2 Current knowledge about tropical phasmid <strong>ecology</strong>...........................................................2<br />
1.2.1 Design and aims <strong>of</strong> the study.....................................................................................................3<br />
1.3 Site characterization and general methods ..........................................................................5<br />
1.3.1 Study site, vegetation and climate .............................................................................................5<br />
1.3.2 Maintenance <strong>of</strong> phasmid species in the laboratory....................................................................7<br />
1.3.3 Identification <strong>of</strong> phasmid and plant species...............................................................................7<br />
1.3.4 Data analysis..............................................................................................................................8<br />
2 Community structure and host range <strong>of</strong> <strong>phasmids</strong> on BCI .................................................9<br />
2.1 Introduction .........................................................................................................................9<br />
2.2 Materials and methods.......................................................................................................11<br />
2.2.1 Line-transects ..........................................................................................................................11<br />
2.2.2 No-choice feeding trials...........................................................................................................12<br />
2.2.3 Data analysis............................................................................................................................12<br />
2.2.3.1 Estimating phasmid community parameters........................................................12<br />
2.2.3.2 Estimating niche dimensions and overlap ...........................................................15<br />
2.3 Results ...............................................................................................................................16<br />
2.3.1 Phasmid diversity and density .................................................................................................16<br />
2.3.2 Seasonality...............................................................................................................................17<br />
2.3.3 Food niche ...............................................................................................................................19<br />
2.4 Discussion .........................................................................................................................24<br />
2.4.1 Phasmid diversity, density, and distribution............................................................................24<br />
2.4.2 Seasonality...............................................................................................................................26<br />
2.4.3 Niche breadth and habitat choice.............................................................................................27<br />
2.4.4 Conclusions .............................................................................................................................30
Table <strong>of</strong> Contents III<br />
3 Life cycle, potential population growth, and egg hatching failure <strong>of</strong><br />
Metriophasma diocles .............................................................................................................31<br />
3.1 Introduction .......................................................................................................................31<br />
3.2 Materials and methods ......................................................................................................33<br />
3.2.1 Assessing demographic population parameters and life history traits.................................... 33<br />
3.2.2 Modeling potential population growth and the effect <strong>of</strong> limited hatching success................. 35<br />
3.3 Results ...............................................................................................................................36<br />
3.3.1 Demographic population parameters and life history traits.................................................... 36<br />
3.3.2 Potential population growth and effects <strong>of</strong> limited hatching success ..................................... 39<br />
3.4 Discussion .........................................................................................................................40<br />
3.4.1 Demographic population parameters and life history traits.................................................... 40<br />
3.4.2 The biotic potential <strong>of</strong> Metriophasma diocles ........................................................................ 41<br />
3.4.3 A first insight into M. diocles population control ................................................................... 42<br />
3.4.4 Conclusions............................................................................................................................. 43<br />
4 Preference <strong>of</strong> female adults and performance <strong>of</strong> larval stages <strong>of</strong> M. diocles on single food<br />
plant species ............................................................................................................................44<br />
4.1 Introduction .......................................................................................................................44<br />
4.2 Materials and methods ......................................................................................................47<br />
4.2.1 Measuring leaf traits ............................................................................................................... 48<br />
4.2.1.1 Measuring leaf toughness ................................................................................... 48<br />
4.2.1.2 Leaf phenol and tannin content........................................................................... 48<br />
4.2.2 Dual-choice feeding trials with M. diocles adult females....................................................... 49<br />
4.2.3 Problems inherent with dual-choice feeding trials.................................................................. 50<br />
4.2.3.1 Conditioning due to prior feeding experience..................................................... 50<br />
4.2.3.2 Choice <strong>of</strong> reference plant species ....................................................................... 51<br />
4.2.4 Long term feeding trials with M. diocles nymphs .................................................................. 52<br />
4.2.5 Dual-choice feeding trials with M. diocles nymphs................................................................ 52<br />
4.3 Data analysis .....................................................................................................................53<br />
4.3.1 Analysis <strong>of</strong> preference ............................................................................................................ 54<br />
4.3.2 Analysis <strong>of</strong> performance......................................................................................................... 54<br />
4.4 Results ...............................................................................................................................55<br />
4.4.1 Interspecific differences in physical and chemical leaf properties ......................................... 55<br />
4.4.2 Preference <strong>of</strong> M. diocles adult females ................................................................................... 60<br />
4.4.3 Performance <strong>of</strong> M. diocles nymphs ........................................................................................ 62<br />
4.4.4 Preference <strong>of</strong> M. diocles nymphs under varying total phenol and tannin contents................. 67
Table <strong>of</strong> Contents IV<br />
4.5 Discussion .........................................................................................................................69<br />
4.5.1 The pattern <strong>of</strong> feeding preference and performance: an attempt <strong>of</strong> an explanation ................69<br />
4.5.2 Ecological and evolutionary consequences .............................................................................74<br />
4.5.3 Conclusions .............................................................................................................................76<br />
5 Predation pressure and its effects on survival and <strong>of</strong>f-plant migration <strong>of</strong> M. diocles<br />
nymphs ....................................................................................................................................77<br />
5.1 Introduction .......................................................................................................................77<br />
5.2 Materials and Methods ......................................................................................................79<br />
5.2.1 Study site and organism...........................................................................................................79<br />
5.2.2 Field experiment......................................................................................................................79<br />
5.2.3 Greenhouse experiment ...........................................................................................................80<br />
5.2.4 Data analysis............................................................................................................................81<br />
5.3 Results ...............................................................................................................................81<br />
5.3.1 Predation-mediated patterns in M. diocles nymph mortality...................................................81<br />
5.3.2 Predation and <strong>of</strong>f-plant migration............................................................................................84<br />
5.4 Discussion .........................................................................................................................86<br />
5.4.1 The top-down view <strong>of</strong> M. diocles population regulation.........................................................86<br />
5.4.2 Is <strong>of</strong>f-plant migration mediated by natural enemies or by resources?.....................................87<br />
5.4.3 Who are the predators?............................................................................................................88<br />
5.4.4 Conclusions .............................................................................................................................89<br />
6 Concluding remarks ..............................................................................................................91<br />
6.1 Is M. diocles a herbivore specialist?..................................................................................91<br />
6.2 Bottom-up or top-down or both ........................................................................................92<br />
7 Abstract...................................................................................................................................93<br />
8 Literature cited.......................................................................................................................95<br />
9 Appendix...............................................................................................................................113
List <strong>of</strong> Figures V<br />
List <strong>of</strong> Figures<br />
Figure 1-1: Study design........................................................................................................................... 4<br />
Figure 1-2: Map <strong>of</strong> Barro Colorado Island (BCI), Panama. ..................................................................... 6<br />
Figure 1-3: Precipitation on Barro Colorado Island in the years 2000 and 2001 ..................................... 7<br />
Figure 2-1: Species accumulation curve for <strong>phasmids</strong> recorded along line-transects on BCI................ 17<br />
Figure 2-2: Relative abundances <strong>of</strong> phasmid at forest edges and in the forest understory..................... 17<br />
Figure 2-3: Temporal fluctuations <strong>of</strong> absolute phasmid abundances along forest edges ....................... 19<br />
Figure 3-1: Mean daily egg production <strong>of</strong> M. diocles females in relation to body weight..................... 38<br />
Figure 3-2: Hatching phenology <strong>of</strong> M. diocles nymphs ......................................................................... 38<br />
Figure 3-3: Model <strong>of</strong> discrete stepwise population growth <strong>of</strong> M. diocles .............................................. 39<br />
Figure 4-1: Comparison <strong>of</strong> paired dual-choice preference tests <strong>of</strong> M. diocles adult females................. 51<br />
Figure 4-2: Relative leaf toughness <strong>of</strong> 15 selected M. diocles food plant species.................................. 57<br />
Figure 4-3: Water content <strong>of</strong> leaves from 15 food plant species <strong>of</strong> M. diocles. ..................................... 58<br />
Figure 4-4: Specific leaf weight (SLW) from 15 food plant species <strong>of</strong> M. diocles. ............................... 58<br />
Figure 4-5: Total phenol content <strong>of</strong> leaves from 15 food plant species <strong>of</strong> M. diocles............................ 60<br />
Figure 4-6: Feeding preference <strong>of</strong> M. diocles females ........................................................................... 61<br />
Figure 4-7: Preference <strong>of</strong> M. diocles females in relation to structural and chemical leaf characters ..... 62<br />
Figure 4-8: Time series <strong>of</strong> the survival <strong>of</strong> M. diocles neonate nymphs on single food plant species..... 63<br />
Figure 4-9: Relative growth rates <strong>of</strong> M. diocles nymphs on single food plant species .......................... 65<br />
Figure 4-10: Relative growth rates <strong>of</strong> nymphs in relation to structural and chemical leaf characters.... 66<br />
Figure 4-11: Relative survival <strong>of</strong> nymphs in relation to structural and chemical leaf characters.......... 66<br />
Figure 4-12: Feeding preference <strong>of</strong> nymphs under varying levels <strong>of</strong> leaf total phenol content ............. 68<br />
Figure 4 -13: Feeding preference <strong>of</strong> M. diocles nymphs under varying levels <strong>of</strong> leaf tannin content….68<br />
Figure 5-1: Cumulative survival <strong>of</strong> phasmid nymphs in exclosures versus controls.............................. 82<br />
Figure 5-2: Mortality <strong>of</strong> nymphs in exclosures versus controls at night and in the day......................... 82<br />
Figure 5-3: Plant size and migratory behavior <strong>of</strong> nymphs...................................................................... 85
List <strong>of</strong> Tables VI<br />
List <strong>of</strong> Tables<br />
Table 2-1: Phasmid species and their community structure on BCI........................................................18<br />
Table 2-2: Niche breadth and niche overlap <strong>of</strong> phasmid species on BCI................................................20<br />
Table 2-3: Dimensions <strong>of</strong> the food niche <strong>of</strong> four <strong>phasmids</strong> on BCI........................................................22<br />
Table 2-4: Densities <strong>of</strong> <strong>phasmids</strong>, insects, and arthropods in neotropical rainforests.............................25<br />
Table 3-1: Estimates <strong>of</strong> demographic population parameters and life history traits <strong>of</strong> M. diocles .........37<br />
Table 4-1: Physical leaf traits <strong>of</strong> 15 M. diocles host plant species. .........................................................56<br />
Table 4-2: Total phenol and tannin contents <strong>of</strong> M. diocles host plant species.. ......................................59<br />
Table 4-3: Survival <strong>of</strong> neonate M. diocles nymphs resulting from long term feeding trials.. .................64<br />
Table 5-1: Disappearance or death and migratory activity <strong>of</strong> M. diocles nymphs ..................................83<br />
Table 5-2: Potential predators <strong>of</strong> M. diocles nymphs ..............................................................................84
List <strong>of</strong> Abbreviations VII<br />
List <strong>of</strong> Abbreviations<br />
% percent<br />
ANOVA Analysis <strong>of</strong> Variance<br />
BCI Barro Colorado Island<br />
BCNM Barro Colorado Nature Monument<br />
cf. confer<br />
cm centimeter<br />
CTFS Center for Tropical Forest Science<br />
d day<br />
df degrees <strong>of</strong> freedom<br />
e.g. "exempli gratia" [Lat.]; ‘example given’ or ‘for example’<br />
g gram<br />
GOF Goodness <strong>of</strong> Fit<br />
ha hectare<br />
i.e. "id est" [Lat.]; ‘that is’<br />
ind. individual<br />
m meter<br />
mg milligram<br />
mm millimeter<br />
N Nitrogen<br />
N sample size<br />
ºC degree Celsius<br />
P probability<br />
pers. obs. Personal observation<br />
SE Standard-Error<br />
SLW specific leaf weight<br />
StDev Standard-Deviation<br />
STRI Smithsonian Tropical Research Institute<br />
TAE Tannic Acid Equivalent<br />
Abbreviations used in particular statistical or analytical methods are explained in the text.
Introduction 1<br />
1 Introduction<br />
1.1 General aspects<br />
Tropical rainforests are renowned for their vast biodiversity and high productivity. For understanding <strong>of</strong><br />
the factors that structure these communities and maintain ecosystem stability, the relationships among<br />
trophic levels are <strong>of</strong> particular interest. Increasing attention has been paid to plant-animal interactions,<br />
and herbivory is discussed as a key agent in maintaining forest dynamics and ecosystem stability<br />
(Lowman 1984; Brokaw 1985; Schowalter et al. 1985; Brown et al. 1987). In tropical forests,<br />
herbivores consume up to 11 percent <strong>of</strong> annual leaf production (Coley & Barone 1996). Such strong<br />
pressure is thought to select for the evolution <strong>of</strong> plant defenses and high plant biodiversity (Ehrlich &<br />
Raven 1964; Janzen 1970; Connell 1971; Rhoades & Cates 1976; Coley et al. 1985). In return, high<br />
variety and high regimes <strong>of</strong> plant defenses are thought to favor high diversity <strong>of</strong> herbivores in the<br />
tropics (Janzen 1973; Coley & Aide 1991). Alternatively, natural enemies may account for selection<br />
towards narrow niches <strong>of</strong> their prey and thereby promote high diversity <strong>of</strong> tropical faunas (Pianka 1966;<br />
Price et al. 1980; Bernays & Graham 1988). Whether populations at different trophic levels are limited<br />
by resources (bottom-up, sensu Murdoch 1966; White 1978; McNeill & Southwood 1978) or due to<br />
consumption by higher trophic levels (top-down, sensu Hairston et al. 1960) is subject to ongoing<br />
debate.<br />
Given the high biodiversity and productivity <strong>of</strong> tropical rainforests, it is most likely that processes that<br />
structure tropical communities may be fundamentally different than processes in temperate ecosystems.<br />
As a consequence, ecological paradigms developed in temperate systems may not be useful for<br />
understanding tropical systems (Dyer & Coley 2001). In fact, relationships among trophic levels seem to<br />
be converse depending on latitude. Tropical plants compared to temperate species seem to be richer in<br />
plant defenses both in variability and amounts (e.g., Coley & Kursar 1996). But the impact <strong>of</strong> plant<br />
defenses appears to be greater in temperate regions (Coley & Barone 1996). The opposite pattern<br />
emerged for predators. There is evidence that the impact <strong>of</strong> predators on herbivores is stronger in the<br />
tropics than in the temperate zone (reviewed in Dyer & Coley 2001). However, there is consensus that<br />
tropical herbivores are kept at bay by both bottom-up and top-down regulation mechanisms (Pace et al.<br />
1999; Persson 1999; Polis 1999). In other words: herbivores are between the devil (natural enemies) and<br />
the deep blue sea (poor food) (Lawton & McNeill 1979). In the debate about the relative roles <strong>of</strong><br />
resource limitation and predators in controlling tropical herbivore populations, evidence suggests that<br />
natural enemies may be the major control factor (Dyer & Coley 2001).
Introduction 2<br />
Regardless whether strong impact from higher or lower trophic levels limits herbivore populations,<br />
current theories assume that this selection pressure has led to narrow niches (Pianka 1966; MacArthur &<br />
Wilson 1967). Since food is one <strong>of</strong> the most important dimensions <strong>of</strong> the niche (Krebs 1989), niche<br />
breadth is generally expressed in terms <strong>of</strong> feeding specialization <strong>of</strong> herbivores (Bernays & Chapman<br />
1994). This debate is <strong>of</strong> broad interest because estimates <strong>of</strong> global biodiversity are largely based on the<br />
degree <strong>of</strong> specialization <strong>of</strong> tropical insects. Just recently global biodiversity estimates were corrected<br />
from formerly stated 31 million (Erwin 1982) to about 4 to 10 million species (Ødegard 2000; Novotny<br />
et al. 2002a) because increasing research effort indicates that specialization is less pronounced than<br />
formerly supposed (Basset 1996, 1999; Basset et al. 1992, 1996; Barone 1998; Novotny et al. 2002a).<br />
Generally, these studies state that most tropical insect herbivores are rare (Basset 1996, 1999; Basset et<br />
al. 1992, 1996; Barone 1998; Novotny et al. 2002b), but they represent the plants view <strong>of</strong> herbivore<br />
specialization, i.e. the herbivore communities <strong>of</strong> one or several plant species are sampled, and thus may<br />
cover only a fraction <strong>of</strong> density and distribution patterns <strong>of</strong> insect herbivores.<br />
There is an enormous lack <strong>of</strong> research which addresses the densities <strong>of</strong> insect communities, let alone the<br />
densities and distribution <strong>of</strong> single insect herbivore species in tropical forests. The scarce information on<br />
this topic derives from studies using trap techniques (Wolda 1978, 1980, 1983, 1992; Smythe 1982), or<br />
describing the overall arthropod community (Janzen & Schoener 1968; Elton 1973). Beyond doubt,<br />
these studies contributed important baseline data for the development <strong>of</strong> general ideas, but they either<br />
incorporate species particularly prone to a certain trapping device, or all insect feeding guilds.<br />
Surprisingly few studies have reported the most basic demographic parameters for tropical insect<br />
herbivores, distribution and population density (Smiley 1978; Willig et al. 1986, 1993; Willig & Camilo<br />
1991).<br />
1.2 Current knowledge about tropical phasmid <strong>ecology</strong><br />
Although <strong>phasmids</strong> are common herbivores in many tropical ecosystems, little is known about the<br />
biology <strong>of</strong> these hemimetabolous insects (Bedford 1978; Van den Bussche et al. 1989; Willig et al.<br />
1986, 1993). The order Phasmatodea (walkingsticks and leaf insects) is one out <strong>of</strong> nine orders <strong>of</strong><br />
phytophagous insects and contains approximately 3000 described species that occur worldwide with a<br />
concentration in tropical regions (Whiting et al. 2003). Generally, <strong>phasmids</strong> are considered as herbivore<br />
generalists although empirical studies on diet breadth <strong>of</strong> natural populations are missing (Bedford 1978;<br />
Willig et al. 1986, 1993; Sandlin & Willig 1993).<br />
The significance <strong>of</strong> <strong>phasmids</strong> as herbivores has attracted some interest as they can reach plague numbers<br />
and may cause severe damage to forests (temperate forests: Graham 1937; Australian Eucalypt forests:<br />
Campbell 1960, 1961, 1974; Campbell & Hadlington 1967) or to agricultural plantations (Pacific<br />
coconut plantations: Paine 1968; Swaine 1969). Such herbivores exerting strong pressure may be key
Introduction 3<br />
agents in maintaining forest dynamics and ecosystem stability (Lowman 1984; Brokaw 1985;<br />
Schowalter et al. 1985; Brown et al. 1987). Their relevance as herbivores in tropical forests was<br />
confirmed in studies on the abundant endemic Puerto Rican species Lamponius portoricensis REHN.<br />
Population density <strong>of</strong> this polyphagous species seems to temporally vary to an enormous extent (Willig<br />
et al. 1986, 1993; Willig & Camilo 1991). Yet, besides drastic reductions in population densities<br />
following natural disturbance <strong>of</strong> high intensity (Willig & Camilo 1991) the causal factors <strong>of</strong> these<br />
fluctuations largely remain unknown. Host plant densities partly explained distribution patterns and<br />
patch densities <strong>of</strong> L. portoricensis (Willig et al. 1993), and individuals displayed differential preference<br />
among hosts depending on age, sex and prior experience (Sandlin & Willig 1993). This preference may<br />
be the result <strong>of</strong> specific nutritional constraints but could also reflect selection by predation pressure:<br />
Sandoval (1994) showed that color morphs <strong>of</strong> an endemic Californian species suffered differential<br />
predation on varying host plants thereby propagating specialization and speciation.<br />
A variety <strong>of</strong> behavioral and morphological adaptations underline the importance <strong>of</strong> predation-related<br />
selection on phasmid evolution. Most <strong>phasmids</strong> species exhibit a repertory <strong>of</strong> predation-avoidance<br />
behaviors (Robinson 1968a, 1968b, 1969; Bedford 1978). They live cryptic, resembling sticks and<br />
leaves, and the majority <strong>of</strong> species is active at nights (Bedford 1978). Most phasmid species dispose <strong>of</strong><br />
glands (Bedford 1978) whose secretions were shown to deter predators (Eisner 1965; Eisner et al.<br />
1997). Many phasmid eggs attract ants with a protein rich cap (Capitulum) and may thereby be<br />
protected from parasitoid wasps (Compton & Ware 1991; Hughes & Westoby 1992; Windsor et al.<br />
1996).<br />
Information on phasmid species <strong>of</strong> Panamá is restricted to the early taxonomic work <strong>of</strong> Hebard (1923,<br />
1929, 1933) and the studies about the defensive behavior <strong>of</strong> several <strong>phasmids</strong> by Robinson (1968a,<br />
1968b, 1969). Panamanian <strong>phasmids</strong> have been observed feeding on plant species <strong>of</strong> the family Araceae<br />
(Robinson 1969). And <strong>phasmids</strong> are reported to feed on Piper spp. (Piperaceae) in Costa Rica (Marquis<br />
1991) and Puerto Rico (Willig et al. 1986, 1993; Sandlin & Willig 1993).<br />
1.2.1 Design and aims <strong>of</strong> the study<br />
In this dissertation, I take an approach to contribute to the understanding <strong>of</strong> the ecological processes<br />
affecting distribution and density <strong>of</strong> tropical insect herbivores. Starting from descriptive information on<br />
the phasmid community on Barro Colorado Island (BCI) (Chapter 2), the study then focuses on<br />
population parameters <strong>of</strong> the phasmid Metriophasma diocles WESTWOOD (Chapter 2&3) and on<br />
experiments on potential control factors related to the bottom-up (Chapter 4) and top-down (Chapter 5)<br />
views <strong>of</strong> population regulation (Figure 1-1).
Introduction 4<br />
Description <strong>of</strong> phasmid<br />
community parameters<br />
(in the field from linetransects)<br />
Diversity<br />
Top-down control<br />
Predation-mediated mortality <strong>of</strong><br />
nymphs (field experiment)<br />
Biotic<br />
Distribution Focus on population<br />
Estimates<br />
potential<br />
Abundance parameters <strong>of</strong><br />
from lab<br />
Potential food<br />
Realized niche Metriophasma diocles<br />
population<br />
niche<br />
Bottom-up control<br />
leaf traits <strong>of</strong> host-plants and their<br />
effects on performance <strong>of</strong> nymphs<br />
and preference <strong>of</strong> adults (feeding trials<br />
in the lab)<br />
Figure 1-1: Study design: The outer circles represent the main focuses <strong>of</strong> Chapters 2 to 5.<br />
As a first step, Chapter 2 addresses the structural aspects <strong>of</strong> the phasmid community on BCI.<br />
Distribution and abundance <strong>of</strong> herbivores may be modulated by resource limitation (e.g., Joern &<br />
Gaines 1990), and knowledge about the food niche <strong>of</strong> herbivores is crucial for an evaluation <strong>of</strong> resource<br />
restrictions. If <strong>phasmids</strong> behave as specialists, their habitat should generally reflect the habitat <strong>of</strong> their<br />
host plants. In contrast, generalists should be less dependent on host plant distribution. Thus uncovering<br />
the diet breadth <strong>of</strong> herbivores directly relates to understanding habitat choice. In combining information<br />
on (1) plant species <strong>phasmids</strong> were observed on along line-transects with (2) feeding-trials in the lab the<br />
realized food niche can be separated from other niche dimensions that are typically incorporated in field<br />
studies. The difference between realized and absolute food niche then allows to conclude on other<br />
impact factors like climate or natural enemies. The estimation <strong>of</strong> phasmid densities provides a basis for<br />
the following chapters.<br />
The realized population densities reflect an organism in the boundaries <strong>of</strong> its environment (Begon et al.<br />
1996). In Chapter 3, I meet the question what is the inherent potential <strong>of</strong> the phasmid species<br />
Metriophasma diocles to reproduce free from environmental limitations. I modeled the potential<br />
population growth <strong>of</strong> M. diocles on the basis <strong>of</strong> life cycle parameters like sex ratio, female fecundity and<br />
generation time assessed from a laboratory population. The difference between potential and realized
Introduction 5<br />
population densities then reflects the impact <strong>of</strong> control. Population control factors can act pre- or postnatal.<br />
Here, I present a first estimate <strong>of</strong> egg mortality and failed hatching and show the effect <strong>of</strong> prenatal<br />
mortality on potential population increase <strong>of</strong> M. diocles.<br />
Dietary constraints <strong>of</strong> M. diocles are the subject <strong>of</strong> Chapter 4, addressing the bottom-up view <strong>of</strong><br />
herbivore regulation. Nutritious requirements <strong>of</strong> <strong>phasmids</strong> may be age or sex-specific (e.g., Cassidy<br />
1978; Sandlin & Willig 1993), and early life stages <strong>of</strong> herbivorous insects may suffer high mortality<br />
depending on the food source and its species-specific physical and chemical leaf characteristics (Joern<br />
& Gaines 1990; Belovsky & Slade 1995). In feeding-trials, I observed performance (sensu growth and<br />
survival) <strong>of</strong> first instar nymphs and preference <strong>of</strong> adult females on different host plants reflecting<br />
M. diocles host range. Performance <strong>of</strong> nymphs and preference <strong>of</strong> adults were analyzed with respect to<br />
particular defensive leaf traits that potentially reduce digestibility <strong>of</strong> the foliage or are toxic to the<br />
organism.<br />
In Chapter 5 I am concerned with the top-down view <strong>of</strong> M. diocles population regulation. In a<br />
predation-exclusion field experiment I assessed the impact <strong>of</strong> predators on first instar nymphs <strong>of</strong><br />
M. diocles. A general pattern in insects is high mortality <strong>of</strong> early life stages with high impact <strong>of</strong><br />
predation, particularly by parasitoids (Cornell & Hawkins 1995; Cornell et al. 1998). While these<br />
patterns arose from studies on holometabolous insects, knowledge on hemimetabolous herbivores<br />
mainly originates from studies on temperate grasshoppers (e.g., Joern & Gaines 1990; Belovsky &<br />
Slade 1995; Oedekoven & Joern 1998).<br />
1.3 Site characterization and general methods<br />
1.3.1 Study site, vegetation and climate<br />
The study took place on Barro Colorado Island (BCI; 9 o 09’N, 79 o 51’W), a field site <strong>of</strong> the Smithsonian<br />
Tropical Research Institute (STRI) in Panamá (Figure 1-2). The island <strong>of</strong> 1567 ha is located in the lake<br />
Gatun. This freshwater lake was dammed up between 1911 and 1914 during construction <strong>of</strong> the Panama<br />
Canal. The island is the centerpiece <strong>of</strong> the 5600 ha Barro Colorado Nature Monument (BCNM) that was<br />
established in 1978 and includes the adjacent mainland peninsulas. In 1923, BCI was declared as<br />
biological reserve and in 1946 it became a unit <strong>of</strong> the Smithsonian Institution. Since then, the island has<br />
become one <strong>of</strong> the most intensively studied areas in the tropics.<br />
BCI is completely covered with semi-deciduous tropical moist forest <strong>of</strong> several successional stages<br />
(Foster & Brokaw 1982). The northeastern part <strong>of</strong> the island consists <strong>of</strong> 100 to 200 year old secondary<br />
forest whereas old forest <strong>of</strong> 200 to 400 years covers most <strong>of</strong> the southeast <strong>of</strong> BCI. A small strip <strong>of</strong> old<br />
forest remained south <strong>of</strong> the laboratory (surrounding Lutz Creek). The area around the laboratory is<br />
cleared and the vegetation is dominated by pioneer plant species such as Cecropia, Ochroma, Trema,
Introduction 6<br />
Solanum and Piper (Thies 1998). The flora <strong>of</strong> BCI comprises more than 1200 plant species and is<br />
described in detail by Croat (1978).<br />
Annual rainfall on BCI averages 2634 mm (Paton 2002). There is a distinctive seasonality in rainfall<br />
with a wet season from May to mid-December and a pronounced dry season approximately from mid-<br />
December to the end <strong>of</strong> April (Figure 1-3). On average, only 293 mm <strong>of</strong> rain falls during the dry season.<br />
The annual average temperature on BCI is 27 ºC, with a diurnal variation <strong>of</strong> 7-8 ºC. A detailed<br />
description on vegetation and climatic conditions <strong>of</strong> BCI is given in Leigh et al. (1990).<br />
Figure 1-2: Map <strong>of</strong> Barro Colorado Island (BCI), Panama (source STRI; modified). Lines with names represent<br />
trails, numbers assign distances from the trail origin (x100 m). Bold lines illustrate streams. Circles mark locations<br />
<strong>of</strong> line-transects (see Chapter 2).
Introduction 7<br />
Precipitation [mm]<br />
500<br />
400<br />
300<br />
200<br />
100<br />
0<br />
1 2 3 4 5 6 7 8 9 10 11 12<br />
Month<br />
2000 2001 1929-2001<br />
Figure 1-3: Precipitation on Barro Colorado Island in the years 2000 and 2001 compared to the long-term average<br />
(1929 to 2001; source Paton 2002).<br />
1.3.2 Maintenance <strong>of</strong> phasmid species in the laboratory<br />
The <strong>phasmids</strong> used for setting up lab colonies were collected by hand in a haphazard way during<br />
specific night walks in forest parts and clearings other than that used for line-transects. Field collections<br />
were made during a cumulative period from July 1999 to December 2001. Lab populations <strong>of</strong><br />
Metriophasma diocles WESTWOOD, Bacteria ploiaria (WESTWOOD) and Otocrania sp. could be<br />
established permanently, while nymphs <strong>of</strong> Oncotophasma martini (GRIFFINI) could be reared from<br />
eggs but no females grew to maturity. Consequently the population collapsed in April 2000 and was<br />
given up, as it could not be provided with sufficient animals from field collections. Phasmid species<br />
were maintained in cages (1 m height, 0.5 m depth, 0.5 m width, covered with mosquito net) in screened<br />
and shaded rooms. Cages were sprayed with fresh water daily and provided with edible plants<br />
periodically. Eggs were collected weekly when cages were cleaned.<br />
1.3.3 Identification <strong>of</strong> phasmid and plant species<br />
Phasmid species were identified in cooperation with the taxonomist Sven Bradler at University <strong>of</strong><br />
Göttingen, Germany. Vouchers were deposited at the STRI insect collection in Panama City, Republic<br />
<strong>of</strong> Panamá. Plant species were identified with the help <strong>of</strong> Croat’s Flora <strong>of</strong> BCI (Croat 1978) and verified<br />
by Rolando Pérez, Andrés Hernández and Salomón Aguilar who work as field botanists for the Center<br />
for Tropical Forest Science (CTFS). Plant Vouchers were deposited at the herbarium <strong>of</strong> BCI, Republic<br />
<strong>of</strong> Panamá.
Introduction 8<br />
1.3.4 Data analysis<br />
For statistical analysis I used the computer-based programs Statistica (StatS<strong>of</strong>t Inc. 2001) and JMP<br />
(SAS Institute Inc. 2001). Data were processed in Excel (Micros<strong>of</strong>t Corp. 2000). Figures were created in<br />
SigmaPlot (SPSS Inc. 1999), Excel and Statistica.
Community structure & host range 9<br />
2 Community structure and host range <strong>of</strong> <strong>phasmids</strong> on BCI<br />
2.1 Introduction<br />
Biodiversity <strong>of</strong> tropical forests is markedly higher than in their temperate counterparts (e.g., Mac Arthur<br />
1972; Erwin 1982) and herbivorous insects constitute a major fraction <strong>of</strong> species (Erwin 1982; Stork<br />
1993; Ødegard 2000; Novotny et al. 2002a). The origin <strong>of</strong> tropical species diversity is partly<br />
hypothesized to be based on the arms raise between plants and their consumers. Their impact on leaves<br />
is thought to represent an important selective force for the evolution <strong>of</strong> plant defenses (Ehrlich & Raven<br />
1964; Rhoades & Cates 1976; Coley et al. 1985). Also, herbivory on seeds and seedlings has been<br />
attributed to the high diversity <strong>of</strong> tropical plant communities (Janzen 1970; Connell 1971). In return the<br />
greater variety and higher regime <strong>of</strong> plant defenses in tropical forests are discussed to favor narrower<br />
diets <strong>of</strong> tropical insect herbivores thereby leading to a higher arthropod diversity than in temperate<br />
forests (Janzen 1973; Coley & Aide 1991).<br />
Aside from plant defenses, natural enemies can select for narrower diets since they have different<br />
abilities to locate a herbivore on variable plant species (Price et al. 1980, Bernays & Graham 1988).<br />
In contrast, the scarcity <strong>of</strong> most plant species in tropical forests (Hubbell & Foster 1986) may favor the<br />
generalist habit if locating them is difficult and costly for a specialist herbivore, both in terms <strong>of</strong> time<br />
and exposure to predators (Jaenike 1990; Basset 1992; Coley & Barone 1996).<br />
Indeed most tropical insect herbivores seem to be relatively specific. Even though the debate on the<br />
degree <strong>of</strong> host specificity remains controversial (e.g. Erwin & Scott 1980; Erwin 1982; Basset 1999;<br />
Basset et al. 1992, 1996; Barone 1998; Ødegard 2000; Novotny et al. 2002a, 2002b) there is evidence<br />
that 90 percent <strong>of</strong> all phytophagous insects feed on plants in less than three different plant families<br />
(Bernays & Graham 1988; Marquis & Braker 1994; Barone 1998).<br />
The majority <strong>of</strong> insect herbivore species in tropical forests is rare (Basset 1996, 1999; Basset et al. 1992,<br />
1996; Barone 1998; Novotny et al. 2002b) and abundances vary temporally and spatially. In seasonal<br />
tropical forests, abundances <strong>of</strong> many insect species are positively correlated to rainfall (Wolda 1978,<br />
1979, 1982, 1992) and leaf production (Murali & Sukumar 1993). Concerning the maintenance <strong>of</strong> low<br />
overall population densities, the relative roles <strong>of</strong> lower or higher trophic levels are subject to ongoing<br />
debate but evidence suggests that top-down effects are more important (Coley & Barone 1996; Pace et<br />
al. 1999; Persson 1999; Polis 1999; Dyer & Coley 2001). On a spatial scale insect herbivore densities<br />
are generally assumed to be higher in light gaps than in the forest understory, but this has mainly been<br />
inferred from leaf damage (e.g., Coley, 1980, 1982, 1983; Coley & Barone 1996 and references therein).<br />
Empirical studies on spatial variation in tropical insect herbivore abundances are scarce (e.g., Elton
Community structure & host range 10<br />
1973; Janzen & Schoener 1968; Smiley 1978; Willig et al. 1986, 1993; Willig & Camilo 1991; Braker<br />
1991).<br />
Studies assessing diversity and host specificity <strong>of</strong> herbivores are <strong>of</strong>ten descriptive and frequently based<br />
on collection records (e.g. Wood & Olmstead 1984; Janzen 1988; Hodkinson & Casson 1991).<br />
Conclusions from such approaches on specialization <strong>of</strong> herbivores are problematic because they<br />
generally are based on the counts <strong>of</strong> occurrence <strong>of</strong> insect herbivores on different plant species.<br />
Therefore, they depend on the extent <strong>of</strong> records (Barone 1998). With increasing sample size, there is an<br />
inherent increase in plant species observed for a particular herbivore species. But more importantly,<br />
collection records do not allow to differentiate if a plant species really is part <strong>of</strong> an insects diet or not<br />
(Basset 1997; Novotny & Basset 2000). Therefore estimates <strong>of</strong> resource use from field observations<br />
represent the multidimensional realized niche <strong>of</strong> herbivores, and plant records may diverge into<br />
dimensions like food, mating, oviposition, or just transience (Begon et al. 1996).<br />
One possibility to separate a herbivore’s food niche from other niche dimensions, and thereby giving a<br />
more accurate estimate <strong>of</strong> specialization levels, is combining field records with feeding trials (e.g.,<br />
Basset 1996, 1999; Basset et al. 1992, 1996; Barone 1998; Novotny et al. 2002a, 2002b). Feeding trials<br />
result in an estimate <strong>of</strong> the absolute food niche <strong>of</strong> a herbivore (Krebs 1989). This is the potential host<br />
range <strong>of</strong> a herbivore when released from biotic or abiotic factors which limit the use <strong>of</strong> palatable plants<br />
under natural conditions. Information about the absolute food niche together with information <strong>of</strong> field<br />
collection records (representing the multidimensional realized niche) allows approaching the realized<br />
food niche. Differences between absolute and realized food niche then give a first insight into the<br />
significance <strong>of</strong> resources, competition and predation in shaping plant-herbivore systems.<br />
When discussing the factors that may have led to the observed restriction in using food resources,<br />
evolutionary and ecological processes have to be considered. A first insight into host range evolution<br />
can be gained by applying conventional definitions <strong>of</strong> host plant range on the results <strong>of</strong> feeding trials<br />
(representing the absolute food niche). According to Bernays & Chapman (1994) the categories <strong>of</strong> host<br />
range usually are recognized as: (1) monophagous, i.e. feeding on plants within a single genus; (2)<br />
oligophagous, i.e. feeding on plants within a single family; and (3) polyphagous, i.e. feeding on plants<br />
from different families. This concept refers to taxonomic relationships <strong>of</strong> host-plants and is based on the<br />
classical theory that the capability <strong>of</strong> insects to handle allelochemicals <strong>of</strong> other plant taxa declines with<br />
their increasing phylogenetic distance to the original host plant taxa (Ehrlich & Raven 1964).<br />
On the other hand, restrictions in insect herbivore host range may be associated with chemical plant<br />
properties that are not exclusively governed by phylogeny. For example, according to current plant<br />
defense theories, mature leaves <strong>of</strong> shade-tolerant, slow growing plant species (persistent) are better<br />
defended than mature leaves <strong>of</strong> shade-intolerant, fast growing plant species <strong>of</strong> gaps and forest edges<br />
(pioneers) (Coley 1983; Coley et al. 1985) and hence are less digestible. Consequently, a generalist<br />
herbivore should preferentially feed on leaves <strong>of</strong> pioneer plant species (Berenbaum et al. 1984).
Community structure & host range 11<br />
Although <strong>phasmids</strong> are common herbivores in many tropical systems, little is known <strong>of</strong> their biology<br />
(Bedford, 1978; van den Bussche et al., 1989; Willig et al., 1986, 1993). Generally <strong>phasmids</strong> are<br />
considered as herbivore generalists but specialization ranges from strict monophagy to wide polyphagy<br />
(Bedford 1978). With about 3000 species worldwide (Whiting et al. 2003) <strong>phasmids</strong> are comparably<br />
poor in diversity and many species are known to occur in low abundances in humid tropical forests<br />
(Novotny & Basset 2000; but see Willig et al. 1986). Accordingly, studies to date indicate that the<br />
Panamanian phasmid community is poor in species (Hebard, 1923, 1929, 1933; Robinson, 1968a,<br />
1968b, 1969) while there is no information available on density, distribution or specialization patterns.<br />
Ecological information for neotropical <strong>phasmids</strong> is entirely restricted to the studies on the abundant<br />
endemic Puerto Rican species Lamponius portoricensis (Willig et al. 1986, 1993; Willig & Camilo<br />
1991, Sandlin & Willig 1993). Distribution patterns and patch densities <strong>of</strong> this polyphagous species<br />
could partially be explained by host plant availability (Willig et al. 1993) and drastic reductions in<br />
population densities followed natural disturbance <strong>of</strong> high intensity (Hurricane Hugo; Willig & Camilo<br />
1991). However, the causal factors <strong>of</strong> temporal fluctuations in L. portoricensis densities largely remain<br />
unknown.<br />
Here, I assessed diversity, distribution, and density <strong>of</strong> the phasmid community on BCI by monitoring<br />
line-transects in the forest understory and along forest edges, and I determined the absolute food niche<br />
<strong>of</strong> four phasmid species by conducting feeding-trials.<br />
The possible range <strong>of</strong> host plants <strong>of</strong> phasmid species was determined by presenting them with four<br />
groups <strong>of</strong> plants. (1) I tested phylogenetic restrictions in host range by <strong>of</strong>fering plant species out <strong>of</strong> the<br />
same genus, the same family and other families than the original host-plant belonged to (i.e. where they<br />
were observed on). To test for constraints in habitat selection connected to food digestibility and<br />
availability, I presented <strong>phasmids</strong> (2) with persistent and pioneer plant species representing the forest<br />
understory and forest edges or gaps, and (3) with a selection <strong>of</strong> 10 <strong>of</strong> the most abundant tree species on<br />
BCI (>1000 ind.*50 ha -1 ; Condit et al. 1998). (4) The validity <strong>of</strong> the assessed host range was tested by<br />
<strong>of</strong>fering a random selection <strong>of</strong> plant species.<br />
2.2 Materials and methods<br />
For details on study site and the maintenance <strong>of</strong> lab populations please refer to Chapter 1.<br />
2.2.1 Line-transects<br />
To describe diversity, distribution and population densities <strong>of</strong> phasmid species in forest understory<br />
versus forest edge habitats, I collected data along line-transects from May 2000 to July 2001. I<br />
established 3 line-transects <strong>of</strong> 80 m length each in the forest understory and at forest edges (for locations
Community structure & host range 12<br />
see Figure 1-2). Transects were monitored at night every two weeks. The vegetation was scanned with<br />
headlamps up to 2 m heights and in a one-sided width <strong>of</strong> about 2 m from the line center (to both sides in<br />
the understory and to one side at the forest edge). Phasmids were classified to morphotypes, and<br />
released again after body length was measured.<br />
2.2.2 No-choice feeding trials<br />
To estimate breadth and overlap <strong>of</strong> the realized niches <strong>of</strong> phasmid species I recorded all plants on which<br />
<strong>phasmids</strong> were found along line-transects. As observations <strong>of</strong> feeding in the field were rare, all plant<br />
records were treated as potential host plants. These plant species were then tested in subsequent nochoice<br />
feeding trials.<br />
To determine diet breadth (sensu absolute food niche) phasmid adults and nymphs were presented with<br />
leaves from alternative plant species in a no-choice design. Adult leaves were harvested in the forest,<br />
placed in a sealed plastic zip log bag and brought back to the laboratory. Within 2 hours <strong>of</strong> being<br />
collected leaves or leaf discs were presented to <strong>phasmids</strong>. Feeding trials were conducted in a screened<br />
room subject to ambient conditions. According to the size <strong>of</strong> the animals, plastic containers <strong>of</strong> different<br />
sizes were used as trial arenas. The lid <strong>of</strong> such arenas was screened to allow for ambient conditions.<br />
Each plant species was tested with a minimum <strong>of</strong> three M. diocles individuals. Adult <strong>phasmids</strong> and large<br />
nymphs (instars five and six) were presented with whole leaves. Leaves were <strong>of</strong>fered with water supply<br />
by sticking the petiole in a water-filled vial and fastening it with Cotton. Small nymphs (instars one to<br />
four) were <strong>of</strong>fered leaf discs (punch <strong>of</strong> 13 mm diameter) that were stuck into a piece <strong>of</strong> cardboard to<br />
assure free access for the nymph. A piece <strong>of</strong> humid paper towel helped minimizing desiccation. Feeding<br />
trials began in the late afternoon and lasted 24 hours. In cases where the leaf received only a few bites or<br />
was not eaten at all, it was considered inedible (see for comparison Barone 1998). As soon as one<br />
phasmid individual obviously had fed on a leaf, the according plant species was recorded as edible. In<br />
general, <strong>phasmids</strong> fed on leaves in a measurable way. If a leaf was left untouched while a nymph had<br />
moulted, the trial was discarded.<br />
Four different groups <strong>of</strong> plants were <strong>of</strong>fered to the four phasmid species maintained in the laboratory:<br />
(1) potential host plants, i.e. plant species where <strong>phasmids</strong> were found on in the field; (2) congeners and<br />
confamilials <strong>of</strong> the plant species that were proven edible; (3) a selection <strong>of</strong> 10 <strong>of</strong> the most abundant tree<br />
species on BCI (>1000 ind.*50 ha -1 ; Condit et al. 1998); (4) a random selection <strong>of</strong> plant species from<br />
forest understory and forest edge. For the latter, I asked field botanists on BCI to bring leaves <strong>of</strong> a<br />
random plant species back to the lab.<br />
2.2.3 Data analysis<br />
2.2.3.1 Estimating phasmid community parameters<br />
A list <strong>of</strong> phasmid species on BCI was achieved by means <strong>of</strong> all available field records (i.e. line-transect<br />
and collection records). Field records besides line-transect data have not been used for analysis <strong>of</strong>
Community structure & host range 13<br />
phasmid community structure (e.g., niche breadth or niche overlap) for three reasons: 1) these data were<br />
biased towards collection on specific host plants and hence towards focal phasmid species; 2) rare<br />
phasmid species were underrepresented in these field records; and 3) species abundances would be<br />
underestimated because <strong>of</strong> the collection (i.e., removal) <strong>of</strong> specimens from the community. To calculate<br />
relative abundances <strong>of</strong> phasmid species data from line-transects in the understory and at forest edges<br />
were pooled (for each habitat per monitor date) due to too many zero counts, especially in the<br />
understory.<br />
This data also built the pool for the calculation <strong>of</strong> diversity, eveness and similarity <strong>of</strong> phasmid<br />
communities for the specific habitat. All measures <strong>of</strong> community structure were based on methods<br />
described by Krebs (1989). To facilitate comparison among studies, I decided to use the most common<br />
measures (applicability to the dataset presupposed).<br />
Similarity in species composition between habitats was calculated with the index <strong>of</strong> Morisita Cλ:<br />
Equation 2-1<br />
C<br />
λ<br />
2<br />
= ∑<br />
n<br />
X<br />
ij<br />
X<br />
ik<br />
( λ1<br />
+ λ2<br />
) N j N k<br />
where Cλ = Morisita’s index <strong>of</strong> similarity between samples j and k<br />
Xij, Xik = Number <strong>of</strong> individuals <strong>of</strong> species i in samples j and k<br />
Nj, Nk = ∑Xij, ∑Xik = Total number <strong>of</strong> individuals in sample j and in sample k respectively<br />
[ X ij ( X ij −1)<br />
]<br />
( N −1)<br />
1 = ∑<br />
n<br />
λ and<br />
N<br />
j<br />
j<br />
2 = ∑<br />
n<br />
λ<br />
N<br />
[ X ik ( X ik −1)<br />
]<br />
( N −1)<br />
The Morisita index <strong>of</strong> similarity is a quantitative measure for similarity and ranges from 0 for no<br />
similarity in species composition to 1 for identical species composition.<br />
Species diversity and eveness were calculated on the base <strong>of</strong> the Shannon-Wiener Function:<br />
Equation 2-2<br />
H<br />
'<br />
=<br />
s<br />
∑<br />
i=<br />
1<br />
( p )(log<br />
i<br />
2<br />
where H’ = Index <strong>of</strong> species diversity measured by the Shannon–Wiener function<br />
s = Number <strong>of</strong> species<br />
pi = Proportion <strong>of</strong> total sample belonging to the species i<br />
The Shannon–Wiener index <strong>of</strong> species diversity expresses the uncertainty <strong>of</strong> predicting the species <strong>of</strong><br />
the next individual sampled. Thus if H’ = 0 then all individuals in a sample belong to one species. H’ is<br />
increasing with the number <strong>of</strong> species in a sample and with increasing eveness <strong>of</strong> these species. The<br />
most common approach to measure eveness is to scale the observed index <strong>of</strong> species diversity relative to<br />
its maximum value when each species in the sample is represented by the same number <strong>of</strong> individuals.<br />
In case <strong>of</strong> the Shannon Wiener Function maximum diversity occurs when p = 1/S and can be calculated<br />
as:<br />
Equation 2-3<br />
'<br />
H MAX =<br />
log 2<br />
S<br />
p )<br />
i<br />
k<br />
k
Community structure & host range 14<br />
where H’MAX = Maximum possible value <strong>of</strong> the Shannon-Wiener Function<br />
S = Number <strong>of</strong> species in the community<br />
Eveness ranges from 0 to 1. Generally all eveness measures are overestimated (see Krebs 1989) as they<br />
assume that the total number <strong>of</strong> species in the community is known. However, in the presented study<br />
this problem may be <strong>of</strong> minor importance as the phasmid community in forest understory and at forest<br />
edges was sampled excessively.<br />
On the base <strong>of</strong> line-transect data I calculated population density <strong>of</strong> the phasmid community and in<br />
particular population density <strong>of</strong> M. diocles for forest understory and forest edges separately. Generally<br />
population densities from line-transect data can be calculated as described by Krebs (1989):<br />
Equation 2-4<br />
n<br />
D =<br />
2La<br />
where D = Density <strong>of</strong> animals per unit area<br />
n = Number <strong>of</strong> animals seen on transect<br />
L = Length <strong>of</strong> transect<br />
a = Constant that describes the probability <strong>of</strong> detecting an animal<br />
The estimation <strong>of</strong> the detection probability a affords knowledge <strong>of</strong> sighting distance and angle for each<br />
animal measured from the transect line. These parameters could not be assessed because for detection <strong>of</strong><br />
nymphs the undersides <strong>of</strong> leaves had to be searched and therefore I had to leave the central transect<br />
lines. Consequently, I simplified the calculation <strong>of</strong> density by assuming that detection probability was 1<br />
(i.e., all animals were found) and thereby that ‘a’ was negligible (density estimates based on numbers <strong>of</strong><br />
observed animals solely are sometimes referred to as apparent density; Krebs 1989). This assumption<br />
may have lead to an underestimation <strong>of</strong> densities, as it was likely that animals were missed. Further, I<br />
accounted for the fact that in the understory line-transects were searched on both sides while at forest<br />
edges they were sampled one-sided facing the forest (width <strong>of</strong> 2 m). Accordingly, in transects <strong>of</strong> 80 m<br />
length, the corresponding searching area in the understory was 320 m 2 versus 160 m 2 at forest edges.<br />
These modifications led to the calculation <strong>of</strong> population densities by:<br />
n<br />
n<br />
D = for forest understory, and D = for forest edges,<br />
2Lw<br />
1Lw<br />
where w is the one-sided monitored width <strong>of</strong> the transect.<br />
Resulting phasmid densities (ind.*m -2 ) for transects were averaged on habitat level per monitor date (28<br />
monitoring dates and three transects per habitat). To allow for comparison I extrapolated densities to the<br />
base <strong>of</strong> number <strong>of</strong> individuals per hectare searching area (ind.*ha -1 ).<br />
Under the assumption that <strong>phasmids</strong> would show a pronounced seasonal pattern in densities, I expected<br />
higher densities <strong>of</strong> <strong>phasmids</strong> (and particularly <strong>of</strong> nymphs) in the early rainy season. Seasonal variation<br />
in abundances for nymphs and adults was compared on the base <strong>of</strong> cumulative absolute abundances on a<br />
monthly scale. As data for the forest understory were few, I only analyzed abundances in forest edges.<br />
Data for November 2000 and July 2001 were excluded from the analysis, because only one monitor date
Community structure & host range 15<br />
was available for each <strong>of</strong> these months. I tested for temporal heterogeneity <strong>of</strong> absolute abundances by<br />
comparing observed and expected abundances in Chi-Square Goodness-<strong>of</strong>-Fit Tests (GOF). Although<br />
data for phasmid abundances may not be independent, e.g. because <strong>of</strong> contagiousness, GOF analysis is<br />
appropriate if the user is only interested in heterogeneity or homogeneity (Fowler et al. 1998).<br />
2.2.3.2 Estimating niche dimensions and overlap<br />
As one dimension <strong>of</strong> niche breadth, I assessed diet breadth using the potential food resources (i.e. plant<br />
families) registered along line-transects. Because none <strong>of</strong> the four tested phasmid species was<br />
specialized below the family level, all niche measures were expressed on the plant family level, i.e. each<br />
potential host plant family represented a resource state. As measure for uniformity <strong>of</strong> distribution <strong>of</strong><br />
individuals among the resource states I used Levin’s standardized measure <strong>of</strong> niche breadth BA:<br />
Equation 2-5<br />
B A<br />
B −1<br />
=<br />
n −1<br />
where BA = Levin’s standardized niche breadth<br />
B = Levin’s measure <strong>of</strong> niche breadth<br />
state j<br />
n = Number <strong>of</strong> possible resource states<br />
1<br />
B with pj = Proportion <strong>of</strong> individuals found in resource<br />
= 2<br />
p j<br />
∑<br />
Levin’s standardized measure <strong>of</strong> niche breadth ranges from 0 to 1. BA is maximal when a species does<br />
not discriminate among resource states.<br />
Overlap in the use <strong>of</strong> food niches among phasmid species was calculated by Pianka’s measure <strong>of</strong> niche<br />
overlap Ojk:<br />
Equation 2-6<br />
O<br />
jk<br />
=<br />
n<br />
∑ pij<br />
p<br />
2<br />
∑ pij∑<br />
where Ojk = Pianka’s measure <strong>of</strong> niche overlap between species j and species k<br />
pij = Proportion resource i is <strong>of</strong> the total resources used by species j<br />
pik = Proportion resource i is <strong>of</strong> the total resources used by species k<br />
Pianka’s measure <strong>of</strong> niche overlap ranges from 0 (complete separation <strong>of</strong> niches) to 1 (complete<br />
overlap).<br />
To describe overlap between realized food niche (i.e. potential host plant families from line-transects)<br />
and absolute food niche (i.e. plant families accepted in feeding-trials) I used Sørensen’s coefficient <strong>of</strong><br />
similarity SS:<br />
Equation 2-7<br />
SS<br />
2a<br />
=<br />
2a<br />
+ b + c<br />
where SS = Sørensen’s similarity coefficient<br />
a = Number <strong>of</strong> plant families recorded in line-transect and accepted in feeding-trials<br />
b = Number <strong>of</strong> plant families only recorded in line-transect records but not accepted in feeding-trials<br />
ik<br />
p<br />
2<br />
ik
Community structure & host range 16<br />
c = Number <strong>of</strong> plant families only accepted in feeding-trials but not recorded in line-transects<br />
Sørensen’s similarity coefficient is a qualitative measure usually used for matches in species<br />
composition between samples. As feeding-trials result in qualitative data (edible vs. inedible) this<br />
coefficient is also applicable to measure qualitative overlap between realized and absolute food niche.<br />
Sørensen’s similarity coefficient weighs matches more heavily than mismatches and thereby accounts<br />
for the fact that mismatches were over represented both 1) in line-transect data, as all recorded plant<br />
species were considered as potential host plants and 2) in feeding trials, as not all tested plant species<br />
that were edible occurred in line-transects.<br />
2.3 Results<br />
2.3.1 Phasmid diversity and density<br />
In 15 months <strong>of</strong> line-transect monitoring I recorded 307 specimens representing 11 phasmid species<br />
(Table 2-1). The species accumulation curve from line-transect records reached an asymptote after four<br />
months (Figure 2-1) suggesting that the phasmid fauna <strong>of</strong> forest edge and understory habitats was<br />
sampled adequately. This was supported by the fact that in field records other than along line-transects<br />
only one additional phasmid species was found (Pseudophasma menius; Table 2-1). One species<br />
(Otocrania sp.) has not been previously reported for Panamá (compare to Appendix 1).<br />
The local phasmid fauna was dominated by four common species comprising more than 89 % <strong>of</strong> the<br />
sampled specimens (Figure 2-2). Seven phasmid species were found in low numbers <strong>of</strong> 10 or less<br />
individuals. One <strong>of</strong> these species was represented by a singleton (Stratocles multilineatus).<br />
Line-transect data uncovered a clear spatial separation in the community structure. Diversity in phasmid<br />
species was higher in forest edges compared to the forest understory (Table 2-1). This higher diversity<br />
resulted from higher species richness and higher eveness along forest edges. The data indicate that<br />
<strong>phasmids</strong> were mainly restricted to forest edge habitats; ten out <strong>of</strong> eleven species and 93 % <strong>of</strong> the<br />
recorded individuals occurred here. In the forest understory <strong>phasmids</strong> were rare and singletons<br />
represented three out <strong>of</strong> four species. Only Metriophasma diocles was found regularly and comprised<br />
86 % <strong>of</strong> the recorded specimens in the understory. As this habitat was poor in species and in individuals,<br />
similarity <strong>of</strong> phasmid communities between forest understory and forest edge was low (demonstrated by<br />
Morisita’s similarity index Cλ = 0.25; Table 2-1). Phasmid density was 35 times higher in forest edge<br />
habitats than in the understory (Table 2-1). Analogous population density for M. diocles was lower in<br />
the understory than at forest edges. While absolute abundances doubled population density trebled from<br />
6.7 ind.*ha -1 in the understory to 21.6 ind.*ha -1 at forest edges after adjusting for size <strong>of</strong> the sampled<br />
area (with a respective total area searched <strong>of</strong> 0.096 and 0.048 ha).
Community structure & host range 17<br />
no. <strong>of</strong> species<br />
11<br />
10<br />
9<br />
8<br />
7<br />
6<br />
5<br />
4<br />
3<br />
2<br />
1<br />
0<br />
Mar-<br />
00<br />
May-<br />
00<br />
Jun-<br />
00<br />
Aug-<br />
00<br />
Oct-<br />
00<br />
Nov-<br />
00<br />
Jan-<br />
01<br />
Feb-<br />
01<br />
Apr-<br />
01<br />
Figure 2-1: Species accumulation curve for <strong>phasmids</strong> recorded along line-transects on BCI (May 2000 to July<br />
2001; N = 307).<br />
relative abundance [%]<br />
40<br />
35<br />
30<br />
25<br />
20<br />
15<br />
10<br />
5<br />
0<br />
Oncotophasma<br />
martini<br />
Isagoras<br />
dentipes<br />
Bacteria<br />
ploiaria<br />
Metriophasma<br />
diocles<br />
species<br />
Otocrania<br />
sp.<br />
Figure 2-2: Relative abundances <strong>of</strong> phasmid species at forest edges (white bars) and in the forest understory<br />
(black bars) <strong>of</strong> BCI (line-transect data; N = 307).<br />
2.3.2 Seasonality<br />
Absolute abundances <strong>of</strong> <strong>phasmids</strong> along forest edges were temporally heterogeneous (Figure 2-3) as<br />
demonstrated by comparison <strong>of</strong> cumulative frequencies per month (GOF, χ 2 = 40.17, df = 12, p < 0.01).<br />
This temporal heterogeneity in phasmid abundances held for phasmid adults (GOF, χ 2 = 40.25, df = 12,<br />
p < 0.01) but not for nymphs (GOF, χ 2 = 18.45, df = 14, p > 0.05). Heterogeneity largely resulted for<br />
Jun-<br />
01<br />
Jul-<br />
01
Community structure & host range 18<br />
adults from highest abundances in May and June 2000 (each with 18 ind.). Because such extremes in<br />
abundances covered seasonal effects, a potential increase in abundances from dry season (January to<br />
April) to the rainy season (from May on) was tested from for the year 2001: there was no detectable<br />
heterogeneity in phasmid abundances (for all specimens: GOF, χ 2 = 4.55, df = 5, p > 0.05; for phasmid<br />
nymphs: GOF, χ 2 = 5.03, df = 5, p > 0.05; for phasmid adults: GOF, χ 2 = 10.25, df = 5, p > 0.05).<br />
Table 2-1: Phasmid species and their community structure on BCI (absolute numbers <strong>of</strong> individuals in subscript;<br />
line transect data, N = 307).<br />
Phasmid species Habitat<br />
Bacteria ploiaria (WESTWOOD) +53<br />
Bacteria sp.* +10<br />
Isagoras dentipes REDTENBACHER +68<br />
Forest edge Understory<br />
Metriophasma diocles WESTWOOD +33 +18<br />
Oncotophasma martini (GRIFFINI) +103 +1<br />
Otocrania sp.* +3<br />
Prisopus berosus WESTWOOD +4<br />
Pterinoxylus spinulosus REDTENBACHER +8<br />
Stratocles multilineatus REHN +1<br />
Diapheromerini: Phanocles group* +2<br />
Metriophasma iphicles* REDTENBACHER +2 +1<br />
Pseudophasma menius (WESTWOOD) not found in line-transects<br />
Shannon Wiener Diversity H’<br />
Overall (forest edge & understory) 2.47<br />
Per habitat 2.40 0.78<br />
Shannon Wiener Eveness J’<br />
Morisita’s Similarity Cλ<br />
Phasmid density [ind*ha -1 ] ± SD<br />
0.69<br />
0.72 0.39<br />
All phasmid species 274.92 ± 211.48 7.81 ± 14.07<br />
Metriophasma diocles. 21.58 ± 43.36 6.70 ± 11.42<br />
* until submission no type material was available, therefore identification should be considered as preliminary<br />
0.24
Community structure & host range 19<br />
Absolute abundance [ind.]<br />
40<br />
35<br />
30<br />
25<br />
20<br />
15<br />
10<br />
5<br />
0<br />
Nymphs Adults<br />
May-00<br />
Jun-00<br />
Jul-00<br />
Aug-00<br />
Sep-00<br />
Oct-00<br />
Nov-00<br />
Dec-00<br />
Jan-01<br />
Feb-01<br />
Mar-01<br />
Apr-01<br />
May-01<br />
Jun-01<br />
Jul-01<br />
Figure 2-3: Temporal fluctuations <strong>of</strong> absolute phasmid abundances along forest edges on BCI for phasmid<br />
nymphs (black bars) and phasmid adults (white bars). Each bar represents the cumulative catch per month along<br />
three line-transects (N = 286). Please note that Oct. 2000 and Jul. 201 were excluded from GOF tests.<br />
2.3.3 Food niche<br />
Single phasmid species showed a highly aggregated distribution on particular host plant families<br />
resulting in narrow resource niches with values for Levin’s standardized niche breadth BA ranging from<br />
0 (Otocrania sp.) to 0.40 (Bacteria ploiaria) (Table 2-2). For example, the low niche breadth <strong>of</strong> 0.10 for<br />
I. dentipes (the second most abundant species in forest edge habitats; cf. Figure 2-1) resulted from 68<br />
specimens recorded on two plant families, and 91 % <strong>of</strong> these specimens were found on two individuals<br />
<strong>of</strong> Vismia baccifera (Clusiaceae). All three individuals <strong>of</strong> Otocrania sp. were found on Sapindaceae.<br />
Niche breadth was larger in the other three species because they were recorded on more plant families<br />
and individuals were less aggregated (major proportion <strong>of</strong> individuals per plant family: O. martini, 55 %<br />
on Clusiaceae, 18 % on Euphorbiaceae; B. ploiaria, 34 % on Rhamnaceae; M. diocles, 49 % on<br />
Piperaceae,and one third <strong>of</strong> these on P. marginatum, 25 % on Araceae).<br />
Generally, resource niches <strong>of</strong> phasmid species were separated as demonstrated by Pianka’s index <strong>of</strong><br />
niche overlap Ojk, usually ranging from 0 to 0.19. In contrast, niche overlap between O. martini and<br />
I. dentipes was high (Ojk = 0.91) because 55 % <strong>of</strong> the O. martini and 91 % <strong>of</strong> the I. dentipes individuals<br />
shared 2 individuals <strong>of</strong> Vismia baccifera as food resource (cf. Table 2-2).
Community structure & host range 20<br />
Table 2-2: Niche breadth and niche overlap <strong>of</strong> four common and one rare (Otocrania sp.) phasmid species on BCI<br />
based on individuals recorded on potential host plant families in line-transects (N = 279).<br />
Levin’s standardized niche<br />
breadth BA<br />
No. <strong>of</strong> phasmid individuals<br />
recorded on plants<br />
Oncotophasma<br />
martini<br />
Bacteria<br />
ploiaria<br />
Metriophasma<br />
diocles<br />
Otocrania<br />
sp.<br />
Isagoras<br />
dentipes<br />
0.31 0.40 0.33 0 0.10<br />
104 53 51 3 68<br />
No. <strong>of</strong> potential host plant families 5 7 6 1 2<br />
Pianka’s niche overlap Ojk<br />
Oncotophasma martini 0.27 0.17 0.01 0.91<br />
Bacteria ploiaria 0.18 0.19 0.03<br />
Metriophasma diocles 0.17 0.08<br />
Otocrania sp. 0<br />
no. <strong>of</strong> plant families<br />
10<br />
9<br />
8<br />
7<br />
6<br />
5<br />
4<br />
3<br />
2<br />
1<br />
0<br />
0.5 0.7<br />
Oncotophasma martini Bacteria ploiaria Metriophasma diocles Otocrania sp.<br />
host plant families accepted in feeding trials plant families in both (overlap)<br />
potential host plant families recorded in line-transects<br />
Figure 2-4: Number <strong>of</strong> plant families composing realized (potential host plant families recorded along line-<br />
transects) and absolute dimension <strong>of</strong> the food niche (host plant families accepted in feeding trials) <strong>of</strong> selected<br />
phasmid species. The overlap between realized and absolute food niche is expressed by Sørensen’s index <strong>of</strong><br />
Similarity SS (values given above the bars). Note that this index does not weigh relative use <strong>of</strong> host plant families.<br />
0.5<br />
1
Community structure & host range 21<br />
Observed resource niches only partly represented food niches, as potential food plant families from linetransect<br />
records (i.e. the realized niche) did not completely overlap with edible plant families from<br />
feeding trials (i.e. the absolute food niche; Figure 2-4). The overlap between the two niche types ranged<br />
from 0.50 to 1.00 (expressed as Sørensen index <strong>of</strong> similarity, Figure 2-4). None <strong>of</strong> the four focal<br />
phasmid species was specialized beyond the plant family level. However, Otocrania sp. exclusively fed<br />
on plant species <strong>of</strong> the Sapindaceae and M. diocles was clearly restricted to Araceae and Piperaceae<br />
(Table 2-3). Generally, plant families that were recorded as preferred resources along line-transects (see<br />
above) proved to be edible to the according phasmid species. But for the tested phasmid species the<br />
palatability <strong>of</strong> plants was not consistent in-between the taxonomic borders <strong>of</strong> plant families (i.e., not all<br />
confamilial plant species tested were edible, cf. Table 2-3).<br />
The focal phasmid species had distinct diets (Table 2-3). In contrast to the plant records from linetransects<br />
(see Table 2-2), the food niches resulting from feeding trials did not overlap (Table 2-3). Only<br />
B. ploiaria shared one host plant family each with O. martini and Otocrania sp.. Nonetheless, plant life<br />
form <strong>of</strong> palatable species corresponded with the preferred habitat <strong>of</strong> phasmid species. O. martini,<br />
B. ploiaria and Otocrania sp. fed exclusively on pioneer tree species and lianas. Whereas the diet <strong>of</strong><br />
M. diocles, the only phasmid species with considerable occurrence in the forest understory (cf. Table 2-<br />
1), contained herbs, shrubs and hemiepiphytes, which are characteristic elements <strong>of</strong> this habitat. None <strong>of</strong><br />
the four phasmid species fed neither on any <strong>of</strong> ten highly abundant tree species <strong>of</strong> BCI which<br />
represented eight plant families, nor did they feed on any <strong>of</strong> 13 randomly selected plant species out <strong>of</strong><br />
12 plant families (cf. Table 2-3).
Community structure & host range 22<br />
Table 2-3: Dimensions <strong>of</strong> the food niche <strong>of</strong> four <strong>phasmids</strong> on BCI. Results from feeding trials represent the<br />
absolute food niche, while overlap with field records (i.e. the realized multidimensional niche) represents the<br />
realized food niche.<br />
Family<br />
Plant<br />
Order<br />
Species lf 1<br />
ab 2<br />
Food plant species<br />
Metriophasma<br />
ft 3<br />
diocles<br />
lt 4<br />
Oncotophasma<br />
martini<br />
Bacteria<br />
ploiaria<br />
Otocrania<br />
sp.<br />
ft lt ft lt ft lt<br />
Araceae Philodendron spp. + + - - -<br />
Araceae Dieffenbachia spp. he + + nt nt nt<br />
Araceae Homalomena wendlandii he + nt nt nt<br />
Araceae Monstera sp. h + nt nt nt<br />
Piperaceae Peperomyia spp. he + nt nt nt<br />
Piperaceae Piper spp. + + nt nt nt<br />
Piperaceae Piper cordulatum ls 28 + - - -<br />
Clusiaceae Vismia spp. pi - + - -<br />
Clusiaceae Vismia baccifera pi 164 - + + + - -<br />
Dilleniaceae Tetracera portobellensis l - + + -<br />
Euphorbiaceae Croton billbergianus pi 48 - + + + - +<br />
Malpighiaceae Stigmatophylon ellipticum l - + - nt<br />
Melastomataceae Miconia argentea pi 52 - + - -<br />
Sterculiaceae Byttneria aculeata l - + + + nt<br />
Sterculiaceae Guazuma ulmifolia pi 187 - nt + nt<br />
Bignoniaceae Arrabidaea spp. l - + - + + -<br />
Rhamnaceae Gouania lupuloides l - - + + + -<br />
Tiliaceae Luehea semanii pi 113 - - + + -<br />
Melastomataceae Mouriri myrtilloides ls 6 nt nt + nt<br />
Sapindaceae Paullinia spp. l - - + +<br />
Sapindaceae Serjania spp. l - - + + + + +<br />
Urticaceae Urera sp. - + nt nt nt<br />
Vitaceae Vitis tiliifolia l nt - - + nt<br />
Abundant tree species on BCI (>1000 ind./50ha) 2<br />
Violaceae Hybanthus prunifolius ls 1 - - - -<br />
Rubiaceae Alseis blackiana ls 5 - - - -<br />
Rubiaceae Psychotria horizontalis ls 7 - - - -<br />
Chrysobalanaceae Hirtella triandra ls 8 - - - -<br />
Burseraceae Tetragastris panamensis ls 10 - - - -<br />
Burseraceae Protium tenuifolium ls 14 - - - -<br />
Bombacaceae Quararibea asterolepis ls 20 - - - -
Community structure & host range 23<br />
Plant<br />
Order<br />
Family<br />
Species lf 1<br />
ab 2<br />
Metriophasma Oncotophasma Bacteria Otocrania<br />
diocles martini ploiaria sp.<br />
ft 3<br />
lt 4<br />
ft lt ft lt ft lt<br />
Moraceae Poulsenia armata ls 23 - - - -<br />
Fabaceae Prioria copaifera ls 36 - - - -<br />
Apocynaceae Tabernaemontana arborea pi 37 - - - -<br />
Random species<br />
Anacardiaceae Anacardium excelsum ls 208 - - - -<br />
Annonaceae Annona spraguei pi 135 - - - -<br />
Bignoniaceae Jacaranda copaia pi 102 - - - -<br />
Bombacaceae Ochroma pyramidale pi 246 - - - -<br />
Bombacaceae Pseudobombax septenatum pi 221 - - - -<br />
Euphorbiaceae Hyeronima laxiflora pi nt - nt nt<br />
Flacourtiaceae Hasseltia floribunda ls 56 - - - -<br />
Gesneriaceae Codonanthe crassifolia ls - nt nt nt<br />
Mimosoideae Inga quaternata l 65 nt nt - -<br />
Moraceae Cecropia obtusifolia pi 189 - - - -<br />
Myristicaceae Virola surinamensis ls 109 - - - nt<br />
Orchidaceae Catasetum viridifloris e - nt nt nt<br />
Papilionoideae Dipteryx panamensis ls 185 - - - -<br />
1<br />
lf = life-form: e = epiphyte, h = hemiepiphyte, he = herb, l = liana, ls = plant <strong>of</strong> late succession, pi = plant <strong>of</strong> early succession<br />
2<br />
ab = abundance: species rank <strong>of</strong> absolute abundance in the 50 ha plot on BCI according to Condit et al. (1998)<br />
3<br />
ft = feeding trial: + = edible, - = not edible, nt = not tested;<br />
4<br />
lt = line-transect: + = phasmid species was recorded on plant species
Community structure & host range 24<br />
2.4 Discussion<br />
This study is the first to demonstrate diversity and distributional patterns <strong>of</strong> the phasmid community <strong>of</strong> a<br />
tropical rainforest. The phasmid community <strong>of</strong> BCI was poor in species and in density. Spatially<br />
<strong>phasmids</strong> were largely restricted to forest edge habitats resulting in higher diversity and density<br />
compared to the forest understory. While phasmid abundances varied throughout the study period, no<br />
seasonal effect on phasmid abundance was detectable. The distribution pattern <strong>of</strong> phasmid species was<br />
clearly linked to restrictions in their host range that seemed to reflect the successional status <strong>of</strong> host<br />
plant species.<br />
2.4.1 Phasmid diversity, density, and distribution<br />
With a total <strong>of</strong> 12 species, the phasmid community <strong>of</strong> Barro Colorado Island was expectedly low in<br />
species richness. Worldwide, the order Phasmatodea contains about 3000 described species that occur<br />
mainly in tropical regions (Whiting et al. 2003) and is species poor compared to other insect orders that<br />
are highly diverse in herbivores like Lepidopterans, Coleopterans, and - to a lower extent –<br />
Orthopterans. For example, on BCI there are approximately 274 species <strong>of</strong> true butterfly (Lepidoptera,<br />
Papilionoidea; DeVries 1994) and 250 species <strong>of</strong> katydids (Orthoptera, Tettigoniidae; A. Lang,<br />
unpublished data). I found reports <strong>of</strong> 42 phasmid species occurring in Panamá (see Appendix 1 for<br />
species and references) where<strong>of</strong> BCI accommodates 26 %; plus one species not formerly reported from<br />
Panamá (Otocrania sp.). Analysis <strong>of</strong> collection records (Windsor, Aiello, Berger, unpublished data)<br />
indicates that Gamma-Diversity in Panamá is high with discrete regions giving shelter to different<br />
phasmid species. Together with the fact that I recorded all but one species previously reported from BCI<br />
(Trychopeplus laciniatus; Aiello, unpublished data) I am confident that I assessed the phasmid<br />
community adequately.<br />
I showed that forest edges and gaps represented important habitats to the majority <strong>of</strong> phasmid species on<br />
BCI. In contrast, the forest understory seemed to provide a suitable habitat for M. diocles only. Higher<br />
abundance <strong>of</strong> insect herbivores in gaps is <strong>of</strong>ten inferred from higher herbivore damage on gap-adapted<br />
versus understory plant species (Coley 1980, 1982, 1983; Coley & Barone 1996). Smiley (1978) found<br />
that Heliconius butterflies were more abundant in young successional than in understory habitats<br />
(Table 2-3). My results support this pattern on the phasmid community and species level. In forest edges<br />
phasmid density was 35 times, and M. diocles density three times higher than in the understory (cf.<br />
Table 2-1). Low densities <strong>of</strong> <strong>phasmids</strong> in the BCI forest understory correspond with Elton (1973) who<br />
found low total arthropod densities <strong>of</strong> 0.92 ind.*m -3 in the same habitat (18400 ind.*ha -1 , extrapolated<br />
on two meter height; Table 2-4).
Community structure & host range 25<br />
Table 2-4: Densities <strong>of</strong> <strong>phasmids</strong>, insects, and arthropods in the understory and in gaps/forest edges <strong>of</strong> neotropical<br />
rainforests and one temperate forest.<br />
Region Habitat Density<br />
Neotropical,<br />
Panamá<br />
Puerto Rico gap<br />
[ind.*ha -1 ]<br />
Studied organisms Reference<br />
understory 7.8<br />
Phasmatodea<br />
presented study<br />
forest edge 274.9<br />
understory 6.7<br />
Metriophasma diocles<br />
forest edge 21.5<br />
(Phasmatodea)<br />
understory 18000 arthropods Elton 1973 1<br />
understory<br />
gap<br />
gap<br />
3520 – 6460<br />
2111.1<br />
351.7<br />
57.55<br />
Lamponius portoricensis<br />
(Phasmatodea)<br />
Agamemnon iphemedeia<br />
(Phasmatodea)<br />
Willig et al. 1986 1&2<br />
Willig et al. 1993 1<br />
Willig & Camilo 1991 1<br />
Costa Rica understory 0.5 - 1.5 Heliconius cydno Smiley 1978<br />
gap 1.4 – 5.0 H. hecale & H. erato<br />
(Lepidoptera)<br />
understory 160000 arthropods Janzen & Schoener 1968 1<br />
Guyana understory,<br />
seedling<br />
foliage<br />
Temperate,<br />
Switzerland<br />
understory,<br />
foliage<br />
Density<br />
[ind*m -2 ]<br />
2.4 insects Basset 1999 3<br />
19 - 78 insects Basset & Burckhardt 1992 3<br />
1<br />
to allow for better comparison density estimates per ha were extrapolated from published data<br />
2<br />
the authors used different calculation methods on their dataset resulting in variation <strong>of</strong> density estimates<br />
3<br />
densities in these studies are based on sampled foliage area and thus could not be extrapolated<br />
Surprisingly, empirical studies assessing arthropod or insect densities <strong>of</strong> rainforest edge/gap and<br />
understory habitat types are rare (for references see Table 2-4), not to mention comparisons <strong>of</strong> densities<br />
between habitats (Smiley 1978). Largely, existing studies focus on the understory including several<br />
feeding guilds, or they refer to sampled leaf area and are therefore <strong>of</strong> restricted comparability (cf.<br />
Table 2-4). In addition, densities are site dependant and may enormously differ in magnitude over time<br />
(Table 2-4). For example, densities <strong>of</strong> the Puerto Rican phasmid Lamponius portoricensis in gaps varied
Community structure & host range 26<br />
tenfold between studies within the same forest (Willig et al. 1986; Willig & Camilo 1991; Table 2-4). In<br />
comparison, density <strong>of</strong> L. portoricensis in the understory was similar to higher estimates for gaps<br />
(Willig et al. 1993; Table 2-3). While L. portoricensis seems to be an abundant herbivore that is not<br />
clearly restricted in the use <strong>of</strong> different habitat types, my results showed that <strong>phasmids</strong> on BCI are<br />
comparably rare and preferably occur in forest edge habitats.<br />
Are these results representative for the whole forest? BCI may harbor higher phasmid abundances and<br />
diversity than presented in this study because I may have missed species living in the upper canopy.<br />
Arthropod densities are generally known to be high in the forest canopy. For example, Leigh (1999,<br />
p. 165) lists data for insect densities in tropical forest canopies ranging from 32 to 161 ind.*m -2 ,<br />
exceeding the numbers presented in Table 2-3 for understory and edge/gap habitats. Based on empirical<br />
studies, the forest canopy also is thought to give shelter to the majority <strong>of</strong> insect species in tropical<br />
rainforests (Erwin 1982; Ødegard 2000; Novotny et al. 2002a). This may well be true for <strong>phasmids</strong> on<br />
BCI. However, the forest canopy also is a largely hostile habitat to insect herbivores: it is hotter, drier<br />
and windier than the understory (Lowman 1985), and sun leaves are smaller, tougher, and have higher<br />
phenolic contents than do shade leaves (Lowman 1985; Coley & Barone 1996). Such climatic and<br />
nutritious constraints could negatively influence phasmid presence in the canopy. Furthermore, the<br />
studied phasmid species rejected all additionally tested late successional plant species in feeding trials<br />
(selection <strong>of</strong> most abundant and random species; cf. Table 2-3). Even though only part <strong>of</strong> these plants<br />
represented canopy trees, this suggests that including the upper canopy may not involve an increase in<br />
abundances <strong>of</strong> the focal phasmid species <strong>of</strong> this study.<br />
2.4.2 Seasonality<br />
Unlike for other arthropods, phasmid abundances were not higher at the beginning <strong>of</strong> the rainy season.<br />
Seasonal fluctuations in abundances have been shown for many tropical insects, with different insect<br />
groups showing different rhythms (Smythe 1982). At more seasonal tropical sites, arthropod abundance<br />
is higher during the wet season than the dry season (Janzen 1973; Wolda 1978, 1983; Windsor 1978;<br />
Smythe 1982) but rainfall may also negatively affect abundances <strong>of</strong> externally feeding folivores<br />
(Marquis & Braker 1994).<br />
Many herbivorous insects seem to synchronize their hatching or emergence with the flush <strong>of</strong> young<br />
leaves (Coley & Barone 1996). Basset (2000) showed that the influence <strong>of</strong> leaf production on insect<br />
seasonality can be species-specific. In this study overall phasmid abundances were heterogeneous<br />
throughout the study period but abundances <strong>of</strong> nymphs seemed to remain on similar levels. This<br />
contradicted my expectation that particularly nymphs should show higher abundances at the beginning<br />
<strong>of</strong> the rainy season. The lack <strong>of</strong> seasonality especially in phasmid nymphs may indicate that they do not<br />
depend on the availability <strong>of</strong> young nutrient rich foliage.
Community structure & host range 27<br />
However, in the presented study, seasonal differences in phasmid abundances may have been concealed<br />
by high variation <strong>of</strong> overall abundances throughout the study period (cf. Figure 2-3). The magnitude <strong>of</strong><br />
variation could reflect deficiencies <strong>of</strong> the sampling method. For example, insect activity is <strong>of</strong>ten<br />
restricted to particular times <strong>of</strong> day (e.g., Willig et al. 1993; Basset 2000) and <strong>phasmids</strong>, when resting,<br />
are highly camouflaged (Bedford 1978; pers. obs.). Thus alternating sampling times may have resulted<br />
in time-dependant sample size (e.g., heavy rains <strong>of</strong>ten did not allow to follow a strict monitor plan)<br />
indicated by heterogeneity <strong>of</strong> phasmid adult abundances throughout the study period. In contrast,<br />
sample time may affect the sighting <strong>of</strong> nymphs to a lower extent. Phasmid nymphs have small home<br />
ranges and were shown to display patch fidelity (Willig et al. 1993). Consistent with these findings,<br />
high occurrence <strong>of</strong> O. martini on two Vismia baccifera individuals was mainly based on nymphs (data<br />
not shown).<br />
2.4.3 Niche breadth and habitat choice<br />
Phasmids on BCI were restricted in the use <strong>of</strong> their resources. Values for Levin’s standardized niche<br />
breadth assessed from records <strong>of</strong> potential food plants along line-transects ranged from 0 to 0.4<br />
(representing the realized niche). Niche breadths resulted both from a low number <strong>of</strong> potential host plant<br />
families (Otocrania sp., I. dentipes) and from contagious distribution <strong>of</strong> phasmid individuals among<br />
resources (all focal phasmid species). For example, 55 % <strong>of</strong> all O. martini and 91 % <strong>of</strong> all I. dentipes<br />
specimens shared two plant individuals <strong>of</strong> Vismia baccifera. Such clumped distribution was shown<br />
before to partially reflect habitat characteristics like plant composition (Willig et al. 1993) and may<br />
result from preference for and/or availability <strong>of</strong> a resource (Bernays & Chapman 1994). Here<br />
contagiousness reflected ‘true’ food resources: In feeding trials all the plant families turned out to be<br />
edible, where phasmid individuals were aggregated on in he field. (Unfortunately I. dentipes could not<br />
be established in lab populations. But field observations confirmed Vismia baccifera as food plant.) In<br />
contrast, other potential host plant families, that were included in the realized niches were rejected in<br />
feeding trials. Partial overlaps <strong>of</strong> realized niches, assessed from phasmid presence on plants in the field,<br />
and absolute food niches, assessed in feeding trials (as depicted by Figure 2-4), underline that field data<br />
represent multidimensional niches, including resources such as mating, oviposition, transience and the<br />
realized food niche (Krebs 1989; Bernays & Chapman 1994).<br />
When discussing the factors that may have led to the observed restriction in using food resources<br />
evolutionary and ecological processes have to be considered. A first insight into host range evolution<br />
can be gained by applying conventional definitions that refer to taxonomic relationships <strong>of</strong> host plant<br />
range on the results <strong>of</strong> feeding trials (representing the absolute food niche). Utilizing this concept, the<br />
user can conclude the most probable behavioral response (Bernays & Chapman 1994). To exemplify<br />
with my data, Otocrania sp. that fed on two plant species out <strong>of</strong> the Sapindaceae (and hence is<br />
monophagous) may use some characteristic <strong>of</strong> the plants they have in common in determining their
Community structure & host range 28<br />
acceptability. In contrast, B. ploiaria and O. martini that fed on plants from a number <strong>of</strong> different<br />
families (meaning they are polyphagous) most likely employ a number <strong>of</strong> different cues. The latter also<br />
applies for M. diocles whose diet included members <strong>of</strong> the Araceae and Piperaceae; two plant families<br />
that are not closely related (Judd et al. 2002). Such a feeding pattern <strong>of</strong> an insect that feeds on a small<br />
number <strong>of</strong> plants from different unrelated families is <strong>of</strong>ten described as disjunct oligophagous (Bernays<br />
& Chapman 1994).<br />
With its relation to plant taxonomy, the above definitions <strong>of</strong> host range involve conclusions regarding<br />
evolutionary processes. Monophagous species like Otocrania sp. are thought to be driven to<br />
specialization by physiological adaptations to host plant chemistry (Futuyma 1991). This may not apply<br />
for the disjunct oligophagous M. diocles. This term does not include any information on the connection<br />
<strong>of</strong> used host plants and Bernays et al. (1989) suggested that specializing on distantly related hosts<br />
indicates that factors such as competition or predation may have selected for restriction in host range.<br />
But what are the reasons that the realized food niches <strong>of</strong> <strong>phasmids</strong> (demonstrated by the overlap region<br />
in Figure 2-4) were smaller than their absolute food niches assessed in feeding trials? In other words:<br />
why did <strong>phasmids</strong> not use all available hosts that were confirmed edible in feeding trials? An<br />
explanation <strong>of</strong> these discrepancies between absolute and realized food niche may be found in biotic<br />
factors in the natural setting. For example, the observed distribution pattern <strong>of</strong> an herbivore among host<br />
plants can result from density dependent food selection, from food selection due to nutritional<br />
constraints, or from varying predation pressure on different hosts (Bernays & Chapman 1994). More<br />
specifically, Willig et al. (1993) found that <strong>phasmids</strong> modulated host selection to density <strong>of</strong> their host<br />
plants rather than to preference. The studied phasmid L. portoricensis occurred mainly on Piper<br />
treleaseanum, the least preferred plant species in feeding trials but the most abundant in the field.<br />
Sandoval (1994) proved that predation pressure can narrow down host use <strong>of</strong> phasmid nymphs to plant<br />
species where they suffered the least predation-related mortality. Such processes, for example, may<br />
explain why O. martini in line-transects never was found on Byttneria aculeata that was proved to be<br />
edible and was present in the habitat.<br />
Nevertheless, careful interpretation is inevitable because feeding trials involve some methodological<br />
imponderability that partially may have contributed to differences between realized and absolute food<br />
niche (see e.g. Gangwere 1961; Holecheck et al. 1982; Capinera 1985; Barone 1998). It is well known<br />
that feeding trials under lab conditions tend to produce more positive responses from insect herbivores<br />
than they would under natural conditions (e.g., Rowell-Rahier 1984). For instance, no-choice tests may<br />
overestimate the host range <strong>of</strong> an herbivore because there is no alternative to the <strong>of</strong>fered food. On the<br />
other hand the number <strong>of</strong> <strong>of</strong>fered plants is inevitably limited and may thus lead to an underestimation <strong>of</strong><br />
host range.
Community structure & host range 29<br />
On the species level, <strong>phasmids</strong> used different resources reflected by the comparison <strong>of</strong> both realized or<br />
absolute niche dimensions. Niche differentiation among species occupying the same habitat is <strong>of</strong>ten an<br />
effect <strong>of</strong> competition (Begon et al. 1996). One simple prediction arising from the assumption that the<br />
observed niche differentiation resulted from interspecific competition would be: while phasmid species<br />
use resources differentially in the field they should not discriminate among resources when they are<br />
released from competition, like in feeding trials. Thus, interspecific overlap in realized niches should be<br />
smaller than overlap <strong>of</strong> absolute niches. This prediction was not confirmed for <strong>phasmids</strong> on BCI.<br />
Principally overlap <strong>of</strong> realized niches between phasmid species was marginal with overlap indices from<br />
3 to 20% (Pianka’s niche overlap). This cannot be generalized as being opposed by an almost complete<br />
niche overlap between O. martini and I. dentipes.<br />
Results from feeding trials revealed that absolute niches <strong>of</strong> phasmid species were even more distinct<br />
(note that I. dentipes was not included in feeding trials). Overlap in absolute niches <strong>of</strong> four phasmid<br />
species was restricted to B. ploiaria sharing one host family each with O. martini and Otocrania sp..<br />
There was no overlap <strong>of</strong> the absolute food niche <strong>of</strong> M. diocles and any <strong>of</strong> the other three species.<br />
This can be partially explained by the fact that many plants in the diet <strong>of</strong> M. diocles (Araceae and<br />
Piperaceae) mirror the understory-habitat, the use <strong>of</strong> which was negligible for all the other species.<br />
Nevertheless, many Piper species are gap adapted (Croat 1978), and hence also available to other<br />
phasmid species. Possibly these <strong>phasmids</strong> are not able to handle particular chemical compounds <strong>of</strong><br />
Piperaceae and Araceae. The phylogenetic separation <strong>of</strong> the Piperaceae from other dicots may involve<br />
differences in phytochemistry (Judd et al. 2002). In fact, Piper species are characterized by a wide array<br />
<strong>of</strong> aromatic compounds (Sengupta & Ray 1987; Baldwin & Schultz 1988; Parmar et al. 1997; Dyer et<br />
al. in press) many <strong>of</strong> them deterring insect herbivores (Parmar et al. 1997 and references therein).<br />
Likewise the Araceae as monocots are distinct from dicots in many features. Araceae contain calcium<br />
oxalate crystals, cyanogenic compounds, and sometimes alkaloids, all known to deter herbivores (Judd<br />
et al. 2002 and references therein). M. diocles seems to be able to detoxify such toxic or deterrent plant<br />
chemicals suggesting that its evolutionary history is closely linked to these plants. However, a<br />
coevolutionary scenario (sensu Ehrlich & Raven 1964) would demand that Araceae and Piperaceae<br />
were closely related. Recent phylogenetic analyses cannot support this imperative (Judd et al. 2002).<br />
While this approach so far lacks an explanation for niche differentiation among O. martini, B. ploiaria<br />
and Otocrania sp., I suggest that their host ranges may reflect their evolution with less defended fast<br />
growing pioneer plants <strong>of</strong> high nutritious quality (Coley 1983; Coley et al. 1985). Both evolutionary<br />
hypotheses are supported by the refusal <strong>of</strong> foliage <strong>of</strong> late successional plant species in feeding trials.<br />
The presented pattern in host range corresponded with the mobility <strong>of</strong> three <strong>of</strong> the focal phasmid<br />
species. Limits to the rate at which a suitable host can be found (like mobility) are clearly related to host<br />
range (Jaenike 1990). Small organisms perceive their environment in a coarse grained fashion (Levins<br />
1968). For specialist herbivores, the resolution becomes worse because with decreasing host range, a
Community structure & host range 30<br />
decreasing availability <strong>of</strong> patches with suitable hosts is inherent (particularly in high diverse tropical<br />
rainforests). This may explain why both sexes <strong>of</strong> M. diocles dispose <strong>of</strong> cost intensive wings. Higher<br />
mobility as compared to wingless <strong>phasmids</strong> may allow them to search for scattered resources more<br />
efficiently. But finding suitable resource patches also represents a critical challenge for nonvolant<br />
<strong>phasmids</strong> like the generalistic O. martini and B. ploiaria. In B. ploiaria only the male is winged and<br />
able to fly short distances (personal observation) while in O. martini both sexes are wingless. Their<br />
restricted host range consisting <strong>of</strong> characteristic gap plant species involves the risk <strong>of</strong> depleting host<br />
plants when a light gap closes. Then the detection <strong>of</strong> a new gap becomes crucial; the more as nonvolant<br />
<strong>phasmids</strong> were shown to move at low velocities (a maximum <strong>of</strong> 6 m per day; Willig et al. 1986). I<br />
suggest that gap phasmid species may escape from being doomed because their diet contains liana<br />
species. I argue that the wingless habitus <strong>of</strong> the Otocrania species does not contradict its specialization,<br />
because Otocrania specialized on Sapindaceae, a plant family that contains many lianas such as<br />
Paullinia spp. and Serjania spp. (Croat 1978). Lianas may contribute up to 14 % <strong>of</strong> above ground<br />
biomass in tropical forests (Gerwing & Farias 2000). They are characteristic components <strong>of</strong> early<br />
successional habitats such as gaps, but they are also present all over the canopy (Putz 1984, DeWalt<br />
et.al. 2000; Schnitzer & Bongers 2002). Thus, <strong>phasmids</strong> that include lianas into their diet may find<br />
sufficient food in upper canopy. The generalistic O. martini and B. ploiaria that were abundant in forest<br />
edges may on their search for new light gaps be able to traverse the forest canopy and rely on lianas. In<br />
contrast, the forest canopy may represent the preferred habitat <strong>of</strong> the specialist Otocrania sp. and<br />
thereby explain its low abundance in my study.<br />
2.4.4 Conclusions<br />
Broadening the meaning <strong>of</strong> specialization, I presented evidence that <strong>phasmids</strong> are specialized to habitat<br />
specific food resources and that their distribution was clearly connected to the distribution <strong>of</strong> their host<br />
plants (as reflected by their successional status). The higher density and species richness <strong>of</strong> phasmid<br />
species in forest edges as compared to the understory may reflect their evolution with less defended fast<br />
growing pioneer plants <strong>of</strong> high nutritious quality (Coley 1983; Coley et al. 1985). The refusal <strong>of</strong> foliage<br />
<strong>of</strong> persistent late successional tree species gives support to this view.<br />
Other than by resources, the distribution <strong>of</strong> an herbivore can be influenced by its natural enemies.<br />
Contagiousness could then be due to differential predation, i.e. an herbivore species suffers less<br />
predation related mortality on a particular host plant species (Sandoval 1994; Price et al. 1980; Bernays<br />
& Graham 1988). Such mechanisms could have led to narrow host range including unrelated plant<br />
species <strong>of</strong> M. diocles. Low abundances <strong>of</strong> M. diocles in the understory then would result from high<br />
predation pressure rather than from nutritious limitations through the host plants.
Life history & potential population growth 31<br />
3 Life cycle, potential population growth, and egg hatching<br />
failure <strong>of</strong> Metriophasma diocles<br />
3.1 Introduction<br />
Great variation in patterns <strong>of</strong> population densities clearly exists in herbivorous insects, but generally<br />
most insect species in the tropics occur in low numbers (e.g., Elton 1973; Basset et al. 1992; Basset<br />
1997, 1999; Novotny & Basset 2000). Such low population densities reflect the biotic potential <strong>of</strong> a<br />
species in the limiting boundaries <strong>of</strong> habitat capacity, intraspecific competition and regulating<br />
mechanisms within trophic cascades.<br />
A whole wealth <strong>of</strong> factors acts on individuals in a population thereby affecting net recruitment (i.e.,<br />
births minus deaths). These factors either do not respond to population density or are density-dependent<br />
and can be roughly categorized as: (1) intraspecific density-dependent factors, (2) environmental<br />
density-dependent factors, and (3) density-independent factors.<br />
The upper limit <strong>of</strong> population size is defined by intraspecific competition. Intraspecific competition as<br />
density-dependent regulation factor increases with population size. Higher competition leads to<br />
increasing death and decreasing birth rates resulting in a population decline (and vice versa). At a<br />
certain density, birth and death rate are equal and there is no net change in population size. This density<br />
is known as carrying capacity (K). The carrying capacity represents the population size the resources <strong>of</strong><br />
the environment can just maintain without a tendency to either increase or decrease (Begon et al. 1996).<br />
However, natural populations lack simple carrying capacities. Alongside with intraspecific competition,<br />
populations are regulated by multiple factors reducing the population size below the carrying capacity.<br />
Most factors in the biotic setting <strong>of</strong> a species respond to population size. Density <strong>of</strong> prey translates into<br />
predator densities (Volterra 1926; Lotka 1925), and diseases spread faster in higher populated areas<br />
(e.g., Stevenson 1959). Increasing population density also involves decreasing food availability and<br />
higher levels <strong>of</strong> interspecific competition (reviewed in Schoener 1983).<br />
Other biotic factors like intrinsic food quality or breeding sites on the other hand do not relate to<br />
population density, but their limited nutritious value or availability may act as regulators (Andrewartha<br />
& Birch 1954, 1984). Likewise, abiotic factors such as climate and natural disasters are density<br />
independent and can cause drastic impact on populations (e.g., Willig & Camilo 1991).<br />
Releasing a population from regulating constraints can uncover the impact <strong>of</strong> the above described<br />
control factors. When there are no limits on its growth, the population <strong>of</strong> a species will increase<br />
infinitely according to its biotic potential, i.e. the inherent power <strong>of</strong> an organism to reproduce and<br />
survive (Chapman 1931). The intrinsic rate <strong>of</strong> natural increase (r) will then be at its maximum. That<br />
means each individual <strong>of</strong> the population will contribute to population growth with peak reproduction<br />
(Begon et al. 1996). In natural populations, most individuals are not capable <strong>of</strong> peak productivity
Life history & potential population growth 32<br />
because restrictions in the biotic and abiotic setting <strong>of</strong> an organism’s environment almost always affect<br />
fecundity and survivorship (e.g., Joern & Gaines 1990, and references therein). In practice, an<br />
approximation <strong>of</strong> the biotic potential can be obtained from laboratory populations where most <strong>of</strong> these<br />
restrictions can be cut <strong>of</strong>f or minimized (e.g., populations under laboratory conditions are not<br />
necessarily competition-free but experience the least competition, cf. Begon et al. 1996).<br />
Data on demographic population parameters and life history traits assessed from laboratory populations<br />
can help in understanding an organism’s realized density in its natural setting and provide the basis for<br />
estimating potential population growth. Under the assumption that density estimates obtained from field<br />
records are derived from a stable population oscillating below K (not being in colonization or in<br />
extinction), the difference between potential and realized population densities then reflects the impact <strong>of</strong><br />
control.<br />
Generally, <strong>phasmids</strong> on BCI occurred in low abundances in both the understory and at forest edges as I<br />
showed in Chapter 2. Although being rather common in comparison to the majority <strong>of</strong> phasmid species,<br />
M. diocles density was low in both habitats. Most other phasmid species are rare in tropical forests<br />
(Bedford 1978, Willig & Camilo 1991, Novotny & Basset 2000) while they occasionally reach pest<br />
status in temperate ecosystems (e.g., Campbell 1961, 1974).<br />
Low densities <strong>of</strong> a species may at least partially result from a low biotic potential, whereas low<br />
density opposed to high biotic potential is indicative <strong>of</strong> high levels <strong>of</strong> control. Among phasmid<br />
species biotic potentials seem to be highly variable as indicated by great differences in<br />
generation times and fecundity (available data do not include these parameters but report<br />
developmental times <strong>of</strong> eggs and nymphs as well as maximum adult lifetimes and maximum<br />
egg production; cf. Bedford 1978).<br />
In this chapter, I present data on demographic population parameters and life history traits from a<br />
laboratory population <strong>of</strong> Metriophasma diocles. In particular, I assessed mean values for (1) individual<br />
fecundity (birthrate), sex ratio and generation time. Based on these parameters (2) I developed a model<br />
for the potential population growth <strong>of</strong> M. diocles (i.e., the biotic potential). This model established the<br />
base for conclusions on the impact <strong>of</strong> population control factors, namely the effects <strong>of</strong> (3) egg mortality<br />
(included here), food quality (Chapter 4) and predation (Chapter 5).<br />
Sex ratio and birth rate represent principle demographic population parameters. The sex ratio provides<br />
information on the proportion <strong>of</strong> females in following generations and approximates equality in most<br />
insects (Wrensch & Ebbert 1993). The birthrate describes the number <strong>of</strong> <strong>of</strong>fspring produced per unit<br />
time, also referred to as mean individual fecundity (Begon et al. 1996). Individual fecundity <strong>of</strong> insects is<br />
known to be influenced by female body size (or weight) with smaller females laying fewer eggs (e.g.,<br />
Price 1984, Wiklund et al. 2001, Zanuncio et al. 2002). In the natural setting <strong>of</strong> an organism, female<br />
body size or weight may reflect impact from different factors, such as food quality and availability,
Life history & potential population growth 33<br />
competiton and predation pressure, and therefore may depend on their according intensities (Price<br />
1984). If such a relation between body size and fecundity was also found in M. diocles, then population<br />
control factors like food quality and predation pressure (addressed to in Chapters 4 and 5) most likely<br />
will influence female fecundity.<br />
The life span <strong>of</strong> an organism is one life history trait reflecting a part <strong>of</strong> its life cycle. In <strong>phasmids</strong>, life<br />
span can be separated into three distinct life stages: (1) developmental time <strong>of</strong> eggs, (2) developmental<br />
time <strong>of</strong> nymphs (maturation) and (3) adult lifetime. The mean durations <strong>of</strong> these life stages merge<br />
together to the mean generation time <strong>of</strong> insects that represents the average parental age at which all<br />
<strong>of</strong>fspring are born (Pianka 1978).<br />
The above described parameters are a reflection <strong>of</strong> an organism’s life cycle (i.e., patterns <strong>of</strong> birth, death<br />
and growth) and can serve as basis for a mathematical model <strong>of</strong> population growth. Population growth<br />
differs depending on the life cycle <strong>of</strong> an organism. Populations <strong>of</strong> organisms with discrete breeding<br />
seasons (i.e., discrete generations) grow in discrete steps whereas populations with continuous breeding<br />
(i.e., overlapping generations) grow continuously (Begon et al. 1996). Consequently, knowledge about<br />
the life cycle <strong>of</strong> an organism is necessary before deciding on a model. With the exception <strong>of</strong> social<br />
insects, generations do not overlap in most insect populations (i.e., the parental reproductive period does<br />
not overlap with the <strong>of</strong>fspring’s reproductive phase) and models <strong>of</strong> discrete stepwise growth best<br />
describe their population growth (Begon et al. 1996).<br />
Accordingly, generations in M. diocles populations were expected not to overlap: if mean<br />
developmental time <strong>of</strong> egg and nymphal stage together exceeded mean adult lifetime then potential<br />
population growth would be modeled by discrete stepwise growth.<br />
3.2 Materials and methods<br />
For details on study site, line-transect and field records, and for maintenance <strong>of</strong> lab populations please<br />
refer to the introductory chapter and to Chapter 2 respectively.<br />
3.2.1 Assessing demographic population parameters and life history traits<br />
For the estimation <strong>of</strong> the biotic potential <strong>of</strong> M. diocles, I gathered data on demographic population<br />
parameters and life history traits from a lab population from January 2000 to January 2002.<br />
Individual fecundity was assessed as the mean number <strong>of</strong> <strong>of</strong>fspring produced per day in a M. diocles<br />
female adult lifetime. For the estimation <strong>of</strong> mean individual fecundity, I observed the egg production <strong>of</strong><br />
single females over the course <strong>of</strong> a 24-hour period. Observations usually started in the early afternoon<br />
and ended at the same time the following day. A female was collected from the lab colony and weighed<br />
before placing it in a plastic container with screened lids (to allow for ambient conditions). Individuals<br />
were provided with leaves <strong>of</strong> different food plants (Philodendron inaequilaterum, Piper marginatum,
Life history & potential population growth 34<br />
P. hispidum, P. reticulatum, etc.). At the end <strong>of</strong> an observation I carefully searched the container and the<br />
remainders <strong>of</strong> the leaves for eggs. In total, I yielded 500 observational days from 99 individual females.<br />
Multiple observation units per female individual were averaged.<br />
Because individual fecundity <strong>of</strong> females may be influenced by female body size (weight) (e.g., Price<br />
1984) female weight was correlated to egg production in a Spearman Rank correlation. For this analysis<br />
I only included females that had laid at least one egg while being under observation (49 females). The<br />
elimination <strong>of</strong> zero counts for female oviposition (50 females) was justified by the fact that the<br />
disposition to lay eggs was independent from female weight (comparison <strong>of</strong> weight for females having<br />
laid eggs and females not having laid eggs: T = -0.54; df = 97; P = 0.59).<br />
For the estimation <strong>of</strong> the proportion <strong>of</strong> females in M. diocles populations, I calculated sex ratio for the<br />
lab population on the base <strong>of</strong> the numbers <strong>of</strong> emerged adult males and females.<br />
The mean generation time <strong>of</strong> M. diocles was measured on the basis <strong>of</strong> the mean duration its three<br />
distinct life stages: (1) developmental time <strong>of</strong> eggs, (2) developmental time <strong>of</strong> nymphs (maturation) and<br />
(3) adult lifetime.<br />
Mean developmental time <strong>of</strong> eggs was derived from observations <strong>of</strong> the hatching <strong>of</strong> nymphs from eggs<br />
with known date <strong>of</strong> oviposition. Eggs were collected from cages at least every third day and stored in<br />
plastic food containers covered with mesh. Containers were labeled with the date <strong>of</strong> oviposition and<br />
stored in plastic boxes with 10 mm <strong>of</strong> sand on the bottom. Eggs were sprayed with water regularly to<br />
provide for ambient humidity. Hatching <strong>of</strong> nymphs was controlled daily.<br />
If eggs fail to hatch, for example due to fungal infestation (Bedford 1978), then this reduced hatching<br />
success will negatively affect population growth. To describe the influence <strong>of</strong> failed hatching on<br />
population growth, I assessed hatching success. Infestation <strong>of</strong> eggs by fungi (notable by fungal hyphens<br />
covering the eggshell) was checked once per month. Infested eggs were collected and kept separately to<br />
observe hatching (no hatching <strong>of</strong> infested eggs occurred). In January 2002 I counted all eggs that were<br />
older than 120 days and had not hatched. I assumed that these eggs had failed to hatch because less than<br />
0.31 % <strong>of</strong> almost 2000 eggs took longer than 120 days for development. I randomly selected 10 <strong>of</strong> these<br />
eggs and opened them: one contained a dead dry nymph, four were dried out, and in five the usually<br />
green liquid had turned black.<br />
Mean developmental time <strong>of</strong> nymphs was assessed from individually raised nymphs. A nymph was set<br />
in a plastic container with screened lids. At least every third day individuals were provided with fresh<br />
leaves <strong>of</strong> Piperaceae or Araceae (see Chapter 2) and the containers were cleaned. Nymph development<br />
was controlled daily.<br />
Average adult lifetime was calculated on the base <strong>of</strong> individuals with certified records <strong>of</strong> date <strong>of</strong><br />
emergence and death from July 2000 to January 2002. The lab population <strong>of</strong> M. diocles was checked at<br />
least weekly for new emerged and dead adults. New adults were measured from head to terminal
Life history & potential population growth 35<br />
abdomen, marked individually with a four-color code (permanent ink) on the pronotum, and transferred<br />
to an extra cage only containing adults. Emergence date and time <strong>of</strong> death were recorded individually.<br />
3.2.2 Modeling potential population growth and the effect <strong>of</strong> limited<br />
hatching success<br />
The above described parameters are a reflection <strong>of</strong> the life cycle <strong>of</strong> M. diocles (i.e., patterns <strong>of</strong> birth,<br />
death and growth) and can serve as the basis for a mathematical model <strong>of</strong> population growth.<br />
For modeling population growth <strong>of</strong> M. diocles, I assumed (1) that generations do not overlap, (2) that<br />
the population increases competition-free, and (3) that all individuals complete their life cycle (i.e., all<br />
individuals complete their mean expected lifetime and reproduce).<br />
Generations in M. diocles populations will not overlap if mean developmental time <strong>of</strong> egg and nymphal<br />
stage together exceed mean adult lifetime. Population growth will then be best described by models <strong>of</strong><br />
discrete stepwise growth (Begon et al. 1996):<br />
Equation 3-1<br />
NT = N 0<br />
where NT = Population size N at generation T<br />
R = Fundamental net per capita rate <strong>of</strong> increase<br />
R<br />
T<br />
This model describes the exponential growth <strong>of</strong> a competition-free population with discrete generations<br />
and constant R. If R > 1 the population will grow exponentially.<br />
R usually combines the birth <strong>of</strong> new individuals with the survival <strong>of</strong> existing individuals (like in<br />
organisms with overlapping generations). When generations are discrete R describes only the birth <strong>of</strong><br />
new individuals and is equivalent to the basic reproductive rate R0:<br />
Equation 3-2<br />
R<br />
0<br />
∑<br />
where R0 = Basic reproductive rate<br />
=<br />
a<br />
F<br />
0<br />
x<br />
Fx = Total number <strong>of</strong> fertilized eggs produced during one generation<br />
a0 = Original number <strong>of</strong> individuals<br />
The natural logarithm <strong>of</strong> R0 describes the intrinsic rate <strong>of</strong> natural increase r. This is the change<br />
in population size per individual per unit time, which is one generation in the presented study.<br />
R0 is usually derived from cohort life tables that describe mortality and survivorship in particular life<br />
stages during the life cycle <strong>of</strong> organisms with discrete generations (e.g., Begon et al. 1996). Therefore<br />
the initial number <strong>of</strong> individuals a0 (here eggs) differs to some extent from individuals alive in the last<br />
life stage ax, which is for insects the reproductive adult phase. In this study, I wanted to model potential<br />
population growth and as a consequence I assumed that all individuals survive until the reproductive<br />
phase; thus a0 = ax.<br />
The total number <strong>of</strong> fertilized eggs produced during one generation (ΣFx) <strong>of</strong> M. diocles can be<br />
calculated on the base <strong>of</strong> the assessed average values for life history parameters by:
Life history & potential population growth 36<br />
∑<br />
Equation 3-3 F x = F d L f a f<br />
where F d = Mean number <strong>of</strong> fertilized eggs produced per day and female<br />
L f = Mean adult lifetime <strong>of</strong> females<br />
af = Number <strong>of</strong> females<br />
For the calculation <strong>of</strong> ΣFx knowledge about the sex ratio <strong>of</strong> a population is inevitable. Female-biased<br />
populations will result in higher values for the net per capita rate <strong>of</strong> increase R and hence in faster<br />
growth. Replacing ΣFx in Equation 3-2 by F d L f a f shows that the proportion <strong>of</strong> females in the<br />
M. diocles lab population (estimated by the sex ratio) is included by the term af/a0.<br />
The outlined model in Equation 3-1 describes the infinite exponential population growth in the absence<br />
<strong>of</strong> limiting factors. Such hypothetical populations do not reflect biological facts. Factors affecting<br />
population growth can act on every life stage <strong>of</strong> an organism. Here, I assessed the effect <strong>of</strong> limiting<br />
factors in the first life stage. More precisely, I estimated egg mortality due to fungal infestation and<br />
failed hatching. A reduction in hatching will result in a lower net per capita rate <strong>of</strong> increase R (or basic<br />
reproductive rate R0 respectively) because a0 > ax and fewer females enter the reproductive adult stage.<br />
The population will still grow exponentially but the proportion <strong>of</strong> eggs that fail to hatch decelerates the<br />
increase. This model assumes that failed hatching is constant.<br />
3.3 Results<br />
3.3.1 Demographic population parameters and life history traits<br />
In the M. diocles lab population sex ratio was balanced (females : males = 1.01; Table 3-1). Females and<br />
males showed a pronounced sexual dimorphism, differing significantly in size and weight. In average,<br />
females weighed more than three times more and were ca. 20 % longer than males (Table 3-1).<br />
Consistently, it took females approximately 8 days longer to develop from nymph to adult, resulting in a<br />
total developmental period <strong>of</strong> 108 days (Table 3-1).<br />
Mean adult lifetime differed significantly between sexes, with females living approximately 13 days<br />
longer than males (i.e., 60 vs. 47 days; cf. Table 3-1). Generally adult lifetimes varied enormously<br />
among individuals. At maximum an individual female tripled average adult lifetime and lived for 177<br />
days. Likewise maximum lifetime for males was more than twice as long as male mean adult lifetime.<br />
Females produced in average 0.66 eggs per day (Table 3-1). But individual females posed up to ten eggs<br />
in one day. Mean egg production was modestly related to female weight (RS = 0.43; cf. Figure 3-1).<br />
In average nymphs hatched after 71 days. Duration <strong>of</strong> egg development ranged considerably from 35 to<br />
172 days but clearly peaked with 50 % <strong>of</strong> all nymphs emerging between days 68 and 74 after<br />
oviposition (Figure 3-2).
Life history & potential population growth 37<br />
Table 3-1: Estimates <strong>of</strong> demographic population parameters and life history traits <strong>of</strong> M. diocles. All data were<br />
based on lab records. Differences were tested by Student’s T-tests.<br />
Sex ratio 249 245<br />
Body weight ± StDev [g]<br />
Body length ± StDev [mm]<br />
Mean female fecundity ± StDev<br />
[eggs*day -1 *ind. -1 ]<br />
Egg developmental time ± StDev<br />
[days]<br />
Nymph developmental time<br />
± StDev [days]<br />
Mean adult lifetime<br />
± StDev [days]<br />
Females Males Difference<br />
1.44 ± 0.29<br />
N = 79<br />
84.15 ± 2.85<br />
N = 122<br />
0.66 ± 1.18<br />
N = 99<br />
108 ± 13.9<br />
N = 7<br />
59.96 ± 40.77<br />
N = 69<br />
71.22 ± 9.69<br />
N = 1958<br />
0.41 ± 0.04<br />
N = 28<br />
67.7 ± 2.47<br />
N = 126<br />
99.8 ± 15.14<br />
N = 12<br />
46.73 ± 27.84<br />
N = 83<br />
Maximum adult lifetime [days] 177 122<br />
Mean generation time [days] 239 218<br />
T = -18.4, df = 105, P < 0.01<br />
T = -48.6, df =246, P < 0.01<br />
T = -2.4, df = 150, P < 0.05<br />
Independently from sex, mean developmental time (egg and nymph development) was longer than mean<br />
adult lifetime. Development for females lasted in average 179 days; three times longer than mean adult<br />
lifetime <strong>of</strong> (60 days; cf. Table 3-1). Similarly, male developmental time took more than three times as<br />
long as male mean adult lifetime (171 vs. 47 days).<br />
Mean generation time for M. diocles lasted approximately eight months (Table 3-1) with female life<br />
span taking three weeks longer than for males. Even under consideration <strong>of</strong> maximum values for adult<br />
lifetime developmental and mature periods in M. diocles populations overlap only marginally (4 days<br />
for males, no overlap for females; cf. Table 3-1). Consequently generations in M. diocles were<br />
considered as distinct.
Life history & potential population growth 38<br />
mean egg production per day<br />
8<br />
7<br />
6<br />
5<br />
4<br />
3<br />
2<br />
1<br />
0<br />
1 1.2 1.4 1.6 1.8 2<br />
female weight [g]<br />
Figure 3-1: Mean daily egg production <strong>of</strong> M. diocles females in relation to body weight (RS = 0.43; N = 49;<br />
P < 0.01). The solid line represents the trendline for y = 3.6308 x – 3.89444. Zero counts were eliminated (see<br />
Methods).<br />
No. <strong>of</strong> hatched nymphs<br />
1000<br />
900<br />
800<br />
700<br />
600<br />
500<br />
100<br />
75<br />
50<br />
25<br />
0<br />
30-39 40-49 50-59 60-69 70-79 80-89 90-99 100-109 110-119 >120<br />
Days after oviposition<br />
Figure 3-2: Hatching phenology <strong>of</strong> M. diocles nymphs (N = 1958).
Life history & potential population growth 39<br />
3.3.2 Potential population growth and effects <strong>of</strong> limited hatching success<br />
As generations in M. diocles were shown not to overlap potential population growth was calculated by<br />
the model <strong>of</strong> discrete stepwise growth described by Equation 3-1.<br />
The fundamental net per capita rate <strong>of</strong> increase R (Equation 3-2) for M. diocles was 19.79 (intrinsic rate<br />
<strong>of</strong> natural increase per generation r = 2.98 and per day for females r = 0.0125). In other words: each<br />
individual <strong>of</strong> a generation contributed with a progeny <strong>of</strong> 20 individuals to the next generation.<br />
The model resulted in exponential population growth (Figure 3-3). Starting with a hypothetical<br />
population <strong>of</strong> two individuals representing the founder generation T0 (male and female) the population<br />
comprised 40 individuals in the first generation (2 * 19.79 = 39.58), multiplying to 783 individuals in<br />
the second, and 15494 individuals in the third generation (population size T4 ~ 306572; T5 > 6*10 6 ).<br />
About 90 % <strong>of</strong> the eggs hatched; 2% <strong>of</strong> embryos were killed by fungal infestations and another 8%<br />
failed to hatch for unknown reasons. The reduction in hatching success <strong>of</strong> 10 % resulted in a lowered<br />
net per capita rate <strong>of</strong> increase <strong>of</strong> R = 17.81 (r = 2.88 per generation and r = 0.0121 for females per day).<br />
Accordingly population growth was decelerated with T1 ~ 36, T2 ~ 634, T3 ~ 11299 and T4 ~ 201227<br />
individuals (Figure 3-3).<br />
Population size [ind.]<br />
16000<br />
14000<br />
12000<br />
10000<br />
500<br />
0<br />
potential population increase, R = 19.79<br />
population increase<br />
including hatching success, R = 17.81<br />
0 1 2 3<br />
Generation T<br />
Figure 3-3: Model <strong>of</strong> discrete stepwise population growth (Equation 3-1) <strong>of</strong> M. diocles for potential population<br />
growth (filled dots) and population growth decreased by reduced hatching success (white dots). Models start from<br />
a hypothetical founder generation T0 <strong>of</strong> two individuals. Net per capita rates <strong>of</strong> increase (R) are depicted in the<br />
figure legend.<br />
4
Life history & potential population growth 40<br />
3.4 Discussion<br />
This study is the first to model potential population growth <strong>of</strong> a tropical phasmid and to give a first<br />
estimate <strong>of</strong> the impact <strong>of</strong> hatching failure <strong>of</strong> eggs on population increase. M. diocles disposed <strong>of</strong> a<br />
comparably low biotic potential that may partially explain the low density <strong>of</strong> this species documented<br />
on BCI (cf. Chapter 2). As expected, generations <strong>of</strong> this phasmid did not overlap and the according<br />
model <strong>of</strong> potential discrete stepwise population growth resulted in markedly higher population size than<br />
realized in the field. Hatching failure <strong>of</strong> eggs caused a marked reduction <strong>of</strong> population increase by 10 %<br />
suggesting that infertility and fungal infestations <strong>of</strong> eggs may be important but not prominent factors in<br />
the maintenance <strong>of</strong> low population density <strong>of</strong> M. diocles.<br />
3.4.1 Demographic population parameters and life history traits<br />
Presented data for M. diocles demographic and life history parameters largely corresponded with data<br />
compiled by Bedford (1978), who provided a helpful and capacious source <strong>of</strong> information on phasmid<br />
biology. Unless otherwise cited the following comparisons are based on Bedford (1978).<br />
Sex ratio <strong>of</strong> the M. diocles lab population equaled 1:1 and is in accordance with sex ratio derived from<br />
many phasmid (Bedford 1978) and insect species (Wrensch & Ebbert 1993). Female to male ratios <strong>of</strong><br />
sexually reproducing animals generally are expected to near equality when sons and daughters are<br />
equally costly to produce (Fisher 1930). For <strong>phasmids</strong>, sex ratio is sometimes female-biased, indicating<br />
that a species reproduces at least partially parthenogenetic. For instance, the sperm supply <strong>of</strong> a<br />
spermatophore may not last the whole adult life <strong>of</strong> a female. Some phasmid species then lay unfertilized<br />
eggs that develop into females. In contrast, M. diocles seemed to reproduce sexually resulting in a<br />
balanced sex ratio (even though copula could never be observed).<br />
As for all phasmid species, sexes in M. diocles differed in size and weight with females being bigger<br />
and heavier than males. Sexual size dimorphism is widespread in animals with bigger females in most<br />
invertebrate species (Andersson 1994; Fairbairn 1997). Female-biased dimorphism is <strong>of</strong>ten attributed to<br />
a fecundity-advantage <strong>of</strong> large female size (Shine 1989). Larger female body size positively relates to<br />
longevity and to energy resources for egg production, both favoring higher reproductive success<br />
(Fairbairn 1997). Positive relationships <strong>of</strong> female body size to reproductive success <strong>of</strong> variable strengths<br />
were demonstrated for several insect taxa (e.g., Fox et al. 1995a; Zanuncio et al. 2002) and pro<strong>of</strong>ed to<br />
hold proved to be true for M. diocles on a modest level. Fox et al. (1995a) found a similar weak relation<br />
<strong>of</strong> reproductive success to female weight in a seed beetle, but they provided evidence that larger females<br />
more <strong>of</strong>ten mated with larger males than their smaller conspecifics. Thereby larger females received<br />
more male-derived nutrients via extragametic substances <strong>of</strong> the spermatophores (that are bigger in<br />
bigger males; Fox et al. 1995b) and increased their egg production. Similarly larger M. diocles females<br />
may gain additional reproductive benefit via intrasexual competition for bigger sized males.
Life history & potential population growth 41<br />
Size differences among females may reflect the effects <strong>of</strong> differing intensities <strong>of</strong> multiple control factors<br />
like food quality and availability, competition and predation pressure in the natural setting <strong>of</strong> an<br />
organism (Price 1984). Hence, in M. diocles control factors like food quality and predation pressure<br />
(addressed to in Chapters 4 and 5) most likely will influence female fecundity.<br />
However, larger body size and higher weight can also be at the expense <strong>of</strong> mobility. Bedford (1978)<br />
reported that in most phasmid species females become gravid with eggs and cannot fly, although the<br />
wings may be large as in M. diocles. This may decrease female searching efficiency for new food<br />
patches. One deriving possible scenario for M. diocles would be that fertile females show a high fidelity<br />
to food patches resulting in clustered distributions as described in Chapter 2.<br />
Generally, the variability in developmental times <strong>of</strong> phasmid eggs is enormous; hatching times range<br />
from 13 days up to three years. Species in temperate regions take longer times <strong>of</strong> egg development <strong>of</strong>ten<br />
linked to diapauses. For tropical phasmid species Bedford (1978) reported hatching times from 13 to<br />
114 days, with the main hatching spreading over a time span <strong>of</strong> 20 to 30 days and only small numbers<br />
taking longer. By comparison M. diocles is situated in the middle <strong>of</strong> embryonic development time.<br />
Developmental time <strong>of</strong> M. diocles nymphs and adult lifetime were consistent with other species, but<br />
mean female adult lifetime ranged on the lower end <strong>of</strong> published data on <strong>phasmids</strong>. Phasmid males in<br />
general have shorter larval development than females and are shorter lived as adults. Both was<br />
confirmed for M. diocles, although the difference in adult longevity was small compared to other<br />
phasmid species. M. diocles females in average lived 13 days longer than males. For example, adult<br />
females may live two (9 weeks, Phyllium bioculatum Gray) to eight times longer than males (8 months,<br />
Phasma gigas Amboine). Nonetheless, maximum lifetime <strong>of</strong> M. diocles adults almost reached 6 months<br />
for females and 4 months for males.<br />
In terms <strong>of</strong> egg production M. diocles remained below the lowest values reported with 60 to 80 eggs per<br />
female for Timema californica Scudder. P. bioculatum produced in a comparable lifespan 80 to 100<br />
eggs per female. In other species females can lay up to 1000 eggs.<br />
3.4.2 The biotic potential <strong>of</strong> Metriophasma diocles<br />
Both, low egg production and short-lived adult females converted into low reproductive potential <strong>of</strong><br />
M. diocles, especially facing a relatively long generation time <strong>of</strong> approximately eight months. Prominent<br />
tropical herbivore groups, such as Lepidopterans and Coleopterans exhibit much shorter generation<br />
times and much higher reproductive potential (e.g., Braker & Greene 1994, Caldas 1994, Chi & Yang<br />
2003, Atluri et al. 2004). To give an example, Braker & Greene (1994) provide data on eight tropical<br />
butterfly species at La Selva, Costa Rica, with lifetime fecundity ranging from 217 to 521 eggs and<br />
maximum generation times <strong>of</strong> 74 to 227 days. While generation times <strong>of</strong> single species may be<br />
comparable to M. diocles (239 days for females) these species all possess much higher individual<br />
fecundities (40 eggs for M. diocles females). The low biotic potential <strong>of</strong> M. diocles becomes apparent<br />
compared to the intrinsic rate <strong>of</strong> increase <strong>of</strong> a predatory coccinelid beetle including stage specific
Life history & potential population growth 42<br />
mortality (r = 0.113*d -1 , Chi & Yang 2003), that exceeds maximum r <strong>of</strong> M. diocles almost tenfold<br />
(0.0125*d -1 ; no mortality until mean generation time). Thus low abundances <strong>of</strong> M. diocles may at least<br />
partially result from its low biotic potential.<br />
Despite large differences in biotic potentials among species, most insect herbivores in the tropics are<br />
rare (Basset 1996, 1999; Basset et al. 1992, 1996; Barone 1998; Novotny et al. 2002b). This is also true<br />
for <strong>phasmids</strong> (Bedford 1978, Willig & Camilo 1991, Novotny & Basset 2000) and was shown for<br />
M. diocles in Chapter 2. Regardless <strong>of</strong> the comparably low reproductive output, potential population<br />
growth <strong>of</strong> M. diocles described by a model <strong>of</strong> discrete stepwise growth resulted in exponential<br />
population growth. Already in the first generation, modeled potential population densities were higher<br />
(applying T1 = 40 ind. on a ha base; cf. Figure 3-3) than realized in the forest edge or understory on BCI<br />
(21.5 and 6.7 ind.*ha -1 respectively; cf. Chapter 2). In following generations modeled population sizes<br />
by far exceeded M. diocles realized population densities (Figure 3-3). Consequently M. diocles cannot<br />
reach its potential population size in its natural setting and population control factors must act<br />
continuously to maintain its low realized density.<br />
3.4.3 A first insight into M. diocles population control<br />
Egg mortality (sensu hatching failure or fungal infestation) may be one factor reducing reproductive<br />
output <strong>of</strong> M. diocles. Mortality <strong>of</strong> insect eggs can be <strong>of</strong> major importance in limiting insect populations<br />
(e.g., Parker & Wakeland 1957, Prior & Greathead 1989, Caldas 1994, Dyssart 1995, Pho<strong>of</strong>olo et al.<br />
2001). Hatching failure may occur due to infertility <strong>of</strong> eggs (Caldas 1994) or because <strong>of</strong> fungal or<br />
bacterial infestation (Bedford 1978). However, the impact <strong>of</strong> hatching failure due to these factors has<br />
reached little attention. Data from Caldas (1994) indicate that infertility <strong>of</strong> eggs may play a minor role<br />
(0.5 % infertile eggs in a nymphalid butterfly). Here, I observed hatching failure <strong>of</strong> 10 % with 2 % <strong>of</strong><br />
M. diocles embryos being killed by fungi. Hatching failure initially lowered population growth<br />
markedly (cf. Figure 3-3). Nevertheless, this may be <strong>of</strong> no impact after generation five when population<br />
density had reached legion (only being limited by resource availability). On the other hand, egg<br />
mortality may play an important role when population density is low as shown for M. diocles in<br />
Chapter 2 and when a number <strong>of</strong> other factors increases mortality levels. For eggs, predators (Parker &<br />
Wakeland 1957, Pho<strong>of</strong>olo et al. 2001) and parasitoids (Prior & Greathead 1989, Caldas 1994, Dyssart<br />
1995) may play a much more prominent role than infertility or pathogens. For example, predators may<br />
reduce lepidopteran egg densities by 50 % (Pho<strong>of</strong>olo et al. 2001) and parasitoids were shown to kill<br />
11 % <strong>of</strong> grasshopper (Dyssart 1995) and up to 38 % <strong>of</strong> butterfly eggs (Caldas 1994). Likewise it is<br />
known that wasps parasitize phasmid eggs (Chrysididae, Cleptidae ;Bedford 1978). Most likely<br />
M. diocles eggs face a wider array <strong>of</strong> mortality agents in its natural setting and egg mortality may be<br />
much higher than under lab conditions. Accordingly, egg mortality may be one important factor among<br />
a variety <strong>of</strong> population control factors acting on later life stages that explain low population densities <strong>of</strong><br />
M. diocles.
Life history & potential population growth 43<br />
Some minor restrictions <strong>of</strong> this study need comment. In general, the presented results are based on<br />
extensive data collection, and hence are considered safe from negative influence from lab conditions.<br />
Fecundity and adult lifetime <strong>of</strong> <strong>phasmids</strong> can be negatively affected by crowding (stress and epidemic<br />
diseases) and by poor quality <strong>of</strong> food plants (cf. Joern & Gaines 1990). I compensated for low quality<br />
food by providing animals with a range <strong>of</strong> fresh food plant species planted in pots. Diseases most likely<br />
played a role in the lab population because two major die-<strong>of</strong>fs <strong>of</strong> nymphs were observed during the<br />
study period. As stated in the introduction, negative density effects due to intraspecific competition<br />
cannot be avoided and epidemic diseases as competition-free situations are almost non-existent (Begon<br />
et al. 1996). Still, if these factors influenced the presented results, then this would weaken only my<br />
conclusion regarding the role <strong>of</strong> the ‘low’ biotic potential as one factor partially explaining low<br />
M. diocles density.<br />
3.4.4 Conclusions<br />
Clearly the presented model <strong>of</strong> population growth represents a synthetic situation while natural<br />
populations are exposed to an interplay between biotic and abiotic factors leading to fluctuating<br />
population densities as suggested for grasshoppers (Berryman et al. 1987, Joern & Gaines 1990). The<br />
comparably low biotic potential and the reduction <strong>of</strong> population growth by failed hatching <strong>of</strong> eggs are<br />
the first steps leading towards the understanding <strong>of</strong> why natural M. diocles population densities are low.<br />
Clearly, this approach lacks any explanation for population fluctuations. Reproductive output <strong>of</strong> females<br />
and hatching success vary depending on factors like the females physiological state, pathogens and egg<br />
predators, humidity and temperature (e.g., Bedford 1978; Chapman & Joern 1990; Bernays & Chapman<br />
1994). Nevertheless, I demonstrated that M. diocles, despite its comparably low reproductive output, has<br />
the potential to reach much higher densities than found in its natural setting (cf. Chapter 1).
Adult female feeding preference & nymph performance 44<br />
4 Preference <strong>of</strong> female adults and performance <strong>of</strong> larval<br />
stages <strong>of</strong> M. diocles on single food plant species<br />
4.1 Introduction<br />
In tropical forests, herbivores consume up to 11 % <strong>of</strong> annual leaf production (Coley & Barone 1996).<br />
Yet, despite high availability <strong>of</strong> plant tissue most herbivorous insects in the tropics are rare (Basset<br />
1996, 1999; Basset et al. 1992, 1996; Barone 1998; Novotny et al. 2002b). In the initial debate about the<br />
factors that keep insect herbivores at low densities, Hairston et al. (1960) suggested that natural enemies<br />
were responsible for the state <strong>of</strong> affairs. Alternatively it was suggested that plants themselves keep<br />
herbivores rare because they are poor food (McNeill & Southwood 1978; Janzen 1988), and that<br />
evolution has favored selection <strong>of</strong> plant defenses and high plant biodiversity as response to herbivore<br />
pressure (Ehrlich & Raven 1964; Janzen 1970; Connell 1971; Rhoades & Cates 1976; Coley et al.<br />
1985). In the meantime there is consensus that both, bottom-up and top-down regulation mechanisms<br />
maintain tropical herbivores at low densities and attention has shifted towards their relative roles (Pace<br />
et al. 1999; Persson 1999; Polis 1999; Dyer & Coley 2001).<br />
There is no doubt that most plants are poor food for particular herbivores, either because they are<br />
nutritionally inadequate or because they are poisonous (Southwood 1973; Lawton & McNeill 1979;<br />
Strong et al. 1984; Janzen 1988; White 1993). Low suitability <strong>of</strong> a plant is not necessarily a<br />
consequence <strong>of</strong> herbivore selection, as for example high fiber and lignin contents are inevitable for plant<br />
architecture (Hartley & Jones 1995). Regardless whether the evolution <strong>of</strong> poor quality <strong>of</strong> plant tissue<br />
reflects herbivore pressure or functional traits, nutritional quality has been implicated as a major factor<br />
in the debate about the roles in population regulation <strong>of</strong> herbivorous insects (House 1967; Onuf et al.<br />
1977; Onuf 1978; McClure 1980). Limitations in the value <strong>of</strong> plant tissue as food reflect bottom-up<br />
forces that influence herbivore performance determining larval growth rates, survival, adult size, and<br />
fecundity (e.g., Häggstrom & Larsson 1995; Burghardt & Fiedler 1996; Barker & Maczka 1996;<br />
Awmack & Leather 2002).<br />
Plants are inadequate food because plant tissues contain low amounts <strong>of</strong> nitrogen and protein (McNeill<br />
& Southwood 1978; Mattson 1980), sometimes they have lower water contents than animals (Scriber &<br />
Slansky 1981), and they have tough leaves (Feeny 1976; Lowman & Box 1983; Nichols-Orians &<br />
Schultz 1989). Plants also contain toxins, repellents, growth-inhibitors and digestibility reducing<br />
compounds that can be present all the time, i.e. constitutive secondary metabolites (Rosenthal &<br />
Berenbaum 1992). In addition, secondary metabolites may be induced in response to herbivore attack<br />
including phenols (Niemelä et al. 1979; Rossiter et al. 1988; Haukioja 1990; Kogan & Fischer 1991;
Adult female feeding preference & nymph performance 45<br />
Tscharntke et al. 2001), alkaloids and protease inhibitors (Baldwin & Ohnmeiss 1993; Baldwin 1996;<br />
Karban & Baldwin 1997; Baldwin et al. 1998; van Dam et al. 2001a).<br />
The defensive character <strong>of</strong> these plant traits has been documented in numerous studies. For instance,<br />
low water contents <strong>of</strong> leaves have been associated with reduced preference and performance <strong>of</strong> insects<br />
(Moran & Hamilton 1980; Mattson & Scriber 1987; Stamp & Casey 1993; Joern & Behmer 1997;<br />
Schädler et al. 2003). Leaf toughness is discussed to be the most effective physical defense (for review<br />
see Coley & Barone 1996 and references therein) and was shown to be negatively correlated with<br />
herbivory (Cherret 1968; Coley 1983; Lowman & Box 1983; Nichols-Orians & Schultz 1989; Reich et<br />
al. 1991; but see Landa & Rabinowitz 1983). Tannins can act in a dosage-dependent manner (Feeny<br />
1970, Rhoades 1977; Coley 1986) and can be toxic or deterrent to particular herbivores (reviewed in<br />
Bernays et al. 1989). Phenolic compounds may be induced in response to insect damage and increased<br />
phenolic contents then may negatively affect herbivores (e.g., Niemelä et al. 1979; Rossiter et al. 1988;<br />
Haukioja 1990; Kogan & Fischer 1991; Tscharntke et al. 2001). Such chemical defenses are compounds<br />
that affect either the digestion <strong>of</strong> biomass or have toxic effects after being absorbed. Physical leaf<br />
properties, such as toughness and water content, reduce the digestion <strong>of</strong> biomass. Compared with<br />
studies on chemical defenses, there are fewer studies that have demonstrated that the physical structure<br />
<strong>of</strong> plants can prevent or influence herbivory (Sanson et al. 2001).<br />
Confronted with these factors lowering the value <strong>of</strong> foods herbivores must assess more variables to<br />
determine food selection than do carnivores (Stephens & Krebs 1986). Thus herbivores forage within<br />
higher nutritional constraints than carnivores (Southwood 1973), the more as plant tissue is lower in<br />
nutrients and higher in non-digestible structural materials than the body tissues that must be built from<br />
these (e.g., Mattson 1980). A single food type <strong>of</strong> such poor or even toxic quality rarely will provide all<br />
essential nutrients for survival. As a consequence herbivores may feed selectively on a mixture <strong>of</strong> plants<br />
(Joern 1979; Cates 1980; Bernays et al. 1994) or on plant parts <strong>of</strong> differing quality (Bernays &<br />
Chapman 1994).<br />
Nutritional requirements <strong>of</strong> herbivores are not consistent within a population (Cates 1980; Karowe<br />
1989). Individual variation in dietary constraints may exist as a function <strong>of</strong> age, sex or morphology<br />
(Boys 1978; Sandlin & Willig 1993; Bernays & Chapman 1994; van Dam et al. 2001b). During<br />
developmental stages nutritional requirements may differ (Bernays & Chapman 1994) and particular<br />
plant defenses may influence early larval instars stronger than later instars (van Dam et al. 2001b).<br />
Feeding habits <strong>of</strong> adult herbivores may reflect previous feeding experience as a consequence <strong>of</strong> induced<br />
preferences or physiological specialization throughout an individual’s lifetime (Cassidy 1978; Papaj &<br />
Prokopy 1988; Redfearn & Pimm 1988; Karowe 1989; Sandlin & Willig 1993) and female adult feeding<br />
behavior may be linked to preferential oviposition (Bernays & Chapman 1994). Above that adult insects<br />
experience additional reproductive constraints. Especially females may be more nutrient limited than
Adult female feeding preference & nymph performance 46<br />
males considering the relatively higher reproductive investment (Boys 1978; Bernays & Chapman<br />
1994).<br />
Explaining the effects <strong>of</strong> food quality on herbivores one has to differentiate between generalists and<br />
specialists. According to biochemical coevolution, herbivore generalists should be more susceptible to<br />
qualitative toxic chemical plant defenses than specialists (Ehrlich and Raven 1964; Feeny 1976; Cornell<br />
& Hawkins 2003). Thus generalist herbivores may have complex diets to meet nutritional requirements<br />
while avoiding plant defenses (Belovsky 1984). Specialized herbivores that overcome such plant<br />
defenses by detoxifying or even sequestering plant compounds should be less affected. Consequently<br />
specialists such as mono- or oligophagous herbivores may particularly respond to physical defenses<br />
such as leaf toughness and water content.<br />
The study presented here assessed the impact <strong>of</strong> interspecific variation in food quality due to physical<br />
and chemical defensive leaf traits on preference and performance <strong>of</strong> the walking stick Metriophasma<br />
diocles.<br />
As shown before (see Chapter 2 and Berger & Wirth 2001) M. diocles feeds exclusively on plants from<br />
two different plant families, the Piperaceae and Araceae. According to recent phylogenetic analyses<br />
these plant families are not closely related (Judd et al. 2002). The Piperaceae are phylogenetically<br />
separated from other dicots, which may involve differences in phytochemistry (Judd et al. 2002). In<br />
fact, Piper species are characterized by a wide array <strong>of</strong> phenolic compounds (Sengupta & Ray 1987;<br />
Baldwin & Schultz 1988; Parmar et al. 1997; Dyer et al. in press), many <strong>of</strong> them deterring insect<br />
herbivores (Parmar et al. 1997 and references therein). Likewise the Araceae as monocots are distinct<br />
from dicots in many features. Araceae were characterized by the (probably) universal presence <strong>of</strong><br />
tannins (Grayum 1990), they contain calcium oxalate crystals, cyanogenic compounds, and sometimes<br />
alkaloids, all known to deter herbivores (Judd et al. 2002 and references therein). Although M. diocles<br />
seems to be able to detoxify such toxic or deterrent plant chemicals (cf. Chapter 2), the phylogenetic<br />
distance <strong>of</strong> Araceae and Piperaceae does not allow to conclude on a strict coevolutionary scenario<br />
(sensu Ehrlich & Raven 1964; Strong et al. 1984). Such specialization on distantly related hosts is best<br />
described as disjunct oligophagous (Chapter 2; Bernays & Chapman 1994). Considering M. diocles as<br />
herbivore specialist, I hypothesized that preference and performance <strong>of</strong> this species would rather be<br />
explained by physical leaf characters than by content <strong>of</strong> chemical compounds.<br />
In particular, (1) I assessed interspecific differences in food quality <strong>of</strong> M. diocles host plant species on<br />
the base <strong>of</strong> leaf toughness, water content, specific leaf weight (SLW), tannin and total phenol contents.<br />
By the use <strong>of</strong> feeding trials, (2) I ranked host-plant species according to female adult preference and (3)<br />
surveyed nymph performance (sensu survival and growth) on single plant species. (4) By correlation<br />
analysis I examined the relation <strong>of</strong> defensive leaf traits to adult preference and nymph performance. In
Adult female feeding preference & nymph performance 47<br />
addition (5) I tested whether nymphs were sensitive towards increasing levels <strong>of</strong> leaf tannin or total<br />
phenol contents reflecting induced responses <strong>of</strong> the host to herbivory.<br />
Defensive leaf traits were either measured from leaves that were fed to adult females in feeding trials<br />
(water content, SLW, tannin, phenol) or from leaves sampled from the M. diocles habitat (toughness).<br />
Specific leaf weight (sometimes referred to as leaf mass per area – LMA) is the product <strong>of</strong> leaf thickness<br />
and dry matter concentration (Witkowski & Lamont 1991) and reflects structural reinforcement <strong>of</strong><br />
leaves. SLW shows a strong positive relationship with leaf lifespan across species (Wright & Cannon<br />
2001) reflecting the important role <strong>of</strong> structural reinforcement <strong>of</strong> leaves in determining their lifespan<br />
presumably by rendering them less susceptible to herbivory (e.g., Bernays & Chapman 1970; Schädler<br />
et al. 2003).<br />
To assess feeding preference I conducted dual-choice feeding trials with 15 host plant species <strong>of</strong><br />
M. diocles. I concentrated on adult females because they are more nutrient limited than males, they are<br />
larger than males (see Chapter 3) - a pattern found consistently in <strong>phasmids</strong> (Bedford 1978) - and they<br />
invest more in reproduction (Boys 1978; Bernays & Chapman 1994). In addition female longevity<br />
directly affects population increase as demonstrated in Chapter 3.<br />
I surveyed nymph growth and survival on 13 single host plant species over the course <strong>of</strong> six weeks.<br />
Nymphs should be affected stronger by low food quality and it was argued that shortage in suitable food<br />
may be the main mortality factor in early lifestages <strong>of</strong> insect herbivores (Joern & Gaines 1990).<br />
Because biochemical differences in leaves may increase with taxonomic distance <strong>of</strong> plant species<br />
(Ehrlich & Raven 1964; Rhoades & Cates 1976) differences in phytochmistry between Araceae and<br />
Piperaceae may cover effects <strong>of</strong> other defensive traits. To account for taxonomical dissimilarities in<br />
plant chemistry correlation analysis <strong>of</strong> prefernce and performance with leaf traits was repeated under<br />
exclusion <strong>of</strong> the Araceae (2 species).<br />
Finally, I expected adult preference to relate to nymph performance because phasmid adults were shown<br />
to display preferences based on previous feeding experience as nymphs (Cassidy 1978; Sandlin &<br />
Willig 1993).<br />
4.2 Materials and methods<br />
For details on study site, identification <strong>of</strong> plant species and maintenance <strong>of</strong> the M. diocles lab population<br />
please refer to Chapter 1.<br />
Feeding trials on preference <strong>of</strong> M. diocles adult females and performance <strong>of</strong> nymphs were conducted<br />
from March 2000 to January 2002 on Barro Colorado Island, Panama.<br />
Feeding trials on nymph preference under varying phenol and tannin leaf contents took place from April<br />
2002 to June 2002 at the Technical University <strong>of</strong> <strong>Kaiserslautern</strong>, Germany.<br />
Phenol and tannin leaf contents were assessed from freeze-dried leaves in February and March 2003 at<br />
the Technical University <strong>of</strong> <strong>Kaiserslautern</strong>, Germany.
Adult female feeding preference & nymph performance 48<br />
4.2.1 Measuring leaf traits<br />
Relative leaf toughness, water content, specific leaf weight, total phenol and tannin content were<br />
assessed for mature leaves <strong>of</strong> 15 host plant species <strong>of</strong> M. diocles.<br />
Leaves were collected in the vicinity <strong>of</strong> the BCI laboratories at the forest edge and in the understory. No<br />
more than three leaves were collected per plant individual to cover intraspecific variation in leaf traits.<br />
Leaves were stored in zip log bags in a cooler until measurements were taken.<br />
Data for leaf water content and specific leaf weight derived from leaves used in dual choice feeding<br />
trials and are expressed as species-specific means (for sample size see Table 4-1). For details see<br />
Chapter 4.2.2.<br />
4.2.1.1 Measuring leaf toughness<br />
Coley and Barone (1996) considered leaf toughness as the most effective plant defense. For this reason I<br />
decided to use the M. diocles host plant species with lowest leaf toughness as reference in dual-choice<br />
feeding trials (see Chapter 4.2.2). Consequently I had to measure leaf toughness before starting<br />
preference tests. This initial screening included nine Piper and two Philodendron species. From these<br />
species I collected six leaves from six individuals each in the nearby vicinity <strong>of</strong> the BCI laboratory and<br />
took toughness measurements as described below. Later, when preference tests were already running, I<br />
added four more Piper species. Here, I measured toughness <strong>of</strong> all leaves that were used in dual-choice<br />
feeding trials. For these reasons sample sizes for toughness measurements vary among species (for<br />
sample size see Table 4-1).<br />
Leaf toughness was measured using a Chatillon penetrometer (Chatillon Co. Ltd., New York; rod<br />
diameter = 3.25 mm; one unit represents a force <strong>of</strong> 1 g * 8.3 mm -2 ) (alternative methods are described<br />
by Choong 1996). As I wanted to measure the strength an herbivore needs to cut leaf tissue I had to<br />
assure to minimize tissue flexibility. Therefore each leaf was positioned between two Plexiglas plates<br />
seated on four stands. The Plexiglas plates were perforated with holes <strong>of</strong> 5mm diameter both. Upraising<br />
the plates prevented from flawed measurements as the punching rod may jump back up if it hits a hard<br />
surface directly after having pierced the leaf tissue. From each leaf I took 10 measurements. Mayor leaf<br />
veins were avoided. Toughness was calculated on a relative scale as species-specific mean toughness <strong>of</strong><br />
mature leaves.<br />
4.2.1.2 Leaf phenol and tannin content<br />
To evaluate leaf foliar chemistry freeze-dried leaves from dual-choice feeding trials were ground and<br />
extracted in 70 % aqeuous acetone (Hagerman 1988).<br />
Total phenolics were assayed using the technique <strong>of</strong> Price & Butler (1977) modified by Mole &<br />
Waterman (1994). The reaction is an oxidation-reduction in which the phenolate ion is oxidized and<br />
ferric irons are reduced to the ferrous state forming the Prussian Blue complex. Phenolic content is then<br />
measured spectrophotometrically.
Adult female feeding preference & nymph performance 49<br />
Tannins were measured with the radial diffusion method (RDM; Hagerman 1987). The RDM is a<br />
protein-binding assay that can be used to determine the amount <strong>of</strong> both condensed and hydrolysable<br />
tannin albeit the method is more sensible to hydrolysable tannins (Hagerman 1987). The tannic solution<br />
is placed in a petry dish with a bovine serum albumine (BSA) containing agar. As tannin diffuses into<br />
the gel it reacts with BSA and protein precipitation becomes visible as a ring. The area <strong>of</strong> the ring is<br />
proportional to the tannin content <strong>of</strong> the extract.<br />
Both total phenols and tannins were measured from 5 leaves <strong>of</strong> 14 plant species each, and from 20<br />
leaves for P. marginatum (see Table 4-2). For extractions I used approximately 50 mg dry leaf material.<br />
Price and Butler phenolics and tannins are reported as percent Tannic Acid Equivalent (% TAE) per g<br />
dry leaf weight derived from standard curves using tannic acid as a standard.<br />
4.2.2 Dual-choice feeding trials with M. diocles adult females<br />
The synchronous <strong>of</strong>fer <strong>of</strong> food alternatives is a way to reveal the relative preference for a given plant<br />
(e.g., Krebs 1989). To assess preference <strong>of</strong> adult M. diocles females I performed dual-choice feeding<br />
trials. In such a design preference for a plant species (tested species) is expressed as relative preference<br />
in comparison to a fixed reference plant species (Richardson & Whittaker 1982). In varying test plant<br />
species dual-choice tests <strong>of</strong>fer the possibility to assess a food rank order.<br />
M. diocles females were presented with leaves <strong>of</strong> two different plant species: Piper marginatum always<br />
served as reference, while the test plant species varied. I decided for P. marginatum for two reasons: (1)<br />
In field records M. diocles pro<strong>of</strong>ed to be highly associated with plants <strong>of</strong> the genus Piper, in particular<br />
with P. marginatum (cf. Chapter 2). And (2) P. marginatum pro<strong>of</strong>ed to have the leaves with lowest<br />
toughness (see Figure 4-2). According to Coley & Barone (1996) leaf toughness may be the strongest<br />
herbivore defense and consequently the plant species with lowest toughness should be preferred. In a<br />
pre-study I measured leaf toughness <strong>of</strong> 11 host-plant species (see Chapter 4.2.1): P. marginatum had the<br />
lowest leaf toughness (Table 4-1).<br />
Test animals were caught in the field or reared in a laboratory population. As feeding behavior <strong>of</strong> adult<br />
<strong>phasmids</strong> may reflect prior feeding experience (Cassidy 1978; Sandlin & Willig 1993), animals in the<br />
lab were fed with all according food plant species simultaneously.<br />
I tested preference <strong>of</strong> M. diocles females for 12 Piper and two Philodendron test plant species. Leaves<br />
for feeding trials were collected in the vicinity <strong>of</strong> the BCI laboratory. No more than three leaves were<br />
collected per plant individual to cover intraspecific variation in leaf characters. Leaves were put in a<br />
plastic zip log bag, which then was kept on ice in a cooler to keep the leaf material fresh. Between every<br />
following step in handling the leaves were stored coolly.<br />
Leaves first were marked individually using a waterpro<strong>of</strong> marker. Then every leaf was cut in two along<br />
the midrib. The half attached to the midrib was used for the feeding trial. Its area was measured using a<br />
Leaf Area Meter LI-3100 (LI-COR inc., Lincoln, USA) on 1 mm 2 area resolution. Both the share <strong>of</strong> the<br />
reference and the test leaf were put together with their petioles sticking in a water filled vial being
Adult female feeding preference & nymph performance 50<br />
closed with cotton batting. The vial then was attached to a wire clamp in a single feeding arena so that<br />
leaves stood upright. When all arenas were equipped, I collected the animals from the lab colony and<br />
started the trial by setting one adult female in each arena. A trial usually started around noon and then<br />
lasted 24 hours. To quantify consumption, leaf area was measured again after a trial was finished.<br />
The second half <strong>of</strong> each leaf was used for measuring water content. For assessing water content I used a<br />
punch to get a leaf disc <strong>of</strong> 15 mm diameter, which was weighed and then freeze-dried for at least three<br />
days. Afterwards dry mass was weighed. By that I could calculate water content for each leaf used in<br />
feeding trials. The leaf remnants also were freeze-dried for analysis <strong>of</strong> leaf phenol and tannin contents.<br />
Each M. diocles female was used only once per test plant species. I conducted 30 plus individual choice<br />
tests for each <strong>of</strong> 14 test plant species (for sample size see Table 4-1). Differences in numbers <strong>of</strong><br />
replicates resulted from females that did not feed in trials and from females having died while the<br />
choice-test was running. For Piper arboreum only 20 replicates could be accomplished, as no more<br />
females were available.<br />
4.2.3 Problems inherent with dual-choice feeding trials<br />
To assure the accuracy <strong>of</strong> the results from choice tests I addressed two major problems inherent in the<br />
use <strong>of</strong> feeding trials: Food choice <strong>of</strong> an animal may be based on prior feeding experience (e.g., Sandlin<br />
& Willig 1993) and the selection <strong>of</strong> the reference test plant may affect the preference ranking (see e.g.,<br />
Richardson & Whittaker 1982; Capinera 1985).<br />
4.2.3.1 Conditioning due to prior feeding experience<br />
The number <strong>of</strong> females in the lab colony generally restricted the number <strong>of</strong> replicates. As a basic<br />
principle no individual was used twice with the same test plant species. But individuals had to be<br />
deployed in feeding trials with different test plant species, i.e. preference data in different choice-tests<br />
(e.g. P. grande and P. hispidum as test plant species) origin from the same female. As a consequence<br />
prior experience and conditioning on a particular food source <strong>of</strong> these females could have influenced the<br />
outcome <strong>of</strong> succeeding choice tests. The resulting question was whether females <strong>of</strong> M. diocles showed<br />
such conditioning behavior or whether they acted naively in every new choice situation. Only in the<br />
latter case data gathered in feeding trials would be independent as every female in every new choice<br />
situation differentiated among <strong>of</strong>fered food sources.<br />
To test for female naivety I designed a sequence <strong>of</strong> two dual-choice tests with different test plant species<br />
(P. grande and P. hispidum) and P. marginatum as reference. In both dual-choice tests identical females<br />
were used. The procedure <strong>of</strong> the feeding trials followed the protocol as described above (Chapter 4.2.2).<br />
In case food selection was influenced by prior experience, I assumed females to display similar<br />
preference patterns in succeeding feeding trials. In contrast to this expectation food preference <strong>of</strong><br />
females differed significantly (Figure 4-1). The preference shift from P. hispidum in test 1 towards<br />
P. marginatum in test 2 clearly demonstrated that in the following choice-test females decided in a naïve
Adult female feeding preference & nymph performance 51<br />
manner and favored the formerly disregarded plant species. This result was supported by pair wise<br />
comparisons <strong>of</strong> choice-tests that shared female individuals. The exclusion <strong>of</strong> females that were not<br />
shared between these dual-choice feeding trials always resulted in a pattern consistent with the<br />
preference pattern for all females (data not shown).<br />
mean acceptability index (MAI)<br />
100<br />
80<br />
60<br />
40<br />
20<br />
0<br />
Median<br />
25%-75%<br />
Min-Max<br />
(1) Pmarg - Phisp (2) Pmarg - Pgran<br />
Figure 4-1: Comparison <strong>of</strong> paired dual-choice preference tests <strong>of</strong> M. diocles adult females. Identical individuals<br />
were used in both tests to control for influence <strong>of</strong> prior feeding experience (for details see text; Wilcoxon paired<br />
signed rank test, T = 21, N = 21, P < 0.01).<br />
4.2.3.2 Choice <strong>of</strong> reference plant species<br />
A further problem inherent with dual-choice feeding trials lies within the choice <strong>of</strong> the reference plant<br />
species. The observed preference pattern could result from discrimination towards a particular plant<br />
species and change if an alternative reference was <strong>of</strong>fered (Richardson & Whittaker 1982). Hence the<br />
preference pattern may not be consistent if observed with different plant species serving as reference.<br />
To account for this problem I conducted a series <strong>of</strong> dual-choice feeding trials using Piper hispidum as<br />
reference plant species and compared the resulting MAI with preference assessed against P. marginatum<br />
in pair wise Mann-Whitney U-tests (test species: P. aequale, P. dilatatum, Phil. sp., P. reticulatum).<br />
Changing the reference plant species did not change the overall preference pattern <strong>of</strong> M. diocles adult<br />
females. MAI resulting from dual-choice feeding trials with different reference plant species<br />
(P. marginatum and P. hispidum) did not differ (all p > 0.35).
Adult female feeding preference & nymph performance 52<br />
4.2.4 Long term feeding trials with M. diocles nymphs<br />
To document growth and mortality <strong>of</strong> M. diocles nymphs I conducted long term feeding trials on single<br />
host plant species. At least 30 nymphs were raised on each <strong>of</strong> 13 food plant species. All performance<br />
trials lasted 6 weeks (performance sensu survival and growth).<br />
The selection <strong>of</strong> food plant species resulted from diet assessment from field records and no-choice<br />
feeding trials <strong>of</strong> M. diocles (see Chapter 2). Because Piper spp. were the main potential food sources in<br />
the field I tested 10 Piper species to evaluate interspecific differences in diet suitability <strong>of</strong> congeners. I<br />
included three species <strong>of</strong> Araceae: two Philodendron species were also recorded as potential food in the<br />
field whereas no M. diocles individual was found on Dieffenbacchia longispatha (but D. longispatha<br />
was accepted in no-choice feeding trials). Due to partial lack <strong>of</strong> nymphs and to restrictions in labor<br />
potential I could not include all Piper species tested in adult female preference tests.<br />
Newly hatched nymphs were weighed and then separately kept in plastic food containers (10cm wide,<br />
5cm deep, 5cm high). Adult leaves were harvested in the forest, placed in a sealed plastic zip log bag<br />
and brought back to the laboratory. Within 2 hours <strong>of</strong> being collected leaf discs (punch <strong>of</strong> 13 mm<br />
diameter) were cut and presented to nymphs. Leaf discs were stuck into a piece <strong>of</strong> cardboard to assure<br />
free access for the nymph. A piece <strong>of</strong> humid paper towel helped minimizing desiccation. If multiple<br />
nymphs hatched on the same day they were allocated to different food plant species. Nymphs then were<br />
provided with new food daily and controlled for survival. To document growth, nymphs were weighed<br />
in weekly periods.<br />
4.2.5 Dual-choice feeding trials with M. diocles nymphs<br />
This experiment was conducted at the Technical University <strong>of</strong> <strong>Kaiserslautern</strong>, Germany.<br />
P. hispidum plants were grown in greenhouses from cuttings I imported from Panamá. M. diocles<br />
nymphs had hatched from eggs I previously had collected from a lab population at Barro Colorado<br />
Island, Panamá.<br />
As defensive or deterring effects <strong>of</strong> phenolic or tannic compounds may be dose-dependent (Feeny 1970;<br />
Rhoades 1977; Coley 1986), I designed a test series <strong>of</strong> dual-choice feeding trials where nymphs were<br />
<strong>of</strong>fered leaf discs with artificially increased natural phenol and tannin contents by use <strong>of</strong> a method<br />
described by Beyschlag & Pfanz (1990) and modified by Herz (unpublished). Beyschlag & Pfanz<br />
(1990) used pressure infiltraton <strong>of</strong> water into a leaf via the stomatal pores to determine stomatal<br />
aperture. Herz (unpublished) used this method to infiltrate sugar solutions in leaves and <strong>of</strong>fered these to<br />
leaf cutting ants. I modified the method as I used leaf discs (15 mm punch) <strong>of</strong> Piper hispidum and<br />
infiltrated aqueous solutions <strong>of</strong> tannic acid and <strong>of</strong> total phenol extract from P. hispidum leaves.<br />
Phenolic compounds were extracted with 70 % aqueous aceton from P. hispidum leaves following the<br />
same procedure as described by Waterman & Mole (1994). Aceton and water <strong>of</strong> the phenolic solution<br />
evaporated within 48 hours under room temperature and the remaining phenolic aliquot was resolved in
Adult female feeding preference & nymph performance 53<br />
distilled water. The phenolic content <strong>of</strong> the resulting solution was assessed by the Price and Butler<br />
method (1977) as described above. In preliminary infiltration trials I assessed the amount <strong>of</strong> water that<br />
could be infiltrated into leaves (27.4 ± 4.3 % fresh weight). In combination with dry weight and natural<br />
total phenol contents <strong>of</strong> P. hispidum leaves I could then calculate the concentration <strong>of</strong> solution needed to<br />
yield particular increases <strong>of</strong> % TAE in leaf discs.<br />
Infiltration was carried out with a 50 ml syringe filled with approximately 25 ml <strong>of</strong> aqueous phenol or<br />
tannin solution (or water for the control). Immediately after punching the disc was weighed and put in<br />
the syringe. All remaining air was removed through the outlet. Then the outlet was closed and the piston<br />
was forcefully pulled outward the depression leading to an evacuation <strong>of</strong> the internal air and the<br />
intercellular space. Simultaneously the syringe was shaken to remove gas bubbles from the leaf surface<br />
and prevent them from entering the leaf disk during the following infiltration process. By slowly<br />
pushing the piston back into the syringe the solution (or water) column was set under pressure and<br />
entered the leaf via open stomatal pores and via intercellular space at the cutting edges. After<br />
infiltritation the leaf disc surface was dried carefully with a peace <strong>of</strong> paper towel and weighed again.<br />
Weight gain was considered as infiltrated amount <strong>of</strong> solution (water). In combination with natural total<br />
phenol contents <strong>of</strong> leaves and their dry weight infiltrated percent TAE in the leaf disc was calculated.<br />
Until the start <strong>of</strong> the feeding trials leaf discs were kept on ice.<br />
First instar nymphs <strong>of</strong> M. diocles were presented with two leaf discs: 1) infiltrated with water (control)<br />
and 2) infiltrated with the according solution (treatment).<br />
Nymphs were set in plastic food containers (10 cm wide, 5 cm deep, 5 cm high). Leaf discs were stuck<br />
into a piece <strong>of</strong> cardboard to assure free access for the nymph. A piece <strong>of</strong> humid paper towel helped<br />
minimizing desiccation. Climate chambers allowed for conditions similar to the tropics (27 o C average<br />
temperature, 70 to 90 % relative humidity). Dual-choice feeding trials lasted 24 hours. This was a<br />
sufficient time span to assess preference because a preliminary test on dual-choice feeding trials over<br />
three days showed no differences in preference among days (Friedmans ANOVA χ 2 (N=38, FG=2) = 1.28,<br />
P < 0.53). After finishing the trial consumed leaf area was measured with a transparent grid. Preference<br />
was then calculated on the base <strong>of</strong> consumed dry weight (see Chapter 4.3.2).<br />
To assure that infiltration did not alter feeding behavior I tested normal leaf discs against water<br />
infiltrated leaf discs. Both, control and treatment were fed equally resulting in a relative preference <strong>of</strong><br />
0.5 indicating that infiltration did not affect feeding behavior (compare to control in Figure 4-12 &<br />
Figure 4-13).<br />
4.3 Data analysis<br />
Multiple groups where compared in Analysis <strong>of</strong> Variance. ANOVA assumes normality <strong>of</strong> data and<br />
homogeneity <strong>of</strong> variances. If not stated differently data transformation resulted in normally distributed<br />
data and allowed minimizing differences in variances whereas homogeneity <strong>of</strong> variances could not be
Adult female feeding preference & nymph performance 54<br />
attained in all cases. However, failure to meet the assumption <strong>of</strong> homogeneity <strong>of</strong> variances is not fatal to<br />
ANOVA. Analysis <strong>of</strong> Variance still remains robust, even when groups are <strong>of</strong> different sample sizes (Zar<br />
1999, p. 185 and references therein).<br />
Data on leaf toughness, specific leaf weight and total phenol content were log-transformed before<br />
statistical analysis. As water content and MAI were expressed on a relative scale data were arcsine<br />
transformed. Interspecific variation in leaf characters was then analyzed in ANOVA.<br />
4.3.1 Analysis <strong>of</strong> preference<br />
In relation to P. marginatum preference <strong>of</strong> M. diocles females for 12 Piper and two Philodendron<br />
species was tested. On the base <strong>of</strong> consumed leaf dry material I calculated a mean acceptability index<br />
(MAI) (Richardson & Whittaker 1982) from the ratios <strong>of</strong> consumed dry weight (dw) <strong>of</strong> test material to<br />
the total <strong>of</strong> consumed dry weight in each replicate:<br />
(Equation 4-1)<br />
[consumed dw] test<br />
MAI =<br />
[consumed dw] + [consumed dw]<br />
test<br />
reference<br />
The MAI allows to group plant species to their ranking as acceptable food source <strong>of</strong> a distinct phasmid<br />
species and ranges from cero to one. MAI-values below 0.5 and down to cero thereby indicate<br />
preference for P. marginatum whereas values above 0.5 represent preference towards the test plant<br />
species.<br />
Consumption ratios from feeding trials were not normally distributed. The distribution <strong>of</strong> MAI values<br />
was two-tailed as 0 and 1 ratios derived frequently resulting from females eating only one food source.<br />
Consequently differences in preference among food plant species were tested by nonparametric<br />
Kruskal-Wallis ANOVA. Preference is expressed as median MAI.<br />
The median <strong>of</strong> the MAI corresponded significantly with its mean (Product Moment Correlation r = 0.98,<br />
df = 12, P < 0.01) and median MAI values were normally distributed. Thus the relationships between<br />
each leaf trait and the established preference pattern were analyzed in parametric Product Moment<br />
Correlation Analysis.<br />
A test series <strong>of</strong> dual-choice feeding trials was conducted where nymphs were <strong>of</strong>fered leaf discs with<br />
artificially increased phenol and tannin contents. Resulting preferences, expressed as MAI, were<br />
compared in Mann-Whitney U-tests. The calculation <strong>of</strong> the MAI is described above.<br />
4.3.2 Analysis <strong>of</strong> performance<br />
Survival <strong>of</strong> nymphs was analyzed by the Kaplan-Meier estimate (also known as the product-limit<br />
estimate). The survival function gives the probability that an individual survives past a given time.<br />
Differences in survival times were analyzed by the Mantel-Cox log-rank test (Mantel 1966; Cox 1972).<br />
Under the assumption that deaths <strong>of</strong> nymphs were independent the Mantel-Cox test proved suitable for<br />
the dataset as it gives equal weight to all events.
Adult female feeding preference & nymph performance 55<br />
For reasons <strong>of</strong> sample size resulting from partially high nymph mortality (in D. longispatha and<br />
P. grande no nymphs had survived beyond week three) relative growth rates <strong>of</strong> nymphs were calculated<br />
after approximately 14 days. For the same reasons weight measures spread from day eight to day 17<br />
with 73 % <strong>of</strong> values referring to days 11 to 16. To account for temporal differences growth was<br />
calculated on a daily base as growth rate [mg*d -1 ]. Initial weight <strong>of</strong> nymphs was significantly different<br />
among groups (i.e., nymphs fed on different plant species) (ANOVA, F = 31.9, df = 12, P < 0.01).<br />
Calculation <strong>of</strong> relative growth rates (RGR) accounted for initial weight <strong>of</strong> nymphs and incorporated<br />
possible covariate effects:<br />
Equation 4-2<br />
final weight - initial weight 1<br />
RGR =<br />
×<br />
days<br />
initial weight<br />
The relative growth rate expresses the weight gain relative to the initial weight at the start <strong>of</strong> an<br />
experiment per unit time (relative weight gain per day).<br />
Plant species-specific relative growth rates <strong>of</strong> nymphs were then compared in Analysis <strong>of</strong> variance<br />
(ANOVA).<br />
The relationships between each leaf trait and survival and growth <strong>of</strong> nymphs were analyzed in<br />
parametric Product Moment Correlation Analysis. D. longispatha was not included in correlation<br />
analysis, because representative measurements <strong>of</strong> leaf traits could not be taken before the end <strong>of</strong> the<br />
study period.<br />
4.4 Results<br />
4.4.1 Interspecific differences in physical and chemical leaf properties<br />
All measured leaf characters showed significant interspecific differences indicating that host plant<br />
species <strong>of</strong> M. diocles varied in nutritional quality. Mean values are listed in Table 4-1 including the<br />
short names for plant species that are used in the Figures.<br />
M. diocles food plants showed expressed heterogeneity in leaf toughness (Figure 4-2). Relative leaf<br />
toughness varied significantly among host plant species with leaves <strong>of</strong> Philodendron sp. possessing a<br />
fivefold higher relative toughness (505.47 ± 41.68) than Piper marginatum (102.40 ± 14.82). Although<br />
P. marginatum had lowest leaf toughness there was no significant difference to P. arboreum and<br />
P. hispidum. All tested Piper species showed significantly lower relative toughness in leaf tissue than<br />
the tested Araceae <strong>of</strong> the genus Philodendron. However, variation in toughness among Piper congeners<br />
was considerably high: P. cordulatum and P. grande (296.37 ± 29.98 and 323.36 ± 31.38) had threefold<br />
tougher leaves than P. marginatum. The pattern <strong>of</strong> interspecific differences in relative leaf toughness<br />
seemed to be expressed stronger than patterns assessed from other leaf characters (see below). No more<br />
than three plant species had similar toughness values.
Adult female feeding preference & nymph performance 56<br />
Table 4-1: Physical leaf traits <strong>of</strong> 15 M. diocles host plant species. Measurements for water content and specific<br />
leaf weight were taken in dual-choice feeding trials with female adults, accordingly the number <strong>of</strong> leaves per<br />
species (N) equals the number <strong>of</strong> preference tests.<br />
Plant species (short name)<br />
Relative toughness* Water content* SLW*<br />
N [%] [mg*cm -2 ] N*<br />
Piper marginatum (Pmarg) 36 102.40 ± 14.83 77.98 ± 4.94 2.86 ± 0.80 422<br />
Piper aequale (Paequ) 36 234.61 ± 33.26 78.13 ± 3.23 3.74 ± 0.77 31<br />
Piper arboreum (Parbo) 20 105.92 ± 8.30 72.45 ± 2.44 5.73 ± 0.82 20<br />
Piper cordulatum (Pcord) 36 323.36 ± 31.38 83.83 ± 1.92 5.49 ± 0.68 31<br />
Piper culebranum (Pcule) 36 175.53 ± 18.82 75.20 ± 6.86 4.31 ± 1.17 32<br />
Piper dariense (Pdari) 30 171.19 ±25.55 76.90 ± 2.13 3.77 ± 0.38 30<br />
Piper dilatatum (Pdila) 36 121.42 ± 24.56 76.20 ± 3.44 4.04 ± 1.07 32<br />
Piper grande (Pgran) 24 296.38 ± 29.98 78.49 ± 3.05 4.19 ± 0.66 30<br />
Philodendron ineaquilaterum<br />
(Philinae)<br />
36 471.72 ± 18.87 77.68 ± 1.52 3.55 ± 0.27 30<br />
Philodendron sp. (Philsp) 36 505.47 ± 41.68 85.77 ± 1.52 4.69 ± 0.49 31<br />
Piper peltatum (Ppelt) 36 108.36 ± 18.68 76.90 ± 3.86 3.60 ± 0.90 31<br />
Piper perlascense (Pperl) 30 148.22 ± 21.70 72.00 ± 5.41 3.97 ± 0.77 30<br />
Piper reticulatum (Preti) 36 163.17 ± 19.79 80.68 ± 3.83 2.76 ± 0.77 31<br />
Piper hispidum (Phisp) 30 134.61 ± 14.19 70.23 ± 6.03 3.82 ± 0.61 30<br />
Piper imperiale (Pimpe) 36 279.08 ± 31.28 64.65 ± 5.94 6.02 ± 1.30 32<br />
* Mean ± StDev<br />
** the same as number <strong>of</strong> dual-choice feeding trials<br />
Leaf toughness was thought to be the primary defensive structural leaf trait. Consequently, I used<br />
Piper marginatum (with lowest leaf toughness) as reference plant species in dual-choice feeding trials.<br />
In the following figures P. marginatum is shown as the first species opposed to test plant species in<br />
alphabetical order.<br />
Leaf water content was not as heterogeneous among species as leaf toughness (Figure 4-3). The leaves<br />
<strong>of</strong> eight species shared similar water contents between 72 % (mean wc <strong>of</strong> P. imperiale) and 78 % (mean<br />
wc <strong>of</strong> P. marginatum). And average leaf water contents <strong>of</strong> 12 M. diocles host plant species ranged from<br />
approximately 70 to 80 %. However, P. cordulatum and Philodendron sp. had significantly higher water<br />
contents (83.83 ± 1.91 % and 85.77 ± 1.51 % respectively) and differed from the 13 other species.<br />
Notably Philodendron sp. also differed from all species in toughness and P. cordulatum had tougher
Adult female feeding preference & nymph performance 57<br />
leaves than its congeners. Both species have thick and fleshy (almost succulent) leaves. With 64.65<br />
± 5.94 % the leaves <strong>of</strong> P. reticulatum had significantly lower water than all other plant species.<br />
In general the pattern <strong>of</strong> variation in structural reinforcement <strong>of</strong> leaves (expressed as specific leaf<br />
weight) was opposed to the interspecific pattern <strong>of</strong> water content (Figure 4-4). This is an indication that<br />
most species shared similar thickness <strong>of</strong> leaves (specific leaf area - the reciprocal <strong>of</strong> SLW - is a measure<br />
<strong>of</strong> leaf thickness). However P. cordulatum and Philodendron sp. the species that possessed maximum<br />
water content both had significantly higher SLW than most other plant species reflecting their thick<br />
fleshy leaves. Highest biomass accumulation per unit leaf area <strong>of</strong> P. reticulatum (6.11 mg*cm -2 ) in<br />
combination with lowest water content on the other hand reflected a comparatively thin and dense leaf<br />
matrix. Only P. cordulatum showed similarly high SLW.<br />
relative leaf toughness<br />
600<br />
500<br />
400<br />
300<br />
200<br />
100<br />
0<br />
a abc h f f c gh<br />
ab de ef d g<br />
Pmarg<br />
Paequ<br />
Parbo<br />
Pcord<br />
Pcule<br />
Pdari<br />
Pdila<br />
Pgran<br />
Philinae<br />
Figure 4-2: Relative leaf toughness <strong>of</strong> 15 selected M. diocles food plant species. Leaf toughness differed<br />
significantly among species (ANOVA, F = 534.8, df = 14, P < 0.01). Identical letters below boxes indicate no<br />
difference (Tukeys HSD unequal N, P > 0.05). Box-Whiskers show mean, standard deviation and 95 % confidence<br />
intervals <strong>of</strong> standard deviation.<br />
Philsp<br />
Phisp<br />
Pimpe<br />
Ppelt<br />
Pperl<br />
Preti
Adult female feeding preference & nymph performance 58<br />
water water content [%]<br />
95<br />
90<br />
85<br />
80<br />
75<br />
70<br />
65<br />
60<br />
55<br />
50<br />
d<br />
e<br />
Pmarg<br />
d<br />
e<br />
Paequ<br />
a<br />
b<br />
c<br />
Parbo<br />
f<br />
Pcord<br />
b<br />
c<br />
d d<br />
Pcule<br />
Pdari<br />
c<br />
d d<br />
e<br />
Pdila<br />
Pgran<br />
d<br />
e<br />
Philinae<br />
f<br />
Philsp<br />
Figure 4-3: Water content <strong>of</strong> leaves from 15 food plant species <strong>of</strong> M. diocles. Water content differed significantly<br />
among species (ANOVA, F = 42.94, df = 14, P < 0.01). Identical letters below boxes indicate no difference<br />
(Tukeys HSD unequal N, P > 0.05). Box-Whiskers show mean, standard deviation and 95 % confidence intervals<br />
<strong>of</strong> standard deviation.<br />
specific leaf weight [mg dw/cm 2 specific leaf weight [mg dw/cm ] 2 ]<br />
9<br />
8<br />
7<br />
6<br />
5<br />
4<br />
3<br />
2<br />
1<br />
0<br />
a<br />
a a<br />
a<br />
a a<br />
b<br />
b b b b<br />
b<br />
c<br />
c c c<br />
c<br />
d<br />
d<br />
d<br />
e e<br />
e<br />
f f<br />
g g<br />
Pmarg<br />
Paequ<br />
Parbo<br />
Pcord<br />
Pcule<br />
Pdari<br />
Pdila<br />
Pgran<br />
Philinae<br />
Philsp<br />
Figure 4-4: Specific leaf weight (SLW) from 15 food plant species <strong>of</strong> M. diocles. SLW differed significantly<br />
among species (ANOVA, F = 63.91, df = 14, P < 0.01). P. marginatum (Pmarg) served as reference plant in dual-<br />
choice feeding trials. Identical letters below boxes indicate no difference (Tukeys HSD unequal N, P > 0.05). Box-<br />
Whiskers show mean, standard deviation and 95 % confidence intervals <strong>of</strong> standard deviation.<br />
d<br />
Phisp<br />
Phisp<br />
a<br />
b<br />
Pimpe<br />
Pimpe<br />
e<br />
Ppelt<br />
Ppelt<br />
a<br />
Pperl<br />
a<br />
b<br />
c<br />
Pperl<br />
Preti<br />
f<br />
Preti
Adult female feeding preference & nymph performance 59<br />
Interspecific differences in total phenol contents ranged from lowest values for P. dariense with 0.64 %<br />
TAE to 8.34 % TAE for Philodendron sp. (Figure 4-5 & Table 4-2). Despite this contrast eight <strong>of</strong> the<br />
tested species shared similar phenol levels (1.68 ± 0.58 % TAE to 2.37 ± 5.81 % TAE). P. marginatum<br />
phenol contents ranged in the upper scale only being exceeded by P. cordulatum and Philodendron sp..<br />
Tannins were not common in M. diocles host plant species. Four Piper species contained with 1.49 to<br />
1.79 % TAE similar amounts <strong>of</strong> Tannin (Table 4-2). In P. hispidum tannins seemed to account for the<br />
major part <strong>of</strong> phenolic compounds (71 %). Only part <strong>of</strong> tested leaves <strong>of</strong> P. marginatum and P. hispidum<br />
showed tannic activity. For the remaining 10 species no BSA precipitation was detectable.<br />
Table 4-2: Total phenol and tannin contents <strong>of</strong> M. diocles host plant species resulting from Price & Butler (1977)<br />
method modified by Mole & Waterman (1994) for phenols and radial diffusion assays (RDM) (Hagermann 1987)<br />
for tannins. For tannic content 3 samples per leaf were tested.. Note that detection <strong>of</strong> tannins wasn’t consistent<br />
intraspecifically. The RDM assay mainly detects hydrolysable tannins (Hagermann 1987).<br />
Plant species Total phenol<br />
content [% TAE]*<br />
Tannin<br />
No. <strong>of</strong> leaves<br />
content [% TAE]* tested containing tannin<br />
Piper aequale 1.21 ± 0.17 nd* 5 0<br />
Piper arboreum 4.32 ± 0.37 1.49 ± 0.42 5 5<br />
Piper cordulatum 5.79 ± 0.91 1.79 ± 0.25 5 5<br />
Piper culebranum 3.87 ± 0.40 nd 5 0<br />
Piper dariense 0.64 ± 0.09 nd 5 0<br />
Piper dilatatum 2.26 ± 0.42 nd 5 0<br />
Piper grande 1.72 ± 0.61 nd 5 0<br />
Piper hispidum 2.45 ± 0.60 1.75 ± 0.68 5 2<br />
Piper imperiale 2.33 ± 0.59 nd 5 0<br />
Piper marginatum 5.71 ± 1.73 1.58 ± 0.44 20 14<br />
Piper peltatum 1.87 ± 0.75 nd 5 0<br />
Piper perlascense 1.95 ± 0.30 nd 5 0<br />
Piper reticulatum 1.84 ± 0.56 nd 5 0<br />
Philodendron<br />
ineaquilaterum<br />
1.91 ± 0.27 nd 5 0<br />
Philodendron sp. 8.33 ± 0.99 nd 5 0<br />
* Mean ± StDev<br />
** nd = not detected
Adult female feeding preference & nymph performance 60<br />
Total Total phenol phenol content [% TAE]<br />
10<br />
8<br />
6<br />
4<br />
2<br />
0<br />
c<br />
d<br />
Pmarg<br />
b<br />
e<br />
Paequ<br />
c c<br />
d<br />
Parbo<br />
Pcord<br />
c<br />
f<br />
Pcule<br />
Pdari<br />
a a<br />
Pdila<br />
e<br />
Pgran<br />
a<br />
b<br />
Philinae<br />
d<br />
Philsp<br />
a<br />
f<br />
Phisp<br />
a a a a<br />
b b b<br />
Figure 4-5: Total phenol content <strong>of</strong> leaves from 15 food plant species <strong>of</strong> M. diocles. Total phenol content differed<br />
significantly among species (ANOVA, F = 44.60, df = 14, P < 0.01). Identical letters below boxes indicate no<br />
difference (Tukeys HSD unequal N, P > 0.05). Box-Whiskers show mean, standard deviation and 95 % confidence<br />
intervals <strong>of</strong> standard deviation.<br />
4.4.2 Preference <strong>of</strong> M. diocles adult females<br />
Feeding preference <strong>of</strong> adult M. diocles females differed significantly indicating that they differentiated<br />
among food plant species (Figure 4-6). The assessed preference pattern at the same time revealed broad<br />
interspecific similarities. P. marginatum seemed to represent a food source <strong>of</strong> high value within the<br />
range <strong>of</strong> species tested. P. peltatum was most similarly accepted as food compared to P. marginatum as<br />
its median MAI was closest to 0.5. As preferences for six more plant species were not different to<br />
P. peltatum they also seemed to range on a similar preference level with P. marginatum as M. diocles<br />
foods. Only four out <strong>of</strong> 14 species were preferred to P. marginatum, i.e. the MAI resulting from dual-<br />
choice feeding trials was significantly above 0.5 (as compared to MAI <strong>of</strong> P. peltatum). Three plant<br />
species were clearly avoided by adult females: presented with P. aequale, P. grande and P. perlascense<br />
the insects strongly preferred the reference P. marginatum.<br />
The measured leaf characters seemed not to function as defenses against herbivory by M. diocles.<br />
Preference for host species neither correlated with structural and physical parameters tested nor with<br />
total phenol contents <strong>of</strong> leaves (Figure 4-7). Likewise tannin contents <strong>of</strong> leaves seemed not to account<br />
for the observed preference pattern <strong>of</strong> M. diocles adult females (correlation analysis was dismissed due<br />
to rare presence <strong>of</strong> tannins). Assuming a defensive function <strong>of</strong> tannins the animals should have preferred<br />
the leaves <strong>of</strong> plant species missing tannins. This could not be confirmed (compare Figure 4-6 and<br />
Pimpe<br />
Ppelt<br />
Pperla<br />
Preti
Adult female feeding preference & nymph performance 61<br />
Table 4-2). In addition P. arboreum was preferred to P. marginatum despite the fact that they shared<br />
similar tannin contents (while no preference for the tannin containing P. hispidum and P. cordulatum<br />
was detected in dual-choice trials).<br />
Particularly biochemical properties <strong>of</strong> leaves could be differing stronger with increasing taxonomic<br />
distance <strong>of</strong> plants (Ehrlich & Raven 1964). Under the assumption that leaf biochemistry influences<br />
feeding habits such differences could cover factors favoring or deterring feeding among closely related<br />
host plant species. To account for taxonomically related biochemical leaf properties correlation analysis<br />
was repeated among Piper congeners under exclusion <strong>of</strong> the two species <strong>of</strong> the Araceae. Within Piper<br />
host plants the preference pattern <strong>of</strong> adult females did not relate to phenol content (Product Moment<br />
Correlation MAI to phenol content r = 0.10, df = 10, P > 0.05).<br />
Likewise particular biochemical properties <strong>of</strong> Araceae leaves could have influenced preference <strong>of</strong><br />
females, thereby covering relationships between physical leaf traits and female preference considering<br />
Piper congeners. Exclusion <strong>of</strong> Araceae from correlation analysis did not reveal any significant<br />
relationship between any <strong>of</strong> these leaf traits and the MAI (Product Moment Correlation, df = 10, MAI<br />
to: leaf toughness r = 0.14, water content r = -0.57, specific leaf weight r = 0.45, all P > 0.05).<br />
Nevertheless, all resulting correlation coefficients increased after excluding Araceae host plants.<br />
MAI<br />
1.0<br />
0.5<br />
0.0<br />
e<br />
Paequ-Pmarg<br />
a a a a<br />
b b<br />
c<br />
d<br />
d<br />
e<br />
f f<br />
g<br />
Parbo-Pmarg<br />
Pcord-Pmarg<br />
Pcule-Pmarg<br />
Pdari-Pmarg<br />
Pdila-Pmarg<br />
Pgran-Pmarg<br />
Philinae-Pmarg<br />
a<br />
b<br />
Philsp-Pmarg<br />
a<br />
b<br />
c<br />
Phisp-Pmarg<br />
Figure 4-6: Feeding preference <strong>of</strong> M. diocles females resulting from dual-choice feeding trials. Preference is<br />
expressed as median <strong>of</strong> the mean acceptability index (MAI). MAI among feeding trials differed significantly<br />
(Kruskall Wallis H(13, N=422) = 101.90, P < 0.01). Identical letters indicate no significant difference (Mann-Whitney<br />
U test, P < 0.05). Box plots show median, 25 to 75 % quartiles and minimum/maximum values.<br />
b<br />
c<br />
g<br />
Pimpe-Pmarg<br />
a<br />
b<br />
Ppelt-Pmarg<br />
d<br />
e<br />
Pperl-Pmarg<br />
f<br />
Preti-Pmarg
Adult female feeding preference & nymph performance 62<br />
MAI [median]<br />
MAI [median]<br />
1<br />
0.5<br />
0<br />
1<br />
0.5<br />
0<br />
0 100 200 300 400 500<br />
a)<br />
Relative leaf toughness<br />
2.5 3.5 4.5 5.5<br />
b)<br />
c) Specific leaf weight [mg/cm2]<br />
d)<br />
MAI [m edian]<br />
MAI [median]<br />
1<br />
0.5<br />
0<br />
1<br />
0.5<br />
0<br />
60 60 70 70 80 90<br />
Water Water content content [%] [%]<br />
0 1 2 3 4 5 6 7 8 9<br />
Phenol content [%TAE]<br />
Figure 4-7: Preference <strong>of</strong> M. diocles adult females (expressed as Mean Acceptability Index; MAI) in relation to<br />
structural and chemical leaf characters <strong>of</strong> 14 food plant species. MAI showed no significant relation to any <strong>of</strong> the<br />
measured leaf traits (Product moment correlation, df = 12, all P > 0.05): a) leaf toughness (r = 0.15), b) water<br />
content <strong>of</strong> leaves (r = -0.38), c) specific leaf weight (r = 0.26), d) leaf phenol contents (r < 0.01).<br />
4.4.3 Performance <strong>of</strong> M. diocles nymphs<br />
Survival and growth seemed to be highly depending on the plant species nymphs fed on.<br />
A comparison <strong>of</strong> survival probabilities <strong>of</strong> nymphs under different food sources revealed substantial and<br />
significant differences (Figure 4-8 and Table 4-3). The effects <strong>of</strong> food source on nymph survival were<br />
temporarily heterogeneous. Median survival and quartiles differed species specifically (Table 4-3). For<br />
instance within the first day 25 % <strong>of</strong> nymphs on P. cordulatum had died while initial mortality rate was<br />
lower on all other food sources. This effect changed over time. When mortality on P. cordulatum<br />
decelerated (and more than 25 % <strong>of</strong> nymphs had survived at the end) it accelerated on other plant<br />
species (D. longispatha, P. grande, P. dariense) leading to comparatively higher mortality in the long<br />
run. Median survival time was lowest for P. grande: after six days 50 % <strong>of</strong> nymphs feeding on<br />
P. grande had died. After day 15 no nymphs had survived. Likewise median survival time on<br />
D. longispatha was 9 days and no nymph survived beyond day 17. Opposed to these low quality foods,<br />
feeding on Philodendron inaequilaterum allowed high nymph survival. After six weeks 76 % <strong>of</strong><br />
nymphs were still alive while on all other host plant species from 50 % (P. dilatatum) up to 100 % <strong>of</strong><br />
nymphs had died.
Adult female feeding preference & nymph performance 63<br />
Relative survival <strong>of</strong> nymphs<br />
1<br />
0<br />
0 10 20 30 40<br />
Time passed [days]<br />
Philinae<br />
Pdila<br />
Pmarg<br />
Pcule<br />
Pcord<br />
Ppelt<br />
Preti<br />
Phisp<br />
Paequ<br />
Figure 4-8: Time series <strong>of</strong> the survival <strong>of</strong> M. diocles neonate nymphs on single food plant species. A pronounced<br />
pattern in differential mortality <strong>of</strong> nymphs builds after two weeks <strong>of</strong> feeding and persists over time. Survival<br />
probabilities <strong>of</strong> nymphs calculated by the product limit estimate differed significantly depending on the food<br />
source (Log Rank Analysis, X 2 = 178.32, df = 12, P < 0.01). Species names on the right are in the order <strong>of</strong> relative<br />
survival at the end <strong>of</strong> the experiment. For further details and explanation <strong>of</strong> species name shortcuts refer to the text<br />
and Table 4-3.<br />
Analysis <strong>of</strong> variance revealed that relative growth rates <strong>of</strong> nymphs differed significantly depending on<br />
food sources (Figure 4-9) and relative growth rates modestly corresponded with survival <strong>of</strong> nymphs<br />
(Product Moment Correlation, r = 0.59, df = 11, P < 0.05). Accordingly lowest relative growth rates<br />
matched high nymphal mortality on P. grande (RGR = 0.6 %) and D. longispatha (2.4 %), followed by<br />
P. dariense (4.3 %) and Philodendron sp. (5 %). Highest growth rates were yielded with 16.8 % weight<br />
gain in a two week period on P. peltatum insignificantly different from P. marginatum, P. hispidum and<br />
P. cordulatum. Nevertheless, the relative growth rate on Philodendron inaequilaterum - the species with<br />
highest survival - ranged on an intermediate level (9 %).<br />
Philsp<br />
Pdari<br />
Dlong<br />
Pgran
Adult female feeding preference & nymph performance 64<br />
Table 4-3: Survival <strong>of</strong> neonate M. diocles nymphs resulting from long term feeding trials on 13 potential host<br />
plant species. Nymphs were fed on a single food plant species for 42 days. Plant species are in descending order <strong>of</strong><br />
relative survival at the end <strong>of</strong> the experiment. The short names are used in Figure 8.<br />
plant species short name replicates nymphs<br />
Philodendron<br />
ineaquilaterum<br />
Piper<br />
dilatatum<br />
Piper<br />
marginatum<br />
Piper<br />
culebranum<br />
Piper<br />
cordulatum<br />
Piper<br />
peltatum<br />
Piper<br />
reticulatum<br />
Piper<br />
hispidum<br />
Piper<br />
aequale<br />
Philodendron<br />
sp.<br />
Piper<br />
dariense<br />
Dieffenbacchia<br />
longispatha<br />
Piper<br />
grande<br />
number <strong>of</strong> percent days to<br />
died<br />
nymphs<br />
survived<br />
nymphs<br />
survived<br />
median<br />
survival*<br />
25%<br />
Quartile**<br />
75%<br />
Quartile<br />
Philinae 30 7 23 76.7 . . .<br />
Pdila 24 12 12 50 . 21 .<br />
Pmarg 61 32 29 47.5 31 8 .<br />
Pcule 30 17 13 43.3 37 16 .<br />
Pcord 33 21 12 36.4 14 1 .<br />
Ppelt 39 25 14 35.9 13 6 .<br />
Preti 29 20 9 31 26 7 .<br />
Phisp 49 38 11 22.4 10 6 30<br />
Paequ 30 24 6 20 21 6 30<br />
Philsp 30 26 4 13.3 11 9 34<br />
Pdari 30 27 3 10 15 12 22<br />
Dlong 30 30 0 0 9 7 11<br />
Pgran 60 60 0 0 6 5 9<br />
* median survival time = the time when half <strong>of</strong> the nymphs had died<br />
** 25% and 75% Quartiles = the time when 25% and 75% <strong>of</strong> nymphs had died
Adult female feeding preference & nymph performance 65<br />
Survival and growth <strong>of</strong> nymphs as key demographic traits in insect herbivores were expected to<br />
decrease with increasing defensive leaf characters. Correlation analysis <strong>of</strong> performance with leaf<br />
toughness, specific leaf weight, water and total phenol content showed no relationship to nymph growth<br />
(Figure 4-10) and survival (Figure 4-11). Considering tannin contents <strong>of</strong> leaves their effects on nymph<br />
performance remained unclear. (Leaf tannin content could not be correlated to nymph performance due<br />
to rare presence <strong>of</strong> tannins.) If tannins influenced survival plant species containing tannins should have<br />
ranged on the upper end considering nymph mortality. In contrast to this prediction 47.5 % <strong>of</strong> nymphs<br />
survived on P. marginatum (1.58 % TAE) only exceeded by survival on two other tannin-free plant<br />
species (P. dilatatum, Phil. inaequilaterum; cf. Table 4-2 and Table 4-3). Similarly survival <strong>of</strong> nymphs<br />
feeding on tannin containing leaves <strong>of</strong> P. cordulatum and P. hispidum ranged on mid levels. While<br />
tannins seemed not to be related to nymph survival there is a clear pattern in terms <strong>of</strong> growth rates <strong>of</strong><br />
nymphs. Growth rates on all three Piper species containing tannins and fed to nymphs (P. cordulatum,<br />
P. hispidum, P. marginatum; cf. Figure 4-9 and Table 4-2) were only exceeded by nymph growth on<br />
P. peltatum (tannin-free).<br />
relative growth rate <strong>of</strong> nymphs<br />
0.20<br />
0.15<br />
0.10<br />
0.05<br />
0.00<br />
f<br />
g<br />
Dlong<br />
Mean<br />
±StDev.<br />
±1.96*StDev.<br />
c<br />
d<br />
e<br />
f<br />
Paequ<br />
a<br />
b<br />
Pcord<br />
b<br />
c<br />
Pcule<br />
e<br />
f<br />
Pdari<br />
c<br />
d<br />
e<br />
Pdil<br />
g<br />
Pgran<br />
b<br />
c<br />
d<br />
Philinae<br />
d<br />
e<br />
f<br />
g<br />
Philsp<br />
a<br />
b<br />
Phisp<br />
a a<br />
Figure 4-9: Relative growth rates <strong>of</strong> M. diocles nymphs on single food plant species (measurements after two<br />
weeks, one week later too many nymphs had died). Growth rates differed significantly depending on food source<br />
(ANOVA, F = 34.2, df = 12, P < 0.01). Identical letters indicate no significant difference (Tukeys HSD unequal N,<br />
P > 0.05).<br />
Pmarg<br />
Ppelt<br />
c<br />
d<br />
e<br />
f<br />
Preti
Adult female feeding preference & nymph performance 66<br />
Relative growth<br />
Relative growth<br />
0.20<br />
0.15<br />
0.10<br />
0.05<br />
0.00<br />
0.20<br />
0.15<br />
0.10<br />
0.05<br />
0.00<br />
0 100 200 300 400 500<br />
a)<br />
Relative leaf toughness<br />
2.5 3.5 4.5 5.5<br />
0.20<br />
0.15<br />
0.10<br />
0.05<br />
0.00<br />
b)<br />
c) Specific leaf weight [mg/cm2]<br />
d)<br />
rel<br />
rel<br />
0.20<br />
0.15<br />
0.10<br />
0.05<br />
0.00<br />
60 70 80 90<br />
W ate r conte nt [%]<br />
0 1 2 3 4 5 6 7 8 9<br />
Phenol content [%TAE]<br />
Figure 4-10: Relative growth rates <strong>of</strong> M. diocles neonate nymphs in relation to structural and chemical leaf<br />
characters <strong>of</strong> 12 food plant species. Relative growth showed no significant relation to any <strong>of</strong> the measured leaf<br />
traits (Product moment correlation, df = 10, all P > 0.05): a) leaf toughness (r = -0.41), b) water content <strong>of</strong> leaves<br />
(r = 0.12), c) specific leaf weight (r = -0.34), d) leaf phenol contents (r = 0.20).<br />
Relative survival<br />
Relative survival<br />
1.0<br />
0.5<br />
0.0<br />
1.0<br />
0.5<br />
0.0<br />
0 100 200 300 400 500<br />
a)<br />
Relative leaf toughness<br />
2.5 3.5 4.5 5.5<br />
1.0<br />
0.5<br />
0.0<br />
b)<br />
c) Specific leaf leaf weight [mg/cm2]<br />
d)<br />
MAI [median]<br />
rel<br />
1.0<br />
0.5<br />
0.0<br />
60 70 80 90<br />
W ater content [%]<br />
0 1 2 3 4 5 6 7 8 9<br />
Phenol content [%TAE]<br />
Figure 4-11: Relative survival <strong>of</strong> M. diocles neonate nymphs (after 42 days) in relation to structural and chemical<br />
leaf characters <strong>of</strong> 12 food plant species. Relative survival showed no significant relation to any <strong>of</strong> the measured<br />
leaf traits (Product moment correlation, df = 10, all P > 0.05): a) leaf toughness (r = -0.03), b) water content <strong>of</strong><br />
leaves (r = -0.13), c) specific leaf weight (r = -0.19), d) leaf phenol contents (r = 0.03).
Adult female feeding preference & nymph performance 67<br />
To account for taxonomically related biochemical leaf properties correlation analysis was repeated<br />
among Piper congeners under exclusion <strong>of</strong> the two species <strong>of</strong> the Araceae. Within Piper host plants<br />
performance <strong>of</strong> nymphs did not relate to phenol content, but exclusion <strong>of</strong> Araceae host plants led to<br />
marked increases in correlation coefficients (Product Moment Correlation, df = 8: survival to phenol<br />
content r = 0.58, relative growth rate to phenol content r = 0.61, both P > 0.05). In contrast to the<br />
expectation <strong>of</strong> a defensive function <strong>of</strong> phenolic compounds correlation coefficients demonstrated a<br />
positive trend in the relationship <strong>of</strong> performance and phenol contents.<br />
Particular biochemical properties <strong>of</strong> Araceae leaves could also have influenced performance <strong>of</strong> nymphs,<br />
thereby covering relationships between physical leaf traits and nymph performance considering Piper<br />
congeners. Exclusion <strong>of</strong> Araceae from correlation analysis did not reveal any significant relationship<br />
between any <strong>of</strong> these leaf traits and nymph performance (Product Moment Correlation, df = 8, relative<br />
growth rate to: leaf toughness r = -0.40, water content r = 0.30, specific leaf weight r = 0.31; survival to:<br />
leaf toughness r = -0.41, water content r = -0.03, specific leaf weight r = -0.04; all P > 0.05). The<br />
exclusion <strong>of</strong> Araceae host plants had no effect on the resulting correlation coefficients except for the<br />
relation <strong>of</strong> survival and leaf toughness that decreased from r = -0.03 (cf. Figure 4-11) to r = -0.41.<br />
Performance <strong>of</strong> nymphs seemed not to relate to female adult preference, indicating that prior feeding<br />
experience did not affect preference <strong>of</strong> females. In correlation analysis on MAI <strong>of</strong> females to survival<br />
and relative growth rates <strong>of</strong> nymphs no significant relation was detected (Product Moment Correlation,<br />
df = 9, MAI to: survival r = 0.50, relative growth rate r = 0.25, all P > 0.05). However, low mortality <strong>of</strong><br />
nymphs on Phil. inaequilaterum corresponded with significant preference <strong>of</strong> adult females (compare to<br />
Figure 4-6), but growth <strong>of</strong> nymphs was intermediate on this food source. Opposed to that, 69 % <strong>of</strong><br />
nymphs had died on P. reticulatum, a highly preferred food <strong>of</strong> adult females.<br />
4.4.4 Preference <strong>of</strong> M. diocles nymphs under varying total phenol and<br />
tannin contents<br />
The results <strong>of</strong> an infiltration experiment indicated that increased total phenolic contents as well as<br />
increased tannin levels in leaves might act against herbivory by phasmid nymphs. Both the increase <strong>of</strong><br />
total phenol contents with phenol extract and tannin solution resulted in significantly reduced feeding<br />
preference (i.e., water infiltrated control discs were preferred; Figure 4-12 & Figure 4-13). Yet, tannins<br />
may play a minor role in defense against M. diocles herbivory compared to other phenolic compounds.<br />
Increased contents <strong>of</strong> total phenols (by infiltration <strong>of</strong> phenol extract) pro<strong>of</strong>ed to be more effective than<br />
an increase <strong>of</strong> phenols by tannin solution alone. A rise <strong>of</strong> 0.5 % <strong>of</strong> total phenols by leaf phenol solution<br />
showed a significant effect in preference shift (Figure 4-12) whereas infiltration <strong>of</strong> 1.2% tannin was not<br />
different from the control (Figure 4-13). An increase <strong>of</strong> tannin concentrations up to 11.7 % above<br />
natural total phenol contents resulted in total rejection <strong>of</strong> tannin infiltrated leaf disks. Natural phenolic<br />
content in P. hispidum leaves from greenhouse plants was 2.86 ± 0.1 % TAE (similar to natural phenol<br />
content from field samples with 2.45 ± 0.6 % TAE).
Adult female feeding preference & nymph performance 68<br />
mean mean acceptability acceptability index<br />
1.0<br />
0.8<br />
0.6<br />
0.4<br />
0.2<br />
0.0<br />
Median<br />
25%-75%<br />
Min-Max<br />
a a<br />
control Phenol +0.5% Phenol +0.9%<br />
Figure 4-12: Feeding preference <strong>of</strong> M. diocles nymphs under varying levels <strong>of</strong> leaf total phenol content (expressed<br />
as increase <strong>of</strong> percent TAE compared to natural total phenol content <strong>of</strong> P. hispidum; total phenol content was<br />
increased by infiltration <strong>of</strong> leaf phenol extract solution). An increase <strong>of</strong> 0.9% TAE <strong>of</strong> total phenols resulted in a<br />
significant preference shift (Mann-Whitney U = 579, P < 0.05, control vs. Phenol+0.9%, Ncontrol=37, NPhenol+0.9%=43).<br />
mean acceptability index<br />
1.0<br />
0.8<br />
0.6<br />
0.4<br />
0.2<br />
0.0<br />
Median<br />
25%-75%<br />
Min-Max<br />
a<br />
a<br />
control Tannin +1.2% Tannin +11.7%<br />
Figure 4 -13: Feeding preference <strong>of</strong> M. diocles nymphs under varying levels <strong>of</strong> leaf tannin content (expressed as<br />
increase <strong>of</strong> % TAE compared to natural total phenol content <strong>of</strong> P. hispidum; tannin content was increased by<br />
infiltration <strong>of</strong> tannin solution). An increase <strong>of</strong> 1.2 % TAE tannin had no effect on feeding preference whereas<br />
nymphs refused to feed on leaf discs with 11.7 % TAE more tannin (Mann-Whitney U = 401, P < 0.01, control vs.<br />
Tannin+11.7%, Ncontrol=37, NTannin+11.7%=24).
Adult female feeding preference & nymph performance 69<br />
4.5 Discussion<br />
The initially formulated hypothesis that M. diocles preference and performance would be particularly<br />
influenced by physical leaf properties <strong>of</strong> host plant species could not be supported in this study. Food<br />
plant species <strong>of</strong> M. diocles differed markedly in quality considering leaf toughness, water content,<br />
specific leaf weight, total phenol and tannin contents. Adult females clearly differentiated among host<br />
plant species and nymph performance differed significantly depending on their food source. However,<br />
nor adult female preference neither differential performance <strong>of</strong> nymphs (sensu survival and growth) did<br />
relate to any <strong>of</strong> the assessed leaf traits over the whole host range (Araceae and Piperaceae) and among<br />
Piper congeners. These results indicate that the measured leaf characters may be <strong>of</strong> minor importance<br />
for M. diocles feeding behavior. However, an intraspecific increase <strong>of</strong> total phenols via infiltration <strong>of</strong><br />
phenol extract in leaves negatively influenced preference <strong>of</strong> nymphs while increased tannin contents<br />
were effective only in substantially higher concentrations. The deterring effect <strong>of</strong> increased total phenol<br />
on nymphs suggests that phenolic compounds may play an important role as qualitative defenses<br />
especially considering induced increases and intraspecific variation in total phenol contents <strong>of</strong> leaves.<br />
Adult preference for plant species did not consistently reflect best nymph performance suggesting that<br />
adult preference does not relate to experience in early life stages. Survival and growth <strong>of</strong> nymphs on a<br />
particular diet corresponded significantly, albeit highest survival was not linked to highest growth rate.<br />
Consequently host plant choice in early life stages <strong>of</strong> M. diocles may crucially determine survival and<br />
growth and hence could have a substantial impact on population density.<br />
(In the following discussion I will use the term preference-performance describing adult female<br />
preference and nymph performance. In another context preference-performance describes oviposition<br />
preference and larval performance.)<br />
4.5.1 The pattern <strong>of</strong> feeding preference and performance: an attempt <strong>of</strong> an<br />
explanation<br />
Adult M. diocles females displayed significant feeding preferences and diet source differentially<br />
influenced survival and growth <strong>of</strong> early life stages <strong>of</strong> M. diocles. However, in the presented study<br />
interspecific differences in physical and chemical leaf characters seemed not to relate to nymph<br />
performance or adult preference. These results do not support the initially stated hypotheses that in<br />
particular physical leaf traits should affect preference and performance <strong>of</strong> a specialist herbivore.<br />
Both, high leaf toughness (Cherret 1968; Coley 1983; Lowman & Box 1983; Reich et al. 1991; but see<br />
Landa & Rabinowitz 1983) and low water contents (e.g., Moran & Hamilton 1980; Coley 1983;<br />
Schädler et al. 2003) have been shown to negatively affect insect herbivores. Coley (1983)<br />
demonstrated that toughness and water contents had the highest negative correlations (among a
Adult female feeding preference & nymph performance 70<br />
multitude <strong>of</strong> other leaf traits) with herbivory rates on mature leaves <strong>of</strong> 46 canopy tree species. In their<br />
review on plant defenses in tropical forests, Coley & Barone (1996) considered leaf toughness as the<br />
most effective herbivore defense. Likewise, high structural reinforcement expressed as SLW (Wright &<br />
Cannon 2001) may negatively affect herbivore feeding behavior. Although direct evidence for this<br />
supposition is missing, SLW may be indicative <strong>of</strong> defense at least when high SLW represents a thick<br />
leaf matrix (SLW is the product <strong>of</strong> leaf thickness and density) (e.g., Bernays & Chapman 1970;<br />
Schädler et al. 2003). For example, Bernays & Chapman (1970) showed that grasshopper nymphs were<br />
unable to feed on thick leaves because they could not open the mandibles wide enough to bite. Here,<br />
thick leaves <strong>of</strong> P. cordulatum and Phil. sp., combining high values for SLW and water content, seemed<br />
not to affect nymph performance. Likewise, my results did not support the defensive view <strong>of</strong> high leaf<br />
toughness and low water contents. For instance, despite the fact that Philodendron inaequilaterum had<br />
the second toughest leaves it ranged on second position as preferred food for females and most nymphs<br />
survived on this food source. Piper reticulatum ranged on top <strong>of</strong> female preference, and growth and<br />
survival <strong>of</strong> nymphs was intermediate while its leaves had significantly lower water contents and<br />
significantly higher SLW than all other species (reflecting a thin and dense leaf matrix).<br />
The insensitivity <strong>of</strong> M. diocles adults towards low water contents may be explained by the fact that<br />
herbivores themselves amplify their food intake depending on their physiological state <strong>of</strong> hydration.<br />
Roessingh et al. (1985) showed that locusts will prefer dry leaf matrices after having fed on fully<br />
hydrated leaf material. While M. diocles nymphs had no food alternative, different adult females may<br />
have fed variably hydrated leaves before a feeding trial. In such a scenario female preference then<br />
simply would reflect their prior feeding.<br />
Similar to physical leaf traits, chemical leaf contents did not explain the described patterns <strong>of</strong> M. diocles<br />
adult preference and nymph performance. Tannins are known to act in a dosage-dependent manner<br />
(Feeny 1970, Rhoades 1977; Coley 1986) and can be toxic or deterrent to particular herbivores (Bernays<br />
et al. 1980; Berenbaum 1984). Likewise phenolic compounds may negatively affect herbivores<br />
(Bernays & Chapman 1994), but in particular when phenol contents are increased following herbivore<br />
damage (e.g., Niemelä et al. 1979; Rossiter et al. 1988; Haukioja 1990; Kogan & Fischer 1991;<br />
Tscharntke et al. 2001). For example, Rossiter et al. (1988) showed that pupal mass and fecundity <strong>of</strong><br />
gypsy moth were negatively correlated with hydrolizable tannin content and with constitutive and<br />
induced total phenolic <strong>of</strong> oak. In contrast, in Coley’s (1983) study on 46 tree species, natural phenol<br />
contents explained least <strong>of</strong> the variation in herbivore damage. This is consistent with my results<br />
considering phenols. Phenol contents varied significantly among tested plant species but did not relate<br />
to preference-performance <strong>of</strong> M. diocles. The difference between P. dariense (0.64 % TAE) and<br />
Phil. sp. (8.33 % TAE) was almost twelve fold while eight species shared similar and comparably low<br />
levels <strong>of</strong> leaf phenols. Despite their highest total phenol contents in Piper species, P. marginatum and
Adult female feeding preference & nymph performance 71<br />
P. cordulatum ranged on third and fifth position considering survival <strong>of</strong> nymphs and shared highest<br />
relative growth rates with two other species.<br />
Tannin containing leaf tissue was not discriminated against other foods by adults or by nymphs.<br />
Detectable tannins by the RDM assay (Hagermann 1987) were absent in the two Araceae detected (and<br />
thus tannins seem not to be characteristic for Araceae as was suggested by Grayum, 1990). Similarly,<br />
tannins were rare in tested Pipers (four out <strong>of</strong> 13 species contained tannins) and ranged on similar levels<br />
from 1.49 to 1.79 % TAE. For example, P. marginatum leaves contained 1.58 % TAE but adult females<br />
displayed no significant preference when tested against five tannin free plant species (as compared to<br />
the MAI <strong>of</strong> P. peltatum, that was closest to 0.5; cf. Figure 4-6). Above that P. marginatum was clearly<br />
preferred to three plant species missing tannins (P. aequale, P. grande, P. perlascense; cf. Figure 4-6 &<br />
Table 4-2). These results suggest that natural levels <strong>of</strong> tannins and phenols in M. diocles host plants do<br />
not affect its feeding behavior.<br />
Biochemical differences between the two host plant families <strong>of</strong> M. diocles seemed not to cover<br />
defensive functions <strong>of</strong> leaf traits within Piper congeners. According to the theory <strong>of</strong> biochemical<br />
coevolutiondifferences in plant biochemistry will increase with increasing taxonomic distance <strong>of</strong> plants<br />
(Ehrlich & Raven 1964). Araceae and Piperaceae are not closely related (Judd et al. 2002) and both<br />
families are rich in secondary compounds (Sengupta & Ray 1987; Baldwin & Schultz 1988; Parmar et<br />
al. 1997; Judd et al. 2002; Dyer et al. in press). At least for Pipers it is known that many species contain<br />
exclusive and highly variable compounds (Dyer et al. 2003). However, an exclusion from correlation<br />
analysis did not reveal any significant relation between defensive leaf traits and preference-performance<br />
<strong>of</strong> M. diocles. Albeit, within Piper host plants physical leaf traits may involve a minor defensive<br />
function: the exclusion <strong>of</strong> Araceae strengthened all relationships to nymph performance markedly. In<br />
contrast, nymph performance tended to positively correlate with total phenols. This again may indicate<br />
that natural levels <strong>of</strong> secondary phenolic leaf compounds do not negatively affect this phasmid.<br />
Nevertheless, a negative effect <strong>of</strong> phenolic and tannic leaf compounds on M. diocles nymphs must not<br />
be neglected. At least considering intraspecifically varying levels <strong>of</strong> these compounds. As noted above,<br />
both phenolic and tannic contents may negatively affect herbivores and many authors showed that<br />
phenolic compounds may be induced in response to insect damage (e.g., Niemelä et al. 1979; Rossiter et<br />
al. 1988; Haukioja 1990; Kogan & Fischer 1991; Baldwin 1994; Tscharntke et al. 2001; but see Lempa<br />
et al. 2004). M. diocles nymphs reacted with a significant preference shift when phenol contents <strong>of</strong><br />
P. hispidum leaf discs were increased above natural phenol levels and preferred the according control.<br />
Likewise, but in much higher concentrations increased tannin contents deterred nymphs. Hence<br />
M. diocles nymphs may be negatively affected at least by intraspecific variation <strong>of</strong> phenolic compounds<br />
in a particular host plant. This may apply to all host plant species presented in this study as all species<br />
contained notable phenolic concentrations. The deterring effect by a comparably small increase <strong>of</strong><br />
phenolic content denotes the qualitative character <strong>of</strong> this defensive pathway. In contrast, tannin may
Adult female feeding preference & nymph performance 72<br />
only function against M. diocles in some Piper host species and even only in particular individuals (as<br />
represented by intraspecific absence <strong>of</strong> tannin in some leaves) if they had higher tannin contents as<br />
found here. Coley (1986) suggested that such intraspecific tannin variation could be governed<br />
genetically as she found between-plant differences in Cecropia tannin content persisted through time.<br />
Undoubtedly, tannin can deter herbivores: low tannin Cecropia plants suffered five times higher<br />
herbivory by caterpillars than plants with high tannin contents (Coley 1986). This difference in<br />
herbivory was based on substantial differences in tannin concentrations among <strong>of</strong> Cecropia individuals<br />
(13 to 58 mg*g -1 dw, Coley 1986). High tannin concentrations involve high costs as they have large<br />
initial construction costs and cannot be reclaimed upon leaf senescence (McKey 1979, Coley et al.<br />
1985, Coley 1988).<br />
Considering that tannins had to be accumulated in much higher concentrations compared to other<br />
phenolic compounds to deter M. diocles nymphs, evolution in Piper biochemistry may have favored<br />
qualitative defenses, particularly as many Piper species are gap adapted (Croat 1978). Coley et al.<br />
(1985) suggested that gap adapted plant species (pioneers, high light) should invest carbon in growth<br />
and less in carbon-based defense such as tannins. The rare presence <strong>of</strong> tannins in Pipers as demonstrated<br />
here and earlier (Baldwin & Schultz 1988) gives support to this view.<br />
However, as all phenolic compounds are based on carbon, the resource availability theory <strong>of</strong> Coley et<br />
al. (1985) also predicts low levels <strong>of</strong> total phenols in pioneer species. Baldwin & Schultz (1988) showed<br />
that independent from habitat Piper species shared low levels <strong>of</strong> total phenols while Miconia forest<br />
species (persistent, low light) had almost 17 times more phenols than Miconia gap species. In this study,<br />
the prediction <strong>of</strong> similarly low phenol contents among Piper species cannot be supported as total<br />
phenols varied significantly among species (independent from habitat as P. marginatum, P. culebranum;<br />
P. dilatatum, P. hispidum, P. peltatum and P. reticulatum represent pioneer species).<br />
Nevertheless, there is more support for a qualitative defensive pathway in Pipers. The genus Piper is<br />
enormously rich in secondary compounds (reviewed in Sengupta & Ray 1987; Parmar et al. 1997; Dyer<br />
et al. in press). So far in 112 out <strong>of</strong> more than 1000 species that have been investigated 661 different<br />
compounds have been found (Dyer et al. in press). Several studies have presented effects <strong>of</strong> all classes<br />
<strong>of</strong> Piper compounds against herbivores with Amides being particular strong (Bernard et al. 1995;<br />
Parmar et al. 1997 and references therein; Siddiqui et al. 2000; Dyer et al. 2003). For example, Dyer et<br />
al. (2003) showed that three Amides <strong>of</strong> Piper cenocladum all negatively influenced larval performance<br />
<strong>of</strong> lepidopterans with stronger synergistic effects <strong>of</strong> a mixture <strong>of</strong> the Amides. Given the large variety in<br />
secondary compounds in Piper, the presented preference-performance pattern <strong>of</strong> M. diocles may have<br />
resulted from interspecific qualitative differences in phenolic composition, with plant species that were<br />
disliked by adults or where nymphs suffered reduced performance containing particularly toxic<br />
compounds. This suggestion is supported by the fact that secondary compounds in Piper differ<br />
qualitatively among species (Parmar et al. 1997). Many species contain exclusive compounds and have<br />
evolved high varieties in particular compound classes (Dyer et al. 2003). To exemplify, from Piper
Adult female feeding preference & nymph performance 73<br />
amalgo 31 amides have been isolated while P. reticulatum seems not to have any amides (Dodson,<br />
unpublished in Dyer et al. 2003). Supposedly the lack <strong>of</strong> amides in P. reticulatum may explain its high<br />
preference by M. diocles adult females. Likewise some Pipers have very diverse herbivore faunas (95<br />
species in P. arieianum; Marquis 1990) indicating that these species may be poor in defensive<br />
compounds.<br />
Secondary plant compounds need not necessarily act as deterrents to herbivores, they also can stimulate<br />
feeding (Bernays & Chapman1994). Particularly interesting examples <strong>of</strong> such phagostimulants are<br />
phenolics and other compounds such as alkaloids, terpenes and flavonoids that can be taxon specific<br />
(listed in Bernays & Chapman 1994, p. 133) and that are thought to play a major role in defining host-<br />
ranges <strong>of</strong> associated insects. Nevertheless, phagostimulatory effects are only observed when the<br />
compounds are present in low concentrations and loose their stimulating effect when deterrent<br />
chemicals increase (Bernays & Chapman 1978). The presence <strong>of</strong> particular secondary phenolic<br />
compounds in Piper possibly acting as phagostimulants to M. diocles may explain the positive trend<br />
between leaf phenol content and nymph performance. When phenol content then increases, for example<br />
by induction, then deterrence outweighs stimulation.<br />
Above that some insects use secondary compounds for pheromone production or for defensive<br />
sequestration (i.e. pharmacophagy, e.g., Boppré et al. 1984; Bernays & Chapman 1994). For example,<br />
highly polyphagous Zonocerus grasshoppers feed preferentially on plants or flowers containing<br />
pyrrolizidine alkaloids and sequester the chemicals for defense against predators (Boppré et al. 1984).<br />
Most <strong>phasmids</strong> dispose <strong>of</strong> defensive glands at their prothorax (Bedford 1978). Their secretions have<br />
been shown to deter predators can be already functional in nymphs (Eisner 1968; Eisner et al. 1997).<br />
Likewise, M. diocles uses these glands and when threatened the smell <strong>of</strong> its spray becomes apparent<br />
(pers. obs.). Probably, this secretion is the result <strong>of</strong> sequestration <strong>of</strong> secondary compounds from<br />
M. diocles host plants. Thereby M. diocles would turn the potentially defensive biochemical diversity in<br />
its host range into its own protection against natural enemies. This would be <strong>of</strong> particular importance for<br />
nymphs as they are supposed to be most vulnerable to predation (Cornell & Hawkins 1995; Cornell et<br />
al. 1998).<br />
Yet, the principle phagostimulants are nutrients. Many authors previously showed positive effects <strong>of</strong><br />
nutritious plant quality (e.g. Nitrogen and carbohydrates) on survivorship and growth <strong>of</strong> insect<br />
herbivores (e.g., Joern & Gaines 1990; Joern & Behmer 1997). And insect herbivores are known to<br />
discriminate among food sources <strong>of</strong> different nutritional quality (Behmer & Joern 1993, 1994; Simpson<br />
& Simpson 1990). For example, growth and survival <strong>of</strong> grasshopper nymphs is <strong>of</strong>ten protein dependent<br />
(Behmer & Joern 1993, 1994) and host plant and tissue selection <strong>of</strong> grasshoppers has repeatedly been<br />
related to N-content reflecting protein (Behmer & Joern 1993, 1994). Nymphs <strong>of</strong> Locusta migratoria<br />
can regulate food intake based on protein (Abisgold & Simpson 1987). Other studies supported the
Adult female feeding preference & nymph performance 74<br />
importance <strong>of</strong> N to reproduction and showed that insects can perceive differences in N-contents. Adult<br />
females may modulate their reproductive output depending on N-content <strong>of</strong> their foods as they decrease<br />
egg production with decreasing N-levels and vice versa (McCaffery 1975). Similarly, host selection (i.e.<br />
preference) and performance <strong>of</strong> M. diocles is likely to depend on nutritious quality, the more as I<br />
showed that defensive leaf traits may be <strong>of</strong> minor importance for this herbivore. I therefore suggest that<br />
analysis <strong>of</strong> leaf nutritional quality should be subject <strong>of</strong> further research on M. diocles diets.<br />
4.5.2 Ecological and evolutionary consequences<br />
The described differential performance <strong>of</strong> M. diocles nymphs and the discriminative preference <strong>of</strong> adults<br />
are <strong>of</strong> significance in several aspects <strong>of</strong> the biology and <strong>ecology</strong> <strong>of</strong> this herbivore.<br />
Slow growth may involve a higher susceptibility to natural enemy attack (Feeny 1976). This slow-<br />
growth high-mortality hypothesis (Feeny 1976; Clancy & Price 1987) suggests that slow growing<br />
herbivores suffer greater mortality from natural enemies, because they remain longer in the more<br />
vulnerable early life stages <strong>of</strong> development than faster growing herbivores. Häggström & Larsson<br />
(1995) provided one <strong>of</strong> the few empirical tests for this hypothesis. They showed that predation on larva<br />
<strong>of</strong> the leaf beetle Galerucella lineola was positively related with longer development that depended on<br />
food quality. Accordingly, in their natural setting differential growth <strong>of</strong> M. diocles nymphs may<br />
translate into differential predation-related mortality. Thereby predation may outbalance high host plant<br />
related mortality <strong>of</strong> fast growing nymphs (e.g,. Piper peltatum) with high host plant related survival <strong>of</strong><br />
slow growing nymphs (e.g,. Phil. inaequilaterum). As a consequence, selection should favor some<br />
intermediate host, i.e. with comparably high growth rate and low host plant related mortality. In the case<br />
<strong>of</strong> M. diocles, the gap associated Piper dilatatum and P. marginatum represent such hosts. Over<br />
evolutionary time one would predict that low suitable plants such as P. grande will be abandoned as<br />
hosts. Together with the fact that M. diocles densities were higher in gaps than in the understory<br />
(Chapter 2) the outlined evolutionary scenario may at least partly explain the distribution <strong>of</strong> this<br />
herbivore.<br />
Still, nymph mortality in a six week period was 50 % or higher for all species but Phil. inaequilaterum<br />
(cf. Table 4-3). This time period reflects less than half the time <strong>of</strong> phasmid nymph development (approx.<br />
100 days, cf. Chapter 3). Such strong constraints in tissue quality (regardless whether related to<br />
defensive or nutritional quality) may motivate an herbivore to leave its host and search for more<br />
adequate food. Leaving the host, the herbivore runs risk not to find a new suitable host. To cite an<br />
example, van Dam et al. (2000) showed that very young caterpillars <strong>of</strong>ten have trouble to find even<br />
neighbouring plants. In addition, when leaving its host the herbivore exposes itself to predation<br />
particularly by arthropods (Haccou & Hemerik 1985). Both risks probably decrease with increasing size<br />
<strong>of</strong> the herbivore, because its action range increases and thereby its searching efficiency (Damman 1991),<br />
while its susceptibility to predators may decrease (Dyer 1995). In addition, the herbivore is deprived <strong>of</strong><br />
food while searching (Schultz 1983). Again all these factors favour selection pressure towards hosts
Adult female feeding preference & nymph performance 75<br />
where nymphs suffer littlest mortality resulting from food quality or from predation, mediated via<br />
extended larval development. However, a single food type <strong>of</strong> poor or even toxic quality rarely will<br />
provide all essential nutrients for survival. As a consequence herbivores may have to leave a host to feed<br />
on a mixture <strong>of</strong> plants (Joern 1979; Cates 1980; Bernays et al. 1994).<br />
From the plants perspective it is most favorable to motivate the herbivore to leave as soon as possible.<br />
Early instars cause little damage but food consumption increases with development (e.g., van Dam et al.<br />
2001) and thereby may increase a plants fitness loss. To cite an example, Marquis (1992) showed that a<br />
leaf loss <strong>of</strong> 10 % on single reproductive branches in Piper arieianum caused a local seed loss <strong>of</strong> 80 %.<br />
However, in a competitive environment the production <strong>of</strong> lethal herbivore defenses may also involve<br />
high fitness costs (e.g., Baldwin 1998). Thus many plants may use defenses on less cost-intense<br />
sublethal levels (Price et al. 1980) that already affect early larval instars and may motivate them to<br />
change hosts (van Dam et al. 2001). In this hypothetical framework M. diocles nymph performance then<br />
would reflect variation in sublethal reduction <strong>of</strong> leaf quality, and the observed mortality patterns would<br />
rather result from the experimental setup ‘forcing’ nymphs to stay on such low quality food. The<br />
positive relation <strong>of</strong> nymph survival and growth gives support to this thought.<br />
As demonstrated, selection pressure on early lifestages <strong>of</strong> M. diocles may be high depending on food<br />
source. This pressure could be reduced if adult female oviposition was related to best nymph<br />
performance. Feeding habits <strong>of</strong> adult herbivores <strong>of</strong>ten reflect previous feeding experience throughout an<br />
individual’s lifetime (Cassidy 1978; Papaj & Prokopy 1988; Redfearn & Pimm 1988; Karowe 1989;<br />
Sandlin & Willig 1993). For example, adult feeding behavior <strong>of</strong> the neotropical phasmid Lamponius<br />
portoricensis depended on sex and prior experience and persistence <strong>of</strong> feeding preference (as proportion<br />
<strong>of</strong> a species in its diet) was stronger in females than in males (Sandlin & Willig 1993). Concluding from<br />
this, one could hypothesize that if adult feeding preference reflected prior feeding experience as<br />
nymphs, selection would favor evolution <strong>of</strong> oviposition on preferred host plants <strong>of</strong> females and nymphs<br />
would perform best on this food. In the many examples <strong>of</strong> insect females that lay their eggs on plants for<br />
larval development, the observed relationship between oviposition preference and <strong>of</strong>fspring<br />
performance ranges from good to poor correspondance (for review see Thompson & Pellmyr 1991).<br />
Clearly, a preferential oviposition on high quality foods would involve immediate consequences for<br />
plant herbivore interactions and for herbivore population dynamics (Price et al. 1995). In the<br />
‘Phylogenetic Constraints Hypothesis’, Price et al. 1990 predicted that larvae <strong>of</strong> such species would<br />
exhibit higher survival, that females would recognize and compete for rare high quality resources, and<br />
that they would disperse large distance to spread spacing <strong>of</strong> eggs preventing larval competition and<br />
overexploitation. In contrast to my expectations performance <strong>of</strong> nymphs seemed not to relate to female<br />
adult preference, indicating that prior feeding experience did not affect preference <strong>of</strong> females. Albeit,<br />
adult preference tended to relate modestly with nymph survival (r = 0.50; P > 0.05) and low mortality <strong>of</strong><br />
nymphs corresponded with significant preference <strong>of</strong> adult females on Phil. inaequilaterum (compare to<br />
Figure 4-6 and Table 4-3). This Araceae is a typical and abundant plant in the understory <strong>of</strong> the BCI
Adult female feeding preference & nymph performance 76<br />
forest (Croat 1978). Considering it’s high acceptance by M. diocles this plant species may account for<br />
the presence <strong>of</strong> M. diocles in the understory (cf. Chapter 2). In addition, while many <strong>phasmids</strong> flick and<br />
drop their eggs (Bedford 1978), M. diocles attaches them to a substrate and indicating a selective<br />
oviposition behavior.<br />
4.5.3 Conclusions<br />
The study presented here, demonstrated that particularly M. diocles nymphs may be exposed to severe<br />
selection pressure depending on its food source. Differential mortality <strong>of</strong> nymphs depending on the host<br />
plant may directly (survival) or indirectly (slow-growth high-mortality) contribute to population control<br />
<strong>of</strong> M. diocles. Further studies on M. diocles should particularly focus on oviposition behavior for one<br />
striking reason: If an evolved life history trait, such as female choice <strong>of</strong> oviposition, is strongly linked to<br />
<strong>of</strong>fspring performance then the reproductive response <strong>of</strong> females to host plant quality is the critical<br />
factor regulating population densities (Craig et al. 1989).<br />
Now, does the fact that M. diocles seemed not to be affected by physical plant defenses contradict its<br />
specialization? I tend to say no. M. diocles was not affected by natural contents <strong>of</strong> leaf tannins or<br />
phenols <strong>of</strong> its host plants indicating that this phasmid can handle the large variability in secondary<br />
compounds in its host range. This supports the consideration <strong>of</strong> M. diocles as herbivore specialist,<br />
simply because host range is ultimately defined by the occurrence <strong>of</strong> deterrent compounds in non-hosts<br />
(Bernays & Chapman 1994).
Predation mediated mortality & migratory behavior <strong>of</strong> nymphs 77<br />
5 Predation pressure and its effects on survival and <strong>of</strong>f-plant<br />
migration <strong>of</strong> M. diocles nymphs<br />
5.1 Introduction<br />
Predation is considered an important determinant <strong>of</strong> the abundance and distribution <strong>of</strong> prey organisms<br />
(Sih et al. 1985; Begon et al. 1996). To date, numerous studies have confirmed that predators and<br />
parasitoids can have significant impact on insect herbivore populations (e.g. Chang 1991; Gomez &<br />
Zamora 1994; Floyd 1996; Moran & Hurd 1998). Extensive analyses <strong>of</strong> life table data found natural<br />
enemies as the most important source <strong>of</strong> mortality for holometabolous herbivorous insects (Cornell &<br />
Hawkins 1995; Cornell et al. 1998; Walker & Jones 2001). Cornell et al. (1998) concluded that this<br />
applies in particular for insects feeding externally on plants, starting out that the importance <strong>of</strong> natural<br />
enemies <strong>of</strong> holometabolous herbivores increases from the early larval stage to the pupal stage. These<br />
results emphasize the role <strong>of</strong> predation as a key factor in determining herbivore survival (Hairston et al.<br />
1960; Walker and Jones 2001). Data on predation pressure on exophytic feeding hemimetabolous<br />
herbivores mainly concentrate on Orthopterans. In general, natural enemies exert a significant impact on<br />
populations <strong>of</strong> grasshoppers and population dynamics are most affected by nymphal mortality (Joern &<br />
Gaines 1990 and references therein). Oedekoven and Joern (1998) showed that the youngest instars<br />
experience the greatest losses and that predation from wandering spiders contributed significantly to<br />
nymphal mortality. The majority <strong>of</strong> larval mortality however reflected other undefined sources.<br />
According to Belovsky and Slade (1995) grasshopper nymphs may be more likely to suffer death from<br />
starvation, while adults may be at greater risk from other factors such as avian predation. Thus specific<br />
mortality causes <strong>of</strong> different stages remain uncertain and to my knowledge there is no data available that<br />
assess the impact <strong>of</strong> predation on early life stages <strong>of</strong> <strong>phasmids</strong>.<br />
Herbivorous insects face predation from a variety <strong>of</strong> natural enemies (Abrahamson & Weis 1997).<br />
These undoubtedly influence how and where an herbivore feeds (Hawkins & Lawton 1987). In<br />
response, prey organisms have developed a variety <strong>of</strong> mechanisms to escape from top-down pressure,<br />
for example morphological mimicry, or behavioral and phenological escape (Sillen-Tullberg et al. 1982,<br />
Kinsmann & Platt 1984, Damman 1987, Witz 1990). Migration patterns <strong>of</strong>ten reflect such predation<br />
avoidance, either in prey moving within (Hopkins and Dixon 1997, Magalhães et al. 2002) or <strong>of</strong>f<br />
(Roitberg & Myers 1979) their host plants. Such behavior usually involves costs such as reduced<br />
fecundity (Roitberg & Myers 1979) or larval growth (Heads 1986, Gotthard 2000). The latter may lead<br />
to prolonged development times, increasing exposure to natural enemies during vulnerable immature<br />
stages (Feeny 1976, Benrey & Denno 1997). In consideration <strong>of</strong> these costs, predator avoidance via
Predation mediated mortality & migratory behavior <strong>of</strong> nymphs 78<br />
migration should be displayed under accordingly high predation pressure (Snyder & Wise 2000, Venzon<br />
et al. 2000, Magalhães et al. 2002).<br />
However, whether an observed behavior does reflect predator avoidance <strong>of</strong>ten remains speculative as<br />
many studies assume but do not test an anti-predator function (Witz 1990). Predation avoidance may not<br />
be the ultimate motivation <strong>of</strong> small-scale migratory movement patterns <strong>of</strong> herbivores. Most ecologists<br />
now agree that both bottom-up and top-down forces directly or indirectly influence populations and<br />
communities <strong>of</strong> herbivores (e.g. Price et al. 1980, Hunter & Price 1992, Hunter et al. 1997, Walker &<br />
Jones 2001, but see Hassell et al. 1998, Hunter et al. 2000 and references therein). Resource limitations,<br />
such as the depletion <strong>of</strong> a food source or reduced digestibility <strong>of</strong> plant tissue, are bottom-up forces that<br />
influence herbivore performance and distribution (e.g. Häggstrom & Larsson 1995, Burghardt & Fiedler<br />
1996, Barker & Maczka 1996). Larval performance <strong>of</strong> insect herbivores can also be affected by plant<br />
size (Price 1991, Teder & Tammaru 2002) and according to Price (1991) herbivores should prefer<br />
bigger and more vigorous plants or plant modules. Depletion or low suitability <strong>of</strong> a host plant can then<br />
result in larvae moving more frequently between feeding sites (Bergelson & Lawton 1988, Loader &<br />
Damman 1991, but see Häggstrom & Larsson 1995). Another reason why herbivores move away from<br />
their host plants is that many herbivores perform best with a mixture <strong>of</strong> food plants, either to complete<br />
their diet or to dilute toxins (Bernays & Chapman 1994, Hägele & RoIll-Rahier 1999).<br />
When explaining herbivore migration by bottom-up forces one has to differentiate between generalists<br />
and specialists. Bottom-up forces, such as chemical plant defenses, should be more effective against<br />
generalist herbivores (Feeny 1976). Specialized herbivores (mono- or oligophagous) that overcome such<br />
plant defenses by detoxifying or even sequestering plant compounds should be less affected (Ehrlich &<br />
Raven 1964).<br />
Concluding from the above, I hypothesized that nymphs <strong>of</strong> an exophytic specialist herbivore should be<br />
particularly regulated by the third trophic level. If these nymphs show migration behavior, I expected<br />
predation avoidance to cause these movement patterns as bottom-up forces were expected to be <strong>of</strong><br />
minor importance for this specialized herbivore (see Chapter 4).<br />
The stick insect Metriophasma diocles (Phasmatodea) is an exophytic herbivore that occurs in low<br />
abundances in the understory <strong>of</strong> neotropical rainforest and feeds exclusively on plants from two<br />
different plant families, the Piperaceae and Araceae (see Chapter 2; Berger & Wirth 2001). As these<br />
families are not closely related, the degree <strong>of</strong> specialization <strong>of</strong> M. diocles is best described as disjunct<br />
oligophagous (see Bernays & Chapman 1994).<br />
I quantified the predation-related mortality <strong>of</strong> M. diocles nymphs <strong>of</strong> by (1) exposing nymphs to natural<br />
levels <strong>of</strong> predation on uncovered host plants (controls), and simultaneously (2) estimating the proportion<br />
<strong>of</strong> intrinsic mortality (not related to natural enemies) through the exclusion <strong>of</strong> predators by covering<br />
host plants with mesh cages (treatment). For the description <strong>of</strong> natural enemies and the temporal pattern
Predation mediated mortality & migratory behavior <strong>of</strong> nymphs 79<br />
<strong>of</strong> their impact I included observations on (3) the identity <strong>of</strong> potential predators, and (4) on diurnal<br />
patterns <strong>of</strong> nymph survival.<br />
To account for predation-related migration <strong>of</strong> nymphs I recorded the migratory activity <strong>of</strong> individual<br />
nymphs (1) in both exclosures and controls, and (2) under predator-free conditions in greenhouses. The<br />
study was complemented by an analysis <strong>of</strong> host plant size based on the number <strong>of</strong> healthy leaves to<br />
determine if bottom-up forces might instead have controlled migratory activity.<br />
A general shortcoming <strong>of</strong> such field studies <strong>of</strong> survival is that they cannot distinguish between death<br />
versus emigration as the cause <strong>of</strong> disappearance. In the presented study this paucity <strong>of</strong> potential<br />
emigration <strong>of</strong> M. diocles nymphs out <strong>of</strong> control plots was acknowledged by following nymphs<br />
individually. Further I accounted for potential effects <strong>of</strong> the exclosures on intrinsic mortality and<br />
migratory activity <strong>of</strong> nymphs by assessing these parameters in a greenhouse experiment.<br />
5.2 Materials and Methods<br />
5.2.1 Study site and organism<br />
The study was conducted in the forest understory <strong>of</strong> Barro Colorado Island. A detailed description on<br />
vegetation and climatic conditions <strong>of</strong> BCI is given in the Chapter 1 and in Leigh et al. (1990). The<br />
experiments took place from September to December 2001 during the rainy season.<br />
Metriophasma diocles (Orthoptera, Phasmatodea) is a winged stick insect occurring on BCI in low<br />
abundances (see Chapter 2). In performing feeding trials and analyzing field observations I found that<br />
M. diocles feeds on leaves <strong>of</strong> Piperaceae and Araceae exclusively (Chapter 2; Berger & Wirth 2001). I<br />
selected Piper marginatum JACQ (Piperaceae) as a suitable and well-documented host plant in this<br />
experiment (cf. Chapters 2 & 4).<br />
5.2.2 Field experiment<br />
To assess the impact <strong>of</strong> predators on first instar nymphs <strong>of</strong> M. diocles I designed a field experiment<br />
excluding predators by covering an individual P. marginatum host plant with mesh cages (diameter<br />
50 cm, height 60 cm, mesh diameter 0.1 cm). As controls, I exposed nymphs to natural levels <strong>of</strong><br />
predation on uncovered host plants. Hereafter I will use the term ‘survival’ to refer to all nymphs<br />
present in control plots (on or <strong>of</strong>f host) and in exclosures at a given time.<br />
I selected sites based on field records indicating that they were representative <strong>of</strong> M. diocles habitat. This<br />
species was shown to occur at forest edges and in moist areas <strong>of</strong> the understory where several species <strong>of</strong><br />
Araceae, especially Philodendron spp. and Piperaceae are abundant (see Chapter 2).<br />
At each <strong>of</strong> three sites in the forest understory I installed 10 experimental plots. Each plot included both<br />
an exclosure and a control plant (1 m apart from each other).The experimental plots were at least 5 m<br />
apart. In each exclosure I planted one individual <strong>of</strong> P. marginatum that had a minimum <strong>of</strong> three adult
Predation mediated mortality & migratory behavior <strong>of</strong> nymphs 80<br />
leaves (P. marginatum saplings were grown in the greenhouse to keep them free from herbivores). The<br />
diameter <strong>of</strong> the exclosures was sufficiently large so that leaves <strong>of</strong> the enclosed plant did not touch the<br />
mesh sides. Control plants were positioned 1 m next to an exclosure.<br />
The experiment was repeated four times (run 1 to 4) during three months in 2001 (September 18 to<br />
October 2, October 3 to October 17, October 25 to November 6, November 23 to December 5), each<br />
time with a new set <strong>of</strong> plants. Before starting an experimental runexclosures and the plants therein were<br />
checked for herbivores and predators such as frogs, ants, spiders and bugs, which were then removed. I<br />
also checked the surrounding vegetation <strong>of</strong> each control plant (in a circle <strong>of</strong> 1 m radius, 2 m height) to<br />
ensure that no individuals <strong>of</strong> M. diocles were present (no M. diocles specimens were found).<br />
First instar nymphs <strong>of</strong> M. diocles were set in the experimental plots (one nymph per plant). In average<br />
nymphs weighed 14.82 mg (StDev 7.10 mg, N = 219) and were 12 to 15 mm long. The nymphs were<br />
reared from eggs collected in a laboratory colony. All individuals had hatched at least three days before<br />
the beginning <strong>of</strong> the experiment. After three days the cuticle and mandibles have hardened and the<br />
intestines are fully functional. All individuals were only used once.<br />
In each run I recorded survival and migratory activity <strong>of</strong> the nymphs for 14 days. At the beginning <strong>of</strong> an<br />
experiment in the morning (before 10 am) <strong>of</strong> day 1, I set one nymph on each plant in exclosures and<br />
controls. I then checked each plant whether the nymph was still present: daily in the morning and the<br />
evening for run 1 to 3 and daily in the morning for run 4 (by then the difference between nocturnal and<br />
daytime events was supported by sufficient data).<br />
Nymphs in the exclosures that were not found on the host plant either fell dead to the ground, or moved<br />
(i.e., ‘migrated’) up to the mesh <strong>of</strong> the exclosures.<br />
I thoroughly searched for nymphs that disappeared from control plants in the surrounding vegetation (in<br />
a circle <strong>of</strong> 1 m radius, 2 m height, see above). Nymphs found alive <strong>of</strong>f their host were recorded as<br />
migrating (only two dead nymphs were found <strong>of</strong>f-host). The location was marked and the distance<br />
traveled measured. Migrating nymphs were followed during the experiment to record remigration to<br />
their hosts, further emigration or loss. If a nymph could not be found, it was recorded as disappeared. In<br />
total, I obtained data for 238 nymphs in both exclosures and controls.<br />
To allow for an analysis <strong>of</strong> potential bottom-up effects triggering nymph migration, I estimated the size<br />
and condition <strong>of</strong> the host plant by counting healthy young and mature leaves at the beginning <strong>of</strong> a trial<br />
and after a nymph had disappeared or left the plant. I discarded senescent leaves. Plant size was then<br />
expressed as the total number <strong>of</strong> healthy leaves per host plant individual.<br />
5.2.3 Greenhouse experiment<br />
To account for intrinsic mortality and migratory potential that is not predation related, I<br />
documented migratory activity and residence (survival) <strong>of</strong> nymphs for 14 days in seven<br />
greenhouse experimental plots (these open greenhouses are protected against intruders by
Predation mediated mortality & migratory behavior <strong>of</strong> nymphs 81<br />
mesh). Mortality comparisons <strong>of</strong> nymphs in screened greenhouses and in exclosures can also<br />
help to uncover microclimatic influences by exclosure design.<br />
I installed plots <strong>of</strong> 1 m 2 size. An individual <strong>of</strong> P. marginatum was planted in the center <strong>of</strong> a plot and<br />
eight individuals at the outer borders. Nymphs were prevented from leaving a plot by an adhesive<br />
barrier (Tanglefoot – Insect Trap Coating, The Tanglefoot Co., USA). A single nymph was then set on<br />
the central plant and checked twice daily. Residence, migration and remigration were checked<br />
accordingly. I used the same criteria for nymphs and host plants as described above. In total, I followed<br />
53 nymphs in this experiment. Occasionally, workers <strong>of</strong> Ectatomma ruidum ROGER, a ponerine ant,<br />
passed the adhesive barrier and entered the plots. As these were rare events, predation events can largely<br />
be ruled out.<br />
5.2.4 Data analysis<br />
Survival times were analyzed by the Kaplan-Meier estimate (also known as the product-limit estimate;<br />
Kaplan & Meier 1958). The survival function gives the probability that an individual will survive past a<br />
given time. Differences in residence times were analyzed by the Mantel-Cox log-rank test (Mantel<br />
1966; Cox 1972). Under the assumption that deaths or disappearances <strong>of</strong> nymphs were independent, the<br />
Mantel-Cox test proved suitable for the dataset as it gives equal weight to all events.<br />
Migration distances were calculated as mean migration distance per nymph because some<br />
nymphs moved multiple times.<br />
Plant size was expressed as total number <strong>of</strong> healthy leaves per host plant after death or disappearance <strong>of</strong><br />
a nymph or at day 14 in case the nymph was still present. As data were not normally distributed, I<br />
compared median plant size via Mann-Whitney U-tests.<br />
5.3 Results<br />
5.3.1 Predation-mediated patterns in M. diocles nymph mortality<br />
Survival times <strong>of</strong> M. diocles nymphs differed significantly between exclosures and controls (Figure 5-<br />
1). In total, nymph survival was three times higher on caged plants than on exposed plants (81% vs<br />
27%; Table 5-1). In the exclosures, survival times varied neither spatially among the three forest sites,<br />
nor temporally throughout the study period. In contrast, spatio-temporal variation increased in the<br />
controls where nymphs were exposed to natural levels <strong>of</strong> predation. Most notably, survival times<br />
differed significantly among runs in the controls (Mantel-Cox Test; X 2 = 23.62, df = 3, P < 0.0001).<br />
In controls, significantly more nymphs disappeared at night as compared to the daytime (Figure 5-2). In<br />
contrast, there was no diurnal variation in mortality in the exclosures, where predation was absent<br />
(Mantel-Cox Test; X 2 = 1.96, df = 1, P < 0.16).
Predation mediated mortality & migratory behavior <strong>of</strong> nymphs 82<br />
Survival <strong>of</strong> nymphs<br />
1.0<br />
0.8<br />
0.6<br />
0.4<br />
0.2<br />
0.0<br />
survival in exclosures<br />
survival in controls<br />
0 2 4 6 8 10 12 14<br />
Time passed [days]<br />
Figure 5-1: Cumulative survival <strong>of</strong> phasmid nymphs in exclosures versus controls. Survival is expressed as the<br />
probability that an individual survives past a given time (Kaplan-Meier estimate). Survival times <strong>of</strong> M. diocles<br />
nymphs differed significantly between exclosures and controls (Mantel-Cox Test; X 2 = 74.08, df = 1, P < 0.0001).<br />
Data were pooled from four experimental runs each lasting 14 days (N = 119 nymphs per treatment). Error bars<br />
show ±1 SE.<br />
Mortality <strong>of</strong> nymphs<br />
0.6<br />
0.5<br />
0.4<br />
0.3<br />
0.2<br />
0.1<br />
0.0<br />
control/night<br />
control/day<br />
exclosure/night<br />
exclosure/day<br />
0 2 4 6 8 10 12 14<br />
Time passed [days]<br />
Figure 5-2: Cumulative mortality (i.e., death or disappearance) <strong>of</strong> nymphs in exclosures versus controls at night<br />
and in the day. Mortality is expressed as the probability that an individual dies past a given time (Kaplan-Meier<br />
estimate). In controls, significantly more nymphs disappeared at night as compared to the daytime (Mantel-Cox<br />
Test; X 2 = 31.13, df = 1, P < 0.0001). Data were pooled from experimental runs 1, 2 and 3 (N = 89; evening checks<br />
were omitted in run 4).
Predation mediated mortality & migratory behavior <strong>of</strong> nymphs 83<br />
Table 5-1: Disappearance or death and migratory activity <strong>of</strong> M. diocles nymphs in a field experiment with<br />
predation exclusion.<br />
Treatment<br />
No. <strong>of</strong> M. diocles nymphs Exclosure Control Chi-Square test<br />
Total 119 119<br />
Disappeared or dead after 14 days 23 87 X 2 = 67.09, p < 0.01<br />
Migrated 30 37 X 2 = 0.75, p = 0.39<br />
Various invertebrate predators were recorded (Table 5-2). Spiders (2 cases) and bugs (Reduviidae) (1<br />
case) were seen preying upon nymphs, and Ectatomma ants were repeatedly found on control plants<br />
prior to the disappearance <strong>of</strong> nymphs.<br />
The fate <strong>of</strong> any lost nymph in the control plots is either a result <strong>of</strong> 1) predation, 2) intrinsic mortality<br />
with subsequent removal by scavengers, or 3) emigration beyond the searched area. Intrinsic mortality<br />
was assumed to be the same in exclosures and controls and was therefore approximated as the<br />
proportion <strong>of</strong> nymphs having died on caged plants (19 %, i.e. 23 out <strong>of</strong> 119 nymphs; Table 5-1). This<br />
estimate proved legitimate as mortality levels in the greenhouse experiment did not differ significantly<br />
(32 %, i.e. 17 out <strong>of</strong> 53 nymphs; X 2 = 2.66, df = 1, P = 0.10). The latter correspondence also suggests<br />
that mortality levels were not considerably influenced by the exclosures. I consider disappearance due to<br />
emigration to have been negligible for two reasons. First, the search area around control plants (1 m<br />
radius) was well above the mean range nymphs moved: 47.53 cm (SD 39.13 cm, N = 29) between<br />
subsequent checks, with the 75 percent quartile lying below 72 cm. Second, overall migratory activity in<br />
controls appeared to be adequately estimated, as the proportion <strong>of</strong> moving nymphs corresponded well<br />
with exclosures (Table 5-1). This was further confirmed by the fact that the proportion <strong>of</strong> migrating<br />
nymphs in the predation-free greenhouse experiment (8 from 53 nymphs) was not different from the<br />
exclosures (30 from 119 nymphs; X 2 = 1.49, df = 1, P = 0.22).<br />
The proportion <strong>of</strong> nymphs dying on control plants due to predation was therefore estimated as follows:<br />
disappearance in controls (73%) – intrinsic mortality in exclosures (19%) – emigration from control<br />
plots (negligible) = 54%.
Predation mediated mortality & migratory behavior <strong>of</strong> nymphs 84<br />
Table 5-2: Potential predators <strong>of</strong> M. diocles nymphs observed on 119 control plants. Each plant was surveyed 29<br />
times in runs 1 to 3 and 15 times in run 4 (including one night check per run).<br />
Predator group No. <strong>of</strong> observations<br />
Ants (Formicidae); Ectatomma spp.<br />
Army ants (Eciton spp.)<br />
Others<br />
Spiders (Araneae) 44<br />
Reduvid bugs (Hemiptera) 3<br />
Frogs (Anura) 2<br />
Katydids * (Orthoptera); adults 35<br />
* Katydids are <strong>of</strong>ten omnivorous<br />
5.3.2 Predation and <strong>of</strong>f-plant migration<br />
The initially stated hypothesis that migration may be a response to predation pressure (i.e., a mechanism<br />
for predator avoidance) was not supported by the observed pattern <strong>of</strong> migratory activity in the field<br />
experiment, because proportions <strong>of</strong> migrating nymphs between treatments were similar (25 % in<br />
exclosures, 31 % in controls; Table 5-1). Nevertheless, migratory activity in the field was markedly<br />
increased compared to the greenhouse experiment (15 %), and the proportion <strong>of</strong> migrating nymphs in<br />
the control plots was significantly higher than in the greenhouse plots (X 2 = 4.07, df = 1, P < 0.05).<br />
In contrast nymph migration was related to the number <strong>of</strong> healthy leaves per host plant (as measure <strong>of</strong><br />
resource availability). Plants from where nymphs emigrated (i.e. nymphs from both treatments that<br />
never returned to their host) had significantly fewer healthy leaves than plants from sessile nymphs (i.e.<br />
nymphs from both treatments that never left their host) (Figure 5-3). In contrast, there was no difference<br />
between leaf numbers <strong>of</strong> plants from remigrating and sessile nymphs.<br />
38<br />
3<br />
7
Predation mediated mortality & migratory behavior <strong>of</strong> nymphs 85<br />
No. <strong>of</strong> healthy leaves per host plant<br />
12<br />
10<br />
8<br />
6<br />
4<br />
2<br />
0<br />
a a b<br />
sessile remigrated emigrated<br />
Median<br />
25%-75%<br />
Min-Max<br />
Figure 5-3: Plant size (in terms <strong>of</strong> healthy leaves per plant) for nymphs that left their hosts (emigrated, N = 24)<br />
was significantly lower than for nymphs that continuously stayed on their host during the experiment (sessile,<br />
N = 96; Mann-Whitney U = 712, P < 0.01) as well as for nymphs that left and returned to their host (remigrated,<br />
N = 38; U = 292, P < 0.05). Different letters indicate significant differences.
Predation mediated mortality & migratory behavior <strong>of</strong> nymphs 86<br />
5.4 Discussion<br />
5.4.1 The top-down view <strong>of</strong> M. diocles population regulation<br />
The presented study is the first to quantify predation-related mortality <strong>of</strong> early life stages <strong>of</strong> <strong>phasmids</strong>.<br />
First instar nymphs <strong>of</strong> M. diocles suffered 73 % mortality in a two-week period, and the significant<br />
reduction in mortality in exclosures indicates that natural enemies were an important source <strong>of</strong><br />
mortality. These results correspond with earlier studies showing predation pressure as a severe factor<br />
influencing survival <strong>of</strong> insect herbivores (e.g. Chang 1991, Floyd 1996, Moran & Hurd 1998) and in<br />
particular immature stages <strong>of</strong> holometabolous external feeding insects (Cornell & Hawkins 1995,<br />
Cornell et al. 1998). Similar patterns have been described for temperate hemimetabolous grasshoppers.<br />
For example, for the whole 48 d nymphal period <strong>of</strong> two grasshoppers Belovsky et al. (1990) estimated<br />
the loss to predators to be ca 40 %. Oedekoven & Joern (1998) accounting 19 % <strong>of</strong> grasshopper nymph<br />
mortality (3 rd instar) while total stage-specific mortality exceeded 90 %. Here, I provided evidence that<br />
nymphs <strong>of</strong> a hemimetabolous tropical phasmid suffered approximately 54 % predation-related mortality<br />
in a 14-day period. As <strong>phasmids</strong> in general have much longer nymphal periods than grasshoppers, total<br />
predation impact on immature stages may not be comparable between the two herbivore groups. It is<br />
reasonable to assume that the extended larval development in <strong>phasmids</strong> (ca 100 d in M. diocles, cf<br />
Chapter 3) may increase the impact <strong>of</strong> predation as compared to grasshoppers. High enemy-induced<br />
mortality in late developmental stages <strong>of</strong> holometabolous insects originates as high parasitation <strong>of</strong> the<br />
pupal stage (Hawkins et al. 1997). Hemimetabolous insects lack this immobile phase <strong>of</strong> reorganisation.<br />
In the case <strong>of</strong> <strong>phasmids</strong> their extended larval development could compensate for the lack <strong>of</strong> parasitoid-<br />
mediated control.<br />
My findings support the top-down view <strong>of</strong> population regulation in M. diocles. Such high predator<br />
induced mortality as presented here leads to a drastic reduction <strong>of</strong> the rate <strong>of</strong> population increase in only<br />
the first two weeks <strong>of</strong> the developmental period <strong>of</strong> this phasmid. Individuals that had so far survived still<br />
need another 12 to 13 weeks before they enter the reproductive stage. However, my results do not allow<br />
for an extrapolation <strong>of</strong> predation impact over the whole life cycle <strong>of</strong> M. diocles, because different life-<br />
stages <strong>of</strong> an insect may experience different susceptibilities to predation, <strong>of</strong>ten in a size-selective<br />
manner (Oedekoven & Joern 1998).<br />
Predation pressure in the present study may be underestimated for two reasons: First, a proportion <strong>of</strong> the<br />
host plant specific predator community (Dyer et al. 1999) could have been missed by the use <strong>of</strong> a gap<br />
associated Piper species. In addition, I could not measure parasitoid attack. Parasitoids may live in their<br />
host a long time only becoming lethal in later developmental stages (Begon et al. 1996). However,<br />
based on observations from specimens collected in the field, parasitoids probably play a minor role in<br />
early mortality <strong>of</strong> M. diocles nymphs.
Predation mediated mortality & migratory behavior <strong>of</strong> nymphs 87<br />
My results need to be discussed with regard to two major problems involved in conducting field<br />
experiments. My design <strong>of</strong> exclosures could have caused microclimatic changes leading to differential<br />
mortality. I think matching proportions <strong>of</strong> intrinsic mortality in both the field and the migration<br />
experiment in greenhouses do enforce my results and suggest that influence <strong>of</strong> microclimatic differences<br />
in the exclosures was negligible. Further, in my study disappearance <strong>of</strong> nymphs in control plots (54 %)<br />
could just reflect emigration, and emigration then was higher at night as <strong>phasmids</strong> are nocturnal. I<br />
presented evidence that emigration <strong>of</strong> nymphs most likely did not affect the presented results, because<br />
my searching area was well above the average distance <strong>of</strong> 47.53 cm nymphs moved between checking<br />
the plots. Similar movement ranges in <strong>phasmids</strong> have been reported previously (0.55 m d -1 , Willig et al.<br />
1986), and phasmid nymphs were shown to behave philopatric while adults represent the dispersal stage<br />
(Willig et al. 1986, 1993). In addition, similar proportions <strong>of</strong> migrating nymphs in both treatments<br />
indicate that migratory behavior was observed adequately.<br />
5.4.2 Is <strong>of</strong>f-plant migration mediated by natural enemies or by resources?<br />
The initially stated hypothesis that migration behavior <strong>of</strong> M. diocles nymphs would reflect predator<br />
avoidance could not be supported by observations in the field experiment. Preys are expected to invest<br />
in predator avoidance tactics when predation risk is sufficiently high (Charnov et al. 1976, Lima &<br />
Bednek<strong>of</strong>f 1999, Luttbeg & Schmitz 2000). Experimental studies show that prey display migratory<br />
predator avoidance based on the risk imposed by predators (Snyder & Wise 2000, Venzon et al. 2000).<br />
This may not apply for the presented study system. I showed that nymphs <strong>of</strong> M. diocles suffered<br />
significant pressure from the third trophic level, but I did not find the expected increase in migratory<br />
activity <strong>of</strong> nymphs in controls.<br />
Increased migratory activity <strong>of</strong> nymphs in the field as compared to nymphs in greenhouses may reflect<br />
odor-released migration. For example, herbivorous mites migrate in-between their host plant as a<br />
specific reaction to odors <strong>of</strong> their predators (Magalhães et al. 2002). The general observation that part <strong>of</strong><br />
M. diocles nymphs moved in both the field and the greenhouse experiment may be intrinsically<br />
triggered as a consequence <strong>of</strong> enemy free space. This has been shown for herbivores moving in non-<br />
feeding periods to patches <strong>of</strong> reduced predation risk (for a review see Beredegue et al. 1996). However,<br />
migration may be <strong>of</strong> minor importance for predation avoidance in <strong>phasmids</strong>, because they show a<br />
variety <strong>of</strong> behavioral and morphological adaptations to escape from predators, such as chemical defense<br />
(e.g. Eisner 1965; Carlberg 1985; Eisner et al. 1997), acoustic and color display (Robinson 1968a,<br />
1968b, 1969), as well as camouflage and mimicry (Bedford 1978).<br />
As an alternative to top-down related explanations <strong>of</strong> migration, data indicated that emigration may be<br />
attributed to ‘plant size’ (in terms <strong>of</strong> leaf number). Mean number <strong>of</strong> healthy leaves per host plant was<br />
significantly lower for emigrating nymphs than for sessile or remigrating nymphs. Plant size may reflect
Predation mediated mortality & migratory behavior <strong>of</strong> nymphs 88<br />
both food availability and quality. As first instar nymphs consume minimal quantities <strong>of</strong> leaf tissue per<br />
day (pers. obs.) food in general was available and hence the described emigration pattern seems not to<br />
be related to resource availability. I suggest that nymphs left their host because <strong>of</strong> significant bottom-up<br />
pressure in terms <strong>of</strong> reduced suitability <strong>of</strong> the host plant. Leaf traits such as nutrient or toxin content can<br />
be plant size related. Plants with lower leaf area suffer relatively higher damage by larval feeding and<br />
consequently are at higher risk <strong>of</strong> reduced fitness (Marquis 1992). The greater impact <strong>of</strong> herbivory on<br />
small plants should have selected for constitutive defenses that decline during development (Coley et al.<br />
1985; but see Kearsley & Whitham, 1989). Plant size was shown to positively affect larval performance<br />
<strong>of</strong> insect herbivores (Price 1991; Teeder & Tammaru 2002) and according to the plant vigor hypothesis,<br />
bigger plants or plant modules are more vigorous and preferred by herbivores (Price 1991). Both<br />
increased constitutive defenses and reduced plant vigor in smaller plants result in diminished food<br />
quality. Poor quality food is known to decrease survivorship (e.g., Lill & Marquis 2001) and<br />
development (Damman 1987) <strong>of</strong> herbivores and as a consequence larva may move on to a new host<br />
(van Dam et al. 2001). The presented relation <strong>of</strong> emigration and plant size supports this view but further<br />
research is needed to evaluate whether smaller individuals in Piper marginatum are <strong>of</strong> minor quality as<br />
food a source for M. diocles nymphs.<br />
If reduced suitability was the motivation to leave a host plant, there are still costs involved in searching<br />
for a new host. First the herbivore may not encounter a suitable new host in time and it is deprived <strong>of</strong><br />
food while searching. Very young caterpillars, for example, <strong>of</strong>ten have trouble finding neighboring food<br />
plants (van Dam et al. 2000) and temporal deprivation <strong>of</strong> food can retard development more strongly<br />
than feeding on an induced low quality food source (van Dam et al. 2001). Second, while searching, the<br />
herbivore runs risk <strong>of</strong> being attacked by enemies (Price et al. 1980). In contrast, staying can result in<br />
higher enemy-caused mortality as development is decelerated (slow growth/ high mortality) (Feeny<br />
1976; Clancy & Price 1987). Hence bottom-up factors can affect mortality directly through starvation<br />
and indirectly through a feedback loop to predation.<br />
5.4.3 Who are the predators?<br />
In my study, disappearance <strong>of</strong> nymphs was significantly higher at night. I showed that disappearance to<br />
a high extent may have reflected predation. As a consequence, I concluded that birds, a prominent group<br />
<strong>of</strong> predators on herbivorous insects (e.g., Marquis & Whelan 1994; Floyd 1996; Murakami 1999) seem<br />
to be <strong>of</strong> no importance as mortality source <strong>of</strong> M. diocles nymphs. In accordance with Belovsky et al.<br />
(1990) I suggest that arthropods are the principal predators on immature individuals. During the day,<br />
nymphs <strong>of</strong> M. diocles mainly hide on the underside <strong>of</strong> leaves. They huddle against the leaf midrib with<br />
their morphology perfectly blending in with the substrate (pers. obs.). Due to this camouflage, they may<br />
prevent predation during the day from visually searching natural enemies. At night, when moving from<br />
their hiding location to a feeding site, they are most vulnerable to attack. Nocturnal activity is a common<br />
behavioral adaptation to decrease predation risk. Nonetheless, many predators search for prey at night. I
Predation mediated mortality & migratory behavior <strong>of</strong> nymphs 89<br />
found spiders, bugs (Reduviidae) and ants <strong>of</strong> the genus Ectatomma preying upon nymphs. The relevance<br />
<strong>of</strong> Ectatomma ants as predators <strong>of</strong> M. diocles is supported by high densities <strong>of</strong> these ants in the BCI<br />
forest (Levings & Franks 1982), and by the fact that E. ruidum workers preyed upon nymphs in lab<br />
experiments (data not shown). E. ruidum is mainly foraging in the litter and on the soil whereas<br />
E. tuberculatum searches different plant strata (Levings & Franks 1982). Ectatomma spp., like many<br />
other ant species show no expressed pattern in diurnal activity (Kaspari & Weiser 2000). In contrast,<br />
Pheidole radowskowskii FOREL (Formicidae) was shown to preferentially forage at night (Kaspari &<br />
Weis 2000) and to forage in high frequencies on leaves <strong>of</strong> Piper marginatum (Dyer et al. 1999).<br />
5.4.4 Conclusions<br />
M. diocles and many other <strong>phasmids</strong> occur in particularly low densities in humid tropical forests (cf.<br />
Chapter 2; Novotny & Basset 2000). Yet, the factors influencing population densities in <strong>phasmids</strong> have<br />
never been addressed in an empirical study. My findings support the top-down view <strong>of</strong> population<br />
regulation in M. diocles. While my data cannot uncover any impacts on population dynamics, for<br />
example because predation rates alone fall short to including density-dependence <strong>of</strong> predator-prey<br />
interactions (Sih et al. 1985), the high rates <strong>of</strong> predator-induced mortality I found may directly translate<br />
into a reduction <strong>of</strong> the intrinsic rate <strong>of</strong> population increase and hence explain the low abundances <strong>of</strong> this<br />
stick insect.<br />
Contrary to my predictions, emigration <strong>of</strong> nymphs was not related to top-down pressure. Hence, the<br />
function <strong>of</strong> observed behavior in one prey may not be assignable to another. In accordance with Witz<br />
(1990), I emphasize experimental confirmation before assuming a behavior as predator avoidance. My<br />
results suggest host plant size as an alternative factor influencing the movement patterns <strong>of</strong> herbivores.<br />
Host plant size may be directly related to suitability as food source. Herbivore survivorship and<br />
fecundity can then be affected directly by plant size related leaf traits reducing quality and indirectly by<br />
increasing migratory behavior thereby increasing exposure to predators.
Concluding remarks 91<br />
6 Concluding remarks<br />
6.1 Is M. diocles a herbivore specialist?<br />
This study could not provide clear evidence whether the restrictions in M. diocles host range reflect<br />
specialization. The distant relationship <strong>of</strong> its host plant families, the Araceae and Piperaceae, disagrees<br />
with the predictions <strong>of</strong> the concept <strong>of</strong> biochemical coevolution (Ehrlich & Raven 1964; Strong et al.<br />
1984). Alternatively, restricted host range <strong>of</strong> M. diocles may reflect ‘clouded’ biochemical coevolution,<br />
i.e. the taxonomic relationship among host plants is disconnected by other factors such as predation.<br />
This concept <strong>of</strong> diffuse coevolution (Janzen 1979; 1980; Fox 1981) bases on multitrophic interactions<br />
simultaneously exerting selective pressures on one another and being affected by changes in other<br />
component members. For example, strong differential predation pressure on host plant species as<br />
demonstrated by Sandoval (1994), may have led to the exclusion <strong>of</strong> missing links between Araceae and<br />
Piperaceae in the host plant range <strong>of</strong> M. diocles. Such a scenario must remain purely speculative<br />
because so far there is no incidence that these families are in a closer taxonomoic relation. In contrast,<br />
the Araceae belong to the monocots and the Piperaceae remain on a somehow uncertain taxonomic<br />
position among the paleoherbs between mono- and dicots (Judd et al. 2002). At least future field-<br />
experiments assessing predation pressure on M. diocles on different host plants would give a principle<br />
idea, whether diffuse coevolution may be involved.<br />
However, Jermy (1976) suggested an alternative ‘null’ model <strong>of</strong> coevolution. Sequential evolution may<br />
best apply to herbivores like M. diocles that feed on distantly related plant taxa. Jermy (1976) argued<br />
that, because most insect herbivores have low population densities, they could hardly be important<br />
selection factors for plants. Insect-host relationships need not be antagonistic, they may as well interact<br />
in a mutually advantageous way by insects keeping their hosts at an ideal density. Consequently<br />
secondary compounds may not reflect defense, as resistance is not necessary. According to sequential<br />
evolution, biochemical plant diversity origins from abiotic selection factors and from plant-plant<br />
interactions. Herbivores just adapt to plant changes but don’t influence them markedly. Generally, this<br />
model applies when evidence for coevolution is not forthcoming, and parallel evolutionary lines <strong>of</strong><br />
plants and insects are few (Hartley & Jones 1995). As a consequence <strong>of</strong> sequential evolution, plants and<br />
their interactions with the abiotic and biotic environment replace herbivores. Thus the initially stated<br />
supposition that herbivores are central factors in maintaining forest dynamics and ecosystem stability <strong>of</strong><br />
tropical forests (Lowman 1984; Brokaw 1985; Collins et al. 1985; Schowalter 1985; Brown et al. 1987)<br />
cannot hold if herbivore specialization is based on sequential coevolution.<br />
Concluding, this study showed that M. diocles as a tropical herbivore is clearly restricted in its host<br />
range, particularly facing the fact that this species seems to feed only on some plants from two families<br />
out <strong>of</strong> more than 1200 plant species representing 120 families occurring on BCI (Croat 1978). Host
Concluding remarks 92<br />
plant use <strong>of</strong> M. diocles may even be more restricted as shown here, because differential interspecific<br />
effects among host plants on nymph performance were great.<br />
6.2 Bottom-up or top-down or both<br />
This study provided evidence that herbivores suffer significant impact from both bottom-up and top-<br />
down factors. In the debate about the relative roles <strong>of</strong> higher and lower trophic levels in regulating<br />
tropical herbivore populations several authors recently reasoned that natural enemies (Pace et al. 1999;<br />
Persson 1999; Polis 1999; Dyer & Coley 2001) and in particular their marked effect on early lifestages<br />
(Cornell & Hawkins 1995; Cornell et al. 1998) exceeded the effects from plants.<br />
My results give further support to this view. Predation seems be the stronger factor explaining low<br />
abundances <strong>of</strong> M. diocles in the BCI forest because <strong>of</strong> its direct effects and because <strong>of</strong> indirect effects<br />
mediated by host plants.<br />
In two weeks nymphs suffered 54 % mortality from predators in their natural environment and predation<br />
pressure seemed to be spread equally in the forest understory (cf. Chapter 5). On the other hand I<br />
provided evidence that nymphs, when confronted with an inadequate host may suffer up to 100 %<br />
mortality in a comparable time span (cf. Chapter 4). I also showed that nymphs may leave a host <strong>of</strong><br />
minor suitability (although the evidence was weak; cf. Chapter 5). Sedentary behaviour on such a host<br />
involves two risks. The nymph may die because <strong>of</strong> toxic or minor nutritive host quality (particularly if<br />
this host was Piper grande or Dieffenbacchia longispatha, cf. Chapter 4 or e.g., Lill & Marquis 2001))<br />
or it will suffer decreased growth thereby remaining longer in the more vulnerable immature stage<br />
(Damman 1987). Leaving the host involves the risks <strong>of</strong> starvation, <strong>of</strong> not finding any or a more suitable<br />
host (van Dam et al. 2001), and <strong>of</strong> predation (Price et al. 1980).<br />
At least in the understory <strong>of</strong> the BCI forest M. diocles nymphs may find an acceptable host in the<br />
abundant Philodendron inaequilaterum (Croat 1978). This species pro<strong>of</strong>ed to be <strong>of</strong> high suitability for<br />
nymphs as they suffered least mortality. Albeit, growth on Phil. Inaequilaterum was decreased as<br />
compared to some other species. Despite the fact that a plant species may be <strong>of</strong> minor suitability<br />
considering growth, <strong>phasmids</strong> were shown to modulate feeding in their natural setting rather to<br />
availability than to acceptability (Willig et al. 1993).<br />
Consequently, low suitability <strong>of</strong> a host plant may either kill a nymph(demonstrated in Chapter 5), it may<br />
translate into higher predation pressure via decelerated growth (slow-growth high mortality; Feeny<br />
1976; Clancy & Price 1987), or it may increase the exposure to predators if the nymph searched a new<br />
host. In other words: effects <strong>of</strong> host suitability feed back into predation and thereby add on to direct top-<br />
down effects.<br />
Closing, I would like to come back to Lawton & McNeill (1979): the Devils can only be that evil<br />
because the Sea is so Deep and Blue.
Abstract 93<br />
7 Abstract<br />
Herbivory is discussed as a key agent in maintaining dynamics and stability <strong>of</strong> tropical forested<br />
ecosystems. Accordingly increasing attention has been paid to the factors that structure tropical<br />
herbivore communities.<br />
The aim <strong>of</strong> this study was (1) to describe diversity, density, distribution and host range <strong>of</strong> the phasmid<br />
community (Phasmatodea) <strong>of</strong> a moist neotropical forest in Panamá, and (2) to experimentally assess<br />
bottom-up and top-down factors that may regulate populations <strong>of</strong> the phasmid Metriophasma diocles.<br />
The phasmid community <strong>of</strong> Barro Colorado Island was poor in species and low in density. Phasmids<br />
mainly occurred along forest edges and restricted host ranges <strong>of</strong> phasmid species reflected the<br />
successional status <strong>of</strong> their host plants. Only M. diocles that fed on early and late successional plants<br />
occurred regularly in the forest understory.<br />
A long generation time with a comparably low fecundity converted into a low biotic potential <strong>of</strong><br />
M. diocles. However, modeled potential population density increased exponentially and exceeded the<br />
realized densities <strong>of</strong> this species already after one generation indicating that control factors<br />
continuously affect M. diocles natural populations. Egg hatching failure decreased potential<br />
population growth by 10 % but was <strong>of</strong> no marked effect at larger temporal scale.<br />
Interspecific differences in defensive physical and chemical leaf traits <strong>of</strong> M. diocles host plants,<br />
amongst them leaf toughness the supposedly most effective anti-herbivore defense, seemed not to<br />
affect adult female preference and nymph performance. Alternatively to these defenses, I suggest that<br />
the pattern <strong>of</strong> differential preference and performance may be based on interspecific differences in<br />
qualitative toxic compounds or in nutritive quality <strong>of</strong> leaves. The significant rejection <strong>of</strong> leaf tissue<br />
with a low artificial increase <strong>of</strong> natural phenol contents by nymphs indicated a qualitative defensive<br />
pathway in Piper evolution. In M. diocles, oviposition may not be linked to nymph performance,<br />
because the evolutionary prediction <strong>of</strong> a relation between female adult preference and nymph<br />
performance was missing. Consequently, the recruitment <strong>of</strong> nymphs into the reproductive adult phase<br />
may be crucially affected by differential performance <strong>of</strong> nymphs.<br />
Neonate M. diocles nymphs suffered strong predation pressure when exposed to natural levels <strong>of</strong><br />
predation. Concluding from significantly increased predation-related mortality at night, I argue that<br />
arthropods may be the main predators <strong>of</strong> this nocturnal herbivore. Migratory behavior <strong>of</strong> nymphs<br />
seemed not to reflect predation avoidance. Instead, I provided first evidence that host plant quality<br />
may trigger <strong>of</strong>f-plant migration.<br />
In conclusion, I suggest that predation pressure with its direct effects on nymph survival may be a<br />
stronger factor regulating M. diocles populations, compared to direct and indirect effects <strong>of</strong> host plant<br />
quality, particularly because slow growth and <strong>of</strong>f-host migration both may feed back into an increase<br />
<strong>of</strong> predation related mortality.
Literature cited 95<br />
8 Literature cited<br />
Abisgold, J. D., and S. J. Simpson. 1987. The physiology <strong>of</strong> compensation by locusts for changes in dietary<br />
protein. J Exp Biol 129: 329-346.<br />
Abrahamson, W. G., and A. E. Weis. 1997. Evolutionary <strong>ecology</strong> across three trophic levels: goldenrods, gall<br />
makers, and natural enemies. Princeton University Press, Princeton, USA.<br />
Andersson, M. 1994. Sexual selection. Princeton, New Jersey.<br />
Andrewartha, H. G., and L. C. Birch. 1954. The distribution and abundance <strong>of</strong> animals. University <strong>of</strong> Chicago<br />
Press, Chicago, Illinois, USA.<br />
Andrewartha, H. G., and L. C. Birch. 1984. The ecological web. University <strong>of</strong> Chicago Press, Chicago, IL.<br />
Atluri, J. B., S. P. V. Ramana, and C. S. Reddi. 2004. Ecobiology <strong>of</strong> the tropical pierid butterfly Catopsilia<br />
pyranthe. Current Science 86(3): 457-461.<br />
Awmack, C. S., and S. R. Leather. 2002. Host plant quality and fecundity in herbivorous insects. Annual<br />
Review <strong>of</strong> Entomology 47: 817-844.<br />
Baldwin, I. T. 1994. Chemical changes rapidly induced by folivory. In Bernays, E. A. (Ed.) Insect-Plant<br />
interactions. Boca Raton, London, Tokyo, CRC Press.<br />
Baldwin, I. T. 1996. Methyl jasmonate-induced nicotine production in Nicotiana attenuata: inducing defenses in<br />
the field without wounding. Entomologia Experimentalis et Applicata 80: 213-220.<br />
Baldwin, I. T. 1998. Jasmonate-induced responses are costly but benefit plants under attack in native<br />
populations. Proceedings <strong>of</strong> the National Academy <strong>of</strong> Sciences <strong>of</strong> the United States <strong>of</strong> America 95:8113-<br />
8118.<br />
Baldwin, I. T., and J. C. Schultz. 1988. Phylogeny and the patterns <strong>of</strong> leaf phenolics in gap and forest-adapted<br />
Piper and Miconia understory shrubs. Oecologia 75: 105-109.<br />
Baldwin, I. T., and T. E. Ohnmeiss. 1993. Alkaloidal responses to damage in Nicotiana native to North<br />
America. Journal <strong>of</strong> Chemical Ecology 19:1143-1153.<br />
Baldwin. I. T., D. Gorham, E. A. Schmelz, C. Lewandowski, and G. Y. Lynds. 1998. Allocation <strong>of</strong> nitrogen to<br />
an inducible defense and seed production in Nicotiana attenuata. Oecologia 115: 541-552.<br />
Barker, A. M., and C. J. M. Maczka. 1996. The relationships betIen host selection and subsequent larval<br />
performance in three free-living graminivorous sawflies. Ecological Entomology 21: 317-327.<br />
Barone, J. A. 1998. Host-specificity <strong>of</strong> folivorous insects in a moist tropical forest. Journal <strong>of</strong> Animal Ecology<br />
67(3): 400-409.<br />
Basset, Y. 1992. Host specificity <strong>of</strong> arboreal and free-living insect herbivores in rain forests. Biological Journal<br />
<strong>of</strong> the Linnean Society 47: 115-133.<br />
Basset, Y. 1996. Local communities <strong>of</strong> arboreal herbivores in Papua New Guinea: predictors <strong>of</strong> insect variables.<br />
Ecology 77: 1906-1919.
Literature cited 96<br />
Basset, Y. 1997. Species - abundance and body size relationships in insect herbivores associated with New<br />
Guinea forest trees, with particular reference to insect host-specificity. In Stork N. E., J. A. Adis, and R.<br />
K. Didham. Canopy arthropods. Chapman & Hall.<br />
Basset, Y. 1999. Diversity and abundance <strong>of</strong> insect herbivores foraging on seedlings in a rain forest in Guyana.<br />
Ecological Entomology 24: 245-259.<br />
Basset, Y. 2000. Insect herbivores foraging on seedlings in an unlogged rain forest in Guyana: spatial and<br />
temporal considerations. Studies on Neotropical Fauna and Environment 35: 115-129.<br />
Basset, Y., and D. Burckhardt. 1992. Abundance, species richness, hostutilization, and host specificity <strong>of</strong> insect<br />
folivores from a woodland site, with particular reference to host architecture. Rev. Suisse Zool. 99: 771-<br />
791.<br />
Basset, Y., G. A. Samuelson, A. Allison, and S. E. Miller. 1996. How many species <strong>of</strong> host specific insects feed<br />
on a species <strong>of</strong> tropical tree? Biological Journal <strong>of</strong> the Linnean Society 59: 201-216.<br />
Basset, Y., H. P. Aberlenc, and G. Delvare. 1992. Abundance and stratification <strong>of</strong> foliage arthropods in a<br />
lowland rain forest <strong>of</strong> Cameroon. Ecological Entomology 17: 310-318.<br />
Beaver, R. A. 1979. Host-specificity <strong>of</strong> temperate and tropical animals. Science 281: 139-41.<br />
Bedford, G. O. 1978. Biology and <strong>ecology</strong> <strong>of</strong> the Phasmatodea. Annual Review <strong>of</strong> Entomology 23: 125-149.<br />
Begon, M., J. L. Harper, and C. R. Townsend. 1996. Ecology. 3rd editition. Blackwell Science Ltd.<br />
Begon, M., J. L. Harper, and C. R. Townsend. 1996. Ecology: individuals, populations and communities.<br />
Blackwell, Boston.<br />
Behmer, S. and A. Joern. 1993. Diet choice by a grass-feeding grasshopper based on the need for a limiting<br />
nutrient. Functional Ecology 7: 522-527.<br />
Behmer, S. and A. Joern. 1994. The influence <strong>of</strong> proline on diet selection: sex-specific feeding preferences by<br />
the grasshoppers Ageneotettix deorum and Phoetaliotes nebrascensis (Orthoptera: Acrididae). Oecologia<br />
98: 76-82.<br />
Belovsky, G. E. 1984. Herbivore optimal foraging: A comparative test <strong>of</strong> three models. Am. Nat. 124: 7-115.<br />
Belovsky, G. E. 1984. Snowshoe hare optimal foraging and its implications for population dynamics. Theor.<br />
Pop. Biol. 25(3): 235-264.<br />
Belovsky, G. E., J. B. Slade, and B. A. Stockh<strong>of</strong>f. 1990. Susceptibility to predation for different grasshoppers:<br />
an experimental study. Ecology 71: 624–634.<br />
Belovsky, G. E., and J. B. Slade. 1995. Dynamics <strong>of</strong> two montana grasshopper populations - relationships<br />
among Iather, food abundance and intraspecific competition. Oecologia 101(3): 383-396.<br />
Benrey, B., and R. Denno. 1997. The Slow-Growth-High-Mortality hypothesis: A test using the cabbage<br />
butterfly. Ecology 78: 987-999.<br />
Beredegue, M., J. T. Trumble, J. D. Hare, and R. A. Redak. 1996. Is it enemy-free space? The evidence for<br />
terrestrial insects and freshwater arthropods. Ecological Entomology 21: 203-217.<br />
Berenbaum, M. R., A. R. Zangerl, and J. K. Nitao. 1984. Constraints on chemical coevolution: wild parsnips<br />
and the parsnip webworm. Evolution 40: 1215-1228.
Literature cited 97<br />
Bergelson, J. M., and J. H. Lawton. 1988. Does foliage damage influence predation on the insect herbivores <strong>of</strong><br />
birch? Ecology 69: 434-445.<br />
Berger, J., and R. Wirth. 2001. Diversity and diet breadth <strong>of</strong> stick-insects (Phasmatodea) in a Panamanian semi-<br />
deciduous rainforest. In Zotz, G., and C. Koerner, (Eds.) Verhandlungen der Gesellschaft für Ökologie<br />
31: 338.<br />
Bernard, C. B., H. G. Krishnamurty, D. Chauret, T. Durst, B. J. R. Philogene, P. Sanchezvindas, C. Hasbun, L.<br />
Poveda, L. Sanroman, and J. T. Arnason. 1995. Insecticidal Defenses <strong>of</strong> Piperaceae from the Neotropics.<br />
Journal <strong>of</strong> Chemical Ecology21: 801-814.<br />
Bernays, E. A., and R. F. Chapman. 1970. Experiments to determine the basis <strong>of</strong> food selection by Chortippus<br />
parallelus (Orthoptera: Acrididae) in the field. J. Anim. Ecol. 39: 761-776.<br />
Bernays, E.A. and R.F. Chapman. 1978. Plant chemistry and acridoid feeding behavior. In J. B. Harbone (Ed.)<br />
Bio-chemical Aspects <strong>of</strong> Plant and Animal Coevolution. London, Academic Press.<br />
Bernays E. A., D. Chamberlain, and P. McCarthy. 1980. The differential effects <strong>of</strong> ingested tannic acid on<br />
different species <strong>of</strong> Acridoidea. Entomologia Experimentalis et Applicata 28:158–166<br />
Bernays, E. A., and M. Graham. 1988. On the evolution <strong>of</strong> host specificity in phytophagous arthropods. Ecology<br />
69: 886-92.<br />
Bernays, E. A., G. C. Driver, and M. Bilgener. 1989. Herbivores and plant tannins. Advances in Ecological<br />
Research 19: 263-302.<br />
Bernays, E. A., and R. F. Chapman. 1994. Host-plant selection by phytophagous insects. Chapman & Hall, New<br />
York.<br />
Bernays, E. A., K. L. Bright, N. Gonzalez, and J. Angel. 1994. Dietary mixing in a generalist herbivore: tests <strong>of</strong><br />
two hypotheses. Ecology 75: 1997–2006.<br />
Berryman, A. A., N. C. Stenseth, and A. S. Isaev. 1987. Natural regulation <strong>of</strong> insect herbivores in forest<br />
ecosystems. Oecologia 71: 174-184.<br />
Beyschlag, W., and H. Pfanz. 1990. A fast method to detect the occurrence <strong>of</strong> nonhomogeneous distribution <strong>of</strong><br />
stomatal aperture in heterobaric plant leaves. Oecologia 82: 52-55.<br />
Boppré, M., U. Seibt, and W. Wickler. 1984. Pharmacophagy in grasshoppers? Zonocerus attracted to and<br />
ingesting pure pyrrolizidine alkaloids. Entomologia experimentalis et applicata 35: 115-117.<br />
Boys, H. A. 1978. Food selection by Oedaleus senegalensis (Acrididae: Orthoptera) in grassland and millet<br />
fields. Entomol. Exp. 24: 78-86.<br />
Braker, H. E. 1991. Natural history and population biology <strong>of</strong> a tropical forest grasshopper. Biotropica 23: 41-<br />
50.<br />
Braker, H. E., and H. W. Greene. 1994. Animal population <strong>ecology</strong> and predator-prey interactions. In Ecology<br />
and Natural History <strong>of</strong> a Tropical Lowland Rain Forest. McDade, L. A., K. L. Bawa, H. A. Hespenheide,<br />
and G. S. Hartshorn, (Eds.) Chicago: University <strong>of</strong> Chicago Press: 244-255.<br />
Brokaw, N. V. L. 1985. Treefall, regrowth, and community structure in tropical forests. In Picket S. T. A., and<br />
P. S. White, (Eds.) Natural Disturbance and Patch Dynamics. Orlando, Florida, Academic Press.
Literature cited 98<br />
Brown, B. J., M. Hanson, D. Liverman, and R. Merideth jr. 1987. Global sustainability: Toward definition,<br />
Environmental Management 11(6): 713-719.<br />
Burghardt, F., and K. Fiedler. 1996. The influence <strong>of</strong> diet on growth and secretion behaviour <strong>of</strong><br />
myrmecophilous Polyommatus icarus caterpillars (Lepidoptera: Lycaenidae). Ecological Entomology 21:<br />
1-8.<br />
Caldas, A. 1994. Mortality <strong>of</strong> Anaea ryphea (Lepidoptera: Nymphalidae) Immatures in Panama, J. Res. Lepid.<br />
31(3-4):195-204,<br />
Campbell, K. G. 1960. Preliminary studies in population estimation <strong>of</strong> two species <strong>of</strong> stick insects occuring in<br />
plague numbers in highland forest areas <strong>of</strong> south-eastern Australia. Proc. Linn. Soc. NSW 85: 121-41.<br />
Campbell, K. G. 1961. The effects <strong>of</strong> forest fires on three species <strong>of</strong> stick insects occuring in plagues in forest<br />
areas <strong>of</strong> south-eastern Australia. Proc. Linn. Soc. NSW: 112-21.<br />
Campbell, K. G. 1974. Factors affecting the distribution and abundance <strong>of</strong> the three species <strong>of</strong> phasmatids which<br />
occur in plague numbers in forests <strong>of</strong> south-eastern Australia. J. Entomol. Soc. Aust. 8: 3-6.<br />
Campbell, K. G., and P. Hadlington. 1967. The biology <strong>of</strong> the three species <strong>of</strong> phasmatids which occur in plague<br />
numbers in forests <strong>of</strong> south-eastern Australia. Forestry Commision NSW Res. Note no. 20.<br />
Capinera, J. L. 1985. Determination <strong>of</strong> host plant preferences <strong>of</strong> Hemileuca-oliviae (Lepidoptera: Saturniidae),<br />
Paropomala- wyomingensis (Orthoptera: Acrididae), and Diapheromera-veli (Orthoptera: Phasmatidae)<br />
by choice test and crop analysis. J. Kans. Entomol. Soc. 58(3): 465-471.<br />
Carlberg, U. 1985. Chemical defence in Anisomorpha buprestoides (Houttuyn in Stoll’) (Insecta: Phasmida).<br />
Zool. Anz. Jena 215: 177-188.<br />
Cassidy, M. D. 1978. Development <strong>of</strong> an induced food-plant preference in the indian stick insect, Carausius<br />
morosus. Ent. exp. & appl. 24: 87-93.<br />
Cates, R. G. 1980. Feeding patterns <strong>of</strong> monophagous, oligophagous, and polyphagous insect herbivores: The<br />
effect <strong>of</strong> resource abundance and plant chemistry. Oecologia 46: 22-31.<br />
Chang, Y. C. 1991. Integrated pest management <strong>of</strong> several forest defoliators in Taiwan. Forest Ecology and<br />
Management 39: 65-72.<br />
Chapman, R. N. 1931. Animal <strong>ecology</strong> with special reference to insects. McGraw-Hill, New York.<br />
Charnov, E. L., G. H. Orians, and K. Hyatt. 1976. Ecological implications <strong>of</strong> resource depression. American<br />
Naturalist 110: 247-259.<br />
Cherret, J. M. 1968. The foraging behavior <strong>of</strong> Atta cephalotes L. (Hymenoptera: Formicidae). Journal <strong>of</strong> Animal<br />
Ecology 37: 387-403.<br />
Chi, H., and D. C. Yang. 2003. Two-Sex Life Table and Predation Rate <strong>of</strong> Propylaea japonica Thunberg<br />
(Coleoptera: Coccinellidae) Fed on Myzus persicae (Sulzer) (Homoptera: Aphididae). Environmental<br />
Entomology 2003(2): 327-333.<br />
Choong, M. F. 1996. What makes a leaf tough and how this affects the pattern <strong>of</strong> Castanopsis fissa leaf<br />
consumption by caterpillars. Functional Ecology 10: 668-674.
Literature cited 99<br />
Clancy, K. M., and P. W. Price. 1987. Rapid herbivore growth enhances enemy attack: sublethal plant defenses<br />
remain a paradox. Ecology 68: 733-737.<br />
Coley, P. D. 1980. Effects <strong>of</strong> leaf age and plant life history patterns on herbivory. Nature 284: 545- 546.<br />
Coley, P. D. 1982. Rates <strong>of</strong> herbivory on different tropical trees. In Leigh jr., E. G,. A. S. Rand, and D. M.<br />
Windsor, (Eds.) The <strong>ecology</strong> <strong>of</strong> a tropical forest seasonal rythms and long term changes. Smithsonian<br />
Institute Press, Washington D. C.<br />
Coley, P. D. 1983. Herbivory and defensive charakteristics <strong>of</strong> tree species in a lowland tropical forest. Ecol.<br />
Monographs 53(2): 209-233.<br />
Coley, P. D. 1988 Effects <strong>of</strong> plant growth rate and leaf life time on the amount and type <strong>of</strong> anti-herbivore<br />
defence. Oecologia 74: 531-536.<br />
Coley, P. D., J. P. Bryant, and F. S. Chapin 3rd. 1985. Resource availability and plant anti-herbivore defense.<br />
Science 230: 895-899.<br />
Coley, P. D. 1986. Costs and benefits <strong>of</strong> defense by tannins in a neotropical tree. Oecologia 70: 238-241.<br />
Coley, P. D., and J. A. Barone. 1996. Herbivory and plant defenses in tropical forests. Annu. Rev. Ecol. Syst.<br />
27: 305-335.<br />
Coley, P. D., and T. M. Aide. 1991. A comparison <strong>of</strong> herbivory and plant defenses in temperate and tropical<br />
broad-leaved forests. In Price, P. W., T. M. Lewinsohn, G. W. Fernandes, and W. W Benson, (Eds.)<br />
Plant-Animal Interactions: Evolutionary Ecology in Tropical and Temperate Regions. Wiley and Sons,<br />
New York: 25-49.<br />
Coley, P. D., and T. A. Kursar. 1996. Antiherbivore defenses <strong>of</strong> young tropical leaves: physiological constraints<br />
and ecological trade<strong>of</strong>fs. In Smith, A. P., S. S Mulkey, and R. L. Chazdon, (Eds.) Tropical forests plant<br />
ecophysiology. Chapman & Hall, New York.<br />
Compton, S. G., and A. B. Ware. 1991. Ants disperse the elaiosome-bearing eggs <strong>of</strong> an African stick insect.<br />
Psyche 98: 207-13.<br />
Condit, R., R. Sukumar, S. P. Hubbell, and R. B. Foster. 1998. Predicting population trends from size<br />
distributions: A direct test in a tropical tree community. The American Naturalist 152: 495-509.<br />
Connell, J. H. 1971. On the role <strong>of</strong> natural enemies in preventing competitive exclusion in some marine animals<br />
and in rain forest trees. In den Boer P. J., and G. R. Gradwell, (Eds.) Dynamics <strong>of</strong> Populations.<br />
Proceedings <strong>of</strong> the Advanced Study Institute on Dynamics <strong>of</strong> Numbers in Populations. Oosterbeek. 1970.<br />
Wageningen, Netherlands: Centre for Agricultural Publishing and Documentation: 298-312.<br />
Cornell, H. V., and B. A. Hawkins. 1995. Survival patterns and mortality sources <strong>of</strong> herbivorous insects - some<br />
demographic-trends. American Naturalist 145: 563-593.<br />
Cornell, H. V., B. A. Hawkins, and M. E. Hochberg. 1998. Towards an empirically based theory <strong>of</strong> herbivore<br />
demography. Ecological Entomology 23: 340-349.<br />
Cornell, H. V., and B. A. Hawkins. 2003. Herbivore responses to plant secondary compounds: a test <strong>of</strong><br />
phytochemical coevolution theory. American Naturalist 161: 507-522.<br />
Cox, D. R. 1972. Regression models and life-tables (with discussion). J. R. Statist. Soc. B 34: 187–220.
Literature cited 100<br />
Croat, T. B. 1978. Flora <strong>of</strong> Barro Colorado Island. Stanford University Press, Stanford, California.<br />
Craig, T. P., J. K. Itami and P. W. Price. 1989. A strong relationship between oviposition preference and larval<br />
performance in a shoot-galling sawfly. Ecology 70:1691-1699.<br />
Damman, H. 1987. Leaf quality and enemy avoidance by the larvae <strong>of</strong> a pyralid moth. Ecology 68: 88-97.<br />
Damman, H. 1991. Oviposition behaviour and clutch size in a group-feeding pyralid moth, Omphalocera<br />
munroei. Journal <strong>of</strong> Animal Ecology 60: 193-204.<br />
DeVries, P. J. 1994. Patterns <strong>of</strong> butterfly diversity and promising topics in natural history and <strong>ecology</strong>. In<br />
MacDade, L., K. S. Bawa, G. Hartshorn, and H. Hespenheide, (Eds.) La Selva: <strong>ecology</strong> and natural<br />
history <strong>of</strong> a Neotropical Rainforest. Univ. <strong>of</strong> Chicago Press, Chicago.<br />
DeWalt, S. J., S. A. Schnitzer, and J. S. Denslow. 2000. Density and diversity <strong>of</strong> lianas along a seasonal tropical<br />
forest chronosequence in central Panama. Journal <strong>of</strong> Tropical Ecology 16(1): 1 - 19.<br />
Doutt, R. L. 1960. Natural enemies and insect speciation. Pan-Pac. Entomol. 36: 1-14.<br />
Dyer, L. A., D. K. Letourneau, W. Williams, and C. Dodson. 1999. A commensalisms between Piper<br />
marginatum Jacq. (Piperaceae) and a coccinellid beetle at Barro Colorado Island, Panama. Biotropica 15:<br />
841-846.<br />
Dyer, L. A., and P. D. Coley. 2001. Latitudinal gradients in tri-trophic interactions. Chapter 4 in: Tscharntke, T.<br />
and B. A. Hawkins, (Eds.) Multitrophic Level Interactions. Cambridge University Press.<br />
Dyer, L. A., C. D. Dodson, J. O. Stireman, M. A. Tobler, A. M. Smilanich, R. M. Fincher, and D. K.<br />
Letourneau. 2003. Synergistic effects <strong>of</strong> three Piper amides on generalist and specialist herbivores.<br />
Journal <strong>of</strong> Chemical Ecology 29:2499-2514.<br />
Dyer, L. A., C. D. Dodson, and J. Richards. In Press. Isolation, synthesis, and evolutionary <strong>ecology</strong> <strong>of</strong> Piper<br />
amides. In Dyer, L. A. and A. N. Palmer, (Eds.) Piper. A model genus for studies <strong>of</strong> evolution, chemical<br />
<strong>ecology</strong>, and trophic interactions. Kluwer Academic Publishers.<br />
Dysart, R. J. 1995. New host records <strong>of</strong> North American Scelio (Hymenoptera: Scelionidae), parasites on<br />
grasshopper eggs (Orthoptera: Acrididae). Journal <strong>of</strong> the Kansas Entomological Society 68: 74–79.<br />
Ehrlich, P. R., and P. H. Raven. 1964. Butterflies and plants - a study in coevolution. Evolution 18: 586-608.<br />
Eisner, T. 1965. Defensive spray <strong>of</strong> a phasmid insect. Science 148: 966-968.<br />
Eisner, T., R. C. Morgan, A. B. Attygalle, S. R. Smedley, K. B. Herath, and J. Meinwald. 1997. Defensive<br />
production <strong>of</strong> quinoline by a phasmid insect (Oreophoetes peruana). J. Exp. Biol. 200: 2493-2500.<br />
Elton, C. S. 1973. The structure <strong>of</strong> invertebrate populations inside neotropical rain forest. Journal <strong>of</strong> Animal<br />
Ecology 42: 55-104.<br />
Erwin, T. L. 1982. Tropical forests: their richness in Coleoptera and other arthropod species. Coleopterists<br />
Bulletin 36: 74-75.<br />
Erwin, T. L., and J. C. Scott. 1980. Seasonal and size patterns, trophic structure, and richness <strong>of</strong> Coleoptera in<br />
the tropical arboreal ecosystem: the fauna <strong>of</strong> the tree Luehea seemannii in the Canal Zone <strong>of</strong> Panama.<br />
Coleopterists' Bulletin 34: 305-355.
Literature cited 101<br />
Fairbairn, D. J. 1997. Allometry for sexual size dimorphism: pattern and process in the coevolution <strong>of</strong> body size<br />
in males and females. Ann. Rev. Ecol. Syst. 28: 659–687.<br />
Feeny, P. 1970. Seasonal changes in oak leaf tannins and nutrients as a cause <strong>of</strong> spring feeding by wintermoth<br />
caterpillars. Ecology 51: 269-581.<br />
Feeny, P. 1976. Plant apparency and chemical defense. Recent Advances in Phytochemistry 10: 1-40.<br />
Fisher R. A. 1930. The Genetic Theory <strong>of</strong> Natural Selection. Oxford Clarendon.<br />
Floyd, T. 1996. Top-down impacts on creosote herbivores in a spatially and temporally complex environment.<br />
Ecology 77: 1544-1555.<br />
Foster, R. B., and N. V. L Brokaw. 1990. Structure and history <strong>of</strong> vegetation <strong>of</strong> Barro Colorado Island. In Leigh<br />
jr., E. G., A. S. Rand and D. M. Windsor, (Eds.) The ecolocy <strong>of</strong> a tropical forest - seasonal rythyms and<br />
long term changes. Washington D.C., Smithsonian Institute Press.<br />
Fox L. R. 1981. Defense and dynamics in plant-herbivore systems. American Zoologist 21: 853-864.<br />
Fox, C. W., L. A. McLennan and T. A. Mousseau. 1995a. Male body size affects female lifetime reproductive<br />
success in a seed beetle. Animal Behavior 50: 281-284.<br />
Fox, C. W., D. L. Hickman, E. L Raleigh, and T. A. Mousseau. 1995b. Paternal investment in a seed beetle<br />
(Coleoptera: Bruchidae): the influence <strong>of</strong> male size, age, and mating history. Ann. entomol. Soc. Am. 88:<br />
100–103.<br />
Futuyma, D. J. 1976. Evolution <strong>of</strong> host specificity in herbivorous insects: genetic, ecological, and phylogenetic<br />
aspects. In Price, P. W., T. M. Lewinsohn, G. W. Fernandes, and W. W. Benson, (Eds.) Plant-Animal<br />
Interactions: Evolutionary Ecology in Tropical and Temperate Regions. New York, Wiley & Sons Inc.<br />
Gangwere, S. K. 1961. A monograph on food selection in Orthoptera. Trans. Am. Entomol. Soc. 87: 67-230.<br />
Gaume, L., D. Mckey, and M. C. Anstett. 1997. Benefits conferred by timid ants-active anti-herbivore<br />
protection <strong>of</strong> the rainforest tree Leonardoxa africana by the minute ant Petalomyrmex phylax. Oecologia<br />
112: 209-216.<br />
Gerwing, J. J. and D. L. Farias. 2000. Integrating liana abundance and forest stature into an estimate <strong>of</strong> total<br />
aboveground biomass for an eastern Amazonian forest. J. Trop. Ecol. 16: 19-23.<br />
Gomez, J. M., and R. Zamora. 1994. Top-down effects in a tritrophic system: Parasitoids enhance plant fitness.<br />
Ecology 75: 1023-1030.<br />
Gotthard, K. 2000. Increased risk <strong>of</strong> predation as a cost <strong>of</strong> high growth rate: an experimental test in a butterfly.<br />
Journal <strong>of</strong> Animal Ecology 69: 896-902.<br />
Graham, S. A. 1937. The walking stick as a forest defoliator. Univ. Mich. School For. Conserv. No. 3.<br />
Grayum, M. 1990. Evolution and phylogeny <strong>of</strong> the Araceae. Ann. Missouri Bot. Gard. 77: 628-697.<br />
Haccou, P. and L. Hemerik. 1985. The influence <strong>of</strong> larval dispersal in the cinnabar moth (Tyria jacobaeae) on<br />
predation by the red wood ant (Formica polyctena): an analysis based on the proportional hazards model.<br />
Journal <strong>of</strong> Animal Ecology 54, 755-769.<br />
Hägele, B. F., and M. RoIll-Rahier. 1999. Dietary mixing in three generalist herbivores: nutrient<br />
complementation or toxin dilution? Oecologia 119: 521-533.
Literature cited 102<br />
Hagerman, A. E. 1987. Radial diffusion method for determining tannin in plant extracts. J. Chem. Ecol. 13: 437-<br />
449.<br />
Hagerman, A. E. 1988. Extractions <strong>of</strong> tannin from fresh and preserved leaves. J. Chem. Ecol. 14: 453-461.<br />
Häggstrom, H., and S. Larsson. 1995. Slow larval growth on a suboptimal willow results in high predation<br />
mortality in the leaf beetle Galerucella lineala. Oecologia 104: 308-315.<br />
Hairston, N. G., F. E. Smith, and L. B. Slobodkin. 1960. Community structure, population control and<br />
competition. American Naturalist 94: 421-425.<br />
Hartley, S. E., and C. G. Jones. 1997. Plant chemistry and herbivory, or why the world is green. In Crawley, M.<br />
J., (Ed.) Plant Ecology, 2nd edition. Blackwell Science Ltd., Oxford, UK.<br />
Hassell M. P., M. J. Crawley, H. C. J. Godfray, and J. H. Lawton. 1998. Top-down versus bottom-up and the<br />
Ruritanian bean bug. Proc. Natl. Acad. Sci. USA 95: 10661–10664<br />
Haukioja, E. 1990. Induction <strong>of</strong> defence in trees. Ann. Rev. Entomol. 36: 25-42.<br />
Hawkins, B. A., and J. H. Lawton. 1987. Species richness for parasitoids <strong>of</strong> British phytophagous insects.<br />
Nature 326: 788-790.<br />
Hawkins, B. A., H. V. Cornell, and M.E. Hochberg. 1997. Predators, parasitoids, and pathogens as mortality<br />
agents in phytophagous insect populations. Ecology 78: 2145-2152.<br />
Heads, P. A. 1986. The cost <strong>of</strong> reduced feeding due to predator avoidance: potential effects on growth and<br />
fitness in Ischnura degans larvae (Odonata, Zygoptera). Ecological Entomology 11: 369-377.<br />
Hebard, M. 1923. Studies in the Mantidae and Phasmidae <strong>of</strong> Panama (Orthoptera). Trans. Am. Ent. Soc.<br />
XLVIII: 327-362.<br />
Hebard, M. 1929. Supplementary Notes on Panamanian Dermaptera and Orthoptera. Trans. Am. Ent. Soc. LV:<br />
389-400.<br />
Hebard, M. 1933. Notes on Panamanian Dermaptera and Orthoptera. Trans. Am. Ent. Soc. LIX: 103-144.<br />
Hodkinson, I. D., and D. Casson. 1991. A lesser predilection for bugs: Hemiptera (Insecta) diversity in tropical<br />
rain forests. Bio J Linnean Soc 43: 101–9.<br />
Holecheck, J. L., M. Vavra, and R. D. E. Pieper. 1982. Methods for determining the nutritive quality <strong>of</strong> range<br />
ruminant's diets: A review. Journal <strong>of</strong> Animal Science 54: 362.<br />
Hopkins, G. W., and A. F. Dixon. 1997. Enemy-free space and the feeding niche <strong>of</strong> an aphid. Ecological<br />
Entomology 22: 271-274.<br />
House, H. C. 1967. The role <strong>of</strong> nutritional factors in food selection and preference as related to larval nutrition<br />
<strong>of</strong> an insect, Pseudosarcophaga affinis (Diptera: Sarcophagidae) on synthetic diets. Canadian<br />
Entomologist 99: 1310-1321.<br />
Hubbell, S. P., and R. B. Foster. 1986. Commonness and rarity in a neotropical forest: implications for tropical<br />
tree conservation. In Soule, M. E. (Ed.). Conservation Biology: The science <strong>of</strong> Scarcity and Diversity.<br />
Sinauer, Sunderland.<br />
Hughes, L., and M. Westoby. 1992. Capitula on stick insect eggs and elaiosomes on seeds: Convergent<br />
adaptations for burial by ants. Function. Ecol. 6: 642-648.
Literature cited 103<br />
Hunter, M.D., and P. W. Price. 1992. Playing chutes and ladders. Heterogeneity and the relative roles <strong>of</strong> bottom-<br />
up and top-down forces in natural communities. Ecology 73: 724-732.<br />
Hunter, M. D., G. C.Varley, and G. R. GradIll. 1997. Estimating the relative roles <strong>of</strong> top-down and bottom-up<br />
forces on insect herbivore populations: a classic study revisited. Proceedings <strong>of</strong> the National Academy <strong>of</strong><br />
Sciences USA 94: 9176-9181.<br />
Hunter, M. D., R. E. Forkner, and J. N. McNeil. 2000. Heterogeneity in plant quality and its impact on the<br />
population <strong>ecology</strong> <strong>of</strong> insect herbivores. In Hutchings, M. J., John, E. A., and A. J. A. Stewart, (Eds.) The<br />
ecological consequences <strong>of</strong> environmental heterogeneity. BlackIll Science Ltd, Oxford, England.<br />
Jaenike, J. 1990. Host specialization in phytophagous insects. Annu Rev Ecol Syst 21:243-273.<br />
Janzen, D. H. 1970. Herbivores and the number <strong>of</strong> tree species in tropical forests. American Naturalist 104: 502-<br />
28.<br />
Janzen, D. H. 1973. Sweep samples <strong>of</strong> tropical foliage insects: effects <strong>of</strong> seasons, vegetation type, elevation,<br />
time <strong>of</strong> day and insularity. Ecology. 54: 687-708.<br />
Janzen D. H. 1979. New horizons in the biology <strong>of</strong> plant defenses. In Rosenthal, G. A., Janzen D. H., (Eds.)<br />
Herbivores: Their Interactions with Secondary Plant Metabolites. Academic Press, New York.<br />
Janzen, D. H. 1980. When is it coevolution? Evolution 34:611-612.<br />
Janzen, D. H. 1988. Ecological characterization <strong>of</strong> a Costa Rican dry forest caterpillar fauna. Biotropica 20:<br />
120-135.<br />
Janzen, D. H., and T. W. Schoener. 1968. Differences in insect abundance and diversity between wetter and<br />
drier sites during a tropical dry season. Ecology 49: 96-110.<br />
Jermy T. 1976. Insect-host relationship - coevolution or sequential evolution? Symposia Biologica Hungarica<br />
116: 109-113.<br />
Joern, A. 1979. Feeding patterns in grasshoppers: factors influencing diet specialization. Oecologia 38: 325-347.<br />
Joern, A., and S. B. Gaines. 1990. Population dynamics and regulation in grasshoppers. In Chapman, R. F., and<br />
A. Joern (Eds.) Biology <strong>of</strong> grasshoppers. John Wiley & Sons, New York, USA.<br />
Joern, A., and S. T. Behmer, 1997. Importance <strong>of</strong> dietary nitrogen and carbohydrates to survival, growth, and<br />
reproduction in adults <strong>of</strong> the grasshopper ageneotettix deorum (Orthoptera, Acrididae). Oecologia 112(2):<br />
201-208.<br />
Judd, W. S., C. S. Campbell, E. A. Kellogg, P. F Stevens, and M. J. Donohue. 2002. Plant Systematics: A<br />
Phylogenetic Approach, 2nd. Ed. Sinauer Assoc., Inc.<br />
Kaplan E., Meier P. 1958. Nonparametric estimation from incomplete observations. J. Am. Stat. Assoc. 53: 457-<br />
481.<br />
Karban, R., and I. T. Baldwin. 1997. Induced responses to herbivory. Chapman & Hall, London.<br />
Karowe, D. N. 1989. Facultative monophagy as a consequence <strong>of</strong> feeding experience: behavioral and<br />
physiological specialization in Colias philodice larvae (Lepidoptera: Pieridae). Oecologia 78:106-111.<br />
Kaspari, M., and M. D. Weiser. 2000. Ant activity along moisture gradients in a tropical forest. Biotropica 32:<br />
703-711.
Literature cited 104<br />
Kearsley, M. J. C., and T. G.Whitham. 1989. Developmental changes in resistance to herbivory: Implications<br />
for individuals and populations. Ecology 70: 424-434.<br />
Kinsmann, S., and W. J. Platt. 1984. The impact <strong>of</strong> a herbivore upon Mirabilis hirsute, a fugitive prairie plant.<br />
Oecologia 65: 2-6.<br />
Kogan, M., and D. C Fischer. 1991. Inducible defenses in soybean against herbivorous insects. Tallamy, D. W.,<br />
Raupp, M. J., (Eds.).. Phytochemical Induction by Herbivores. John Wiley & Sons, New York, USA<br />
Krebs, C. J. 1989. Ecological Methodology. Harper Collins Publishers, New York.<br />
Landa, K. and D. Rabinowitz. 1983. Relative preference <strong>of</strong> Arphia sulphurea (Orthoptera: Acrididae) for sparse<br />
and common prairie grasses. Ecology 64: 392-395.<br />
Lawton, J. H., and S. McNeill. 1979. Between the devil and the deep blue sea: on the problem <strong>of</strong> being a<br />
herbivore. In Anderson, R. M., B. D. Turner, and L. R. Taylor, (Eds.) Population dynamics (20th<br />
Symposium <strong>of</strong> the British Ecological Society). Blackwell, Oxford: 223–244.<br />
Leigh jr., E. G. 1999. Tropical forest <strong>ecology</strong>: a view from Barro Colorado Island. Oxford University Press,<br />
New York, Oxford.<br />
Leigh jr., E. G., A. S. Rand, and D. M. Windsor. 1990. The ecolocy <strong>of</strong> a tropical forest - seasonal rythyms and<br />
long term changes (2 nd ed). Smithsonian Institute Press, Washington D.C., USA.<br />
Lempa, K., A. Agrawal, J.-P. Salminen, T. Turunen, V. Ossipov, S. Ossipova, E. Haukioja, and K. Pihlaja.<br />
2004. Rapid herbivore-induced changes in mountain birch phenolics and nutritive compounds and their<br />
effects on performance <strong>of</strong> the major defoliator, Epirrita autumnata. Journal <strong>of</strong> Chemical Ecology 30(2):<br />
303-321.<br />
Levings, S. C., and N. R. Franks. 1982. Patterns <strong>of</strong> nest dispersion in a tropical ground ant community. Ecology<br />
63: 338-344.<br />
Levins, R. 1968. Evolution in changing environments. Princeton University Press, Princeton, New Jersey, USA.<br />
Lill, J. T., and R. J. Marquis. 2001. The effects <strong>of</strong> leaf quality on herbivore performance and attack from natural<br />
enemies. Oecologia 126: 418-428.<br />
Lima, S. L., and P. A. Bednek<strong>of</strong>f. 1999. Temporal variation in danger drives antipredator behaviour: the<br />
predation risk allocation hypothesis. American Naturalist 153: 649-659.<br />
Loader, C., and H. Damman. 1991. Nitrogen content <strong>of</strong> food plants and vulnerability <strong>of</strong> Pieris rapae to natural<br />
enemies. Ecology 72: 1586-1590.<br />
Lotka, A. J. 1925. Elements <strong>of</strong> physical biology. Baltimore: Williams & Wilkins Co.<br />
Lowman, M. D. 1984. An assessment <strong>of</strong> techniques for measuring herbivory: is rainforest defoliation more<br />
intense than we thought? Biotropica 16: 264-268.<br />
Lowman, M. D. 1985. Temporal and spatial variability in insect grazing <strong>of</strong> the canopies <strong>of</strong> five Australian<br />
rainforest tree species. Australian Journal <strong>of</strong> Ecology 10: 7-24.<br />
Lowman, M. D., and J. D. Box. 1983. Variation in leaf toughness and phenolic content among five species <strong>of</strong><br />
Australian rainforest trees. - Aust. J. Ecol. 8: 17-25.
Literature cited 105<br />
Luttbeg, B., and O. J. Schmitz. 2000. Predator and prey models with flexible individual behaviour and imperfect<br />
information. American Naturalist 155: 669-683.<br />
MacArthur, R. H. 1969. Patterns <strong>of</strong> communities in the tropics. Biol. J. Linn. Soc. 1: 19-30.<br />
MacArthur, R. H. 1972. Geographical <strong>ecology</strong>: patterns in the distribution <strong>of</strong> species. Harper and Row, New<br />
York.<br />
MacArthur, R. H., and E. 0. Wilson. 1967. The theory <strong>of</strong> island biogeography. Princeton University Press,<br />
Princeton, New Jersey, USA.<br />
Magalhães, S., A. Janssen, H. Rachid, and M. W. Sabelis. 2002. Flexible antipredator behaviour in herbivorous<br />
mites through vertical migration in a plant. Oecologia 132: 143-149.<br />
Mantel, N. 1966. Evaluation <strong>of</strong> survival data and two new rank order statistics arising in its consideration.<br />
Cancer Chemother. Rep. 50 163–170.<br />
Marquis, R. J. 1990. Genotypic variation in leaf damage in Piper arieianum (Piperaceae) by a multi-species<br />
assemblage <strong>of</strong> herbivores. Evolution 44:104-120.<br />
Marquis, R. J. 1991. Herbivore fauna <strong>of</strong> Piper (Piperaceae) in a Costa Rican wet forest: diversity, specificity,<br />
and impact. In Price P. W., T. M. Lewinsohn, G. W. Fernandes, and W. W. Benson, (Eds.) Plant-Animal<br />
Interactions: Evolutionary Ecology in Tropical and Temperate Regions. Wiley & Sons, New York: 179-<br />
208.<br />
Marquis, R. J. 1992. A bite is a bite is a bite? Constraints on response to folivory in Piper arieianum<br />
(Piperaceae). Ecology 73: 143-152.<br />
Marquis, R. J. and H. E. Braker 1994. Plant-herbivore interactions: diversity, specificity, and impact. In<br />
McDade, L. A., K. S. Bawa, H. A. Hespenheide, and G. S. Hartshorn, (Eds.) La Selva - Ecology and<br />
natural history <strong>of</strong> a neotropical rain forest. Chicago and London, The University <strong>of</strong> Chicago Press.<br />
Marquis, R. J., and C. J. Whelan. 1994. Insectivorous birds increase growth <strong>of</strong> white oak through consumption<br />
<strong>of</strong> leaf-chewing insects. Ecology 75: 2007-2014.<br />
Marquis, R. J., and H. E. Braker. 1994. Plant-herbivore interactions: diversity, specificity, and impact. In<br />
McDade L. A., K. S. Bawa, H. A. Hespenheide, and G. S. Hartshorn (Eds.) La Selva - Ecology and<br />
natural history <strong>of</strong> a neotropical rain forest. The University <strong>of</strong> Chicago Press, Chicago and London: 261-<br />
281.<br />
Mattson, W. J. 1980. Herbivory in relation to plant nitrogen con-tent. Annu Rev Ecol Syst 11: 119–161.<br />
Mattson, W. J., and J. M. Scriber. 1987. Nutritional <strong>ecology</strong> <strong>of</strong> insect folivores <strong>of</strong> woody plants: nitrogen, water<br />
fiber and mineral considerations. In Slansky jr., F., and J. G. Rodriguez, (Eds.) Nutritional <strong>ecology</strong> <strong>of</strong><br />
insects, mites, spiders and related invertebrates. Wiley, New York, USA.<br />
McCaffery, A. R. 1975. Food quality and quantity in relation to egg production in Locusta migratoria<br />
migratorioides. Journal <strong>of</strong> Insect Physiology 21: 1551–1558.<br />
McClure, M. S. 1980. Foliar nitrogen: a basis for host suitability for elogate hemlock scale, Fiorinia externa<br />
(Homoptera: Draspididae). Ecology 61: 72-79.
Literature cited 106<br />
McNeill, S., T. R. E. Southwood. 1978. The role <strong>of</strong> nitrogen in the development <strong>of</strong> insect-plant relationships. In<br />
Harborne, J. B, (Ed.) Biochemical aspects <strong>of</strong> plant and animal coevolution. Academic Press, London: 77-<br />
98.<br />
Moran, H. A., and D. W. Hamilton. 1980. Low nutritive quality as a defense against herbivores. Journal <strong>of</strong><br />
Theoretical Biology 86: 247–254.<br />
Moran, M. D., and L. E. Hurd. 1998. A trophic cascade in a diverse arthropod community caused by a generalist<br />
arthropod predator. Oecologia 113: 126-132.<br />
Murakami, M. 1999. Effect <strong>of</strong> avian predation on survival <strong>of</strong> leaf-rolling lepidopterous larvae. Researches on<br />
Population Ecology 41: 135-138.<br />
Murali, K. S., and R. Sukumar. 1993. Leaf flushing phenology and herbivory in a tropical dry deciduous forest,<br />
southern India. Oecologia 94: 114-119.<br />
Murdoch, W. W. 1966. Community structure, population control, and competition. American Naturalist 100:<br />
219-226.<br />
Nichols-Orians, C. M., and J. C. Schultz. 1989. Leaf toughness affects leaf harvesting by the leaf-cutter ant, Atta<br />
cephalotes (L.) (Hymenoptera: Formicidae). Biotropica 21: 80-83.<br />
Niemelä, P., E. M. Aro, and E. Haukioja 1979. Birch leaves as a resource for herbivores. Damage-induced<br />
increase in leaf phenols with trypsin-inhibiting effects. Rep. Kevo Subarctic Res. Stat. 15: 37-40.<br />
Novotný, V., and Y. Basset. 2000. Rare species in communities <strong>of</strong> tropical insect herbivores: pondering the<br />
mystery <strong>of</strong> singletons. Oikos 89: 564-572.<br />
Novotný, V., Y. Basset, S. E. Miller, G. D. Weiblen, B. Bremer, L. Cizek, and P. Drozd 2002a. Low host<br />
specificity <strong>of</strong> herbivorous insects in a tropical forest. Nature 416: 841-844.<br />
Novotný, V., Y. Basset, S. E. Miller, P. Drozd, and L. Cizek. 2002b. Host specialization <strong>of</strong> leaf-chewing insects<br />
in a New Guinea rainforest. Journal <strong>of</strong> Animal Ecology 71: 400-412.<br />
Ødegaard, F. 2000. How many species <strong>of</strong> arthropods? Erwin’s estimate revised. Biol. J. Linn. Soc. 71: 583–597.<br />
Oedekoven, M. A., and A. Joern. 1998. Stage-based mortality <strong>of</strong> grassland grasshoppers (Acrididae) from<br />
wandering spider (Lycosidae) predation. Acta Oecologica 19(6): 505-515.<br />
Onuf, C. P. 1978. Nutritive value as a factor in plant-insect interactions with emphasis on field studies. In G. G.<br />
Montgomery, (Ed.) The <strong>ecology</strong> <strong>of</strong> arboreal folivores. Washington D.C. Smithsonian Inst. Press.<br />
Onuf, C. P., J. M. Teal, and I. Valiela. 1977. Interactions <strong>of</strong> nutrients, plant growth and herbivory in a mangrove<br />
ecosystem. Ecology 58: 514-526.<br />
Pace, M. L., J. J. Cole, S. R. Carpenter, and J. F. Kitchell. 1999. Trophic cascades revealed in diverse<br />
ecosystems. Trends in Ecology and Evolution 14: 483-488.<br />
Paine, R. W. 1968. Investigations for the biological control in Fiji <strong>of</strong> the coconut stick insect Graeffea crouani<br />
(Le Guillou). Bull. Entomol. Res. 57: 567-604.<br />
Papaj, D. R., and R. J. Prokopy. 1988. The effect <strong>of</strong> adult experience on components <strong>of</strong> habitat preference in the<br />
apple maggot fly (Rhagoletis pomonella).Oecologia 76:538-543.
Literature cited 107<br />
Parker, J. R., and C. Wakeland. 1957. Grasshopper egg pods destroyed by larvae <strong>of</strong> bee flies, blister beetles, and<br />
ground beetles. Tech. Bull. 1165. Washington, D.C: U.S. Department <strong>of</strong> Agriculture, Agricultural<br />
Research Service: 1–29.<br />
Parmar, V. S., S. C. Jain, K. S. Bisht, R. Jain, P. Taneja, A. Jha, O. D. Tyagi, A. K. Prasad, J. Wengel, C. E.<br />
Olsen, and P. M. Boll. 1997. Phytochemistry <strong>of</strong> the genus Piper. Phytochemistry 46(4): 597-673.<br />
Paton, S. 2002. Meteorological and Hydrological Summary for Barro Colorado Island 2001. Smithsonian<br />
Tropical Research Institute, Panama.<br />
Persson, L. 1999. Trophic cascades: abiding heterogeneity and the trophic level concept at the end <strong>of</strong> the road.<br />
Oikos 85: 385-397.<br />
Pho<strong>of</strong>olo, Mpho. W., J. J. Obrycki, and L. C Lewis. 2001. Quantitative Assessment <strong>of</strong> Biotic Mortality Factors<br />
<strong>of</strong> the European Corn Borer (Lepidoptera: Crambidae) in Field Corn. Journal <strong>of</strong> Economic Entomology<br />
94(3): 617-622.<br />
Pianka, E. R. 1966. Latitudinal gradients in species diversity: A review <strong>of</strong> concepts. American Naturalist 100:<br />
33-46.<br />
Pianka, E. R. 1978. Evolutionary Ecology. Harper & Row, New York.<br />
Polis, G. A. 1999. Why are parts <strong>of</strong> the world green? Multiple factors control productivity and the distribution <strong>of</strong><br />
biomass. Oikos 86: 3-15.<br />
Price, M. L., and L.G., Butler. 1977. Rapid visual estimation and spectrophometric determination <strong>of</strong> tannin<br />
content <strong>of</strong> sorghum grain. Journal <strong>of</strong> Agricultural and Food Chemistry, Washington: 1268-1273.<br />
Price, P. W. 1984. Insect <strong>ecology</strong>. Wiley & Sons, New York.<br />
Price, P. W. 1991. The plant vigor hypothesis and herbivore attack. Oikos 62: 244-251.<br />
Price, P. W., C. E. Bouton, P. Gross, B. A. McPheron, J. N. Thompson, and A.E. Iis. 1980. Interactions among<br />
three trophic levels: Influence <strong>of</strong> plants on interactions betIen insect herbivores and natural enemies.<br />
Annual Review <strong>of</strong> Ecology and Systematics 11: 41-65.<br />
Price, P. W., N. Cobb, T. P. Craig, G. W. Fernandes, J. K. Itami, S. Mopper, and R. W. Preszler. 1990. Insect<br />
herbivore population dynamics on trees and shrubs: new approaches relevant to latent and eruptive<br />
species and life table development. In Bernays, E. A., (Ed.) Focus on Insect-Plant Interactions. CRC<br />
Press, Boca Raton.<br />
Price, P. W., T. P. Craig, and H. Roininen. 1995. Working toward a theory on galling sawfly population<br />
dynamics. In Cappuccino, N. and P. W. Price, (Eds.) Population dynamics: New approaches and<br />
synthesis. Academic Press, San Diego.<br />
Prior, C., and D. J. Greathead. 1989. Biological control <strong>of</strong> locusts: the potential for the exploitation <strong>of</strong><br />
pathogens. United Nations Food and Agriculture Organization Plant Protection Bulletin 37(1): 37–48.<br />
Putz, F. E. 1984. The natural history <strong>of</strong> lianas on Barro Colorado Island, Panama. Ecology 65: 1713-1724.<br />
Redfearn, A. and S. L. Pimm. 1988. Population variability and polyphagy in herbivorous insect communities.<br />
Ecological Monographs 58: 39-55.
Literature cited 108<br />
Reich, P. B., C. Uhl, M. B. Walters, and D. S. Ellsworth. 1991. Leaf lifespan as a determinant <strong>of</strong> leaf structure<br />
and function among 23 amazonian tree species. Oecologia 86: 16-24.<br />
Rhoades, D. F. 1977. Integrated antiherbivore, antidesiccant and ultraviolet screening properties <strong>of</strong> creosotebush<br />
resin. Biochemical Systematics and Ecology 5: 281-290.<br />
Rhoades, D. F., and R. G. Cates. 1976. Toward a general theory <strong>of</strong> plant antiherbivore chemistry. Rec. Adv.<br />
Phytochem. 10: 168-213.<br />
Richardson, R., and J. B. Whittaker. 1982. The effect <strong>of</strong> varying the reference material on ranking <strong>of</strong><br />
acceptability indices <strong>of</strong> plant species to a polyphagous herbivore, Agriolimax reticulatus. Oikos 39: 237-<br />
240.<br />
Robinson, M. H. 1968a. The defensive behaviour <strong>of</strong> Pterinoxylus spinulosus Redtenbacher, a winged stick<br />
insect from Panama. Psyche J. Entomol. 75: 195-207.<br />
Robinson, M. H. 1968b. The defensive behaviour <strong>of</strong> the stick insect Onctophasma martini (Griffini). Proc. R.<br />
Entomol. Soc. London Ser. A. 43: 183-87.<br />
Robinson, M. H. 1969. The defensive behaviour <strong>of</strong> some orthopteroid insects from Panama. Trans. R. Entomol.<br />
Soc. London 121: 281-303.<br />
Roessingh, P., E.A. Bernays, and A.C. Lewis. 1985. Physiological factors influencing preference for wet and<br />
dry food in Schistocerca gregaria nymphs. Entomologia Experimentalis et Applicata, 37(89-94): 90-105.<br />
Roitberg, B. D., and J.H. Myers. 1979. The influence <strong>of</strong> predators on the movement <strong>of</strong> apterous pea aphids<br />
betIen plants. Journal <strong>of</strong> Animal Ecology 48: 111-122.<br />
Rosenthal, G. A., and M. R. Berenbaum. 1992. Herbivores, their interaction with secundary plant metabolites.<br />
San Diego. Academic Press.<br />
Rossiter, M. C., J. C. Schultz, and I. T. Baldwin. 1988. Relationships among defoliation, red oak phenolics, and<br />
gypsy moth growth and reproduction. Ecology 69:267-277.<br />
Rowell-Rahier, M. 1984. The food plant preferences <strong>of</strong> Phratora vitellinae (Coleoptera: Chrysomelinae). A.<br />
Field observations. Oecologia 64: 369-374.<br />
Sandlin, E. A., and M. R. Willig. 1993. Effects <strong>of</strong> age sex prior experience and intraspecific food variation on<br />
diet composition <strong>of</strong> a tropical folivore (Phasmatodea: Phasmatidae). Environ. Entomol. 22(3): 625-633.<br />
Sandoval, C. P. 1994. Differential visual predation on morphs <strong>of</strong> Timemacristinae (Phasmatodeae: Timemidae)<br />
and its consequences for host range. Biological Journal <strong>of</strong> the Linnean Society 52: 341-356.<br />
Sanson, G., J. Read, N. Aranwela, F. Clissold, and P. Peeters. 2001. Measurement <strong>of</strong> leaf biomechanical<br />
properties in studies <strong>of</strong> herbivory: Opportunities, problems and procedures. Austral Ecology 26: 535-546.<br />
Schädler, M., G. Jung, H. Auge, and R. Brandl. 2003. Palatability, decomposition and insect herbivory: patterns<br />
in a successional old-field plant community. Oikos 103: 121-132.<br />
Schnitzer, S. A., and F. Bongers. 2002. The <strong>ecology</strong> <strong>of</strong> lianas and their role in forests. Trends in Ecology &<br />
Evolution 17(5): 223-230.<br />
Schoener, T. W. 1983. Field experiments on interspecific competition. Amer. Natur. 122: 240-285.
Literature cited 109<br />
Schowalter, T. D. 1985. Adaptations <strong>of</strong> insects to disturbance. In Pickett, S. T. A., and P. S. White, (Eds.) The<br />
Ecology <strong>of</strong> Natural Disturbance and Patch Dynamics. Academic Press, New York.<br />
Schowalter, T. D., W. W. Hargrove, and D. A. Crossley jr. 1986. Herbivory in forested ecosystems. Ann. Rev.<br />
Entomol. 31: 177-196.<br />
Schultz, J. C. 1983. Habitat selection and foraging tactics <strong>of</strong> caterpillars in heterogeneous trees. In Denno, R. F.<br />
and McClure, M. S., (Eds) Variable plants and herbivores in natural and managed systems. Academic<br />
Press.<br />
Scriber, J. M., and F. Slansky jr. 1981. The nutritional <strong>ecology</strong> <strong>of</strong> immature insects. Annual Review <strong>of</strong><br />
Entomology 26: 183-211.<br />
Sengupta, S., and A. B. Ray. 1987. The Chemistry <strong>of</strong> Piper: a Review. Fitoterapia 58(3).<br />
Shine, R. 1989. Ecological causes for the evolution <strong>of</strong> sexual dimorphism: a review <strong>of</strong> the evidence. Q. Rev.<br />
Biol. 64: 419–461.<br />
Siddiqui, B. S., T. Gulzar, and S. Begum. 2002. Amides from the seeds <strong>of</strong> Piper nigrum Linn. and their<br />
insecticidal activity. Heterocycles 57: 1653-1658.<br />
Sih, A., P. Crowley, M. McPeek, J. Petranka, and K. Strohmeier. 1985. Predation, competition and prey<br />
communities: a review <strong>of</strong> field experiments. Annual Review <strong>of</strong> Ecology and Systematics 16: 269-311.<br />
Sillen-Tullberg, B., C. Wiklund, and T. Jaervi. 1982. Aposematic coloration in adult and larvae <strong>of</strong> Lygaeus<br />
equestris and its bearing on muellerian mimicry: an experimental study on predation on living bugs by<br />
the great tit: Parus major. Oikos 39: 131-136.<br />
Simpson, S. J., and C. L. Simpson. 1990. The mechanisms <strong>of</strong> nutritional compensation by phytophagous insects.<br />
In Bernays, E. A., (Ed.) Insect-plant interactions 2. CRC Press, Boca Raton, Fla.<br />
Smiley, J. T. 1978. The host plant <strong>ecology</strong> <strong>of</strong> Heliconius butterflies in Northeastern Costa Rica. Ph.D.<br />
Dissertation, University <strong>of</strong> Texas at Austin.<br />
Smythe, N. 1982. The Seasonal Abundance <strong>of</strong> Night-flying Insects in a Neotropical Forest. In Leigh jr, E. G., A.<br />
S. Rand, and D. M. Windsor, (Eds.) The Ecology <strong>of</strong> a Tropical Forest: seasonal rhythms and long-term<br />
changes. Smithsonian Tropical Research Institute: 309-318.<br />
Snyder, W. E., and D. H. Wise. 2000. Antipredator behaviour <strong>of</strong> spotted cucumber beetles (Coleoptera:<br />
Chrysomelidae) in response to predators that pose varying risks. Environmental Entomology 29: 35-42.<br />
Southwood, T. R. E. 1973. The insect/plant relationship - an evolutionary perspective. In van Emden, H. F.,<br />
(Eds.) Insect/Plant Relationships, Blackwell Scientific Publications, London.<br />
Stamp, N. E., and T. M. Casey, (Eds.) 1993. Caterpillars: ecological and evolutionary constraints on foraging.<br />
Chapman & Hall, New York.<br />
Stephens, D. W., and Krebs, J. R. 1986. Foraging theory. Princeton University Press, Princeton, NJ.<br />
Stevenson, J. P. 1959. Epizootology <strong>of</strong> a disease <strong>of</strong> the desert locust, Schistocerca gregaria (Forskäl), caused by<br />
nonchromogenic strains <strong>of</strong> Serratia marcescens Bizio. Journal <strong>of</strong> Insect Pathology 1: 232–244.<br />
Stork, N. E. 1993. How many insect species are there? Biodiversity and Conservation 2: 215-232.
Literature cited 110<br />
Strong, D. R., J. H. Lawton, and R. Southwood. 1984. Insects on plants: community patterns and mechanisms.<br />
Cambridge, Massachussets, USA., Harvard University Press.<br />
Swaine, G. 1969. The coconut stick insect Graeffea crouani Le Guillou. Oleagineux 24: 75-77.<br />
Teeder, T., and T. Tammaru. 2002. Cascading effects <strong>of</strong> variation in plant vigor on the relative performance <strong>of</strong><br />
insect herbivores and their parasitoids. Ecological Entomology 27: 94-104.<br />
Thies, W. 1998. Resource and habitat use in two frugivorous bat species (Phyllostomidae: Carollia perpiscillata<br />
and C. castanea) in Panama: Mechanisms <strong>of</strong> coexistence. (Dissertation).<br />
Thompson, J. N., and 0. Pellmyr. 1991. Evolution <strong>of</strong> oviposition behavior and host preference in Lepidoptera.<br />
Annual Review <strong>of</strong> Entomology 36:65-89.<br />
Tscharntke, T., S. Thiessen, R. Dolch, and W. Boland. 2001. Herbivory, induced resistance, and interplant<br />
signal transfer in Alnus glutinosa. Biochemical Systematics and Ecology 29: 1025-1047.<br />
van Dam, N., K. Hadwich, and I. T. Baldwin. 2000. Induced responses in Nicotiana attenuata affect behaviour<br />
and growth <strong>of</strong> the specialist herbivore Manduca sexta. Oecologia 122: 371-379.<br />
van Dam, N. M., M. Horn, M. Mares, and I. T. Baldwin. 2001a. Ontogeny constrains the systemic protease<br />
inhibitor response in Nicotiana attenuata. Journal <strong>of</strong> Chemical Ecology 27: 547-568.<br />
van Dam, N., U. Hermenau, and I. T. Baldwin. 2001b. Instar-specific sensitivity <strong>of</strong> specialist Manduca sexta<br />
larvae to induced defenses in their host plant Nicotiana attenuata. Ecological Entomology 26: 578-586.<br />
van den Bussche, R. A., M. R. Willig, R. K. Chesser, and R. B. Waide. 1989. Genetic variation and genetics <strong>of</strong><br />
four taxa <strong>of</strong> neotropical walkingsticks (Phasmatodea, Phasmatidae). Proc. Entomol. Soc. Wash. 90: 422-<br />
427.<br />
Venzon, M., A. Janssen, A. Pallini, and M. W. Sabelis. 2000. Diet <strong>of</strong> a polyphagous arthropod predator affects<br />
refuge seeking <strong>of</strong> its thrips prey. Animal Behaviour 60: 369-375.<br />
Volterra, V. 1926. Variazioni e fluttuazioni del numero d'individui in specie animali conviventi. Mem. R.<br />
Accad. Naz. dei Lincei. VI(2).<br />
Walker, M., and T. H. Jones. 2001. Relative roles <strong>of</strong> top-down and bottom-up forces in terrestrial tritrophic<br />
plant–insect herbivore–natural enemy systems. Oikos 93: 177-187.<br />
Waterman, P. G., and S. Mole. 1994. Analysis <strong>of</strong> phenolic plant metabolites. Oxford Blackwell Scientific<br />
Publications, Boston.<br />
White, T. C. R. 1978. The importance <strong>of</strong> a relative shortage <strong>of</strong> food in animal <strong>ecology</strong>. Oecologia 33: 71-86.<br />
White, T. C. R. 1993. The Inadequate Environment (Nitrogen and the Abundance <strong>of</strong> Animals), Springer-Verlag,<br />
Berlin.<br />
Whiting, M. F., S. Bradler, and T. Maxwell. 2003. Loss and recovery <strong>of</strong> wings in stick insects. Nature 421: 264-<br />
267.<br />
Wiklund, C., B. Karlsson, and O. Leimar. 2001. Sexual conflict and cooperation in butterfly reproduction - a<br />
comparative study on polyandry and female fitness. Proc. R. Soc. Lond. B 268: 1661-1667.
Literature cited 111<br />
Willig, M. R., R. W. Garrison, and A. J. Bauman. 1986. Population dynamics and natural history <strong>of</strong> a<br />
neotropical walkingstick, Lamponius portoricensis Rehn (Phasmatodea, Phasmatidae). Tex. J. Sci. 38:<br />
121-137.<br />
Willig, M. R., and G. R. Camilo. 1991. The effect <strong>of</strong> Hurricane Hugo on six invertebrate species in the Luquillo<br />
Experimental Forest <strong>of</strong> Puerto Rico. Biotropica 23:455-461.<br />
Willig, M. R., E. A. Sandlin, and M. R.Gannon. 1993. Structural and Taxonomic components <strong>of</strong> habitat<br />
selection in the neotropical folivore Lamponius portoricensis (Phasmatodea: Phasmatidae). Environ.<br />
Entomol. 22(3): 634-641.<br />
Windsor, D. M. 1978. The feeding activities <strong>of</strong> tropical insect herbivores on some deciduous forest legumes. In<br />
G. G. Montgomery, (Ed.) The <strong>ecology</strong> <strong>of</strong> arboreal folivores. Washington D.C. Smithsonian Inst. Press.<br />
Windsor, D. M., D. W. Trapnell, and G. Amat. 1996. The Egg Capitulum <strong>of</strong> a Neotropical Walkingstick,<br />
Calynda bicuspis, Induces Aboveground Egg-Dispersal by the Ponerine Ant, Ectatomma ruidum. J. Insect<br />
Behaviour 9(3): 353-67.<br />
Witkowski, E. T. F., and B. B Lamont. 1991. Leaf specific mass confounds leaf density and thickness.<br />
Oecologia 88: 486 –493.<br />
Witz, B.W. 1990. Antipredator mechanisms in arthropods: a tInty year literature survey. Florida Entomologist<br />
73: 71-99.<br />
Wolda, H. 1978. Fluctuations in abundance <strong>of</strong> tropical insects. Am. Nat. 112: 1017-45.<br />
Wolda, H. 1979. Seasonality parameters for insect populations. Res. Popul. Ecol. 20: 247-256.<br />
Wolda, H. 1980. Seasonality <strong>of</strong> tropical insects. I. Leaf-hoppers (Homoptera) in Las Cumbres, Panama. J Anim<br />
Ecol 49: 277–290.<br />
Wolda, H. 1982. Seasonality <strong>of</strong> homoptera on Barro Colorado Island. In Leigh jr., E. G., Rand, A. S., and D. M.<br />
Windsor, (Eds. ) The Ecology <strong>of</strong> a Tropical Forest Seasonal Rhythms and Long-term Changes.<br />
Washington: Smithsonian Institution Press.<br />
Wolda, H. 1983. Spatial and temporal variations in abundance <strong>of</strong> tropical animals. In Sutton, T. C. W., and. A.<br />
C. C. S. L., (Eds.) The Tropical Rainforest: Ecology and Management Oxford, U.K.: Blackwell Scientific<br />
Publications.<br />
Wolda, H. 1992. Trends in abundance <strong>of</strong> tropical forest insects. Oecologia 89: 47–52.<br />
Wood, T. K., and K. L. Olmstead. 1984. Latitudinal effects on treehopper species richness (Homoptera:<br />
Membracidae). Ecological Entomology 9: 109-115.<br />
Wrensch, D. L., and M. Ebbert. 1993. Evolution and Diversity <strong>of</strong> Sex Ratio in Insects and Mites. Chapman &<br />
Hall, New York.<br />
Wright, I. J.and K. Cannon. 2001. Relationships between leaf lifespan and structural defences in a low nutrient,<br />
sclerophyll flora. Functional Ecology 15: 351-359.<br />
Zanuncio, J. C., A. J. Molina-Rugama, G. P. Santos, and F. S. Ramalho. 2002. Effect <strong>of</strong> body weight on<br />
fecundity and longevity <strong>of</strong> the stinkbug predator Podisus rostralis. Pesq. Agropec. Bras. 37: 1225-1230.<br />
Zar, J. H. 1999. Biostatistical analysis. Prentice Hall, 4th ed.
Appendix 113<br />
9 Appendix<br />
Please continue to next page.<br />
A newly hatched nymph <strong>of</strong> Metriophasma diocles (© Christian Ziegler)
Appendix 1: Phasmid species previously reported from Panama and BCI. The table lists current names <strong>of</strong> species and synonyms.<br />
BCI Synonyms. Reference<br />
Reported locations<br />
Type-Author<br />
Species<br />
Genus<br />
No<br />
1 Acanthometrio- crassus Hebard Panama, Ecuador ROBINSON 1969, BEDFORD<br />
tes<br />
1978<br />
2 Agrostia amoena Redtenbacher Panama HEBARD<br />
1923<br />
3 Agrostia viridipes (Rehn) Panama (Cabima) / Costa Rica (Cache) Olcyphides viridipes Rehn 1905 HEBARD 1923<br />
4 Bacteria nodulosa Redtenbacher Panama, Surinam<br />
5 Bacteria ploiaria (Westwood) Panama (Gatun, Canal Zone, coll. by Berger Phibalosoma ploiaria Westwood HEBARD 1923, ROBINSON<br />
Zetek, Chiriqui)<br />
1859<br />
1969<br />
Bacteria subvolans Redtenbacher<br />
1908<br />
6 Bostra dorsuaria Stal Panama (Chiriqui) HEBARD<br />
1923<br />
7 Bostra lobata Stal Phantasis lobata Redtenbacher HEBARD 1923<br />
8 Bostra martini Griffini<br />
9 Bostra nodulosa Redtenbacher HEBARD<br />
1923<br />
10 Bostra podagrica Stal HEBARD<br />
1923<br />
11 Brizoides annulicornis Hebard Panama (Portobello) HEBARD<br />
1923<br />
12 Brizoides graminea Redtenbacher Panama (Chiriqui-Bugaba) HEBARD<br />
1923<br />
13 Brizoides lacteipennis Redtenbacher HEBARD<br />
1923<br />
14 Brizoides nigricornis Redtenbacher HEBARD<br />
1923<br />
15 Calynda bicuspis Stal Panama (Chiriqui) HEBARD<br />
1923<br />
16 Chlorophasma hyalina Redtenbacher HEBARD<br />
1923<br />
17 Damasippus fuscipes Redtenbacher HEBARD<br />
1923<br />
18 Damasippus striatus Redtenbacher HEBARD<br />
1923<br />
19 Damasippus westwoodii Stal HEBARD<br />
1923<br />
20 Dyme chiriquensis Brunner Bacteria HEBARD 1923<br />
21 Dyme discors Brunner Bacteria HEBARD 1923<br />
22 Dyme magnifica Hebard Panama (BdT) Bacteria HEBARD, 1933<br />
23 Dyme modesta Brunner Bacteria HEBARD 1923<br />
24 Isagoras dentipes Redtenbacher Panama (Chiriqui-Bugaba) Berger HEBARD 1923, ROBINSON<br />
1969
Appendix 1: Phasmid species previously reported from Panama and BCI. The table lists current names <strong>of</strong> species and synonyms.<br />
No Genus Species Type-Author Reported locations BCI Synonyms. Reference<br />
25 Isagoras vigneri (Redtenbacher) Panama (Darien-Paya, Portobello) Xerosoma vignieri Redtenbacher HEBARD 1923<br />
26 Libethra panamae Hebard Panama (Paraiso, Panama vieja) HEBARD<br />
1923<br />
27 Metriophasma diocles Westwood Panama (BCI) Berger Metriotes diocles HEBARD 1923, 1933,<br />
ROBINSON 1969<br />
28 Metriophasma iphicles Redtenbacher Panama (Chiriqui-Bugaba, Rio Trinidad) / Berger HEBARD<br />
1923<br />
Honduras (San Pedro-Sula)<br />
29 Olcyphides grisescens (Redtenbacher) Perliodes grisescens Redtenbacher HEBARD 1923<br />
30 Olcyphides nigro- (Redtenbacher) Perliodes nigrogranulosus HEBARD 1923<br />
granulosus<br />
Redtenbacher<br />
31 Oncotophasma armata (Brunner) Panama (Chiriqui) Paradiapheromera armata HEBARD 1923<br />
Wattenwyl, sp. n.<br />
32 Oncotophasma martini (Griffini) Panama (Darien-Lake Pita, Chiriqui & Berger Bostra martini Griffini 1896 HEBARD 1933<br />
Darien, Portobello, Alhajuelo, Gatun, BCI) Paradiapheromera strumosa<br />
Brunner 1907 (Darien)<br />
Wattenwyl, sp. n.<br />
33 Paranisomorpha insignis Redtenbacher Panama (Boquete) / Costa Rica REDTENBACHER 1908<br />
34 Prisopus ariadne Hebard Panama (Alhajuela, Paraiso) / Costa Rica<br />
HEBARD<br />
1923<br />
(Carillo)<br />
35 Prisopus berosus Westwood Panama (coll. by Zetek)/ Costa Rica (in Berger HEBARD<br />
1923<br />
coll.)<br />
36 Pseudoceroys harroweri Hebard Panama (Portobello)<br />
37 Pseudophasma menius (Westwood) Panama (Portobello, Gatun, Culebra, BCI) Berger Phasma menius Weswood HEBARD 1923, ROBINSON<br />
/ Colombia<br />
1969<br />
38 Pterinoxylus spinulosus Redtenbacher Panama (Chiriqui, BCI) Berger BEDFORD,<br />
1978<br />
REDTENBACHER, 1908<br />
39 Stratocles cinctipes Stal HEBARD<br />
1923<br />
40 Stratocles multilineatus Rehn Panama (Bugaba-Chiriqui, Gatun,<br />
Berger Stratocles forcipatus<br />
HEBARD 1923, 1929,<br />
Guamina-Rio Chagres) / Costa Rica (San<br />
Redtenbacher<br />
ROBINSON 1969, BEDFORD<br />
Carlos)<br />
1978<br />
41 Tenerella tenerrima Redtenbacher Ancon HEBARD 1923, 1933
Appendix 1: Phasmid species previously reported from Panama and BCI. The table lists current names <strong>of</strong> species and synonyms.<br />
No Genus Species Type-Author Reported locations BCI Synonyms. Reference<br />
HEBARD 1923<br />
Aiello Ceroys laciniatus Westwood<br />
Pericentrus multilobatus<br />
Redtenbacher<br />
Pericentrus laciniatus Shelford<br />
Trychopeplus multilobatus<br />
Shelford<br />
42 Trychopeplus laciniatus (Westwood) Panama (Chiriqui, Chiriqui-Bugaba, Rio<br />
Trinidad) / Costa Rica (Rio Sucio) /<br />
Nicaragua
Tabellarischer Lebenslauf<br />
Angaben zur Person:<br />
Name: Berger<br />
Vorname: Jürgen<br />
Geburtsdatum: 9. November 1967<br />
Geburtsort: Neuenstadt am Kocher<br />
Eltern: Reinhold und Marlies Berger (geb. Trabold)<br />
Familienstand: ledig<br />
Staatsangehörigkeit: deutsch<br />
Bildungsweg:<br />
Juli 1987 Abitur, Gustav-von-Schmoller-Schule Heilbronn am Neckar<br />
WS 1989 – SS 1992 Diplomstudium Biologie, Vordiplom, <strong>Universität</strong> Würzburg<br />
WS 1992 – WS 1997 Diplomstudium Biologie, Diplom, <strong>Universität</strong> Göttingen<br />
Hauptfach: Zoologie mit Schwerpunkt Ökologie<br />
Nebenfächer: Mikrobiologie, Bodengeographie und Bodenkunde<br />
Diplomarbeit: Untersuchungen zur Hautflüglerfauna (Hymenoptera,<br />
Aculeata) eines Freilichtmuseums: Blütenbesuch in historisch angelegten<br />
Bauerngärten.<br />
1997 – 1998 Wissenschaftlicher Mitarbeiter, Abteilung Ökologie, <strong>Universität</strong> Göttingen<br />
seit Januar 2000 Promotionsstudium bei Pr<strong>of</strong>. Dr. Burkhard Büdel<br />
Weitere Tätigkeiten:<br />
1987 – 1988 Wehrdienst<br />
Wissenschaftlicher Mitarbeiter an der Abteilung Allgemeine Botanik,<br />
Technische <strong>Universität</strong> <strong>Kaiserslautern</strong><br />
1998 – 2000 Freiberuflicher Biologe
Citable publications:<br />
Berger J., Wirth R., In press. Predation-mediated Mortality <strong>of</strong> Early Life Stages: A Field Experiment<br />
with Nymphs <strong>of</strong> a Herbivorous Stick Insect (Metriophasma diocles) (WESTWOOD).<br />
Biotropica 36(3). (appears in September 2004)<br />
Berger J., Wirth R., 2001. Physical antiherbivore defense does not determine preference <strong>of</strong> a specialist<br />
stick insect. In: G. Zotz, Ch. Körner (eds.) The functional importance <strong>of</strong> biodiversity.<br />
Verhandlungen der Gesellschaft für Ökologie 31: 311.<br />
Berger J., Wirth R., 2001. Diversity and diet breadth <strong>of</strong> stick insects (Phasmatodea) in a Panamanian<br />
semi-deciduous rainforest). In: G. Zotz, Ch. Körner (eds.) The functional importance <strong>of</strong><br />
biodiversity. Verhandlungen der Gesellschaft für Ökologie 31: 338.<br />
Contributions to meetings:<br />
Berger J., Wirth R. 2004. Resource and predator-mediated control <strong>of</strong> a rare specialist herbivore. In:<br />
Biodiversity and dynamics in tropical ecosystems. 17th annual meeting <strong>of</strong> the Society for<br />
Tropical Ecology. Poster<br />
Berger J., Wirth R., 2003. Top-down and bottom-up effects on survival and migration <strong>of</strong> a neotropical<br />
herbivore. Field experiments with nymphs <strong>of</strong> the stick insect Metriophasma diocles.<br />
Tagungsband der 16. Jahrestagung der Gesellschaft für Tropenökologie. Poster<br />
Berger J., Wirth R., 2003. Patterns <strong>of</strong> predation pressure on a neotropical herbivore. Tagungsband der<br />
16. Jahrestagung der Gesellschaft für Tropenökologie. Poster<br />
Meyer S., Hartard B., Herz H., Berger J., 2003. Effect <strong>of</strong> tannin and total phenols on the feeding<br />
preference <strong>of</strong> a specialized herbivore. Tagungsband der 16. Jahrestagung der Gesellschaft für<br />
Tropenökologie. Poster<br />
Berger J., Wirth R., 2002. It’s not predation alone: Top-down and bottom-up effects on a specialist<br />
herbivore. In Tropical Forests: Past, Present, Future. Smithsonian Tropical Research Institute<br />
(editor). Oral Presentation<br />
Berger J., Hartard B., Saverscheck N., Wirth R., 2002. It’s not predation alone: Top-down and<br />
bottom-up effects on a specialist herbivore. Tagungsband der 15. Jahrestagung der Gesellschaft<br />
für Tropenökologie. Poster<br />
Wagner T., Berger J., Wirth R., 2001. Ölkörper an Insekteneiern – ein gefundenes Fressen für Pilze<br />
und Parasitoide? Tagungsband der 14. Jahrestagung der Gesellschaft für Tropenökologie. Poster<br />
Glöggler J., Berger J., Schaefer M., 1998. Untersuchungen zu gebäudebesiedelnden Stechimmen<br />
(Hymenoptera) in einem Freilichtmuseum. In: Osten, T. (Hrsg.) Beiträge der<br />
Hymenopterologen-Tagung in Stuttgart. Oral Presentation
Berger J., Schaefer, M., 1997. Wildbienen als Blütenbesucher in Bauerngärten. Tagungsband der<br />
Jahrestagung der Gesellschaft für Ökologie. Poster<br />
Popular scientific articles:<br />
Berger J., In press. The Masters <strong>of</strong> Camouflage. BBC Wildlife Magazine. (appears in September<br />
2004)
Erklärung:<br />
Hiermit versichere ich, dass ich die vorliegende Dissertation in allen Teilen selbständig angefertigt<br />
und keine anderen als die angegebenen Quellen und Hilfsmittel benutzt habe.<br />
Darüber hinaus erkläre ich, dass die vorliegende Dissertationsschrift weder vollständig noch teilweise<br />
einer anderen Fakultät mit dem Ziel vorgelegt worden ist, einen akademischen Grad zu erwerben.<br />
<strong>Kaiserslautern</strong>, den 27. Mai 2004