ANNUAL REPORT 2006 - DG Hyp
ANNUAL REPORT 2006 - DG Hyp
ANNUAL REPORT 2006 - DG Hyp

Create successful ePaper yourself
Turn your PDF publications into a flip-book with our unique Google optimized e-Paper software.
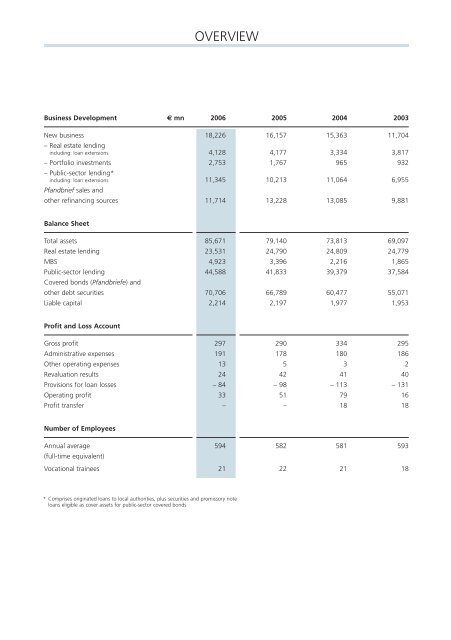
Business Development € mn <strong>2006</strong> 2005 2004 2003<br />
New business<br />
– Real estate lending<br />
18,226 16,157 15,363 11,704<br />
including: loan extensions 4,128 4,177 3,334 3,817<br />
– Portfolio investments<br />
– Public-sector lending*<br />
2,753 1,767 965 932<br />
including: loan extensions<br />
Pfandbrief sales and<br />
11,345 10,213 11,064 6,955<br />
other refinancing sources 11,714 13,228 13,085 9,881<br />
Balance Sheet<br />
Total assets 85,671 79,140 73,813 69,097<br />
Real estate lending 23,531 24,790 24,809 24,779<br />
MBS 4,923 3,396 2,216 1,865<br />
Public-sector lending<br />
Covered bonds (Pfandbriefe) and<br />
44,588 41,833 39,379 37,584<br />
other debt securities 70,706 66,789 60,477 55,071<br />
Liable capital 2,214 2,197 1,977 1,953<br />
Profit and Loss Account<br />
Gross profit 297 290 334 295<br />
Administrative expenses 191 178 180 186<br />
Other operating expenses 13 5 3 2<br />
Revaluation results 24 42 41 40<br />
Provisions for loan losses – 84 – 98 – 113 – 131<br />
Operating profit 33 51 79 16<br />
Profit transfer – – 18 18<br />
Number of Employees<br />
OVERVIEW<br />
Annual average<br />
(full-time equivalent)<br />
594 582 581 593<br />
Vocational trainees 21 22 21 18<br />
* Comprises originated loans to local authorities, plus securities and promissory note<br />
loans eligible as cover assets for public-sector covered bonds