ENERGY CHAPTER 10 - Taranaki Regional Council
ENERGY CHAPTER 10 - Taranaki Regional Council
ENERGY CHAPTER 10 - Taranaki Regional Council

You also want an ePaper? Increase the reach of your titles
YUMPU automatically turns print PDFs into web optimized ePapers that Google loves.
Photo: Rob Tucker<br />
<strong>CHAPTER</strong> <strong>10</strong><br />
<strong>ENERGY</strong><br />
259
260<br />
AT A GLANCE<br />
<strong>ENERGY</strong><br />
<strong>Taranaki</strong>, the energy province, produces energy, from both nonrenewable<br />
fossil fuels (oil, gas, coal) and from renewable sources<br />
such as water (hydro-electricity), wind, solar or biomass. The following<br />
summarises the key facts about <strong>Taranaki</strong>’s production and use of energy:<br />
all of the oil and gas produced in New Zealand is from <strong>Taranaki</strong>;<br />
<strong>Taranaki</strong> uses 3.2% of the total energy used in New Zealand;<br />
477 resource consents have been issued by the <strong>Taranaki</strong> <strong>Regional</strong><br />
<strong>Council</strong> relating to petroleum exploration activities over the past fi ve<br />
years and 48 relate to production stations;<br />
four hydroelectric power generation schemes in <strong>Taranaki</strong> can produce<br />
up to 47 megawatts;<br />
<strong>Taranaki</strong> has currently no wind farms, although one has been<br />
proposed in South <strong>Taranaki</strong>;<br />
industry uses 38% of all energy used in <strong>Taranaki</strong>, with households<br />
using the next greatest proportion (28%);<br />
petrol use in <strong>Taranaki</strong> has remained relatively stable over the past six<br />
years but use of diesel has increased;<br />
signifi cantly more use is made of mains gas in <strong>Taranaki</strong> for home<br />
heating (35%) than across New Zealand as a whole (13%); and<br />
little is known of the state of energy effi ciency in <strong>Taranaki</strong> compared<br />
to the rest of New Zealand as no regional data is collected.<br />
Energy production and use are primarily managed by Central<br />
Government (e.g. the Ministry of Economic Development). Two national<br />
level strategies guide energy development, transmission and use: The<br />
New Zealand Energy Strategy to 2050 and the Energy Effi ciency and<br />
Conservation Strategy. At the local level, energy, and effects associated<br />
with the production of energy, are managed under the Proposed<br />
<strong>Regional</strong> Policy Statement, and regional and district plans.<br />
TARANAKI – WHERE WE STAND
State of the Environment Report 2009<br />
261
262<br />
<strong>ENERGY</strong><br />
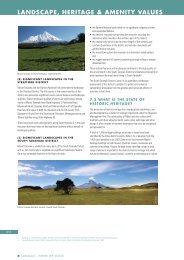
Maui A production platform and supply vessel, offshore from Opunake.<br />
TARANAKI<br />
THE <strong>ENERGY</strong> PROVINCE<br />
Energy in the scientifi c sense of the term, is the capacity of something to<br />
do work and overcome resistance. In everyday usage the word energy is<br />
usually taken to mean a source of power, such as electricity for industrial<br />
processes and home heating or petrol and diesel for our cars. Energy<br />
is derived from other natural and physical resources such as nonrenewable<br />
fossil fuels (oil, gas, coal) or from renewable sources such<br />
as water (hydroelectricity), wind, solar or biomass.<br />
The <strong>Taranaki</strong> <strong>Regional</strong> <strong>Council</strong> and the region’s three district councils<br />
have responsibilities under the Resource Management Act 1991 to<br />
promote the sustainable management of natural and physical resources<br />
(which includes energy) when carrying out their environmental<br />
management functions. Recent amendments to the Act require<br />
greater consideration of the benefi ts to be derived from the use and<br />
development of renewable energy. Wider issues concerning the security<br />
of energy supplies and ensuring competitive and effi cient pricing<br />
of energy production, distribution and supply are the responsibility<br />
of Central Government agencies such as the Ministry of Economic<br />
Development, the Electricity Commission, the Energy Effi ciency and<br />
Conservation Authority and Transpower (NZ) Ltd.<br />
Total primary energy supply is the amount of energy available for<br />
energy transformation (e.g. natural gas to electricity) and end use. New<br />
Zealand’s total primary energy supply in 2006 was 741 petajoules (PJ) 1 .<br />
A petajoule is a unit of energy roughly equivalent to what a coastal<br />
oil tanker carries – about 20,000 tonnes of oil. This was a drop in the<br />
primary energy supply of 0.8% from 2005, and was largely a result of a<br />
decrease in the supply of oil and coal from New Zealand. Most of New<br />
Zealand’s primary energy supply is provided by non-renewable fossil fuels<br />
namely oil and oil products (37%) (most of which is imported), gas (21%)<br />
and coal (12.5%). A further 12% is supplied by geothermal, and by hydro<br />
(11%), and other renewables such as wind, biogas and wood (6.3%).<br />
1 Ministry of Economic Development, New Zealand Energy Data File 2007.<br />
2 Ministry of Economic Development, 2006. New Zealand’s Energy Outlook to 2030.<br />
3 New Zealand Government, 2007. New Zealand Energy Strategy to 2050. Powering Our Future.<br />
TARANAKI – WHERE WE STAND<br />
Rob Tucker<br />
Consumer energy is that used by fi nal consumers. It excludes energy<br />
used or lost in transforming the energy and in bringing the energy to<br />
consumers. Total consumer energy demand in New Zealand in 2006 was<br />
499 PJ, an increase of 1.5% from 2005 1 . Oil and oil products make up<br />
51% of consumer energy demand and most of this (93%) is imported.<br />
Transport accounted for the largest share of consumer energy in 2006 –<br />
about 44% of the total, and accounted for the largest increase – up 4%<br />
from 2005. The next largest consumer in 2006 was the industrial sector<br />
which used 30% of the total consumer energy followed by residential<br />
(12.6%), commercial (9.1%) and agriculture (4.3%).<br />
Demand for energy will inevitably increase over time. Under businessas-usual<br />
assumptions with no major changes in policy, New Zealand’s<br />
energy use is projected to increase by 35% by 2030 with demands for<br />
transport predicted to increase the most. Under these assumptions,<br />
oil use would grow by about 35%, geothermal energy supply by about<br />
75% and wind energy by about <strong>10</strong>00% 2 . However this scenario is not<br />
the Government’s desired outcome. Under the New Zealand Energy<br />
Strategy 3 the Government proposes to increase the proportion of<br />
renewable energy used in electricity generation and transport, reduce<br />
reliance on imported fossil fuels, increase energy effi ciency and reduce<br />
emissions of greenhouse gases from the energy sector.<br />
The challenges for <strong>Taranaki</strong> in the years ahead are to produce energy<br />
effi ciently and environmentally sustainably from a variety of sources, and<br />
then use that energy wisely.<br />
<strong>10</strong>.1 WHAT IS THE CURRENT<br />
STATE OF <strong>ENERGY</strong> IN TARANAKI?<br />
(A) NON-RENEWABLE <strong>ENERGY</strong> IN TARANAKI<br />
Oil and gas<br />
All of New Zealand’s producing oil and gas fi elds are located in the<br />
<strong>Taranaki</strong> basin – an area of about <strong>10</strong>0,000 square kilometres. Most of the<br />
basin is offshore although the majority of producing fi elds are onshore.<br />
Figure <strong>10</strong>.1 Oil production by fi eld for 2006.<br />
SOURCE: Ministry of Economic Development, 2007
Vector K _ apuni gas treatment plant (foreground) and Ballance ammonia-urea plant, K _ apuni.<br />
Most fi elds, including the large M _ aui and K _ apuni fi elds, contain mainly<br />
gas but nearly all fi elds produce a proportion of oil and condensate.<br />
The main offshore fi elds are the M _ aui, Pohokura, Kupe, Maari and T _ u _ ı<br />
fi elds while onshore fi elds include K _ apuni, McKee, Kaimiro, Ng _ atoro,<br />
Tariki/Ahuroa, Waihapa/Ngaere, Stratford, Mangahewa and Rimu/Kauri<br />
fi elds (see Figure 2.8 in Chapter 2: <strong>Taranaki</strong> People and Place). Recent<br />
discoveries include the onshore Surrey and Kahili fi elds (2002) and the<br />
offshore T _ u _ ı oil fi eld (2003).<br />
Oil production is dominated by the offshore M _ aui fi eld which began<br />
producing oil in 1979 and supplied 56% of New Zealand’s total oil<br />
production in 2006. The K _ apuni fi eld provides 9% of total oil production,<br />
while the McKee fi eld provides 6%. The remaining 29% is produced by a<br />
number of smaller fi elds (Figure <strong>10</strong>.1).<br />
In 2006, total New Zealand production of crude oil and condensate (and<br />
naphtha) was 38.9 PJ, a decrease of 2.4% from 2005. New Zealand’s oil<br />
production from the <strong>Taranaki</strong> fi elds continued to decline from the peak in<br />
1997 mainly as a result of declining production in the M _ aui fi eld<br />
(Figure <strong>10</strong>.2).<br />
Figure <strong>10</strong>.2 Annual crude oil, condensate and naphtha production by Field.<br />
4 www.crownminerals.govt.nz/cms/petroleum/overview<br />
Rob Tucker<br />
SOURCE: Ministry of Economic Development, 2007<br />
In 2006, 86% of all our crude oil, condensate and naphtha was<br />
exported, much of it to Australia, Japan and Korea, because <strong>Taranaki</strong>’s<br />
higher quality oil and condensate can be sold at higher prices on the<br />
international market. The remaining 14% was used for feedstock at<br />
Marsden Point refi nery to produce refi ned products such as petrol, diesel<br />
and fuel oil.<br />
Estimated reserves of 55 million barrels of oil remain in existing<br />
producing fi elds and an estimated 147 million barrels in known nonproducing<br />
fi elds 4 . Oil production is set to increase signifi cantly in 2008-09<br />
as new developments such as Maari and Kupe come on line.<br />
As with oil production, all gas produced in New Zealand comes from the<br />
<strong>Taranaki</strong> region. The M _ aui fi eld produced 57.1% of all gas produced in<br />
2006. Other major producers were the K _ apuni fi eld (17.3%) and Pohokura<br />
(8.6%) which commenced production in 2006 (Figure <strong>10</strong>.3).<br />
Total gas produced in <strong>Taranaki</strong> in 2006 was 163 PJ, an increase of 2%<br />
over 2005. Total annual gas production by fi eld is shown in Figure <strong>10</strong>.4.<br />
Figure<strong>10</strong>.3 Gas production by fi eld for 2006.<br />
Figure<strong>10</strong>.4 Annual total gas production by fi eld.<br />
State of the Environment Report 2009<br />
SOURCE: Ministry of Economic Deavelopment, 2007 SOURCE: Ministry of Economic Development, 2007<br />
263
264<br />
<strong>ENERGY</strong><br />
Figure <strong>10</strong>.5 Gas consumption by sector for 2006.<br />
About 56% of New Zealand’s natural gas produced during 2006 was<br />
used for electricity generation (Figure <strong>10</strong>.5). Contact Energy Ltd (Otahuhu<br />
B, <strong>Taranaki</strong> Combined Cycle at Stratford and New Plymouth Power<br />
Station) and Genesis Power Ltd (Huntly Power Station) were the main<br />
thermal electricity generators in New Zealand using natural gas. The<br />
amount of gas used for electricity generation increased by 12% from<br />
2005 to 2006.<br />
In December 2007 Contact Energy Ltd decided to permanently close the<br />
New Plymouth Power Station because of asbestos-related health and<br />
safety issues but the station was partly reopened in mid-2008 to meet<br />
electricity demand. Final decisions on the decommissioning of the station<br />
are still to be made. It was commissioned in 1976 and because of its<br />
age and relative ineffi ciency operated largely when other plants were<br />
not operating or when demand for electricity was high. By contrast, the<br />
newer combined cycle power station at Stratford completed in 1998, at<br />
55.5%, has one of the best fuel effi ciencies of New Zealand’s thermal<br />
power stations 5 .<br />
Industrial users throughout the North Island used 20.2% of gas produced<br />
in 2006, and the petrochemical sector another 15%. The petrochemical<br />
sector use of gas included Methanex’s methanol plants at Motunui and<br />
the Waitara Valley and the Ballance Agri-Nutrients ammonia/urea plant<br />
at K _ apuni. Methanex New Zealand produced about 400,000 tonnes of<br />
methanol during 2006, up from 340,000 tonnes in the previous year.<br />
This was despite the Motunui Plant having shut down in November<br />
2004 because of a lack of natural gas supply at a competitive price, and<br />
the temporary closure of the Waitara Valley Plant in July 2006 (which<br />
re-opened in September 2006). Methanex New Zealand has since reopened<br />
its Motunui Plant.<br />
The residential sector accounted for about 5% of all gas used in 2006,<br />
with the number of residential consumers throughout the North Island<br />
totalling about 229,000. The remaining 3% of gas was used by about<br />
8,000 commercial users (including transport) spread throughout the<br />
North Island.<br />
Estimated gas reserves remaining in currently producing fi elds are of the<br />
order of 1,048 billion cubic feet with a further 1,144 billion cubic feet of<br />
estimated reserves in non-producing fi elds 6 . Gas yields from the maturing<br />
M _ aui fi eld have been declining from the peak recorded in 2001.<br />
5 www.contactenergy.co.nz<br />
6 www.crownminerals.govt.nz/cms/petroleum/overview<br />
TARANAKI – WHERE WE STAND<br />
SOURCE: Ministry of Economic Development, 2007<br />
The <strong>Taranaki</strong> Basin is under explored by international standards and<br />
exploration interest in the region for both oil and gas remains high.<br />
Responsibility for issuing permits to undertake prospecting and<br />
exploration of petroleum minerals, such as oil and gas, and for issuing<br />
permits and licences to mine oil and gas resources, lies with the Ministry<br />
of Economic Development. The various permits and licences to explore<br />
for and extract petroleum resources are processed by the Ministry<br />
under the Crown Minerals Act 1991. Table <strong>10</strong>.1 shows the number of<br />
petroleum prospecting, exploration and mining permits and licences, and<br />
the number of wells drilled between 2002 and 2006.<br />
Table <strong>10</strong>.1 National summary of petroleum exploration and mining activity 2002-06.<br />
Number (national<br />
totals)<br />
2002 2003 2004 2005 2006<br />
Wells drilled<br />
Petroleum prospecting<br />
21 16 33 34 30<br />
and exploration<br />
permits<br />
82 86 <strong>10</strong>5 <strong>10</strong>4 79<br />
Petroleum mining<br />
permits and licences<br />
SOURCE: Ministry of Economic Development, 2007.<br />
12 12 14 19 21<br />
Almost all wells drilled and petroleum permits issued were in the<br />
<strong>Taranaki</strong> Basin, although in the past fi ve years an exploration well<br />
was drilled in the offshore Canterbury Basin and some prospecting or<br />
exploration activities have been undertaken in the Great South Basin<br />
offshore from Southland and South Otago and in the Ruakumara Basin<br />
off the North Island’s East Coast.<br />
Another indicator of the state and pressures on oil and gas resources<br />
in the region is the number of resource consents issued under the<br />
Resource Management Act 1991. Table <strong>10</strong>.2 shows the number of<br />
resource consents issued by the <strong>Taranaki</strong> <strong>Regional</strong> <strong>Council</strong> for oil and<br />
gas exploration activities, and oil and gas production stations over the<br />
past fi ve years. These resource consents deal with the environmental<br />
effects of oil and gas exploration and production activities (for example,<br />
effects on water and air quality) and do not deal with managing the oil<br />
and gas resources themselves which is the responsibility of the Ministry<br />
of Economic Development.<br />
Table <strong>10</strong>.2 Number of resource consents issued by the <strong>Taranaki</strong> <strong>Regional</strong> <strong>Council</strong><br />
for oil and gas exploration activities and production stations 2002-03 to 2006-07.<br />
Number of<br />
resource<br />
consents issued 1<br />
2002-03 2003-04 2004-05 2005-06 2006-07<br />
Petroleum<br />
exploration<br />
75 112 9022 138 62<br />
Production stations 16 8 8 9 7<br />
1 Includes water permits, discharge permits, land use consents and coastal permits.<br />
2 Excludes 68 changes to resource consents to refl ect changes to the Resource<br />
Management Act regarding greenhouse gas emissions reporting.<br />
In 2002-03 consents were issued to Swift Energy New Zealand Ltd for<br />
exploration sites associated with the onshore Kauri oil and gas fi eld
and 17 consents were issued to Shell Todd Oil Services Ltd for the<br />
offshore Pohokura gas fi eld development. Forty two consents were<br />
issued to Swift Energy NZ Ltd for exploration activities associated with<br />
the Manutahi exploration sites in South <strong>Taranaki</strong> in 2003-04, and six<br />
consents were issued for the Natural Gas Corporation New Zealand<br />
Kahili Production Station. Resource consents for a number of new<br />
onshore exploration wellsites across the region were issued in 2004-05<br />
and in 2005-2006. In 2004-05, 17 consents were issued to Origin Energy<br />
Resource (Kupe) Ltd for development of the offshore Kupe fi eld and<br />
associated onshore production station.<br />
Compliance by the oil and gas industry with the conditions of resource<br />
consents is generally very high. In 2006-2007 the <strong>Council</strong> carried out 135<br />
inspections of exploration wells, 80 inspections of producing wellsites<br />
and 72 inspections of production stations. In all cases activities were in<br />
compliance with resource consent conditions at the time of inspection<br />
and no re-inspections were required 7 .<br />
Coal<br />
The <strong>Taranaki</strong> Coal Region comprises fi ve coalfi elds mainly between<br />
Taumarunui and M _ okau on the west coast - M _ okau, Aria, Waitewhena,<br />
_ Ohura-Tangarakau and Retaruke. Only part of the M _ okau fi eld lies<br />
within the boundaries of the <strong>Taranaki</strong> local government region. Coal-inground<br />
resources in these fi elds total 380 million tonnes (2.4% of New<br />
Zealand’s total coal-in-ground resource) of which 173 million tonnes are<br />
estimated to be recoverable 9 . Most of the resources are in the M _ okau<br />
coalfi eld where there is potential for opencast and underground mining.<br />
Various exploration and mining feasibility assessments of the <strong>Taranaki</strong><br />
Coal Region took place in the early to mid-1980s. However, the relatively<br />
remote location of the coalfi elds and consequently high transport costs<br />
have limited development. A preliminary mining feasibility study of<br />
the M _ okau coalfi eld in 1985 for a 1,000 MW power station defi ned<br />
saleable reserves at 36 million tonnes opencast and 71 million tonnes<br />
underground 8 .<br />
(B) RENEWABLE <strong>ENERGY</strong> IN TARANAKI<br />
<strong>Taranaki</strong>’s climate, topography and other physical features mean that the<br />
region has a number of potential sources of renewable energy. The main<br />
sources are hydro, wind, solar, biomass, geothermal and marine.<br />
A number of barriers slow the uptake of renewable energy, particularly<br />
the high capital cost as projects must include the cost of fuel gathering<br />
as well as energy conversion. Some technologies are new and have not<br />
reached a stage of commercial application or do not yet have economies<br />
of scale in plant construction compared with conventional energy<br />
sources. Other potential constraining factors are long development<br />
times, competition with other users for the same resource and<br />
environmental impacts.<br />
Hydropower<br />
<strong>Taranaki</strong> currently has four hydroelectric power generation schemes in<br />
<strong>Taranaki</strong> with a total installed capacity of 47 megawatts (MW) (Table<br />
<strong>10</strong>.3). In addition, a small scheme in Normanby on the Waingongoro<br />
River is in the process of being recommissioned with a potential capacity<br />
to generate an additional 2 MW.<br />
Table <strong>10</strong>.3 Developed hydro-electric schemes in <strong>Taranaki</strong>.<br />
Scheme Catchment area Scheme rating (MW)<br />
P _ atea P _ atea 30.7<br />
Opunake Waiaua 7.0<br />
Motukawa Manganui, Waitara 4.8<br />
Mangorei Waiwhakaiho 4.5<br />
Total 47.0<br />
SOURCE: Sinclair Knight Merz, 2006.<br />
A large number of rivers and streams fl ow off Mount <strong>Taranaki</strong> and out<br />
of the inland <strong>Taranaki</strong> hill country. However, development of large-scale<br />
hydroelectric power schemes is constrained by the relatively small<br />
river fl ows in the region’s waterways and the lack of topographical<br />
features where substantial head can be gained or sites that would<br />
allow diversion of fl ows to neighbouring catchments. Constraints are<br />
also imposed because large areas of the region are located in public<br />
conservation land which has signifi cant biodiversity values.<br />
There are opportunities for micro and mini schemes and hydrogeneration<br />
in the lower reaches of rivers at locations with steep river<br />
reaches or local drops.<br />
There have been a number of assessments of hydroelectric power<br />
generation potential in <strong>Taranaki</strong> over the years. One report concluded<br />
that the remaining hydro potential in <strong>Taranaki</strong> from schemes outside<br />
public conservation land was almost 60 MW in mini, small and medium<br />
scale projects 9 .<br />
Wind<br />
Wind power generation has become a signifi cant contributor to<br />
electricity generation in many parts of the world, especially Europe and<br />
the USA. There has been substantial growth in electricity generated<br />
by wind power in New Zealand in the past <strong>10</strong> years but the installed<br />
wind power capacity of 170 MW (in 2006) nationwide is still relatively<br />
low and provides only about 2% of New Zealand’s electricity needs.<br />
Predictions estimate that there is potential for 2000 MW of additional<br />
capacity from wind power in the next <strong>10</strong> years providing about 17% of<br />
New Zealand’s installed capacity <strong>10</strong> .<br />
There are currently no wind farms in the <strong>Taranaki</strong> region but some wind<br />
farm developers have shown interest in <strong>Taranaki</strong> as a possible area for<br />
Wind turbine.<br />
7 <strong>Taranaki</strong> <strong>Regional</strong> <strong>Council</strong>, 2007. Annual report: Compliance monitoring 2006-07.<br />
8 www.crownminerals.govt.nz/cms/coal<br />
9 Sinclair Knight Merz, 2006. Renewable Energy Assessment: <strong>Taranaki</strong> Region. Report to the Energy Effi ciency and Conservation Authority<br />
<strong>10</strong> Electricity Commission quoted in Parliamentary Commissioner for the Environment, 2006.Wind Power, People and Place.<br />
Rob Tucker<br />
State of the Environment Report 2009<br />
265
266<br />
<strong>ENERGY</strong><br />
development. In 2007, Waverley Wind Farm Ltd applied to the South<br />
<strong>Taranaki</strong> District <strong>Council</strong> to establish a 45-turbine wind farm (135 MW)<br />
on a coastal site on Stewart Road, Waverley. The application has yet to<br />
be heard by the South <strong>Taranaki</strong> District <strong>Council</strong>.<br />
Wind speeds in <strong>Taranaki</strong> are not among the highest in the country,<br />
which are generally found in the southern parts of the North Island.<br />
However, some areas of <strong>Taranaki</strong> are likely to have average wind<br />
speeds of above 8 metres/second which is currently the approximate<br />
minimum wind speed required for economic wind farms. The <strong>Taranaki</strong><br />
coastline is an area with suffi cient wind speeds, with generally more<br />
wind on the region’s western and southern coast.<br />
However, a range of other factors, such as the location of important<br />
natural features and landscapes, proximity to population and<br />
site availability, determine what areas are suitable for wind farm<br />
developments. It is unlikely that very large wind farms (greater than 300<br />
MW) will be developed in <strong>Taranaki</strong> due to the region’s even distribution<br />
of population and dwellings. However, it has been suggested that if<br />
carefully planned, approximately 300 MW of wind capacity could be<br />
installed over a number of years with environmental impacts that were<br />
broadly acceptable to local communities, focused along the South<br />
<strong>Taranaki</strong> coastline. The report also noted that the technically available<br />
wind potential in <strong>Taranaki</strong> is much great than 300 MW and that smallscale<br />
wind turbines (less than <strong>10</strong> KW) could be operated successfully in<br />
areas with lower wind speeds than those required for larger turbines.<br />
Solar<br />
Solar radiation (energy from the sun), in <strong>Taranaki</strong> is amongst the highest<br />
in New Zealand and higher than most areas in Europe (Table <strong>10</strong>.4).<br />
Solar radiation for New Plymouth is approximately 1,500 Kilowatt-hours<br />
(kWh) per square metre per year. There are no large variations in solar<br />
radiation across the region. However, solar radiation varies greatly over<br />
the year, being highest in January and lowest in June.<br />
A standard solar thermal system can produce about 55% of a<br />
household’s water heating, and households account for 32% of<br />
electricity demand in the <strong>Taranaki</strong> region 11 . The installation of solar<br />
thermal technologies, therefore, has the potential to contribute to the<br />
region’s overall energy supply.<br />
Solar energy.<br />
TARANAKI – WHERE WE STAND<br />
Table <strong>10</strong>.4 Typical values for total solar radiation for several sites.<br />
Site Solar radiation (kwh/m2/yr) Gisborne 1,497<br />
New Plymouth 1,485<br />
Kaitaia 1,469<br />
Paraparaumu 1,403<br />
Christchurch 1,360<br />
Invercargill 1,292<br />
Sydney 1,708<br />
Melbourne 1,473<br />
Germany 1,003<br />
SOURCE: Sinclair Knight Merz, 2006.<br />
Solar thermal systems are most economic when installed in new<br />
buildings. The number of occupied dwellings in <strong>Taranaki</strong> increased by<br />
more than 1,300 between 2001 and 2006. There is therefore potential to<br />
increase the uptake of solar thermal use in the <strong>Taranaki</strong> region.<br />
Given <strong>Taranaki</strong>’s high levels of solar radiation there is also potential to<br />
make increased use of passive solar heating through building orientation<br />
and design (both commercial and residential) to maximise the absorption<br />
of solar energy.<br />
Biomass<br />
The resources for the production and use of biomass as a renewable<br />
energy resource include agricultural crops, dairy and livestock farming,<br />
forestry and the wastes associated with production and processing.<br />
An assessment of renewable energy in <strong>Taranaki</strong> in 2006 concluded that<br />
while <strong>Taranaki</strong> does not have a particularly suitable climate for intensive<br />
cropping and is not therefore likely to be a major source of crop-derived<br />
biomass, there is potential for the production of ethanol or electrical<br />
energy from woody biomass derived from lower-grade forestry 11 . That<br />
report also noted potential biomass energy from the region’s dairy<br />
processing residues, meat processing by-products (e.g. tallow), municipal<br />
solid waste, and sewage biogas and sludge.<br />
One Lepperton piggery operator is in the process of developing a system<br />
to harness the biogas generated from piggery waste to enable electricity<br />
generation for use in the piggery. Biogas is a term that refers to gases<br />
extracted off anaerobic ponds which are made up of methane, CO2 and<br />
hydrogen sulphide.<br />
Geothermal<br />
11 Sinclair Knight Merz, 2006. Renewable Energy Assessment: <strong>Taranaki</strong> Region. Report to Energy Effi ciency and Conservation Authority.<br />
Rob Tucker<br />
<strong>Taranaki</strong> does not contain high temperature geothermal fi elds of the<br />
sort found in the Taup _ o Volcanic Zone. However, because of the region’s<br />
volcanic history, higher than average heat fl ows are found in parts of the<br />
region. Temperatures of over 150°C can occur in some deep oil and gas<br />
exploration wells. It is more likely however that the temperatures and<br />
fl ow rates obtained from geothermal sources in <strong>Taranaki</strong> would be too<br />
low for power generation but could be used for direct heat applications<br />
such as horticulture (greenhouse) heating, aquaculture, timber drying<br />
and space heating 11 .
Marine<br />
Various studies have been carried out throughout New Zealand on tidal<br />
energy and wave energy. Given weather patterns, water depths and wave<br />
energies in <strong>Taranaki</strong>, it has been estimated that the capacity potential<br />
from wave energy in <strong>Taranaki</strong> (ignoring environmental constraints and<br />
confl icts with other maritime users) is in the <strong>10</strong>00 MW range 11 .<br />
Information available regarding tidal fl ow patterns in the region is<br />
limited but indicates that the tidal fl ows seen within the region are<br />
insuffi cient for power generation.<br />
Teacher Warwick Foy and student Abbie Fowler with the environmental award<br />
presented by <strong>Council</strong> Chairman David MacLeod (right).<br />
STUDENTS SWITCH ON TO<br />
<strong>ENERGY</strong> EFFICIENCY<br />
Inglewood High School has been supplementing the three Rs with<br />
CGE – conservation, generation and education – in the cause of<br />
energy effi ciency and sustainability.<br />
They were the three strands of a $<strong>10</strong>0,000 Enviropower pilot<br />
programme at the 380-student school funded by Venture <strong>Taranaki</strong><br />
and the Ministry for the Environment supported by EcoInnovation<br />
and Enviroschools. It was believed to be the fi rst of its kind in New<br />
Zealand and it earned a <strong>Taranaki</strong> <strong>Regional</strong> <strong>Council</strong> Environmental<br />
Award in 2008.<br />
The most obvious sign of the project is a <strong>10</strong> m wind turbine in the<br />
school grounds, a renewable source for electricity that is used on<br />
site. The school also has two sets of solar panels – one to generate<br />
electricity and one for water heating.<br />
<strong>Taranaki</strong> <strong>Regional</strong> Coun cil<br />
Marine energy.<br />
According to teacher Warwick Foy, the turbine generates about 800<br />
watts on the average breezy day in Inglewood, while the photovoltaic<br />
solar panels can produce 300 to 1,000 watts and the hot water panels<br />
can supply the needs of the administration block.<br />
On the conservation side, the school has eliminated unnecessary<br />
hot water heating by wrapping, timing and in some cases turning off<br />
cylinders. More energy-effi cient lighting and computer systems have<br />
been introduced and power consumption is constantly monitored,<br />
allowing students and staff to see immediately the result of effi ciency<br />
measures.<br />
Tangible benefi ts of the year-long project included a 17% reduction in<br />
power consumption, exceeding the target of 15%. Biggest gains were<br />
made in daytime consumption, especially at weekends. Energy use is<br />
down 22% on weekdays and 57% in weekend daytime.<br />
But it’s the third strand of the project, education, that was probably<br />
the most important, said Warwick.<br />
Students have been involved in many aspects of the project –<br />
wrapping the cylinders, digging the turbine foundations and so on –<br />
and they have taken real ownership of the project.<br />
That zeal has been taken back to their homes, where they have been<br />
monitoring the family power consumption and generally raising<br />
awareness and promoting effi ciency. This will have real long-term<br />
benefi ts.<br />
The school also incorporated Enviropower aspects in geography,<br />
social studies, maths, science and art lessons, with a four-week social<br />
studies unit covering issues such as peak oil and gas, global warming,<br />
renewable and non-renewable energy and sustainability issues.<br />
The Enviropower project was a great learning experience for all<br />
involved, said Warwick. “As we enter into a future of energy and<br />
environmental uncertainty, it’s good to know that our students will be<br />
better prepared.”<br />
The programme was designed to support the Government’s Energy<br />
Strategy, and Venture <strong>Taranaki</strong> was delighted with the enthusiasm<br />
demonstrated by teachers, pupils and the wider school community<br />
in the project. Venture <strong>Taranaki</strong> is considering what the next stage<br />
will be.<br />
Rob Tucker<br />
State of the Environment Report 2009<br />
267
268<br />
<strong>ENERGY</strong><br />
(C) <strong>ENERGY</strong> TRANSMISSION AND<br />
DISTRIBUTION IN TARANAKI<br />
The <strong>Taranaki</strong> region contains a highly developed energy transmission and<br />
distribution network associated particularly with its oil and gas resources<br />
and electricity generation.<br />
Pipelines link oil and gas fi elds to production stations such as those<br />
at _ Oaonui, Waihapa, Rimu and McKee and from there to Port <strong>Taranaki</strong>.<br />
High pressure gas pipelines distribute natural gas to major gas users in<br />
<strong>Taranaki</strong> and from <strong>Taranaki</strong> throughout the North Island. In total there<br />
Bar Manager Michelle Trainor in the chiller. Furlong Manager Margaret Bailey<br />
shows the length of the chiller before the area was reduced.<br />
<strong>ENERGY</strong> EFFICIENCY<br />
A COSY IDEA<br />
The Furlong Motor Inn in H _ awera has become a cosier place and it’s<br />
all in the name of energy effi ciency.<br />
In the past year, measures to cut electricity and gas consumption have<br />
included reducing the space in regular public use by a third – achieved<br />
by closing one bar, using another only for functions and moving the<br />
house restaurant into a smaller area.<br />
(D) <strong>ENERGY</strong> USE<br />
12 Energy Effi ciency and Conservation Authority. Energy End Use Database. www.eeca.govt.nz.<br />
TARANAKI – WHERE WE STAND<br />
are more than 3,400 km of high pressure gas transmission pipelines in<br />
New Zealand and more than 2,800 km of intermediate, medium and<br />
low pressure gas distribution pipelines connected to the high pressure<br />
transmission system.<br />
Transpower (NZ) Ltd, operates the national electricity transmission<br />
network (the national grid). In <strong>Taranaki</strong> this includes high voltage 220<br />
kV transmission lines from New Plymouth to Stratford, inland from<br />
Stratford, and south to Waverley. 1<strong>10</strong> kV lines link New Plymouth,<br />
Motunui, Stratford, H _ awera, Opunake and Waverley south.<br />
<strong>Taranaki</strong> consumes about 15.36 petajoules of energy per year, 3.2% of New Zealand’s total energy use (487.07 PJ) 12 . Table <strong>10</strong>.5 shows energy<br />
use by sector and compares <strong>Taranaki</strong>’s energy use with the national totals.<br />
Table <strong>10</strong>.5 <strong>Taranaki</strong> and New Zealand end use energy consumption (PJ)<br />
Sector<br />
<strong>Taranaki</strong> end use energy<br />
consumption<br />
Rob Tucker<br />
%<br />
<strong>Taranaki</strong> total<br />
The impact was almost immediate when heating, lighting, and bar<br />
fridges and bowsers were turned off in the redundant areas.<br />
The same idea was applied to two large walk-in chillers at the<br />
Furlong. A considerable amount of this space was previously underused<br />
but internal walls have now been installed, reducing by about<br />
two-thirds the area that needs to be kept refrigerated.<br />
These were big steps for the business to take but manager Margaret<br />
Bailey says they have paid off, with a 40% reduction in electricity<br />
costs over the past year.<br />
Other measures to reduce energy consumption have included<br />
insulating hot water pipes and raising staff awareness of the need to<br />
turn off lights and other electrical equipment when not in use.<br />
The Furlong has also cut by around half the amount of waste it sends<br />
to landfi ll, by paying greater attention to recycling possibilities and<br />
fi nding new users or uses for food scraps, used cooking oil and green<br />
waste.<br />
The establishment’s successes in energy effi ciency and waste<br />
minimisation were marked by a <strong>Taranaki</strong> <strong>Regional</strong> <strong>Council</strong><br />
Environmental Award this year.<br />
New Zealand end use<br />
energy consumption<br />
%<br />
New Zealand total<br />
Agriculture 2.28 14.8 35.31 7.3<br />
Commerce 1.11 7.2 54.55 11.2<br />
Household 4.31 28.1 157.99 32.4<br />
Industry 5.89 38.3 166.24 34.1<br />
Transport and storage 1.77 11.5 72.99 15.0<br />
Total 15.36 <strong>10</strong>0.00 487.07 <strong>10</strong>0.00<br />
Note: Data sourced from the Energy End Use Database maintained by the Energy Effi ciency and Conservation Authority. This database includes residential household<br />
transport energy consumption in the Household category. The Energy Data File maintained by the Ministry of Economic Development referred to at the beginning of this<br />
chapter includes residential household transport in the national transport category.
Table <strong>10</strong>.5 shows that in <strong>Taranaki</strong> the greatest amount of energy is<br />
used in the industry and household categories. The amount used in the<br />
agricultural sector is twice the percentage used nationally and refl ects<br />
the strong agricultural base to the region’s economy. Energy use by<br />
industry in <strong>Taranaki</strong> is also higher than the national average refl ecting<br />
<strong>Taranaki</strong>’s petrochemical and related engineering industries. Energy use<br />
by households and commerce is proportionately lower.<br />
<strong>Taranaki</strong>’s use of fossil fuels for non-transport activities such as<br />
agricultural production is 35% of all energy used, signifi cantly higher<br />
than the national average of 25%. Our use of fossil fuels for transport is<br />
similar to the national average.<br />
Petrol sales in <strong>Taranaki</strong> have been relatively stable over the past six<br />
years with a total of 77.3 million litres used in 2006-07. Diesel sales<br />
have increased by about 12% from 65.1 to 73.2 million litres between<br />
2001-02 and 2006-07 (refer Figure 6.3 in Chapter 6: Atmosphere). In<br />
addition, the number of households that have access to two or more<br />
vehicles has increased over the past ten years contributing to an overall<br />
increase in petrol and diesel sales.<br />
National energy use fi gures show that household use annually is about<br />
13% of all energy used (excluding household transport). More than<br />
one-third (34%) of this is used to heat dwellings 13 . The fuel types used<br />
to heat dwellings are therefore an important indicator of energy use<br />
in <strong>Taranaki</strong>. Figure <strong>10</strong>.6 shows the types of fuels to heat dwellings in<br />
<strong>Taranaki</strong> compared with New Zealand as a whole.<br />
Figure <strong>10</strong>.6 shows that electricity is used to heat a little over half (51%)<br />
of dwellings in <strong>Taranaki</strong> compared to almost three quarters (71%) of<br />
private dwellings nationwide. Signifi cantly more use is made of mains<br />
gas in <strong>Taranaki</strong> (35%) than across New Zealand as a whole (13%).<br />
<strong>Taranaki</strong> residents also make more use of wood to heat their homes but<br />
use less bottled gas and coal. Over the past <strong>10</strong> years there has been<br />
Figure <strong>10</strong>.6 Percentage of fuel types used to heat private occupied dwellings.<br />
13 New Zealand Government, 2007. New Zealand Energy Effi ciency and Conservation Strategy.<br />
DATA: Statistics NZ<br />
a decrease in the use of electricity and mains gas to heat homes in<br />
<strong>Taranaki</strong> and an increase in the use of bottled gas. There has also been<br />
an increase in use of solar heating in <strong>Taranaki</strong> in the past <strong>10</strong> years but<br />
the number of households concerned remains small (see also Chapter 6<br />
Air Quality).<br />
Transport (including household transport) uses 44% of energy used<br />
nationally. Over half of all transport energy is used by passenger<br />
transport modes (as opposed to freight transport).<br />
Figure <strong>10</strong>.7 shows the most common means of travel to work for people<br />
in <strong>Taranaki</strong> compared to New Zealand as a whole. This shows that in<br />
<strong>Taranaki</strong>, as well as nationally, the main means of travelling to work is<br />
either the private car or company vehicle. The use of public transport<br />
in <strong>Taranaki</strong> is lower than for New Zealand generally refl ecting better<br />
public passenger transport services in large metropolitan centres where<br />
population numbers and densities make them a more viable transport<br />
option. <strong>Taranaki</strong> workers made greater use of motor cycles or walking<br />
and jogging to work than New Zealanders as a whole.<br />
(E) <strong>ENERGY</strong> EFFICIENCY<br />
Little is known of the state of energy effi ciency in <strong>Taranaki</strong> or whether<br />
<strong>Taranaki</strong> is any more or less energy effi cient than other parts of the<br />
country, as no regional level data is collected.<br />
One of the important energy effi ciency programmes run by the Energy<br />
Effi ciency and Conservation Authority (EECA), is the Energywise Home<br />
Grants Scheme. This programme gives grants for energy effi ciency<br />
improvements to low income families and landlords of properties with<br />
low income tenants. These improvements include underfl oor insulation,<br />
sealing, cylinder wraps and pipe lagging. Over 40,000 pre 1977 homes<br />
throughout New Zealand have been retrofi tted under the scheme. To date<br />
some 2,500 homes in <strong>Taranaki</strong> have been retrofi tted (see case study).<br />
Figure <strong>10</strong>.7 Main means of travel to work as percentage of totals for <strong>Taranaki</strong><br />
and New Zealand.<br />
State of the Environment Report 2009<br />
DATA: Statistics NZ<br />
269
270<br />
<strong>ENERGY</strong><br />
Harley Meston of Better Homes installing ceiling insulation.<br />
<strong>ENERGY</strong>-SAVER<br />
ON MORE THAN<br />
ONE LEVEL<br />
An ambitious, multi-agency project is under<br />
way to cut energy consumption in thousands<br />
of <strong>Taranaki</strong> homes, and at the same time<br />
reducing the energy expended by staff at<br />
hospitals and doctors’ clinics.<br />
The Healthy Homes <strong>Taranaki</strong> project,<br />
launched in January 2007, aims to have all<br />
the region’s houses insulated by 2014. That’s<br />
a big retrofi tting job as an estimated 29,000<br />
of <strong>Taranaki</strong> homes were built before 1977<br />
and therefore are without insulation.<br />
Besides reducing energy consumption and<br />
costs, the project’s aims include reducing<br />
respiratory illnesses and other serious health<br />
<strong>10</strong>.2 HOW IS<br />
<strong>ENERGY</strong> MANAGED<br />
IN TARANAKI?<br />
(A) CENTRAL GOVERNMENT<br />
Energy production, transmission, distribution<br />
and retail are undertaken by a range of<br />
private sector and state-owned enterprises<br />
working within commercial markets and a<br />
regulatory framework established by Central<br />
Government. Rights to Crown-owned minerals<br />
– oil, gas, minerals and coal – are managed<br />
under the Crown Mineral Act 1991, by the<br />
Crown Minerals Group within the Ministry<br />
of Economic Development. The Electricity<br />
Commission is a Crown entity established<br />
under the Electricity Act, to oversee New<br />
Zealand’s electricity industry.<br />
14 New Zealand Government, 2007. New Zealand Energy Strategy to 2050. Powering Our Future.<br />
15 New Zealand Government, 2007. New Zealand Energy Effi ciency and Conservation strategy.<br />
TARANAKI – WHERE WE STAND<br />
problems brought on by cold and damp living<br />
conditions, and making houses safer for children<br />
and the elderly.<br />
The project is being delivered by Waitara-based<br />
community charitable trust Better Homes and<br />
follows an earlier pilot project which saw <strong>10</strong>0<br />
cold and draughty Waitara homes improved<br />
with insulation.<br />
“The pilot project showed there were defi nite<br />
benefi ts to be had from improving the internal<br />
ambient temperatures in these Waitara homes,<br />
such as fewer respiratory issues,” said Better<br />
Homes General Manager Steve Wharehoka.<br />
“We now want to bring these benefi ts to all<br />
homes in <strong>Taranaki</strong>”.<br />
He said that the work depended on the needs<br />
of the dwelling and occupants, but could<br />
The Ministry of Economic Development<br />
develops and implements policy for the<br />
energy sector overall, and monitors market<br />
performance, including competition issues<br />
and gas and electricity prices. The Ministry<br />
also carries out energy supply and demand<br />
modelling which supports the development<br />
of energy and environmental policies and<br />
develops policy for the oil and alternative fuels<br />
markets.<br />
The Energy Effi ciency and Conservation<br />
Authority (EECA) was established under the<br />
Energy Effi ciency and Conservation Act 2000<br />
and is responsible for promoting energy<br />
effi ciency throughout New Zealand across all<br />
sectors of the economy.<br />
There are two national level strategies<br />
prepared by Central Government to guide<br />
Better Homes<br />
include the installation of roof and underfl oor<br />
insulation and moisture barrier, draughtproof<br />
doors and windows, cylinder wraps,<br />
energy-saving light bulbs, pipe lagging, fi re<br />
alarms, safety latches and security stays<br />
for houses with young children, and grab<br />
rails and barriers for elderly and less mobile<br />
occupants.<br />
Occupants can also be referred to other<br />
appropriate programmes run by the funding<br />
agencies.<br />
The project got off to a fl ying start in its fi rst<br />
year, when 476 houses across the region<br />
were retrofi tted. Of these, less than a third<br />
were spending under $150 a month on<br />
heating and nearly a quarter were paying<br />
$200 or more.<br />
Uninsulated homes lose 42% of their heat<br />
through roofs, 24% through walls, 12%<br />
through windows and <strong>10</strong>% through the fl oor.<br />
<strong>Taranaki</strong>’s yearly energy spend totals $260<br />
million, of which $34 million is for domestic<br />
energy.<br />
Strategic partners in the project are the<br />
Energy Effi ciency and Conservation Authority<br />
(EECA), Peak Health <strong>Taranaki</strong>, the New<br />
Plymouth District <strong>Council</strong>, Work and Income,<br />
Housing NZ, the ACC and the <strong>Taranaki</strong><br />
District Health Board. Major funders include<br />
the TSB and TET community trusts and EECA.<br />
energy development, transmission, distribution<br />
and use throughout New Zealand – the New<br />
Zealand Energy Strategy to 2050 14 and the<br />
Energy Effi ciency and Conservation Strategy 15 .<br />
The New Zealand Energy Strategy aims to<br />
establish “a reliable and resilient system<br />
delivering New Zealand sustainable, low<br />
emissions energy services”. Key features of<br />
the strategy are targets of 90% renewable<br />
energy generation by 2025, and that all new<br />
generation should be renewable except<br />
to the extent needed to ensure security of<br />
energy supply. Actions are proposed in the<br />
strategy to increase energy effi ciency in the<br />
transport sector, encourage public transport<br />
and alternative fuels, use energy more<br />
effi ciently and explore sustainable energy and<br />
innovation.
The Government adopted a new Energy Effi ciency and Conservation<br />
Strategy in an effort to boost energy effi ciency and conservation<br />
and to promote the uptake of renewable electricity. A review of<br />
the earlier 2001 strategy had shown that its objective of improving<br />
energy effi ciency across the economy had not been achieved. The<br />
strategy identifi es targets and actions to improve energy effi ciency and<br />
conservation throughout New Zealand. Targets and actions are set out<br />
for energywise homes (improving the performance of existing and new<br />
homes), energywise business (energy effi ciency and renewable energy<br />
programmes in industry and commerce and in agriculture, horticulture,<br />
forestry and fi shing), energywise transport (managing travel demand,<br />
reducing car and fuel use, improving transport effi ciency, increasing the<br />
use of public transport and developing renewable fuels) and an effi cient<br />
and renewable electricity system. Key targets under the strategy include<br />
70,000 low-interest loans by 2015 for insulation, energy effi ciency<br />
or clean heat in homes, up to 20,000 solar water heating systems by<br />
20<strong>10</strong>, reducing vehicle kilometres travelled, encouraging use of public<br />
transport, halving per capita transport greenhouse gas emissions by<br />
2040 and having 80% of vehicles capable of using <strong>10</strong>% biofuel blends or<br />
electric powered by 2015.<br />
The Government has also adopted a strategy to promote walking and<br />
cycling as alternative modes of transport 16 .<br />
(B) REGIONAL POLICIES AND PLANS<br />
A recent amendment to the Resource Management Act 1991 requires<br />
Local Government to have particular regard to the benefi ts to be derived<br />
from the use and development of renewable energy. The Proposed<br />
<strong>Regional</strong> Policy Statement for <strong>Taranaki</strong> prepared by the <strong>Taranaki</strong><br />
<strong>Regional</strong> <strong>Council</strong> identifi es energy effi ciency and development of<br />
renewable energy as issues for the region.<br />
<strong>Regional</strong> plans prepared by the <strong>Taranaki</strong> <strong>Regional</strong> <strong>Council</strong> and district<br />
plans prepared by the New Plymouth, Stratford and South <strong>Taranaki</strong><br />
district councils, provide for and regulate energy developments while<br />
ensuring that the environment effects of such developments are<br />
avoided, remedied or mitigated.<br />
The <strong>Regional</strong> Air Quality Plan for <strong>Taranaki</strong> contains rules regulating<br />
discharges to air from petroleum exploration activities and from<br />
production stations. The <strong>Regional</strong> Fresh Water Plan for <strong>Taranaki</strong> allows<br />
and regulates the taking or diversion of water (for example for hydroelectric<br />
power generation) and for discharges of contaminants to land or<br />
water and use of riverbeds associated with energy industry exploration<br />
and development such as the laying of pipelines. The <strong>Regional</strong> Coastal<br />
Plan for <strong>Taranaki</strong> contains similar provisions in relation to the coastal<br />
marine area.<br />
(C) DISTRICT PLANS<br />
The New Plymouth District Plan contains objectives, policies and<br />
rules for activities such as building structures, earthworks and use of<br />
hazardous substances etc. Energy exploration, development and use are<br />
16 Ministry of Transport, 2005. Getting There - On Foot, By Cycle.<br />
Pohokura production station.<br />
able to take place within the policy and rules framework set out in the<br />
district plan, which notes that the established activities of the petroleum<br />
exploration and production industry form part of the elements associated<br />
with the rural environment that have developed as a result of traditional<br />
rural practices.<br />
The Stratford District Plan contains objectives, policies and methods<br />
covering issues such as amenity values, outstanding natural features<br />
and landscapes, rural and residential use, protected areas, mineral<br />
extraction and network utilities (among others) all of which may be<br />
of relevance to energy use and development. Rules in the plan permit<br />
certain underground pipeline operations for the distribution of natural<br />
gas, petroleum or geothermal energy, existing electricity lines and<br />
mineral prospecting and pre-drilling petroleum exploration activities in<br />
the rural zone. Other aspects of mineral exploration are dealt with as<br />
controlled or discretionary activities requiring resource consent. Solar<br />
heating devices are exempt from the height in relation to boundary<br />
requirements for buildings.<br />
The South <strong>Taranaki</strong> District Plan has objectives, policies and methods<br />
on a range of issues including the coastal environment, environmental<br />
quality, infrastructure, natural hazards, landscape, and historical and<br />
cultural heritage among others. Rules in the rural zone permit petroleum<br />
Rob Tucker<br />
State of the Environment Report 2009<br />
271
272<br />
<strong>ENERGY</strong><br />
prospecting, including seismic exploration while petroleum exploration<br />
and production testing require resource consent as controlled activities.<br />
Energy generation activities associated with the manufacturing,<br />
processing and/or treatment process are permitted activities in rural and<br />
industrial zones.<br />
All district plans contain provisions that ensure access to natural light<br />
and sunlight and avoid shading of neighbouring properties in the built<br />
environment.<br />
(D) BUILDING ACT<br />
In addition, under the Building Act 2004 and in granting building<br />
consents, district councils must ensure that all building work complies<br />
with the Building Code. This requires among other things that buildings<br />
are constructed to provide adequately controlled interior temperature,<br />
adequate natural light and facilitate the effi cient use of energy.<br />
(E) TRANSPORT<br />
The <strong>Regional</strong> Land Transport Strategy prepared by the <strong>Taranaki</strong> <strong>Regional</strong><br />
<strong>Council</strong> contains policies and actions to reduce vehicle traffi c demand,<br />
fuel consumption and greenhouse gas emissions through the increased<br />
use of alternative modes of transport such as rail, public passenger<br />
transport and walking and cycling. The strategy also recognises the<br />
need to integrate land use with land transport to minimise the total<br />
demand for travel. The <strong>Council</strong>’s <strong>Regional</strong> Passenger Transport Plan<br />
which forms part of the strategy sets out a programme for providing and<br />
supporting public passenger transport in <strong>Taranaki</strong>. The plan recognises<br />
the benefi ts of public transport in reducing private vehicle use and use<br />
of fuel energy.<br />
In 2006-07, over 320,000 trips were made on urban bus services in<br />
New Plymouth 17 . In July 2007 the council introduced once-a-week<br />
bus services between Waverley and H _ awera, Opunake and H _ awera,<br />
and Opunake and New Plymouth. A once-a-week service between<br />
Inglewood and New Plymouth was introduced in November 2007.<br />
The <strong>Taranaki</strong> <strong>Regional</strong> <strong>Council</strong> has also adopted a <strong>Regional</strong> Walkways<br />
and Cycleways Strategy for <strong>Taranaki</strong> to promote walking and cycling<br />
throughout the region. One of the key benefi ts of walking and cycling<br />
Mountain biking.<br />
17 <strong>Taranaki</strong> <strong>Regional</strong> <strong>Council</strong>, 2007. Annual report: <strong>Regional</strong> land transport planning and passenger transport. 2006-07.<br />
TARANAKI – WHERE WE STAND<br />
Rob Tucker<br />
Passengers board a City Link bus, New Plymouth.<br />
noted in the strategy is reduced consumption of fossil fuels and reduced<br />
emissions of greenhouse gases. The strategy records a number of<br />
initiatives already under way in <strong>Taranaki</strong> to promote walking and cycling.<br />
(F) <strong>ENERGY</strong> EFFICIENCY<br />
The <strong>Council</strong> employs a <strong>Regional</strong> Waste Minimisation Offi cer (partly<br />
funded by the district councils) to promote waste minimisation and<br />
energy effi ciency throughout the region. Over 50 organisations have<br />
been visited between early 2007 and mid 2008 – mainly restaurants<br />
and cafes, hotels and service clubs, a major shopping centre, offi ces and<br />
marae. A walk-through assessment is made of current energy practices<br />
and the potential for improving energy effi ciency identifi ed (see case<br />
study on Furlong Motor Inn).<br />
The four local authorities in <strong>Taranaki</strong> all apply in-house energy effi ciency<br />
programmes. The <strong>Taranaki</strong> <strong>Regional</strong> <strong>Council</strong> is a member of the<br />
Communities for Climate Protection (New Zealand) which has seen the<br />
<strong>Council</strong> develop an action plan to increase energy effi ciency within its<br />
own operations.<br />
(G) SUMMARY OF PROGRESS<br />
Progress in implementing regional objectives and policies on energy is<br />
summarised in Table <strong>10</strong>.6.<br />
New Plymouth coastal walkway.<br />
<strong>Taranaki</strong> <strong>Regional</strong> <strong>Council</strong><br />
Rob Tucker
Table <strong>10</strong>.6 Summary of progress: implementing regional objectives and policies on energy.<br />
Issue What do we want to<br />
achieve?<br />
Sustainability<br />
managing energy<br />
Effi ciency in the use,<br />
production and transmission<br />
of energy<br />
Promotion of renewable<br />
sources of energy<br />
Enabling of people and<br />
communities to use and<br />
develop energy to meet their<br />
needs<br />
<strong>10</strong>.3 HOW DO WE COMPARE?<br />
Energy production and transmission are managed at a national level.<br />
<strong>Taranaki</strong> is New Zealand’s only producing oil and gas region and is<br />
the hub for the processing and distribution of natural gas to industrial,<br />
commercial and residential consumers throughout the North Island.<br />
However, regional differences occur in energy use. Table <strong>10</strong>.7 shows the<br />
way in which energy is used in each region and what percentage of that<br />
energy is used by the agriculture, commerce, household, industry and<br />
transport and storage sectors.<br />
<strong>Regional</strong> differences in energy end use refl ect the overall make up of<br />
the economy in each region, the dominance (or otherwise) of particular<br />
industries, climate and population size (which will infl uence household<br />
energy use) and location and distance from main centres and markets<br />
(which will infl uence transport energy use). For example, industrial<br />
energy use in Southland accounts for 68.6% of all energy use in<br />
Southland, the highest proportion by far of all regions, and is likely to be<br />
the result of one large energy user (the Tiwai Point aluminium smelter) in<br />
that region. This reduces the relative proportions of energy use in other<br />
sectors even though in absolute terms, and on a per capita basis, the<br />
energy used in other sectors may be similar to other regions.<br />
<strong>Taranaki</strong>’s energy use of 15.36 PJ is 3.2% of New Zealand’s total energy<br />
use and is above <strong>Taranaki</strong>’s share of the national population at 2.8%.<br />
<strong>Taranaki</strong>’s energy use in agriculture as a proportion of total energy use in<br />
the region (14.9%) is twice the national average and is sixth highest of<br />
all 16 regions refl ecting the level of activity of this sector in the region.<br />
However, the highest absolute energy use in agriculture is found in the<br />
Waikato region (at 6.64 PJ or 14% of the region’s total energy use) and<br />
is almost three times that used in <strong>Taranaki</strong>. The Marlborough region has<br />
What are we doing about it? Where are we at?<br />
Implementing regional plans and<br />
district plans and process resource<br />
consents to regulate and allow<br />
energy production, transmission and<br />
use, including renewable energy.<br />
Implementing the Building Code to<br />
facilitate the effi cient use of energy<br />
in buildings.<br />
Promoting alternative modes<br />
of transport to private vehicles,<br />
urban design and travel demand<br />
management that reduce<br />
consumption of fossil fuels.<br />
Advocating actions at Central<br />
Government level to ensure reliable<br />
and affordable energy supplies,<br />
research into energy effi ciency and<br />
renewable energy technologies and<br />
strategies to enable New Zealand to<br />
continue to meet its energy needs.<br />
All regional and district plans in the region<br />
are operative. Resource consents for energy<br />
developments or projects are monitored.<br />
The Building Code is implemented.<br />
Alternative modes of transport and travel demand<br />
management are promoted.<br />
Central Government has adopted an Energy Strategy<br />
to 2050 and an Energy Effi ciency and Conservation<br />
Strategy.<br />
the highest proportional consumption in agriculture of all regions at 23%<br />
of total energy used in the region.<br />
<strong>Taranaki</strong> has a relatively high proportion of energy use in industry at<br />
38.3%, the third highest proportion in New Zealand after Southland and<br />
Bay of Plenty, refl ecting the presence of the oil and gas, petrochemical<br />
processing and supporting engineering industries.<br />
Pohokura offshore well-head platform.<br />
Rob Tucker<br />
State of the Environment Report 2009<br />
273
274<br />
<strong>ENERGY</strong><br />
Table <strong>10</strong>.7 Energy used by region in different sectors of the economy.<br />
Region Energy used (PJ) % energy used by sector<br />
Agriculture Commerce Household Industry Transport &<br />
storage<br />
Auckland 149.45 2.5 12.5 32.4 37.0 15.6<br />
Bay of Plenty 35.36 7.4 8.4 29.0 42.6 12.6<br />
Canterbury 57.87 5.8 11.6 35.3 29.3 18.0<br />
Gisborne 4.77 14.7 9.4 38.8 21.2 15.9<br />
Hawke’s Bay 16.34 <strong>10</strong>.2 9.7 37.3 28.0 14.8<br />
Manawatu-Wanganui 25.03 7.2 15.6 37.2 24.8 15.0<br />
Marlborough 5.71 23.3 <strong>10</strong>.0 29.9 24.2 12.6<br />
Nelson 8.28 18.4 8.0 21.5 17.6 34.5<br />
Northland 15.69 16.1 9.1 37.2 24.5 13.0<br />
Otago 22.01 8.0 13.0 36.0 27.0 15.9<br />
Southland 30.02 6.3 3.7 13.0 68.6 8.4<br />
<strong>Taranaki</strong> 15.36 14.9 7.2 28.0 38.3 11.5<br />
Tasman 5.18 20.8 6.4 34.7 28.0 <strong>10</strong>.0<br />
Waikato 47.47 14.0 9.1 32.0 30.1 14.9<br />
Wellington 43.32 2.6 16.9 41.3 25.6 13.6<br />
West Coast 5.18 24.5 9.3 25.7 22.8 17.6<br />
New Zealand 487.07 7.2 11.2 32.4 34.1 15.0<br />
Note: Household includes household transport. Data sourced from the Energy End Use Database, EECA.<br />
TARANAKI – WHERE WE STAND