LAND, SOIL & BIODIVERSITY - Taranaki Regional Council
LAND, SOIL & BIODIVERSITY - Taranaki Regional Council
LAND, SOIL & BIODIVERSITY - Taranaki Regional Council

Create successful ePaper yourself
Turn your PDF publications into a flip-book with our unique Google optimized e-Paper software.
TARANAKI<br />
WHERE WE STAND<br />
STATE OF THE ENVIRONMENT REPORT 2009
TARANAKI<br />
WHERE WE STAND<br />
State of the Environment Report 2009<br />
Published by the <strong>Taranaki</strong> <strong>Regional</strong> <strong>Council</strong><br />
Private Bag 713<br />
Stratford<br />
February 2009<br />
Print: ISBN 978-0-473-14730-3<br />
Online: ISBN 978-0-473-14731-0
David MacLeod (Chairman) and Basil Chamberlain (Chief Executive), <strong>Taranaki</strong> <strong>Regional</strong> <strong>Council</strong>.<br />
MESSAGE FROM THE CHAIRMAN<br />
AND CHIEF EXECUTIVE<br />
We have great pleasure in presenting to you,<br />
the third state of the environment report for<br />
<strong>Taranaki</strong>. It reports on current environmental<br />
conditions and trends since monitoring<br />
programmes began.<br />
It is not that many years ago, at the time<br />
of the creation of the <strong>Taranaki</strong> Catchment<br />
Commission in 1970 in fact, that most wastes<br />
from dairy farms discharged directly into<br />
the nearest watercourse. That meant that<br />
the untreated waste generated by tens of<br />
thousands of cows was washed into the<br />
region’s rivers and streams every day. Not<br />
only that, there were no fewer than 43 dairy<br />
factories around the region, almost all of them<br />
built alongside rivers which they both drew<br />
water from, and discharged wastes into.<br />
Today, every dairy farm in <strong>Taranaki</strong> operates<br />
under a regularly monitored discharge permit<br />
that does not allow discharge of untreated<br />
waste directly into any stream, and the<br />
rationalisation of the dairy industry means that<br />
there is now just one (large) dairy factory that<br />
discharges a strictly-controlled discharge of<br />
treated waste into the Tasman Sea through a<br />
long outfall.<br />
Equally, it’s not that many years ago, that<br />
possum numbers in <strong>Taranaki</strong> were high –<br />
competing with cattle for grass and posing<br />
a risk of Bovine TB, and severely impacting<br />
on biodiversity. Today, possum numbers,<br />
particularly on the ring plain, are very low,<br />
thanks to the joint efforts of all the landowners<br />
in the <strong>Council</strong>’s self-help possum programme<br />
and the Department of Conservation.<br />
The information contained in this report draws<br />
on comprehensive state of the environment<br />
monitoring programmes put in place by the<br />
<strong>Taranaki</strong> <strong>Regional</strong> <strong>Council</strong> mainly in the mid<br />
1990s. It also draws on information from<br />
other agencies involved in environmental<br />
management in <strong>Taranaki</strong>: the three district<br />
councils, the Department of Conservation, the<br />
Ministry for Fisheries and many other agencies<br />
and community-based groups. This highlights<br />
that managing the environment takes a<br />
collective response from a whole range of<br />
agencies and individuals.<br />
Many state of environment monitoring<br />
programmes have now been in place for a<br />
suffi ciently long period of time that the data<br />
Rob Tucker<br />
can be analysed for statistically signifi cant<br />
trends. This is important because it provides<br />
us with scientifi cally robust measures of how<br />
the environment is changing.<br />
Overall, the report shows that the health<br />
of our rivers and streams – an important<br />
issue for <strong>Taranaki</strong> – does decrease down<br />
catchments, as would be expected in an<br />
intensively farmed region, but signifi cantly,<br />
over time, it is either not changing or has<br />
measurably improved. This is despite<br />
expansion and intensifi cation of our<br />
agricultural sector over the past fi ve to<br />
10 years. Positive movements towards<br />
sustainability continue in our erosion-prone<br />
inland hill country. Improvements in air<br />
emissions from our major industries have<br />
continued over the last fi ve years and, by all<br />
measures, we in <strong>Taranaki</strong> enjoy excellent air<br />
quality. The report shows similar results for<br />
coastal waters and bathing beaches.<br />
Biodiversity, on land, in fresh water and on the<br />
coast, is an emerging issue, and much good<br />
work is being undertaken by many people<br />
from all corners of the region to combat<br />
the pressures on our biodiversity from land<br />
development and invasive pest plants and pest<br />
animals. Residents and visitors to <strong>Taranaki</strong><br />
enjoy marvellous landscapes and natural and<br />
physical amenities. Our historic heritage is<br />
well preserved in many fi ne buildings and<br />
other historic places. <strong>Taranaki</strong> is working hard<br />
to manage the waste it generates, although<br />
there is always scope for innovative solutions.<br />
Energy production and effi ciency are key<br />
features of <strong>Taranaki</strong>, the energy province of<br />
New Zealand.<br />
The science is one thing, and basing decisions<br />
on sound, robust scientifi c monitoring is<br />
crucial, but equally important is the perception<br />
of people out and about in the environment,<br />
living their lives, every day. Almost nine in 10<br />
residents (87%) of <strong>Taranaki</strong> recently surveyed<br />
are satisfi ed with the management of the<br />
natural environment. This is an overwhelming<br />
endorsement indeed.<br />
The positive outcomes in this report towards<br />
achieving sustainable management have<br />
State of the Environment Report 2009<br />
1
2<br />
not come about by mere good fortune or by accident. The <strong>Taranaki</strong><br />
community can feel justifi ably proud of the efforts it has made in recent<br />
years to ensure that <strong>Taranaki</strong>’s natural resources – vital to our economic<br />
and social well-being – are managed for the benefi t of present and<br />
future generations. These efforts have come at some considerable<br />
effort, hard work and serious money. It has been conservatively<br />
estimated that over the past fi ve years environmental capital<br />
investments on water resources, air and noise, land management,<br />
energy effi ciency and environmental services totalled $216.7 million<br />
– almost two and a half times the expenditure identifi ed in 2002 for<br />
the previous fi ve-year period. Local actions by the community, both<br />
proactive and reactive, are perhaps the single most important change<br />
towards sustainable development in <strong>Taranaki</strong>. These are illustrated in<br />
this report through dozens of stories highlighting individuals doing their<br />
bit for the environment. We know they are just the tip of the iceberg.<br />
However, <strong>Taranaki</strong>’s clean, green image must never be taken for granted.<br />
This report does raise concerns regarding the effects of continued<br />
intensifi cation of our dairying industry on soil compaction, modifi cation<br />
of stream and wetland habitats for land development, and nutrient<br />
run-off from pasture with effects on water quality in the lower reaches<br />
of our rivers and streams. These pressures will intensify with continued<br />
growth in our agricultural sector. They will require ongoing attention<br />
and responses. Restoring the riparian vegetation along the length of our<br />
rivers and streams is our biggest challenge – to fence and plant along<br />
waterways that cumulatively could stretch from Auckland to Sydney and<br />
back again.<br />
The <strong>Taranaki</strong> <strong>Regional</strong> <strong>Council</strong> is greatly heartened by the extent to<br />
which the <strong>Taranaki</strong> community has moved to embrace environmental<br />
stewardship and the concept of sustainability. This bodes well for<br />
meeting future issues that will almost certainly challenge us.<br />
The <strong>Council</strong> believes that sustainable development – a balanced,<br />
integrated approach to development that ensures we look after people<br />
and the environment in the long term – is the key to prosperity. This<br />
will involve working alongside other environmental agencies, farmers,<br />
landowners, industries and businesses to bring about practical, positive<br />
and permanent results over the next fi ve years and in the decades beyond.<br />
ACKNOWLEDGEMENTS<br />
Many people and organisations have assisted in the production of this report. The<br />
<strong>Taranaki</strong> <strong>Regional</strong> <strong>Council</strong> would like to thank the following organisations and<br />
individuals for their assistance.<br />
Contributions for the report were provided by staff from: Stratford District <strong>Council</strong>;<br />
South <strong>Taranaki</strong> District <strong>Council</strong>; New Plymouth District <strong>Council</strong>; Department of<br />
Conservation; Ministry of Fisheries; and the Queen Elizabeth II National Trust.<br />
Research was commissioned for the report from Landcare Research and<br />
Business and Economic Research Limited. Many of the photos were taken by Rob<br />
Tucker, with others sourced from the <strong>Taranaki</strong> <strong>Regional</strong> <strong>Council</strong>, Department of<br />
Conservation, The <strong>Taranaki</strong> Daily News and other groups and individuals.<br />
Susette Goldsmith provided editiorial services.<br />
Graham McBride, from NIWA is specifi cally acknowledged for undertaking a peer<br />
review of the Fresh Water chapter.<br />
TARANAKI – WHERE WE STAND<br />
The following agencies and individuals provided information for the research<br />
undertaken by Business and Economic Research Limited: Methanex New<br />
Zealand Limited; Swift Energy (New Zealand) Limited; Shell Todd Oil Services<br />
Limited; Tasman Oil Tools Ltd; Olex New Zealand Limited; Ravensdown Fertiliser<br />
Limited; <strong>Taranaki</strong> By-Products Limited; Riverlands Eltham Limited; Clelands<br />
Timber Limited; Ballance Agri-Nutrients (Kapuni) Limited; PCL Industries<br />
Limited; MCK Metals Pacifi c Ltd; ABB Limited; C&O Concrete Products Ltd;<br />
Technix Group Limited; Firth Industries Ltd; <strong>Taranaki</strong> Galvanizers Ltd; Fitzroy<br />
Engineering Group Limited; Allied Concrete; Bulk Storage Terminals Limited;<br />
Stratford High School; Weatherford New Zealand Limited; Fonterra Co-operative<br />
Group Limited; Liquigas Limited; New Zealand Oil & Gas Limited; Hooker<br />
Bros Holdings Ltd; Sandford Bros Limited; New Plymouth New World; Pak N<br />
Save; Hawera Rewinds; Independent Blast Services; Inglewood Metal Limited;<br />
Gough Gough & Hamer Limited; Hurlstone Earthmoving Limited; Inglewood Golf<br />
Club; La Nuova Ltd; Vector Gas Ltd; Kibby Metal Pressing Limited; Stresscrete;<br />
Graham Harris (2000) Limited; Austral Pacifi c Energy Ltd; Mainfreight Transport<br />
Ltd; Manukorihi Golf Club; G R & L J Jones; <strong>Taranaki</strong> Jockey Club; Gully Rock<br />
Limited; Powerco Limited; Matador Meats; Toll NZ Consolidated Ltd; Osfl o<br />
Spreading Industries Limited; Dow AgroSciences (NZ) Limited; Shaun Pattinson;<br />
Oaonui Water Supply; Vid Pro Services Ltd; <strong>Taranaki</strong> Drum and Pallet Recycling;<br />
South Road Quarries; Tyco Flow Maintenance; The New Zealand Transport<br />
Agency; Downer EDi Works Limited; Auto Lodge Motor Inn; Plymouth Hotel;<br />
Falcon Engineering Ltd; Brian Crawford Contracting Limited; Ferndene Quarries<br />
Limited; Greymouth Petroleum Limited; Fulton Hogan Limited; Blast It; Clark &<br />
Rogers Limited; Halliburton New Zealand Limited; B J & L B Bishop; Berridge<br />
Pet Food; D M & D L Bourke; Chevron New Zealand; AB & DM Sybrandy<br />
Contracting Limited; Dick Sybrandy Limited; ALSCO NZTS New Zealand; New<br />
Plymouth Quarries Ltd; Meadowvale Stud Farm Limited; TrustPower Limited;<br />
New Zealand Oil Services Ltd; AA Contracting Ltd; Winstone Aggregates<br />
Limited; Pacifi c Natural Gut String Company Ltd; A J Cowley Ltd; Howard<br />
Wright Limited; Port <strong>Taranaki</strong> Limited; <strong>Taranaki</strong> Sawmills Ltd; L A Chatterton<br />
(Waitara) Ltd; The Kiwi Butcher; BTW Company Ltd; Dan Cosgrove Ltd;<br />
Mountain House Motor Lodge; Egmont Seafoods Limited; Te Ngutu Golf Club<br />
(Inc); M-I New Zealand Ltd; PEL Waste Services Limited; Vector Gas Limited;<br />
Zelam Limited; Waitara Golf Club; Silver Fern Farms Limited; Whitaker Civil<br />
Engineering Limited; New Zealand Energy Limited; Westwill Properties Limited;<br />
Origin Energy Resources (Kupe) Limited; Wai-iti Beach Camp Limited; Vickers<br />
Quarries Ltd; Hawera Golf Club (Inc); Summit Quinphos (NZ) Limited; Contact<br />
Energy Limited and TBS Farnworth Ltd.<br />
Finally, the valuable assistance in providing information for the case studies is<br />
gratefully acknowledged from: Stratford District <strong>Council</strong>; South <strong>Taranaki</strong> District<br />
<strong>Council</strong>; New Plymouth District <strong>Council</strong>; Department of Conservation; Kii Tahi<br />
Nursery; Genner family; <strong>Taranaki</strong> Arts Festival Trust; AgResearch; Clive Cullen;<br />
Ng _ ati Tawhirikura Hap _ u; Janice Adamson; Opunake High School; Inglewood High<br />
School; Lincoln Ventures Ltd; Emma Crofskey; Furlong Motor Inn; Better Homes;<br />
Friends of the Eltham Town Hall; Rev David Hollingsworth; Clive Cullen; Ella<br />
Borrows; Collette Holgate; Waste Management Ltd; St Joseph’s School, H _ awera;<br />
Diana Reid; Greg Topless; Mark and Leigh Caskey; Ng _ ati Tara _ Oaonui Sandy Bay<br />
Society; Barry Hartley; Cam and Sarah Collier; Tom Gibson; Parininihi Ki Wait _ otara<br />
Incorporation; Ng _ ati Tama Iwi Development Trust; Merv and Rae Hooker; Bernard<br />
and Pauline Gibson; Bill Clarkson; Moturoa School; Venture <strong>Taranaki</strong> Trust;<br />
Riverlands Eltham Limited; Russell Joblin; East <strong>Taranaki</strong> Environment Trust; Lake<br />
Rotokare Scenic Reserve Trust; Balance Agri-Nutrients; Peter Burgham; <strong>Taranaki</strong><br />
Tree Trust; Tom Gibson; Trust Power; Len Pentelow; Pat Morris and Civil Defence<br />
Emergency Management Group.
TABLE OF CONTENTS<br />
Message from the Chairman and Chief Executive ...................................................................................................................................................................... 1<br />
Contents ........................................................................................................................................................................................................................................ 3<br />
Executive summary ........................................................................................................................................................................................................................ 4<br />
INTRODUCTION ............................................................................................................................................................................................................... 7<br />
2. TARANAKI – THE PEOPLE AND THE PLACE ........................................................................................................................ 11<br />
3. <strong>LAND</strong>, <strong>SOIL</strong> AND <strong>BIODIVERSITY</strong><br />
3.1 Soil erosion ................................................................................................................................................................................................................. 29<br />
3.2 Soil health ................................................................................................................................................................................................................... 36<br />
3.3 Contaminated sites .................................................................................................................................................................................................... 43<br />
3.4 Biodiversity on land .................................................................................................................................................................................................... 47<br />
4. FRESH WATER<br />
4.1 Surface water quality .................................................................................................................................................................................................. 77<br />
4.2 Surface water quantity and fl ows ............................................................................................................................................................................ 111<br />
4.3 Groundwater .............................................................................................................................................................................................................. 121<br />
4.4 Fresh water biodiversity ............................................................................................................................................................................................ 130<br />
4.5 Public access to fresh water ..................................................................................................................................................................................... 141<br />
5. COASTAL AND MARINE ENVIRONMENT<br />
5.1 Coastal water quality ................................................................................................................................................................................................ 153<br />
5.2 Natural character ...................................................................................................................................................................................................... 163<br />
5.3 Coastal and marine biodiversity .............................................................................................................................................................................. 171<br />
5.4 Public access ............................................................................................................................................................................................................. 186<br />
6. ATMOSPHERE<br />
6.1 Air quality .................................................................................................................................................................................................................. 198<br />
6.2 Greenhouse gases and climate change .................................................................................................................................................................. 206<br />
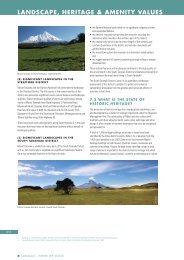
7. <strong>LAND</strong>SCAPE, HERITAGE AND AMENITY VALUES ........................................................................................................ 213<br />
8. NATURAL HAZARDS ............................................................................................................................................................................... 231<br />
9. WASTE .................................................................................................................................................................................................................. 245<br />
10. ENERGY ............................................................................................................................................................................................................... 259<br />
11. TOWARDS SUSTAINABLE DEVELOPMENT .......................................................................................................................... 275<br />
State of the Environment Report 2009<br />
3
4<br />
EXECUTIVE SUMMARY<br />
Pukearuhe and Whitecliffs, North <strong>Taranaki</strong>.<br />
Under the Resource Management Act 1991, regional councils are<br />
required to monitor the overall state of the environment of the region.<br />
Monitoring the state of the environment is important because it tells the<br />
<strong>Council</strong> and the wider community how successful we have been as a<br />
community in promoting the sole purpose of the Resource Management<br />
Act – the sustainable management of our natural and physical<br />
resources.<br />
This is the third state of the environment report for <strong>Taranaki</strong> – the<br />
earlier reports were prepared in 1996 and 2003. Such reports help us<br />
answer questions such as: ‘Is the quality of our environment improving<br />
or deteriorating?’ ‘Have our policies and programmes been effective in<br />
promoting sustainable management?’ ‘What standard of environmental<br />
quality do we want in <strong>Taranaki</strong> and what changes, if any, are required?’<br />
The <strong>Taranaki</strong> environment is managed by a number of organisations,<br />
not just the <strong>Taranaki</strong> <strong>Regional</strong> <strong>Council</strong>. For that reason this report has<br />
attempted to incorporate monitoring from other agencies, such as<br />
the Department of Conservation (DOC), the New Plymouth, Stratford<br />
and South <strong>Taranaki</strong> district councils, the Ministry for Fisheries and the<br />
Ministry of Agriculture and Forestry, and from community groups.<br />
The report is organised around the core resources of land, fresh water,<br />
coast and air as well as landscape, natural and built heritage and<br />
amenity values, natural hazards, waste and energy.<br />
Chapter 1 introduces the report. It describes the purpose and content of<br />
the report and how information is organised and presented.<br />
TARANAKI – WHERE WE STAND<br />
Chapter 2 describes the physical, economic and social characteristics<br />
of the region. This is important because managing natural and physical<br />
resources and the environment takes place within, and is infl uenced by,<br />
these wider physical, economic and social circumstances.<br />
Each of the chapters that follow covers each section of the environment<br />
such as land, fresh water, coast and air. Biodiversity is considered<br />
under each of these environment types. Additional chapters consider<br />
landscape, historic heritage and amenity values, natural hazards, waste<br />
and energy. Each chapter:<br />
begins with an opening scene-setting introduction which explains<br />
why this part of the environment is signifi cant for <strong>Taranaki</strong> people and<br />
what the major pressures on the environment are;<br />
describes the current state of each aspect of the environment – core<br />
information is presented on the state of the environment and key<br />
trends or changes over time;<br />
outlines the management responses to environmental conditions now<br />
and in the future. Information is presented on what is being done now<br />
to address issues raised in the preceding text and what might be done<br />
in the future;<br />
provides a summary of progress in implementing regional objectives<br />
and policies in relation to the chapter topic; and<br />
provides regional comparisons where relevant information is<br />
available. This information enables comparisons to be made between<br />
environmental conditions and trends in <strong>Taranaki</strong> and other parts of<br />
New Zealand.<br />
Rob Tucker
Much of the information contained in the report is based on<br />
comprehensive state of the environment monitoring programmes<br />
established by the <strong>Council</strong> in the mid-1990s. These programmes have<br />
been purpose-built for state of the environment monitoring and have now<br />
been running for suffi cient lengths of time to enable statistical testing of<br />
trends in the data.<br />
The report generally presents <strong>Taranaki</strong> as having a high-quality<br />
environment, which is valued and well-managed by the community.<br />
Like any report card there are positives and negatives. In summary, the<br />
report concludes that:<br />
87.4% of the hill country is being used sustainably with no signifi cant<br />
soil erosion problems. Sustainability in the hill country has increased by<br />
2.4% over the past 5 years, with less land in sheep and beef farming,<br />
and 30.8% of hillcountry land now reverting to scrub.<br />
58% of privately-owned hillcountry land, and 41% of privately-owned<br />
sand country, is now included in the <strong>Council</strong>’s sustainable land<br />
management programme;<br />
97% of <strong>Taranaki</strong> soils have only low to moderate vulnerability to soil<br />
compaction and while there is evidence of soil compaction on some<br />
<strong>Taranaki</strong> farms this is usually only under wet winter conditions and is<br />
generally reversible with appropriate pasture and stock management.<br />
There do not appear to be any signifi cant problems with soil carbon<br />
content, phosphate, nitrogen, cadmium or residual or cumulative<br />
agrichemicals in the soils of the region;<br />
757 potentially contaminated sites have been investigated with no<br />
contamination found to be present, 16 sites have been remediated<br />
and 480 sites contain hazardous substances, but not at levels that<br />
would pose an unacceptable environmental risk, or are currently being<br />
managed so that there is no unacceptable risk;<br />
in terms of biodiversity protection, 20% of the region is in public<br />
conservation land and managed by the Department of Conservation<br />
to safeguard biodiversity values. Furthermore, predator control<br />
programmes, aimed at protecting threatened birds, are undertaken<br />
by a range of agencies and community groups. Possum numbers are<br />
maintained at low levels through both the <strong>Taranaki</strong> <strong>Regional</strong> <strong>Council</strong>’s<br />
self-help possum control programme on the ring plain, and the<br />
Department of Conservation programmes in priority conservation areas;<br />
restoration of riparian vegetation has been shown to result in increased<br />
plant and bird biodiversity;<br />
measures of freshwater ecological health, such as the communities<br />
of invertebrates living in streams, are good to excellent in the upper<br />
catchments where there is more stream bank vegetation cover, but only<br />
fair further down catchments where land use is more intense. However,<br />
over the past 12 years, ecological health has demonstrably improved<br />
at a number of sites, including in the middle and lower reaches of<br />
catchments, and has not demonstrably deteriorated at any sites.<br />
the region’s fresh water usually meets the bacteriological guidelines<br />
for swimming, except after fl oods or in some intensively farmed<br />
catchments. <strong>Taranaki</strong> rivers are naturally high in phosphorus and so<br />
do not meet national guidelines, and furthermore, phosphorus levels<br />
are generally increasing. Nitrogen levels meet guidelines in the<br />
upper reaches of catchments, but not further down, where impacts of<br />
agriculture are more intense.<br />
the <strong>Council</strong>’s riparian management programme is designed to address<br />
these issues with the preparation of 2,009 riparian plans covering<br />
10,818 km of stream bank. Landowners have fenced 504 km of stream<br />
bank and planted 426 km, which, added to exisiting fencing and<br />
planting means 60% of stream bank on the ring plain is fenced, and<br />
43% is vegetated. <strong>Council</strong> will continue to work with landowners to<br />
fence and plant streams to meet the 2015 target of 90% of riparian<br />
plans implemented.<br />
measures of levels of organic pollution (BOD), bacteriological pollution<br />
(faecal coliforms and enterococci) and toxicity (ammonia) are now<br />
stable regionally, after past improvements.<br />
most of <strong>Taranaki</strong>’s 530 streams and rivers are not under any allocation<br />
pressure although interest in water abstraction for irrigation has<br />
increased in recent years. More than 20% of the average low fl ow is<br />
allocated for use in the nine most highly allocated catchments, but<br />
fl ows at which abstraction must cease are set to safeguard ecological<br />
values;<br />
although there has been an increase in the amount of groundwater<br />
abstracted, there is not a signifi cant pressure on groundwater levels;<br />
groundwater quality in <strong>Taranaki</strong> is generally high with no problems<br />
associated with pesticide residues, microbial contamination or<br />
saltwater intrusion, and groundwater quality, in terms of nitrate<br />
levels, is generally improving;<br />
in terms of freshwater biodiversity, regionally signifi cant wetlands<br />
have on the whole been adequately protected through formal<br />
mechanisms and proactive protection works such as fencing and<br />
planting, but small wetlands and streams are under pressure from<br />
land improvement. Of 108 structures that have the potential to<br />
impede fi sh passage, 49 provide adequate fi sh passage, two have<br />
been removed and the others need remedial work;<br />
coastal water quality for swimming is excellent, the product of an<br />
exposed coastal environment and few direct point source discharges;<br />
with the reduction in the number of point source discharges and<br />
better treatment of wastewater, the greater infl uence on coastal<br />
water quality is from rivers and streams discharging the cumulative<br />
effects of land use within their catchments to the sea;<br />
rocky shore ecological health is reasonably stable at most sites<br />
monitored;<br />
the rugged high-energy nature of the <strong>Taranaki</strong> coastal environment<br />
means that much of the coastal area has retained its distinct natural<br />
character and so far levels of development are not impacting on that<br />
character;<br />
biodiversity protection on the coast has been enhanced over the past<br />
fi ve years with the establishment of two new marine reserves;<br />
ecological conditions in both the Tongaporutu and Wait _ otara<br />
estuaries, where long term monitoring is carried out, are generally<br />
stable although they can be affected by severe fl oods;<br />
the legally protected subtidal habitats around the Sugar Loaf (Ng _ a<br />
Motu) Islands provide shelter for a greater diversity and higher<br />
numbers of fi sh and other organisms than neighbouring areas of reef;<br />
there is a range of disparate views on trends in local fi sh stocks;<br />
public access to both freshwater and coastal environments is generally<br />
good, as illustrated by the popular New Plymouth coastal walkway;<br />
State of the Environment Report 2009<br />
5
6<br />
overall air quality in the region is excellent enabling the <strong>Taranaki</strong><br />
community to enjoy one of the healthiest regions in New Zealand.<br />
Signifi cant improvements have been made in the quality of point<br />
source discharges;<br />
natural features and landscapes, and amenity and heritage values are<br />
of a high quality;<br />
over the past fi ve years there has been continued provision,<br />
development or upgrading of a number of community recreational and<br />
cultural facilities;<br />
over the past fi ve years there have been four signifi cant fl ood events,<br />
a number of minor events and one period of signifi cant drought over<br />
the summer of 2007-08;<br />
the swarm of tornadoes that hit <strong>Taranaki</strong> in July 2007 triggered a<br />
state of emergency. The emergency response systems functioned<br />
well;<br />
while the whole region is now serviced by just one well managed<br />
landfi ll, at Colson Road in New Plymouth, the quantity of waste<br />
discharged has increased by 20%; and<br />
<strong>Taranaki</strong> produces all of the oil and gas produced in New Zealand and<br />
uses 3.2% of the total energy used, with industry using 38% of all<br />
energy consumed in <strong>Taranaki</strong>, and households using the next greatest<br />
proportion (28%).<br />
TARANAKI – WHERE WE STAND<br />
The report fi nds that the <strong>Taranaki</strong> community has made a substantial<br />
investment in protecting and enhancing the environment. Capital<br />
investment by the <strong>Taranaki</strong> community has been estimated in excess<br />
of $216 million in the period 2002-2007 compared with $91 million in<br />
the preceding fi ve-year period. Annual operating costs are of the order<br />
of $41.8 million ($28.8 million in the preceding four year period). Total<br />
spending on the environment by the <strong>Taranaki</strong> community has been<br />
conservatively estimated at $85.1 million per annum. This is an increase<br />
of $28 million per annum from the $57.1 million per annum reported in<br />
our 2003 report. The high quality environment enjoyed by residents<br />
and visitors alike has therefore not come about by accident but by the<br />
co-operative and increasingly proactive actions of the community.<br />
The combined effort of all of the policies, programmes and actions<br />
described in this report, representing the combined effort of the <strong>Taranaki</strong><br />
<strong>Regional</strong> <strong>Council</strong>, district councils, the Department of Conservation,<br />
the Ministry of Fisheries, community groups, iwi and landowners, is a<br />
signifi cant step along the path to sustainable management in <strong>Taranaki</strong>.<br />
The <strong>Council</strong>’s slogan of ‘working with people, caring for our environment’<br />
summarises the approach believed to be critical to successful<br />
environmental programmes in the future.
Photo: Rob Tucker<br />
CHAPTER 1<br />
INTRODUCTION<br />
7
8<br />
INTRODUCTION<br />
THE PURPOSE OF THE REPORT<br />
Under the Resource Management Act 1991 (RMA) regional councils like<br />
the <strong>Taranaki</strong> <strong>Regional</strong> <strong>Council</strong> are required to monitor the overall state of<br />
the environment of the region. Monitoring the state of the environment<br />
is important because it tells the <strong>Council</strong> and the wider community how<br />
successful we have been as a community in promoting the sole purpose<br />
of the RMA – the sustainable management of our natural and physical<br />
resources. While the report looks back on environmental trends and<br />
changes over the past fi ve to 10 years or more, its fundamental outlook<br />
is forward looking. It will help us answer such questions as:<br />
in what direction is our environment heading?;<br />
have our policies and programmes been effective in promoting<br />
sustainable management and will they continue to be effective in the<br />
future?; and<br />
what changes are required and what standard of environmental<br />
quality do we wish to see in <strong>Taranaki</strong>?<br />
The purpose of this report is therefore to provide high quality<br />
environmental information that is accessible and understandable to<br />
the <strong>Taranaki</strong> community at large, and upon which sound resource<br />
management decisions can be based in future.<br />
THE CONTENT OF THE REPORT<br />
The content of this report primarily refl ects the responsibilities that local<br />
government has under the RMA. Under the RMA regional councils are<br />
responsible for:<br />
the control and management of water, air and land (in relation to land<br />
for the purposes of soil conservation and the avoidance or mitigation<br />
of natural hazards);<br />
the control of the coastal marine area (in conjunction with the<br />
Minister of Conservation);<br />
the control of the discharge of contaminants into the environment;<br />
the control of the use of river and lake beds; and<br />
the establishment and implementation of policies and methods for<br />
maintaining indigenous biological diversity.<br />
District councils are responsible for:<br />
the integrated management of the effects of the use, development or<br />
protection of land such as development and subdivision;<br />
the avoidance or mitigation of natural hazards;<br />
the management of storing, using, disposing and transporting<br />
hazardous substances; and<br />
the maintenance of indigenous biological diversity.<br />
Objectives and policies for managing resource management issues and<br />
land use effects that are of regional signifi cance ie: issues of importance<br />
to the region as a whole are set out in the <strong>Regional</strong> Policy Statement for<br />
<strong>Taranaki</strong> 1994 and the reviewed Proposed <strong>Regional</strong> Policy Statement for<br />
TARANAKI – WHERE WE STAND<br />
<strong>Taranaki</strong> released in 2006. Some of these issues, such as those dealing<br />
with natural features and landscapes, historic heritage and amenity<br />
values and the natural character of the coast, arise from the effects<br />
of land use which are dealt with largely by district councils. However,<br />
the <strong>Taranaki</strong> <strong>Regional</strong> <strong>Council</strong> has adopted policy on these issues in<br />
accordance with its statutory functions.<br />
While Local Government manages a diverse range of responsibilities in<br />
relation to the environment as a whole, some aspects are managed by<br />
central government agencies such as the Ministry for Agriculture and<br />
Forestry, the Ministry of Fisheries and the Department of Conservation.<br />
Where information was easily obtained on environmental matters<br />
that are not strictly under the management of Local Government, such<br />
as the management of fi sh stocks, or changes in the condition of the<br />
conservation estate, this has been included in this report. However,<br />
the primary focus is reporting on the state of those aspects of the<br />
environment managed under the Resource Management Act.<br />
The report has 11 chapters as follows:<br />
1. INTRODUCTION<br />
The Introduction provides an outline of the purpose, content and<br />
organisation of the report.<br />
2. TARANAKI – THE PEOPLE AND THE PLACE<br />
This chapter contains a brief outline of the natural and physical features<br />
of the region, its human history and development and social and<br />
economic characteristics. Such information provides a context vital for<br />
understanding environmental conditions, pressures and responses in<br />
<strong>Taranaki</strong>.<br />
3. <strong>LAND</strong>, <strong>SOIL</strong> AND <strong>BIODIVERSITY</strong><br />
This chapter addresses soil erosion and soil health issues and the<br />
management of contaminated sites and hazardous substances.<br />
Biodiversity, or biological diversity, means the variability among living<br />
organisms and the ecological complexes of which they are a part. The<br />
biodiversity section of this chapter looks at biodiversity on land.<br />
4. FRESH WATER<br />
The chapter on fresh water considers a wide range of issues relating to<br />
fresh water, rivers and lakes. Reporting on water quality considers the<br />
effects of point and diffuse source discharges on water quality in rivers,<br />
streams and lakes and forms a major part of this chapter. Water quantity<br />
is addressed from the point of view of water fl ows, use and availability.<br />
Also reported on are groundwater quantity and quality. Fresh water<br />
biodiversity, in terms of ecosystems (rivers and wetlands), invertebrates<br />
and fi sh, is considered. Finally, public use and access to rivers and lakes<br />
are examined.
5. COASTAL AND MARINE ENVIRONMENT<br />
This chapter discusses coastal water quality, natural character of the<br />
coast, biodiversity of the coastal marine area and public use and access<br />
to the coast. Coastal erosion is addressed in the Natural Hazards chapter.<br />
6. ATMOSPHERE<br />
This chapter addresses overall air quality in <strong>Taranaki</strong> as well as issues<br />
surrounding greenhouse gases and climate change.<br />
7. <strong>LAND</strong>SCAPE, HERITAGE<br />
AND AMENITY VALUES<br />
This chapter looks at <strong>Taranaki</strong>’s natural landscape features, historic<br />
heritage resources such as our historic buildings and places and<br />
archaeological sites and amenity values – those things that make up or<br />
detract from an enjoyable and pleasant living environment.<br />
8. NATURAL HAZARDS<br />
The chapter on natural hazards reports on the main natural hazards in<br />
<strong>Taranaki</strong> – fl ooding, volcanic activity, earthquakes, high winds and land<br />
instability and erosion, including coastal erosion.<br />
9. WASTE<br />
This chapter looks at the situation with regard to waste and how it is<br />
managed in <strong>Taranaki</strong>.<br />
10.ENERGY<br />
This chapter looks at energy production, distribution and use in <strong>Taranaki</strong>.<br />
It looks at both renewable and non-renewable sources of energy.<br />
11.TOWARDS SUSTAINABLE DEVELOPMENT<br />
This concluding chapter draws together the underlying directions<br />
of and approaches to managing the environment described in the<br />
previous chapters and comments on what this means for sustainable<br />
development in future.<br />
HOW THE REPORT IS ORGANISED<br />
Each of the chapters 3 to 10 covers particular aspects of the<br />
environment, for example, land and soil, fresh water and the coastal and<br />
marine environment. Each chapter:<br />
begins with an opening scene-setting introduction which explains<br />
why this part of the environment is signifi cant for <strong>Taranaki</strong> people,<br />
and what the major pressures on the environment are;<br />
describes the current state of each aspect of the environment – core<br />
information is presented on the state of the environment and key<br />
trends or changes over time;<br />
outlines the management responses to environmental conditions now<br />
and in the future. Information is presented on what is being done now<br />
to address issues raised in the preceding text and what might be done<br />
in future;<br />
provides a summary of progress in implementing regional objectives<br />
and policies in relation to the chapter topic; and<br />
provides regional comparisons where relevant information is<br />
available. This information enables comparisons to be made between<br />
environmental conditions and trends in <strong>Taranaki</strong> and other parts of<br />
New Zealand.<br />
The organisation of the report follows the Pressure-State-Response<br />
model widely adopted overseas in state of the environment reporting.<br />
The report format is similar to that adopted for the <strong>Council</strong>’s previous<br />
state of the environment reports in 2003 and 1996. However, the format<br />
has been revised slightly by bringing to the front of each chapter, the<br />
values of and pressures on that aspect of the environment, that in<br />
previous reports were spread throughout each subsection of each<br />
chapter. This provides readers with a broad context for each chapter, for<br />
example on fresh water, before information is presented on the state or<br />
condition of the environment and management responses.<br />
PRESENTATION OF<br />
INFORMATION<br />
The <strong>Taranaki</strong> <strong>Regional</strong> <strong>Council</strong> has had the benefi t of another fi ve years<br />
of data collection and analysis since it last reported in 2003. In a number<br />
of cases data has now been collected over a suffi ciently long time<br />
period specifi cally for state of the environment monitoring purposes to<br />
enable statistically robust, long-term trend analysis to be undertaken.<br />
This was generally not the case for the <strong>Council</strong>’s 2003 report. Trend<br />
analysis can indicate with a high degree of certainty whether the data<br />
collected is showing an improvement or deterioration (or no change) in<br />
environmental conditions.<br />
The New Plymouth, Stratford and South <strong>Taranaki</strong> district councils have<br />
assisted in the preparation of this report by providing information on<br />
environmental conditions and trends for which they are responsible.<br />
Other agencies or organisations such as the Department of Conservation<br />
and Ministry of Fisheries have similarly assisted in this way. Dozens<br />
of businesses, industries, individuals and community groups have<br />
contributed information on their environmental work including<br />
information for case studies and information on their level of spending<br />
on environmental improvements over the last fi ve years.<br />
Information provided from all such sources has been a valuable addition<br />
to the report enabling the <strong>Council</strong> to present relevant and up-to-date<br />
information to the community. Those who have contributed to this report<br />
through providing information or in other ways are acknowledged at the<br />
beginning of the report.<br />
State of the Environment Report 2009<br />
9
10<br />
INTRODUCTION<br />
Every attempt has been made to present the information in a form<br />
that is understandable to the community. At the beginning of most<br />
chapters there is a box entitled ‘At a glance’. This provides a very short<br />
summary of the key points contained in the chapter. Throughout the<br />
chapters, information is provided with a reference (footnote) to reports<br />
or databases containing more detailed information for those who want<br />
it. Wherever possible, maps, diagrams and photographs have been used<br />
to demonstrate environmental conditions and trends. Case studies of<br />
particular programmes or examples are presented for added interest and<br />
to showcase practical examples of the <strong>Taranaki</strong> community ‘at work’ on<br />
protecting and enhancing the environment in which we live.<br />
SUMMARY REPORT<br />
Much of the information presented in the following report is of technical<br />
and scientifi c nature. Furthermore, the report has endeavoured to be<br />
comprehensive, covering environmental issues of interest or concern to<br />
the <strong>Taranaki</strong> community. It is therefore a relatively large document. The<br />
<strong>Council</strong> has also summarised the main fi ndings of the report to present<br />
to a wide audience including schools and community groups.<br />
WEBSITE<br />
The full report and summary document are available on the <strong>Taranaki</strong><br />
<strong>Regional</strong> <strong>Council</strong> website www.trc.govt.nz.<br />
CONTACTING THE<br />
TARANAKI REGIONAL COUNCIL<br />
If you wish to contact the <strong>Council</strong> on matters raised in the report you can<br />
do so by<br />
Phone: 06 765 7127 or 0800 736 222<br />
Fax: 06 765 5097<br />
Email: publications@trc.govt.nz<br />
by writing to the <strong>Council</strong> at:<br />
<strong>Taranaki</strong> <strong>Regional</strong> <strong>Council</strong><br />
Private Bag 713<br />
Stratford<br />
or by calling into the <strong>Council</strong> offi ces at 47 Cloten Road, Stratford.<br />
TARANAKI – WHERE WE STAND
Photo: Rob Tucker<br />
CHAPTER 2<br />
TARANAKI –<br />
THE PEOPLE AND<br />
THE PLACE<br />
11
12<br />
TARANAKI – THE PEOPLE & THE PLACE<br />
2.1 NATURAL AND<br />
PHYSICAL FEATURES<br />
The <strong>Taranaki</strong> region lies on the west coast of the North Island of New<br />
Zealand. It extends from the Mohakatino catchment in the north to<br />
the Wait _ otara catchment in the south and inland to the boundary of,<br />
but not including, the Whanganui catchment. The region extends 12<br />
nautical miles (approximately 22 km) offshore to include the waters of<br />
the territorial sea. There are three districts within the region: the New<br />
Plymouth, Stratford and South <strong>Taranaki</strong> districts (Figure 2.1).<br />
The land area of the <strong>Taranaki</strong> region comprises 723,610 ha, which is<br />
approximately 3% of New Zealand’s total land area.<br />
<strong>LAND</strong>FORMS, <strong>SOIL</strong>S AND RIVERS<br />
The <strong>Taranaki</strong> region consists of four distinct landforms, each of which<br />
requires a different type of environmental management (Figure 2.2).<br />
These are:<br />
the volcanic landscape and ring plain centred on Mount <strong>Taranaki</strong>;<br />
the dissected <strong>Taranaki</strong> hill country;<br />
the coastal and inland marine terraces of the North and South<br />
<strong>Taranaki</strong> coast; and<br />
the coastal and marine environment.<br />
Many rivers and streams fl ow across the landscape. Of these, some 530 are<br />
named. The main rivers and streams in <strong>Taranaki</strong> are shown in Figure 2.3.<br />
Figure 2.1: The <strong>Taranaki</strong> region: location and local government boundaries.<br />
TARANAKI – WHERE WE STAND<br />
Figure 2.2: Landforms of the <strong>Taranaki</strong> region.<br />
Figure 2.3: Main rivers and streams of the <strong>Taranaki</strong> region.
VOLCANIC <strong>LAND</strong>SCAPE AND RING PLAIN<br />
The volcanic cone of Mount <strong>Taranaki</strong> (2,518 m) dominates the <strong>Taranaki</strong><br />
landscape. It is the most recent of a number of andesitic volcanoes that<br />
have developed in western <strong>Taranaki</strong> over the past two million years.<br />
The Sugar Loaf Islands, Pouakai and Kaitake ranges are the remnants<br />
of older volcanoes which are now extinct. Mount <strong>Taranaki</strong> is, however,<br />
still considered (in geological terms) to be active, even though it has not<br />
erupted in the past 250 years.<br />
Over the past 50,000 years the cone of Mount <strong>Taranaki</strong> has collapsed<br />
intermittently causing very large and mobile debris avalanches and<br />
lahars (mudfl ows) to sweep down the mountain. As each volcanic cone<br />
was built up by successive eruptions, natural erosion has stripped away<br />
the volcanic debris and redistributed it in a ‘ring’ around the volcano<br />
base creating the <strong>Taranaki</strong> ring plain.<br />
The soils of the ring plain are mostly deep, free-draining, fertile, volcanic<br />
ash soils known as yellow-brown loams. These soils support intensive<br />
pastoral farming, particularly dairying, which is most intensive on the<br />
fl atter land in South <strong>Taranaki</strong>.<br />
Over 300 rivers and streams fl ow from the fl anks of Mount <strong>Taranaki</strong><br />
in a distinctive radial pattern. These streams are characterised by<br />
short narrow catchments of steep gradient, normally well incised into<br />
the volcanic ash and debris fl ow material of the ring plain. Egmont<br />
National Park acts as a huge reservoir, supplying a steady fl ow of<br />
water to the ring plain streams, even during prolonged dry periods, as<br />
well as maintaining high water quality in those streams. The rivers<br />
that fl ow from the mountain are extensively used by the community<br />
for agriculture, industry and community water supplies, and for a wide<br />
range of recreational purposes.<br />
Mount <strong>Taranaki</strong> dominates the <strong>Taranaki</strong> landscape.<br />
HILL COUNTRY<br />
The <strong>Taranaki</strong> hill country lies to the east of the ring plain. The inland<br />
terraces and frontal hill country are of strongly rolling topography<br />
and largely retain the volcanic ash soils, while the inland hill country<br />
is steeper and more deeply dissected. The underlying geology of the<br />
<strong>Taranaki</strong> hill country is not volcanic, but consists of older sedimentary<br />
rocks – mudstones, siltstones and sandstones known locally as ‘papa’.<br />
The soils of the inland hill country are mostly shallow soils that have<br />
developed on steep, relatively unstable slopes. The composition and<br />
Rob Tucker<br />
Eastern hill country from the Mangamingi Saddle.<br />
depth of soils are extremely variable, and often erosion has prevented<br />
the development of a mature soil. While the hill country is more prone<br />
to erosion it can support both pastoral farming and commercial forestry<br />
when managed in accordance with the physical limitations of the land.<br />
The rivers of the hill country have short tributaries contained by narrow<br />
valleys. In general, these rivers carry high sediment loads.<br />
MARINE TERRACES<br />
Marine terraces raised by tectonic activity extend along the North and<br />
South <strong>Taranaki</strong> coasts. In the far north only a narrow strip of coastal<br />
plain is preserved, but between Waitara and Lepperton in the north and<br />
from H _ awera south, the terraces extend up to 20 km inland. Along the<br />
coastline, cliffs ranging from three to 60 m in height have formed from<br />
high energy wave action. In the Whitecliffs area of North <strong>Taranaki</strong>, some<br />
cliffs are over 200 m high.<br />
The volcanic deposits on the old terrace surfaces are deep and, because<br />
they are further from the volcanic centre, are fi nely textured. The soils of<br />
these areas are classic volcanic loams and are among the most versatile<br />
and productive in the region.<br />
Sand accumulation is concentrated near river mouths, particularly along<br />
the southern coastline, where dunefi elds extend inland for several<br />
kilometres. Less than 2% of the <strong>Taranaki</strong> region is classifi ed as coastal<br />
sand country. Because of their weak structure these soils are susceptible<br />
to wind erosion if the vegetation cover is disturbed.<br />
COASTAL ENVIRONMENT<br />
The <strong>Taranaki</strong> coastline is exposed to the west, and as a consequence,<br />
high energy wave and wind conditions dominate the coastal<br />
environment. There are few areas of sheltered water beyond the<br />
estuaries, such as those of the Tongaporutu, Waitara and P _ atea rivers,<br />
and the confi nes of Port <strong>Taranaki</strong>.<br />
Almost the entire <strong>Taranaki</strong> coastline is subject to varying rates of erosion<br />
from waves and wind. This has resulted in a predominantly cliffed<br />
coastline, with the western coast characterised by boulder cliffs and<br />
offshore reefs derived from erosion of lahar and other volcanic material.<br />
In North and South <strong>Taranaki</strong>, erosion of marine sediments has resulted<br />
in a coastline of almost continuous papa cliffs and the famous black<br />
sand beaches.<br />
Rob Tucker<br />
State of the Environment Report 2009<br />
13
14<br />
TARANAKI – THE PEOPLE & THE PLACE<br />
Rugged North <strong>Taranaki</strong> coast and marine terrace.<br />
CLIMATE<br />
<strong>Taranaki</strong>’s climate is determined by its westerly position, its mid-latitude<br />
location, and its topography. <strong>Taranaki</strong> lies in the path of weather<br />
systems moving east from the Tasman Sea. The region’s climate is<br />
generally sunny and windy, with moderate temperatures and regular<br />
rainfall throughout the year.<br />
Rainfall varies markedly throughout the region, ranging from less than<br />
1,400 mm in the coastal areas to in excess of 8,000 mm at the summit<br />
of Mount <strong>Taranaki</strong>. Rainfall also increases with elevation in the <strong>Taranaki</strong><br />
hill country (Figure 2.4).<br />
<strong>Taranaki</strong> may experience heavy rainfall events, particularly from warm,<br />
moist westerly and northerly air masses moving on to the region. In<br />
the past six years 2002-03 to 2007-08, <strong>Taranaki</strong> received 102 ‘special<br />
1 <strong>Taranaki</strong> Weather Services, 2008.<br />
TARANAKI – WHERE WE STAND<br />
weather warnings’ from the Meteorological Service, mostly for heavy<br />
rain. Signifi cant heavy rains caused fl ooding in Wait _ otara township<br />
in February 2004. Other heavy rainfall events in the Wait _ otara and<br />
neighbouring catchments in July and October 2006 threatened farmland<br />
and roading infrastructure.<br />
Very heavy rain in New Plymouth and surrounding areas in May 2007<br />
caused localised fl ooding, and heavy rain and fl ooding in April 2008<br />
caused damage to rural properties, bridges and roads in coastal<br />
<strong>Taranaki</strong>. Generally however, heavy rain does not result in major fl ooding<br />
or property damage as the region’s river catchment networks are well<br />
adapted to periodic heavy rain events.<br />
The mean (average) daily temperatures for <strong>Taranaki</strong> in January and July<br />
are shown in Figure 2.5 and Figure 2.6.<br />
Minimum temperatures are lower at inland locations than at coastal<br />
locations due to higher elevations inland and their greater distance<br />
from the sea - with its moderating effect on extreme temperatures. At<br />
sheltered inland sites the daily temperature variation is larger than in<br />
coastal areas.<br />
<strong>Taranaki</strong>’s generally moderate summer and winter temperatures are<br />
combined with average to high sunshine hours. Average sunshine hours<br />
at New Plymouth Airport total 2,173 1 , which are higher than many other<br />
New Zealand centres. Centres with higher sunshine hours than New<br />
Plymouth include Tauranga, Nelson and Blenheim.<br />
<strong>Taranaki</strong> is windy, but wind strength varies greatly because of the range<br />
of topographical features in the region which infl uence the extent to<br />
which different areas are exposed (Figure 2.7).<br />
Figure 2.4: Mean annual rainfall (mm). Figure 2.5: Mean temperature (°C), January.<br />
Rob Tucker<br />
Source: NIWA.<br />
Source: NIWA.
Westerly winds generally predominate in spring and summer, bringing<br />
unsettled and showery weather. South-easterlies are often predominant<br />
in coastal and exposed areas and bring generally fi ne weather in <strong>Taranaki</strong><br />
due to the sheltering effect of the ranges to the east. About 40% of New<br />
Plymouth’s rain comes with winds from the north or north-east, and high<br />
rainfalls about Mount <strong>Taranaki</strong> are common. However, much of South<br />
<strong>Taranaki</strong> may remain relatively sheltered, with scattered showers or dry<br />
conditions. South-westerly winds are common in the cooler months.<br />
The 2007 year produced a number of notable weather patterns or events<br />
- being drier, warmer and sunnier than usual. Total rainfall at New<br />
Plymouth airport was 1,051 mm, 27% below normal, and the lowest<br />
annual total since offi cial records started there in 1944. Stratford’s total<br />
rainfall of 1,501 mm in 2007 was also the lowest annual total since<br />
records began in 1961 2 . At the same time, sunshine hours were 4.5%<br />
above average totalling 2,271 hours at New Plymouth Airport.<br />
Across the region, the summer of 2007-08 was one of the driest,<br />
warmest and sunniest summers on record. It developed from a<br />
strengthening La Nina weather pattern evident from September 2007<br />
onwards, with increasingly dry anticyclonic conditions and north-easterly<br />
winds. The temperature in New Plymouth on Sunday 20 January 2008<br />
was 30.2°C, one of the highest recorded in 114 years, and 3.7°C short of<br />
the record 33.9°C in January 1865 3 .<br />
The average daily maximum temperature in New Plymouth during<br />
January 2008 was 24°C, the highest average since 1911.<br />
In the four-month period from 1 November 2007 to 29 February 2008, all<br />
<strong>Taranaki</strong> <strong>Regional</strong> <strong>Council</strong> rainfall recorder stations recorded rainfall levels<br />
at well below average. Areas south and east of Mount <strong>Taranaki</strong>, and on<br />
2 NIWA, 2008. Climate Summary for 2007.<br />
3 <strong>Taranaki</strong> Daily News, March 7 2008.<br />
4 <strong>Taranaki</strong> <strong>Regional</strong> <strong>Council</strong>, 2008. Recount April 2008 No. 64.<br />
5 NIWA, 2008. Climate Summary for March 2008.<br />
6 Dominion Post, April 3 2008, page C8.<br />
7 NIWA, 2008. Climate Summary for 2007.<br />
the coast, had rainfalls ranging from 42% to 59% of average over the four<br />
month period 4 . Signifi cant or severe soil moisture defi cits developed in<br />
many parts of the region, particularly in South <strong>Taranaki</strong>, which persisted<br />
into March 2008 5 . The prolonged dry spell, the most severe in 30 years,<br />
led to the declaration of drought conditions over a large part of the region.<br />
Estimates of the fi nancial impact of the 2007-08 drought on the region’s<br />
economy range from $100 million to $150 million 6 .<br />
<strong>Taranaki</strong> may occasionally experience high winds or tornadoes. The<br />
most signifi cant event in recent years was the swarm of tornadoes that<br />
swept across <strong>Taranaki</strong> on 4 and 5 July 2007, the fi rst of which struck<br />
New Plymouth on 4 July 2007. Multiple damaging tornadoes affected<br />
coastal and inland <strong>Taranaki</strong> on 5 July 2007, resulting in a state of<br />
emergency being declared. Damage from the tornadoes was estimated<br />
at $7 million. The National Institute of Water and Atmosphere’s (NIWA)<br />
climate summary for 2007 records the <strong>Taranaki</strong> tornadoes as New<br />
Zealand’s most signifi cant extreme weather event of the year 7 .<br />
Figure 2.6: Mean temperature (°C), July. Figure 2.7: Wind roses for fi ve sites in <strong>Taranaki</strong>.<br />
Source: NIWA.<br />
Near the summit, Mount <strong>Taranaki</strong>.<br />
Rob Tucker<br />
State of the Environment Report 2009<br />
15
16<br />
TARANAKI – THE PEOPLE & THE PLACE<br />
<strong>LAND</strong> COVER<br />
High sunshine hours, coupled with abundant moisture and mild<br />
temperatures, foster vegetation growth throughout the region. The<br />
climate and subsoils are suited to high producing pastures, with about<br />
60% of the region used for high intensity pastoral farming.<br />
Approximately 40% of the region is in indigenous forest and shrubland,<br />
mostly within Egmont National Park and areas of the inland hill country.<br />
2.2 HISTORY AND DEVELOPMENT<br />
The human occupation of <strong>Taranaki</strong> dates back to at least 800 AD, which<br />
is when settlement by ancestors of the present M _ aori people is thought<br />
to have begun. Signifi cant populations settled in coastal areas between<br />
Urenui and Waitara. Eight iwi are currently recognised in <strong>Taranaki</strong>.<br />
These are Ng _ ati Tama, Ng _ ati Mutunga, Te _ Atiawa, Ng _ ati Maru, <strong>Taranaki</strong>,<br />
Ng _ a Ruahine, Ng _ ati Ruanui and Ng _ a Rauru.<br />
European settlers began arriving from the early 1840s. In 1841, the<br />
New Zealand Company purchased a large block of land in what was to<br />
become New Plymouth. Settlement was initially concentrated near the<br />
coast and land was cleared for cropping and small-scale mixed livestock<br />
farming.<br />
Increasing European settlement pressures led to disputes over land<br />
ownership and eventually to the <strong>Taranaki</strong> Wars of the 1860s. In<br />
response to M _ aori ‘rebellion’ against the Crown, the Government<br />
confi scated large tracts of land under the terms of the New Zealand<br />
Settlements Act 1863.<br />
From the 1870s, after hostilities had ceased, settlement increased<br />
rapidly and began to encroach inland. Coastal areas were easily cleared<br />
of the light cover of tutu, fl ax, toetoe and fern and converted to grazing<br />
land. Indigenous forest cover further inland was also cleared and under<br />
ideal physical and climatic conditions, dairying became the dominant<br />
land use. Surplus dairy products were initially used for local bartering<br />
but with the development of refrigerated shipping and new export<br />
markets in the 1880s, milk was collected from farms and processed in<br />
bulk at creameries and factories scattered throughout the region. By<br />
the end of the nineteenth century <strong>Taranaki</strong> was developing into a highly<br />
productive agricultural province.<br />
Agriculture, particularly dairying (and to a lesser extent, sheep and<br />
beef farming), was extended and intensifi ed during the fi rst half of<br />
the twentieth century, and continues to dominate the local economy.<br />
However, in the second half of the twentieth century, oil and gas<br />
exploration and development became increasingly important.<br />
Table 2.1 Population changes in <strong>Taranaki</strong> 1996-2006 8 .<br />
8 www.stats.govt.nz 2006 Census of Population and Dwellings, Final Counts.<br />
TARANAKI – WHERE WE STAND<br />
Children at play, Ng _ amotu Beach.<br />
The K _ apuni gas fi eld was discovered in 1959 and the much larger<br />
offshore M _ aui fi eld was discovered in 1969. These discoveries led to<br />
the development of major petrochemical industries in the early 1980s,<br />
which continue to operate today. <strong>Taranaki</strong> remains New Zealand’s only<br />
commercially producing oil and gas area and an area of continuing<br />
exploration activity.<br />
2.3 THE TARANAKI COMMUNITY<br />
<strong>Taranaki</strong>’s population was 104,127 (Table 2.1) at the March 2006<br />
census. This represents a 1.2% increase in population since 2001. This<br />
increase in population reversed a 3.5% decline in population between<br />
1996 and 2001, refl ecting buoyant economic conditions between 2001<br />
and 2006. Over the past 10 years however, the population of <strong>Taranaki</strong><br />
has decreased slightly from 106,590 to 104,127 (Table 2.1). <strong>Taranaki</strong><br />
accounts for 2.6% of New Zealand’s population.<br />
Population changes have also varied within the region. The most notable<br />
feature has been the continued concentration of population in the New<br />
Plymouth District, which in 2006 contained approximately 66% of the<br />
region’s total population. New Plymouth District’s population increased<br />
by 3.5% during the 2001-2006 period, after experiencing a population<br />
decrease over the previous fi ve years. The 2006 census results show<br />
that Stratford District had maintained its 2001 census night population,<br />
after experiencing a 6.9% decline in population between 1996 and<br />
2001. South <strong>Taranaki</strong> District experienced a 3.8% decrease in population<br />
between 2001 and 2006 which followed a 5.5% decrease between 1996<br />
and 2001 (Table 2.1).<br />
The general trend has been for a decrease in the population of smaller<br />
rural towns and an increase in concentration of population in North<br />
<strong>Taranaki</strong>. This is the result of several factors, including reduced<br />
Total population<br />
Local authority<br />
1996 2001 % change 1996-2001 2006 % change 2001-2006<br />
New Plymouth District 68,112 66,603 -2.2 68,901 3.5%<br />
Stratford District 9,543 8,883 -6.9 8,889 0.0%<br />
South <strong>Taranaki</strong> District 29,133 27,537 -5.5 26,484 -3.8%<br />
<strong>Taranaki</strong> region 106,590 102,858 -3.5 104,127 1.2%<br />
Rob Tucker
employment opportunities in rural areas and small towns through farm<br />
amalgamations, closure of dairy processing factories and reduced<br />
employment in servicing and other industries, combined with land<br />
diversifi cation, lifestyle and retirement opportunities in North <strong>Taranaki</strong>.<br />
The <strong>Taranaki</strong> population is both older and younger than the national<br />
average, with a higher proportion of children under 15 years of age<br />
(21.8%) and adults over 65 years of age (14.8%). This may be due to<br />
lifestyle factors, with <strong>Taranaki</strong> being seen as an attractive and desirable<br />
area for family living with good facilities and amenities and affordable<br />
housing. The proportion of those in the 20–29 years age group is also<br />
lower than the national average (10.5% compared to 12.7% nationally)<br />
and may refl ect young adults leaving the region for further tertiary<br />
education or employment opportunities.<br />
<strong>Taranaki</strong>’s population is less ethnically diverse than the population of<br />
New Zealand as a whole. At the 2006 census 77% of <strong>Taranaki</strong> residents<br />
indicated that they belonged to the European ethnic group compared<br />
with 67.6% for New Zealand as a whole.<br />
The percentage of M _ aori within the <strong>Taranaki</strong> population continues<br />
to increase - from 11.9% in 1991, 14.7% in 2001 and 15.8% in 2006.<br />
Nationally, M _ aori make up 14.6% of the population. Those belonging<br />
to Pacifi c (1.4%) and Asian (2.2%) ethnic groups are much lower than<br />
for New Zealand as a whole (6.9% and 9.2%, respectively). Those in<br />
<strong>Taranaki</strong> who indicated their ethnicity as New Zealander totalled 13.6%<br />
compared to 11.1% nationally 9 .<br />
2.4 THE TARANAKI ECONOMY<br />
A notable feature of the <strong>Taranaki</strong> region is its reliance on the region’s<br />
natural and physical resources for its economic and social well-being.<br />
Farming and other land-based activities continue to play a prominent<br />
role in employment and wealth creation while the oil and gas industry<br />
is a signifi cant contributor to the regional economy. Since 2004,<br />
economic growth in <strong>Taranaki</strong> has been consistently above the national<br />
growth rate with the rate of growth slowing from early 2007. From 2004<br />
to 2006 <strong>Taranaki</strong> recorded among the highest rates of economic growth<br />
in the country 10 .<br />
Overall, <strong>Taranaki</strong> makes up 2.5% of national employment and<br />
contributes 2.8% of National Gross Domestic Product (GDP) 11 .<br />
Fonterra’s milk processing site at Whareroa, near H _ awera.<br />
9 Statistics New Zealand, 2008. QuickStats about <strong>Taranaki</strong> Region.<br />
10 National Bank <strong>Regional</strong> Trend Reports.<br />
11 Business and Economic Research Ltd, 2007. <strong>Taranaki</strong> Industry Projections 2006-2026. Report to Venture <strong>Taranaki</strong>.<br />
12 Business and Economic Research Ltd, 2007. <strong>Taranaki</strong> Industry Projections 2006-2026. Report to Venture <strong>Taranaki</strong>.<br />
13 Livestock Improvement Corporation, 2007. 2006/2007 dairy statistics.<br />
14 Business and Economic Research Ltd, 2007. <strong>Taranaki</strong> Industry Projections 2006-2026. Report to Venture <strong>Taranaki</strong>.<br />
15 Statistics, New Zealand, 2004. 2002 Agricultural Production Census.<br />
Rob Tucker<br />
Modern farm dairy.<br />
AGRICULTURE AND FORESTRY<br />
Over 16% of <strong>Taranaki</strong>’s full-time equivalent labour force is employed in<br />
agriculture, compared with 7.5% nationally 12 .<br />
Dairying dominates farming in <strong>Taranaki</strong>, particularly on the ring plain.<br />
There are 1,870 dairy herds in <strong>Taranaki</strong> – 16% of all New Zealand dairy<br />
herds with 480,000 dairy cows making up 12.2% of all New Zealand’s<br />
dairy cows 13 . Milk processing in <strong>Taranaki</strong> is now concentrated at one<br />
site – Fonterra’s Whareroa site near H _ awera. At peak production this<br />
facility processes over 14 million litres of milk per day. Other major<br />
agricultural processing industries are based at K _ apuni (Fonterra K _ apuni),<br />
and Eltham (Mainland Products and Pastoral Foods). In addition to direct<br />
farm income from milk production, the added value resulting from the<br />
processing of milk, whey and cheese manufacturing is a signifi cant<br />
contributor to employment.<br />
Sheep and beef farming, concentrated in the hill country, has an<br />
important role in the regional economy. Approximately 880 sheep and<br />
beef farms in <strong>Taranaki</strong> stock approximately 679,000 sheep and 131,000<br />
beef cattle. Meat processing works are located at Eltham (Riverlands<br />
Eltham Ltd), H _ awera and Wait _ otara (Silver Fern Farms Ltd, formerly<br />
PPCS).<br />
Overall, agriculture and associated food processing industries contribute<br />
almost 20% to regional GDP generating around $850 million in GDP<br />
in 2006 14 . The future economic outlook for the agriculture and forestry<br />
sectors is positive with rising demands from developing economies<br />
overseas for food and forestry products and increasing global food prices.<br />
Exotic forest plantations continue to expand. The region has a suitable<br />
climate, good forestry sites and a well-established roading system and<br />
port. There has been a marked increase in planted production forestry –<br />
from 9,700 ha in 1990 to an estimated 19,350 ha in 2002 15 .<br />
PIG AND POULTRY FARMING<br />
<strong>Taranaki</strong> has some 25 piggeries and 46 poultry farms. The number of pig<br />
farms has declined from 35 in 1996. Most pig farming is concentrated in<br />
the New Plymouth district.<br />
<strong>Taranaki</strong> has a signifi cant and expanding poultry industry and is the<br />
major poultry meat producing region in New Zealand involving all<br />
Rob Tucker<br />
State of the Environment Report 2009<br />
17
18<br />
TARANAKI – THE PEOPLE & THE PLACE<br />
Poultry production operation, Bell Block.<br />
aspects of the industry from breeding and growing to production<br />
and distribution. Operations are concentrated in North <strong>Taranaki</strong> with<br />
the major processing facility at Bell Block. The poultry industry has<br />
undergone signifi cant expansion in <strong>Taranaki</strong> in the past 10 years with<br />
the closure of Tegel production operations at Te Horo near Levin and<br />
their shift to <strong>Taranaki</strong> and Auckland in 1998.<br />
HORTICULTURE AND CROPPING<br />
Horticulture and cropping are not signifi cant land uses in <strong>Taranaki</strong>.<br />
The crops grown include fl owers, asparagus and roses. Maize crops (a<br />
supplementary feed stock for dairy cattle) have expanded signifi cantly.<br />
<strong>Taranaki</strong> is self-suffi cient in most crops. Small local growers produce<br />
apples, tamarillos, kiwifruit, feijoas, berryfruits, some citrus fruits,<br />
strawberries and tomatoes for both the local and export markets.<br />
OIL AND GAS INDUSTRY<br />
The <strong>Taranaki</strong> Basin is currently New Zealand’s only commercial<br />
hydrocarbon producing area. The onshore K _ apuni and the offshore M _ aui<br />
fi elds make up the major part of New Zealand’s natural gas resources.<br />
Figure 2.8 shows the location of the major oil and gas fi elds in <strong>Taranaki</strong>.<br />
The K _ apuni and M _ aui gas fi elds are the oldest of the currently producing<br />
oil and gas fi elds. In the past 10 years new oil or gas fi elds such as the<br />
Mangahewa, Maari, Rimu, Kauri, T _ u _ ı and Pohokura fi elds have been<br />
The _ Oaonui Production Station processes gas from the Maui fi eld.<br />
16 www.crownminerals.govt.nz.<br />
17 <strong>Taranaki</strong> Daily News, 26 April 2008, page 7.<br />
TARANAKI – WHERE WE STAND<br />
Rob Tucker<br />
Rob Tucker<br />
Figure 2.8 Main oil and gas fi elds in <strong>Taranaki</strong>.<br />
discovered. The Kupe fi eld, fi rst discovered in 1986, is being developed<br />
with gas expected to fl ow from the fi eld by the middle of 2009.<br />
By world standards, however, <strong>Taranaki</strong> is under-explored and exploration<br />
interest in the region remains high. There is also considered to be<br />
potential for very large oil and gas reserves in deep water further off the<br />
<strong>Taranaki</strong> coast 16,17 .<br />
The presence of oil and gas in the region has given rise to further<br />
‘downstream’ industries involved in the processing, distribution, use and<br />
export of hydrocarbons. Production stations or gas treatment plants are<br />
found at Oaonui, K _ apuni, Waihapa, Rimu, Pohukura, Kaimiro and the<br />
The production vessel Umaroa transfers oil from the Tui fi eld.<br />
Rob Tucker
McKee oil and gas fi elds. Two methanol plants are located at Motunui<br />
and the Waitara Valley respectively. An ammonia urea plant is located<br />
at K _ apuni, a UF resin plant at Waitara and gas-fi red power stations at<br />
Stratford and New Plymouth.<br />
The oil and gas industry makes a signifi cant contribution to the<br />
<strong>Taranaki</strong> economy. In the year ended March 2006, the oil and gas<br />
industry employed 817 fulltime workers (1.8% of the region’s fulltime<br />
employment) and generated $741 million - almost 17% of the region’s<br />
GDP 18 . The proportion of GDP accounted for by the mining sector (oil and<br />
gas) is unique in New Zealand. When spin offs to other industries such<br />
as engineering and construction are added, the contribution to regional<br />
GDP exceeds $1 billion and 3,000 jobs 19 .<br />
MANUFACTURING<br />
<strong>Taranaki</strong> has a relatively small but distinctive manufacturing base.<br />
The region has also developed a national and international reputation<br />
for its expertise in food processing, particularly of dairy products and<br />
speciality dough production. Further, the special servicing needs of the<br />
dairy and petrochemical sectors (and to a lesser extent the meat, energy,<br />
industrial, chemical and timber processing sectors) have contributed<br />
to the development of both heavy and light engineering industries. In<br />
total, manufacturing (including food processing), engineering and other<br />
manufacturing (chemical, wood and paper products, textiles, printing<br />
and publishing etc.) provide over 18% of all employment in <strong>Taranaki</strong>.<br />
CONSTRUCTION<br />
Construction activity, as shown by the number of building consents<br />
issued by the three district councils, and the value of the building<br />
work done, provides an indication of general economic conditions and<br />
potential pressures on the environment. Table 2.2 shows the number<br />
and value of building consents issued in the New Plymouth, Stratford<br />
and South <strong>Taranaki</strong> district council areas between December 2003 and<br />
December 2007.<br />
Table 2.2 shows that the number and value of building consents issued<br />
in the fi ve years between 2003 and 2007 was highest in the New<br />
Plymouth District with the total value of building consents issued being<br />
over $800 million, and averaging over $160 million per year. All three<br />
district council areas, however, have shown signifi cant increases in<br />
both the number and value of building consents issued since 2003.<br />
Furthermore there have been substantial increases in the number and<br />
Table 2.2 Number and value of building consents 2003 - 2007 20 .<br />
18 Business and Economic Research Ltd, 2007. <strong>Taranaki</strong> Industry Projections 2006-2026. Report to Venture <strong>Taranaki</strong>.<br />
19 <strong>Taranaki</strong> Daily News, 12 September 2007, page 6.<br />
20 Statistics New Zealand.<br />
21 <strong>Taranaki</strong> <strong>Regional</strong> <strong>Council</strong>, 2003. <strong>Taranaki</strong> - Our Place, Our Future. Report on the State of the <strong>Taranaki</strong> Environment - 2003.<br />
value of building consents issued in all district council areas in the past<br />
fi ve years compared to the previous fi ve years 21 .<br />
The increases seen in the past fi ve years have been the result of very<br />
strong economic growth and business and consumer confi dence which<br />
have seen consistent increases in both residential and non-residential<br />
building activity. In addition to new residential development throughout<br />
the region, major building work in New Plymouth has been associated<br />
with the new large-scale retailing development in the Waiwhakaiho<br />
Valley and industrial developments in Bell Block and the Mangati<br />
catchment. New industrial developments have occurred in the southern<br />
and northern part of the Stratford township while considerable<br />
expansion of commercial big-box retail has occurred along Glover Road<br />
in H _ awera.<br />
2003 2004 2005 2006 2007<br />
No. $Value<br />
(000)<br />
No. $Value<br />
(000)<br />
Boat building, Fitzroy Yachts New Plymouth.<br />
New residential development, Bell Block.<br />
No. $Value<br />
(000)<br />
No. $Value<br />
(000)<br />
No. $Value<br />
(000)<br />
New Plymouth 1317 98,100 1566 137,500 1648 165,200 1741 213,200 1635 193,100<br />
Stratford 167 9,600 198 11,900 226 13,600 235 16,100 277 21,500<br />
South <strong>Taranaki</strong> 459 27,000 623 62,100 625 50,500 640 52,500 683 55,400<br />
Note: data comprises residential building consents for new dwelling units and alterations to existing dwellings and non-residential building consents for construction<br />
and alteration of non-residential buildings. All fi gures are to December of each year.<br />
Rob Tucker<br />
Rob Tucker<br />
State of the Environment Report 2009<br />
19
20<br />
TARANAKI – THE PEOPLE & THE PLACE<br />
Table 2.3 Number of subdivision consents 2003 -2007 22 .<br />
District 2003 2004 2005 2006 2007<br />
New Plymouth District 208 261 313 295 301<br />
Stratford District 32 36 59 65 65<br />
South <strong>Taranaki</strong> District 52 102 121 107 142<br />
There have also been new house and farm dairy construction throughout<br />
<strong>Taranaki</strong> as a result of continuing farm amalgamations, and expenditure<br />
associated with energy developments. Of all industry sectors in the<br />
region, the construction sector has experienced the fastest employment<br />
growth (in percentage terms) over the past fi ve years with an increase in<br />
employment of 8.4% per annum 23 .<br />
The number of subdivision consents issued also provides an indicator of<br />
economic activity and development pressures. Table 2.3 shows that the<br />
number of subdivision consents issued by the three district councils has<br />
increased signifi cantly since 2003.<br />
The New Plymouth District has experienced relatively high levels of<br />
greenfi elds residential development in the past fi ve years, particularly in<br />
Bell Block, and around the periphery of New Plymouth in the Highlands<br />
Park and Barrett Road areas. The rate of greenfi elds development has<br />
slowed since 2006, with subdivisions becoming more predominant for<br />
infi ll housing or small lot, rural lifestyle developments 24 .<br />
Subdivision in Stratford and South <strong>Taranaki</strong> districts in recent years has<br />
been running at levels more than double that seen in the late 1990s<br />
and early 2000s. In Stratford the increase has been mainly due to<br />
lifestyle block development initially and subsequently infi ll residential<br />
development, as demand for residential property and associated house<br />
prices have increased 25 . In South <strong>Taranaki</strong> District, infi ll subdivision has<br />
occurred throughout H _ awera with new multi-lot development occurring<br />
to the west and north of the town. There has also been an increase in<br />
subdivision of coastal land, particularly in the north of the district 26 .<br />
Retail development in the Waiwhakaiho Valley, New Plymouth.<br />
22 New Plymouth, Stratford and South <strong>Taranaki</strong> district councils.<br />
23 Business and Economic Research Ltd, 2007. <strong>Taranaki</strong> Industry Projections 2006-2026. Report to Venture <strong>Taranaki</strong>.<br />
24 New Plymouth District <strong>Council</strong>.<br />
25 Stratford District <strong>Council</strong>.<br />
26 South <strong>Taranaki</strong> District <strong>Council</strong>.<br />
27 Business and Economic Research Ltd, 2007. <strong>Taranaki</strong> Industry Projections 2006-2016. Report to Venture <strong>Taranaki</strong> .<br />
TARANAKI – WHERE WE STAND<br />
Rob Tucker<br />
RETAIL AND SERVICE INDUSTRIES<br />
Wholesale and retail industries are the second largest employer in<br />
<strong>Taranaki</strong>, after agriculture, employing 15% of full-time employees in<br />
<strong>Taranaki</strong>. Other signifi cant employers are business, fi nance and property<br />
services - the third largest employer group (11.6%), and health and<br />
community services (8.1%) 27 .<br />
Business, fi nance and property services and wholesale and retail<br />
trade are the largest contributors to regional GDP (16.4% and 10.5%,<br />
respectively) after mining (oil and gas).<br />
Smaller service industries such as hospitality and cultural and<br />
recreational services, which are important in the tourism industry, have<br />
shown strong growth in employment over the past fi ve years 28 .<br />
TOURISM AND EVENTS<br />
Tourism is playing an increasingly important role in the <strong>Taranaki</strong><br />
economy. The region’s mountain, coast, surf, forests, gardens and parks,<br />
festivals and events are attracting growing numbers of visitors. In 2007<br />
there were 274, 738 visitor arrivals 29 in <strong>Taranaki</strong>, an increase of 5.6%<br />
over 2006. These visitors spent a total of 556,660 guest nights in the<br />
region, an increase of 3.9% over 2006 30 . <strong>Taranaki</strong> performed better than<br />
the national average in 2007 in both guest nights and visitor numbers.<br />
Domestic visitors (from within New Zealand) account for approximately<br />
85% of total guest nights spent in the region.<br />
The <strong>Taranaki</strong> region is also becoming increasingly popular and<br />
recognised for organised cultural, sporting and other events. These<br />
New Plymouth hosts the international WOMAD festival every year.<br />
Rob Tucker
Mount <strong>Taranaki</strong> attracts visitors throughout the year.<br />
include the Festival of Lights, Rhododendron and Fringe garden festivals,<br />
the World of Music, Arts and Dance (WOMAD) festival, the biennial<br />
<strong>Taranaki</strong> International Festival of the Arts, Parihaka International Peace<br />
festival, Paepae in the Park, Americarna festival, Urenui Rodeo, the<br />
Around the Mountain Cycle Challenge, the <strong>Taranaki</strong> Wine and Food<br />
Festival, Whangamomona Republic Day, various exhibitions at Puke<br />
Ariki and the Govett-Brewster Art Gallery, national and international<br />
music concerts and numerous sports events including the International<br />
Triathlon Union (ITU).<br />
The various events bring large numbers of visitors to the region with<br />
signifi cant benefi ts for the local economy. For example, the WOMAD<br />
festival, held annually for the fi rst time in 2008, attracted more than<br />
43,700 festival-goers over three days with 66% coming from out of<br />
town 31 . The 2008 festival had a direct economic impact of $2.89 million<br />
and an estimated fl ow-on economic impact of $6.43 million for the region.<br />
2.5 TANGATA WHENUA<br />
There are eight iwi whose rohe or tribal area falls either wholly or<br />
partially within the <strong>Taranaki</strong> region (Figure 2.9).<br />
The rohe of Ng _ ati Ruanui, Ng _ a Ruahine, <strong>Taranaki</strong>, Te _ Atiawa and Ng _ ati<br />
Mutunga are located entirely within the region, while that of Ng _ ati Tama<br />
overlaps the Waikato region in the north and those of Ng _ ati Maru and<br />
Ng _ a Rauru overlap the Manawatu-Wanganui region to the east and<br />
south.<br />
The 2006 Census indicates that 15.8% of <strong>Taranaki</strong>’s population is M _ aori.<br />
TANGATA WHENUA AND THE ENVIRONMENT<br />
M _ aori view themselves as an integral part of the natural world. The<br />
spiritual beliefs held by all M _ aori link tangata whenua to their original<br />
parents Papa-t _ u- _ a-nuku (Earth Mother) and Ranginui (Sky Father) as part<br />
of a complete living system. The close attachment of tangata whenua<br />
to their ancestral lands and resources stems from this belief in their<br />
common origins and from occupation and use. This relationship of M _ aori<br />
Rob Tucker<br />
The 2008 Americarna festival, New Plymouth.<br />
with the environment provides links with both ancestors and future<br />
generations, and establishes tribal identity and continuity. Some of the<br />
relationships of M _ aori and their culture and traditions to land, water, air<br />
and the coast are briefl y outlined below.<br />
When exercising their functions and powers under the Resource<br />
Management Act, the regional and district councils must recognise and<br />
provide for the relationship of M _ aori and their culture and traditions<br />
with their ancestral land, water, air, sites, w _ ahi tapu and other taonga<br />
as a matter of national importance. <strong>Council</strong>s are also required to have<br />
Figure 2.9: Iwi boundaries.<br />
28 Business and Economic Research Ltd 2007. <strong>Taranaki</strong> Industry Projections 2006-2026. Report to Venture <strong>Taranaki</strong>.<br />
29 Includes only those staying in commercial accommodation and recorded in the Commercial Accommodation Monitor administered by Statistics New Zealand for the Ministry of Tourism.<br />
A large number of visitors to <strong>Taranaki</strong> stay with relatives and friends and these are not recorded in the Commercial Accommodation Monitor.<br />
30 Venture <strong>Taranaki</strong>, 2008. <strong>Taranaki</strong> Trends. <strong>Taranaki</strong> economic report.<br />
31 <strong>Taranaki</strong> Daily News 26 April 2008.<br />
Rob Tucker<br />
State of the Environment Report 2009<br />
21
22<br />
TARANAKI – THE PEOPLE & THE PLACE<br />
Young members of the Owae Marae concert group performing a Kapa Haka.<br />
particular regard to kaitiakitanga and to take into account the principles<br />
of the Treaty of Waitangi.<br />
Other agencies operating under other pieces of legislation, such as<br />
the Conservation Act and the Fisheries legislation, are also required to<br />
provide for the relationship of M _ aori with the natural environment.<br />
<strong>LAND</strong><br />
Ancestral lands are not restricted to land currently owned by M _ aori but<br />
also include lands traditionally occupied by iwi and hap _ u. In managing<br />
the effects of the use of land resources in <strong>Taranaki</strong>, recognition must be<br />
given to the relationship M _ aori have with their ancestral lands, and of<br />
the need to protect sites and resources of particular cultural and spiritual<br />
value from the adverse effects of land use and development.<br />
Mount <strong>Taranaki</strong> is of particular signifi cance to all iwi in <strong>Taranaki</strong>.<br />
WATER<br />
To M _ aori, water (wai) in all its forms is descended from Papa-t _ u- _ a-nuku<br />
and Ranginui. Rivers (awa) represent the t _ upuna (ancestors) of the<br />
tangata whenua. Water and every river therefore have their own mana.<br />
Water also has its own mauri (life force) and wairua (spirituality) which<br />
are linked to mana. If the mauri or wairua of a waterbody is interfered<br />
with through over-exploitation, pollution or desecration, then the spirits<br />
of the t _ upuna are affected and the waterbody loses its mana. Spiritual<br />
qualities can be adversely affected by the taking, use or diversion of<br />
water, and discharges of contaminants to land or water.<br />
Tangata whenua also value water for the provision of physical<br />
sustenance through the gathering of kai - for example, watercress, tuna<br />
(eel), piharau (lamprey), kahawai, inanga and other whitebait species.<br />
Particular rivers have special signifi cance to those iwi and hap _ u in<br />
whose rohe they are located. For example, the Stony (Hangatahua) River<br />
TARANAKI – WHERE WE STAND<br />
Rob Tucker<br />
The Aotearoa Marae, _ Okaiawa South <strong>Taranaki</strong>.<br />
has special value for the <strong>Taranaki</strong> iwi, the Waiwhakaiho and Waiongana<br />
rivers are of particular signifi cance to Te _ Atiawa, the K _ apuni Stream is of<br />
special value to Ng _ a Ruahine and the Manganui and Waitara rivers are<br />
of special value to Ng _ ati Maru.<br />
AIR<br />
According to M _ aori, the sky is Ranginui, father of Papa-t _ u- _ a-nuku’s<br />
earthly progeny, and is therefore tapu or sacred. The emission of<br />
contaminants to air may therefore have adverse effects on the spiritual<br />
values associated with the sky, atmosphere and associated celestial<br />
bodies which are the source of light and life. Air contaminants may also<br />
affect w _ ahi tapu. Because the sacredness of w _ ahi tapu extends upwards<br />
towards Ranginui, objectionable odours or visible contaminants may<br />
violate the sacredness of these sites.<br />
THE COAST<br />
The coastal environment and its resources are of great cultural, spiritual<br />
and economic value to all <strong>Taranaki</strong> iwi. As kaitiaki (guardians) of<br />
traditional fi shing grounds and reefs, iwi and hap _ u have a responsibility<br />
to safeguard these resources for the future. This guardianship role<br />
is refl ected in customary practices such as rotational or seasonal<br />
harvesting, the use of r _ ahui (prohibition) on seafood gathering to prevent<br />
over-exploitation, and the avoidance of contamination of coastal waters<br />
and habitat from human and other wastes.<br />
Considerable tribal mana and standing is derived from providing locally<br />
obtained food for manuhiri (guests) on the marae.<br />
<strong>Taranaki</strong>’s coast is rich in tribal history and many sites and features are<br />
of particular signifi cance to tangata whenua. These include coastal w _ ahi<br />
tapu, battlegrounds, urup _ a (burial sites), tauranga waka (ancestral canoe<br />
landing and launching sites), taonga raranga (plants valued for weaving),<br />
Rob Tucker
toko taunga ika (rocks marking fi shing grounds), and landscape features<br />
signifying iwi and hap _ u boundaries and other sites of importance.<br />
THE TREATY OF WAITANGI<br />
After extensive discussions with iwi, the <strong>Council</strong>, together with the<br />
<strong>Council</strong>’s Iwi Liaison Committee, Te Putahitanga o <strong>Taranaki</strong>, developed<br />
a Declaration of Understanding and Code of Conduct in relation to the<br />
principles of the Treaty of Waitangi.<br />
The Declaration of Understanding establishes and records a basis of<br />
mutual understanding about the relationship between the devolved<br />
kawanatanga (governorship) responsibilities of the <strong>Council</strong>, and the<br />
rangatiratanga (chieftainship) rights of iwi.<br />
The Code of Conduct is an expression of the <strong>Council</strong>’s commitment<br />
to take into account the principles of the Treaty of Waitangi in the<br />
exercise of its resource management functions. Both the Declaration of<br />
Understanding and Code of Conduct were incorporated into the <strong>Regional</strong><br />
Policy Statement for <strong>Taranaki</strong> 32 , which, following a lengthy public<br />
consultation procedure became operative in 1994. The declaration and<br />
code have also been incorporated into the reviewed Proposed <strong>Regional</strong><br />
Policy Statement for <strong>Taranaki</strong> 2006 33 . The declaration and code have<br />
continued to guide the development of all <strong>Council</strong> statutory resource<br />
management policies and plans.<br />
In 1996 the Waitangi Tribunal reported on historic Treaty claims in<br />
<strong>Taranaki</strong>. The report on the <strong>Taranaki</strong> claims 34 (Wai 143) sets out a long<br />
history of tension, warfare, land confi scation and expropriation and other<br />
injustices, since the earliest times of European settlement. The Tribunal<br />
noted that the effects of the many breaches of the Treaty that occurred<br />
in <strong>Taranaki</strong> continue to this day and concluded that the <strong>Taranaki</strong> claims<br />
are likely to be the largest in the country.<br />
The coastal environment and its resources are of great importance to iwi and hap _ u.<br />
32 <strong>Taranaki</strong> <strong>Regional</strong> <strong>Council</strong>, 1994. <strong>Regional</strong> Policy Statement for <strong>Taranaki</strong>.<br />
33 <strong>Taranaki</strong> <strong>Regional</strong> <strong>Council</strong>, 2006. Proposed <strong>Regional</strong> Policy Statement for <strong>Taranaki</strong>.<br />
34 Waitangi Tribunal, 1996. The <strong>Taranaki</strong> Report, Kaupapa Tuatahi, Waitangi Tribunal Report 1991.<br />
35 Refer section 10 Local Government Act 2002.<br />
Rob Tucker<br />
<strong>Taranaki</strong> iwi are at various stages of negotiation with the Crown<br />
regarding the settlement of their Treaty claims. Settlements will<br />
introduce a new phase in the development of relationships with iwi and<br />
hap _ u in <strong>Taranaki</strong>.<br />
To date, Treaty settlement claims between <strong>Taranaki</strong> iwi and the Crown<br />
have been signed with four iwi - Ng _ ati Ruanui, Ng _ ati Tama, Ng _ a Rauru<br />
and Ng _ ati Mutunga.<br />
The progressive settlement of historic Treaty claims will further develop<br />
relationships between iwi, the <strong>Taranaki</strong> <strong>Regional</strong> <strong>Council</strong> and district<br />
councils. Formal protocols between councils and iwi governance bodies,<br />
regarding the interactions between them, will be developed. For its part<br />
the <strong>Council</strong> has already commenced discussions with iwi who have<br />
fi nalised deeds of settlement, in order to develop such protocols. In<br />
addition, statutory acknowledgements which set out areas, locations or<br />
sites of particular signifi cance to iwi have been included in the <strong>Council</strong>’s<br />
statutory planning documents.<br />
As claims are settled, iwi may also become more active in resource use<br />
and development activities.<br />
2.6 OUR VISION FOR THE FUTURE<br />
The role of the <strong>Council</strong> and other local authorities in <strong>Taranaki</strong> is to<br />
give effect to the purpose of Local Government as set out in the<br />
Local Government Act 2002. An important part of this purpose is to<br />
promote the social, economic, environmental and cultural well-being of<br />
communities both in the present and for the future 35 . In achieving this<br />
purpose, councils are required to identify ‘community outcomes’ i.e., the<br />
things that the community thinks are important for its well-being and<br />
want to see as the desired end result or ‘state of affairs’ in the district or<br />
region in the future.<br />
<strong>Taranaki</strong> people value their natural environment.<br />
Rob Tucker<br />
State of the Environment Report 2009<br />
23
24<br />
TARANAKI – THE PEOPLE & THE PLACE<br />
The four local authorities in the <strong>Taranaki</strong> region, the New Plymouth,<br />
Stratford and South <strong>Taranaki</strong> district councils and the <strong>Taranaki</strong> <strong>Regional</strong><br />
<strong>Council</strong>, have undertaken extensive consultation with the people of<br />
<strong>Taranaki</strong> to identify the desired ‘outcomes’ for the future of the region 36 .<br />
The outcomes that the people of <strong>Taranaki</strong> wanted for the present and<br />
future well-being of the community were:<br />
A secure and healthy <strong>Taranaki</strong>.<br />
A region that provides a safe, healthy, and friendly place to live, work<br />
or visit.<br />
A prosperous <strong>Taranaki</strong>.<br />
A region that boasts a sustainable, resilient and innovative economy<br />
that prospers within the natural and social environment.<br />
A skilled <strong>Taranaki</strong>.<br />
A region that values and supports learning so that all people can play<br />
a full and active role in its social, cultural and economic life.<br />
A connected <strong>Taranaki</strong>.<br />
A region that delivers accessible and integrated infrastructure,<br />
transport and communication systems which meet the needs of<br />
residents, businesses and visitors.<br />
A sustainable <strong>Taranaki</strong>.<br />
A region that appreciates its natural environment and its physical and<br />
human resources in planning, delivery and protection.<br />
A together <strong>Taranaki</strong>.<br />
A region that is caring and inclusive, works together, and enables<br />
people to have a strong and distinctive sense of identity.<br />
A vibrant <strong>Taranaki</strong>.<br />
A region that provides high quality and diverse cultural and<br />
recreational experiences and encourages independence and creativity.<br />
The state of the environment reported on in this document has an<br />
important infl uence on the achievement of a number of the community<br />
outcomes described above.<br />
36 Community Outcomes Project Team, 2004. Future <strong>Taranaki</strong>: A Report on Community Outcomes for <strong>Taranaki</strong>.<br />
TARANAKI – WHERE WE STAND
Photo: Rob Tucker<br />
CHAPTER 3<br />
<strong>LAND</strong>, <strong>SOIL</strong><br />
AND <strong>BIODIVERSITY</strong><br />
25
26<br />
AT A GLANCE<br />
<strong>SOIL</strong> EROSION<br />
Soil is one of <strong>Taranaki</strong>’s most important resources sustaining the region’s<br />
agricultural industries. Soil erosion rates vary throughout the region<br />
according to geology, slope, vegetation cover and land use. Land uses that<br />
are sustainable are those that match the capabilities of the land class.<br />
Monitoring undertaken by the <strong>Taranaki</strong> <strong>Regional</strong> <strong>Council</strong> shows that:<br />
87.4% of the hill country is being used sustainably with no signifi cant<br />
soil erosion problems;<br />
there has been a 2.4% increase in sustainability over the past fi ve years;<br />
the area of land in sheep and beef farming has continued to decline;<br />
30.8% of hill country land is now reverting to scrub;<br />
the area in plantation forestry has doubled since 1994;<br />
a total of 269 comprehensive farm plans and 24 agroforestry plans<br />
have been prepared; and<br />
178,580 ha, or 58% of privately-owned hill country land, and 5,233<br />
ha, or 41% of privately-owned sand country, are now included in the<br />
<strong>Council</strong>’s sustainable land management programme.<br />
The <strong>Regional</strong> Soil Plan, made operative in 2001, addresses soil erosion<br />
issues in <strong>Taranaki</strong>. The sustainable land management programme<br />
involves supporting hill country farmers to farm in a sustainable way,<br />
including identifying areas where forestry (plantation or reversion) are<br />
preferred over pastoral farming. The <strong>Council</strong> will continue to monitor soil<br />
erosion in <strong>Taranaki</strong>.<br />
TARANAKI – WHERE WE STAND<br />
<strong>SOIL</strong> HEALTH<br />
Soil health refers to the biological, chemical and physical state of the<br />
soil. The region is fortunate in that soil types commonly found here<br />
are naturally robust and able to retain nutrients and organic material.<br />
The <strong>Council</strong> has continued soil quality investigations and monitoring<br />
projects to ascertain whether there are any emerging trends in <strong>Taranaki</strong><br />
relating to soil compaction, depletion of soil nutrients, and residual soil<br />
contamination, each of which would affect soil health. This research<br />
shows that:<br />
97% of <strong>Taranaki</strong> soils are of very low to moderate vulnerability to soil<br />
compaction;<br />
there is evidence of soil compaction on some <strong>Taranaki</strong> farms during<br />
wet weather, but this compaction is generally reversible with<br />
appropriate pasture and stock management;<br />
the carbon content of <strong>Taranaki</strong> soils is not changing, suggesting that<br />
soils are not becoming depleted of their organic content;<br />
phosphate levels, whilst increasing, are considered appropriate;<br />
total nitrogen levels are higher than optimal on all dairy farms<br />
surveyed, although most nitrogen is in the organic form which does<br />
not so readily leach out of the soil;<br />
nitrogen levels indicate vigorous pasture growth and have only minor<br />
implications for nutrient balancing;<br />
levels of cadmium available for uptake by plants are well below levels<br />
that would give rise to environmental concerns although they are<br />
increasing slowly;<br />
there is no evidence of any issue of residual or cumulative<br />
agrichemicals in the soils of the region; and<br />
baseline studies have been undertaken to explore soil fauna diversity.<br />
The <strong>Regional</strong> Soil Plan, includes policies and methods to address soil<br />
health issues in <strong>Taranaki</strong>. Actions include working with landowners on<br />
sustainability issues. The <strong>Council</strong> will continue to monitor soil health.
CONTAMINATED SITES AND<br />
HAZARDOUS SUBSTANCES<br />
Contaminated sites are those that result from historical activities and<br />
industries where hazardous substances have been inappropriately<br />
stored, used or disposed of. The <strong>Council</strong>’s register of selected land uses<br />
records 1,281 sites where past or current activities could have resulted<br />
in contamination. Of these:<br />
757 sites (59%) have been investigated and no contamination found<br />
to be present;<br />
16 sites have been remediated, so levels of contamination no longer<br />
pose an unacceptable environmental risk;<br />
480 sites contain hazardous substances, but based on current<br />
knowledge, not at levels that would pose an unacceptable<br />
environmental risk, or they are currently being managed so that there<br />
is no unacceptable risk (e.g. such as the P _ atea site case-studied in<br />
this report);<br />
28 sites have been classifi ed as being low-risk, but require further<br />
investigation to complete classifi cation; and<br />
No sites have been deemed ‘contaminated’, i.e. found to pose an<br />
unacceptable risk.<br />
The <strong>Regional</strong> Fresh Water Plan and <strong>Regional</strong> Air Quality Plan contain<br />
rules controlling the discharge of contaminants, thus avoiding new sites<br />
being contaminated. Hazardous substances are managed under the<br />
Hazardous Substances and New Organisms Act 1996, and discharges<br />
under the RMA. <strong>Council</strong> inspects industries and businesses to assess<br />
compliance with regulations under these acts. Potentially contaminated<br />
sites are managed through the register of selected land use and through<br />
district plans.<br />
<strong>BIODIVERSITY</strong><br />
The <strong>Taranaki</strong> region, despite its modest size, is a biologically diverse<br />
region. It has four distinctive ecological districts which give it its<br />
biodiversity characteristics. In summary:<br />
Over 140,000 ha, or 20% of the region, is set aside as public<br />
conservation land;<br />
3,374 ha of indigenous vegetation on private land is protected<br />
by landowners through Queen Elizabeth II National Trust (QEII)<br />
covenants, and this area is increasing;<br />
57% of remaining indigenous vegetation is either in public<br />
conservation land or private land protected by a QEII covenant;<br />
40 birds, mammals, reptiles and invertebrates have been identifi ed<br />
as threatened in <strong>Taranaki</strong>, about seven of these are either stable or<br />
improving;<br />
predator control programmes, aimed at protecting threatened birds,<br />
are undertaken by a range of agencies, landowners and community<br />
groups;<br />
research into kerer _ u and t _ u _ ı in New Plymouth highlighted the<br />
importance of both native and exotic fl owering and fruiting trees in<br />
the city;<br />
threatened plants often occupy coastal cliff edge habitats and are<br />
threatened by weed species such as giant gunnera;<br />
possum levels are kept low by landowners through the <strong>Taranaki</strong><br />
<strong>Regional</strong> <strong>Council</strong>’s self-help possum control programme on the ring<br />
plain and by Department of Conservation programmes in priority<br />
conservation areas;<br />
areas with goat control are healthier with higher numbers of<br />
regenerating seedlings of plant species vulnerable to goat browse;<br />
restoration of riparian (or stream side) vegetation results in an<br />
increase of both plant and bird biodiversity; and<br />
the number of community-led biodiversity projects is increasing.<br />
Biodiversity on land is managed by a number of agencies. The<br />
Department of Conservation is the key agency and sets out its<br />
programmes in its Conservancy Management Strategy. District Plans<br />
and the Proposed <strong>Regional</strong> Policy Statement contain policies about<br />
biodiversity on private land. The <strong>Taranaki</strong> <strong>Regional</strong> <strong>Council</strong> has prepared<br />
a Biodiversity Strategy to guide all the various biodiversity actions<br />
undertaken by the <strong>Council</strong> for working alongside landowners to maintain<br />
and enhance biodiversity on private land.<br />
State of the Environment Report 2009<br />
27
28<br />
<strong>LAND</strong>, <strong>SOIL</strong> & <strong>BIODIVERSITY</strong><br />
Mount <strong>Taranaki</strong> and ring plain, South <strong>Taranaki</strong>.<br />
OUR <strong>LAND</strong>, <strong>SOIL</strong> AND <strong>BIODIVERSITY</strong><br />
Soil is one of <strong>Taranaki</strong>’s most important<br />
resources. The region’s rural -based wealth<br />
depends on the amount of grass produced<br />
which is dependent on the sustainable<br />
management of our soils. The region is<br />
fortunate to have naturally robust soils that<br />
retain their structure, nutrients and organic<br />
matter, a product of their volcanic nature.<br />
However, good land and soil management<br />
is still required to retain this advantage and<br />
this has been recognised by the community<br />
as a vital step towards seeing a ‘prosperous<br />
<strong>Taranaki</strong>’, a region that boasts a sustainable,<br />
resilient and innovative economy. A prosperous<br />
<strong>Taranaki</strong> was considered as one of the top<br />
priorities that <strong>Taranaki</strong> needs to work on over<br />
the next 10 years 1 .<br />
<strong>Taranaki</strong> has a wide range of soil types, from<br />
the fertile well-drained soils on the ring plain<br />
and coastal terraces to the steep, erodible and<br />
relatively infertile soils of the inland hill country<br />
and on the upper slopes of Mount <strong>Taranaki</strong>.<br />
While erosion is a natural process, human<br />
activities may increase its rate. Accelerated<br />
erosion leads to the loss of the topsoil, and so<br />
reduces the land’s productivity and capability,<br />
as well as lowering water quality, degrading<br />
aquatic habitat and increasing the risks of<br />
fl oods from river beds fi lling up with silt and<br />
gravels.<br />
Retaining soil on the land is one thing, but<br />
safeguarding the health of our soils is equally<br />
important. Soil health refers to the biological,<br />
1 Community Outcomes Project Team, 2004. Future <strong>Taranaki</strong>: A report on Community Outcomes for <strong>Taranaki</strong>.<br />
TARANAKI – WHERE WE STAND<br />
chemical and physical state of the soil and<br />
the maintenance of soil ecosystems. Unlike<br />
the impact of accelerated erosion, soil health<br />
problems are not immediately evident, but are<br />
no less important.<br />
Market forces and policies from both central<br />
and local governments have infl uenced<br />
changes in land use patterns. Vegetation<br />
change and land use pressures are driven<br />
largely by economics and have fl uctuated with<br />
export prices and past government subsidies<br />
– land clearance occurred more frequently<br />
in past years when such land development<br />
was subsidised. Encouragingly, some of that<br />
cleared land, that was never going to be<br />
feasible to farm sustainably (economically<br />
or environmentally), has been allowed to<br />
revert back to scrub, even during times when<br />
Umutekai bush, a remnant swamp forest, managed within a productive landscape.<br />
Rob Tucker<br />
the market was relatively buoyant. Current<br />
government policies may further accelerate<br />
this trend to retire unsustainable land or<br />
convert it to plantation forestry through carbon<br />
emissions trading schemes which may make<br />
economic the retiring or reforesting of steep<br />
hill country.<br />
Livestock farming is one example of a land<br />
use that has the potential to cause pressures<br />
on soil health of the region through soil<br />
compaction, nutrient depletion and residual<br />
soil contamination. <strong>Council</strong> investigations<br />
confi rm that <strong>Taranaki</strong> has no evident signifi cant<br />
or immediate soil health problems with respect<br />
to these matters. This is largely attributed<br />
to the resilient nature of the volcanic soils<br />
of the ring plain, although they can still be<br />
susceptible to the long-term effects of soil<br />
compaction. The environmental impacts can be<br />
short-term and reversible if appropriate stock<br />
and land management practices are in place.<br />
Wise management of the land includes not<br />
only the management of soil erosion and soil<br />
health, but also the management of biological<br />
diversity, or ‘biodiversity’. Biodiversity<br />
describes the variety of all biological life<br />
large and small, including micro-organisms,<br />
fungi, ferns, trees, plants, insects, and the<br />
ecosystems they come from - forests to grass<br />
lands as well as the genetic diversity within<br />
species.<br />
Biodiversity is important not only from an<br />
intrinsic perspective, but also from economic,<br />
social and cultural perspectives. Biodiversity<br />
provides economic benefi ts in the form of<br />
ecosystem services (such as pollination, soil<br />
stability and fertility, and maintaining water<br />
<strong>Taranaki</strong> <strong>Regional</strong> <strong>Council</strong>
quality), tourism opportunities, and potential commercial and medical<br />
uses. Biodiversity, is signifi cant to the people of <strong>Taranaki</strong>. It is a key<br />
component of a ‘sustainable <strong>Taranaki</strong>’, a community outcome which<br />
includes the importance of understanding, valuing, maintaining and<br />
enhancing biodiversity for future generations. Protecting native bush and<br />
wildlife was considered as very important by 70% of people across the<br />
region 2 .<br />
Biodiversity is particularly signifi cant to tangata whenua who, through<br />
their long occupation of New Zealand prior to European settlement,<br />
have a strong relationship to native plants and animals, and to their<br />
habitats. This relationship with biodiversity is woven into M _ aori culture<br />
and traditions.<br />
Safeguarding <strong>Taranaki</strong>’s biodiversity is considered important for <strong>Taranaki</strong><br />
people because some species, habitats and ecosystems exist here and<br />
no where else in New Zealand. For example, a native land snail that<br />
lives only on Mount <strong>Taranaki</strong>. Protecting <strong>Taranaki</strong>’s biodiversity is up to<br />
<strong>Taranaki</strong> people who either actively support actions that will safeguard<br />
or restore that local biodiversity or conversely, support or make decisions<br />
to place pressure on our biodiversity.<br />
The pressures placed on <strong>Taranaki</strong>’s biodiversity stem from a history<br />
of human use of our native biodiversity. Before human settlement,<br />
native forest covered almost the entire region. The clearance and<br />
development of land for farming, particularly on the <strong>Taranaki</strong> ring plain<br />
and fertile river valleys elsewhere, led to the loss of large areas of<br />
indigenous vegetation. The most signifi cant loss in indigenous habitat<br />
in <strong>Taranaki</strong> occurred on the ring plain and coastal terraces. Damage to<br />
our biodiversity goes well beyond habitat loss. The condition (or quality)<br />
of remaining areas of indigenous biodiversity has suffered from the<br />
introduction of pest plants, such as old man’s beard, and animals such<br />
as possums, goats, rats, cats and stoats.<br />
The challenge is to fi nd ways to manage <strong>Taranaki</strong>’s biodiversity within<br />
the context of a productive landscape. A carefully managed farm, for<br />
instance, with wetlands and forest remnants protected, animal pest<br />
species controlled, streams fenced and planted with riparian buffer<br />
zones, erosion -prone soils protected and with stocking rates matching<br />
the land’s carrying capacity, can both restore and enhance biodiversity<br />
and be economically and socially sustainable.<br />
Table 3.1: Natural erosion rates in the region.<br />
Part of the region Natural<br />
erosion rates<br />
Reasons for accelerated erosion rates<br />
3.1 <strong>SOIL</strong> EROSION<br />
3.1.1 WHAT IS THE CURRENT<br />
STATE OF <strong>SOIL</strong> EROSION IN<br />
TARANAKI ?<br />
The extent and rate of soil erosion in <strong>Taranaki</strong> is determined by geology,<br />
slope, climate and vegetation cover. Different levels of natural erosion<br />
rates in the region are set out in Table 3.1 3 .<br />
Soil erosion impacts on water quality, increases fl ood risk through rivers<br />
fi lling up with silts and gravels, as well as reducing the general health<br />
and productivity of the soil. Land that is susceptible to severe erosion<br />
in <strong>Taranaki</strong> is illustrated in Figure 3.1. The erosion potential of land<br />
Mount <strong>Taranaki</strong> High Erosion rates may be accelerated where animal pests damage vegetation, although this is managed through<br />
the animal pest control programme in Egmont National Park.<br />
<strong>Taranaki</strong> ring plain and<br />
western fringe of the<br />
hill country<br />
Figure 3.1: Land susceptible to severe erosion in <strong>Taranaki</strong>.<br />
Low Any accelerated erosion is insignifi cant when compared with the long-term soil accumulation beneath<br />
vegetation that has occurred in the past, and which has been augmented by volcanic ash during eruptions of<br />
the <strong>Taranaki</strong> volcanoes.<br />
Inland hill country High Erosion rates can be accelerated by land use activities – highest in areas cleared for pasture, less in areas<br />
planted in plantation forestry and even less in areas that remain bush-clad.<br />
Coastal sand country Moderate Erosion rates can be exacerbated by land use activities that expose topsoil to wind causing blow-out and the<br />
re-deposition of the underlying sand in localised areas.<br />
2 Community Outcomes Project Team, 2004. Future <strong>Taranaki</strong>: A report on Community Outcomes for <strong>Taranaki</strong>.<br />
3 Hicks, D.L, 1998. Soil Erosion in <strong>Taranaki</strong> – A summary of research fi ndings. Prepared by Ecological Research Associates for the <strong>Taranaki</strong> <strong>Regional</strong> <strong>Council</strong>.<br />
State of the Environment Report 2009<br />
29
30<br />
<strong>LAND</strong>, <strong>SOIL</strong> & <strong>BIODIVERSITY</strong><br />
depends on its geology, slope and vegetation cover. Hill country makes<br />
up 414,260 ha, or 57% of the region. Of this, 306,060 ha are privatelyowned<br />
with the remainder managed by the Department of Conservation.<br />
(A) SUSTAINABILITY IN THE HILL COUNTRY<br />
Land that is used sustainably is less susceptible to erosion. Changes<br />
in the sustainability of land use in the eastern <strong>Taranaki</strong> hill country is<br />
monitored by the <strong>Taranaki</strong> <strong>Regional</strong> <strong>Council</strong>. Every fi ve years, aerial<br />
photographs of the region are taken, and vegetation and land use are<br />
mapped for 25 representative sites, each 900 hectares in area, spread<br />
evenly throughout the hill country.<br />
The monitoring has now been completed in 1996 4 , 2000 5 and 2008 6<br />
using aerial photos taken in 1994, 2000 and 2007 respectively. The<br />
2008 exercise involved bringing the 1996 and 2000 mapping into line<br />
with the latest digital aerial photos. This enabled the 2008 work to<br />
continue comparing sites between years, despite the inferior accuracy<br />
of the aerial photos in earlier years. The information obtained provides a<br />
representative picture of private land use in the hill country and the way<br />
that land use has changed over time.<br />
Changes in vegetation over the 25 monitoring sites have seen a<br />
reduction in the area of pasture (from 49.0% in 1994 to 47.6% in 2000<br />
to 46.3% in 2007) and an increase in the area of plantation forestry,<br />
which increased from 2.4% to 4.7% over the 13 years. The total area of<br />
indigenous forest decreased slightly in the monitored sites from 3,380<br />
ha in 1994 to 3,295 ha in 2007.<br />
Land use changes between 1994 and 2000 were dominated by a<br />
reduction in the area of meat and wool farming from 53.9% to 51.1%,<br />
which continued to fall to 45.1% in 2007. Meat and wool farming land<br />
use shifted to either scrub (classifi ed as ‘revegetated meat and wool<br />
farming land’ in the report) or plantation forestry. Land reverting to<br />
scrub increased from 24.1% to 25.5% and then to 30.8% over the three<br />
monitoring periods. The area of land changing in land use from 1994 to<br />
2007 is illustrated in Figure 3.2.<br />
Sheep farming, <strong>Taranaki</strong> hill country.<br />
4 O’Leary, S.M.; Stephens, P.R.; Willoughby, E.J.; DeRose, R.C.; Gibb, R.G.; White, M.F.; Sutherland, A. 1996. Land Use Monitoring in the Eastern <strong>Taranaki</strong> Hill Country. Prepared by Landcare<br />
Research for the <strong>Taranaki</strong> <strong>Regional</strong> <strong>Council</strong>.<br />
5 Jessen, M.R.; .Betts, H.D.; Sutherland, A.; Willoughby, E.J. 2000. Sustainable Land Use Monitoring in the Eastern <strong>Taranaki</strong> Hill Country and Coastal Sand Country. Prepared by Landcare Research for<br />
the <strong>Taranaki</strong> <strong>Regional</strong> <strong>Council</strong>.<br />
6 Betts, H.D,; Lynn, I.H. 2008. Sustainable Land Use Monitoring in the Eastern <strong>Taranaki</strong> Hill Country and Coastal Sand Country – 2007 Re-survey. Prepared by Landcare Research for the <strong>Taranaki</strong><br />
<strong>Regional</strong> <strong>Council</strong>.<br />
TARANAKI – WHERE WE STAND<br />
Rob Tucker<br />
Figure 3.2: Changes in land use from 1994 to 2007.<br />
Land is described as physically sustainable if the use of that land carries<br />
only a moderate or low risk of accelerated erosion. Unsustainable<br />
land use is that which carries a severe or higher risk of accelerated<br />
erosion into the long term. The sustainability of land use is measured by<br />
comparing the type of land use that can be physically supported by that<br />
land with what it is actually being used for.<br />
From 1994 to 2000, overall sustainability of land use improved by about<br />
1.1 + -0.7%. In 1994, 83.9% of the area was used sustainably, that is,<br />
almost 84% of the hill country was being used for the land use that<br />
suited its geology, slope and soil type. Land use sustainability improved<br />
to 85.0% in 2000 and to 87.4% by 2007 (an increase in land use<br />
sustainability of 2.4 + -1.5%). This means there has been a 3.5 + - 1.6%<br />
increase in land use sustainability since 1994. The improvement in<br />
sustainability of land use was the result of a move away from the meat<br />
and wool farming land use after 2000, and a reversion of that land to<br />
scrub or to forestry. The report noted that increases in the area under<br />
plantation forestry also contributed to improve land use sustainability.<br />
Erosion in the Wait _ otara catchment after the 2004 storm.<br />
<strong>Taranaki</strong> <strong>Regional</strong> <strong>Council</strong>
Of signifi cance also in this result is the fact that the trend towards<br />
increasing sustainability is accelerating, from the 1.1% improvement<br />
in sustainability between 1994 and 2000 to an increase of 2.4% in<br />
sustainability between 2000 and 2007. This is a very positive and<br />
encouraging result, particularly given that there had been good<br />
economic years for the meat and wool sector during the monitoring<br />
period which have in the past encouraged some unsustainable land use<br />
practices such as the clearing of steep land.<br />
(B) SUSTAINABILITY IN THE SAND COUNTRY<br />
Coastal sand country makes up 12,648 ha, less than 2% of the region.<br />
This type of land is mainly pasture land, but 428 ha have been identifi ed<br />
as consisting of bare sand. The majority of sand country in the region is<br />
in South <strong>Taranaki</strong> with other areas around Cape Egmont and in North<br />
<strong>Taranaki</strong>. Almost all of this area is susceptible to wind erosion.<br />
To measure changes in sustainability in the sand country, the <strong>Council</strong><br />
has monitored changes in the area of bare sand at four widely separated<br />
representative sites from near Cape Egmont in the north, to north of<br />
Wanganui in the south 7 . The sites combined represent 25% of the<br />
coastal sand country, and capture the range of conditions along the<br />
coast. Aerial photos have been used since 1994 to map any change in<br />
the amount of bare sand at those sites.<br />
Between 1994 and 2000, the area of bare sand increased at two of the<br />
sites, possibly due to tracking and treading damage, while replanting<br />
of forest at the site near the Wait _ otara River mouth helped reduce the<br />
amount of bare sand at that site. Between 2000 and 2007, no signifi cant<br />
change was recorded in the area of bare sand at any of the sites. Most<br />
of the changes noted after 2000, albeit insignifi cant, appeared to be<br />
related to natural causes such as blowouts of unstable dunes near the<br />
beach rather than to land management ones.<br />
Quite aside from being a soil erosion issue, bare sand does occur<br />
naturally and can form an important habitat for threatened species such<br />
as katip _ o spiders and p _ ingao grass.<br />
David Pearce farms to the potential of his coastal property near Wait _ otara.<br />
Rob Tucker<br />
3.1.2 HOW IS <strong>SOIL</strong> EROSION<br />
MANAGED IN TARANAKI ?<br />
(A) REGIONAL <strong>SOIL</strong> PLAN FOR TARANAKI<br />
Soil erosion is addressed in the <strong>Regional</strong> Soil Plan for <strong>Taranaki</strong>. The plan<br />
contains policies, methods and rules addressing accelerated erosion,<br />
with the objective of maintaining and enhancing the soil resource in the<br />
region. The plan is now half way through its statutory life and will be<br />
formally reviewed in 2011.<br />
Objectives, policies and methods set out in the plan build on the success<br />
of past experiences and involve the <strong>Council</strong> addressing soil loss in<br />
partnership with farmers. The plan focuses on non-regulatory methods,<br />
such as the <strong>Council</strong>’s sustainable land management programme, to<br />
achieve sustainable land management.<br />
Non-regulatory methods are complemented by two regional rules that<br />
target vegetation disturbance over 5 ha in area, on land that has a slope<br />
greater than 28 degrees. In these circumstances, vegetation disturbance,<br />
for example forest clearance or harvesting, is permitted only if certain<br />
conditions can be met. These conditions deal with the prevention<br />
or mitigation of soil erosion, and effects on water quality. If these<br />
conditions cannot be met, a resource consent is required and an erosion<br />
and sediment control management plan must be prepared.<br />
Since the <strong>Regional</strong> Soil Plan was made operative in 2001, only one<br />
consent has been granted under it. This was for vegetation disturbances<br />
for the extraction of logs from Te Wera Forest.<br />
(B) SUSTAINABLE <strong>LAND</strong> MANAGEMENT<br />
PROGRAMME IN THE HILL COUNTRY<br />
The objectives of the <strong>Regional</strong> Soil Plan for <strong>Taranaki</strong> are delivered<br />
through the <strong>Council</strong>’s sustainable land management programme. When<br />
requested, the <strong>Council</strong> will prepare comprehensive farm plans that set<br />
out options and recommendations for individual hill country properties.<br />
The plans are prepared in close consultation with landowners and are<br />
offered free of charge.<br />
Land Management offi cers support landowners to implement their farm plans.<br />
7 Betts, H.D and Lynn, I.H. 2008. Sustainable Land-Use Monitoring in the Eastern <strong>Taranaki</strong> Hill Country and Coastal Sand Country – 2007 Re-survey. Prepared by Landcare Research for the <strong>Taranaki</strong><br />
<strong>Regional</strong> <strong>Council</strong>.<br />
Rob Tucker<br />
State of the Environment Report 2009<br />
31
32<br />
<strong>LAND</strong>, <strong>SOIL</strong> & <strong>BIODIVERSITY</strong><br />
A comprehensive farm plan covers all soil<br />
conservation aspects of a farming operation,<br />
including land and stock management, while<br />
maximising the property’s productive capability.<br />
These plans are based on land use capability<br />
through a detailed land resource inventory,<br />
derived from soil type, geology, vegetation,<br />
slope and present erosion. Recommendations<br />
may include planting of erosion control species<br />
or exotic forestry on slopes not suited to<br />
pastoral use, or retirement of very steep land<br />
to enable regeneration of native vegetation.<br />
Agroforestry plans are prepared for farmers<br />
interested in diversifi cation by establishing<br />
woodlots or plantations.<br />
In the past 10 years or so the <strong>Council</strong> has<br />
achieved good coverage of property plans<br />
and has maintained ongoing liaison with plan<br />
holders to assist with implementation of plan<br />
recommendations and work programmes<br />
over time. The extent of farm plans prepared<br />
by the <strong>Council</strong> to the end of June 1995 was<br />
only 42,000 ha or 13% of privately-owned<br />
land in the hill country (Figure 3.3a). This has<br />
quadrupled to 178,580 ha or 58 % of privatelyowned<br />
hill country land by June 2008 (Figure<br />
3.3b). A total of 269 comprehensive farm plans<br />
and 24 agroforestry plans have been prepared<br />
by the <strong>Council</strong>.<br />
Land management offi cers from the <strong>Council</strong><br />
support landowners to implement their farm<br />
Figure 3.3(a): Number of sustainable land<br />
management plans prepared up to June 1995.<br />
8 Wu, J; Sanderson, K. June 2008. Community Investment in Environmental Improvements in <strong>Taranaki</strong>. Prepared by Business and Economic Research Limited for the <strong>Taranaki</strong> <strong>Regional</strong> <strong>Council</strong>..<br />
TARANAKI – WHERE WE STAND<br />
plans. Areas where recommendations have<br />
been implemented are noted in a database and<br />
will be analysed in the future to monitor the<br />
rate of implementation of farm plans.<br />
A recent review of the level of community<br />
investment in environmental improvements<br />
found that the average farmer expenditure<br />
is over $13,400 per year on implementation<br />
of sustainable land management practices<br />
such as environmental planting, forestry/<br />
agroforestry development, or fencing and<br />
retirement of erosion-prone land 8 . The annual<br />
cost was adjusted according to the Farm<br />
Expenses Price Index published by Statistics<br />
New Zealand. Thus the total annual farmer<br />
expenditure under this programme is $2.2<br />
million per annum on hill country protection.<br />
The <strong>Council</strong> intends to continue its sustainable<br />
land management programme into the future.<br />
Further improvements in land use sustainability<br />
will be required to meet the <strong>Regional</strong> Soil<br />
Plan target of 89% sustainability by 2011 – a<br />
further increase of 1.6% by 2011. Given the<br />
increase in sustainability over the most recent<br />
monitoring period, and economic disincentives<br />
for farming unsustainable land (such as rising<br />
fertiliser costs) there is a good basis for<br />
optimism that this target can be achieved.<br />
Figure 3.3(b): Coverage of comprehensive and agroforestry farm plans in the hill country up to June 2008.
Land Services Manager Don Shearman with Cam and Sarah Collier.<br />
POLES WITH A PURPOSE<br />
Their aim has always been simple: controlling erosion and providing<br />
shade and shelter. But along the way, sheep and beef farmers Cam<br />
and Sarah Collier have become award-winners and role models for<br />
sustainable land management.<br />
With nearly two-thirds of their Mangamingi property identifi ed as<br />
susceptible to accelerated erosion, the Colliers have established<br />
exotic forest on 480 ha of the steeper land and planted hundreds of<br />
poplar poles – 50 to 150 a year for the past two decades – on the<br />
more productive pasture land.<br />
The poles are young tree stems 3 m long, which root and sprout when<br />
planted. Planting so many has been a big effort but Cam is pleased<br />
with the result – “they’ve been good”.<br />
The poles anchor soil with their roots, effectively controlling hill slope<br />
erosion and reducing the sediment entering watercourses. By keeping<br />
Figure 3.4: An extract from the Colliers’ farm plan showing recommended and implemented works.<br />
Rob Tucker<br />
soil on hillsides, they maintain pasture production at a good level, and<br />
by helping to prevent slips and gullies, they reduce damage to farm<br />
assets, and the cost of repairing damage after storms.<br />
The pole planting is among sustainable land management measures<br />
the Colliers are carrying out under a Comprehensive Farm Plan<br />
prepared for them by the <strong>Taranaki</strong> <strong>Regional</strong> <strong>Council</strong>. They also have an<br />
Agroforestry Plan, under which their exotic forest was developed.<br />
All this work continues soil conservation work started by Cam’s father<br />
in the 1970s, when a 223 ha block of near pristine lowland, podocarphardwood<br />
native forest on the property was protected with a QEII<br />
National Trust covenant.<br />
Annual pest control operations aimed at possums and goats are<br />
carried out in this block in conjunction with Forest and Bird. Cam<br />
said the dividend is the increased birdlife and rejuvenation of native<br />
species.<br />
And the Colliers’ efforts haven’t stopped there. Another 10 ha<br />
of the property have been enhanced with amenity plantings, the<br />
establishment of blackwoods, wetland retirement and riparian<br />
planting, and shelter belt establishment.<br />
Cam believes fencing and planting waterways, even on the fl at, not<br />
only make the property safer for stock but are also more economic in<br />
the long run than trying to keep these areas drained.<br />
“Once the initial cost is out of the way, it’s cheaper than getting a<br />
digger in every few years to keep the drains clear.”<br />
The Colliers were recognised in the 2008 <strong>Taranaki</strong> <strong>Regional</strong> <strong>Council</strong><br />
Environmental Awards, the award’s citation noting their commitment<br />
to sustainable land management.<br />
State of the Environment Report 2009<br />
33
34<br />
<strong>LAND</strong>, <strong>SOIL</strong> & <strong>BIODIVERSITY</strong><br />
A comprehensive farm plan is one of the tools Rod Pearce uses to sustainably<br />
farm his Wait _ otara sheep and beef property.<br />
HINTS TAKEN IN THE<br />
HINTER<strong>LAND</strong><br />
When Mother Nature speaks, it pays to listen. And landowners and<br />
<strong>Taranaki</strong> <strong>Regional</strong> <strong>Council</strong> staff have been all ears in the Wait _ otara<br />
Valley following successive fl oods that highlighted some hard<br />
geological facts.<br />
And soft geological facts. The valley varies from consolidated<br />
sandstone in the upper reaches where erosion is related to rock<br />
hardness, to mudstone, siltstone and moderately consolidated<br />
sandstone throughout the catchment – where the erosion potential is<br />
governed by the type of vegetation and a soft sandstone belt further<br />
down which are highly vulnerable to erosion. There’s also a mixture of<br />
slump-prone hill country.<br />
After the fl ood in 2004, Landcare Research analysed satellite imagery<br />
to fi nd 465 ha of landslides in the Wait _ otara catchment. Of this, 20%<br />
to 25% was made up of slip scars and the rest was trails of debris<br />
spread approximately 10-20 cm thick. Compared to pasture, closed<br />
canopy forest (both exotic and indigenous) reduced landslides by 90%,<br />
while scrub reduced the incidence by about 80% and space-planted<br />
trees by 60%.<br />
On the ground, the <strong>Council</strong>’s land management staff and landowners<br />
could see there was more erosion on the northerly (sunny) faces of<br />
steep, moderate to hard sandstone country higher in the valley.<br />
Gully erosion was also severe throughout the catchment, regardless<br />
of geology or vegetation type, and resulted in many culverts or bridges<br />
blowing out, and logs and debris forming log jams in confi ned channels<br />
or being widely scattered on fl ood plains. There were also large areas<br />
of deep-seated slumps in the mid to upper catchment.<br />
With the land speaking so eloquently, there was clearly a need to<br />
do more than listen. The <strong>Council</strong> took an action plan to landowners,<br />
built around the assistance available through its sustainable land<br />
management programme.<br />
The <strong>Council</strong> draws up comprehensive farm plans at no cost to<br />
landowners, and also supplies at-cost poplar and willow material to<br />
help stabilise land.<br />
The plans are based on a detailed land resource inventory and include<br />
an analysis of the property’s soils, geology, vegetation, slope and<br />
erosion. This gives landowners a good indication of the options for<br />
TARANAKI – WHERE WE STAND<br />
Rob Tucker<br />
using their land sustainably, and the plans also recommend measures<br />
to stabilise and protect the soil’s productive capability. More recent<br />
plans also indicate production potentials for different parts of the<br />
property and provide some basic economic analyses. The idea is to<br />
match land use to the potential of the land.<br />
By understanding the land’s potential for sustained production, inputs<br />
can be increased on better classes of land and soil conservation<br />
measures can be implemented so that pastoral farming can continue<br />
where suitable. Land that is not sustainable under pastoral farming<br />
can be assessed for alternative land uses such as forestry, or retired if<br />
only suitable for conservation purposes. Generally, farm plans highlight<br />
sustainable land management practices without an overall loss of<br />
productivity on the farm.<br />
It’s an approach that has found ready acceptance in Wait _ otara Valley,<br />
and Figure 3.5 shows how well the farm planning services have been<br />
taken up.<br />
After another heavy downpour in July 2006 resulted in signifi cant<br />
fl ooding and silt deposition, particularly in the Moumahaki and mid to<br />
lower Wait _ otara catchments, landowners were offered a <strong>Council</strong> relief<br />
package of up to $8,000 for plants to promote land stability and up to<br />
$10,000 for half the cost of grass seed.<br />
The plants to promote land stability were mainly 3 m poplar and<br />
willow poles and grass seed for the revegetation of slip erosion debris<br />
trails - not for the re-sowing of fl ats covered in silt. The 2006 fl ood also<br />
resulted in more demand for information on soil conservation options.<br />
This sustainability option involves working with Mother Nature so she<br />
is less prone to angry outbursts in the form of erosion and fl oods.<br />
Figure 3.5: Coverage of farm plans in the Wait _ otara catchment in relation to<br />
land susceptible to erosion.
(C) CARBON FARMING IN THE HILL COUNTRY<br />
The previous Government introduced policies to promote the removal<br />
of carbon from the atmosphere including several schemes to encourage<br />
landowners to retain land in trees or grow in new trees, and thus earn<br />
carbon credits (see case study in Chapter 6: Atmosphere). While the<br />
emission trading scheme is being reviewed, schemes which encourage<br />
the retirement or planting of marginal hill country, making its land<br />
use more environmentally sustainable, will complement the <strong>Council</strong>’s<br />
sustainable land management programme.<br />
(D) SUSTAINABLE <strong>LAND</strong> MANAGEMENT IN<br />
THE SAND COUNTRY<br />
The <strong>Council</strong> also works with landowners of sand country by preparing<br />
property plans to provide information and advice on managing sand<br />
country sustainably. Conservation plans specifi cally addressing sand blow<br />
problems and riparian plans make recommendations for the retiring and<br />
planting of waterways and for the provision of shelter belts which can<br />
minimise the risk of sand blow outs. The <strong>Council</strong> has prepared property<br />
plans covering 5,233 ha, or 41% of the region’s coastal sand country, the<br />
extent of which in South <strong>Taranaki</strong> are illustrated in Figure 3.6.<br />
Figure 3.6: South <strong>Taranaki</strong> showing coverage of property plans and extent of<br />
bare sand.<br />
Table 3.2: Summary of progress: implementing regional objectives and policies on soil erosion.<br />
(E) INFORMATION, EDUCATION AND ADVICE<br />
The <strong>Council</strong> receives and responds to numerous requests from the public<br />
for information on sustainable land management and has prepared a<br />
number of pamphlets and other educational material. By way of example,<br />
in 2007-08, the <strong>Council</strong> liaised with existing property plan holders on<br />
2,487 occasions (over twice the number in 2000-01) and received and<br />
responded to 554 requests for advice and assistance on a wide variety of<br />
land management related issues. The <strong>Council</strong> will continue to provide the<br />
community with information on sustainable land management.<br />
(F) PLANTING MATERIAL<br />
The <strong>Council</strong> operates a scheme involving the supply to property plan<br />
holders of low cost poplar and willow plants for soil stability purposes.<br />
During the 2007-08 year the <strong>Council</strong> provided 12,569 poplars and<br />
willows to 73 landholders. Over the past 10 years, the <strong>Council</strong> has<br />
supplied over 90,000 poplars and willows to landholders (Figure 3.7). The<br />
provision of planting material at cost is a key component in the success<br />
of the <strong>Council</strong>’s sustainable land management programmes.<br />
(G) SUMMARY OF PROGRESS<br />
A summary of progress in implementing regional objectives and policies<br />
on soil erosion is given in Table 3.2 below.<br />
Issue What do we want to achieve? What are we doing about it ? Where are we at ?<br />
Accelerated erosion 89% of privately-owned hill country<br />
sustainably managed.<br />
A 50% increase in forestry or plantings<br />
on steep land (Class VIe and VIIe).<br />
No net loss in the area of indigenous<br />
forest on steep hill country land.<br />
A 5% reduction in the area of bare sand<br />
in the coastal sand country.<br />
50% of privately-owned hill country and<br />
sand country covered by farm plan.<br />
70% of property plans implemented in<br />
whole or in part.<br />
Figure 3.7: Plants provided to landowners at cost for soil stability planting over<br />
the past 10 years.<br />
Implementing the<br />
<strong>Regional</strong> Soil Plan.<br />
Preparing property plans<br />
through the sustainable land<br />
management programme.<br />
Hill country and sand country<br />
monitoring.<br />
Providing advice and<br />
information.<br />
Providing planting material.<br />
Developing methods for<br />
monitoring implementation of<br />
property plans.<br />
87.4% of the hill country is managed sustainably.<br />
Area of plantation forestry in the hill country has<br />
doubled.<br />
3% decrease in area of indigenous forest on<br />
monitored sites.<br />
Overall decrease in area of bare sand at monitoring<br />
sites.<br />
58% of privately-owned land in the hill country is in<br />
the sustainable land management programme.<br />
41% of privately-owned land in the coastal sand<br />
country is in the sustainable land management<br />
programme.<br />
269 comprehensive farm plans and 24 agroforestry<br />
plans have been prepared.<br />
State of the Environment Report 2009<br />
35
36<br />
<strong>LAND</strong>, <strong>SOIL</strong> & <strong>BIODIVERSITY</strong><br />
Table 3.3: Area of pasture on erosion-prone hill country by region between 1997 and 2002.<br />
Region Erosion-prone area<br />
(ha) in pasture in<br />
1997 (LCDB1)<br />
3.1.3 HOW DO WE COMPARE?<br />
The Ministry for the Environment has compared areas of erosion<br />
susceptible land in New Zealand and the at-risk area being farmed by<br />
region by comparing satellite images between 1997 (LCDB1) and 2002<br />
(LCDB2) 9 . According to the Ministry’s analysis, <strong>Taranaki</strong> has 5.3% of<br />
its region in erosion-prone land in pasture, compared to neighbouring<br />
regions such as Waikato (4.6%) or Manawatu-Wanganui (10%) (Table<br />
9 Ministry for the Environment. 2007. Environment New Zealand 2007. Note: LCDB = Land Cover Database.<br />
TARANAKI – WHERE WE STAND<br />
Erosion-prone area<br />
(ha) in pasture in<br />
2002 (LCDB2)<br />
Percentage of total<br />
regional land area<br />
(%)<br />
3.3). The amount of erosion-prone land in pasture recorded in 2002<br />
decreased nationally by 36,000 hectares. In <strong>Taranaki</strong> there was a 5.4%<br />
reduction in the amount of erosion-prone pasture land between 1997<br />
and 2002 (this fi gure differs to that determined through the <strong>Council</strong>’s<br />
own monitoring due to the different methodology used but is still of<br />
a similar magnitude and in the same direction). This was the highest<br />
percentage of change recorded for all the regions, followed by the<br />
Wellington region (showing 5.2% reduction in erosion-prone pasture<br />
land) and the Gisborne region (which demonstrated a 4.9% reduction).<br />
3.2 <strong>SOIL</strong> HEALTH<br />
3.2.1 WHAT IS THE CURRENT<br />
STATE OF <strong>SOIL</strong> HEALTH IN<br />
TARANAKI?<br />
(A) INDICATORS<br />
Area (ha) change<br />
from pasture (LCDB2)<br />
Northland 67.723 65.832 5.10 -1.691 -2.50<br />
Auckland 13.101 12.988 2.49 -53 -0.40<br />
Bay of Plenty 27.000 25.855 2.20 -1.104 -4.09<br />
Waikato 116.049 112.315 4.58 -3.680 -3.17<br />
Gisborne 169.141 158.382 19.01 -8.151 -4.88<br />
Hawke’s Bay 113.128 110.416 7.80 -2.537 -2.24<br />
Manawatu 230.585 223.535 10.08 -6.793 -2.95<br />
<strong>Taranaki</strong> 40.580 38.444 5.30 -2.136 -5.26<br />
Wellington 54.281 51.387 6.33 -2.794 -5.15<br />
Nelson 1.612 1.535 3.52 -76 -4.74<br />
Tasman 24.249 22.697 2.39 -1.012 -4.17<br />
Marlborough 75.042 71.946 6.84 -3.107 -4.14<br />
Canterbury 113.995 113.770 2.52 -220 -0.19<br />
West Coast 4.623 4.592 0.20 -16 -0.35<br />
Otago 101.531 101.236 3.17 -294 -0.29<br />
Southland 26.083 25.437 0.80 -646 -2.48<br />
North Island 829.587 799.154 N/A 30.433 -3.67<br />
South Island 347.134 341.213 N/A -5.291 -1.71<br />
Total 1.176.721 1.140.367 N/A -36.354 -3.09<br />
Notes:<br />
1. Figures rounded to the nearest 200 hectares.<br />
2. Pasture classes from the erosion risk data used for this analysis limited to the Land Cover Database ‘Primarily Pastoral’ classes for reporting.<br />
Data: Landcare Research, from MFE, 2007.<br />
East <strong>Taranaki</strong> hill country.<br />
Rob Tucker<br />
Percentage change<br />
(%)<br />
Soil health refers to the biological, chemical and physical state of the<br />
soil and the maintenance of soil ecosystems. It includes aspects such<br />
as the structure of the soil, the levels of organic matter, nutrients and<br />
trace elements and levels of any contaminants. Ecological processes
Table 3.4: Indicators used for soil quality assessment.<br />
Measures What this tells us about soil health<br />
Physical properties Dry bulk density Compaction<br />
Particle density Porosity and available water<br />
Macroporosity Soil compaction, root environment, aeration<br />
Chemical properties Total carbon content Organic matter status<br />
Total nitrogen content Organic nitrogen reserves<br />
Olsen P Plant available phosphate<br />
Cadmium and zinc concentration Level of trace metal contaminants<br />
Biological properties Mineralisable nitrogen Organic nitrogen that can be mineralised to a plant available form<br />
Microbial biomass Amount of living microbes in soil<br />
Soil respiration Total activity of aerobic soil organisms<br />
Soil nematode populations Diversity and numbers of soil nematodes<br />
SOURCE: Sparling and Stevenson, 2008.<br />
are important for productive soil, such as the breakdown of organic<br />
material and the release of nutrients for plant growth. Other indicators<br />
of soil health include concentrations of various chemicals – indicators of<br />
nutrients available for plant growth, and various biological properties that<br />
provide an indication of the ‘healthy’ functioning of the soil (Table 3.4).<br />
Since the last state of the environment report 10 the <strong>Council</strong> has<br />
continued soil quality investigations and monitoring projects to<br />
ascertain whether there are any threats or emerging trends in <strong>Taranaki</strong><br />
relating to soil compaction, depletion of soil nutrients and residual soil<br />
contamination. Results from the following studies inform us of the state<br />
of soil health and will be discussed further below:<br />
1. 2008 soil study: A study was repeated into the biological, chemical<br />
and physical characteristics of soil on properties representative of<br />
the major agricultural land uses and soil types within <strong>Taranaki</strong> 11 . This<br />
study updated a national monitoring project implemented in 1999-<br />
2001 (the ‘500 Soils’ project). Sites are illustrated in Figure 3.8.<br />
2. 2007 long term study: A separate study looked at how soil health<br />
has changed over a longer time frame 12 . This involved re-sampling<br />
seven sites sampled 20-30 years ago, and included data from eight<br />
additional sites re-sampled in 2005. All sites were dairy farms except<br />
for one beef farm.<br />
3. Two new trials explored the possible effects of livestock<br />
intensifi cation upon soil and pasture quality for several years.<br />
The locations of these research farms are illustrated in Figure 3.8.<br />
(B) PHYSICAL PROPERTIES OF <strong>SOIL</strong><br />
<strong>Taranaki</strong>’s soils, particularly its volcanic and organic soils, are generally<br />
more resistant to compaction than other soil types, although they are<br />
not altogether immune to damage. In relation to soil compaction, 97%<br />
of <strong>Taranaki</strong> soils are in the moderately vulnerable to very resistant<br />
categories, with 52% in the very resistant category 13 . <strong>Taranaki</strong>’s<br />
volcanically-based soils have a naturally high resistance to structural<br />
damage and are generally able to withstand intensive land uses while<br />
maintaining essential soil physical qualities. Other types of soils such as<br />
those found on river and stream margins, coastal sandy soils, or alpine<br />
and sub-alpine soils are very vulnerable to soil compaction but comprise<br />
only 3% of <strong>Taranaki</strong> soils.<br />
Soil compaction leads to reduced aeration, a tendency for soils to<br />
turn ‘sour’, decreased water infi ltration and retention capacity, and<br />
accelerated run-off. It is linked to adverse effects on pasture productivity.<br />
Other short-term effects of compacted soil include increased erosion<br />
potential, emissions of nitrous oxide (a greenhouse gas), and leaching<br />
of nitrate.<br />
Figure 3.8: Sites sampled for soil health monitoring and the location of research<br />
farms, the sites of trials.<br />
10 <strong>Taranaki</strong> <strong>Regional</strong> <strong>Council</strong>. 2003. <strong>Taranaki</strong> – Our Place, Our Future. Report on the State of the Environment of the <strong>Taranaki</strong> Region.<br />
11 Sparling, G; Stevenson, B. 2008. Soil Quality in <strong>Taranaki</strong> Region: Characteristics of new sites, and current status of previously sampled sites. Prepared by Landcare Research for the <strong>Taranaki</strong> <strong>Regional</strong><br />
<strong>Council</strong>.<br />
12 Parfi tt, R,L and Ross C. 2007. Soil Profi le Resampling for Carbon, Nitrogen and Phosphorus after 21 to 31 years. Prepared by Landcare Research for the <strong>Taranaki</strong> <strong>Regional</strong> <strong>Council</strong>.<br />
13 Hewitt, AE, 1998. Structural Vulnerability of <strong>Taranaki</strong> Soils. Prepared by Landcare Research for the <strong>Taranaki</strong> <strong>Regional</strong> <strong>Council</strong>.<br />
State of the Environment Report 2009<br />
37
38<br />
<strong>LAND</strong>, <strong>SOIL</strong> & <strong>BIODIVERSITY</strong><br />
<strong>Taranaki</strong> soils are naturally resilient to compaction.<br />
Notwithstanding the generally good soil structure found in <strong>Taranaki</strong><br />
soils, the original ‘500 soils’ study identifi ed some evidence of soil<br />
compaction at 16 of the 32 dairy farm sites investigated 14 . In the 2008<br />
soil study, 60% of the sites sampled showed soil compaction problems<br />
with six of seven dairying sites and four of fi ve drystock sites showing<br />
soil compaction over target levels. However, it should be noted sites<br />
were sampled at the end of winter, a ‘worst case’ situation.<br />
The most likely cause of increased soil compaction has been identifi ed<br />
as the ‘pugging’ of soil by cattle during wet weather (when the soil is<br />
saturated), with paddocks either excessively stocked or left stocked<br />
for extended periods. Compaction is generally reversible. The rate<br />
of recovery depends on subsequent pasture and stock management,<br />
climate and soil type factors 14 .<br />
The stocking rate intensifi cation trial showed that paddocks left<br />
unstocked had the best soil health in terms of soil compaction.<br />
Interestingly, different stocking rates did not show any difference in<br />
compaction rates. One trial showed soil structure improving regardless of<br />
stocking rate as good pasture management was put in place. The biggest<br />
effect on soil compaction, irrespective of stocking rate, occurred when<br />
paddocks were grazed during heavy rainfall. Under these circumstances,<br />
moderate pasture damage occurred as a result. These trials indicate<br />
that pasture management regimes had a far greater potential effect<br />
on pasture quality and soil health than stocking intensity. It was noted<br />
during the experiment that increased stocking rates led to increased loss<br />
of vegetative cover on the pasture 15 . This affects the potential for soil<br />
erosion and sedimentation due to run-off.<br />
Thus soil health can be mitigated by adopting appropriate farm<br />
management techniques such as rapid movement of cattle from<br />
susceptible paddocks, grazing cattle on higher ground during heavy rain<br />
fall and not over-grazing paddocks.<br />
(C) CHEMICAL PROPERTIES OF <strong>SOIL</strong><br />
Organic matter<br />
Organic matter in the soil is important for soil moisture and nutrient<br />
retention, soil structure, availability of trace elements, and plant growth.<br />
Popular perception is that pastoral farming depletes the organic content<br />
and nutrient levels of soil.<br />
14 Sparling, G. 2001. Interpretation of <strong>Taranaki</strong> Region Soil Health Data from the 500 Soils Project, 1998-2000. Prepared by Landcare Research for the <strong>Taranaki</strong> <strong>Regional</strong> <strong>Council</strong>.<br />
15 Unpublished data.<br />
16 Sparling, G and Stevenson, B 2008. Soil Quality in <strong>Taranaki</strong> Region. Prepared by Landcare Research for the <strong>Taranaki</strong> <strong>Regional</strong> <strong>Council</strong>.<br />
TARANAKI – WHERE WE STAND<br />
Rob Tucker<br />
However, the 2008 soil study showed that the carbon content of the<br />
dairying soils was actually overall higher than for the two sites in native<br />
bush, indicating that no or little ‘carbon mining’ is taking place and that<br />
the reverse may actually be occurring, and that there was no overall<br />
trend of decreasing carbon values for pasture as has been observed in<br />
some other regions of New Zealand with different soil types 16 .<br />
The 2007 long-term soil study of sites fi rst analysed 30 and 20 years<br />
ago, found that on average, the total soil organic matter and the<br />
carbon:nitrogen ratio had not changed. The common soil type in <strong>Taranaki</strong><br />
is derived from volcanic rocks. The soil particles with volcanic content<br />
may bind to the organic matter and so prevent the loss of organic<br />
matter from the soil. The fi nding that levels of organic carbon in soil in<br />
<strong>Taranaki</strong> are being maintained under pastoral livestock management,<br />
has implications not only for the aim of protecting the quality and fertility<br />
of these soils, but also for ‘carbon crediting’ in greenhouse gas emission<br />
inventories.<br />
Phosphate levels<br />
Phosphates are nutrients important for plant growth. The 2008 soil<br />
study found that phosphate levels were below levels recommended<br />
for productivity at forestry and drystock sites surveyed, indicating<br />
production is likely to be sub-optimal at such sites, and that productivity<br />
on <strong>Taranaki</strong>’s hill country farms could be enhanced by judicious use of<br />
phosphate fertilisers 16 .<br />
While the studies show that over a 20-30 year time frame phosphate<br />
levels have increased signifi cantly in <strong>Taranaki</strong> soils (68% average),<br />
over the past ten years the increase has in fact been negligible. This is<br />
consistent with fertiliser sales data showing a sharp decline in recent<br />
years. Phosphate levels on almost all dairy farms reported on in the two<br />
studies are considered appropriate.<br />
Nitrogen levels<br />
Nitrogen is another nutrient important for plant growth. Soil nutrient<br />
depletion can be an issue. However, excessive nitrogen levels (which<br />
may arise through excessive fertiliser application or importation of feed)<br />
can lead to nitrate leaching into either surface water or groundwater. It<br />
is also an economic cost to farmers.<br />
Nutrient levels are important for pasture production.<br />
Rob Tucker
The 2008 study found that total nitrogen levels were above<br />
recommended levels on almost all dairy farms and that the average total<br />
nitrogen level on dairy farms had slightly increased over the past 10<br />
years 16 . While soluble nitrogen fell, this may refl ect the infl uence of the<br />
timing of the sampling (winter’s end). However, the 2007 long-term soil<br />
study found that total soil nitrogen in the dairy farm sites probably has<br />
not changed when assessed against 30 or 20 years ago 17 .<br />
Nitrogen in soil is predominantly in the organic form. When it<br />
decomposes it may contribute to increased nitrate leaching but the<br />
majority of nitrate leaching comes from fertiliser and animal excreta,<br />
not the decomposition of organic nitrogen. High total nitrogen refl ects<br />
conditions with vigorous root growth of pasture, which is to be<br />
encouraged. Nutrient levels in cropping/gardening soils were generally<br />
among the highest of all land use classes.<br />
The stocking rate intensifi cation trials found there was no signifi cant<br />
difference in loss of nutrients and trace elements (total nitrogen,<br />
calcium, and magnesium) via leaching, even though stocking rates and<br />
the amount of feed imported increased. For the duration of these trials<br />
Pip Gerard, of AgResearch, with one of the mites brought to <strong>Taranaki</strong>.<br />
IRISH ALIEN TACKLES<br />
ROOT WEEVIL<br />
It’s the stuff of horror movies – but in terms of the health of <strong>Taranaki</strong>’s<br />
soil, it’s a story that has a happy ending in sight.<br />
The protagonist, an Irish wasp called Microctonus aethiopoides,<br />
injects its egg into the target, the clover root weevil called Sitona<br />
lepidus. When the egg hatches, the weevil is fi rstly sterilised then dies<br />
as the mature larva bursts out of the abdomen.<br />
The stakes here rival a blockbuster’s box-offi ce takings. Healthy<br />
clover is a low-cost, natural source of nitrogen, with the value of its<br />
fi xed nitrogen pasture yield, high-quality forage, seed production and<br />
honey production put at $3 billion nationally. The root weevil can<br />
cut clover pasture production by a third or more. This not only takes<br />
a direct economic toll, but forces farmers to apply more nitrogen<br />
fertiliser which can potentially compromise the health of both soil and<br />
waterways.<br />
it was apparent that higher stocking rates do not necessarily lead to an<br />
increase in leaching to groundwater, but rather the issue is more one<br />
of balancing nutrient application and uptake by pasture. The studies<br />
showed that appropriate farm management could improve soil quality<br />
(structure and chemistry) even at higher stocking rates, and that more<br />
highly stocked soils can be as good as those stocked at a lower rate 18 .<br />
(D) RESIDUAL <strong>SOIL</strong> CONTAMINATION<br />
Cadmium and zinc<br />
There is considerable interest in the question of whether cadmium (a<br />
contaminant found in phosphate rock) and zinc (an animal remedy) are<br />
accumulating in pasture soils to an extent that poses an environmental<br />
risk such as toxicity in produce. To this end, the <strong>Council</strong> has reviewed<br />
data from national and specifi c <strong>Taranaki</strong> studies 19,20 .<br />
In these studies, the average cadmium concentration in dairying soils<br />
in <strong>Taranaki</strong> was in the range 0.52-0.66 mg/kg, and for all soils the<br />
averages were 0.47-0.66 mg/kg. Very few results lay above 1.0 mg/kg,<br />
The weevil, a native of Europe and North America, was fi rst discovered<br />
in New Zealand in 1996. By the early part of this decade it had made<br />
its way into <strong>Taranaki</strong> and had also won infamy as one of the nation’s<br />
worst pasture pests.<br />
Enter the Microctonus aethiopoides, a natural enemy of the weevil<br />
and brought to New Zealand by AgResearch in 2005 to fi ght the weevil<br />
under an overall programme funded through Dairy NZ and Meat and<br />
Wool NZ. It was introduced to this region in the summer of 2006-07,<br />
under a project funded by the <strong>Taranaki</strong> <strong>Regional</strong> <strong>Council</strong>.<br />
It got off to a roaring start at two <strong>Taranaki</strong> trial sites. After the release<br />
of 5,000 weevils carrying the wasp egg, parasitism rates of 64% had<br />
been established at Lepperton and 23% at Stratford within six months.<br />
That was encouraging evidence that the Irish wasp would be able<br />
to increase its numbers rapidly in <strong>Taranaki</strong>, and plans were made for<br />
widespread dispersal of parasitised weevils among the region’s famers<br />
during the summer of 2007-08.<br />
Nature intervened, however, with the summer drought hitting pastures<br />
hard. While parasitism levels were good, only one site produced<br />
enough weevils for collection, and dispersal sites were limited to a<br />
couple of farms with good irrigation and plenty of clover.<br />
Another 58 vials of infected weevils have been given to <strong>Taranaki</strong><br />
farmers in 2008, along with background information and instructions<br />
for release.<br />
With more favourable weather expected for the summer of 2008-<br />
09, wider dispersal of the weevils is planned, along with a publicity<br />
campaign.<br />
It may not be an Oscar-winner, but the wasp-versus-weevil story is a<br />
gripping one for <strong>Taranaki</strong> landowners.<br />
17 Parfi tt, R,L and Ross C. 2007. Soil Profi le Resampling for Carbon, Nitrogen and Phosphorus after 21 to 31 years. Prepared by Landcare Research for the <strong>Taranaki</strong> <strong>Regional</strong> <strong>Council</strong>.<br />
18 Unpublished data.<br />
19 <strong>Taranaki</strong> <strong>Regional</strong> <strong>Council</strong>. 2005. Cadmium in <strong>Taranaki</strong> Soils: An assessment of cadmium in <strong>Taranaki</strong> soils from the application of superphosphate fertiliser.<br />
20 Sparling, G. 2001. Interpretation of <strong>Taranaki</strong> Region Soil Health Data from the 500 Soils Project, 1998-2000. Prepared by Landcare Research for the <strong>Taranaki</strong> <strong>Regional</strong> <strong>Council</strong>.<br />
<strong>Taranaki</strong> Daily News<br />
State of the Environment Report 2009<br />
39
40<br />
<strong>LAND</strong>, <strong>SOIL</strong> & <strong>BIODIVERSITY</strong><br />
Aerial topdressing.<br />
with the highest reported in any study 1.7 mg/kg. Generally cadmium<br />
levels were highest on grazed pastures (but there was little distinction<br />
between pastoral soils and plantation soils), and lowest within<br />
indigenous forestry soils. Internationally, guideline values for cadmium in<br />
agricultural soils (including beef, sheep, and horticultural soils) are in the<br />
range 1-12 mg/kg, with the lower values being used for triggering the<br />
need for further investigation (1.0-1.4 mg/kg). The majority of <strong>Taranaki</strong><br />
sites were about half the lower guideline values.<br />
At the average rate of increase found in some of these studies, it would<br />
be approximately 100 years before the average for dairy sites exceeds<br />
the guideline values and triggers the need for further investigation.<br />
Modelling of cadmium accumulation predicts that soil concentrations of<br />
cadmium will in fact reach a limiting value around 1.3 mg/kg or a little<br />
higher, depending upon phosphate fertiliser application rates 21 . It should<br />
also be noted that the current rate of application of superphosphate<br />
(2007) is now less than what it was in the preceding four decades<br />
(Figure 3.9) 22 , and the current cadmium concentration in superphosphate<br />
is less than half of what it was over that period. These factors would<br />
considerably extend the period before levels were reached that would<br />
necessitate further investigations. A national working party is examining<br />
options for controlling cadmium accumulation in agricultural soils. The<br />
working party also advises that, in any case, ‘dairy (milk), muscle meat<br />
and fruit products are unlikely to be at risk of high cadmium levels, due<br />
to the low capacity of these products to store cadmium’ 23 .<br />
Figure 3.9: Tonnes of superphosphate-based fertiliser used in <strong>Taranaki</strong><br />
(see note below on data used).<br />
21 Taylor M et al, 2007. Soil Maps of Cadmium in New Zealand. Published by Landcare Research.<br />
22 Note: Data on tonnes of superphosphate not available for all years. For 1957, and 1961-1980 Statistics New Zealand just records fertiliser used and tonnes of lime. Given that the main fertiliser<br />
used during those years, the graph uses this fi gure as the estimate for quantities of superphosphate used.<br />
23 Cadmium Working Group. November 2007. Summary of Risks from Cadmium in Agricultural Soils.<br />
TARANAKI – WHERE WE STAND<br />
Rob Tucker<br />
Data: Statistics NZ<br />
Zinc concentrations at all sites were far below guideline limits. While<br />
the highest soil concentration was found in one dairy pasture site,<br />
generally levels were similar in all land uses surveyed: indigenous bush,<br />
plantation forest and beef pasture sites.<br />
Of note is that the forms of both cadmium and zinc that are readily<br />
available for uptake or ingestion by plants or animals were several<br />
orders of magnitude or more lower in concentrations than the total<br />
concentrations of these elements. This highlights that in <strong>Taranaki</strong> soils<br />
these metals are simply not readily available for plants or animals.<br />
Agrichemicals<br />
As part of the 2008 soil survey, samples were also collected for evidence<br />
of residual contamination by agrichemicals. All sites were tested for a<br />
suite of 18 different acidic herbicides (including acetochlor, chlorpyalid,<br />
dicamba, 2,4-D, haloxyfop, MCPA, MCPB, pentachlorophenol, picloram,<br />
2,4,5-T, 2,4,5-TP, and triclopyr). Sites were also tested for a suite of 72<br />
different chemicals that are used to control insects or fungus. These<br />
included acephate, atrazine and its derivatives, captan, chlorpyrifos,<br />
cyfl uthrin, diazinon, dichlorvos, malathion, parathion, permethrin,<br />
simazine, trifl uralin, and vinclozolin.<br />
The limits of detection for the herbicides were in the range 0.008-0.02<br />
mg/kg. The limits of detection for the pesticides were in the range<br />
0.009-0.04 mg/kg.<br />
Out of 72 pesticides tested for in 20 samples (1,440 results), 12 results<br />
returned a positive result (in each case, just on the limit of detection).<br />
That is, 99.17% of all results were negative for the presence of any<br />
pesticide. One sample had fi ve positive detections, while a second had<br />
two. Perhaps unsurprisingly, these two sites were the two cropping<br />
sites tested. Otherwise each of the remaining fi ve results occurred in a<br />
different sample, i.e. none of these fi ve latter sites (two drystock farms<br />
and three forestry plots) had more than a single pesticide (out of 72)<br />
confi rmed present.<br />
No agrichemicals were detected in the soil at any dairy farm site, the<br />
predominant land use on the ring plain of <strong>Taranaki</strong>.<br />
The herbicide acetochlor was detected at fi ve sites (some drystock,<br />
market gardening, and indigenous forest sites), otherwise no<br />
agrichemical was detected at more than one site. Acetochlor is used for<br />
pre-emergent weed control in cropping. It is strongly absorbed by soil,<br />
with little leaching, and a half life of 8-18 days i.e. it degrades rapidly<br />
and is not persistent or cumulative.<br />
On the basis of these results, there is no evidence of any issue of<br />
residual or cumulative agrichemicals in the soils of the region.<br />
(E) BIOLOGICAL HEALTH<br />
Soil biological health can be assessed from the soil microbial biomass<br />
and soil respiration. The diversity of the soil invertebrate community<br />
can be assessed by counting the numbers and types of soil nematodes<br />
(small worm-like animals). However, research on using these measures<br />
as indicators of soil health is in its preliminary stage and there is still
little understanding of the consequences of changes in soil biodiversity 24 .<br />
The <strong>Council</strong> still chose to pursue this component of soil assessment<br />
because of the growing awareness of the need to safeguard ecological<br />
diversity within soil communities, and that soil health has a biological,<br />
as well as structural and chemical, component.<br />
Popular perception is that soils under pastoral management tend to<br />
have lower diversity and ecological richness than plantation forestry and<br />
indigenous bush soils. The results of the 2008 soil survey do not bear<br />
this out. Soil biodiversity was poor only in cropped soils. These sites<br />
were also among those with the lowest quantity of microbial biomass.<br />
The report notes that cropping sites frequently have lower microbial<br />
biomass than pastures, because of repeated soil disturbance and<br />
reduced returns to soil. Forestry sites had invertebrate communities that<br />
refl ected a damp environment with a high rate of organic decomposition.<br />
The study fi ndings will be used as a baseline for future studies and can<br />
also be revisited as expertise and experience in interpretation develops.<br />
3.2.2 HOW IS <strong>SOIL</strong> HEALTH<br />
MANAGED IN TARANAKI?<br />
(A) REGIONAL PLANS<br />
The <strong>Council</strong> addresses soil health through the <strong>Regional</strong> Soil Plan for<br />
<strong>Taranaki</strong> and the <strong>Regional</strong> Fresh Water Plan for <strong>Taranaki</strong>. The Soil Plan’s<br />
soil health objective, policies and methods focus on non-regulatory<br />
methods. Through the plan, monitoring systems have also been put in<br />
place to monitor and gather information on the long-term effects of land<br />
use activities on soil health. The <strong>Regional</strong> Fresh Water Plan includes<br />
objectives, policies, and methods (including rules) addressing the effects<br />
of discharges of contaminants to land, whether from animals, effl uent<br />
treatment, or applications of fertiliser and pesticides.<br />
In implementing the plans the <strong>Council</strong> seeks to raise public awareness<br />
of soil health issues, optimise soil productivity and promote the adoption<br />
of practices by farmers that will avoid or minimise soil structure<br />
degradation, soil nutrient depletion, or residual soil contamination<br />
problems.<br />
(B) RESOURCE CONSENTS<br />
The <strong>Taranaki</strong> <strong>Regional</strong> <strong>Council</strong> issues consents for discharges to land,<br />
in accordance with the rules set out in the <strong>Regional</strong> Fresh Water Plan.<br />
At the end of June 2008, there were 875 consents for the discharge of<br />
agricultural wastes to land, 817 from farm dairy discharges, and 298 for<br />
the discharge of non-agricultural wastes to land. 75% of all discharges<br />
to land, were for the land application of farm dairy effl uent. The total<br />
number and the proportion of such discharges directly to land instead<br />
of to water is steadily increasing in the region – a product of increased<br />
amalgamation of dairy farms, increased environmental awareness and<br />
recognition of the fertiliser benefi t of discharging to land.<br />
Over half of all the consents for the discharge to land of nonagricultural<br />
wastes have been granted within the past fi ve years.<br />
Figure 3.10: Number of land related incidents over time compared to the number<br />
of incidents reported each year.<br />
These predominantly relate to discharges of sediments associated with<br />
earthworks, septic tank soakage systems, cleanfi lls, stormwater and<br />
hydrocarbon exploration sites discharging to land soakage, and the land<br />
incorporation of drilling wastes and fl uids.<br />
(C) UNAUTHORISED INCIDENTS<br />
The <strong>Council</strong> maintains a register of complaints, and follows these up.<br />
The number of incidents related to land compared with the total number<br />
of other complaints is illustrated in Figure 3.10. Over the past six years<br />
these have largely arisen from complaints about dairy farms (29%),<br />
cleanfi lls (15%), meatworks and transport operators.<br />
(D) INFORMATION, EDUCATION AND ADVICE<br />
The <strong>Council</strong> responds to all requests from the public for information on<br />
soil health. The provision of information and advice can raise awareness<br />
of issues and problems and provide simple cost-effective solutions<br />
enabling land users to make well-informed decisions to prevent or<br />
minimise the effects of their land use practices on soil health.<br />
The <strong>Council</strong> also promotes the use of guidelines, codes of practice,<br />
and standards, particularly on the application of pesticides, fertilisers<br />
and other agricultural compounds. This applies especially for those<br />
developed by the industry for the agricultural sector such as the Code of<br />
Practice for Nutrient Management 25 and the Spreadmark Programme 26 .<br />
The Dairying and Clean Streams Accord 27 is part of a range of activities<br />
to promote sustainable dairy farming in New Zealand. One of the<br />
six priorities for action adopted by the region includes the effective<br />
management of nutrients 28 . The <strong>Regional</strong> Action Plan for <strong>Taranaki</strong> sets a<br />
target of 100% of dairy farms to have a nutrient budget in place by 2007.<br />
By June 2008, 99.1% of dairy farms had a nutrient budget in place.<br />
This was up from 22% in 2004-05 29 . With Fonterra proposing fi nancial<br />
penalties for farms that do not have a nutrient budget, it is anticipated<br />
that by the 2008-09 dairy season all supply farms will have nutrient<br />
budgets, a quadrupling within four years and a very positive situation for<br />
the health of <strong>Taranaki</strong>’s soil resources.<br />
24 Sparling, G and Stevenson, B 2008. Soil Quality in <strong>Taranaki</strong> Region. Prepared by Landcare Research for the <strong>Taranaki</strong> <strong>Regional</strong> <strong>Council</strong>.<br />
25 Fert Research, 2007. Code of Practice for Nutrient Management.<br />
26 New Zealand Groundspread Fertilisers Association. 1994. Spreadmark Programme.<br />
27 Fonterra Co-operative Group, regional councils, unitary authorities, the Ministry for the Environment, and the Ministry of Agriculture and Forestry, 2003. Dairying and Clean Streams Accord.<br />
28 <strong>Taranaki</strong> <strong>Regional</strong> <strong>Council</strong>, 2004. <strong>Regional</strong> Action Plan for <strong>Taranaki</strong>.<br />
29 <strong>Taranaki</strong> <strong>Regional</strong> <strong>Council</strong>, 2008. Dairying and Clean Streams Accord. Annual Report 2007-08.<br />
State of the Environment Report 2009<br />
41
42<br />
<strong>LAND</strong>, <strong>SOIL</strong> & <strong>BIODIVERSITY</strong><br />
Taking soil samples.<br />
(E) MONITORING AND INVESTIGATIONS<br />
Since its 1996 State of the Environment Report, the <strong>Taranaki</strong> <strong>Regional</strong><br />
<strong>Council</strong> has undertaken investigative monitoring and participated in the<br />
national ‘500 soils’ project (including its own continuing investigations<br />
based on the ‘500 soils’ methodology) in order to fi rst ‘benchmark’<br />
and then track trends in soil health indicators. Future monitoring will<br />
be based on the ‘500 soils’ Project (which, subject to review, will be<br />
continued at fi ve-yearly intervals).<br />
The <strong>Council</strong> supports work investigating the effects on soil health of<br />
different stocking rates with supplementary feeding regimes at two<br />
research farms. Research into the biodiversity and ecological richness<br />
associated with the varying stocking intensities, the effects on soil<br />
characteristics of nitrogen inhibitors, validation of soil nutrient modeling<br />
and the effects on soil structure from cropping and pasture renewal has<br />
been commissioned.<br />
For example, during 2007-08, the <strong>Council</strong> investigated the impacts<br />
of higher dairy stocking rates on soil biodiversity. Plant, nematode,<br />
earthworm and invertebrate abundance and diversity were compared<br />
between paddocks with different stocking intensities. This found that<br />
higher stocking rates led to paddocks with higher proportions of bare<br />
ground. Higher stocking rates had little impact on overall nematode<br />
density or on species diversity, probably because the higher stocking<br />
rates had little effect on soil bulk density as <strong>Taranaki</strong> soil is generally<br />
resistant to soil compaction damage. There were no signifi cant effects<br />
Table 3.5: Summary of progress: implementing regional objectives and policies on soil health.<br />
30 Schipper, L et al. 2007. Large losses of soil C and N from soil profi les under pasture in New Zealand during the past 20 years. Global Change Biology 13:6 pp.1138-1144<br />
31 Sparling, G, and Schipper, L. 2004. Soil quality monitoring in New Zealand: trends and issues arising from a broad scale survey 1995–2001. Agriculture, Ecosystems and Environment vol 104, pp<br />
545–552.<br />
32 Sparling, G. 2007. Land: Soil Quality Assessed from the 500 Soils Project, unpublished, prepared for the Ministry for the Environment. Wellington: Ministry for the Environment.<br />
33 Ministry for the Environment. 2007. Environment 2007.<br />
TARANAKI – WHERE WE STAND<br />
of increased stocking rates on earthworm species’ richness, or on<br />
earthworm densities, with the exception of Aporrectodea longa, a<br />
useful deep burrowing species, which was found to be more abundant<br />
in the highly stocked paddocks. This increase was not surprising as this<br />
species of earthworm feeds on the surface where there was more food<br />
(more dung from the higher stocking rate). It might even be that this<br />
earthworm helped offset impacts of stock compacting the soil to a small<br />
extent.<br />
During the 2007-08 year the <strong>Council</strong> also investigated the effects of<br />
disposing of oil drilling wastes onto land on the soil biology. Earthworm<br />
densities were compared between areas that had and had not been<br />
subject to various types of drilling waste application. Preliminary results<br />
indicate that applying drilling wastes to land in a manner that complies<br />
with consent conditions does have negative impacts on earthworm<br />
numbers, but these impacts subside with time and populations are able<br />
to recover over the long term. Further studies are planned to investigate<br />
the reasons for these negative impacts and to investigate ways to<br />
improve the ways in which drilling wastes are disposed to land.<br />
(F) SUMMARY OF PROGRESS<br />
Progress on implementing regional objectives and policies on soil health<br />
is summarised in Table 3.5.<br />
3.2.3 HOW DO WE COMPARE?<br />
Two studies have recently been completed looking at soils across New<br />
Zealand. One study looked at changes in total carbon and nitrogen in<br />
pastoral soils over the past 17-30 years 30 . It found that on average, soils<br />
had lost statistically signifi cant amounts of both carbon and nitrogen.<br />
This loss of organic material from soils was attributed primarily to<br />
grazing, distinct from erosion or leaching. Of the <strong>Taranaki</strong> sites in the<br />
study, half showed increases in carbon and nitrogen in contrast with<br />
the national trends, and those sites that did show a loss of carbon or<br />
nitrogen showed smaller losses than sites elsewhere in the country.<br />
As part of the ‘500 soils’ Project, six key measures of soil health were<br />
monitored across seven major land-use categories in New Zealand 31,32 .<br />
These were reported on in the national state of the environment report 33 .<br />
Interestingly, of all land use types, the soil used for dairying and drystock<br />
Issue What do we want to achieve? What are we doing about it? Where are we at?<br />
Soil health No adverse change in soil structure on<br />
privately-owned land.<br />
No adverse depletion in the nutrient levels<br />
of soils on privately-owned land.<br />
No adverse increase in residual<br />
contaminant levels in soils on privately<br />
-owned land.<br />
<strong>Taranaki</strong> <strong>Regional</strong> <strong>Council</strong><br />
Implementing the <strong>Regional</strong> Soil Plan.<br />
Providing advice and information.<br />
Advocacy.<br />
Soil health investigations and research.<br />
Monitoring.<br />
<strong>Regional</strong> Soil Plan made operative in<br />
October 2001<br />
Monitoring shows soil compaction at<br />
some sites but no evidence to date of long<br />
term change in soil structure.<br />
Further research into soil structure<br />
and nutrient soil levels management<br />
commissioned.<br />
No adverse depletion of soil nutrients or<br />
organic content.<br />
No adverse increase in residual<br />
contamination from diffuse activities.
had the highest carbon and nitrogen levels of all land use types, well<br />
above (for example) native forestry or tussock. In this work, the average<br />
levels of carbon and nitrogen in <strong>Taranaki</strong>’s dairying soils were 22% and<br />
24%, respectively, higher than the national average for dairying soils.<br />
However, this same study showed that soil compaction in <strong>Taranaki</strong>’s<br />
dairying soils was worse than the average, scoring only 6.1% on the soil<br />
compaction measure used, compared to an average of 10.1% across the<br />
whole country, although it is worth noting that these were sampled at<br />
the end of winter, the worst-case timing. Nationwide, half of all dairy<br />
soil sites scored below 10% which is the threshold of adverse effects<br />
upon productivity.<br />
In terms of cadmium levels, nationwide, the highest single soil cadmium<br />
level has been found in Waikato, with Bay of Plenty also having a high<br />
average along with <strong>Taranaki</strong> 34 . The highest results are associated with<br />
dairying, but orcharding had similar average values. Peat soils were<br />
found to have the highest potential for cadmium accumulation. These<br />
soils are rare in <strong>Taranaki</strong>. Beef and sheep farming sites had values very<br />
close to the national average.<br />
3.3 CONTAMINATED SITES<br />
Contaminated sites result from historical activities and industries where<br />
hazardous substances were inappropriately stored, used or disposed<br />
of, although these activities may well have been lawful at the time.<br />
Contamination may remain on-site in soil and/or move off site in surface<br />
water, groundwater or air discharges, posing a wider risk to both public<br />
health and the environment. Examples of land uses that could result<br />
in site contamination include landfi lls, engineering workshops, timber<br />
treatment sites, rail yards, gasworks, scrap metal yards and stock dips.<br />
Present day activities and industries are much less likely to result in<br />
contaminated land, as those involving discharges to the environment<br />
are controlled under the RMA, while the storage and use of hazardous<br />
substances is controlled under the Hazardous Substances and New<br />
Organisms Act 1996 (HSNO).<br />
Table 3.6: Status of sites on the Register of Selected Land Uses (RSLU).<br />
No. of sites Status Comments<br />
757<br />
480<br />
16<br />
0*<br />
Hazardous substances not present -<br />
No identifi ed contamination<br />
Hazardous substances present -<br />
Risk acceptable for land use<br />
Hazardous substances not present -<br />
Remediation undertaken<br />
Hazardous substances present -<br />
Risk unacceptable for land use<br />
28 Verifi ed history of hazardous activity/industry<br />
3.3.1 WHAT IS THE STATE<br />
OF CONTAMINATED SITES<br />
IN TARANAKI?<br />
In 1992 a report on potentially contaminated sites in New Zealand 35<br />
was released, suggesting there might be 272 potentially contaminated<br />
sites in <strong>Taranaki</strong>. Given the desirability of a degree of certainty about<br />
the extent of any site contamination in the region, the <strong>Taranaki</strong> <strong>Regional</strong><br />
<strong>Council</strong> embarked on a programme to investigate sites of interest,<br />
particularly timber treatment sites, sawmilling sites, landfi lls and<br />
rubbish dumps. This resulted in a number of extensive and thorough<br />
investigations and reports 36 .<br />
No national environmental standard currently exists on contaminants<br />
in soil. Sites are therefore classifi ed on the basis of inspections and<br />
investigations carried out by the <strong>Council</strong> and a variety of currently<br />
available guidelines from both New Zealand and overseas.<br />
The <strong>Council</strong> also developed a database, called the Register of Selected<br />
Land Uses (RSLU), to record information about sites in the region, where<br />
past or current activities may have resulted in contamination.<br />
The RSLU includes information on sites which have been investigated<br />
for various reasons, including allegations of contamination. The total<br />
number of sites on the database does not indicate the number of<br />
contaminated sites, but rather the number of sites that have been<br />
investigated. There are 1,281 sites currently on the RSLU database<br />
(Table 3.6). The majority of sites (757), almost 60% of the total, have<br />
been investigated and no contamination has been found. A further 480<br />
sites, or 37%, have had hazardous substances detected, but they pose<br />
no risk. Sixteen sites have been remediated, and there are no sites<br />
where the risk of the contamination means they are unable to be used.<br />
Twenty eight sites remaining on the database require further<br />
investigation. These are generally low-risk sites, such as sites where<br />
notifi cation has been received from the New Zealand Police regarding<br />
clandestine drug laboratories (previous investigations have shown that<br />
the land at such properties is not usually contaminated). The 28 sites<br />
also include those identifi ed in the Moturoa oil fi eld investigation 37 ,<br />
Investigations have shown no contamination is present<br />
Includes managed and remediated sites<br />
Remediated to background levels<br />
Contaminated sites<br />
Low-risk sites unlikely to be contaminated, where further investigation is<br />
required to confi rm status<br />
*At the time of preparing this report, asbestos at the P _ atea freezing works site had been stabilised, and so the site in the interim does not pose an unacceptable risk<br />
environmentally. Long-term remediation is still necessary.<br />
34 Taylor M et al. 2007.Soil Maps of Cadmium in New Zealand. Published by Landcare Research.<br />
35 Ministry for the Environment 1992. Potentially Contaminated Sites in New Zealand: A broadscale assessment. Prepared by Worley Consultants Ltd<br />
36 <strong>Taranaki</strong> <strong>Regional</strong> <strong>Council</strong>. Investigation of Possible Dieldrin Storage and Disposal Sites in <strong>Taranaki</strong>, (1993); Investigations of Past Refuse Dumping Sites in <strong>Taranaki</strong>, (1995); Investigations of Past<br />
Refuse Dumping Sites in <strong>Taranaki</strong>, (1996); Investigation of Timber Treatment and Sawmilling Sites in <strong>Taranaki</strong>, (1995); Site Investigations: Drycleaners, scrap metal yards, rail yards and gasworks,<br />
(2000); and Investigation of Alleged Agrichemical Waste Disposal Sites in New Plymouth, (2001).<br />
37 <strong>Taranaki</strong> <strong>Regional</strong> <strong>Council</strong>, Feb 2003. Moturoa Oil Field Investigation: Stage 1. Prepared by Transfi eld Worley Ltd<br />
State of the Environment Report 2009<br />
43
44<br />
<strong>LAND</strong>, <strong>SOIL</strong> & <strong>BIODIVERSITY</strong><br />
where any risk is due to the presence of the abandoned oil wells rather<br />
than the presence of hazardous substances. The <strong>Council</strong> has completed<br />
a follow-up investigation of one well which showed no evidence of any<br />
leaking from the well head. Investigations of other wells are planned.<br />
3.3.2 HOW ARE CONTAMINATED<br />
SITES MANAGED IN TARANAKI?<br />
(A) REGIONAL POLICY STATEMENT AND PLANS<br />
The Proposed <strong>Regional</strong> Policy Statement for <strong>Taranaki</strong>, 2008 states that<br />
all known and potentially contaminated sites are to be identifi ed and<br />
managed in a manner that avoids or mitigates actual and potential<br />
adverse effects on both the environment and human health. Priority<br />
actions are determined by the type of contaminants, the degree of<br />
contamination, existing and future uses of the site and the potential<br />
for adverse environmental and public health effects. The <strong>Regional</strong> Air<br />
Quality Plan and <strong>Regional</strong> Fresh Water Plan contain rules to regulate the<br />
discharge of hazardous substances.<br />
(B) DISTRICT PLANS<br />
The New Plymouth District Plan, the South <strong>Taranaki</strong> District Plan<br />
and the Stratford District Plan all contain policies and methods that<br />
recognise the importance of managing hazardous substances to avoid<br />
contaminating the environment, and aim to facilitate the clean-up and<br />
rehabilitation of contaminated sites. District councils work closely with<br />
the <strong>Taranaki</strong> <strong>Regional</strong> <strong>Council</strong> to ensure that information about known<br />
contaminated sites is readily available to interested parties, such as<br />
landowners, potential purchasers and developers. Subdivisions and uses<br />
of rehabilitated sites are managed under district plans.<br />
(C) PROPERTY DATABASE<br />
The RSLU database is continually updated as new information is<br />
received. Information may be obtained from the <strong>Council</strong>’s own activities,<br />
including investigations, regular monitoring and inspection programmes,<br />
and responses to unauthorised incidents. Information may also be<br />
provided by consultants carrying out site investigations, property<br />
owners, and members of the public.<br />
Dangerous goods storage.<br />
38 Ministry for the Environment, 2003. Contaminated Land Management Guidelines No. 1. Reporting on Contaminated Sites in New Zealand.<br />
39 <strong>Taranaki</strong> <strong>Regional</strong> <strong>Council</strong>, 2008. Patea Freezing Works Detailed Site Investigation Report.<br />
TARANAKI – WHERE WE STAND<br />
<strong>Taranaki</strong> <strong>Regional</strong> <strong>Council</strong><br />
Sites on the RSLU database are identifi ed on www.trc.govt.nz through<br />
the <strong>Regional</strong> Xplorer. The information available includes the historical<br />
and current land uses, site status and a link to inspection data. A full<br />
site report can be made available on request from the <strong>Taranaki</strong> <strong>Regional</strong><br />
<strong>Council</strong>. Real estate agents, land valuers, and solicitors have been<br />
advised of the RSLU and regularly make use of it.<br />
Future development and subdivision of former agricultural or industrial<br />
land for residential use has the potential to lead to an increase in the<br />
number of sites considered contaminated as land uses change.<br />
(D) MONITORING AND INSPECTIONS<br />
The Hazardous Activities and Industries List (HAIL) is a compilation<br />
of activities and industries that are considered likely to cause land<br />
contamination resulting from hazardous substance use, storage or<br />
disposal 38 . The list includes industries such as abrasive blasters, cement<br />
works, garages/workshops, light engineering, paint sprayers, sawmills<br />
and other industries. The <strong>Council</strong> regularly monitors these industries for<br />
their compliance with consent conditions or permitted activity standards.<br />
Where industries fail to meet consent conditions or standards in<br />
regional plans they are re-inspected and if required, enforcement action<br />
is undertaken (including requirements for remediation).<br />
(E) INVESTIGATIONS AND REMEDIATION<br />
The <strong>Council</strong> has been proactive in the investigation of sites where<br />
past or current activities may have resulted in contamination. Some<br />
of these investigations have identifi ed site contamination that poses<br />
unacceptable risks to the environment. A number of sites, with no<br />
apparent owner, have successfully been remediated in co-operation with<br />
the region’s district councils. In 2003-04 this included four scrap metal<br />
yards, a garage, and two former gasworks sites.<br />
In May 2008 the <strong>Council</strong> reported on the investigation undertaken of the<br />
former P _ atea freezing works 39 (see case study). The report concluded<br />
that asbestos and electrical equipment containing PCBs are the only<br />
contamination issues remaining on the site.<br />
Due to the careful and strategic use of resources the <strong>Council</strong> has<br />
devoted to the issue of contaminated land since the early 1990s, only a<br />
small number of low-risk sites now require further investigation.<br />
<strong>Taranaki</strong> Sawmills, Bell Block.<br />
<strong>Taranaki</strong> <strong>Regional</strong> <strong>Council</strong>
Fire raged through the abandoned P _ atea Freezing Works, 6 February 2008.<br />
AFTER THE HEAT CAME THE LIGHT<br />
The heat went on – literally – in the midst of a lengthy site<br />
contamination investigation at the abandoned P _ atea freezing works.<br />
Interrupted by a major fi re, the investigation was one of the most<br />
extensive and complicated ever carried out by the <strong>Taranaki</strong> <strong>Regional</strong><br />
<strong>Council</strong>. But it has helped to defi ne a positive way forward in dealing<br />
with the site.<br />
Asbestos, hydrocarbons, PCBs and a range of other chemicals including<br />
nitric acid were on the list of possibilities in 2007 as <strong>Council</strong> staff began<br />
preparing to assess the site, which has lain disused for 20 years.<br />
On-site work began in January 2008 but was dramatically interrupted<br />
on Ash Wednesday, 6 February, when a major fi re at the old works<br />
caused the evacuation of hundreds of townsfolk because of fears of<br />
airborne asbestos in the smoke.<br />
While subsequent air sampling indicated no asbestos contamination in<br />
the township, it was obvious that as a priority, urgent measures were<br />
needed to stabilise asbestos fi bres left in the ruins of the site. <strong>Taranaki</strong><br />
<strong>Regional</strong> <strong>Council</strong> technical and compliance staff suggested the use<br />
of a polymer dust suppressant of the type they are familiar with at<br />
construction sites and transport yards.<br />
This succeeded beyond expectations, adhering to hard surfaces<br />
and soaking into the fi ne material and forming a thick spongy layer<br />
that bound ash and other fi re debris, and ensured dust from the site<br />
wouldn’t go anywhere. Subsequent air sampling has confi rmed this.<br />
(F) HAZARDOUS SUBSTANCES AND NEW<br />
ORGANISMS ACT<br />
The <strong>Council</strong> inspects industries and businesses to check compliance<br />
with the Hazardous Substances and New Organisms Act. Businesses<br />
are not charged for the HSNO inspections which are done in conjunction<br />
with other inspections or monitoring wherever possible. The inspections<br />
are done under a contract with the Department of Labour.<br />
Hawera Fire Brigade<br />
The tangled mess left at the site posed more challenges for <strong>Council</strong><br />
staff as they resumed their site assessment. PCBs were removed where<br />
possible, and old drums of acid were removed or neutralised on-site.<br />
In the meantime, the publicity around the big fi re highlighted<br />
uncertainty over ownership of the site, with several parties involved.<br />
On-site investigations continued for four more months, covering soil,<br />
groundwater, air quality, and the ecology of the adjacent estuary. As a<br />
result of the site investigation, the <strong>Taranaki</strong> <strong>Regional</strong> <strong>Council</strong>’s report<br />
concluded that concentrations of all on-site contaminants are below<br />
relevant guidelines except for asbestos, which has been stabilised<br />
with the polymer binder.<br />
Surface water discharging from the site has elevated levels of metals.<br />
This goes directly into the estuary where it is immediately diluted<br />
many times over, and would not exceed guidelines or pose a signifi cant<br />
risk to human health, or to the P _ atea River ecosystem.<br />
The <strong>Council</strong>’s Director-Environment Quality, Gary Bedford, said he<br />
was pleased the investigation carried out by the <strong>Council</strong> had provided<br />
encouraging answers to many questions about the state of the site.<br />
The South <strong>Taranaki</strong> District Mayor, Ross Dunlop, said that now his<br />
<strong>Council</strong> knows what contaminants it is dealing with, it can make plans<br />
for moving forward. He says the next step will be talks with central<br />
Government, land owners and iwi aimed at getting the site cleaned up.<br />
The then Minister for the Environment, Trevor Mallard, announced<br />
Government funding of $1.5 million to help with cleaning up the site.<br />
The clean-up was expected to take place over a period of up to 40<br />
weeks in 2009.<br />
<strong>Taranaki</strong> <strong>Regional</strong> <strong>Council</strong> staff prepare to move hazardous waste after the fi re.<br />
The Environmental Risk Management Authority assigns various controls<br />
for sites based on the risk of hazardous substances that are stored or<br />
used. Controls may include ‘Location Test Certifi cates’ (similar to the old<br />
dangerous goods licences), ‘Approved Handlers Registrations’ for people<br />
handling hazardous substances, and tracking of hazardous substances.<br />
Compliance with these controls is assessed during inspections.<br />
<strong>Taranaki</strong> <strong>Regional</strong> <strong>Council</strong><br />
State of the Environment Report 2009<br />
45
46<br />
<strong>LAND</strong>, <strong>SOIL</strong> & <strong>BIODIVERSITY</strong><br />
(G) SUMMARY OF PROGRESS<br />
Progress on implementing regional objectives and policies on<br />
contaminated sites is summarised in Table 3.7.<br />
3.3.3 HOW DO WE COMPARE?<br />
In the Environment New Zealand 2007 40 report, 10 regions in New Zealand<br />
self-reported on contaminated sites. The data are shown in Table 3.8.<br />
Table 3.7: Summary of progress: implementing regional objectives and policies on contaminated sites.<br />
40 Ministry for the Environment, 2007. Environment 2007.<br />
TARANAKI – WHERE WE STAND<br />
Since this report was released, remediation has occurred at additional<br />
sites in the <strong>Taranaki</strong> region. The fi gures show that as expected, most<br />
reported and confi rmed contaminated sites are in the more populated<br />
regions that have high levels of industrial and agricultural activity.<br />
As discussed earlier, <strong>Taranaki</strong> has no contaminated sites - all sites have<br />
either been remediated or are actively managed to ensure there are<br />
no signifi cant adverse effects on the environment, such as the P _ atea<br />
freezing works site.<br />
Issue What do we want to achieve? What are we doing about it? Where are we at?<br />
Management<br />
of hazardous<br />
substances<br />
Investigation and<br />
management of<br />
contaminated sites<br />
Improvement in management RMA and HSNO advice, controls and<br />
monitoring are provided by the <strong>Regional</strong><br />
<strong>Council</strong>.<br />
Information on potentially<br />
contaminated sites, provision of<br />
accessible public information, and<br />
appropriate management of sites<br />
where there is an environmental or<br />
public health risk.<br />
Table 3.8: Self-reported information on contaminated sites in 10 regions, 2006–2007.<br />
Region Total number of sites that<br />
have been found to be<br />
contaminated<br />
All identifi ed high-risk contaminated sites<br />
have been remediated and by December<br />
2008 all identifi ed medium risk contaminated<br />
sites will be effectively managed or<br />
remediated by the <strong>Council</strong>.<br />
The <strong>Council</strong> contaminated sites database will<br />
conform to the Ministry for the Environment<br />
Classifi cation and Management Protocols<br />
and district councils will have access to this<br />
database and subsequent updates.<br />
The district councils will acknowledge within<br />
fi ve working days an enquiry for information<br />
concerning contaminated sites.<br />
Number of contaminated<br />
sites not yet cleaned up or<br />
actively managed1<br />
Number of cleaned up<br />
sites<br />
Inspections of businesses are undertaken<br />
by the <strong>Regional</strong> <strong>Council</strong> in conjunction with<br />
RMA monitoring. There is a high level of<br />
compliance.<br />
All contaminated sites in <strong>Taranaki</strong><br />
remediated or effectively managed. 1,281<br />
sites recorded on the database.<br />
MfE proposing a National Environmental<br />
Standard for database requirements. Register<br />
of selected land uses incorporates current<br />
MfE guidelines.<br />
Enquiries regarding the database come<br />
directly from the public.<br />
Number of actively<br />
managed sites<br />
Auckland 368 93 109 166<br />
Waikato 258 118 140 See note 2<br />
Wellington 149 77 46 26<br />
Canterbury 134 10 124 See note 2<br />
Otago 93 35 21 37<br />
Bay of Plenty 85 42 4 39<br />
Hawke’s Bay 65 8 57 See note 2<br />
<strong>Taranaki</strong> 39 0 10 29<br />
Marlborough 24 5 15 4<br />
Tasman 23 4 19 See note 2<br />
Total 1,238 392 545 301<br />
Notes:<br />
(1) This column includes only sites that have not yet been cleaned up or managed, except for the Auckland fi gure, which includes some sites that have resource<br />
consents (and are therefore managed).<br />
(2) The number of managed sites in this region is included under the column for confi rmed cleaned up sites.<br />
Data source: Listed regional councils.
Indigenous vegetation in Egmont National Park.<br />
3.4 <strong>BIODIVERSITY</strong> ON <strong>LAND</strong><br />
The <strong>Taranaki</strong> region, despite its modest size, is a biologically diverse<br />
region. It has fi ve distinctive ecological districts which give it its<br />
biodiversity characteristics (Figure 3.11). Each of these has its own<br />
character and supports different forest types, refl ecting differences in<br />
geology, latitude and distance from the coast.<br />
The Egmont ecological district is dominated by Mount <strong>Taranaki</strong>, volcanic<br />
soils, hundreds of ring plain rivers and streams, and would have once<br />
been covered with indigenous vegetation dominated by k _ amahi, with a<br />
notable absence of beech species 41 . Altitude changes up the mountain<br />
lead to distinctive zones of vegetation. In this ecological district are<br />
threatened coastal species, threatened forest species and species found<br />
only on Mount <strong>Taranaki</strong>.<br />
The Matemate _ aonga ecological district was once part of the ocean fl oor.<br />
Geological forces pushed up the landscape, and erosion of the soft papa<br />
Figure 3.11: Map of ecological districts.<br />
rock has created deeply entrenched waterways, sharp ridges and steep<br />
hillsides. The area is characterised by extensive lowland forests of tawa<br />
and k _ amahi. The inland <strong>Taranaki</strong> hill country forests have been described<br />
as lacking diversity, but close inspection reveals a fi ne scale mosaic of<br />
forest types with species occupying particular areas depending on soil<br />
and slope. For example, Hall’s t _ otara is the main species on dry ridges,<br />
whereas kahikatea occupies fl at, poorly drained sites 42 .<br />
The North <strong>Taranaki</strong> ecological district was also formed from sedimentary<br />
rock, folded into steep hillsides and deeply incised streams and rivers.<br />
From a biodiversity perspective, its coastal areas are most signifi cant<br />
with cabbage trees, m _ anuka, marsh ribbonwood, karaka, and ngaio 43 .<br />
North <strong>Taranaki</strong> forests support a range of northern species close to their<br />
distributional limits such as p _ uriri and various rare or threatened species<br />
such as king fern found at Whitecliffs.<br />
Inland and coastal South <strong>Taranaki</strong> is made up of sections of the Foxton<br />
and Manawatu ecological districts. The coastal areas are the result<br />
of sand movement, under the infl uence of prevailing westerly winds.<br />
Moving sand is important habitat for threatened species such as katipo<br />
and p _ ingao.<br />
3.4.1 WHAT IS THE STATE OF<br />
TARANAKI’S TERRESTRIAL<br />
<strong>BIODIVERSITY</strong>?<br />
(A) INDICATORS<br />
It is neither practical nor possible to measure the distribution and health<br />
of every native plant and animal species or ecosystem to assess the<br />
state of <strong>Taranaki</strong>’s terrestrial biodiversity. Instead, a number of indicators<br />
are appropriate to use as surrogates, such as the amount of indigenous<br />
vegetation remaining in the region, the amount that is legally protected<br />
and the status of some threatened species. This section describes the<br />
status of <strong>Taranaki</strong>’s terrestrial biodiversity according to these indicators.<br />
(B) REMAINING INDIGENOUS VEGETATION<br />
Approximately 40% of the <strong>Taranaki</strong> region is in native forest and<br />
shrubland (225,566 ha). The majority of this is in the eastern and<br />
northern hill country. The development of the <strong>Taranaki</strong> ring plain<br />
41 Bayfi eld, M.A.; Benson, M.A. 1986. Egmont Ecological Region. Survey Report for the Protected Natural Areas Programme. Department of Lands and Survey, Wellington.<br />
42 Ravine, D.A. 1996. Matemateaonga Ecological District. Survey Report for the Protected Natural Areas Programme. Wanganui Conservancy, Department of Conservation, Wanganui.<br />
43 Bayfi eld, M.A.; Courtney, S.P.; Wiessing, M.I. 1991. North <strong>Taranaki</strong> Ecological District. New Zealand Protected Natural Areas Programme. Department of Conservation, Wanganui.<br />
Department of Conservation<br />
Native forest covers 40% of <strong>Taranaki</strong>.<br />
Rob Tucker<br />
State of the Environment Report 2009<br />
47
48<br />
<strong>LAND</strong>, <strong>SOIL</strong> & <strong>BIODIVERSITY</strong><br />
Figure 3.12: <strong>Taranaki</strong>’s land cover.<br />
and coastal areas for intensive farming has led to the reduction of<br />
indigenous habitats and the disproportionate loss of some types of<br />
terrestrial habitats such as lowland forests and coastal dune vegetation.<br />
The extent of land cover types is illustrated in Figure 3.12.<br />
Changes in the extent of indigenous vegetation in <strong>Taranaki</strong> have been<br />
measured for the hill country through the <strong>Council</strong>’s sustainable land<br />
monitoring programme (see section 3.1). The total area of indigenous<br />
forest decreased in the monitored sites from 3,380 ha in 1994 to<br />
3,295 ha in 2007, a decrease of 3%. Research undertaken by the New<br />
Plymouth District <strong>Council</strong> of changes in indigenous forests (from analysis<br />
of satellite images) showed that between 1990 and 2000, 246.2 ha of<br />
native bush was cleared, most (197.4 ha) on the mountain adjacent<br />
to the national park. Interestingly, forest re-growth of 397.4 ha was<br />
recorded in the northern hill country 44 .<br />
Umutekai wetland and lowland forest near New Plymouth.<br />
44 Wells, T. 2003. Letter to New Plymouth District <strong>Council</strong> accompanying CD of images of satellite images. Prepared for the New Plymouth District <strong>Council</strong> by Becca Consultants.<br />
45 Walker, S; Cieraad, E; Grove, P; Lloyd, K; Myers, S; Park T; Porteous, T. 2007. Guide for Users of the Threatened Environment Classifi cation. Landcare Research Environlink Report.<br />
TARANAKI – WHERE WE STAND<br />
Rob Tucker<br />
(C) PROTECTED INDIGENOUS VEGETATION<br />
Land Environments of New Zealand (LENZ) is a national classifi cation<br />
system used to map areas that are similar to each other, regardless of<br />
where they occur. LENZ uses 15 climate, landform and soil variables<br />
that can infl uence the distribution of species to identify areas with<br />
similar environment or ecosystem character. These are known as ‘land<br />
environments’.<br />
By then combining these land environments with information about<br />
where indigenous vegetation remains, and where vegetation is<br />
legally protected, it is possible to divide the region into threatened<br />
land environment categories according to the amount of indigenous<br />
vegetation remaining, and how much of that is legally protected 45 . The<br />
categories are illustrated in Figure 3.13 and include land where there is:<br />
now less than 10% indigenous vegetation remaining;<br />
between 10-20% indigenous vegetation remaining;<br />
between 20-30% indigenous vegetation remaining;<br />
still more than 30% indigenous vegetation remaining but less than<br />
10% is legally protected;<br />
more than 30% indigenous vegetation remaining but between 10-<br />
20% legally protected; and<br />
more than 30% indigenous vegetation and more than 20% is legally<br />
protected.<br />
On the ring plain and South <strong>Taranaki</strong> coastal terraces the areas of<br />
remaining indigenous vegetation are only small remnants of what they<br />
would have been historically. These areas now support less than 10% of<br />
the original indigenous vegetation (the ‘red zones’ in Figure 3.13). In the<br />
Figure 3.13: Threatened land environment categories in <strong>Taranaki</strong> according to the<br />
amount of indigenous vegetation remaining and how much is legally protected.
Neill Phillips, QEII National Trust, works with landowners to voluntarily covenant<br />
areas of indigenous vegetation.<br />
eastern hill country however, there is a far greater proportion of remaining<br />
indigenous vegetation and a signifi cant proportion of that is legally<br />
protected. Protection of indigenous vegetation in the fi rst two categories<br />
(the red and yellow areas on Figure 3.13) is a national priority 46 .<br />
The area of indigenous vegetation remaining in each of these categories<br />
is set out in Table 3.9 for the three districts in <strong>Taranaki</strong>. For example<br />
almost 4,000 ha of indigenous vegetation remains unprotected in the<br />
New Plymouth District in the threatened land environment category<br />
which nationally has now less than 10% of the indigenous vegetation<br />
cover (the ‘red zone’). There are just over 1,000 ha in this category in<br />
the Stratford District and about 6,000 ha remaining in South <strong>Taranaki</strong>.<br />
However, these areas are made up of small fragments of indigenous<br />
vegetation (and the areas are derived from the land cover database<br />
which used satellite imagery and so may not be as accurate as say<br />
an analysis of aerial photographs might be). Table 3.9 also shows the<br />
Table 3.9: Extent of remaining indigenous vegetation and legal protection by land environment type.<br />
Total area (ha) Threatened land environment category<br />
30% left and<br />
30% left and<br />
10-20%<br />
protected<br />
2,068 8,695 69 0 130,356<br />
414 279 8 0 1,832<br />
46 Ministry for the Environment. 2007. The National Priorities for Protecting Rare and Threatened Native Biodiversity on Private Land.<br />
47 Data from Walker, S. Price, R and Rutledge, D. 2004. New Zealand’s Remaining Indigenous Cover: Recent changes and biodiversity protection needs. Prepared by Landcare Research for Department<br />
of Conservation.<br />
State of the Environment Report 2009<br />
49
50<br />
<strong>LAND</strong>, <strong>SOIL</strong> & <strong>BIODIVERSITY</strong><br />
North Island brown kiwi.<br />
(D) THREATENED FAUNA<br />
New Zealand has some of the most ancient and fascinating species<br />
in the world (e.g. the tuatara). Many of New Zealand’s plants and<br />
animals are found nowhere else. However, a large number of them<br />
are threatened - a legacy of a history of unsustainable harvest, habitat<br />
destruction and introductions of pest plants and animals.<br />
A system has been developed for classifying New Zealand species<br />
according to the threat of them becoming extinct. The threat status<br />
has been established for 2,788 species of birds, mammals, plants and<br />
plants 48 .<br />
The most threatened categories are: ‘nationally critical’, followed by<br />
‘nationally endangered’, and ‘nationally vulnerable’, for species at high<br />
risk of extinction in the wild. These are species with small remaining<br />
numbers, which occur in only a small area or in very few places, and<br />
may be declining rapidly. Species in the ‘serious decline’ and ‘gradual<br />
decline’ categories are not yet seriously threatened with extinction<br />
but are likely to become so over time given their current rate of loss.<br />
There are also species classifi ed as being at risk due to their restricted<br />
distribution, or low densities. These are classifi ed as ‘range restricted’<br />
and ‘sparse’ respectively. In some cases, so little is known about a<br />
species its threat status can not be determined, and these are classifi ed<br />
as ‘data defi cient’.<br />
The threat classifi cation list is periodically updated using any new<br />
information available. Very recently the threat status of the kerer _ u was<br />
reclassifi ed from gradual decline to not threatened. This is thought<br />
to have resulted largely from increased control of predators, such as<br />
possums, rats, cats and stoats over many thousands of hectares of<br />
forest throughout New Zealand on public and private land.<br />
The Department of Conservation has recognised 40 threatened<br />
birds, mammals, reptiles and invertebrates that occur in <strong>Taranaki</strong> as<br />
threatened. Table 3.10 illustrates the threat status of these species, if the<br />
populations are increasing or decreasing, and the possible reasons why.<br />
The table of threatened species highlights the importance of <strong>Taranaki</strong> as<br />
home to threatened lizards. These animals can be hard to fi nd, meaning<br />
new populations are still being discovered around <strong>Taranaki</strong> today. The<br />
48 Hitchmough, R; Bull, L and Cromarty, P. (compilers). 2005. New Zealand Threat Classifi cation System Lists. Science & Technical Publishing, Department of Conservation, Wellington<br />
49 Department of Conservation. 2007. Draft Taxon Management Plan for Western North Island Brown Kiwi (Apteryx mantelli). Published by Department of Conservation, Wanganui.<br />
50 Campbell, J. Dijkgraaf, A. 2001. Kiwi Call Survey in the Waitotara Conservation Area/Whanganui National Park. Department of Conservation Monitoring Report, Wanganui Conservancy.<br />
TARANAKI – WHERE WE STAND<br />
Department of Conservation<br />
Pittosporum Kirkii, a threatened plant found on Mount <strong>Taranaki</strong>, and a favourite<br />
possum food.<br />
rarest lizard found is the ‘southern North Island’ species of speckled<br />
skink (considered nationally endangered). Another locally found species<br />
is the striped skink, classifi ed as data defi cient because so little is<br />
known about its lifestyle or how to fi nd it. It seems likely to be a tree<br />
top specialist but there are no good methods for locating it. The few<br />
populations known in <strong>Taranaki</strong>, among rotting logs or pampas, may be<br />
the stranded and grounded descendants of lizards that once lived in<br />
those places years before, when trees were still present.<br />
Kiwi found in <strong>Taranaki</strong> are of the western North Island brown kiwi<br />
group, found also in the Tongariro, Wanganui, and King Country<br />
regions 49 . Large populations have been recorded from the forests and<br />
shrublands of inland Wanganui and <strong>Taranaki</strong> with the Matemate _ aonga<br />
ecological district estimated to support about 6,000-11,800 adults 50 ,<br />
although anecdotal reports suggest that this population is declining.<br />
The population in North <strong>Taranaki</strong> is estimated at about 2,000<br />
individuals. The North Island brown kiwi is declining in all unmanaged<br />
parts of its range, due largely to predators, especially stoats. While the<br />
western North Island population as a whole is not believed to be in<br />
immediate danger of extinction, if nothing is done, sub-populations of<br />
kiwi are predicted to halve in size every 24 years and fi nally disappear<br />
altogether in about 130 years.<br />
<strong>Taranaki</strong>’s goldstripe gecko is sometimes found in urban habitats.<br />
Department of Conservation<br />
Rob Tucker
Table 3.10: Trends in the status of some threatened fauna in <strong>Taranaki</strong>.<br />
Threat status Threatened<br />
species<br />
Nationally<br />
endangered<br />
Nationally<br />
vulnerable<br />
Serious decline<br />
How are <strong>Taranaki</strong> populations going ? Why ?<br />
Black-fronted tern Unknown. Unknown.<br />
Brown teal No individuals remaining in wild in <strong>Taranaki</strong>. No sightings confi rmed in <strong>Taranaki</strong> in recent years. The<br />
opportunity to reintroduce depends on adequate predator<br />
control.<br />
North Island k _ okako No or isolated individuals remaining<br />
in <strong>Taranaki</strong>. Managed in captivity and<br />
elsewhere.<br />
No sightings confi rmed in <strong>Taranaki</strong> in recent years. The<br />
opportunity to reintroduce descendents of <strong>Taranaki</strong> k _ okako<br />
depends on adequate predator-control (see case studies).<br />
North Island k _ ak _ a Stable but small. Predation (especially by mustelids).<br />
Australasian bittern Unknown. Loss and damage to wetland habitat.<br />
Southern North Island<br />
speckled skink<br />
Probably declining but recent discoveries of<br />
further populations is encouraging and may<br />
provide opportunities for protection.<br />
Whio (blue duck) Mount <strong>Taranaki</strong> population increasing (see<br />
case study), others declining.<br />
Loss of habitat, few populations, probably vulnerable to<br />
predation.<br />
Predation (especially by mustelids), requires clean streams<br />
with good insect food supply.<br />
Long-tailed bat Possibly stable. Large areas of forest remaining - vulnerable to loss of roost<br />
trees, predation, habitat damage.<br />
Bush falcon Small, possibly stable. Poor information. Loss of habitat.<br />
Reef heron Unknown. This is a national trend.<br />
Wrybill, ngutu-parore Unknown. Unknown.<br />
Northern New<br />
Zealand dotterel<br />
Small and vulnerable. Dependent on predator control, prone to vehicle, animal and<br />
storm/tide damage. Breeding started here relatively recently<br />
and seems an expansion of range for the northern subspecies.<br />
Katip _ o spider Believed to be declining. Destruction and damage of coastal dunes and disturbance of<br />
vegetation and debris.<br />
Moth Notoreas<br />
‘<strong>Taranaki</strong> coast’<br />
Western North Island<br />
brown kiwi<br />
SOURCE: Department of Conservation.<br />
Fluctuating but promising. Protective planting becoming established, landowners helping<br />
to protect vital habitat. Numbers unclear, monitoring will build<br />
up to a clearer picture over time.<br />
Improving where predators are controlled or<br />
birds added through management, declining<br />
elsewhere.<br />
Very vulnerable to stoats (chicks) and dogs (any age). Longlived<br />
adults remain a long time but local disappearance<br />
follows from recruitment failure. Possum poison operations<br />
slow decline by temporary reduction of stoat numbers,<br />
allowing temporary kiwi population growth.<br />
State of the Environment Report 2009<br />
51
52<br />
<strong>LAND</strong>, <strong>SOIL</strong> & <strong>BIODIVERSITY</strong><br />
Table 3.10 (Continued): Trends in the status of some threatened fauna in <strong>Taranaki</strong>.<br />
Threat status Threatened species How are <strong>Taranaki</strong> populations going ? Why ?<br />
Gradual decline<br />
Sparse<br />
Range restricted<br />
Data defi cient<br />
Flesh-footed<br />
shearwater<br />
TARANAKI – WHERE WE STAND<br />
Unknown. Unknown.<br />
Long-tailed cuckoo Unknown. This refl ects a national trend.<br />
Northern little blue<br />
penguin<br />
Probably declining. This refl ects a national trend of decline and fl uctuating<br />
numbers.<br />
Red-billed gull Unknown. Declining at three main colonies elsewhere.<br />
North Island rifl eman Probably declining. This refl ects a national trend.<br />
Sooty shearwater Unknown. Unknown.<br />
White-fronted tern Unknown. Unknown.<br />
Yellow-crowned<br />
k _ ak _ ariki<br />
Declining. Anecdotal reports, few records. Vulnerable to stoat predation.<br />
Pacifi c gecko Declining. Anecdotal reports.<br />
Wellington green<br />
gecko<br />
Declining. National trend, reduced sightings. Predation and habitat loss.<br />
Goldstripe gecko Declining although newly discovered<br />
populations.<br />
Vulnerable to predation by mammals. Opportunities exist<br />
where good predator control, e.g. Lake Rotokare Scenic<br />
Reserve.<br />
Speckled skink Possibly declining. This refl ects a national trend due to their vulnerability to<br />
predation and habitat loss.<br />
Ornate skink Declining. Vulnerable to predation by mammals, populations lost<br />
elsewhere on mainland NZ.<br />
Black shag Unknown. Unknown.<br />
Spotless crake Unknown. Vulnerable to habitat loss.<br />
Brown skink Gradually declining. Vulnerable to rodent predation, loss of coastal shrubland.<br />
Carabid beetle,<br />
Brullea antarctica<br />
North Island fernbird,<br />
M _ at _ at _ a<br />
Unknown. Not monitored.<br />
Unknown. Vulnerable to habitat loss.<br />
Short-tailed bat Possibly declining. Historic records from Egmont, no recent sightings. May still<br />
occur in inland forests.<br />
Amphipod Tara<br />
taranaki<br />
Ground beetle<br />
Mecodema<br />
angustulum<br />
Unknown. Not monitored.<br />
Unknown. Unknown.<br />
Black petrel Historically on Mount <strong>Taranaki</strong>, but no recent<br />
records.<br />
Giant landsnail<br />
Powelliphanta<br />
‘Egmont’<br />
SOURCE: Department of Conservation.<br />
Possibly stable. Encouraging recent discovery<br />
of another population nearby.<br />
Unknown.<br />
Diffi cult to monitor, no evidence of decline or predation.<br />
Striped skink Unknown, probably declining. No reliable survey methods known for this species so little<br />
known.
Charles Mareikura (DOC), Turangapito Parata (Uncle Sandy from Ng – ati Ruanui)<br />
and Dean Caskey (DOC) release blue ducks in Egmont National Park.<br />
LIFE IN THE FAST LANE<br />
BECOMING LESS FRAGILE<br />
Whio are the speed freaks of the duck world and it’s not a life without<br />
risks – so many, in fact, that a big effort is being made to get them off<br />
the list of endangered species. And thankfully, the results are starting<br />
to show promise.<br />
Also known as blue duck, whio are one of only three waterfowl<br />
species worldwide that live year-round on fast-fl owing rivers like<br />
those that tumble down the slopes of Mount <strong>Taranaki</strong>.<br />
But in modern times, introduced predators and loss of habitat have<br />
taken their toll – as if the blue duck didn’t have enough problems<br />
anyway. It has always been vulnerable to spring fl oods washing away<br />
nests and eggs.<br />
And as numbers decrease, breeding is a bigger challenge because<br />
the bigger and longer-living males make up more and more of the<br />
population.<br />
That’s been a problem in Egmont National Park, where since 1999<br />
over 100 blue duck have been released into areas where predators<br />
have been intensely trapped. Before trapping only 41% of the<br />
released birds lived for more than a year. After trapping, survival rate<br />
rose to 63% 51 . Now, in addition to the trapping programme another<br />
approach is providing cause for optimism.<br />
Under Operation Nest Egg, vulnerable eggs are taken from parent<br />
birds in the wild and then hatched in controlled conditions at Mount<br />
Bruce National Wildlife Centre in the Wairarapa. Ducklings are raised<br />
to the just-fl edged stage, about four months old, and then released<br />
back to the source population. The male/female balance of these eggs<br />
is usually about even.<br />
Department of Conservation<br />
their incubator and modifi ed some outside cages for newly-hatched<br />
ducklings. The ducklings spend time in the rocky aviaries with fl owing<br />
water to help prepare them for their release into the wild.<br />
A suitable nest was found and in early November fi ve eggs were lifted<br />
and taken to Mount Bruce. Four eggs were viable and hatched the<br />
following week and the skilled Mount Bruce team raised four healthy<br />
ducklings, three females and one male.<br />
The successful hatching and rearing of juvenile blue ducks using<br />
Operation Nest Egg was a fi rst for the population establishment<br />
project in the Egmont National Park. “To get three females from the<br />
four viable eggs was fantastic,” said DOC’s Dean Caskey.<br />
By March 2008 the four ducklings were ready for release along with<br />
three captive bred males. Ng _ ati Ruanui kaum _ atua, Uncle Sandy<br />
blessed the birds and DOC staff and members of the East <strong>Taranaki</strong><br />
Environment Trust released them in rivers and streams in core<br />
predator controlled areas of the Egmont National Park. It brought the<br />
population close to 50.<br />
The fi rst ducklings known to hatch on the mountain for decades were<br />
seen in 2005, and in 2007 several pairs were nesting and produced<br />
broods of ducklings. Flooding and the occasional stoat accounted for<br />
some, but at least four survived to leave their parents and strike out<br />
on their own.<br />
This population re-establishment project was initiated by the Blue<br />
Duck Recovery Group. Mount Bruce National Wildlife Centre, the<br />
Central North Island Blue Duck Charitable Trust and the East <strong>Taranaki</strong><br />
Environment Trust all make signifi cant contributions towards its<br />
success. It’s a partnership that’s working well and hopes are high that<br />
the population on Mount <strong>Taranaki</strong> may become self-sustaining in the<br />
near future. Life can be viable in the fast lane.<br />
In the spring of 2007, Department of Conservation rangers observed<br />
pairs of breeding-age birds in Egmont National Park and assessed the<br />
vulnerability of their nests to fl ooding. Staff at Mount Bruce prepared Figure 3.15: The growing blue duck population on Mount <strong>Taranaki</strong>.<br />
51 Perfect, A.J, Caskey, D.A, 2007. Blue Duck Hymenolaimus malacorhynchos Translocation and Establishment in Egmont National Park, 1999-2007. Published by the Department of Conservation,<br />
Wanganui.<br />
SOURCE: Perfect & Caskey, 2008<br />
State of the Environment Report 2009<br />
53
54<br />
<strong>LAND</strong>, <strong>SOIL</strong> & <strong>BIODIVERSITY</strong><br />
Adrian and Anna Mansell maintain stoat trap lines.<br />
HILLS ARE ALIVE WITH<br />
KIWI CAN-DO<br />
Treasure has been discovered in the hills of eastern <strong>Taranaki</strong> – but<br />
instead of a rush to exploit it, there’s been a rush to protect and<br />
enhance it.<br />
The treasure is not gold or millable forests. It’s kiwi – our national<br />
icon, unoffi cial emblem and taonga.<br />
Karen and Bob Schumacher bought a 192 ha run-off in remote Purangi<br />
in 2001, fully intending to covenant and protect the bush remnant on<br />
the property but unaware that it was home to 10 or more Western<br />
North Island brown kiwi. Their presence was confi rmed by expert kiwi<br />
tracker Sid Marsh, and further investigations revealed there were<br />
probably around 100 kiwi in the surrounding area.<br />
Thus was born the East <strong>Taranaki</strong> Environment Trust. With advice and<br />
fi nancial support from a number of organisations, the Schumachers,<br />
and around 30 surrounding landowners, have combined to carry<br />
out pest control, an operation which now covers 3,000 ha and has<br />
included aerial drops.<br />
But that’s just the beginning. The next step is expanding the predator<br />
control operation to include the adjoining two large blocks of public<br />
conservation land, Pouiatoa and Taramoukou, and private land with<br />
cover of native bush, scrub, production pine forest, and pasture.<br />
Initial kiwi surveys of Pouiatoa have resulted in hopeful signs, and the<br />
area also includes four locations identifi ed by the <strong>Taranaki</strong> <strong>Regional</strong><br />
<strong>Council</strong> as Key Native Ecosystems.<br />
An aerial poison drop was carried out at Pouiatoa in 2005 and a<br />
private contractor has carried out follow-up work.<br />
Karen said that the Trust’s vision is a 16,000 ha sanctuary where 1,000<br />
pairs of kiwi thrive, fi lling the night air with their raucous calls.<br />
TARANAKI – WHERE WE STAND<br />
East <strong>Taranaki</strong> Environment Trust<br />
“This is do-able, it’s not pie in the sky,” said Karen. “There‘s already<br />
a good population of kiwi in the area and the project builds on an<br />
existing stronghold for the species. This is relatively easier than<br />
establishing a new population or recovering a small population”.<br />
“The project will result in the ‘in situ’ protection of a large sustainable<br />
population of kiwi - the only one in <strong>Taranaki</strong> - important not only to the<br />
people of <strong>Taranaki</strong> but nationally to all New Zealanders. It can be a<br />
cornerstone of the national plan to ensure the survival of the Western<br />
North Island brown kiwi.”<br />
The potential has already been seen by the Trust’s backers and advisers,<br />
including the Department of Conservation, the <strong>Taranaki</strong> <strong>Regional</strong><br />
<strong>Council</strong>, the BNZ Save the Kiwi Trust, the Government’s Biodiversity<br />
Fund, Ng _ ati Maru, Ng _ ati Mutunga and the QEII National Trust.<br />
The East <strong>Taranaki</strong> Environment Trust hopes for support from<br />
others who recognise there’s gold in them thar hills … avian gold,<br />
biodiversity gold, kiwi gold.<br />
Karen Schumacher with kiwi chick and the Waitara M _ aori Women’s Welfare<br />
League, partners in the project.<br />
Bob Schumacher, and Ian and Laurel Aitken.<br />
East <strong>Taranaki</strong> Environment Trust<br />
East <strong>Taranaki</strong> Environment Trust
Kerer _ u, the native wood pigeon.<br />
KERER – U: SPECIAL PLACE<br />
IN CITY’S HEART<br />
What’s fat, big-mouthed and happily nestled in the civic bosom of<br />
New Plymouth?<br />
The answer: Kerer _ u. One of the nation’s iconic birds, the native wood<br />
pigeon graces New Plymouth and surrounding areas in relatively high<br />
numbers. One pair even make a regular nesting place in the shadow<br />
of the New Plymouth District <strong>Council</strong> chamber.<br />
What’s the big attraction? A three-year study by Department of<br />
Conservation researchers has found the city offers ideal habitats with<br />
its stream gullies lined with native vegetation, native forest patches<br />
and extensive private gardens full of trees and shrubs. If you grow it,<br />
they will come.<br />
Not surprisingly the fl owers and leaves of the native k _ owhai and p _ uriri<br />
fruit are prominent in their top 10 favourite foods. But interestingly, so<br />
are the fl ower buds, fl owers and new leaves of cherry, apricot, plum<br />
and peach trees. So a place like New Plymouth, with its mixture of<br />
native and exotic fl owering and fruiting trees, provide kerer _ u with a<br />
year-round source of goodies.<br />
Other big favourites are kawakawa, magnolia, pigeonwood, cabbage<br />
tree, miro and strawberry dogwood.<br />
And don’t underestimate the importance of the big mouth that does all<br />
this eating. While most people are familiar with the slow whooshwhoosh<br />
sound of the kerer _ u moving its opera-singer body through the<br />
air, fewer may realise it is the only surviving native bird species with<br />
a beak wide enough to swallow big fruit. This gives it a vital role in<br />
the dispersal of seeds from trees like p _ uriri, miro, taraire, karaka, tawa<br />
and kohekohe.<br />
A team of DOC researchers led by Ralph Powlesland became avian<br />
sleuths between 2003 and 2006 as they tracked populations of kerer _ u<br />
and t _ u _ ı in New Plymouth and in Invercargill. This involved fi tting some<br />
birds with radio transmitters, as well as enlisting the public’s help in<br />
locating nesting and feeding spots.<br />
Of 13 birds radio-tagged in New Plymouth, nine were perfectly<br />
happy to stay city bound, moving less than 2 km over two years. Four<br />
travelled up to 60 km in autumn and winter, heading over to Purangi<br />
and further north to the Moki Conservation Area.<br />
<strong>Taranaki</strong> <strong>Regional</strong> <strong>Council</strong><br />
Of four kerer _ u tagged at Lake M _ angam _ ahoe and _ O _ akura, three<br />
travelled to Egmont National Park for autumn-winter, and one went<br />
to P _ urangi in spring-autumn.<br />
The locations of kerer _ u and t _ u _ ı nests were tracked down in New<br />
Plymouth, which were not evenly distributed through the city but<br />
instead most occurred in forest patches (parks, reserves). The hotspots<br />
included Pukekura Park, Barretts Lagoon, Ratapihihi Reserve, Te<br />
Henui walkway and the Huatoki Walkways (Figure 3.16). Nesting is<br />
determined by the time of egg-laying and this peaks in October.<br />
The study confi rmed they are doing all right in New Plymouth. Ralph<br />
Powlesland puts this down to their ability to survive in a variety of<br />
habitats and thrive on a range of food types, both native and exotic.<br />
They are happy to fl y over unfavourable habitat to reach seasonal food<br />
sources, and will nest in urban gardens and parks in exotic trees while<br />
feeding on exotic foods.<br />
But rats, possums and cats remain a major threat.<br />
Ralph says nesting success rates during the study were measured<br />
at 27% in the fi rst year (11 successful nests), 28% for the second<br />
year (18 nests) and 50% for the third year (28 nests). While this is<br />
reasonable, nesting success is much better in areas where rat and<br />
possum populations are controlled to very low levels.<br />
“The kerer _ u nesting success rate could probably be increased by<br />
undertaking intensive predator control – control of stoats, possums,<br />
feral cats and rats to very low densities – at nesting hotspots<br />
between September and March,” he says.<br />
Imagine expanding an already thriving population of city-dwelling<br />
kerer _ u. That would be a civic coup. Or, as New Plymouth’s downtown<br />
kerer _ u might put it, a civic coo.<br />
Figure 3.16: Nesting locations in New Plymouth.<br />
State of the Environment Report 2009<br />
55
56<br />
<strong>LAND</strong>, <strong>SOIL</strong> & <strong>BIODIVERSITY</strong><br />
Gratiola nana, a threatened plant found at Cold Creek bush, Egmont National Park.<br />
(E) THREATENED PLANTS<br />
There are several indigenous plants on the South <strong>Taranaki</strong> coast that<br />
are nationally or regionally rare or threatened 52 . Several of these plants<br />
live on the cliff faces, including Euphorbia glauca, Sonchus kirkii and<br />
Craspedia ‘Otakeho’. Others occur in herbfi elds at the top of cliffs or<br />
associated with rocky beaches, e.g. Ranunculus recens, two species of<br />
Moturoa school children grow plants from local stock.<br />
MOTUROA SCHOOL -THEY<br />
SHARE WHAT’S RARE<br />
Story by the Department of Conservation<br />
When it comes to rare plants the kids at Moturoa School are real<br />
experts and now they’re sharing their knowledge and plants with<br />
other coastal <strong>Taranaki</strong> Schools.<br />
Their mentor is part-time teacher Bill Clarkson who oversees the<br />
school’s ‘Trees for Survival’ programme and the plants the children<br />
grow are sourced from the last of the <strong>Taranaki</strong> stock.<br />
Take Scandia rosifolia - commonly called koheriki. In the wild this<br />
Scandia species only grows on a rocky point near _ Okato overlooking<br />
the sea. It is thought that cattle and possums ate them up. The very<br />
last plant known in <strong>Taranaki</strong> is fenced off in a reserve named Maitahi.<br />
Bill’s brother and ex-DOC man Jim Clarkson gave the Moturoa<br />
children six seeds from this last plant, from which they grew six more.<br />
They have planted 50 of their plants back in the reserve in 2007, and<br />
another 100 in 2008. Many more have also been planted by children<br />
in association with New Plymouth District <strong>Council</strong> along the city’s<br />
coastal walkway.<br />
52 La Cock, G. 2001. Threatened Plant Strategy. Wanganui Conservancy. Occasional Publication. Department of Conservation, Wanganui.<br />
TARANAKI – WHERE WE STAND<br />
Department of Conservation<br />
Department of Conservation<br />
Myosotis, and Lepidium fl exicaule. Stent Road is the only known North<br />
Island location for this plant. Some are endemic to this coastline, e.g.<br />
Crassula manaia and Limosella ‘Manutahi’. Coastal herbfi eld and cliff<br />
plants are particularly vulnerable to the impacts of pest plants.<br />
Other special plants occur in the coastal dunes, e.g. Sebaea ovata (one<br />
of two natural populations remaining in New Zealand) and pingao.<br />
Cook’s scurvy grass is found on the Sugar Loaf Islands.<br />
Other rare and threatened plants in the region are associated with<br />
Mount <strong>Taranaki</strong>, e.g. Gratiola nana, Myriophyllum robusta and the<br />
endemic Melicytus drucei. Dactylanthus occurs on Mount <strong>Taranaki</strong><br />
as well as in the forests of eastern and northern <strong>Taranaki</strong>. Possums<br />
love dactylanthus. Possum control on Mount <strong>Taranaki</strong> helps to protect<br />
dactylanthus, but individual clumps also need to be caged in stainless<br />
steel mesh to exclude possums. Seed set would not occur without this<br />
additional protection.<br />
Many of the plant populations are stable. These are monitored regularly<br />
to ensure that they are still safe. Others, e.g. Sebaea ovata and Scandia<br />
rosifolia need supplementary plantings. Schools, nurseries and private<br />
individuals help in these programmes (see case study).<br />
Now the Scandia and two more rare plants are growing at 17 schools<br />
in coastal gardens designed and monitored by their student minders.<br />
The second plant is the ‘Paritutu korokio’ (Corokia cotoneaster) which<br />
grows naturally on Parit _ ut _ u Rock, the last remnant of an old volcano<br />
much older than <strong>Taranaki</strong>. Moturoa children have been growing them<br />
from cuttings of plants they have established in their school’s native<br />
gardens. Many of these have been planted by the children in local<br />
public gardens and parks.<br />
The third plant, pinatoro (Pimelea prostrata var. urvilleana), is really<br />
special. It is the only host plant for the very rare day fl ying moth,<br />
Notoreas ‘<strong>Taranaki</strong> Coast’. The kids will love this thumb sized moth if it<br />
turns up. It has amber and black wings like the <strong>Taranaki</strong> rugby jersey.<br />
The schools exchange botanical tips, questions and photos of their<br />
gardens via email. It began as a DOC Arbor Day project and now there’s<br />
a widespread team of young botanists ensuring local plants survive.<br />
And that can only be good.<br />
The rare moth Notoreas ‘<strong>Taranaki</strong> Coast’.<br />
Department of Conservation
Indicative monitoring suggests possum numbers have reduced over the last 30 years.<br />
(F) ANIMAL THREATS<br />
A number of introduced animals threaten <strong>Taranaki</strong>’s indigenous<br />
biodiversity such as goats, deer, possums and predators such as stoats,<br />
mustelids and feral cats.<br />
Goats prevent forest regeneration by browsing seedlings and saplings of<br />
canopy trees. They also change the make-up of the forest by eating out<br />
their favourite species leaving those they don’t like as much to take over.<br />
In forests without goat control, young plants of highly palatable species<br />
such as wineberry, tree fuchsia, m _ ahoe and large-leafed coprosmas are<br />
scarce, the lower canopy are not the dense forests they would have<br />
been once been and less palatable plants like hookgrass, bush rice<br />
grass, crown fern and tree ferns thrive.<br />
Vegetation in Egmont National Park has recovered as goats have been controlled.<br />
GOAT NUMBERS KEPT DOWN IN<br />
THE EGMONT NATIONAL PARK<br />
Weeds have long been a problem for <strong>Taranaki</strong> farmers, even when the<br />
land was barely cleared. Some bright spark fi gured that goats could<br />
be the answer.<br />
250 pairs of goats took the train from Hawke’s Bay to Inglewood in<br />
1910 and local farmers snapped them up. Most farms bordering the<br />
Egmont National Park soon had goats and it wasn’t long before some<br />
escaped into the bush-clad slopes.<br />
<strong>Taranaki</strong> <strong>Regional</strong> <strong>Council</strong><br />
Department of Conservation<br />
Feral deer will destroy the under-storey of vegetation which, when<br />
combined with possum damage to the upper canopy, can result in severe<br />
deterioration of forested areas. Even small numbers of feral deer can<br />
cause suffi cient damage to affect the diversity, and survival of rare and<br />
endangered species.<br />
Possums also have favourite foods, including northern r _ at _ a, t _ otara,<br />
k _ amahi, kohekohe, m _ ahoe and fuchsia. Over several years, heavy<br />
browsing can kill tall trees or make them more vulnerable to drought,<br />
high winds and insect damage. Possums seek out fruits and fl owers, and<br />
eat seedlings on the forest fl oor. By stripping forests of fruit, fl owers, and<br />
leaves, possums also affect vital food sources for birds. Possums also<br />
eat eggs and chicks as well as invertebrates such as wetas and giant<br />
land snails.<br />
Numbers of possums trapped are an indicator of the state of this threat<br />
to biodiversity. Possums are monitored through setting out trap lines<br />
and, based on the number of possums caught per trap, a residual trap<br />
catch index, or RTC can be calculated. A high RTC of 30 indicates that<br />
the forest is suffering signifi cant possum damage, so much so that its<br />
species composition will probably be changing. In contrast, a low RTC (of<br />
say, fi ve) means that possums are too scarce to cause serious damage,<br />
although they will still impact particularly sensitive threatened plants.<br />
Anecdotally, farmers in <strong>Taranaki</strong> recall much higher possum numbers in<br />
the past. <strong>Council</strong> offi cers have over the past 30 years also undertaken an<br />
informal monitoring of possum numbers by counting road kill around the<br />
upper ring plain road at the same time every year. In the late 1970s more<br />
than 100 possum road kills were counted, whereas in 2007 none was<br />
The goats liked the forest and by 1928 Ranger Rupert Larsen was<br />
reporting thousands on Mount Egmont as a result of the goats<br />
increasing at a tremendous rate.<br />
By 1945 regular reports of hectares of dead areas and a bare and<br />
depleted understorey had Chief Ranger Gordon Atkinson worried. He<br />
reported that it was a ghastly spectacle with thousands of large trees<br />
having been ring barked and destroyed and an almost total absence<br />
of seedlings.<br />
Offi cial goat control in the Egmont National Park began in 1925 and<br />
97,000 goats have been killed since then. Today, DOC’s team of<br />
hunters keep numbers right down but without them the population<br />
would double about every 20 months.<br />
The forest has responded well. Thirty years of analysis shows<br />
vegetation that has greatly improved and the few goats that slip<br />
the hunters’ guns are having minimal impact on the plant life of the<br />
Egmont National Park. DOC hunters are now reporting how diffi cult it<br />
is to navigate their way through the forest because of the thick dense<br />
undergrowth.<br />
Now that’s a problem that those early park rangers could only have<br />
dreamed of!<br />
State of the Environment Report 2009<br />
57
58<br />
<strong>LAND</strong>, <strong>SOIL</strong> & <strong>BIODIVERSITY</strong><br />
Setting a mustelid trap at Te Wawa wetland.<br />
sighted. This less-than-scientifi c, but still indicative monitoring shows<br />
that possum numbers have dramatically reduced over the past 30 years.<br />
Predators on indigenous biodiversity include cats, mustelids (ferrets,<br />
stoats and weasels) and hedgehogs. In and around natural areas such<br />
as forests, shrubland, wetlands and dunelands, cats are signifi cant<br />
predators of indigenous birds, reptiles and invertebrates. Stoats are now<br />
by far the most common of the mustelids. They are widespread in forest<br />
and on farmland and serious predators of indigenous bird-life. Along<br />
with cats, mustelids predate on young kiwi resulting in 95% of juvenile<br />
kiwi being killed within the fi rst six to nine months of leaving the<br />
nest, before they are able to reach a weight at which they can defend<br />
themselves. Hedgehogs predate the eggs and chicks of ground-nesting<br />
birds and are especially abundant in coastal areas.<br />
Feral pigs can also have a signifi cant impact on indigenous biodiversity<br />
values. Where present in large numbers, feral pigs will eat the tops<br />
and dig up the roots of indigenous vegetation resulting in the decline of<br />
some plant species. They are also a signifi cant predator on threatened<br />
native land snails as well as destroying their habitat. The Egmont<br />
National Park is the only national park in New Zealand that has no<br />
established feral pig populations – illegal releases of pigs into the park<br />
are eradicated by the Department of Conservation.<br />
(G) PLANT THREATS<br />
Pest plants are a threat to indigenous biodiversity values where they<br />
compete with native plants for space. Certain climbing pest plants such<br />
as climbing spindleberry and old man’s beard can form dense colonies,<br />
smothering and shading out indigenous plants, affecting the succession<br />
or regeneration of native plants. Pest plant species are able to invade<br />
forest remnant, riparian areas or wetlands through their ability to seed<br />
prolifi cally or through their ability to grow from tubers, such as giant<br />
bindweed.<br />
Ornamental plant species that escape from gardens have huge potential<br />
to adversely impact on indigenous biodiversity. For example, giant<br />
gunnera and hybrids have massive umbrella-sized leaves with stems<br />
up to 2 m tall. It is a very free-seeding plant with seeds being spread by<br />
water and birds. Giant gunnera threatens indigenous biodiversity values<br />
in coastal, wetland and riparian areas through its ability to form dense<br />
53 Clarkson, B.D. 1986. Vegetation of Egmont National Park, New Zealand. DSIR Science Information Publishing Centre, Wellington.<br />
54 Husheer, S. 2006. Changes to the Forests of Egmont National Park 1977-2001. Research and Development Series. Department of Conservation, Wellington.<br />
55 Payton, I.J.; Pekelharing, C.J.; Frampton, C.M. 1999. Foliar Browse Index: A method for monitoring possum (Trichosurus vulpecula) damage to plant species and forest communities.<br />
Landcare Research, Lincoln.<br />
56 Prip, P.; Robertson, L.; Robinson, M. 2005. New Plymouth Area Possum Management Plan 2005-2010. Department of Conservation, New Plymouth.<br />
TARANAKI – WHERE WE STAND<br />
<strong>Taranaki</strong> <strong>Regional</strong> <strong>Council</strong><br />
Giant gunnera, once an ornamental plant, is now a pest plant.<br />
colonies which shade-out lower growing native plants or suppress<br />
natural regeneration of indigenous species. Kahili ginger and yellow<br />
ginger are once popular garden plants that are now recognised to have<br />
signifi cant impact on indigenous biodiversity values, by smothering and<br />
replacing under-storey species and seedlings.<br />
(H) CONDITION OF INDIGENOUS VEGETATION<br />
While the extent of indigenous vegetation is one indicator of biodiversity<br />
in <strong>Taranaki</strong>, the condition of that indigenous vegetation is an equally<br />
important indicator, particularly given the threats from animal and plant<br />
pests.<br />
Egmont National Park has had a long and effective programme of animal<br />
control. In the past, the Park has been greatly modifi ed by goats and<br />
possums, with extensive dead areas created in the upper catchment<br />
shrublands and loss of palatable under-storey plants from the forest 53 .<br />
However, monitoring in 2001 found that species preferred by possums<br />
and goats, like pate, hangehange and large-leafed coprosmas, had<br />
increased in abundance relative to initial measurements in 1977. It was<br />
also found that the abundance of these species was higher than other<br />
New Zealand forests where pest animals such as goats, deer and pigs<br />
are present 54 .<br />
Monitoring the impact of possums on trees involves examining a number<br />
of trees (either from the ground or aerially) and assessing such things<br />
as foliage density, presence of dieback (bare, dead twigs), evidence of<br />
possum damage (chewed leaves or trunk marking) and production of<br />
fl owers and fruits. This information is then used to calculate a foliar<br />
browse index (FBI) 55 .<br />
The FBI is calculated from the ground at sites where possum control is<br />
undertaken to protect kohekohe forest. Recent results have found that,<br />
although there has been a slight increase in browse, all sites are in good<br />
condition and meet the targets set 56 .<br />
Individual threatened species known to be susceptible to possum<br />
browse are also monitored. A population of Melicytus druceii, a plant<br />
found only on Mount <strong>Taranaki</strong>, has been monitored since 1991. Two<br />
cages were built in 1992. One protected some plants from hare and<br />
possum damage, the other protected plants from hares but was open to<br />
possums. Browse intensity has decreased over time and appears to be<br />
<strong>Taranaki</strong> <strong>Regional</strong> <strong>Council</strong>
especially reduced after possum control operations. Hares now appear<br />
to be the main browsing agent 57 .<br />
In large, rugged or inaccessible blocks, monitoring is conducted from a<br />
helicopter looking down on the canopy. This method is used in Egmont<br />
National Park and Wait _ otara, Moki, Makino, Hutiwai and Pouiatoa<br />
conservation areas, which all receive periodic treatment with 1080<br />
to control possums. Twenty to 40 trees of seven common species<br />
are measured at fi ve sites, and taking into account each tree’s own<br />
susceptibility to possums and rate of recovery from damage, a general<br />
pattern has emerged. Typically, over the fi rst one and a half years<br />
after a possum control operation the forest recovers, showing reduced<br />
browse and dieback and increased foliage density. Recovery or at least<br />
maintenance of forest health continues for the next four years, and<br />
then six years after the operation some decline in becomes apparent,<br />
although it is not ever as bad as before the operation.<br />
The Department of Conservation uses three methods to quantify<br />
goat impact and measure the outcomes of goat control operations:<br />
permanent forest plots 58 , fenced plots (20 by 20 m) that goats are<br />
excluded from, and a measure of seedling growth called the seedling<br />
ratio index (SRI).<br />
Three goat exclosure plots are maintained in the <strong>Taranaki</strong> region and<br />
are measured every 5-10 years. Monitoring of these plots in Egmont<br />
National Park and near Whitecliffs (measured in 2005 and 2006<br />
respectively) showed no difference between the vegetation within the<br />
fence and that outside the fence exposed to goats. This showed that<br />
goat control had successfully reduced goat densities to a point where<br />
they are only having a minor impact on the vegetation. In contrast, at<br />
Taramoukau Conservation Area, palatable seedlings and saplings were<br />
more common inside the fenced area than outside, and a wider range<br />
of species was recorded inside the fence. These results suggest that<br />
more goat control is required at this site. Fenced areas have also been<br />
used to study the effects of goats on seedling growth in forest near<br />
Whangamonona. Survival and growth rates were higher in the fenced<br />
areas over the six years’ study 59 .<br />
Measurements of the numbers and types of seedlings to calculate the<br />
Seedling Ratio Index provide a rapid method of assessing goat impact<br />
on forest health 60 . So far, networks of 15-20 400 m transects (monitoring<br />
Possum browse on m _ ahoe, Mount Messenger.<br />
Department of Conservation<br />
lines) have been established in the Moki Conservation Area and other<br />
forests with different degrees of goat management outside the <strong>Taranaki</strong><br />
region. Results from Moki (surveyed in 2005) found that goat browse<br />
was still preventing regeneration of palatable species. Forests that<br />
have had extensive goat control, such as Waitaanga and Motutara<br />
(near Taumarunui) have been found to be in much better condition. Remeasurement<br />
of the seedling ratio index at Moki in the next two years<br />
will reveal whether there has been any improvement.<br />
(I) LOGGING OF INDIGENOUS FORESTS<br />
Under the Forests Amendment Act 1993 any indigenous timber from<br />
privately-owned indigenous forest may be milled as long as it is<br />
harvested and milled in accordance with a registered Sustainable<br />
Forestry Management Plan or a sustainable forestry permit issued by the<br />
Ministry of Agriculture and Forestry.<br />
<strong>Taranaki</strong> is one of the regions with the greatest harvest of indigenous<br />
timber in the country. In mid-2008 there were 102 registered permits for<br />
indigenous logging in <strong>Taranaki</strong> (Figure 3.17). Several more were pending.<br />
This represents more than a third of all permits in the North Island,<br />
and 38 more than the Manawatu/Wanganui region, - the next highest.<br />
These permits are for almost 25,000 m 3 of the 122,000 m 3 of timber to<br />
be harvested nationally under the permit system. Rimu and tawa are the<br />
two main species, with black beech a distant third.<br />
Figure 3.17: Extent of indigenous forest permits in relation to existing<br />
indigenous forest and indigenous forest legally protected through either<br />
being public conservation land or private QEII land.<br />
57 J. Clarkson, unpublished data, 2008.<br />
58 Hurst, J.; Allen, R. 2007. A Permanent-plot Method for Monitoring Changes in Indigenous Forests. Landcare Research.<br />
59 Blaschke, P. 1992. Measuring the Impact of Goats and Possums on Vegetation Composition, Growth and Regeneration, Matemateonga Ecological Region, from Exclosure Plot Data. DSIR Contract<br />
Report.<br />
60 Sweetapple, P.; Nugent, G. 2004. Seedling Ratios: A simple method for assessing ungulate impacts on forest understories. Wildlife Society Bulletin 32: 137-147.<br />
State of the Environment Report 2009<br />
59
60<br />
<strong>LAND</strong>, <strong>SOIL</strong> & <strong>BIODIVERSITY</strong><br />
Rimu harvested under a sustainable logging permit, South <strong>Taranaki</strong>.<br />
Permits allow the harvest of up to 250 m 3 of hardwoods (usually made<br />
up of rimu and tawa) and softwoods, and up to 500 m 3 of beech from<br />
a property over a 10-year period. In addition to these permits there are<br />
six sustainable logging plans. These plans permit the annual logging of<br />
1,600 m 3 of timber, mainly rimu, from 4,764 ha of forest. These plans<br />
normally have a lifespan of 50 or more years.<br />
There are 187,619 ha of indigenous forest in the eastern <strong>Taranaki</strong> hill<br />
country 61 . Of this, 93,321 ha is public conservation land and 1,649 ha<br />
is legally protected under a QEII covenant. Of the remaining privatelyowned<br />
indigenous vegetation (92,411 ha), 34,861 ha (38%) is subject to<br />
a sustainable forestry permit.<br />
(J) RESTORATION OF <strong>BIODIVERSITY</strong><br />
Riparian management has been a key focus for the <strong>Taranaki</strong> <strong>Regional</strong><br />
<strong>Council</strong>. While riparian planting was intended initially to provide<br />
benefi ts for aquatic biodiversity and water quality, little was known<br />
about its effects on terrestrial biodiversity. A study has been undertaken<br />
to investigate to what extent riparian management has improved<br />
native terrestrial biodiversity values. Biodiversity values, richness and<br />
abundance of plant and bird species, were measured and compared in<br />
different types of riparian margins. Sites included riparian margins that<br />
were still grazed, some that had just been fenced, margins with medium<br />
aged plantings (four to eight years), margins that had been planted<br />
eight-12 years ago and margins with remnant or naturally regenerated<br />
vegetation more than 20 years old.<br />
The preliminary results seem to indicate that riparian planting leads to an<br />
increase in native plant species richness over time. Figure 3.18a illustrates<br />
that once areas have been retired for over eight years, the average<br />
number of species is comparable to naturally regenerated areas. The<br />
interesting thing seems to be the increase in the number of fern species<br />
in older riparian areas. Ferns are not planted but naturally regenerate in<br />
newly planted areas. This is clearly illustrated in Figure 3.18b.<br />
The study has shown that native and introduced birds do not use grazed<br />
riparian areas, yet they start to turn up in areas once they are fenced.<br />
After riparian areas have been planted for four to eight years, bird use<br />
increases, and this is even more apparent once riparian plantings reach<br />
eight to 12 years (see Figure 3.18c). Riparian margins with naturally<br />
61 Using data from LCDB2.<br />
TARANAKI – WHERE WE STAND<br />
Department of Conservation<br />
Figure 3.18a: Changes in plant diversity with age of riparian planting.<br />
Figure 3.18b: Changes in diversity of ferns with age of riparian planting.<br />
Figure 3.18c: Changes in bird diversity with age of riparian planting.<br />
regenerated vegetation older than 20 years have signifi cantly higher<br />
native bird abundances than grazed and un-vegetated fenced margins.<br />
Overall, the study indicates that planting of riparian margins is<br />
creating new habitat for native plant and bird species where none<br />
existed previously and is leading to an improvement in the biodiversity<br />
of the region.
Ruka Holden and David Rangitawa grow native species at Kii Tahi Nursery for<br />
the riparian plant scheme.<br />
KII TAHI, THE HUMAN FACTOR<br />
IN <strong>BIODIVERSITY</strong><br />
They grow plants and they grow people at Kii Tahi Nursery and Land<br />
Care, which is based at Wai-o-Turi Marae south of P _ atea.<br />
Most of the plant output – about 44,000 per year, all of them native<br />
species – is destined for <strong>Taranaki</strong> stream banks where the plants<br />
protect and enhance water quality and promote biodiversity.<br />
And many of the young workers that have come through the nursery<br />
have found it a springboard to a career, not only in horticulture but<br />
also with organisations like the Navy.<br />
3.4.2 HOW ARE WE MANAGING<br />
<strong>BIODIVERSITY</strong> ON <strong>LAND</strong> ?<br />
(A) PLANS<br />
The Proposed <strong>Regional</strong> Policy Statement for <strong>Taranaki</strong> includes a<br />
new chapter dealing with the maintenance and enhancement of<br />
indigenous biodiversity. The policy statement recognises the importance<br />
of protecting under-represented habitats of terrestrial indigenous<br />
vegetation, the need to reduce the impacts of pest animals and plants,<br />
particularly in areas with regionally signifi cant indigenous biodiversity<br />
values and the importance of encouraging connectivity between<br />
remnant habitats. The Biodiversity Strategy: an operational strategy to<br />
guide the biodiversity actions of the <strong>Taranaki</strong> <strong>Regional</strong> <strong>Council</strong> provides<br />
the operational policy and action plan for the <strong>Council</strong>’s involvement<br />
in biodiversity management. This Strategy identifi es that the <strong>Council</strong><br />
will contribute to biodiversity through focusing proactive attention on<br />
regionally signifi cant sites (Key Native Ecosystems), through enhancing<br />
the biodiversity of existing programmes (e.g. the pest programmes and<br />
the sustainable land management programmes), through working with<br />
others in the community, particularly on fl agship biodiversity projects,<br />
and through establishing the systems for gathering and managing<br />
biodiversity information.<br />
The Conservancy Management Strategy for the Wanganui Conservancy<br />
is the guiding policy document for work of the Department of<br />
Conservation. It became operative in 1997 and is currently being<br />
reviewed. It established a vision and objectives for the management<br />
Rob Tucker<br />
“A lot of people think the youngsters don’t want to work but there are<br />
plenty keen to work here,” says the Operations Manager, Heremia<br />
Taputoro. “And many have done well. We’re growing our people.”<br />
An enterprise of Ng _ a Rauru Kiitahi, the nursery has a ‘catchment’ of<br />
11 marae to call on and currently has satellite growing operations at<br />
two others besides Wai-o-Turi.<br />
Heremia leads four full-time staff at the 1.6 ha main site, set<br />
amongst the marae’s 4 ha. A stunning garden of native fl axes and<br />
grasses graces the road frontage, a clear signal to visitors about this<br />
enterprise’s kaupapa.<br />
Kii Tahi produces 20 varieties of native plants and fl axes, most under<br />
contract to the <strong>Taranaki</strong> <strong>Regional</strong> <strong>Council</strong> for its riparian management<br />
programme. Nursery workers also get involved in the on-farm planting<br />
and follow-up maintenance work.<br />
The nursery was established in 2000, growing vegetables at fi rst but<br />
they soon made the switch to native species, as the <strong>Council</strong>’s riparian<br />
scheme offers a relatively secure customer base.<br />
Kii Tahi shares the <strong>Council</strong>’s ambition to greatly increase the rate of<br />
riparian planting in the region – in this case for the extra employment<br />
opportunities it will create for the iwi, as well as the biodiversity and<br />
environmental benefi ts of the project.<br />
of biodiversity on land administered by the Department. The Egmont<br />
National Park Management Plan and the Whanganui National Park<br />
Management Plan provide the operational policies.<br />
Under the Biosecurity Act 1993, the <strong>Council</strong> has prepared the Pest<br />
Management Strategy for <strong>Taranaki</strong>: Animals and the Pest Management<br />
Strategy for <strong>Taranaki</strong>: Plants. These strategies set out the eradication,<br />
containment and surveillance pests, and the rules for landowners<br />
relating to these pests, and indicate the <strong>Council</strong>’s intention to become<br />
more proactive with pest management on regionally signifi cant sites.<br />
Each district council in <strong>Taranaki</strong> has prepared a district plan which<br />
addresses, amongst other things, the management of signifi cant<br />
indigenous vegetation. The New Plymouth District <strong>Council</strong> has a<br />
schedule of signifi cant natural areas, where consents are required for<br />
the removal of indigenous vegetation. A heritage fund is available for<br />
landowners wishing to receive fi nancial assistance with protecting these<br />
areas. A number of signifi cant natural areas have been covenanted.<br />
The Stratford District Plan has a general vegetation clearance rule. The<br />
South <strong>Taranaki</strong> District maintains a schedule of signifi cant natural areas<br />
and works closely with QEII to secure protection of these sites through<br />
their Signifi cant Natural Areas Fund. The South <strong>Taranaki</strong> District Plan<br />
also has a general vegetation clearance rule. Two consents have been<br />
granted under this rule: one for the removal of indigenous vegetation to<br />
provide a clear path for the predator proof fence at Lake Rotokare, and a<br />
second more recently, for the clearance of just over 7 ha of forest on the<br />
most threatened land environment type (the red zone in Figure 3.13), for<br />
the purpose of creating more dairy land.<br />
State of the Environment Report 2009<br />
61
62<br />
<strong>LAND</strong>, <strong>SOIL</strong> & <strong>BIODIVERSITY</strong><br />
(B) INVENTORIES<br />
The New Plymouth and South <strong>Taranaki</strong> district councils have prepared<br />
inventories of signifi cant natural areas. The New Plymouth District<br />
<strong>Council</strong> has recently had its inventory re-assessed 62 .<br />
Through a multi-agency working party, the <strong>Taranaki</strong> <strong>Regional</strong> <strong>Council</strong><br />
facilitated the compilation of an inventory of terrestrial sites with<br />
indigenous biodiversity values of regional signifi cance in the <strong>Taranaki</strong><br />
region 63 . Sites in the inventory, which are referred to as key native<br />
ecosystems, are regionally signifi cant because:<br />
rare and distinctive indigenous fl ora and fauna species are present;<br />
they are representative of an indigenous vegetation type that is now<br />
much reduced (e.g. less than 10 or 20%) from its former extent in the<br />
ecological district;<br />
they enhance connectivity between fragmented indigenous habitats,<br />
enhance the values or provide buffering for other sites of value, or<br />
provide seasonal or core habitat for specifi c indigenous species; or<br />
they are sustainable i.e. they are of a size or shape and have the<br />
ability, through appropriate management, to sustain those other<br />
values referenced above.<br />
Of the 140 identifi ed Key Native Ecosystems, 99 have some portion<br />
of private ownership, while the remainder is public conservation land<br />
(Figure 3.19).<br />
(C) COVENANTS<br />
The QEII National Trust helps landowners protect signifi cant natural and<br />
cultural features on their land. The Trust was established in 1977 at the<br />
request of New Zealand farmers to protect open space on private land<br />
for the benefi t and enjoyment of the present and future generations of<br />
Figure 3.19: Key Native Ecosystems: Private and publicly managed.<br />
62 Wildlands. 2007. Signifi cant Natural Areas in New Plymouth District. Prepared for the New Plymouth District <strong>Council</strong>.<br />
63 <strong>Taranaki</strong> <strong>Regional</strong> <strong>Council</strong>. 2006. Key Native Ecosystems. Inventory of Sites with Indigenous Biodiversity Values of <strong>Regional</strong> Signifi cance.<br />
64 More information on the QEII Trust can be found on www.qe2.org.nz<br />
TARANAKI – WHERE WE STAND<br />
Figure 3.20: Number of QEII covenants approved and registered over the past 30 years.<br />
New Zealanders. The QEII National Trust works with landowners who<br />
wish to enter into a voluntary covenant - a form of legal protection put<br />
on the land title - to protect areas of indigenous vegetation.<br />
In <strong>Taranaki</strong>, there are now 175 registered QEII covenants with an<br />
additional 47 approved and awaiting registration, - totalling 3,374 ha in<br />
registered or approved covenants. The largest registered QEII covenant<br />
in <strong>Taranaki</strong> is 334 ha, with the average sized covenant being 15.6 ha.<br />
QEII covenants protect signifi cant natural and cultural features on<br />
private land in perpetuity 64 . Figure 3.20 shows the huge growth in QEII<br />
covenants over the past eight years.<br />
In addition, 238 ha of North <strong>Taranaki</strong> has recently been protected<br />
through Ng _ a Whenua R _ ahui Kawenata (covenants). These are<br />
conservation covenants tailored to M _ aori landowners.<br />
(D) PEST CONTROL<br />
The <strong>Taranaki</strong> <strong>Regional</strong> <strong>Council</strong> runs a self-help possum control programme,<br />
which is a joint approach with land occupiers for managing possum<br />
populations. The major emphasis of the programme is the protection of<br />
agricultural production, as possums compete directly with livestock for<br />
grass, along with reducing the threat of bovine Tb. The programme also<br />
has major advantages for indigenous biodiversity and now covers most<br />
of the <strong>Taranaki</strong> ring plain. The <strong>Council</strong> fi rst reduces possum levels in<br />
operational areas to at least a 5% residual trap catch. Figure 3.21 shows<br />
how successful <strong>Council</strong> operations have been at achieving this.<br />
Figure 3.21: Possum numbers before and after <strong>Taranaki</strong> <strong>Regional</strong> <strong>Council</strong> control<br />
operations.<br />
Data: QEII Trust
Kerry Matthews (TRC) and Pat Morris discuss the re-growth of native vegetation.<br />
POSSUMS NO PLAYTHINGS<br />
Rahot _ u farmer Len Pentelow and near neighbour Pat Morris have<br />
both been part of the self-help possum programme since the scheme<br />
started in the early 1990s.<br />
And both Len and Pat have also discovered the benefi ts go<br />
far beyond preserving stock health and export receipts, as important<br />
as they are.<br />
Following the initial knock-down operation, the <strong>Council</strong> facilitates land<br />
occupiers to keep possum numbers to at least a 10% residual trap<br />
catch (RTC) rate. This is monitored annually. Table 3.11 indicates that<br />
the average RTC is generally below the 10% target, and the proportion<br />
of properties failing to meet this target is generally low. The higher<br />
proportion of lines exceeding the 10% RTC target in the 2006-07 year<br />
was due to more accurate placement of traps in more suitable possum<br />
habitat and monitoring both before and after landowners completed<br />
their possum control work. Properties that failed the 10% target were<br />
followed up, and required to undertake possum control.<br />
The self-help possum programme now covers 227,000 ha or 96% of the<br />
<strong>Taranaki</strong> ring plain (Figure 3.22).<br />
Table 3.11: Results of monitoring the ring plain self-help possum programme.<br />
04-05 05-06 06-07 07-08<br />
Number of properties monitored 320 305 300 341<br />
Mean Residual Trap Catch 4.6 4.1 8.2 7.5<br />
Number of lines exceeding 10% Target 32 34 89 85<br />
Percentage exceeding 10% Target 10% 11% 30% 24%<br />
The Department of Conservation undertakes extensive pest animal and<br />
pest plant management work in <strong>Taranaki</strong>, maintaining 102,000 ha of public<br />
conservation land and 3,000 ha of private land under sustained possum<br />
control (Figure 3.22). Possum operations include periodic aerial control or<br />
annual ground-based control at specifi c sites, such as in the Waitaanga,<br />
Hutiwai, Wait _ otara and Moki/Makino conservation areas, Egmont<br />
National Park, and a number of smaller reserves around New Plymouth.<br />
<strong>Taranaki</strong> <strong>Regional</strong> <strong>Council</strong><br />
As well as spreading bovine TB, possums are known for damaging<br />
bush and preying on birds’ eggs and even chicks. Len has a couple of<br />
stands of native bush on his farm, protected under QEII covenant, and<br />
he’s observed “massive changes” since the possum control<br />
work started.<br />
“Kohekohe trees, r _ at _ a, tawa trees – they’re all coming back. There’s<br />
been a big, big difference,” he said. “And t _ u _ ı are here now, we hear<br />
them all the time. It’s a signifi cant change to hear these birds<br />
coming back.”<br />
Pat Morris has a similar story to tell. Back in the old days, he says,<br />
you didn’t realise how many possums were around and the damage<br />
they were doing.<br />
“Now you realise because of the re-growth of native vegetation<br />
along the streams. Bracken fern – I thought it had disappeared. Now<br />
it’s coming through in fenced-off areas where the cows can’t get at it.<br />
“I see karo trees. Ponga are starting to pop up along the stream<br />
edges. You rarely saw them before. Possums would strip their fronds.<br />
There’s akeake. Karaka trees are coming back. Coprosma.”<br />
Figure 3.22: Areas under sustained possum control under the <strong>Taranaki</strong> <strong>Regional</strong><br />
<strong>Council</strong>’s self-help possum programme and the Department of Conservation<br />
programmes.<br />
State of the Environment Report 2009<br />
63
64<br />
<strong>LAND</strong>, <strong>SOIL</strong> & <strong>BIODIVERSITY</strong><br />
Figure 3.23 Area of <strong>Taranaki</strong> under sustained management for deer and goats.<br />
The Department of Conservation has over 48,000 ha of public<br />
conservation land and 5,000 ha of private land under sustained<br />
management for goat control, and over 108,000 ha of public<br />
conservation land and almost 200,000 ha of private land under sustained<br />
management for deer control (Figure 3.23).<br />
Predator trapping programmes are undertaken throughout <strong>Taranaki</strong>,<br />
primarily targeted at protecting threatened species. For example, the<br />
extensive predator trapping programme to enhance the survival of<br />
blue duck and kiwi on Mount <strong>Taranaki</strong> (in and adjacent to the Egmont<br />
National Park) comprises 1,160 trap boxes within Egmont National Park<br />
and 200 on private land adjacent to the park (Figure 3.24). Traps are<br />
checked 18 times a year (twice monthly from October to March, monthly<br />
from April to September). Numbers of stoats trapped peak over the<br />
summer of each year (Figure 3.25). The large increase in stoat numbers<br />
caught from December 2006 was due to the extension of the trapping<br />
programme from November 2006.<br />
This programme is a partnership between the Department of<br />
Conservation, the <strong>Taranaki</strong> Kiwi Trust, the Central North Island Blue Duck<br />
Trust, the Koala Trust and the East <strong>Taranaki</strong> Environment Trust, with<br />
support from the <strong>Taranaki</strong> <strong>Regional</strong> <strong>Council</strong>.<br />
Other examples of predator programmes in <strong>Taranaki</strong> include:<br />
the predator trapping programme carried out by the East <strong>Taranaki</strong><br />
Environment Trust in the P _ urangi/Matau area which has killed 91<br />
stoats and 685 rats since January 2007 (see case study);<br />
TARANAKI – WHERE WE STAND<br />
Figure 3.24: Stoat trap lines in the Egmont National Park and on adjacent private land.<br />
the trapping programme carried out by the Ng _ ati Tara _ Oaonui Sandy<br />
Bay Society around the Sandy Bay area which has trapped 191<br />
hedgehogs, 10 mustelids and 3 rats since October 2004 (see case<br />
study in section 5.2);<br />
the trapping programme carried out by the landowners of a regionally<br />
signifi cant wetland at Toko that has destroyed more than 169<br />
predators over 1,200 trap nights from the 4.8 ha area since 2004;<br />
extensive possum and predator control to establish a pest free<br />
sanctuary around Lake Rotokare (see case study); and<br />
predator trapping around other key native ecosystems by community<br />
groups such as Forest and Bird.<br />
Figure 3.25: Mustelid and rat trap catch, June 2004-September 2007.<br />
SOURCE: Perfect & Caskey, 2008
Tahana O’Carroll of Ng _ ati Tama discusses possum control with Daniel Cuming (TRC).<br />
IWI SETS SCENE FOR KOKAKO<br />
HOMECOMING<br />
Tahana O’Carroll has a vision of a special homecoming – and it’s a<br />
vision with sound effects.<br />
All going to plan, the vision will become reality in the early years of<br />
next decade: The haunting call of the k _ okako will ring through the<br />
morning air in the bush at Whitecliffs.<br />
Tahana, the kaitiaki of 1,320 ha of Whitecliffs bushland that was<br />
returned to Ng _ ati Tama as part of a Treaty settlement in 2003, has<br />
particular birds in mind – those descended from the region’s last known<br />
k _ okako, a lone male transferred from Moki Forest to a Wairarapa refuge<br />
in 1999.<br />
And the vision encompasses much more than k _ okako. Whitecliffs offers<br />
a habitat where a huge range of native fl ora and fauna can fl ourish,<br />
and where the rangatahi (young people) of Ng _ ati Tama can have<br />
opportunities to experience the bush.<br />
But fi rst, much work needs to be done. Although it is already an<br />
ecological jewel, regarded as one of the best remaining examples<br />
of coastal hardwood/podocarp forest in the North Island, introduced<br />
predators continue to take a heavy toll.<br />
The hard yards have started with an intensive possum poisoning<br />
operation in the spring of 2008, carried out with the <strong>Taranaki</strong> <strong>Regional</strong><br />
<strong>Council</strong>, which has successfully reduced possum numbers to very low<br />
levels. While mustelids were a secondary target, further intensive<br />
Pest control is not all about animals. Weed control programmes in<br />
the region are undertaken to protect biodiversity values. For example,<br />
the Department of Conservation has controlled giant gunnera, a pest<br />
plant that grows to over 2 m tall, and shades out anything under it<br />
such as threatened plants growing on cliffs and in herbfi elds. Pasture<br />
grasses and weeds are the big threat to herbfi elds on top of the<br />
cliffs. The programme has been focused on over the 40 km cliff face<br />
stretch on the South <strong>Taranaki</strong> coastline between Manaia and Ot _ akeho,<br />
Rob Tucker<br />
trapping is still needed. Then there are the feral cats, the goats, the wild<br />
pigs … and pig hunters whose dogs have had no kiwi aversion training.<br />
“It’s a huge mission,” says Tahana. “But we’re holding fast to the<br />
vision of a k _ okako sanctuary. The K _ okako Recovery Group has identifi ed<br />
Whitecliffs as a preferred site for re-introduction. But for that to<br />
happen, there must be intensive predator control.”<br />
He envisages further predator control being centred in a 700 ha core<br />
area around the upper Waipingau Stream, inland of the Whitecliffs<br />
Walkway, before spreading to cover the entire block.<br />
Helping Tahana hold to the vision is experience of similar blocks in<br />
the T _ uhoe rohe on the East Coast. “The morning birdsong just blew me<br />
away. It could be like that here, too.”<br />
He believes the Whitecliffs block will provide an opportunity for the<br />
young people of Ng _ ati Tama to have positive experiences of the bush<br />
and the treasures it holds. “I never had that when I was younger,” he<br />
says. “Some might come here and then decide they’d rather do other<br />
things, and that’s fi ne. As long as they get the opportunity to come here.”<br />
The Ng _ ati Tama block and adjoining Department of Conservationadministered<br />
land are recognised by the <strong>Taranaki</strong> <strong>Regional</strong> <strong>Council</strong> as<br />
a key native ecosystem. With Mt Messenger, it forms a continuous<br />
sequence from coastal to inland forest and supports a range of plants<br />
that do not occur elsewhere in the region.<br />
It is home to threatened species including matangaoa or NZ cress and<br />
king fern, and has the only naturally growing p _ ingao in North <strong>Taranaki</strong>.<br />
The area is the northern growing limit for NZ mistletoe and the<br />
southern limit for other species such as p _ ohutukawa.<br />
Scratching on trees noted in 2006 was attributed to North Island kaka,<br />
and while the kokak _ o are long gone, kiwi monitoring in 2002 recorded<br />
36 birds.<br />
Stewardship of the land is overseen by a Joint Advisory Committee<br />
made up of representatives of Ng _ ati Tama and DOC. The same group<br />
is also involved in management of the new Parininihi Marine Reserve<br />
adjoining the block.<br />
And on the ground, Tahana walks the ridges and gullies, eyeing up<br />
potential trap-line terrain and dreaming of the day when the morning<br />
birdsong here will rival that of anywhere else.<br />
land that is owned by DOC, iwi and about 65 farmers. Many of the<br />
threatened plants and special habitats occur on private land, so this<br />
control programme is reliant on ongoing good co-operation between<br />
the Department and farmers. The programme involves some helicopter<br />
spraying, abseilers and, ground-based crews and even hand weeding<br />
of herbfi elds. Threatened species are starting to re-establish in the<br />
weeded sites.<br />
State of the Environment Report 2009<br />
65
66<br />
<strong>LAND</strong>, <strong>SOIL</strong> & <strong>BIODIVERSITY</strong><br />
Lake Rotokare, the ‘rippling lake’.<br />
IS<strong>LAND</strong> LIFE FAR FROM THE SEA<br />
How do you turn an inland lake and its surrounds into an island? And<br />
why would you want to anyway?<br />
Answer #1: With thousands of volunteer-hours of sheer hard work.<br />
Answer #2: To restore to <strong>Taranaki</strong> some of its former treasures of<br />
biodiversity – for we are talking here about a ‘mainland island’, a<br />
landlocked area where introduced pests are excluded so native fauna<br />
and fl ora can thrive and grow.<br />
Long a popular spot for nature-lovers and recreational boaties,<br />
Lake Rotokare and its 230 ha bush-clad catchment sit amidst a<br />
sea of farmland 12 km east of Eltham. And thanks to the grit and<br />
determination of locals, it is now encircled by an 8.4 km high-tech<br />
predator-proof fence, within which introduced pests are being<br />
eradicated with traps and baits.<br />
It’s all the work of the Rotokare Scenic Reserve Trust. This grassroots<br />
organisation was formed in 2004 by reserve neighbours concerned<br />
about the run-down state of the habitat, and it has quickly developed<br />
its scope, stature, membership and experience.<br />
Already the reserve is home to precious native species including the<br />
North Island robin, fernbird, spotless crake, kerer _ u, t _ u _ ı, New Zealand<br />
scaup, mallard, grey duck, New Zealand shoveler, morepork, tomtit,<br />
bellbird and black shag.<br />
But the Rotokare Scenic Reserve Trust has a yet grander vision: - a<br />
restored and protected ecosystem that is a safe haven for the release<br />
of endangered species such as the kiwi, saddleback and k _ okako. In the<br />
words of the trust’s mission statement, it aims to offer the <strong>Taranaki</strong><br />
community ‘the best opportunities for education, recreation and<br />
inspiration within the bounds of environmental protection’.<br />
“The Xcluder predator-proof fence is the most sustainable method of<br />
controlling pests – volunteer burn-out or long-term use of toxins is a<br />
risk the trust doesn’t want to take,” said Chairman Joe Menzies.<br />
TARANAKI – WHERE WE STAND<br />
environment free from exotic predators, and provide a safe habitat for<br />
translocation of endangered species.”<br />
It possibly may be a source of endangered species for translocation<br />
to other projects. And once bird numbers start increasing inside the<br />
reserve, a spill-over effect is likely in neighbouring reserves and<br />
patches of bush.<br />
The Trust has succeeded in convincing many in <strong>Taranaki</strong> and beyond<br />
that its vision can become reality. Volunteers and sponsors have given<br />
up many weekends of free time to take part in an intensive trapping<br />
and monitoring programme.<br />
Eye-wateringly enormous fundraising targets have also been met<br />
– for example, the predator-proof fence cost $1.9 million. The Trust<br />
has won support from the South <strong>Taranaki</strong> District <strong>Council</strong> and the<br />
<strong>Taranaki</strong> <strong>Regional</strong> <strong>Council</strong>, the TSB Community Trust and the <strong>Taranaki</strong><br />
Electricity Trust. But Joe says most credit must go to individuals in the<br />
community who have sponsored and given their support. “This really<br />
is what got us in the door of the major sponsors.”<br />
South <strong>Taranaki</strong> District <strong>Council</strong> Property and Facilities Manager John<br />
Sargeant has one word for the Trust’s achievements: Incredible. “It<br />
really is a model of a community project working from the bottom up.”<br />
“A completely pest-free area will allow vegetation to recover without<br />
browsing pressure, allow existing fauna to breed successfully in an Project Co-ordinator Kara Prankerd checks a tracking tunnel.<br />
Beverley Prankard<br />
Rob Tucker
(E) WORKING WITH <strong>LAND</strong>OWNERS<br />
ON KEY NATIVE ECOSYSTEMS<br />
The <strong>Taranaki</strong> <strong>Regional</strong> <strong>Council</strong> has much experience and expertise in<br />
preparing riparian plans and farm plans through its sustainable land<br />
management programme. Using these as a model, the <strong>Council</strong> is now<br />
working with landowners and other agencies to develop Biodiversity<br />
Plans for regionally signifi cant sites. These plans will vary according to<br />
the complexity of management needs at a particular site. They will be<br />
customised to suit the site and landowners.<br />
Planning the management at each site is important to ensure that all<br />
aspects of management are considered (e.g. it is no good killing the<br />
predators if meanwhile old man’s beard is smothering the canopy).<br />
Developing a plan of the required management actions will provide<br />
the landowner with a clear idea of what management is required to<br />
sustainably manage the site for biodiversity purposes, show landowners<br />
what tasks they can do, and what tasks <strong>Council</strong> staff, or staff from<br />
other agencies they can do, and will be used to assist landowners to<br />
access funds from the various funding pools available (e.g. QEII, TRC<br />
Environmental Enhancement Grant, district council heritage funds,<br />
<strong>Taranaki</strong> Tree Trust and Biodiversity Condition Fund).<br />
A few landowners have started implementing their biodiversity plans.<br />
For example, the plan developed for the Umutekai bush, a regionally<br />
signifi cant area of lowland forest just out of New Plymouth, was used to<br />
successfully apply for biodiversity condition funds to develop a predator<br />
programme.<br />
(F) SUSTAINABLE <strong>LAND</strong> MANAGEMENT<br />
PROGRAMME<br />
The <strong>Council</strong>’s sustainable land management programme involves<br />
preparing for landowners property plans and making recommendations<br />
for riparian fencing and planting on the ring plain and retirement of<br />
steep land in the hill country. By implementing the recommendations<br />
contained in these plans, landowners are making valuable contributions<br />
to biodiversity. By the end of June 2008, the <strong>Council</strong> had prepared a<br />
total of 2009 riparian management plans, cumulatively covering 10,818<br />
km of stream bank. 6,539 km of stream bank is fenced and 4,705 km is<br />
vegetated (either with existing vegetation or new riparian planting).<br />
(G) THREATENED SPECIES PROGRAMMES<br />
There are a number of programmes undertaken in <strong>Taranaki</strong> led by<br />
the Department of Conservation targeting threatened species. These<br />
have been outlined in Table 3.10 above and described in a number of<br />
case studies. Examples of threatened fauna programmes include the<br />
following:<br />
The whio/blue duck population on Mount <strong>Taranaki</strong> is gradually<br />
increasing as a result of the predator control, releases of captive and<br />
wild birds, and operation nest egg.<br />
Kiwi chicks have been reintroduced to the Egmont National Park by<br />
the Department of Conservation and <strong>Taranaki</strong> Kiwi Trust with the<br />
support of the Bank of New Zealand Save the Kiwi Trust. Since 2004,<br />
A mass release of kiwi chicks into Egmont National Park, April 2007.<br />
33 kiwi chicks have been released on the mountain. Annual kiwi calls<br />
are monitored and suggest the population is still low. However, it is<br />
hoped that call rates will increase in the coming years as the released<br />
chicks mature and start calling.<br />
Breeding of Northern NZ dotterel is monitored to see if there is any<br />
range expansion for the northern subspecies. A dotterel census is<br />
planned for 2011 by DOC and the Ornithological Society.<br />
Survey and monitoring are a priority for striped and speckled skinks.<br />
This involves the Department of Conservation conducting surveys,<br />
revisiting recorded populations, and following up public reports.<br />
Giant powelliphanta land snails are regularly monitored and surveyed<br />
on Mount <strong>Taranaki</strong>. Recently a second population was discovered on<br />
the Pouakai range.<br />
The habitat of the coastal moth, Notoreas ‘<strong>Taranaki</strong> coast’ is<br />
protected through liaison with landowners and a host plant weeding<br />
and replanting programme.<br />
Gecko surveys of new areas have resulted in the recent discovery of<br />
gold stripe geckos at Lake Rotokare. Previously recorded populations<br />
and public reports of geckos are also followed up.<br />
(H) MONITORING<br />
The <strong>Taranaki</strong> <strong>Regional</strong> <strong>Council</strong> is developing a programme to monitor<br />
the state of privately-owned key native ecosystems, and is including<br />
monitoring recommendations in each biodiversity plan prepared.<br />
The Department of Conservation runs several forest monitoring<br />
programmes in <strong>Taranaki</strong>, mainly focused on the impacts of possums and<br />
goats, to determine whether wild animal management is meeting its<br />
objectives of maintaining or restoring forest health.<br />
Community groups also gather information valuable for monitoring<br />
biodiversity in the region. Groups such as the Ornithological Society and<br />
the Herpetological Society gather information about birds and lizards<br />
respectively. The <strong>Taranaki</strong> <strong>Regional</strong> <strong>Council</strong> is planning to work with<br />
such groups to ensure that their information is incorporated onto the<br />
<strong>Taranaki</strong> <strong>Regional</strong> Xplorer website so that it can be made more widely<br />
available.<br />
Department of Conservation<br />
State of the Environment Report 2009<br />
67
68<br />
<strong>LAND</strong>, <strong>SOIL</strong> & <strong>BIODIVERSITY</strong><br />
(I) FUNDING FOR <strong>BIODIVERSITY</strong> PROTECTION<br />
Biodiversity projects on private land or by private trusts have been<br />
funded, over the past fi ve years, by a number of sources (Table 3.12).<br />
Two district councils have funds that they allocate to biodiversity<br />
projects (South <strong>Taranaki</strong> District <strong>Council</strong> and New Plymouth District<br />
<strong>Council</strong>). The <strong>Taranaki</strong> <strong>Regional</strong> <strong>Council</strong>’s environmental enhancement<br />
grant is targeted for regionally signifi cant wetlands and other sites of<br />
regional signifi cance.<br />
South <strong>Taranaki</strong> District <strong>Council</strong> and New Plymouth District <strong>Council</strong> both<br />
have heritage funds from which they fund biodiversity projects. The<br />
<strong>Taranaki</strong> Tree Trust assists land owners with the protection of valuable<br />
forest remnants and wildlife habitats. It helps with fencing and planting<br />
of riparian (stream bank) margins and the protection of forest and<br />
wetland remnants through fencing or planting.<br />
Over the past fi ve years the Biodiversity Condition and Advice Fund has<br />
funded 30 projects within the <strong>Taranaki</strong> region, with a total investment<br />
from the fund being $805,650, covering 15,000 hectares of private<br />
property. Many other organisations and the landowners also put<br />
signifi cant contributions forward themselves to gain this funding. The<br />
projects have directly benefi ted more than 500 landowners through<br />
fencing, pest animal and weed control projects, restoration plantings,<br />
and dog aversion training. In addition, many of these approved projects<br />
have had signifi cant benefi t for endangered species including kiwi and<br />
blue duck through landowner initiated projects.<br />
Other sources for biodiversity projects have included corporate<br />
sponsorships. For example, Greymouth Petroleum sponsors aspects of<br />
the East <strong>Taranaki</strong> Environment Trust, Shell Todd Oil Services has donated<br />
to biodiversity work undertaken at Sandy Bay. In addition to the funds<br />
noted above, additional council funds have been used for signifi cant<br />
projects (e.g. both South <strong>Taranaki</strong> District <strong>Council</strong> and the <strong>Taranaki</strong><br />
<strong>Regional</strong> <strong>Council</strong> have provided funds for the Rotokare Scenic Reserve<br />
project). Finally, funds have been received from trusts from outside the<br />
region (e.g. the Central North Island Blue Duck Charitable Trust).<br />
(J) COMMUNITY PROJECTS<br />
A number of community groups are actively involved in biodiversity<br />
projects in <strong>Taranaki</strong>.<br />
Table 3.12: Grants allocated to landowners/Trusts for biodiversity protection in <strong>Taranaki</strong> over the past fi ve years.<br />
65 Primarily used to protect regionally signifi cant wetlands (see Chapter 4.4 Freshwater Biodiversity, but included here for comparison and completeness).<br />
66 Used to protect areas of indigenous vegetation not just identifi ed Signifi cant Natural Areas.<br />
TARANAKI – WHERE WE STAND<br />
Part of the 8.4 km predator-proof fence which encloses Rotokare Scenic Reserve.<br />
For example, the East <strong>Taranaki</strong> Environment Trust undertakes extensive<br />
predator control work to protect around 3 ,000 ha of kiwi habitat in the<br />
Matau/Pouiatoa area in eastern <strong>Taranaki</strong>. The Trust focuses on ‘in situ’<br />
native species protection with a focus on kiwi. Its goal is to see 500<br />
pairs of kiwi under predator protection in <strong>Taranaki</strong> within fi ve years (see<br />
case study).<br />
The Ng _ ati Tara _ Oaonui Sandy Bay Society undertakes activities such as<br />
fencing, pest control and putting up signs to protect New Zealand dotterels<br />
and other threatened bird species in the Sandy Bay area in _ Oaonui.<br />
Source 2002-03 2003-04 2004-05 2005-06 2006-07 TOTAL<br />
Environmental Enhancement Grant (TRC) 65 $121,093 $102,942 $41,863 $84,410 $112,663 $462,971<br />
Signifi cant Natural Areas fund (STDC) 66 $14,851 - $23,359 $12,808 $23,299 $74,317<br />
Heritage Fund - SNAs (NPDC) $7,111 - $47,725 $13,688 $23,620 $92,144<br />
Biodiversity Condition Fund (DOC) $107,222 $112,460 $212,109 $100,852 $273,007 $805,650<br />
<strong>Taranaki</strong> Tree Trust $168,000 $79,239 $111,226 $78,923 $125,846 $563,234<br />
<strong>Taranaki</strong> <strong>Regional</strong> <strong>Council</strong>
The Rapanui Grey-Faced Petrel Trust was established to assist in<br />
the management, conservation and monitoring of the Rapanui greyfaced<br />
petrel colony, particularly the management of the predator<br />
exclusion fence.<br />
The Rotokare Scenic Reserve Trust aims to eradicate all introduced<br />
mammal pests from the Rotokare Scenic Reserve within three years<br />
and prevent their re-introduction back into the pest free sanctuary (see<br />
case study).<br />
The <strong>Taranaki</strong> Kiwi Trust works throughout <strong>Taranaki</strong> ‘to promote and<br />
facilitate the restoration and protection of sustainable populations of<br />
kiwi in <strong>Taranaki</strong>’. The Trust is involved in the predator trapping project<br />
on Mount <strong>Taranaki</strong>, and the Bank of New Zealand’s Save the Kiwi Trust<br />
Operation Nest Egg project that enables the Egmont National Park’s<br />
kiwi population to be rejuvenated. The Trust is also actively involved in<br />
advocacy and education.<br />
<strong>Taranaki</strong> branches of Forest and Bird are also actively involved in several<br />
biodiversity projects.<br />
Individual landowners and other community groups are increasingly<br />
getting involved in managing and protecting biodiversity.<br />
Table 3.13: Summary of progress implementing regional objectives and policies on biodiversity.<br />
(K) SUMMARY OF PROGRESS<br />
Progress with implementing regional objectives and policies on<br />
biodiversity is summarised in Table 3.13.<br />
Issue What do we want to achieve How is it measured What progress are we making<br />
Protecting underrepresented<br />
habitats of<br />
terrestrial indigenous fl ora<br />
and fauna.<br />
Reducing the impact of pest<br />
animals and plants.<br />
Encouraging connectivity<br />
between remnant habitats.<br />
Maintenance of the areal extent<br />
of indigenous ecosystems and<br />
habitats.<br />
An increase in the number<br />
and areal extent of regionally<br />
signifi cant values that are formally<br />
protected or covenanted.<br />
Maintenance and enhancement<br />
of the ecological condition of<br />
regionally signifi cant habitats.<br />
An increase in the areal extent of<br />
planted riparian margins along ring<br />
plain rivers.<br />
The Rapanui coastline.<br />
Extent of indigenous vegetation.<br />
Extent of indigenous vegetation<br />
formally protected or covenanted.<br />
Number of pests killed in pest<br />
operations.<br />
Response from indicator species,<br />
such as threatened plants/animals<br />
(e.g. kiwi, blue duck).<br />
Extent of riparian vegetation –<br />
both existing and planted.<br />
<strong>Taranaki</strong> <strong>Regional</strong> <strong>Council</strong><br />
Slight decrease in the coverage of<br />
indigenous vegetation at monitored sites.<br />
225,566 ha of indigenous vegetation<br />
remains in <strong>Taranaki</strong>, 11,034 ha on land that<br />
nationally has less than 10% indigenous<br />
vegetation remaining.<br />
128,549 ha of indigenous vegetation is<br />
formally protected through either being<br />
public conservation land or private land<br />
protected with a QEII covenant. Other areas<br />
have also been covenanted through Ng _ a<br />
Whenua Rahui Kawanata.<br />
3,374 ha have been formally protected<br />
through a QEII covenant.<br />
96% of the <strong>Taranaki</strong> ring plain is included<br />
in the <strong>Regional</strong> <strong>Council</strong>’s self-help possum<br />
programme.<br />
105,000 ha of <strong>Taranaki</strong> is included in a<br />
Department of Conservation possum<br />
programme.<br />
There are a number of specifi c programmes<br />
targeting predators.<br />
Blue duck population on Egmont National<br />
Park has increased to between 30 and 50<br />
birds over the last eight years.<br />
6,539 km or 60% of stream bank covered by<br />
riparian plans is fenced, 4,705 km or 57% of<br />
stream bank is vegetated.<br />
State of the Environment Report 2009<br />
69
70<br />
<strong>LAND</strong>, <strong>SOIL</strong> & <strong>BIODIVERSITY</strong><br />
3.4.3 HOW DO WE COMPARE?<br />
The extent of indigenous vegetation remaining in threatened land<br />
environments (where there is now less than 20% indigenous vegetation<br />
remaining) in <strong>Taranaki</strong> was presented in section 3.4.1(c) and Figure<br />
3.13. This has been reported for all district and regional councils<br />
in the country 68 . This study ranked the district councils for the area<br />
of indigenous cover not protected in each of the threatened land<br />
environments (described in the section on indigenous vegetation above<br />
and illustrated in Figure 3.13 for <strong>Taranaki</strong>). The three district councils in<br />
<strong>Taranaki</strong>, - New Plymouth, Stratford and South <strong>Taranaki</strong>, ranked 42nd,<br />
33rd and 40th, respectively, out of a total of 73 councils in terms of the<br />
amount of indigenous vegetation remaining in these categories. <strong>Council</strong>s<br />
with the most indigenous vegetation remaining in threatened land<br />
environments included Central Otago (ranked 1st), Queenstown Lakes<br />
(2nd), Waitaki (3rd) and Mackenzie (4th).<br />
The area of indigenous vegetation cover not protected was also<br />
identifi ed for the regions. This is set out in Table 3.14.<br />
68 Walker, S; Price, R and Rutledge, D. 2004. New Zealand’s Remaining Indigenous Cover Recent Changes and Biodiversity Protection Needs. Prepared by Landcare Research for the Department of<br />
Conservation.<br />
69 Ministry for the Environment. 2007. Environment New Zealand 2007.<br />
TARANAKI – WHERE WE STAND<br />
Comparing <strong>Taranaki</strong> with other regions in terms of how much indigenous<br />
vegetation remains in the most threatened land environment categories<br />
reveals that <strong>Taranaki</strong> ranks 7th behind Hawke’s Bay, Wellington,<br />
Waikato, Otago, Canterbury and Manawatu-Wanganui. However, when<br />
considering the amount of indigenous vegetation remaining in both<br />
categories (acutely threatened and chronically threatened), <strong>Taranaki</strong> is<br />
5th from the bottom, just ahead of Nelson City, West Coast, Auckland<br />
and Tasman.<br />
The loss of indigenous vegetation (between 1996-97 and 2001-02)<br />
from threatened land environments was also calculated. This found<br />
that South <strong>Taranaki</strong> District had one of the largest losses of indigenous<br />
vegetation cover from the land environment category that now has less<br />
than 10% indigenous vegetation remaining (with an estimated 99 ha<br />
being lost), just behind Masterton District which saw a loss of 194 ha.<br />
Across the whole country there was a decrease of 17,200 ha in native<br />
vegetation cover over that period 69 .<br />
Table 3.14: Area of indigenous vegetation not protected in land environments with less than 10% or less than 20% nationally across 16 regions.<br />
Area (in ha) of indigenous vegetation cover not protected<br />
Region 0-10% category 10-20% category In both categories, i.e. 0-20%<br />
Auckland 3,464 5,299 8,763<br />
Bay of Plenty 8,636 5,027 13,663<br />
Canterbury 25,077 36,836 61,913<br />
Gisborne 3,815 47,601 51,416<br />
Hawke’s Bay 12,128 41,481 53,609<br />
Manawatu-Wanganui 30,883 25,878 56,761<br />
Marlborough 3,183 9,080 12,263<br />
Nelson City 398 213 611<br />
Northland 6,893 16,308 23,202<br />
Otago 23,748 52,494 76,242<br />
Southland 10,149 12,355 22,504<br />
<strong>Taranaki</strong> 11,034 307 11,341<br />
Tasman 3,277 6,232 9,509<br />
Waikato 22,484 12,161 34,645<br />
Wellington 17,404 13,434 30,838<br />
West Coast 0 711 711<br />
Data from Walker et al, 2004.
CHAPTER 4<br />
FRESH WATER<br />
71
72<br />
AT A GLANCE<br />
FRESHWATER QUALITY<br />
The quality of <strong>Taranaki</strong>’s fresh water is highly valued for a wide range of<br />
uses from recreational of fi shing and swimming, to uses for agriculture,<br />
industry and town supplies. Maintaining and enhancing the mauri<br />
(life form) and wairua (spirit) of water is of fundamental importance to<br />
tangata whenua. Management of water quality has been a signifi cant<br />
issue for the <strong>Taranaki</strong> <strong>Regional</strong> <strong>Council</strong> and its predecessors for the past<br />
40 years. Monitoring has shown that:<br />
• measures of ecological health, such as the communities of<br />
invertebrates living in streams, are good to excellent in the upper<br />
catchments where there is more stream bank vegetation cover but<br />
only fair further down the catchment where land use is more intense;<br />
• over the past 12 years, ecological health has demonstrably improved<br />
at a number of sites, including a number in the middle and lower<br />
reaches of catchments, and has not demonstrably deteriorated at any<br />
sites;<br />
• the region’s fresh water usually meets the bacteriological guidelines<br />
for swimming, although at certain times of the summer (immediately<br />
after a fl ood event) or in certain catchments (such as small intensively<br />
farmed catchments) water quality may not meet national guidelines;<br />
• the region’s water quality comfortably meets guidelines for dissolved<br />
oxygen and clarity;<br />
• measures of levels of organic pollution (BOD), bacteriological pollution<br />
(faecal coliforms and enterococci) and toxicity (ammonia) are now<br />
stable regionally, after past improvements;<br />
• <strong>Taranaki</strong> rivers are naturally high in phosphorus and so do not meet<br />
national guidelines, furthermore levels of phosphorus are generally<br />
increasing; and<br />
• nitrogen levels meet guidelines in the upper reaches of catchments,<br />
but not further down, where impacts of agriculture are more intense.<br />
TARANAKI – WHERE WE STAND<br />
The <strong>Regional</strong> Fresh Water Plan, made operative in 2001, contains<br />
policies, methods and rules to maintain and enhance water quality in<br />
<strong>Taranaki</strong>. <strong>Council</strong> offi cers regularly monitor for compliance with the plan<br />
and resource consents, undertaking enforcement action where necessary.<br />
Management highlights over the past fi ve years include:<br />
• a decline in the number of point source discharges to surface water<br />
from 1,612 in 2003 to 1,413 in 2008;<br />
• signifi cant investments have been made by agriculture, industry and<br />
the community in wastewater treatment and disposal systems;<br />
• 100% of dairy farms have effl uent treatment and disposal systems<br />
that are monitored and inspected each year;<br />
• a high rate of compliance with consent conditions with an average of<br />
96% of farm dairy discharges complying with consent conditions and<br />
93% of consent holders showing high or good levels of performance;<br />
• a signifi cant growth in the <strong>Council</strong>’s riparian management programme<br />
– 2,009 riparian plans have now been prepared (treble the number of<br />
plans that had been prepared by 2003 (385), covering a total of 10,818<br />
km of stream bank;<br />
• 1.3 million riparian plants provided at low cost to riparian plan holders<br />
since 1997; and<br />
• landowners’ fencing of 504 km of stream bank and planting of 426 km<br />
through implementing riparian plans, which, added to existing fencing<br />
and planting means that 60% of stream bank on the ring plain, under<br />
a riparian plan, is fenced, and 43% is vegetated.<br />
The <strong>Council</strong> will continue to promote fencing and planting of ring plain<br />
streams to meet the target of 90% of riparian plans implemented by<br />
2015.
FRESHWATER QUANTITY<br />
Surface fresh water is used for a wide range of uses from agriculture<br />
and industry to town water supplies. The region is well-endowed with<br />
fresh water having no less than 530 named rivers or streams. For most<br />
of the time, there are no signifi cant water use pressures in <strong>Taranaki</strong>.<br />
Since 2003 the region has experienced some of the biggest fl oods and<br />
lowest fl ows on record, with fl oods for the Wait _ otara region in 2004 and<br />
the May 2007 fl ash fl ood event between _ O _ akura around to Egmont Village.<br />
Conversely, the region experienced a drought over the summer of<br />
2007-08, recording extremely low rainfall totals, and low stream fl ows.<br />
The main features of water quantity are that:<br />
• there are 150 resource consents to take and use surface water, and<br />
52 consents to direct and use surface water;<br />
• total surface water use is over 474,371 m 3 (the equivalent of 194<br />
Olympic-sized swimming pools) per day;<br />
• the single largest use category is for municipal and rural water supply<br />
schemes, with a total allocation of 152,333 m 3 per day (1,763 litres<br />
per second) or 32% of all allocated water use;<br />
• overall there has been a 7% increase in surface water used since<br />
2003;<br />
• more than 30% of the average low fl ow is allocated for use in 8%<br />
of catchments, but fl ows at which abstraction must cease are set to<br />
safeguard ecological values; and<br />
• interest in irrigation has increased in recent years, especially in the<br />
coastal and southern areas of the region.<br />
The <strong>Regional</strong> Fresh Water Plan, contains provisions to manage water<br />
use to protect aquatic life and other values. Measures are required to be<br />
put in place to mitigate or reduce the environmental effects of water use<br />
and these are closely monitored by the <strong>Council</strong>.<br />
GROUNDWATER<br />
<strong>Taranaki</strong>’s groundwater is increasingly becoming an important source<br />
of water for a variety of purposes including domestic, industrial,<br />
agricultural and domestic water supply, particularly in South <strong>Taranaki</strong>.<br />
Groundwater is also the major component of stream fl ow during dry<br />
weather periods for the hundreds of streams in the region. Groundwater<br />
systems are complex, being infl uenced by the nature of geological<br />
systems. In summary:<br />
• there are 81 resource consents for groundwater use in <strong>Taranaki</strong>;<br />
• a total of 1,550 wells are recorded on the <strong>Council</strong>’s database. Most<br />
of them are used for farm and domestic water supplies, although it<br />
is estimated that a large number of bores are not recorded on the<br />
<strong>Council</strong>’s database;<br />
• 44,022 m 3 (the equivalent of 17 Olympic-sized swimming pools) of<br />
groundwater a day is currently allocated, twice the amount reported<br />
in 2003, but still not a signifi cant pressure on groundwater levels;<br />
• the deeper aquifers mostly show less variation in groundwater levels<br />
than do the shallower aquifers;<br />
• groundwater quality in <strong>Taranaki</strong> is generally high, there are no<br />
problems associated with pesticide residues, microbial contamination<br />
or saltwater intrusion and mineral levels refl ect the geology of the<br />
aquifers;<br />
• 94% of the 68 groundwater wells monitored had nitrate levels that<br />
met national drinking water standards, although nitrate levels have<br />
been found above the guidelines in a few wells tapping into shallow<br />
aquifers in South <strong>Taranaki</strong>; and<br />
• shallow groundwater quality, in terms of nitrate levels, is generally<br />
improving.<br />
The <strong>Regional</strong> Fresh Water Plan, controls groundwater use and<br />
discharges to land that have the potential to affect groundwater quality.<br />
State of the Environment Report 2009<br />
73
74<br />
AT A GLANCE<br />
<strong>BIODIVERSITY</strong><br />
The diverse freshwater wetlands in <strong>Taranaki</strong> range from pristine ones<br />
surrounded by national park to small remnant wetlands that are the<br />
subject of restoration by some landowners, but drainage and land reclamation<br />
by others. The region has a diverse range of rivers and streams<br />
- mountain fed rivers with their headwaters in the Egmont National Park;<br />
ring plain streams arising in pasture land; and river systems draining hill<br />
country. <strong>Taranaki</strong> rivers and streams support a diverse range of native<br />
fi sh and invertebrates. In summary:<br />
• regionally signifi cant wetlands have, on the whole, been adequately<br />
protected through formal mechanisms and proactive protection works<br />
such as fencing and planting;<br />
• 63 small wetlands have been drained or reclaimed since a study<br />
undertaken in 1995;<br />
• Over the past fi ve years, consents have been granted for 25.5 km<br />
of small streams to be piped underground and the realignment of<br />
almost 7 km of streams for the purpose of land improvement with<br />
consequential loss of native fi sh habitat;<br />
• of 108 structures that have the potential to impede fi sh passage,<br />
49 provide adequate fi sh passage, two have been removed and the<br />
others need remedial work;<br />
• since 2001, fi sh passage has been improved over 12 structures; and<br />
• four out of fi ve sites monitored for the threatened brown mudfi sh<br />
show healthy breeding populations.<br />
The <strong>Regional</strong> Fresh Water Plan, contains policy and objectives for<br />
managing freshwater biodiversity through provisions for land drainage,<br />
protection of regionally signifi cant wetlands and provision of fi sh<br />
passage over structures. The <strong>Council</strong> works with landowners to protect<br />
regionally signifi cant wetlands.<br />
TARANAKI – WHERE WE STAND<br />
PUBLIC ACCESS<br />
Public access to rivers and lakes is important for all people of <strong>Taranaki</strong><br />
who use freshwater sites for a variety of recreational purposes, such<br />
as swimming, fi shing, whitebaiting and enjoying picnics. Public access<br />
to rivers and lakes in <strong>Taranaki</strong> is often provided by way of public roads,<br />
or directly through parks and reserves. However, access to many rivers<br />
and stream sites requires the permission of the adjoining landowner.<br />
Respondents to several surveys have indicated that public access to<br />
freshwater sites is “about right”. No major constraints on public access<br />
exist to rivers and streams in <strong>Taranaki</strong>.<br />
District plans prepared by the New Plymouth, Stratford and South<br />
<strong>Taranaki</strong> district councils provide for the creation of esplanade reserves<br />
and esplanade strips alongside rivers and streams.
State of the Environment Report 2009<br />
75
76<br />
FRESH WATER<br />
Waiwhakaiho River and Mount <strong>Taranaki</strong>.<br />
OUR FRESH WATER<br />
Fresh water is important to the people of<br />
<strong>Taranaki</strong>, and is vital for community water<br />
supplies, major industrial uses and agriculture.<br />
Maintaining and enhancing the mauri and<br />
wairua of water is of fundamental importance<br />
to tangata whenua. Water forms an important<br />
part of the cultural and spiritual values of M _ aori<br />
who have a kaitiaki or guardianship role in<br />
relation to water. It is highly valued for its<br />
association with a wide range of amenity and<br />
recreational uses such as swimming, angling,<br />
enjoying picnics, walking and tramping.<br />
Wise management of that freshwater resource<br />
is a signifi cant regional issue for the people of<br />
the region and for the <strong>Taranaki</strong> economy, and<br />
has been for at least the past 40 years. It is<br />
a key component of a ‘prosperous <strong>Taranaki</strong>’,<br />
a region that has a sustainable, resilient and<br />
innovative economy that prospers within the<br />
natural and social environment. Equally it is a<br />
key component of a ‘sustainable <strong>Taranaki</strong>’, a<br />
region that appreciates its natural environment<br />
and its physical and human resources in<br />
planning, delivery and protection 1 . Protecting<br />
the quality of water in our streams, rivers and<br />
lakes is considered by most people to be very<br />
important (81% of people surveyed in the Future<br />
<strong>Taranaki</strong> report agreed). Interestingly, protecting<br />
water quality was identifi ed by only 17% of<br />
people surveyed as an area where signifi cantly<br />
more effort was required, indicating that<br />
the large majority of respondents consider<br />
that current efforts and current progress are<br />
1 Community Outcomes Project Team, 2004. Future <strong>Taranaki</strong>: A Report on Community Outcomes for <strong>Taranaki</strong>.<br />
2 <strong>Taranaki</strong> <strong>Regional</strong> <strong>Council</strong>, 2008. Recreational Use of Coast, Rivers and Lakes in <strong>Taranaki</strong> 2007-08.<br />
TARANAKI – WHERE WE STAND<br />
delivering on their aspirations. Access to highquality<br />
recreational sites (i.e. lakes and rivers),<br />
was also noted as important to the community<br />
in this and other surveys 2 .<br />
Rainfall in <strong>Taranaki</strong> is generally high and<br />
frequent, meaning water supply for agriculture,<br />
community water supplies and industry is<br />
generally plentiful and streams are well-fl ushed,<br />
although certain parts of the region can still fi nd<br />
themselves stretched for water during periods<br />
of low rainfall and low fl ows, as witnessed<br />
during the dry summer of 2007-08. Increasingly,<br />
those needing water at critical periods are<br />
seeking groundwater, to ensure continuity of<br />
availability during times of water restriction.<br />
Demand, particularly from agriculture, for<br />
Manganui River at Everett Park.<br />
<strong>Taranaki</strong> <strong>Regional</strong> <strong>Council</strong><br />
groundwater is increasing, but is still not at<br />
levels seen elsewhere around the country.<br />
The region contains hundreds of rivers and<br />
streams. Those around the ring plain are, on the<br />
whole, short, relatively small and fast-fl owing,<br />
and they drain catchments formed from volcanic<br />
geology. These characteristics infl uence the<br />
water quality and stream ecological health,<br />
which are generally high, particularly in the<br />
upper catchments of those rivers with their<br />
headwaters in Egmont National Park. Naturally<br />
high levels of phosphorus in <strong>Taranaki</strong> rivers can<br />
be attributed to the volcanic catchments they<br />
drain. Rivers and streams draining the eastern<br />
and northern hill country tend to be more siltladen,<br />
largely due to the erodible nature of the<br />
geology of their catchments.<br />
The quality of <strong>Taranaki</strong>’s fresh water is also<br />
strongly infl uenced by uses of it and the<br />
adjacent land. Intensive agriculture leads to<br />
contamination from surface run-off particularly<br />
from pastoral land, point source discharges, and<br />
structural alteration of streams and wetlands for<br />
the purpose of land improvement. Pastoral and<br />
urban development over the past 150 years has<br />
resulted in dramatic changes to the character<br />
of <strong>Taranaki</strong>’s rivers and their catchments. Rivers<br />
and streams that once fl owed through forest<br />
cover, today fl ow through farmland for most<br />
of their length. Streams where stream bank<br />
vegetation has been retained or restored are<br />
less susceptible to erosion, fl ooding, loss of<br />
shading, increased water temperature, and<br />
increased nutrients, and support richer natural<br />
aquatic and stream bank habitat.<br />
Rob Tucker
Figure 4.1: Dairy cow numbers in <strong>Taranaki</strong>.<br />
In <strong>Taranaki</strong>, the predominant agricultural pressure on freshwater<br />
resources comes from the dairying sector, which covers the majority of<br />
the ring plain. Dairy herds are increasing in size through stocking rate<br />
intensifi cation and farm amalgamations, resulting in larger operations.<br />
Overall, the number of cows in <strong>Taranaki</strong> has steadily increased from<br />
350,000 in the late 1970s and appears to be on a plateau of about<br />
480,000 cows (Figure 4.1). Pressures on freshwater quality and quantity<br />
also come from industrial uses.<br />
Managing freshwater quantity and quality, and managing freshwater<br />
habitats (streams, rivers and wetlands) in a manner that is sympathetic<br />
to the demands of 21st century living, and which allows the regional<br />
community to meet its aspirations and expectations, is the challenge for<br />
not just the <strong>Council</strong>, but for all of <strong>Taranaki</strong>.<br />
Looking to the future, it is anticipated that a mix of regulatory and nonregulatory<br />
measures such as increasing riparian planting, the exclusion of<br />
stock from water courses and from stream banks, and continued vigilance<br />
in terms of managing point source discharges, should result in maintaining,<br />
or improving upon existing water quality and ecological health.<br />
4.1 SURFACE WATER<br />
QUALITY<br />
Water quality may be infl uenced by a number of natural factors such as<br />
climate, fl ow, geology, soils and vegetation cover. It is also infl uenced<br />
by human activities such as waste disposal, urban and industrial<br />
development, and agricultural land use.<br />
Monitoring water quantity and quality has been, and continues to be, an<br />
important component of the <strong>Taranaki</strong> <strong>Regional</strong> <strong>Council</strong>’s work. Results<br />
enable the <strong>Council</strong> to compare <strong>Taranaki</strong>’s water quality against national<br />
water quality guidelines and to examine trends in water quality over<br />
time. Being able to report accurately on the environmental results of<br />
the management of <strong>Taranaki</strong>’s freshwater resources will depend on<br />
continuing the <strong>Council</strong>’s scientifi cally robust monitoring programmes,<br />
something the <strong>Council</strong> is committed to doing.<br />
When water quality is investigated or monitored, it is for the purpose<br />
of being able to assess what the health of the river, stream or lake is<br />
like, and the suitability of the water for other uses. Stream ecological<br />
health can be measured directly by looking at the composition of the<br />
communities of invertebrates (such as insects, crustaceans and snails)<br />
that live on the stream bed and by looking at the algae (in terms of how<br />
There are around 480,000 dairy cows in <strong>Taranaki</strong>.<br />
much and what type) growing on the rocks. These communities respond<br />
directly to water quality and ecological conditions, so the indices derived<br />
from the data are particularly useful for monitoring trends in stream<br />
health over time. This chapter fi rst discusses the outcomes of the<br />
<strong>Council</strong>’s biomonitoring programme. It is the state of the ecology that<br />
is one of the ultimate measures of the success or otherwise of water<br />
management in the region.<br />
Water quality is also assessed indirectly through a range of physical and<br />
chemical measurements such as levels of nutrients, water clarity, water<br />
temperature and bacteria. These indicators can help identify specifi c<br />
pressures or problems (in turn allowing remedial and control measures<br />
to be better focused). This chapter then discusses the outcomes of the<br />
<strong>Council</strong>’s physicochemical monitoring programme and whether <strong>Taranaki</strong><br />
streams comply with guidelines for physical and chemical variables in<br />
order to safeguard water quality for such purposes as protecting the<br />
aquatic ecosystem, for ensuring that water quality is adequate for stock<br />
drinking water, for irrigation or for contact recreation. Furthermore,<br />
trends in the variables monitored are examined to see if <strong>Taranaki</strong>’s water<br />
quality is moving closer to the guidelines or further away.<br />
In considering <strong>Taranaki</strong>’s water quality, as measured by either physical,<br />
chemical or biological variables, monitoring aims to examine differences<br />
between sites, between catchments, down catchments, and over time.<br />
Interpreting the data aims to answer questions of why water quality<br />
differs, whether differences are due to natural or human impacts, the<br />
effectiveness or otherwise of management interventions, and what<br />
amount of change (either between sites or over time) is appropriate.<br />
Measuring water temperature.<br />
Rob Tucker<br />
Rob Tucker<br />
State of the Environment Report 2009<br />
77
78<br />
FRESH WATER<br />
4.1.1 WHAT IS THE STATE<br />
OF ECOLOGICAL HEALTH OF<br />
TARANAKI’S RIVERS & STREAMS?<br />
(A) INDICATORS AND GUIDELINES<br />
Freshwater invertebrates<br />
Freshwater invertebrate communities include a range of insects,<br />
crustaceans, worms and snails that live in river and stream beds<br />
and waterways. They are often called ‘macroinvertebrates’ as they<br />
are visible to the naked eye. The composition of these communities<br />
refl ects water quality and habitat conditions 3 . Indices based on these<br />
communities are an important measure of overall ecological health<br />
because they measure what actually lives in the water, and how those<br />
organisms are responding to instream conditions such as levels of algae.<br />
The key index used is the ‘Macroinvertebrate Community Index’ (MCI)<br />
which is based on scores for individual taxa living in stony streams<br />
according to their particular tolerance to organic pollution or nutrient<br />
enrichment. The higher the MCI the greater the proportion of organisms<br />
that prefer better water quality and better ecological conditions 4 .<br />
The interpretation of the MCI index has been adapted for <strong>Taranaki</strong><br />
streams and rivers, 5,6 based on the original classifi cation 4,7 , and in<br />
consultation with the index’s author. This six-step classifi cation system<br />
is based on a much more comprehensive dataset than available for the<br />
original scale, and so more accurately refl ects the situation for <strong>Taranaki</strong><br />
ring plain streams. It means that ecological conditions for stonybottomed<br />
streams can be graded from very poor to excellent (Table 4.1).<br />
Table 4.1 MCI categories of <strong>Taranaki</strong> stream ‘health’.<br />
Grading MCI Code<br />
Excellent >140<br />
Very Good 120-140<br />
Good 100-119<br />
Fair 80-99<br />
Poor 60-79<br />
Very Poor
(B) WHAT INVERTEBRATES TELL US<br />
ABOUT THE ECOLOGICAL HEALTH OF<br />
RIVERS AND STREAMS<br />
Freshwater invertebrate communities have been used to assess the<br />
environmental state of rivers and streams in the region for nearly 30<br />
years. Over 7,500 macroinvertebrate samples have been collected from<br />
more than 1,000 sites within the <strong>Taranaki</strong> region. Samples are collected<br />
and processed according to national protocols 8 . Since 1995 the <strong>Taranaki</strong><br />
<strong>Regional</strong> <strong>Council</strong> has used them to monitor long-term regional water<br />
quality trends. This component of the <strong>Council</strong>’s state of the environment<br />
monitoring (SEM) programme commenced with 32 sites surveyed under<br />
stable spring and summer fl ow conditions each year. The programme<br />
had expanded to 51 SEM sites by 2007 (Figure 4.2). The sites in the<br />
programme are mostly in the cool or extremely wet climate category of<br />
the national classifi cation of streams 9 . They all are sourced from hills<br />
or the mountain (rather than springs) and are all in areas of volcanic<br />
geology. There are a few sites within indigenous vegetation with the<br />
remainder in areas where pasture is the main land use.<br />
Biological monitoring within the larger, more erosion-prone catchments<br />
of eastern <strong>Taranaki</strong> has not been as extensive as elsewhere in the<br />
region (particularly on the ring plain where the majority of compliance<br />
biomonitoring and most state of the environment monitoring is<br />
undertaken). However, some monitoring has been carried out at 22<br />
hill country sites in six catchments extending from coastal to upper<br />
reaches 10 (Figure 4.2).<br />
Figure 4.2: Locations of biomonitoring sites around the region.<br />
Collecting freshwater invertebrates.<br />
All sites are classifi ed as low elevation sites in soft sedimentary geology<br />
rivers with eight sites in indigenous forest and 14 in pastoral land use<br />
types 9 .<br />
Summary of results<br />
The results from the <strong>Council</strong>’s state of the environment monitoring are<br />
summarised for each site in Table 4.2. The table sets out the range<br />
and median MCI scores, provides an indication of the stream health,<br />
as classifi ed by MCI score, and indicates the direction of any trends<br />
(together with an indication of the statistical signifi cance of the trend).<br />
Median MCI scores of greater than 120 were found in the upper reaches<br />
of the P _ atea, Manganui, Waiwhakaiho, Kaupokonui and Waingongoro<br />
rivers and Timaru, Maketawa, Waimoku and Katikara streams. MCI<br />
scores of greater than 120 are indicative of very good stream health,<br />
high water quality and good habitat conditions.<br />
Sites with good stream health (MCI scores between 100 and 119) were<br />
mainly situated in mid to upper catchments, with these sites refl ecting<br />
effects such as non-point source run-off, point source discharges and<br />
physical habitat changes downstream of the Egmont National Park<br />
boundary.<br />
Fair stream health tended to typify sites in the mid to lower reaches of<br />
rivers and streams, where cumulative impacts of point and non-point<br />
source discharges, and stream bed and stream bank changes, were<br />
more pronounced.<br />
Poor to very poor stream health (MCI scores below 80 units) has been<br />
found in smaller streams subject to point source organic overloading<br />
(Mangawhero Stream) and intensively industrialised catchments<br />
(Mangati Stream).<br />
The long-term health of the Stony (Hangatahua) and Waiaua rivers cannot<br />
be accurately assessed using MCI scores as both have been markedly<br />
affected by severe natural erosion events in the headwaters on several<br />
occasions during the 12 year period, hence the wide range of MCI scores<br />
for these rivers.<br />
In terms of the sites in hillcountry catchments, those in the indigenous<br />
forest class had greater species richness (median: 30 taxa) and higher<br />
MCI values (median: 116 units) than those sites in the pasture land<br />
cover class (median: 19 taxa and 87 MCI units). The overall range of MCI<br />
scores in eastern hillcountry catchments was narrower and the median<br />
lower than found for ring plain rivers and streams 10 .<br />
8 Stark, J.D; Boothroyd, I.K.G; Harding, J.S; Maxted J.R; Scarsbrook, M.R, 2001. Protocols for Sampling Macroinvertebrates in Wadeable Streams. New Zealand Macroinvertebrate Working Group<br />
Report No 1. Prepared for Ministry for the Environment. Sustainable Management Fund Project No 5103.<br />
9 Snelder, T; Biggs, B; Weatherhead, M. 2004. New Zealand River Environment and Classifi cation User Guide. Prepared for the Ministry for the Environment by NIWA.<br />
10 <strong>Taranaki</strong> <strong>Regional</strong> <strong>Council</strong>, 2006. A Review of Macroinvertebrate Biomonitoring Data for Large Hill Country Catchments in the <strong>Taranaki</strong> Region.<br />
Rob Tucker<br />
State of the Environment Report 2009<br />
79
80<br />
FRESH WATER<br />
Table 4.2 Summary of state and trends of stream health as measured by freshwater invertebrates, 1995-2007.<br />
Sites Stream health<br />
Trends<br />
River/Stream Location Range Median (median)<br />
Signifi cance<br />
Stony (Hangatahua) R Mangatete Road 64-160 113 good+ �<br />
TARANAKI – WHERE WE STAND<br />
SH45 84-160 109 good+ �<br />
Huatoki S Hadley Drive 79-105 92 fair ☺<br />
Huatoki Domain 91-115 102 good ☺<br />
Near coast 69-99 86 fair �<br />
Kapoaiaia S Wiremu Road 83-119 101 good �<br />
Wataroa Road 78-98 91 fair �<br />
Cape Egmont 76-92 84 fair �<br />
Katikara S Carrington Road 132-148 138 very good �<br />
Coast 81-116 99 fair ID<br />
Kaupokonui R Opunake Rd 125-138 129 very good �<br />
u/s of Kaponga WWTP 98-126 112 good ☺<br />
u/s of Fonterra, Kapuni factory 71-118 98 fair ☺<br />
Upper Glenn Rd 66-101 91 fair ☺<br />
near mouth 69-98 89 fair �<br />
Kurapete S u/s of Inglewood WWTP 80-100 90 fair ☺<br />
6km d/s of Ing’d WWTP 70-103 87 fair ☺<br />
Maketawa S Denby Rd 116-141 129 very good ID<br />
Tarata Rd 91-115 99 fair ID<br />
Mangaehu R Raupuha Road 77-104 84 fair ☺<br />
Manganui R SH3 113-143 126 very good �<br />
Bristol Road 77-115 98 fair �<br />
Mangaoraka S Corbett Road 75-104 86 fair ☺<br />
Mangati S d/s of railway line 56-83 77 poor �<br />
Te Rima Pl, Bell Block 44-72 63 poor ☺<br />
Mangawhero S u/s of Eltham WWTP 58-79 73 poor �<br />
d/s of Mangawharawhara S 68-86 77 poor ☺<br />
Mangorei S. SH3 86-113 104 good ID<br />
P _ atea R Barclay Road 127-143 138 very good �<br />
Swansea Road 99-130 110 good �<br />
Skinner Road 86-104 97 fair �<br />
Punehu S Wiremu Road 104-133 119 good �<br />
SH45 70-99 85 fair ☺
Table 4.2 Continued: Summary of state and trends of stream health as measured by freshwater invertebrates, 1995-2007.<br />
Sites Stream health<br />
Trends<br />
River/Stream Location Range Median (median)<br />
Signifi cance<br />
Timaru S Carrington Road 125-144 136 very good �<br />
SH45 89-120 99 fair ☺<br />
Waiau S Inland North Road 80-98 87 fair �<br />
Waiaua R Wiremu Road 96-126 117 good+ �<br />
SH45 69-112 94 fair+ ☺<br />
Waimoku S Lucy’s Gully 121-137 132 very good �<br />
Beach 75-95 87 fair �<br />
Waingongoro R Adjacent to Nat. Pk. boundary 122-139 133 very good ☺<br />
Opunake Road 119-139 127 very good �<br />
Eltham Road 91-115 100 good ☺<br />
Stuart Road 82-105 93 fair �<br />
SH45 73-105 95 fair �<br />
_<br />
Ohawe Beach 69-98 86 fair �<br />
Waiongana S SH3a 82-112 94 fair �<br />
Devon Road 72-102 83 fair ☺<br />
Waitara R Mamaku Road 64-97 84 fair �<br />
Waiwhakaiho R National Park 121-137 127 very good ID<br />
SH3 (Egmont Village) 87-122 107 good �<br />
Constance St, NP 71-108 93 fair �<br />
Near mouth 70-111 86 fair �<br />
Note: Stony and Waiaua Rivers regularly affected by signifi cant headwater erosion events.<br />
Key:<br />
upper Upper reaches of the catchment<br />
middle Middle reaches of the catchment<br />
lower Lower reach of the catchment<br />
Statistically very signifi cant improvement P
82<br />
FRESH WATER<br />
Mid reaches of the Waingongoro River below Eltham.<br />
How invertebrate communities<br />
change down a catchment<br />
The median MCI scores from reference, sites have been mapped to<br />
illustrate the distribution of MCI scores around the region (Figure 4.3).<br />
The distribution of MCI scores refl ect variations in water quality, habitat<br />
and fl ow conditions throughout the region, and illustrate a gradual<br />
decrease in scores from Egmont National Park downstream to the coast.<br />
For example, MCI scores in the Waingongoro River range from very good<br />
in the upper reaches, through good near Eltham, to fair over the length<br />
below Eltham to the sea (Table 4.2).<br />
To a certain extent this decrease is a natural and inevitable result of the<br />
changing physical habitat downstream. It is also due to the cumulative<br />
Figure 4.3 Stream health, as measured by MCI.<br />
TARANAKI – WHERE WE STAND<br />
Rob Tucker<br />
Figure 4.4: Relationship between MCI score and altitude on the <strong>Taranaki</strong> ring plain.<br />
effects of land uses on water quality and habitat such as nutrient runoff,<br />
lack of riparian vegetation, and increased sedimentation as a result<br />
of erosion of the stream margins.<br />
There is a strong link between altitude and MCI in <strong>Taranaki</strong> ring plain<br />
streams and rivers. MCI scores increase with altitude by approximately<br />
9 units per 100 m in altitude (Figure 4.4). This means that typically, a<br />
<strong>Taranaki</strong> ring plain stream could be expected to have an MCI value of<br />
approximately 135 units near the National Park boundary and 85 units<br />
near the coast.<br />
It is important to realise that MCI values lower down a catchment<br />
cannot match those higher in the catchment, even under ideal water<br />
quality conditions, because of habitat changes. Freshwater invertebrate<br />
communities are strongly infl uenced by the physical habitat. What is of<br />
interest is any site where the MCI deviates from what would be expected<br />
at that site based on the relationship between MCI and altitude.<br />
In the 1995-2007 period the majority of SEM sites have shown MCI<br />
scores that would be expected based on values for sites in similar rivers<br />
and streams at equivalent altitudes.<br />
However, there have been some exceptions. Figure 4.5 shows the median<br />
MCI scores for each of the 51 monitoring sites in relation to the expected<br />
MCI values. Some sites are more than 10 units lower than the expected<br />
score for that altitude. These include sites that have been subjected<br />
to large scale headwater erosion events (e.g. the Stony (Hangatahua)<br />
and the Waiaua Rivers), sites affected by point source discharges (e.g.<br />
the mid-reach of the P _ atea River which is impacted by the Stratford<br />
wastewater discharge), and sites with poor riparian cover (such as the<br />
Kapoaiaia Stream). Some sites have better than expected MCI scores<br />
(e.g. the Huatoki and Katikara streams). This is thought to be due to<br />
higher than average levels of riparian vegetation in these catchments.<br />
A relationship also exists between altitude and MCI scores for hill<br />
country streams (Figure 4.6). In the upper reaches of these streams<br />
and rivers MCI scores of about 125 MCI units (i.e. very good ecological<br />
health) can be expected, provided that the site has a stony substrate and<br />
reasonable riparian vegetation. Ecological health declines to fair (with<br />
MCI scores of 80) at the coast. This is due to fi ner substrates, wider<br />
channels and lack of riparian cover.
Figure 4.5: Deviations from typical median scores expected from relationship<br />
between MCI and altitude.<br />
How invertebrate communities<br />
have changed over time<br />
Data on invertebrate communities from 51 sites has now been gathered<br />
for 12 years and has been analysed to see if MCI scores have changed<br />
signifi cantly over that time 11,12 . Trends that are statistically signifi cant are<br />
set out in Table 4.2 above.<br />
Table 4.2 illustrates is that of the 51 state of the environment monitoring<br />
sites, no site has signifi cantly deteriorated and 17 sites (one third) have<br />
shown a statistically and/or ecologically signifi cant improvement, with<br />
seven showing a highly signifi cant improvement.<br />
This general improvement in river health is occurring principally at<br />
sites in the middle and lower reaches of catchments, where there has<br />
been an approximately 20% increase in sites graded good or better<br />
Riparian fencing and planting, Kaupokonui Stream.<br />
<strong>Taranaki</strong> <strong>Regional</strong> <strong>Council</strong><br />
Figure 4.6 MCI Scores in relation to altitude at control sites in large hill country<br />
streams and rivers.<br />
(see Table 4.2). These reaches are those that are most intensively used<br />
and are under the greatest pressures. There have been sites that have<br />
improved to such an extent that they have moved up one or even two<br />
scale grades.<br />
For example, the ecological health of the mid reaches of the Kaupokonui<br />
Stream has increased from poor to good over the 12 years from 1996<br />
to 2007 (Figure 4.7). This is attributed to improved management of the<br />
wastewater disposal from the Fonterra factory at K _ apuni, improved<br />
compliance with dairy shed waste discharges and additional riparian<br />
retirement and vegetation growth adjacent of the upstream river<br />
margins.<br />
Reasons for the measurable improvement in stream health at<br />
other sites with statistically signifi cant trends relate primarily to<br />
improvements made to point source discharges. For example,<br />
measurable improvements were made when the tributary draining the<br />
old Inglewood landfi ll was diverted to the wastewater treatment plant,<br />
and the Inglewood wastewater was no longer discharged into the<br />
stream. Waiongana Stream improvements followed better compliance<br />
with consent conditions for a piggery waste disposal and in other<br />
streams there was improved compliance with farm dairy waste disposal<br />
conditions. Other reasons for measurable improvements include natural<br />
events such as less severe fl ood events in an otherwise erosion-prone<br />
Figure 4.7: MCI values of the Kaupokonui Stream, downstream of the Fonterra,<br />
K _ apuni factory discharge from 1996 to 2007.<br />
11 Stark, JD and Fowles, CR, 2006. An Approach to the Evaluation of Temporal Trends in <strong>Taranaki</strong> State of the Environment Macroinvertebrate Data. Cawthron Institute Report No 1135.<br />
12 <strong>Taranaki</strong> <strong>Regional</strong> <strong>Council</strong>, 2007. Fresh Water Biological Monitoring Programme Annual SEM Report 2006-2007.<br />
State of the Environment Report 2009<br />
83
84<br />
FRESH WATER<br />
catchment. For some sites, reasons behind the measurable improvement<br />
are unclear, particularly the site in the Waingongoro River immediately<br />
downstream of the Egmont National Park.<br />
Changes in stream health as refl ected in the biological communities may<br />
occur for a variety of reasons. These reasons could be due to natural<br />
causes such as physical disturbances (fl oods, sedimentation, mountain<br />
erosion), biotic interactions, and/or changes to water quality. These<br />
in turn can be due to changes in land or water management, such as<br />
changes in fl ow regulation, land use (including stocking rates, fertiliser<br />
application) and/or discharge management (rates, concentrations or<br />
diversion to alternative treatment).<br />
Changes in stream health may also refl ect management initiatives such<br />
as increased compliance by point source discharges with consents,<br />
upgrading/improving wastewater treatment standards, and riparian<br />
initiatives (retirement, fencing and planting of stream margins).<br />
Invertebrate communities may change at a site due to factors occurring<br />
in the catchment some distance upstream from the site where<br />
monitoring has been undertaken, rather than in the immediate vicinity<br />
of that site. This is particularly the case with riparian planting which,<br />
once the plants are suffi ciently grown, can provide shading over some<br />
distance of the main stream/river or tributaries and thereby enhance<br />
ecological conditions for some distance downstream. However,<br />
measurable improvements to river health are unlikely to become<br />
signifi cant until riparian planting is fully implemented, provides effective<br />
shading, and covers considerable proportions of mainstream and/or<br />
tributary catchments. It is anticipated that ongoing monitoring (e.g. over<br />
the next 20 years or more) should be more likely to discern trends due to<br />
riparian planting initiatives.<br />
(C) WHAT ALGAE TELLS US ABOUT THE<br />
ECOLOGICAL HEALTH OF RIVERS AND<br />
STREAMS<br />
The <strong>Taranaki</strong> <strong>Regional</strong> <strong>Council</strong> has been undertaking monitoring of<br />
periphyton, or stream algae and slimes, at 21 sites, in 10 catchments<br />
since 2002 (Figure 4.8). These sites are surveyed during the spring, midsummer<br />
and late summer, under standard protocols that take natural<br />
fl ow variability into account. At each site the types of periphyton growth<br />
and the percentage of streambed covered are recorded and assessed.<br />
Assessing periphyton growth.<br />
13 Biggs,B. 2000. New Zealand Periphyton Guideline: Detecting, monitoring and managing enrichment of streams. Prepared for the Ministry for the Environment.<br />
TARANAKI – WHERE WE STAND<br />
<strong>Taranaki</strong> <strong>Regional</strong> <strong>Council</strong><br />
Figure 4.8: Monitoring sites for periphyton.<br />
In a manner similar to the MCI for macroinvertebrates, a periphyton<br />
index can be calculated based on allocating scores for the various types<br />
of periphyton according to their preferences for different levels of stream<br />
nutrient enrichment. The lower the score, the more that particular<br />
algae prefers a nutrient-enriched environment. For example, long green<br />
fi laments, grow best in nutrient enriched waters, and so are given a<br />
score of 1.<br />
The periphyton index score for a stream can be expected to decrease<br />
downstream, because periphyton will increase as water temperatures<br />
and nutrient inputs increase, and shade and fl ow velocities decrease.<br />
Index scores will also usually decrease at any site from spring to<br />
summer, as water fl ows become more stable, and warmer.<br />
National guidelines have been produced which recommend the<br />
maximum periphyton cover acceptable for aesthetics and recreation<br />
purposes 13 . These guidelines are breached when the visible streambed<br />
is 60% covered by thick mats of periphyton (more than 3 mm thick), or<br />
30% covered by long fi lamentous algae (longer than 2 cm).<br />
Table 4.3 sets out the results from the periphyton monitoring. It<br />
highlights that upper catchment sites with little agriculture upstream,<br />
generally show little periphyton proliferation, and only occasionally<br />
breach the recreational guidelines during summer (Table 4.3). Most<br />
upstream sites maintain a very good median periphyton index score<br />
throughout the year, indicating that although fl ow conditions might be<br />
suitable, the low amount of nutrients limits excessive periphyton growth.<br />
The only upstream site to show a low periphyton index score is the<br />
Kapoaiaia Stream. This could be due to the wide shallow nature of the<br />
stream that fl ows through intensive farmland, even though it is in the<br />
upper catchment.
Table 4.3: Frequency of times samples met the periphyton recreation guidelines and the median periphyton index scores between 2002-2007.<br />
Place in<br />
catchment<br />
River/Stream Location<br />
The monitoring shows that mid-catchment sites, which are in intensively<br />
farmed areas, generally breach the recreational guidelines for long<br />
fi lamentous algae, usually during summer.<br />
Lower catchment sites typically have warmer water temperatures, lower<br />
water velocities, and less shading. Consequently, all lower catchment<br />
sites, with the exception of the Stony (Hangatahua) River, breached<br />
the recreational guidelines at least once during the period monitored,<br />
generally with fi lamentous growths rather than with thick mats. The<br />
Stony (Hangatahua) River has low nutrient inputs (discharges to surface<br />
water are prohibited), few tributaries that drain farmland and signifi cant<br />
erosion in the headwaters which scours periphyton off the rocks.<br />
Most of the lower catchment sites monitored have higher nutrient<br />
levels, so periphyton growth is limited primarily by fl ow regime and<br />
water temperature. As there are fewer fl oods in mid-to late summer,<br />
periphyton is not scoured off streambeds as frequently, and this<br />
combined with the warmer water temperatures can lead to a build up<br />
of periphyton to nuisance levels. The growth of nuisance periphyton in<br />
lower catchments is expected to reduce as riparian margins are fenced<br />
and planted, although improvement will take some years to become<br />
apparent and will be more signifi cant once the plants have established<br />
and grown, shading the streambed.<br />
% of samples that<br />
met the guideline for<br />
‘thick mats’ (n=10-11)<br />
% of samples that met<br />
the guideline for ‘Long<br />
fi lamentous algae’<br />
4.1.2 WHAT IS THE CURRENT<br />
PHYSICAL AND CHEMICAL STATE<br />
OF TARANAKI’S WATER QUALITY?<br />
(A) INDICATORS AND GUIDELINES<br />
Median<br />
periphyton index.<br />
upper P _ atea River Barclay Road 100 100 9.5<br />
Punehu Stream Wiremu Road 100 90 9.2<br />
Maketawa Stream Denby Rd 100 100 8.6<br />
Waingongoro River Opunake Road 100 100 8.1<br />
Kapoaiaia Stream Wiremu Road 100 36 3.5<br />
middle<br />
Lower<br />
Stony (Hangatahua) River Mangatete Road 100 100 9.5<br />
Manganui River<br />
P<br />
SH3 100 100 9.4<br />
_ atea River Skinner Road 100 36 5.2<br />
Waiwhakaiho River SH3 (Egmont Village) 100 40 6.0<br />
Waingongoro River Stuart Road 90 90 8.0<br />
Kapoaiaia Stream Whataroa Road 82 73 6.5<br />
Waiongana Stream SH3a 100 70 5.9<br />
Hangatahua (Stony) River SH45 100 100 9.1<br />
Maketawa Stream Tarata Road 100 70 5.6<br />
Manganui River Bristol Road 100 73 5.9<br />
Waiwhakaiho River<br />
Waingongoro River<br />
Constance St, NP<br />
_<br />
Ohawe Beach<br />
100<br />
82<br />
70<br />
100<br />
6.7<br />
7.0<br />
Punehu Stream SH45 100 55 6.3<br />
Kapoaiaia Stream Cape Egmont 90 36 4.8<br />
Waiongana Stream Devon Road 100 90 7.2<br />
Mangaehu River Raupuha Road 90 60 5.0<br />
Water quality can be assessed by various physical and chemical<br />
measurements. These indicators are used nationally and internationally<br />
to highlight and quantify aspects of the key pressures on the health of<br />
the water and suitability for various water uses, and trends in their state.<br />
A number of indicators vary naturally (e.g. over the course of a day or<br />
season) but standardised sampling protocols eliminate this variability to<br />
allow robust assessment of underlying trends in water quality that may<br />
be very subtle but statistically signifi cant. Beside statistical signifi cance,<br />
the ecological importance of any trend is also evaluated.<br />
State of the environment monitoring does not necessarily identify the<br />
very best or very worst conditions that may occur at any one site, or<br />
the full range of conditions that may occur. For example, samples are<br />
generally collected between early morning and mid-afternoon, which<br />
from spring to autumn coincides with the period just after farm dairies<br />
have been washed down and therefore effl uent ponds have discharged<br />
across the region – raising biochemical oxygen demand (BOD), nutrients,<br />
State of the Environment Report 2009<br />
85
86<br />
FRESH WATER<br />
and bacteria, and reducing clarity, from the background levels present in<br />
the region’s streams during the rest of the day.<br />
BOD is an indicator of the level of residual organic pollution from<br />
sources such as farm effl uent treatment ponds. High BOD may cause<br />
slime growth in streams. The plant nutrients phosphorus and nitrogen<br />
are useful indicators of ecological health as increased nutrients may<br />
lead to increased algae growth given the right conditions. High dissolved<br />
oxygen and clarity are important for the health of aquatic organisms<br />
(and, with respect to clarity, for aesthetic and recreational reasons).<br />
Temperature is another critical aspect for healthy stream life and to track<br />
the infl uence of riparian management and climate change. Finally, three<br />
Table 4.4: Guidelines for commonly measured water quality variables.<br />
14 Australian and New Zealand Environment and Conservation <strong>Council</strong>, 2000. Australian and New Zealand Guidelines for Fresh and Marine Water Quality. Prepared by the Australian and New<br />
Zealand Environment and Conservation <strong>Council</strong> and the Agriculture and Resource Management <strong>Council</strong> of Australia and New Zealand.<br />
15 Ministry for the Environment and Ministry of Health, 2003. Microbiological Water Quality Guidelines for Marine and Freshwater Recreational Areas.<br />
16 Ministry for the Environment, 1992. Water Quality Guidelines No. 1.<br />
17 Ministry for the Environment, 1994. Water Quality Guidelines No. 2 Guidelines for the Management of Water Colour and Clarity.<br />
18 Quinn, J. M.; Hickey, C. W. 1990. Characterisation and classifi cation of benthic invertebrate communities in 88 New Zealand rivers in relation to environmental factors. New Zealand Journal of<br />
Marine and Freshwater Research 24: 387-409.<br />
TARANAKI – WHERE WE STAND<br />
measures of bacterial contamination are used: faecal coliforms, E.coli<br />
and enterococci are used as an indicator of faecal contamination. They<br />
all provide useful information on bacteriological sources and quality. For<br />
example, E.coli levels are used to indicate the relative risk of disease<br />
causing micro-organisms being present such as bacteria, viruses or<br />
protozoa.<br />
For each of these variables guidelines have been developed that relate<br />
to the use and value of that waterway. For example, clarity guidelines<br />
for contact recreation (i.e. how far you should be able to see in the water<br />
for safe swimming) differ from the guidelines recommended for aquatic<br />
ecosystem protection (i.e. how far fi sh need to see through the water or<br />
Water quality variable Standard or guideline<br />
Purpose of standard or guideline<br />
(variable may be important for<br />
other reasons also)<br />
Reference<br />
Dissolved reactive phosphorus
Collecting a water sample.<br />
how clear the water needs to be for light penetration for plant growth). In<br />
many cases consideration of aquatic ecosystem protection sets the most<br />
rigorous guidelines. The guidelines are designed to safeguard aquatic<br />
ecosystem values, however, these values are actually best measured<br />
through direct sampling of biological indicators such as the state of the<br />
invertebrates and algae, as described in the preceding section.<br />
The guidelines referenced by the <strong>Council</strong> are set out in Table 4.4. They<br />
are consistent with those used nationally 19 and internationally. Some<br />
guidelines stipulate the median is an appropriate statistic to use,<br />
whereas other guidelines require compliance for every single sample.<br />
The guidelines are not standards set in stone, and do have a number of<br />
limitations. For example, guidelines for phosphorus must be considered<br />
with caution when considering <strong>Taranaki</strong> streams, which are often subject<br />
to the natural leaching of this element from volcanic rock, particularly in<br />
the Egmont National Park, so that even pristine streams in the region do<br />
not meet this guideline.<br />
The guidelines are generally ‘precautionary’. For example, a high<br />
concentration of indicator bacteria means that it is more likely that<br />
disease-causing organisms are present. It does not mean that anyone/<br />
everyone swimming in the water at the time will actually get sick as<br />
individual exposure and susceptibility also play their parts. Likewise, the<br />
nutrient guidelines address the possibility of subtle shifts in ecosystem<br />
composition, rather than inhibitory or toxic effects (which occur at far<br />
higher values).<br />
Furthermore, scientifi c consensus on some guidelines is lacking. For<br />
example, there are two guidelines available for dissolved oxygen: the<br />
RMA sets a lower limit of 80% saturation, and the Australia and New<br />
Zealand Environment and Conservation <strong>Council</strong> (ANZECC) guidelines<br />
specify 99-103% saturation or 98-105% saturation for upland and<br />
lowland rivers respectively. The RMA schedule has been used in Table<br />
4.4, because even in a completely un-impacted waterway the ANZECC<br />
guidelines would often be breached through natural variability in<br />
dissolved oxygen levels.<br />
Likewise, the guideline for bacteria levels (faecal coliforms) in stock<br />
drinking water proposed by ANZECC in 2000 (a median of 100 per 100<br />
mls) differs markedly from the guideline proposed in 1992 (a limit of<br />
1000 per 100 mls), and there appears little scientifi c basis for either<br />
guideline 20 . The link between any particular concentration of bacteria<br />
<strong>Taranaki</strong> <strong>Regional</strong> <strong>Council</strong><br />
Stony River.<br />
and stock health is not well-established. The guideline from the 1992<br />
ANZECC guidelines has been adopted in Table 4.4, as the derivation of<br />
the standard is more appropriate to surface water.<br />
(B) HOW DOES TARANAKI’S WATER QUALITY<br />
COMPARE WITH THE GUIDELINES ?<br />
Water quality has been monitored monthly by the <strong>Taranaki</strong> <strong>Regional</strong><br />
<strong>Council</strong> since 1995 at nine river sites with an additional site added in 1997<br />
(the Waingongoro River at SH45) and a further site in 2003 (Maketawa<br />
Stream) bringing the total number of sites routinely monitored to 11. Three<br />
sites (one also included in the <strong>Council</strong>’s sites) have been monitored by<br />
National Institute of Water and Atmosphere Research (NIWA) since 1989,<br />
as part of a national water quality monitoring programme 21 . The locations<br />
of these sites in relation to their catchments are shown in Figure 4.9.<br />
Figure 4.9: Locations of state of the environment monitoring sites for<br />
physicochemical variables.<br />
19 Ministry for the Environment, 2007. Environment New Zealand 2007.<br />
20 Sinton, L and Weaver, L. 2008. Environment Southland Proposed <strong>Regional</strong> Water Plan – Comments on the bacteriological standards. Client report prepared by Institute of Environmental Science and<br />
Research Ltd.<br />
21 The National River Water Quality Network (NRWQN).<br />
Rob Tucker<br />
State of the Environment Report 2009<br />
87
88<br />
FRESH WATER<br />
Viewing a black disc to assess water clarity.<br />
Table 4.5 : Evaluation of physicochemical data against water quality guidelines.<br />
Catchment<br />
Level<br />
Upper<br />
Upper/<br />
Middle<br />
Middle<br />
Middle<br />
Middle<br />
Middle<br />
Lower<br />
Lower<br />
Lower<br />
Lower<br />
Lower hill<br />
country<br />
Location<br />
P _ atea R.<br />
Barcley Rd<br />
Punehu R.<br />
Wiremu Rd<br />
Stony R.<br />
Mangatete rd<br />
P _ atea R.<br />
Skinner Rd.<br />
Biochemical<br />
Oxygen Demand<br />
Dissolved Reactive<br />
Phosphorus<br />
TARANAKI – WHERE WE STAND<br />
Aquatic ecosystem protection Irrigation<br />
Total Phosphorus<br />
Nitrate<br />
Ammonia-N<br />
Total Nitrogen<br />
Dissolved Oxygen<br />
Black disc<br />
Total Phosphorus<br />
Total Nitrogen<br />
Stock<br />
drinking<br />
Faecal coliforms<br />
Nitrate<br />
Contact<br />
recreation<br />
aesthetics<br />
☺ � ☺ ☺ ☺ ☺ ☺ ☺ ☺ ☺ ☺ ☺ ☺ ☺<br />
☺ � � ☺ ☺ ☺ ☺ ☺ ☺ ☺ ☺ ☺ ☺ ☺<br />
☺ � ☺ ☺ ☺ ☺ ☺ ☺ ☺ ☺ ☺ ☺ ☺ ☺<br />
☺ � � � � � ☺ ☺ ☺ ☺ ☺ ☺ ☺ ☺<br />
Waiwhakaiho<br />
SH3 ☺ � � ☺ ☺ ☺ ☺ ☺ ☺ ☺ ☺ ☺ ☺ ☺<br />
Waingongoro<br />
Eltham Rd<br />
☺ � � � ☺ � ☺ ☺ ☺ ☺ ☺ ☺ ☺ ☺<br />
Maketawa St.<br />
Tarata Rd ☺ � ☺ ☺ ☺ ☺ ☺ ☺ ☺ ☺ ☺ ☺ ☺ ☺<br />
Mangaoraka<br />
Corbett Rd<br />
☺ ☺ ☺ � ☺ � ☺ ☺ ☺ ☺ ☺ ☺ ☺ ☺<br />
Waingongoro<br />
SH45 ☺ � � � � � ☺ ☺ ☺ ☺ ☺ ☺ � ☺<br />
Punehu R.<br />
SH45 ☺ � � � � � ☺ ☺ ☺ ☺ ☺ ☺ � ☺<br />
Mangaehu R.<br />
Raupuha Rd<br />
Key:<br />
☺ Maximum (or minimum, depending on variable) meets the guidelines – Very good<br />
☺ Median value meets the guidelines - Good<br />
� Median value does not meet guidelines – Poor<br />
Rob Tucker<br />
Waingongoro River.<br />
☺ ☺ ☺ ☺ ☺ ☺ ☺ ☺ ☺ ☺ ☺ ☺ � ☺<br />
Black disc<br />
Rob Tucker<br />
Biochemical<br />
Oxygen Demand
Water quality testing in the <strong>Council</strong>’s IANZ-registered chemistry laboratory.<br />
Twelve years of state of the environment monitoring data undertaken<br />
by the <strong>Council</strong> have been summarised in Table 4.5 and compare the<br />
medians (the mid-point value of all values) with the guidelines (where<br />
the use of medians is appropriate) for aquatic ecosystem protection,<br />
irrigation, stock drinking water and contact recreation.<br />
Sites within the table have been grouped according to their location<br />
within their catchment, i.e. upper, middle and lower reaches of rivers.<br />
The Stony (Hangatahua) River site has been placed directly below the<br />
upper catchment sites as its water quality should be less infl uenced<br />
by human activity due to strict controls placed on all discharges within<br />
this catchment. In this way, patterns can be more easily seen in their<br />
catchment-location context.<br />
In addition to evaluating <strong>Taranaki</strong>’s water quality data against the<br />
guidelines, it is possible to examine patterns, such as changes in a<br />
variable down a catchment or between catchments with differing levels<br />
of intensive land use and to investigate deviations from values expected.<br />
In the absence of a stream or river that is in a state un-impacted (by<br />
human activities) to function as a benchmark, the guidelines (albeit with<br />
limitations) are an appropriate estimate of the standards we should be<br />
aiming to attain.<br />
Aquatic Ecosystem protection<br />
In relation to aquatic ecosystem protection, Table 4.5 shows that there<br />
are some guidelines that all sites meet comfortably (such as dissolved<br />
oxygen, biochemical oxygen demand, and clarity), some guidelines where<br />
the majority of sites exceed the guidelines (such as dissolved and total<br />
phosphorus), other guidelines that most sites meet (such as ammonia)<br />
and others where it is about 50:50 (nitrate and total nitrogen).<br />
Biochemical oxygen demand<br />
Biochemical oxygen demand is a measure of the amount of organic<br />
matter (dissolved and particulate) in the water. This material is a source<br />
of carbon for slimes and fi lamentous growths, commonly referred to as<br />
‘sewage fungus’, that as a nuisance growth adversely degrades habitat<br />
quality for instream ecosystems. BOD is sourced primarily from dairy<br />
farm effl uent treatment ponds, as well as municipal sewage ponds and<br />
various other discharges.<br />
All samples at all sites meet the guideline.<br />
Rob Tucker<br />
Checking for algal growth on a stream bed.<br />
Plant nutrients<br />
Overall, very few sites met the guidelines for dissolved reactive<br />
phosphorus or total phosphorus. In <strong>Taranaki</strong> streams, phosphorus is<br />
derived from the leaching of volcanic rock but can also be indicative of<br />
fertiliser and sediment run-off or leaching. The only ring plain site that<br />
met the guideline for phosphorus was the Mangaoraka Stream which<br />
does not have its headwaters in the national park, and is thus less<br />
susceptible to erosion of volcanic materials. Likewise, the Mangaehu<br />
River, being sourced from the eastern hill country, is not infl uenced by<br />
the leaching of phosphorus from volcanic soils. For ring plain streams, it<br />
is diffi cult to distinguish between the levels of phosphorus derived from<br />
natural erosion and that contributed by intensifi cation of agricultural<br />
activities. Even the natural background levels exceed the guidelines.<br />
For upper catchment sites and the Stony (Hangatahua) River, even<br />
the site with the highest recorded levels of nitrogen met the ANZECC<br />
guidelines. In contrast, lower catchment sites exhibited elevated levels<br />
of nitrate/total nitrogen. This is probably due to increased nutrient<br />
run-off, possible stock access, and discharges from effl uent treatment<br />
ponds.<br />
Ammonia guidelines are only exceeded by the median values of samples<br />
at three sites. This is very encouraging considering intensive livestock<br />
agricultural land use involving high stocking rates and levels of fertiliser<br />
use, particularly the increases in urea.<br />
Algal growth requires both nitrogen and phosphorus, and its growth will<br />
be limited by the nutrient that is in shortest supply. In <strong>Taranaki</strong>’s upper<br />
catchments, the nutrient most likely to be limiting for algal growth is<br />
nitrogen, given the naturally high levels of phosphorus. Therefore more<br />
nitrogen is likely to lead to more algal growth, although other factors,<br />
such as light, temperature and frequency of fl oods will play a crucial<br />
role. Lower in the catchments, nitrogen becomes relatively plentiful<br />
while phosphorus becomes the limiting nutrient. Research continues to<br />
examine how the changes in nutrient levels actually affect the aquatic<br />
ecosystems in <strong>Taranaki</strong> streams, irrespective of the guidelines, and to<br />
determine what aspects are most appropriate to target management<br />
(e.g. managing shade through increased riparian planting may be a<br />
more effi cient means of managing algal growth than trying to manage<br />
naturally derived phosphorus).<br />
<strong>Taranaki</strong> <strong>Regional</strong> <strong>Council</strong><br />
State of the Environment Report 2009<br />
89
90<br />
FRESH WATER<br />
Collecting a sample to measure dissolved oxygen.<br />
Dissolved oxygen and clarity<br />
Well-oxygenated water supports a greater diversity of aquatic life.<br />
Levels of dissolved oxygen can be an indicator for organic pollution, and<br />
may refl ect the level of algae growth. Dissolved oxygen levels and clarity<br />
(as measured by the length one can see a black disc) are consistently<br />
high, and adequate to support aquatic ecosystems at all catchment<br />
levels.<br />
Temperature<br />
If water temperatures exceed their usual ranges for too long, plants and<br />
animals in waterways can become stressed. Higher temperatures can<br />
also encourage excessive algal growth.<br />
Temperature medians are not included in Table 4.5 because the<br />
monthly spot sampling is not appropriate to assess compliance with<br />
this guideline, although still valuable for trend analysis. However, fi ve<br />
sites have continuous temperature measuring devices and from this the<br />
number of days when temperature has reached ecologically signifi cant<br />
levels such as 25ºC/20ºC has been determined (Table 4.6). This table<br />
shows that the number of days that sites have exceeded 25ºC is<br />
TARANAKI – WHERE WE STAND<br />
relatively small, even during the long, hot summer of 2007-08. The two<br />
sites that more frequently reach 20ºC, are located in the lower, open<br />
reaches of the Mangaoraka Stream and Waingongoro River.<br />
While Table 4.6 shows how frequently sites reached these<br />
temperatures, it does not show for how long, or at what time of the day.<br />
Generally sites that did reach 25ºC, stayed at that temperature for a few<br />
hours. Sites that reached 20ºC could stay at that temperature for several<br />
days. These extreme temperatures can be attributed to factors such as<br />
little riparian shading, but also to the volcanic rock boulders in <strong>Taranaki</strong><br />
ring plain streams that retain heat and release it slowly. Thus the higher<br />
water temperatures generally occur later in the day.<br />
Guidelines for irrigation and<br />
stock consumption<br />
All monitored sites meet the relevant nutrient-related guidelines for<br />
irrigation and stock drinking purposes (see Table 4.4)<br />
Table 4.6 Number of days when temperature has ever reached 20ºC or 25ºC (n/a = no complete data available for these years).<br />
Mid catchment<br />
Lower catchment<br />
P _ atea River at Skinner Rd<br />
Waiwhakaiho River at SH3<br />
Waingongoro River at Eltham Rd<br />
Waingongoro River at SH45<br />
Mangaoraka Stream at Corbett Rd<br />
Rob Tucker<br />
Well oxygenated water supports a diversity of aquatic life.<br />
In terms of stock drinking water, all sites comfortably met the 1992<br />
bacteria guideline for stock drinking water, although not the 2000<br />
guidelines. Given that higher faecal coliform levels in streams generally<br />
2000-01 2001-02 2002-03 2003-04 2004-05 2005-06 2006-07 2007-08<br />
>25ºC n/a n/a n/a 0 0 0 0 0<br />
>20ºC n/a n/a n/a 15 21 19 14 40<br />
>25ºC 0 0 0 0 0 0 0 1<br />
>20ºC 10 3 15 6 18 13 7 44<br />
>25ºC 0 0 0 n/a n/a n/a n/a 0<br />
>20ºC 22 17 36 n/a n/a n/a n/a 40<br />
>25ºC n/a n/a n/a 0 1 1 0 2<br />
>20ºC n/a n/a n/a 43 52 66 57 91<br />
>25ºC n/a n/a n/a 0 8 6 0 0<br />
>20ºC n/a n/a n/a 22 76 72 55 96<br />
Rob Tucker
Kaupokonui River mouth.<br />
occur under conditions of heavy rainfall, when stream water is less<br />
likely to be utilised as stock drinking water, individual results above this<br />
guideline may not necessarily indicate a need for concern.<br />
Guidelines for contact recreation<br />
The <strong>Council</strong>’s state of the environment monitoring programme gathers<br />
some information that is of relevance to contact recreation – levels of<br />
bacteria, clarity and BOD. Cleaner water is more aesthetically pleasing<br />
and safer to swim in. Table 4.5 shows that the majority of sites meet<br />
the bathing water guidelines for clarity (as measured by black disc),<br />
except for the lower Waingongoro River and Punehu Stream, and the<br />
Mangaehu River which have greater levels of fi ne suspended sediments<br />
from catchment erosion and run-off.<br />
All sites comfortably meet the guidelines for BOD.<br />
In order to monitor compliance with the contact recreation standards,<br />
and to monitor trends over time, the <strong>Council</strong> undertakes separate<br />
specifi c water quality monitoring at a number of popular lake, river and<br />
stream sites around <strong>Taranaki</strong> during the summer months (November to<br />
April) according to national protocols 22 . Sites included in this programme<br />
feature the most popular sites in the recent survey of recreational use of<br />
fresh water 23 (Figure 4.10).<br />
Samples collected are classifi ed into three categories according to<br />
the level of bacterial contamination (see Table 4.4). If they fall into<br />
the ‘Acceptable’ category, monitoring continues on a weekly basis,<br />
if they fall into the ‘Alert’ category, then more frequent monitoring<br />
is undertaken and if they trigger the ‘Action’ category, then further<br />
investigation is carried out and the public is advised with warning<br />
signs. For each site, the proportion of samples that results fell within<br />
these categories is illustrated in Figure 4.10. This shows that most<br />
sites are safe for swimming most of the time, although there are some<br />
exceptions. More detailed information on gradings of sites can be found<br />
in the <strong>Council</strong>’s technical reports.<br />
The sites in the Waiwhakaiho and lower Urenui rivers have been<br />
consistently within the guidelines, with very few samples exceeding<br />
<strong>Taranaki</strong> <strong>Regional</strong> <strong>Council</strong><br />
Meeting of the Waters, Waiwhakaiho River.<br />
the Alert or Action criteria per season. The sites in the Kaupokonui,<br />
_<br />
O _ akura, Manganui and (lower) Waingongoro streams or rivers, and<br />
Lake Rotomanu generally showed acceptable water quality. However<br />
these sites exceeded the guidelines more frequently, up to 40% in some<br />
seasons. These are due to a variety of reasons, from high wild fowl<br />
numbers in Lake Rotomanu, stock having access to streams, and/or dairy<br />
treatment pond discharges (see case study).<br />
Similarly, the Waingongoro River at Eltham, Timaru Stream and P _ atea<br />
River often exceeded acceptable levels, with samples in the P _ atea<br />
River in particular recording over 60% of samples above acceptable<br />
levels. Bacteria may enter rivers and streams from a variety of sources,<br />
including direct waste discharges, seepages from septic tanks, stock<br />
access, run-off from agricultural land, dairy farm treatment pond wastes,<br />
and as a result of the presence of wildlife (including birds).<br />
Water quality for contact recreation in the small Waimoku Stream at<br />
_<br />
O _ akura Beach is consistently poor, with results frequently exceeding the<br />
Action level. Intensive investigations of the catchment have attributed<br />
this to birdlife as there are extensive ducks and p _ ukeko populations<br />
present on or adjacent to tributaries upstream of the township. However,<br />
discharges/seepages into groundwater from septic tanks can not be<br />
ruled out as possible contributors of faecal contamination.<br />
Whitewater kayaking.<br />
22 <strong>Taranaki</strong> <strong>Regional</strong> <strong>Council</strong>, 1997-2008. Freshwater Bathing Contact Recreational Water Quality at Selected <strong>Taranaki</strong> Sites. State of the Environment Reports. Technical Reports 97-04, 98-20, 99-18,<br />
00-06. 01-07, 02-01, 03-05, 04-19, 05-09, 06-32, 07-11, 08-02.<br />
23 <strong>Taranaki</strong> <strong>Regional</strong> <strong>Council</strong>, 2008. Recreational Use of Coast, Rivers and Lakes in <strong>Taranaki</strong>. 2007-08.<br />
Rob Tucker<br />
<strong>Taranaki</strong> <strong>Regional</strong> <strong>Council</strong><br />
State of the Environment Report 2009<br />
91
92<br />
FRESH WATER<br />
a. Manganui River<br />
b. _ O _ akura River below SH45<br />
c. Kaupokonui River at beach<br />
d. Waiwhakaiho River at Merrilands domain<br />
Figure 4.10: Map of rivers monitored for bathing water quality and monitoring results.<br />
TARANAKI – WHERE WE STAND<br />
e. Waimoku Stream at _ O _ akura beach<br />
f. P _ atea River at Stratford
g. Waingongoro River at Eltham<br />
h. Waingongoro River at _ Ohawe<br />
i. Lake Rotomanu<br />
j. Timaru Stream at Lower Weld Rd<br />
Urenui River.<br />
Rural and urban run-off during signifi cant rainfall events substantially<br />
increases bacterial levels in rivers and streams for up to several days after<br />
these events. Samples for monitoring contact recreational water quality<br />
are not taken within three days of heavy rain, because there is generally<br />
less likelihood of people swimming in rivers and streams immediately<br />
following signifi cant rainfall. These results are therefore more conservative<br />
than if sampling was carried out on a random basis.<br />
The frequency that results comply with the contact recreation guidelines<br />
varies not only between sites, but also between years. The proportion<br />
of all the samples taken each year that comply with contact recreational<br />
guidelines is illustrated in Figure 4.11. The proportion falling into the<br />
combined Alert or Action categories was generally between 10 and 30%,<br />
and this proportion did not show a trend over time, but rather varied from<br />
year to year.<br />
During the very dry summer of 2007-08 for example, a high proportion of<br />
samples in the Action category (37) occurred in the Waimoku Stream. At<br />
least 60% of sites surveyed seasonally have entered the Alert level at<br />
some instance every summer since 2003, but in most cases such events<br />
are isolated rather than ongoing.<br />
While the guidelines for contact recreation include requirements framed in<br />
terms of individual samples rather than seasonal medians, nevertheless,<br />
medians can be a useful indication of the level of bacterial contamination<br />
found most often at each site and can be analysed for trends over time.<br />
The good news though is that there were very few signifi cant trends<br />
over time in the seasonal medians data, with the only exception being<br />
the _ O _ akura River, which is showing a statistically signifi cant increase in<br />
bacterial numbers. However, median results and most individual sample<br />
levels remain well within the contact recreation guidelines.<br />
Figure 4.11: Proportion of samples meeting guidelines each year.<br />
<strong>Taranaki</strong> <strong>Regional</strong> <strong>Council</strong><br />
State of the Environment Report 2009<br />
93
94<br />
FRESH WATER<br />
Lake Rotomanu.<br />
PUT DUCKS ON DIET<br />
FOR LAKES’ SAKE<br />
Duck-feeders please desist – you are contributing to a water quality<br />
problem.<br />
That was one of the messages to go out during the drought summer<br />
of 2007-08, when a number of issues were highlighted in the <strong>Taranaki</strong><br />
<strong>Regional</strong> <strong>Council</strong>’s annual recreational freshwater monitoring<br />
programme.<br />
E. coli bacteria counts in water samples from nine of the 14 monitored<br />
sites at times reached or exceeded the Action level established under<br />
national guidelines, nine also exceeded the Alert level.<br />
At Lake Rotomanu in New Plymouth, high E. coli counts were related<br />
to the droppings from large numbers of wildfowl gathered there to<br />
escape arid conditions elsewhere and to take advantage of free feeds<br />
from picnickers.<br />
Notifi ed of the <strong>Taranaki</strong> <strong>Regional</strong> <strong>Council</strong>’s test results, health<br />
authorities stepped in with signage advising the public to stay out of<br />
the water – and a plea from the New Plymouth District <strong>Council</strong> for<br />
picnickers not to aggravate the problem by feeding the ducks.<br />
“If we can keep the number of ducks low, there will be less chance of<br />
the lake being closed off to the public for health reasons in future,”<br />
New Plymouth District <strong>Council</strong> Manager Parks Mark Bruhn told local<br />
media.<br />
Ducks were also an issue at Lake Opunake. But elsewhere, bigger<br />
beasts were the culprits, with problems in at least one stream<br />
(C) HOW IS TARANAKI’S<br />
WATER QUALITY CHANGING?<br />
Trends in physical and chemical water quality<br />
With 12 years of physical and chemical data now analysed for 10 state<br />
of the environment monitoring sites, detection of trends in water quality<br />
through statistical analysis is possible.<br />
This section examines trends in the physical and chemical water quality<br />
variables listed earlier. These are variables infl uenced by changing land<br />
use practices, and those in which there is most interest nationally.<br />
The methods of statistical analysis used by the <strong>Council</strong> follow those<br />
24 Scarsbrook and McBride, 2007. Best Practice Guidelines for the Statistical Analysis of Freshwater Quality Data. Version 1. Prepared by NIWA for Ministry for the Environment.<br />
TARANAKI – WHERE WE STAND<br />
Rob Tucker<br />
traced back to a landowner upstream allowing thirsty stock into<br />
the waterway and allowing his cows to use the stream as a race to<br />
access an adjacent property. This resulted in follow-up advice, and<br />
an abatement notice, to the individual by <strong>Taranaki</strong> <strong>Regional</strong> <strong>Council</strong><br />
inspectorate staff.<br />
Generally, monitored sites fl uctuate in and out of compliance with the<br />
guidelines for a variety of reasons, some of which require immediate<br />
investigation when alert levels are reached.<br />
Most of the monitored sites are near the mouths of rivers where<br />
conditions are generally attractive for recreational users. But these<br />
sites are also where the cumulative effects of upstream farmland<br />
run-off and discharges, stock access and urban stormwater disposal<br />
can have an impact on water quality, varying according to weather<br />
conditions, river fl ows and farming activities.<br />
Results of the summer bathing water quality monitoring programme<br />
are immediately reported on the <strong>Taranaki</strong> <strong>Regional</strong> <strong>Council</strong>’s website,<br />
www.trc.govt.nz, and there is close liaison with district councils and<br />
the <strong>Taranaki</strong> District Health Board.<br />
www.trc.govt.nz<br />
increasingly being adopted for such analysis in New Zealand 24 . The<br />
statistical technique involves adjusting for variations in fl ow and<br />
seasonality, calculating trends, and then determining the statistical<br />
signifi cance of the trend i.e. how sure can we be that a trend is ‘real’<br />
and not just natural fl uctuation? This is calculated via the ‘p value’,<br />
i.e. if p
quality monitoring programme (see Figure 4.9). Trends have been<br />
analysed for the whole 18-year dataset for these sites and compared<br />
with trends in the data for these three sites over just the past 12 years<br />
(Table 4.8). These comparisons enable us to detect changes in the<br />
trends over the longer term. For example, if a variable has been found to<br />
improve over the whole 18-year time period, but no signifi cant trend over<br />
the past 12 years is demonstrated, then it could be concluded that the<br />
rate of change may have plateaued or been arrested.<br />
Alongside the question of whether there is a change occurring in<br />
our waterways, is the question of whether any such change has<br />
environmental implications, such as affecting the suitability of water<br />
for various purposes, uses and values. Therefore the discussion set out<br />
below also includes comments on how important for our environment<br />
any trend might be.<br />
Table 4.7: Trends in surface water quality at state of the environment monitoring sites in <strong>Taranaki</strong>- 1995-2007.<br />
Catchment<br />
Level<br />
Upper<br />
Upper/<br />
Middle<br />
Middle<br />
Middle<br />
Middle<br />
Middle<br />
Lower<br />
Lower<br />
Lower<br />
Lower<br />
Location<br />
Dissolved Reactive<br />
Phosphorus<br />
Total Phosphorus<br />
Nitrate<br />
Ammonia-N<br />
Examining Tables 4.7 (trends over 10-12 years) and Table 4.8 (trends<br />
over 12 years compared with trends over 18 years), what is noticeable<br />
is that traditional indicators of pollution, organic matter (BOD),<br />
suspended solids, clarity, conductivity (dissolved matter), and bacterial<br />
contamination, generally show no apparent trends at most sites over the<br />
past 12 or 18 years. Fundamentally, these aspects of water quality could<br />
be considered stable. This is during a time when the number of consents<br />
involving water abstractions and discharges has increased considerably,<br />
urban centres are spreading, and livestock farming has intensifi ed.<br />
However, more nutrients are being released into the region’s streams<br />
overall, particularly in the middle and lower catchments. At sites with<br />
18 years of data, all of these trends in nutrients have either plateaued<br />
or have become less statistically signifi cant, that is, the rate of<br />
deterioration may have slowed down more recently at these sites.<br />
Total Nitrogen<br />
Water Quality Variable<br />
Faecal coliforms<br />
Enterococci<br />
Conductivity<br />
Black Disc<br />
Suspended Solids<br />
Temperature<br />
Biochemical<br />
Oxygen Demand<br />
P _ atea River<br />
Barclay Rd � � � � ☺ � � � � � � � �<br />
Punehu Stream<br />
Wiremu Rd � � � � ☺ � � � � � � ☺ �<br />
Stony River<br />
Mangatete Road<br />
� � � � ☺ � � � � � � � �<br />
P _ atea River<br />
Skinner Rd � � � � � � � � � � � � �<br />
Waiwhakaiho<br />
SH3 � � � � � � � ☺ � � ☺ � �<br />
Waingongoro<br />
Eltham Rd* � � � � � � � � � � ☺ � �<br />
Mangaoraka<br />
Stream Corbett Rd<br />
Total no. sites: Improvement ☺<br />
No change �<br />
Deterioration �<br />
� � � � � � � � � � � � �<br />
Waingongoro<br />
SH45 � � � � � � � � � � ☺ � �<br />
Punehu Stream<br />
SH45 � � � � � ☺ � � � � � � �<br />
Mangaehu River<br />
Raupuha Rd � � � ☺ ☺ � � ☺ � � � � �<br />
0<br />
2<br />
8<br />
0<br />
8<br />
2<br />
0<br />
7<br />
3<br />
Key:<br />
* Data for this site only for the past 9 years: 1998 – 2007<br />
☺ statistically very signifi cant improvement P
96<br />
FRESH WATER<br />
Table 4.8: Trends over the past 18 years and over the past 12 years.<br />
(a) Waingongoro River at State Highway 45<br />
18 years<br />
Ammonia �<br />
DRP �<br />
Total<br />
Phosphorous<br />
�<br />
Nitrate �<br />
Total<br />
Nitrogen<br />
�<br />
Clarity �<br />
(c) Waitara River at Bertrand Road Bridge<br />
18 years<br />
Ammonia ☺<br />
DRP �<br />
Total<br />
Phosphorous<br />
�<br />
Nitrate �<br />
Total<br />
Nitrogen<br />
�<br />
Clarity �<br />
TARANAKI – WHERE WE STAND<br />
12 years<br />
�<br />
�<br />
�<br />
�<br />
�<br />
�<br />
12 years<br />
�<br />
�<br />
�<br />
�<br />
�<br />
�<br />
☺ statistically signifi cant improvement P
While increased nutrient levels are not being refl ected in trends in the<br />
aquatic health of streams of the region (see previous section, where<br />
stream health is discussed), increasing nutrients into the middle and<br />
lower reaches of the region’s catchments where stream ecological<br />
health is already poorer than in the upper catchments, and less than<br />
what might be expected in ideal conditions, is of concern. Furthermore,<br />
trends in nutrient losses from land to fresh water is a real issue for<br />
<strong>Taranaki</strong>, environmentally and economically.<br />
Changes in the amount of organic wastes<br />
Biochemical oxygen demand levels, an indicator of the amount of<br />
organic wastes entering our streams, show no apparent trends over the<br />
past 12 years, despite increasing intensifi cation of dairy farming during<br />
this period. Some extrapolation from earlier data suggests instream<br />
BOD levels may have actually fallen 25 . This may refl ect the adoption<br />
of treatment pond designs providing a higher degree of treatment for<br />
dairy farm effl uent, better management of these systems, an increasing<br />
proportion of such ponds discharging to land instead of to water, and<br />
improvements in the quality of other discharges.<br />
Changes in phosphorus levels<br />
The overall story for phosphorus, particularly dissolved reactive<br />
phosphorus, is however not such good news. In addition to many<br />
sites not meeting phosphorus guidelines, most sites in the <strong>Council</strong>’s<br />
monitoring programme (80%) show a statistically signifi cant<br />
deterioration in dissolved reactive phosphorus has occurred over the<br />
past 12 years, and a couple of sites also show deterioration in total<br />
phosphorus (Table 4.7).<br />
Deterioration found at sites in upper catchments most probably refl ects<br />
natural causes such as an increase of phosphorus leaching from<br />
volcanic material exposed by subsidence and erosion events within the<br />
headwaters in the Egmont National Park. However, deteriorating trends<br />
in the middle and lower catchments will have been infl uenced by farming<br />
activities within the catchments, as well as these natural events.<br />
At the mid-catchment site in the Waingongoro River (upstream of the<br />
Eltham wastewater treatment system and the Riverlands meatworks<br />
discharges), dissolved reactive phosphorus deteriorated over the past<br />
nine years (Table 4.7). Interestingly, while dissolved reactive phosphorus<br />
has shown deterioration when viewed over the past 18 years at a site<br />
further down the catchment (State Highway 45) (Table 4.8), over the<br />
past 12 years levels have shown no apparent trend at this site. This<br />
suggests that the deteriorating trend may have been arrested in recent<br />
years. This may be attributed, at least in part, to reduced waste loadings<br />
from the Riverlands meatworks discharge (see case study). A similar<br />
pattern has been found in the Waitara River at Bertrand Road (Table 4.8).<br />
Interestingly, signifi cant improvements in dissolved reactive phosphorus<br />
levels in the Manganui River at SH3 are evident over the past 18 years<br />
and also over the past 12 years (Table 4.8).<br />
Changes in nitrogen levels<br />
The overall story for nitrogen in <strong>Taranaki</strong>’s waterways is more positive,<br />
although some concerns do emerge. The majority (70%) of <strong>Council</strong>’s<br />
25 <strong>Taranaki</strong> <strong>Regional</strong> <strong>Council</strong>. 2006. Trends in the Quality of the Surface Water of <strong>Taranaki</strong>.<br />
Figure 4.12: Use of nitrogenous fertilisers in <strong>Taranaki</strong>.<br />
monitored sites show no statistically signifi cant change in nitrate<br />
or total nitrogen levels over the past 12 years, and ammonia levels<br />
have not statistically changed at any of the monitored ring plain sites<br />
(Table 4.7). These results are encouraging and surprising, as the use of<br />
nitrogenous fertiliser, especially urea, is increasing (Figure 4.12), and<br />
intensifi cation of stocking rates means more urine in paddocks and<br />
more effl uent in ponds. All these indicate more nitrogen, primarily as<br />
ammonia which is transformed into nitrate, potentially entering our<br />
environment. Stabilisation of ammonia concentrations in particular<br />
indicates enhanced treatment of effl uent and disposal to land rather<br />
than water are showing environmental benefi ts. However, some sites in<br />
mid-catchments do show deterioration in either or both nitrate and total<br />
nitrogen, probably due to the pressures discussed above.<br />
Over the longer term, nitrate levels in the Waingongoro River at SH45<br />
have deteriorated over the past 18 and 12 years (Table 4.8), but this<br />
trend is not evident over the past nine years (Table 4.7). While ammonia<br />
levels have also been deteriorating over the past 18 years at the same<br />
site, this trend may likewise have been arrested over the past nine years<br />
(Table 4 .7). This could also be due to improvements in the Riverlands<br />
discharge (see case study).<br />
The lower Mangaehu River site (a hill country site in the P _ atea<br />
catchment) has shown statistically signifi cant improvements in both<br />
ammonia and total nitrogen trends, for reasons as yet unknown.<br />
Changes in bacteria levels<br />
Most sites monitored do not show statistically signifi cant trends<br />
in levels of bacterial contamination (either faecal coliforms or<br />
enterococci). Two lower catchment sites, of the Mangaoraka Stream and<br />
Waingongoro River, show anomalous trends of signifi cant deterioration<br />
in levels of enterococci, but no changes in faecal coliforms. This is<br />
an unusual situation that could be due to environmental growth of<br />
enterococci, but warrants further investigation.<br />
Changes in other variables<br />
Dissolved oxygen levels in surface water throughout <strong>Taranaki</strong> are<br />
consistently high, and this situation is not changing.<br />
State of the Environment Report 2009<br />
DATA: Statistics NZ.<br />
97
98<br />
FRESH WATER<br />
Cyanobacteria warning sign, Lake Rotokare.<br />
Clarity, measured by the black disc method, is not signifi cantly<br />
changing at 85% of the monitored sites. The exceptions are the Stony<br />
(Hangatahua) River (due to natural erosion episodes), and in the lower<br />
Mangaoraka Stream, where clarity is deteriorating.<br />
Trends in temperature can be analysed from the <strong>Council</strong>’s state of the<br />
environment programme because they are taken at the same time of<br />
day at each site. Interestingly, temperatures in our streams and rivers<br />
are either not changing signifi cantly, or are measurably improving<br />
(i.e. getting cooler). The cooling effect is most pronounced further<br />
downstream on the ring plain, rather than at upper catchment sites,<br />
suggesting an infl uence other than natural temperature fl uctuations.<br />
However, it is too early to attribute this to the riparian programme given<br />
how little new planting has occurred and how long it will take for plants<br />
to provide shade to streams.<br />
(D) WHAT IS THE PHYSICAL AND CHEMICAL<br />
STATE OF TARANAKI LAKES?<br />
The main purpose of four of <strong>Taranaki</strong>’s largest lakes is for hydrogeneration,<br />
i.e. Lakes Rotorangi, M _ angam _ ahoe, Ratapiko and Opunake.<br />
Because of their use for energy generation, water tends to fl ow<br />
through these lakes relatively quickly and so they are less susceptible<br />
to potential water quality issues than might otherwise be the case.<br />
Although artifi cial, these lakes, and lakes Rotomanu and Rotokare are<br />
highly valued for their recreational uses, including fi shing and boating,<br />
water and jet-skiing, picnicking and as wildlife reserves 26 .<br />
Cyanobacteria levels in lakes<br />
Cyanobacteria are not indicators of faecal contamination, but rather are<br />
naturally occurring algae that may produce toxins which may pose risks<br />
to humans and animals by contact or consumption during recreational<br />
activities. Levels of cyanobacteria have been monitored since 2006-07<br />
at three lake sites (Rotokare, Rotomanu and Ratapiko) and in the lower<br />
Waiwhakaiho River. Lake Opunake was added the following year.<br />
This monitoring has found no cyanobacteria problems associated<br />
with lakes Opunake and Ratapiko, or in the lower reaches of the<br />
Waiwhakaiho River. However, cyanobacteria counts exceeded health<br />
standards towards the end of the exceptionally dry 2008 summer at Lake<br />
Rotomanu, and throughout the entire summer at Lake Rotokare 27 . Counts<br />
peaked at 37,000 cells per ml at Lake Rotomanu in late February 2008<br />
26 <strong>Taranaki</strong> <strong>Regional</strong> <strong>Council</strong>, 2008. Recreational Use of Coast, Rivers and Lakes in <strong>Taranaki</strong> 2007-2008.<br />
27 <strong>Taranaki</strong> <strong>Regional</strong> <strong>Council</strong>, 2008. Freshwater Contact Recreational Water Quality at selected <strong>Taranaki</strong> Sites. Technical Report 2008-02.<br />
28 Burns, N.M., 2007. Patea Hydro Electric Power Scheme Reconsenting Project Aquatic Ecology Review. Water Quality Trends in Lake Rotorangi, 1990-2006. Prepared by Lakes Consulting for Trust Power Ltd.<br />
TARANAKI – WHERE WE STAND<br />
<strong>Taranaki</strong> <strong>Regional</strong> <strong>Council</strong><br />
Figure 4.13: Cyanobacteria counts (cells/ml) at Lake Rotokare (health warning: ><br />
15,000 cells/ml).<br />
while counts at Lake Rotokare exceeded 150,000 cells per ml twice in<br />
January and again in March 2008 (Figure 4.13).<br />
Further monitoring into late autumn to mid-winter 2008 revealed the<br />
algal count had subsequently dropped considerably at Lake Rotokare,<br />
but risen at Lake Rotomanu despite wet, cold weather.<br />
With Lake Rotokare being closed to boating over the 2007-08 summer,<br />
boating use increased on Lake Rotorangi 26 . No cyanobacteria were<br />
detected at Lake Rotorangi.<br />
Monitoring of Lake Rotorangi<br />
Lake Rotorangi is the largest lake in <strong>Taranaki</strong> – a reservoir formed by the<br />
82 m high P _ atea earth-fi ll hydro-electric dam. The dam, 41 km upstream<br />
of the P _ atea River mouth, was constructed in 1984.<br />
The water entering the upper lake is often turbid, carrying high sediment<br />
loads under fl ood conditions. However, as this water slowly moves<br />
down the lake, the sediment settles and the water becomes clearer.<br />
Lake stratifi cation, where the lake water separates into distinct layers<br />
because of temperature differences, is an annual feature in spring/<br />
summer particularly at the deeper sites near the middle and the lower<br />
end of the lake. The lake’s layers become mixed again in mid-to late<br />
winter, although full mixing might not always happen leaving the bottom<br />
layers with lower oxygen levels in deeper areas of the lake. Lake mixing<br />
has the potential to cause environmental effects, by bringing nutrients<br />
to the surface where they become available for algal growth leading to<br />
odours, algal blooms, or even fi sh kills. It was originally predicted that<br />
these effects were possible in the reservoir, particularly during the early<br />
years with the decomposition of terrestrial vegetation. The sampling<br />
programme has been designed to monitor these potential effects. Since<br />
monitoring began in 1984, none of these effects has been recorded.<br />
The lake has been classed as being moderately nutrient enriched and<br />
appears throughout the 22 years of monitoring to have been slowly<br />
moving towards a more nutrient enriched state 28 . More enriched lakes<br />
have the potential to lead to algal blooms. Lake Rotorangi water<br />
contains nitrate nitrogen in plentiful quantities for enriched algal growth,<br />
but relatively low levels of phosphorus. Four of the main variables<br />
monitored regularly (chlorophyll-a, clarity, total phosphorus and total<br />
nitrogen) have not changed signifi cantly over time, which indicates
that the lake chemistry is not signifi cantly changing, although levels<br />
of dissolved reactive phosphorus and nitrate seem to be increasing.<br />
While currently, the relatively low levels of phosphorus limit algal<br />
growth within the lake, the situation could change if this upward trend<br />
continues 22 .<br />
All of this means that the lake is probably increasing in trophic level, but<br />
at a very low rate. This indicates that riparian management initiatives<br />
within the catchment upstream, improvements to point-source waste<br />
discharges and more sustainable land use in the hill country catchments<br />
to reduce sediment input, should be supported.<br />
4.1.3 HOW IS FRESHWATER<br />
QUALITY MANAGED ?<br />
(A) REGIONAL FRESH WATER PLAN<br />
The <strong>Regional</strong> Fresh Water Plan for <strong>Taranaki</strong> became operative in October<br />
2001. One of the main objectives of the plan is to maintain and enhance<br />
water quality in <strong>Taranaki</strong>’s rivers and streams. The plan recognises<br />
that point and diffuse source discharges and their effects on water<br />
quality must be addressed if it is to meet this objective. The plan uses a<br />
combination of regulatory and non-regulatory approaches as part of an<br />
overall strategy for managing the environmental effects of discharges to<br />
land and water. Key features of the plan are:<br />
• rules containing environmental standards or conditions for all major<br />
point source discharges to land or water;<br />
• policies and methods for the promotion of sustainable land<br />
management practices that prevent or minimise adverse effects on<br />
water quality from diffuse sources, including good stock and fertiliser<br />
management practices;<br />
Table 4.9: Consented discharges to land and surface water in <strong>Taranaki</strong>.<br />
29 <strong>Taranaki</strong> <strong>Regional</strong> <strong>Council</strong>, 2008. Effectiveness and Effi ciency of the <strong>Regional</strong> Fresh Water Plan for <strong>Taranaki</strong>.<br />
• policies and methods for the promotion of riparian planting on all ring<br />
plain catchments;<br />
• policies and methods to recognise and provide for the relationship of<br />
tangata whenua and the culture and traditions with their water, sites,<br />
w _ ahi tapu and other taonga;<br />
• best practice guidelines for water and land-based treatment and<br />
disposal of agricultural effl uent;<br />
• water quality guidelines for different water values and uses that<br />
are taken into account when assessing applications to discharge<br />
contaminants to land or water; and<br />
• special rules for the Stony (Hangatahua) River catchment so that the<br />
waters of this catchment are protected as far as possible in their<br />
natural state.<br />
The <strong>Council</strong> has prepared a report looking into the effectiveness and<br />
effi ciency of the Fresh Water Plan and has sought comments on it from<br />
stakeholders 29 .<br />
(B) RESOURCE CONSENT MANAGEMENT<br />
Point source discharges to surface water require a resource consent<br />
from the <strong>Council</strong> to ensure that discharges do not have unacceptable<br />
adverse effects on water quality.<br />
There are a number of point source discharges throughout the region<br />
that have the potential to result in the contamination of surface water.<br />
These include both discharges directly to water and discharges to land,<br />
where there is potential for run-off to water. Table 4.9 shows the number<br />
and type of consented discharges to land and surface water in <strong>Taranaki</strong>.<br />
2,655 consents are held for discharge to land and surface water. A little<br />
over half (53%) are for discharges to water, 44% are for discharges to<br />
land and 2% are to land and/or water.<br />
Discharges to surface water Discharges to land Discharges to land or water Total<br />
Agricultural - dairy 989 817 62 1868<br />
Agricultural - piggery 5 11 1 17<br />
Agricultural - poultry 3 43 0 46<br />
Agricultural - goats 2 4 0 6<br />
Hydrocarbon exploration 140 137 0 277<br />
Petrochemical processing 43 11 1 55<br />
Quarries 32 12 1 45<br />
Landfi ll 20 7 0 27<br />
Cleanfi ll 2 23 0 25<br />
Sewage treatment 18 24 0 42<br />
Water supply or treatment 19 4 0 23<br />
Dairy processing/manufacturing 13 6 0 19<br />
Power generation 18 3 1 22<br />
Other industry 109 71 3 183<br />
Total 1413 1173 69 2655<br />
Data from <strong>Council</strong>’s consent database to June 2008.<br />
State of the Environment Report 2009<br />
99
100<br />
FRESH WATER<br />
Inspecting dairy farm effl uent treatment ponds.<br />
There has been a slight decline in the total number of discharge<br />
consents to land and water, from 2,997 in 1996, to 2,655 in 2008. There<br />
has been a 23% reduction in the number of issued discharge consents to<br />
surface water (from 1,845 in 1996 to 1,413 in 2008).<br />
All discharges of treated farm dairy effl uent require a resource consent<br />
from the <strong>Council</strong>. The vast majority of all discharge to land or water<br />
consents (1,868 or 70%) are for dairy farms. This has dropped from<br />
2,299 reported in 2003 30 . Where minimum standards for waste disposal<br />
to water cannot be met, the <strong>Council</strong> requires wastes to be disposed of<br />
on to land, or the use of other treatment and disposal methods. Land<br />
disposal is also subject to conditions to avoid adverse environmental<br />
effects. The discharge of untreated dairy farm, piggery and poultry farm<br />
effl uent to water is prohibited. Largely due to increasing amalgamation<br />
of dairy farms over the past few years and encouragement to farmers to<br />
consider land treatment and disposal, there are fewer discharges into<br />
water than there were in 1995 (see Figure 4.14).<br />
There has been a signifi cant increase in discharge consents for<br />
hydrocarbon exploration (from 80 in 1996 to 277 in 2008). The proportion<br />
of these discharges that are to water, however, has declined from 92.5%<br />
in 1996 to 50% in 2008. This refl ects a signifi cant shift to land treatment<br />
and disposal options, particularly for drilling solids and stormwater over<br />
the past 10 years.<br />
Figure 4.14: Comparing the number of agricultural discharges to water or to land<br />
between 1995 and 2007.<br />
30 <strong>Taranaki</strong> <strong>Regional</strong> <strong>Council</strong>. 2003. <strong>Taranaki</strong> – Our Place, Our Future. State of the Environment Report.<br />
31 Wu, J; Sanderson, K. 2008. Community Investment in Environmental Improvements in <strong>Taranaki</strong>. Report prepared for the <strong>Taranaki</strong> <strong>Regional</strong> <strong>Council</strong>.<br />
TARANAKI – WHERE WE STAND<br />
<strong>Taranaki</strong> <strong>Regional</strong> <strong>Council</strong><br />
Other major industries, notably meat and by-product processing, have<br />
also moved to land-based effl uent disposal over the past 10 years.<br />
Municipal sewage discharges at Inglewood and H _ awera no longer<br />
discharge to rivers and streams. Several industries in the Mangati<br />
catchment in Bell Block have ceased discharging to the stream and have<br />
redirected their discharges to the New Plymouth municipal wastewater<br />
system. These changes have reduced pressures on surface water quality<br />
in <strong>Taranaki</strong>.<br />
Resource consents are renewed and reviewed by the <strong>Council</strong> over time.<br />
As an outcome from reviews of monitoring results, conditions are often<br />
adjusted to improve environmental performance.<br />
The community, through the district councils, has invested over<br />
$83.4 million in capital costs over the past fi ve years, to protect and<br />
improve surface water quality, mainly related to stormwater handling,<br />
wastewater and sewage collection, treatment and discharge. This fi gure<br />
is considerably higher than the $15.5 million reported for the period<br />
1997-02 31 . For example, New Plymouth District <strong>Council</strong> invested more<br />
than $15 million on wastewater collection, treatment and disposal and<br />
in addition upgraded the Fitzroy Beach camp stormwater discharge<br />
system, costing an additional $80,000 (approx). Other examples<br />
include more than $2 million invested on stormwater and wastewater<br />
treatments by Stratford District <strong>Council</strong>, and around $17 million by South<br />
<strong>Taranaki</strong> District <strong>Council</strong>.<br />
Over the period 2002-07 there were approximately 31 farm dairy effl uent<br />
treatment systems installed in <strong>Taranaki</strong> and, over the same period, 184<br />
were upgraded. Among the 31 newly-installed systems, six of them<br />
were oxidation ponds, seven were tertiary oxidation ponds and 18 were<br />
effl uent irrigation systems. Total installation and upgrade costs reached<br />
$3.6 million over the past fi ve years and annual cost of running and<br />
maintaining all systems was estimated to be around $1.5 million.<br />
(C) UNAUTHORISED INCIDENTS<br />
The risk of unauthorised discharges such as accidental spills, breaches<br />
of consent conditions and other non-authorised discharges entering<br />
watercourses is a continuing water quality issue in the region.<br />
Figure 4.15: Number of freshwater incidents over time as a proportion of total<br />
number of incidents.
Table 4.10: Major sources of freshwater incidents by sector from 2001-02 to 2007-08.<br />
2003-04 2004-05 2005-06 2006-07 2007-08<br />
Total freshwater incidents 339 333 355 329 277<br />
% of all incidents<br />
Major sources of incidents by sector<br />
60.8 60.3 57.4 56.9 51.3<br />
Dairy farm 159 172 163 125 138<br />
Dairy processing/manufacturing 3 4 5 5 4<br />
Meatworks, rendering plants 4 8 12 12 7<br />
Private housing 17 16 16 25 17<br />
Transport 7 9 11 6 5<br />
Cleanfi ll 4 1 6 3 1<br />
Building construction/drainage/fl ood control 13 6 11 6 1<br />
Recreation/tourism/cultural 14 19 11 15 15<br />
Quarries 8 4 9 6 1<br />
Other agriculture32 17 8 19 12 15<br />
Unknown 33 30 23<br />
Other33 59 84 50<br />
Reports of unauthorised incidents arise mostly from public complaints<br />
and from <strong>Council</strong> compliance and monitoring checks. Most<br />
environmental incidents are reported by the public (67% of all incidents<br />
in 2007-08). This is indicative of a general societal trend of rising<br />
expectations of environmental performance and quality. Increasingly,<br />
incidents are reported by consent holders as part of implementing<br />
stormwater management plans, or just as part of being environmentally-<br />
conscious citizens.<br />
Figure 4.15 illustrates the trends in freshwater related incidents. This<br />
shows that water pollution incidents make up over half of all registered<br />
unauthorised incidents (51% in 2007-08), the majority of these relating<br />
to surface fresh water.<br />
The major sources of freshwater incidents are illustrated by sector for<br />
the past fi ve years in Table 4.10. Farm dairy discharges consistently<br />
account for the greatest proportion of all fresh water unauthorised<br />
incidents (on average 47%).<br />
(D) RESOURCE CONSENT MONITORING<br />
<strong>Council</strong> monitors compliance with the conditions placed on consents<br />
on a regular basis. Tailored compliance monitoring programmes are<br />
implemented for major activities and can involve a range of monitoring<br />
activities including chemical and biological monitoring, inspections,<br />
data audit and annual reporting. At 30 June 2008, there were a total of<br />
283 current tailored compliance monitoring programmes covering 345<br />
resource consent holders, exercising 1,020 consents (Table 4.11).<br />
The <strong>Council</strong> annually monitors agricultural point source discharges to<br />
ensure compliance with consent conditions. The major programmes in<br />
this category are for inspections of dairy farm effl uent treatment and<br />
disposal systems. 1,868 dairy farms were inspected in 2007-08. The<br />
number of agricultural point source discharges inspected, along with an<br />
indication of the level of re-inspection or follow up required, is illustrated<br />
in Figure 4.16.<br />
Some inspections are carried out for minor industrial operations such as<br />
garages that do not require resource consents from the <strong>Council</strong> but are<br />
required to comply with conditions set out in the <strong>Council</strong>’s regional plans.<br />
(E) COMPLIANCE AND ENFORCEMENT<br />
The overall level of compliance with consent conditions and plan<br />
requirements is high. Consent holders with tailored compliance<br />
monitoring programmes have shown consistently high levels of<br />
Table 4.11: Sites and activities monitored in 2007-08.<br />
Type of activity<br />
Sewerage 12<br />
Marine outfalls 3<br />
Motorcamp and community wastewater systems 4<br />
Landfi lls 14<br />
Cleanfi lls 20<br />
Dairy companies 3<br />
Petrochemical 39<br />
Meat processing and feedmills 5<br />
Miscellaneous industry 9<br />
Abrasive blasting 13<br />
Quarries 29<br />
Water supply schemes 20<br />
Energy 6<br />
Abstraction for farm irrigation 48<br />
Consent holders in the catchment monitoring programmes 58<br />
Total number of sites/activities covered by tailored programmes 283<br />
32 Includes: agricultural services, drystock, goat, poultry and piggery farming operations.<br />
33 Includes: chemical processing/manufacturing; concrete products; electrical manufacutring; fertiliser storage or distribution; garage/workshop; hydrocarbon exploration; light engineering;<br />
local authority; pesticide manufacture/use; petrochemical processing; power generation; retail; road/bridge construction; sewage treatment; timber treatment and water supply or treatment.<br />
State of the Environment Report 2009<br />
101
102<br />
FRESH WATER<br />
Riverlands Chief Executive Trevor Johnston (left) and farmer Russell Joblin.<br />
WIN-WIN DEAL HELPS KEEP<br />
WAINGONGORO CLEAN<br />
The inspiration could have come from the name: Riverlands is doing its<br />
bit for the environment by diverting discharges from river to land.<br />
The busy meatworks, which sits on the banks of the Waingongoro River<br />
at Eltham, has more than trebled its throughput since the mid-1990s and<br />
has also taken on the processing of bobby calves.<br />
That level of increase could have been expected to put greater stress on<br />
the Waingongoro – but monitoring by the <strong>Taranaki</strong> <strong>Regional</strong> <strong>Council</strong> is in<br />
fact suggesting a gradual improvement in the quality of the river water 34 .<br />
Why? Because during crucial summer seasons, when river fl ows are at<br />
their lowest, an increasing amount of treated effl uent from the plant is<br />
discharged to land via irrigators on a neighbouring dairy farm.<br />
It’s the classic win-win: Riverlands keeps its impact on the environment<br />
to a minimum; pastures on the Joblin family farm next door get a boost<br />
at precisely the right time they need it.<br />
environmental performance, with 93% showing either a high or good<br />
level of performance in 2007-08. Ninety-six percent of the agricultural<br />
operations inspections and 97% of the minor industrial operations<br />
inspected in 2007-08 complied with their consent conditions or <strong>Council</strong><br />
requirements. The re-inspection rate for farms failing to meet <strong>Council</strong><br />
Figure 4.16: Frequency of <strong>Council</strong> inspections of agricultural point source<br />
discharges.<br />
34 <strong>Taranaki</strong> <strong>Regional</strong> <strong>Council</strong>, 2007. Riverlands Eltham Limited. Monitoring Programme Biennial Report 2005-2007. Technical Report 2007-116.<br />
TARANAKI – WHERE WE STAND<br />
Rob Tucker<br />
“We’re very pleased with the arrangement,” said the Riverlands Chief<br />
Executive Offi cer, Trevor Johnston. “It’s good to keep our own operation<br />
as environmentally clean as possible, it’s good to work in with a<br />
neighbour and it’s good that it’s going towards boosting production.”<br />
Farmer Russell Joblin agreed: “It’s been really good for the farm,<br />
especially during the dry summer we’ve just had. It is a real win-win,<br />
and it’s going to be more important as time goes on.”<br />
The soil acts as a living fi lter for the treated effl uent, processing it<br />
physically, chemically and biologically. Ultraviolet radiation in sunlight<br />
and the drying effect of the elements also have an effect.<br />
And, of course, the spraying brings nutrients and moisture to pastures –<br />
crucial for maintaining production in dry summers.<br />
Riverlands’ discharges to land began in 2001 and rapidly increased<br />
so that by 2005, they accounted for 62% of the plant’s annual treated<br />
effl uent. During this time, bacterial colonies known as “sewage fungus”<br />
have disappeared from the river, and studies of invertebrate populations<br />
downstream of the meat plant indicate that water quality may be<br />
improving.<br />
The effects of the discharges to land are also monitored and no<br />
signifi cant detrimental impacts have been detected.<br />
Meanwhile, a resource consent has been approved allowing treated<br />
municipal wastewater from Eltham to be piped to H _ awera and then out<br />
to sea via the Fonterra Whareroa outfall.<br />
That will bring an end to the discharge of Eltham municipal wastewater<br />
into the Mangawhero Stream, a tributary of the Waingongoro River. The<br />
new pipeline is expected to be completed in mid-2009.<br />
policy or consent conditions was 4% in 2007–08 - up from 2.7% in<br />
2006–07. However, most farm dairy effl uent systems consistently meet<br />
<strong>Council</strong> requirements with compliance rates between 95 and 97% over<br />
the past fi ve years (Table 4.12).<br />
Abatement notices are issued to require action to be taken where there<br />
is non-compliance. Table 4.12 sets out the annual number of abatement<br />
notices, infringement notices and prosecutions issued under the<br />
<strong>Regional</strong> Fresh Water Plan, including the number specifi cally relating to<br />
farm dairy discharges.<br />
The strategic use of enforcement in resource management to modify<br />
attitudes and encourage positive environmental outcomes has been long<br />
recognised by the <strong>Council</strong>.<br />
(F) CONTINGENCY PLANS AND STORMWATER<br />
MANAGEMENT PLANS<br />
The <strong>Council</strong> has the power to require consent holders to prepare<br />
contingency plans containing measures or procedures to avoid pollution<br />
in the event of a leak, spillage or failure of plant or equipment. A total<br />
of 338 contingency plans have been prepared, 312 relate to discharges
Table 4.12. Annual number of abatement notices, infringement notices and prosecutions.<br />
2003/04 2004/05 2005/06 2006/07 2007-08<br />
Consent compliance rate Relating to farm dairy discharges 95% 95.8% 94.1% 97.3% 95.9%<br />
Abatement notices Total 146 143 143 118 104<br />
Relating to fresh water<br />
125<br />
125<br />
131<br />
103<br />
88<br />
(relating to farm dairy discharges) (105)<br />
(117)<br />
(108)<br />
(73)<br />
(74)<br />
Infringement notices Total<br />
9<br />
9<br />
26<br />
40<br />
30<br />
(relating to farm dairy discharges) (2)<br />
(4)<br />
(4)<br />
(11)<br />
(7)<br />
Prosecutions Relating to fresh water<br />
(relating to farm dairy discharges)<br />
2<br />
(1)<br />
0<br />
3<br />
(2)<br />
5<br />
(4)<br />
4<br />
(3)<br />
to land and/or water, for a wide range of<br />
industrial activities including oil and gas<br />
exploration and production sites, landfi lls,<br />
quarries, meatworks, transport depots and<br />
engineering works. Contingency plans are<br />
regularly reviewed and updated.<br />
In addition to its industry-based contingency<br />
plans, the <strong>Council</strong> has prepared a contingency<br />
response plan for responding to spills or other<br />
unauthorised incidents in inland and estuarine<br />
areas 35 . This plan complements the <strong>Council</strong>’s<br />
Marine Oil Spill Response Plan and ensures<br />
the region is fully prepared for unauthorised<br />
discharge events.<br />
Recently, the <strong>Council</strong> prepared a template<br />
for stormwater management plans to assist<br />
industries develop their own plans 36 .<br />
(G) MANAGEMENT OF<br />
RIPARIAN MARGINS<br />
Riparian planting, incorporating streamside<br />
fencing and improved stock management<br />
35 <strong>Taranaki</strong> <strong>Regional</strong> <strong>Council</strong>. 2003. Inland and Estuarine Contingency Response Plan.<br />
36 www.trc.govt.nz/environment/pdf/smp_template.DOC.<br />
near waterways, is an important method for<br />
maintaining and improving water quality. The<br />
<strong>Council</strong> promotes riparian management through<br />
the preparation of riparian management plans,<br />
at no cost to the landowners, the provision<br />
Figure 4.17: Coverage of riparian plans to June 2000 compared to the coverage of riparian plans to the end of June 2008.<br />
of low cost riparian plants and assisting with<br />
planting contractors. The philosophy is that<br />
landowner initiative, voluntary co-operation<br />
and ongoing commitment are vital for the longterm<br />
success of riparian management.<br />
State of the Environment Report 2009<br />
103
104<br />
FRESH WATER<br />
Collecting riparian plants from the <strong>Council</strong>’s plant depot, Lepperton.<br />
To date the <strong>Council</strong>’s riparian management initiatives have resulted in the<br />
preparation of 2,009 riparian management plans making recommendations<br />
for riparian planting and fencing for 10,818 kilometres of stream banks. The<br />
coverage of riparian plans across the ring plain is illustrated in Figure 4.17.<br />
The <strong>Council</strong> supports riparian management by making riparian plants<br />
available to riparian plan holders at low cost. This involves contracting<br />
nurseries to supply suitable native riparian planting material. By bulkpurchasing<br />
these plants, costs are reduced and savings are passed<br />
on to landowners. In the fi rst year of the riparian plant scheme 15,600<br />
plants were provided. In 2007-08, some 256,438 plants were provided to<br />
riparian plan holders, almost three times the number of plants provided<br />
in 2001-02. In total, almost one and a half million plants have been<br />
provided to plan holders since 1996-97 (Figure 4.18).<br />
Progress in implementing riparian plans is closely monitored. Most<br />
plan holders are visited or contacted each year to assess progress and<br />
discuss any diffi culties or problems. The extent of fencing and planting<br />
completed from 2002 to 2007 was 412 km, compared to 139 kilometres<br />
from 1997 to 2002, at an estimated cost of approximately $1.2 million<br />
as part of the $3.6 million investment on riparian protection 37 . As at 30<br />
June 2008, landowners had fenced 504 km of stream bank and planted<br />
426 km of stream bank. Taking into account the pre-existing fencing and<br />
planting into consideration, this means that 60% of stream banks are<br />
fenced and 43% of stream banks are planted 38 .<br />
Table 4.13: Progress with developing and implementing riparian plans in the four monitored catchments.<br />
37 Wu, J. Sanderson, K. 2008. Community Investment in Environmental Improvements in <strong>Taranaki</strong>. Prepared by Business and Economic Research Limited for <strong>Taranaki</strong> <strong>Regional</strong> <strong>Council</strong>.<br />
38 <strong>Taranaki</strong> <strong>Regional</strong> <strong>Council</strong>. 2008. Land Management Annual Report 2007-08.<br />
TARANAKI – WHERE WE STAND<br />
Rob Tucker<br />
Figure 4.18: Number of plants supplied through the riparian plant scheme.<br />
The progress with planting and fencing stream banks in four catchments<br />
is set out in Table 4.13. These are the catchments that are subject to<br />
a monitoring programme. This shows that in the Katikara stream for<br />
example, 116 km of stream bank has been covered by a riparian plan,<br />
62 km (53%) is protected from stock through existing fencing or natural<br />
boundaries, a further 35 km fencing has been recommended in the<br />
riparian plans but only 2 km (6%) of this has been completed. In the<br />
Kapoaiaia Stream, 5% of recommended fencing has been completed<br />
compared with 15% in the Kaupokonui River.<br />
Land management offi cers support landowners to implement riparian plans.<br />
Katikara Kapoaiaia Kaupokonui Tangahoe<br />
Area of catchment (excluding ENP) (ha) 1849 1177 11899 29769<br />
Area of catchment covered by riparian plans (ha) 1385 1053 10802 11870<br />
Total length of streams covered by plans (km) 58 49 417 213<br />
Total length of stream bank (km) 116 99 835 426<br />
Fencing (km) existing 58 40 474 169<br />
natural boundary 4 5 10 5<br />
proposed 36 41 230 149<br />
completed 2 3 34 5<br />
Planting (km) proposed 14 56 408 203<br />
completed 1 2 37 7<br />
Rob Tucker
Kaponga farmer Tom Gibson with well-established riparian planting on the<br />
banks of the Kaupokonui Stream.<br />
DOLLARS AND SENSE IN<br />
STREAMSIDE PLANTING<br />
Kaponga farmer Tom Gibson knows all about the value of stock. And<br />
about the value of streamside fences and plants.<br />
A keen enthusiast for riparian (streamside) fencing and planting, he<br />
reckons it’s well worth the investment.<br />
“I’d have to say, the cost of planting is a lot less than the cost of the<br />
stock I was losing,” he said. And that was even before the current<br />
large dairy payouts, which have pushed cow prices up to $2,500-<br />
$3,000 a head – enough to pay a contractor to put in around 800 m of<br />
tax-deductible riparian fencing.<br />
Mr Gibson has been implementing a riparian management plan on his<br />
100 ha-property for fi ve years. And he’s had the benefi t of hard lessons<br />
(H) STATE OF THE ENVIRONMENT<br />
MONITORING<br />
Regular monitoring of general water quality occurs throughout the<br />
region. State of the environment physicochemical, bathing water and<br />
biomonitoring programmes have been fully described in this chapter.<br />
A programme has been developed to monitor the long-term effects of<br />
the riparian policy in four catchments - Kapoaiaia, Katikara and Tawhiti<br />
streams, and Kaupokonui River in terms of enhancement of water<br />
quality and stream health.<br />
Didymosphenia geminata (didymo), also known as “rock snot” is a type<br />
of single-celled algae and was fi rst reported in New Zealand in the<br />
South Island in 2004. Didymo has the ability to bloom in nutrient-limited<br />
streams, breaching the recreational guideline for long fi lamentous<br />
periphyton cover, and impacting on other values by blocking intake<br />
screens for water takes, clogging jet boat intakes, and entangling<br />
<strong>Taranaki</strong> <strong>Regional</strong> <strong>Council</strong><br />
from earlier forays into streamside work, seeing stock demolish new<br />
plantings after fl ood-damaged fences weren’t repaired quickly enough.<br />
Now it’s smooth sailing, however, with a contractor taking care of the<br />
hard graft and Mr Gibson happy to see the end of stock being lost by<br />
drowning or by being bogged.<br />
“At calving time the cows would head for the streams, and often<br />
come down with milk fever. If you weren’t there when they got up<br />
again, they’d get into the stream and drown,” he said.<br />
Liver fl uke is another lurking peril for animals drinking from streams,<br />
while agricultural research has also shown that cows drinking from<br />
reticulated troughs tend to walk less, eat more and do better than<br />
cows drinking from streams.<br />
For these reasons and more, Mr Gibson said riparian fencing and<br />
planting have made farm and stock management much easier –<br />
providing shelter, making stock movement safer, and break feeding<br />
simpler because the temporary line can be strung across the paddock<br />
to a fence alongside a stream.<br />
He also appreciates the protection and enhancement of water quality –<br />
the reason that riparian fencing and planting is among the targets under<br />
the Dairying and Clean Streams Accord <strong>Regional</strong> Action Plan agreed to<br />
by Federated Farmers, Fonterra and the <strong>Taranaki</strong> <strong>Regional</strong> <strong>Council</strong>.<br />
Properly established riparian buffers fi lter sediment and pollution,<br />
and reduce the speed of run-off, which moderates stream fl ows and<br />
reduces fl ooding.<br />
Riparian buffers also provide food and shelter for wildlife and<br />
corridors for plants and birds. Streamside vegetation also reduces<br />
water temperatures and supplies food for aquatic insects that in turn<br />
provide food for fi sh.<br />
“Land in <strong>Taranaki</strong> is among the most valuable in the world,” said Mr<br />
Gibson. “And it’s the same with the waterways. We need to keep<br />
them as clean and pristine as possible.”<br />
fi shing equipment as well as impacting on the ecology and aesthetics of<br />
streams. Surveys have been undertaken in nine <strong>Taranaki</strong> rivers that are<br />
of recreational value, at three-to-four-monthly intervals. To date, didymo<br />
has not been recorded in <strong>Taranaki</strong> or anywhere else in the North Island.<br />
(I) RESOURCE INVESTIGATIONS<br />
The <strong>Council</strong> undertook investigations on the effectiveness of <strong>Taranaki</strong><br />
dairy wastes treatment pond systems for the treatment of these wastes.<br />
Ten pond systems were studied to determine if the criteria in the Fresh<br />
Water Plan provided adequate protection against unacceptable adverse<br />
environmental effects from individual consented discharges 39 .<br />
The results suggest that individual pond systems, if designed and sized<br />
in accordance with the criteria in the plan, and if consistently achieving<br />
a dilution ration of 100:1 or greater, are unlikely to result in more than<br />
minor effects on the environment. Biological effects ranged from<br />
39 <strong>Taranaki</strong> <strong>Regional</strong> <strong>Council</strong>, Oct 2006. Dairy Shed Oxidation Pond Discharges in <strong>Taranaki</strong>. A study and discussion of oxidation pond performance, management and environmental effects.<br />
State of the Environment Report 2009<br />
105
106<br />
FRESH WATER<br />
Riparian planting, Taungatara Stream.<br />
undetectable to signifi cant in nature – the latter only where ponds were<br />
overloaded and dilution inadequate. The study highlighted that other<br />
factors, such as shading from riparian vegetation, appear to infl uence<br />
the potential effects of discharges. Where the downstream riparian<br />
vegetation is good, effects on ecological health and other indicators of<br />
instream ecology were reduced.<br />
This study has been followed up by a more intensive study of<br />
assimilation of dairy pond discharges which will provide guidance on<br />
appropriate separation distances between discharge points to help avoid<br />
cumulative effects 40 .<br />
The <strong>Council</strong> supports research in the Waiokura Catchment as part of the<br />
Best Practice Dairying Catchments for Sustainable Growth project, initiated<br />
in 2001 by the dairy industry and a consortium of research partners. The<br />
<strong>Council</strong> provides fi nancial support and ongoing fi eldwork. Impacts of dairy<br />
intensifi cation on farm productivity, soil physical and chemical resources<br />
and stream water quality are measured. This information is being used<br />
to measure long-term trends in soil and stream water condition, and to<br />
predict the effects of improving management practices.<br />
Trend analysis of water quality and quantity monitoring coupled with<br />
surveys of farming practices and soil quality, have shown that signifi cant<br />
improvements have been achieved over 2001-07. Reductions of 25-40%<br />
of phosphorus and suspended soils have occurred, primarily as a result<br />
of riparian protection of 42% of the total stream length, and also<br />
because of a reduction in farm dairy effl uent pond discharges (from<br />
eight to six), and a 25% reduction in the average application rate of<br />
phosphorus-derived fertiliser.<br />
(J) INFORMATION, EDUCATION AND ADVICE<br />
The <strong>Council</strong> provides information and advice on a wide range of matters<br />
concerning water quality, and has prepared a large number of guidelines,<br />
pamphlets and educational material. Examples of material produced in<br />
recent years include:<br />
• guidelines for earthworks in the <strong>Taranaki</strong> region;<br />
• a stormwater management plan template for industrial sites;<br />
• guidelines for the construction of culverts and bridges and for road<br />
culvert maintenance;<br />
• guidelines for clean-fi ll disposal;<br />
• riparian management guide;<br />
40 <strong>Taranaki</strong> <strong>Regional</strong> <strong>Council</strong>. 2008. The Assimilation and Dilution of Dairy Shed Oxidation Pond Discharges in <strong>Taranaki</strong>. A study and discussion of instream environmental effects below a pond discharge.<br />
TARANAKI – WHERE WE STAND<br />
Rob Tucker<br />
Vogeltown School students identifying invertebrates from the Huatoki Stream.<br />
• a range of information sheets on riparian management, establishing<br />
and maintaining riparian vegetation and fencing options and costs; and<br />
• guides to regional plan requirements for dairying and sheep and beef<br />
farming, the oil and gas industry and for small businesses.<br />
As part of its environmental education programme, the <strong>Council</strong> works with<br />
teachers and schoolchildren to raise awareness of freshwater issues and<br />
encourage wise and sustainable use of freshwater resources. The <strong>Council</strong><br />
provides a unit of work and a teaching resource kit to teachers that links<br />
water studies to the New Zealand curriculum. The <strong>Council</strong> also offers<br />
support and equipment for fi eld trips to rivers where children participate<br />
in monitoring activities such as measuring fl ow, temperature, turbidity, pH,<br />
dissolved oxygen and aquatic invertebrate sampling.<br />
<strong>Council</strong> offi cers visited popular river and lakeside areas over the summers<br />
of 2006-07 and 2007-08 and provided information on didymo and on<br />
how to disinfect equipment that has been in contact with fresh water.<br />
Educating people about cleaning gear between freshwater sites will help<br />
avoid the spread of freshwater pests such as didymo.<br />
(K) CLEAN STREAMS ACCORD AND ACTION PLAN<br />
The Dairying and Clean Streams Accord was signed on 26 May, 2003,<br />
by representatives of Fonterra Co-operative Group, the Ministry of<br />
Agriculture, the Ministry for the Environment and regional councils. The<br />
Accord promotes sustainable dairy farming and focuses on reducing the<br />
impacts of dairying on the quality of streams, rivers, lakes, groundwater<br />
and wetlands. A <strong>Regional</strong> Action Plan for <strong>Taranaki</strong> was prepared by local<br />
representatives of the Fonterra Co-operative Group, Federated Farmers,<br />
and the <strong>Taranaki</strong> <strong>Regional</strong> <strong>Council</strong>. The plan adapts the actions outlined in<br />
the Accord to <strong>Taranaki</strong> conditions and is reported on annually.<br />
By June 2008, 1,347 riparian property plans had been prepared,<br />
representing 72% of the total dairy farms in the region. Annual monitoring<br />
of works completed is conducted on-site by land management staff of the<br />
<strong>Council</strong>. In addition, all properties were inspected to monitor farm dairy<br />
discharge permit compliance. A summary of <strong>Taranaki</strong>’s progress against<br />
the targets at the end of June 2008 is set out in Table 4.14. The <strong>Council</strong><br />
will be looking to further the retirement and planting of riparian margins<br />
to meet the 2015 target.<br />
Rob Tucker
Rebecca Croft and Ayla Fryer monitoring stream health and water quality.<br />
SCIENTIFIC SATISFACTION<br />
IN THE STREAM<br />
If you’re taking trouble to plant stream banks in an effort to protect<br />
and enhance water quality, you want to be sure it works.<br />
That was part of the reason for Opunake High School Year 10 students<br />
Rebecca Croft and Ayla Fryer carrying out an investigation into the<br />
effectiveness of riparian planting – and claiming a number of awards<br />
at the <strong>Regional</strong> Science and Technology Fair in 2007.<br />
The pair had also noted “some confusion” among farmers over the<br />
benefi ts of riparian planting. “We thought if we could prove that it<br />
does work, farmers would be happier … We were also interested in<br />
the result because we have done riparian planting ourselves.”<br />
Table 4.14: Summary of progress with the regional action plan.<br />
Opunake High School<br />
And prove it they did, carrying out three tests at sites upstream,<br />
alongside and below established riparian plantings on the Waiteka<br />
Stream and the Rautini Stream.<br />
They measured the temperature and turbidity of the water at each site<br />
and took samples of the tiny insects and worms found in the stream.<br />
The state and variety of this macroinvertebrate life give valuable<br />
indications of overall stream health and water quality.<br />
Their fi ndings: Signifi cant differences in temperature and invertebrate<br />
life between sites above and alongside riparian planting, with higher<br />
temperatures and less variety of life forms upstream. This suggests<br />
the plantings do shade the water and encourage the formation of<br />
healthy ecosystems.<br />
Downstream of the plantings, water temperatures rose again but<br />
invertebrate variety remained healthy.<br />
No signifi cant differences were found in turbidity, though the girls<br />
noted that the water “looked a lot cleaner and clearer” as it passed<br />
through areas of riparian planting.<br />
Rebecca and Ayla also observed that there were other factors<br />
which could have been investigated – the effects of recent storms,<br />
soil types, the species of riparian plants. But overall, they satisfi ed<br />
themselves that riparian protection is worth the effort.<br />
Among their Science Fair prizes was the <strong>Taranaki</strong> <strong>Regional</strong> <strong>Council</strong><br />
Award for Environmental Science, whose judges noted that the<br />
process the girls followed was as important as the result. In essence,<br />
Rebecca and Ayla demonstrated that they knew what they were doing<br />
and why they were doing it.<br />
The judges also heartily endorsed their fi nal conclusion: The more<br />
trees, the better.<br />
<strong>Taranaki</strong> Target Progress with target<br />
90% of all dairy farms have a riparian plan by 2010. 72% of <strong>Taranaki</strong> dairy farms have a property plan.<br />
50% of property plans are to be implemented by 2010, 90% by 2015. 61% of stream bank is protected by fencing. Of that protection, 56% consists<br />
of fencing that was already in place (existing) at the time of preparing the<br />
property plans, 5% consists of new work completed on dairy farms.<br />
56% of stream bank is protected by planting and vegetation. Of that<br />
protection, 52% consists of vegetation that was already in place (existing) at<br />
the time of preparing the property plan, 4% consists of new work completed<br />
on dairy farms.<br />
50% of regular crossing points are to have bridges or culverts by 2007, 90% 97% of all regular stream crossings at the regional level are adequately<br />
by 2015.<br />
bridged or culverted.<br />
100% of dairy farms in <strong>Taranaki</strong> have an effl uent discharge consent that 100% of dairy farms had a consent that complied with the <strong>Regional</strong> Fresh<br />
complies with the <strong>Regional</strong> Fresh Water Plan.<br />
Water Plan by 2004.<br />
60% of regionally signifi cant wetlands are to be fenced by 2005, 90% by 2010. 76% of regionally signifi cant wetlands are fenced.<br />
100% of dairy farms with systems in place to manage nutrient inputs and 99.1% of dairy farms in <strong>Taranaki</strong> have a nutrient budget in place.<br />
outputs by 2007.<br />
State of the Environment Report 2009<br />
107
108<br />
FRESH WATER<br />
(L) SUMMARY OF PROGRESS<br />
Table 4.15: Summary of progress implementing regional objectives and policies on surface water quality.<br />
Issue What do we want to achieve ? What are we doing about it ? Where are we at ?<br />
Adverse effects on water<br />
quality from point and<br />
diffuse source discharges.<br />
Maintenance and enhancement<br />
surface water quality.<br />
4.1.4 HOW DOES OUR WATER<br />
QUALITY COMPARE WITH OTHER<br />
REGIONS?<br />
Measures of physical, chemical and bacteriological variables are the<br />
most common methods of comparing water quality between different<br />
localities as they are subject to the same or very similar techniques of<br />
sampling, measuring and analysis.<br />
The Ministry for the Environment has in recent years released reports<br />
describing aspects of water quality and management in New Zealand<br />
41 Scarsbrook, M, 2006. State and Trends in the National River Water Quality Network (1989-2005). Prepared by NIWA for the Ministry for the Environment.<br />
TARANAKI – WHERE WE STAND<br />
• Implementing the <strong>Regional</strong> Fresh<br />
Water Plan for <strong>Taranaki</strong>.<br />
• Undertaking an effectiveness and<br />
effi ciency review of the Fresh<br />
Water Plan.<br />
• Issuing and monitoring resource<br />
consents for discharges to land and<br />
water.<br />
• Promoting good land management<br />
practices and riparian management<br />
and planting.<br />
• Providing information and advice<br />
on water quality management and<br />
implement a schools’ education<br />
programme.<br />
• <strong>Regional</strong> Fresh Water Plan made operative in<br />
2001 and effectiveness review undertaken in<br />
2008.<br />
• 1,413 current resource consents controlling<br />
discharges to water, 1,173 discharges to land,<br />
69 discharges to land/water.<br />
• 214 freshwater tailored compliance monitoring<br />
programmes covering 345 consent holders,<br />
exercising 1020 consents established.<br />
• 1,868 dairy farms annually monitored with 96%<br />
compliance.<br />
• 312 contingency plans relating to discharges to<br />
land/water required.<br />
• Over the past fi ve years 544 abatement notices,<br />
114 infringement notices and 12 prosecutions<br />
have been undertaken.<br />
• 2,009 riparian management plans prepared<br />
covering 10,818 km of stream bank. Over 1.5<br />
million riparian plants sold to plan holders at<br />
low cost.<br />
• A range of information and advice and<br />
educational services provided.<br />
• Monitoring shows good to excellent water<br />
quality on most variables but elevated nutrient<br />
and bacterial levels, particularly in lower<br />
catchments. Ecological health decreases down<br />
catchments.<br />
• Trend monitoring shows ecological health is<br />
not changing generally, but has measurably<br />
increased at some sites. Some physicochemical<br />
variables are deteriorating.<br />
lakes and rivers. These reports have enabled comparison of the state<br />
of freshwater quality and trends found in <strong>Taranaki</strong> waterways, with the<br />
state and trends in water quality in other regions and nationally.<br />
(A) HOW DOES THE PHYSICAL AND CHEMICAL<br />
QUALITIES OF TARANAKI WATERWAYS<br />
COMPARE WITH WATERWAYS NATIONALLY?<br />
The National River Water Quality Network has been used to compare<br />
water quality around the country 41 . Two <strong>Taranaki</strong> rivers included are<br />
among the smallest in the programme, they are relatively cool, and they
are in the middle of the range for conductivity (dissolved material) and<br />
pH. The Waitara River had one of the lowest median clarities, which is<br />
not surprising given the infl uence of hill country sediment on clarity at<br />
this site.<br />
The lower Waingongoro River had one of the highest median levels of<br />
nitrate, ammonia, and dissolved and total phosphorus nationally. Given<br />
the freezing works and wastewater treatment plant at Eltham, this is to<br />
be expected. The upper Waingongoro River and the Waitara River sites<br />
were closer to national averages. Compared to the national median for<br />
faecal coliforms, the Waitara River’s counts were high, but counts for the<br />
Waingongoro River were near the median.<br />
Data for <strong>Taranaki</strong>’s state of the environment monitoring sites has also<br />
been compared with data from close to 1,000 sites from around New<br />
Zealand that are similar in terms of climate, land cover, geology and<br />
stream type 42 . Median values were used to compare <strong>Taranaki</strong> sites with<br />
the ranges of all national data (see table key) 43 . With only a few isolated<br />
Table 4.16: Comparison of water quality at <strong>Taranaki</strong> state of the environment monitoring sites with a national database.<br />
Catchment<br />
level<br />
P _ atea River<br />
Barcley Rd<br />
Upper<br />
Punehu Stream<br />
Wiremu Rd<br />
Upper/<br />
Middle<br />
Stony (Hangatahua)<br />
River<br />
Mangatete Rd<br />
Middle<br />
Patea River<br />
Skinner Rd<br />
Middle<br />
Waiwhakaiho<br />
River<br />
SH 3<br />
exceptions, water quality in <strong>Taranaki</strong> appears as good as or better than<br />
water quality at comparable sites around New Zealand.<br />
Trends in water quality have also been considered nationally 41 . This<br />
has shown that nationally, for the period 1989-2003, there have been<br />
measurable improvements in water clarity, ammonia and BOD levels<br />
(suggesting improvements to point source pollutants), but some<br />
measurable deterioration in nitrates, total nitrogen, dissolved reactive<br />
phosphorus, and total phosphorus (suggesting ongoing or increased<br />
pollution from diffuse source pollutants) at some sites. The national<br />
studies note that dissolved reactive phosphorus levels appear to have<br />
stabilised in recent years but nitrates appear to be deteriorating the<br />
most in rivers where concentrations are highest. Figure 4.19 shows<br />
the proportion of sites both nationally (for the years 1989-2003) and<br />
regionally (for the years 1995-2007) that are measurably improving or<br />
deteriorating. Generally, water quality trends in <strong>Taranaki</strong> rivers appear to<br />
be following the national pattern.<br />
42 S. Larned, M. Scarsbrook, T. Snelder, N.Norton. 2005. Nationwide and <strong>Regional</strong> State and Trends in River Water Quality 1996-2002. Prepared by NIWA for the Ministry for the Environment.<br />
43 <strong>Taranaki</strong> <strong>Regional</strong> <strong>Council</strong>. 2006. Trends in the Quality of the Surface Water of <strong>Taranaki</strong>.<br />
44 Scarsbrook, M, 2006. State and Trends in the National River Water Quality Network (1989-2005). Prepared by NIWA for the Ministry for the Environment.<br />
Middle<br />
Waingongoro River<br />
Eltham Rd<br />
Mangaoraka<br />
Stream<br />
Corbett Rd<br />
NH4 ☺ � ☺ � � � � � � ☺<br />
NO3 ☺ ☺ ☺ � � � � � � ☺<br />
E coli ☺ � ☺ ☺ ☺ ☺ � ☺ � ☺<br />
Clarity ☺ � ☺ ☺ � � � � � �<br />
DRP � � � � � ☺ ☺ � � ☺<br />
NH4: ammonium NO3: nitrate DRP: dissolved reactive phosphorus<br />
Key:<br />
☺ median value is better than three quarters of values for comparable sites nationwide<br />
� median value lies between the range of values occupied by a quarter to three quarters of values from comparable nationwide sites<br />
� median value is worse than a quarter of all values for comparable sites nationwide.<br />
Middle<br />
Lower<br />
Waingongoro River<br />
SH 45<br />
Lower<br />
Punehu River<br />
SH 45<br />
Lower<br />
Mangaehu River<br />
Raupuha Rd<br />
Lower<br />
State of the Environment Report 2009<br />
109
110<br />
FRESH WATER<br />
Mountain stream.<br />
Figure 4.19: Comparing trends in surface water quality in <strong>Taranaki</strong> waterways (1995-2007) with trends in surface water quality from waterways across New Zealand<br />
(1989-2003).<br />
TARANAKI – WHERE WE STAND<br />
Rob Tucker
Lake Rotomanu, New Plymouth.<br />
(B) HOW DO TARANAKI LAKES COMPARE<br />
WITH OTHER REGIONS?<br />
Comparison of lake data between regions in New Zealand is diffi cult<br />
because lake monitoring is undertaken for different reasons. Monitoring<br />
may be carried out because a lake is of a high value or quality, of the<br />
largest size, at high risk of nutrient enrichment, or eutrophication,<br />
or of high use and public interest 44 . There is no representativeness<br />
across current regional monitoring programmes, so results can only be<br />
compared with caution.<br />
Table 4.17 shows the number of New Zealand lakes according to their<br />
nutrient status compared to Lake Rotorangi. This shows that Lake<br />
Rotorangi has a similar nutrient status to 16% of lakes monitored across<br />
New Zealand.<br />
Trends in nutrient status in lakes have also been examined. Across New<br />
Zealand 13 (19%) are declining, 34 (48%) are showing no change and<br />
23 (33%) are showing improved water quality. Like Lake Rotorangi, the<br />
nutrient status of most monitored New Zealand lakes is not changing,<br />
although more monitored lakes are improving than declining.<br />
(C) HOW DOES TARANAKI BATHING WATER<br />
QUALITY COMPARE NATIONALLY?<br />
The suitability of <strong>Taranaki</strong>’s freshwater sites for swimming can be<br />
compared with the national data provided by the Ministry for the<br />
Environment 45 . Figure 4.20 shows that <strong>Taranaki</strong> freshwater bathing sites<br />
were suitable for contact recreation a greater proportion of the time than<br />
the national average, i.e. more samples were under the Alert threshold.<br />
For three out of the four years that national data is available, <strong>Taranaki</strong><br />
swimming spots were more likely to be suitable for bathing than the<br />
national average.<br />
Table 4.17: Trophic status of Lake Rotorangi compared with lakes in New Zealand.<br />
4.2 SURFACE WATER<br />
QUANTITY AND FLOWS<br />
4.2.1 WHAT IS THE CURRENT<br />
STATE OF TARANAKI RIVERS?<br />
44 Opus, 2006. Snapshot of Lake Water Quality in New Zealand. Prepared by Opus International Consultants for the Ministry for the Environment.<br />
45 Ministry for the Environment. 2007. Environment New Zealand 2007.<br />
46 Ministry for the Environment. 2008. Proposed National Environmental Standard on Ecological Flows and Water Levels Discussion Document.<br />
Since the 2003 State of the Environment Report the region has<br />
experienced some of the biggest fl oods and lowest fl ows on record,<br />
with fl oods for the Wait _ otara region in 2004 and the May 2007 ‘fl ash<br />
fl ood’ event in the area from _ O _ akura around to Egmont Village. During<br />
the summer of 2007-08 the region recorded extremely low rainfall totals,<br />
with some of the streams recording their lowest fl ow on record. Two of<br />
the streams recorded a low fl ow return period of a ‘1 in 80 year’ event,<br />
meaning that that probability of such a low fl ow occurring in any one<br />
year was 1.2%.<br />
(A) INDICATORS AND GUIDELINES<br />
There are several key measures of river or stream fl ow that are used<br />
as indicators of surface water quantity: the mean, or average fl ow, the<br />
median fl ow which is the fl ow that occurs 50% of the time, and the<br />
mean annual low fl ow, or MALF, which is an average of the lowest fl ow<br />
that the river reached each year (usually during summer).<br />
National guidelines for ecological fl ows, i.e. fl ows that should be<br />
retained in rivers and streams to safeguard ecological values, are in<br />
the process of being developed 46 . The <strong>Taranaki</strong> <strong>Regional</strong> <strong>Council</strong> has<br />
adopted a guideline for ecological fl ows in the <strong>Regional</strong> Fresh Water<br />
Plan. This guideline requires levels of water to remain in rivers and<br />
streams that will retain two thirds of the amount of instream habitat that<br />
State<br />
Hyper-trophic<br />
� More impacted < < < < < < � > > > > > > > > > more pristine ☺<br />
Super-trophic Eutrophic Meso-trophic Oligo-trophic Micro-trophic<br />
Lake Rotorangi yes<br />
All NZ 18 (13%) 13 (10%) 44 (33%) 21 (16%) 25 (19%) 13 (10%)<br />
National data from Opus, 2006.<br />
Rob Tucker<br />
Figure 4.20: Proportion of sites in various categories of compliance with water<br />
quality guidelines for swimming in <strong>Taranaki</strong> and New Zealand from 2003-04 to<br />
2006-07.<br />
State of the Environment Report 2009<br />
111
112<br />
FRESH WATER<br />
Gauging the fl ow of the Mangaoraka Stream.<br />
would be found at the mean annual low fl ow (or MALF), i.e. the average<br />
lowest summer level. This formula was developed to predict when<br />
instream conditions become limiting for a range of aquatic species 47 .<br />
Compliance with this guideline is used as an indicator of surface water<br />
quantity in <strong>Taranaki</strong>.<br />
Indicators of the level of pressure on the rivers and streams include<br />
the quantity of water allocated for different uses and the number of<br />
consents issued for water abstraction. There are 224 parent catchments<br />
in <strong>Taranaki</strong>, 45 of these have consented water abstractions.<br />
(B) FLOW CHARACTERISTICS<br />
River fl ows in <strong>Taranaki</strong> are typically high in the winter with low fl ows<br />
occurring in the summer. Rivers draining the mountain typically rise<br />
rapidly from high rainfall events, and they recede at a steady rate once<br />
the rain has stopped. Generally mean or average river fl ows are much<br />
higher than the median fl ows.<br />
The Egmont National Park is critical for maintaining fl ows in ring<br />
plain streams and rivers during prolonged dry periods. During low<br />
fl ow periods, Egmont National Park is the source of approximately<br />
80% of water in ring plain streams. In some rivers, such as the Stony<br />
(Hangatahua) River, the fl ow at the coast is almost all (95%) derived<br />
from the park. In contrast, for other rivers such as the K _ apuni, the park’s<br />
contribution is somewhat lower (57%), but this is still reasonably high.<br />
The other signifi cant feature of ring plain streams and rivers is the<br />
stability of their low fl ows. In general, stream fl ows recede, or drop,<br />
predictably once low fl ow conditions prevail, but fl ows in some streams<br />
continue to go down faster than others. In most summers, ring plain<br />
streams recede to approximately 50% of their median fl ow levels, but<br />
once they reach these levels, they tend to take a relatively long time to<br />
drop much lower. Even during a 10-year drought, levels typically recede<br />
to only 35-40% of median fl ows.<br />
Rivers draining the mountain also generally have high base fl ows, due<br />
to the water storage on the mountain from ice and springs located high<br />
in the catchment. In comparison, the streams draining the hill country<br />
47 Jowett, I. 1993. Report on Minimum Flow Requirements for Instream Habitat in <strong>Taranaki</strong> Rivers. NZ Freshwater Miscellaneous Report No. 75. NIWA, Christchurch.<br />
TARANAKI – WHERE WE STAND<br />
<strong>Taranaki</strong> <strong>Regional</strong> <strong>Council</strong><br />
Figure 4.21: Location of monitoring stations in <strong>Taranaki</strong>.<br />
have reasonably low base fl ows, as there is less storage of water in the<br />
ground reservoirs.<br />
Hillcountry rivers do not have the same fl ash-fl ood type events as the<br />
ring plain streams do. They tend to rise and fall quite uniformly and take<br />
a lot longer to reach their peak fl ows. This is due to the rivers taking<br />
longer to respond to rainfall levels. Hillcountry catchments do not usually<br />
receive rainfall events as intense as ring plain streams, and surface<br />
fl ows are slowed down by vegetation.<br />
During summer or when there is an absence of rainfall, the rivers from<br />
the hill country tend to recede quite quickly to their low fl ows, and<br />
continue to decrease at a higher rate than the ring plain streams do, and<br />
they also take longer to recover to normal fl ows once rainfall occurs.<br />
The <strong>Council</strong> operates a network of 35 monitoring stations which<br />
continuously collect data on rainfall, stream fl ow and water levels. This<br />
is complemented by a further fi ve stations operated by NIWA. Two<br />
stations are shared by the <strong>Council</strong> and NIWA. All monitoring stations<br />
are shown in Figure 4.21. This system provides valuable information on<br />
fl oods as well as water availability during droughts.<br />
The <strong>Council</strong> also undertakes stream fl ow measurements for many<br />
waterways in the region for state of the environment and pasture<br />
irrigation monitoring, particularly during low fl ow periods.<br />
Regular monitoring enables the <strong>Council</strong> to gather valuable information<br />
about the region’s surface water resources. This information is used to<br />
assess the low fl ow behaviour of rivers and streams, assess the likely<br />
impacts of current and future abstractions and to develop appropriate<br />
water management policies.
Table 4.18 shows that data on water levels in streams have been<br />
gathered for a long time for certain sites. For example, almost 40 years<br />
of data have been gathered for the Punehu Stream. The mean annual<br />
low fl ow relates to the size of the catchment – the larger catchments<br />
obviously having a larger fl ow. The maximum fl ow ever recorded was<br />
2.4 million litres per second in the Waitara River.<br />
The mean annual low fl ows for the past 20 years were analysed to see<br />
if there were any statistically signifi cant trends over that time. Fourteen<br />
Table 4.18: Flow data for selected <strong>Taranaki</strong> river sites.<br />
of the 27 sites showed signifi cant temporal changes and 13 showed no<br />
statistically signifi cant trend. There were fi ve signifi cant increases and<br />
one decrease (which was Waingongoro River at Eltham Rd) in MALF.<br />
In terms of median levels, seven sites showed statistically signifi cant<br />
increases and one showed a measurable decrease (the Waitara River at<br />
Bertrand Rd). Three streams showed statistically signifi cant increases in<br />
both MALF and median - the Punehu Stream, Waitara River at Tarata and<br />
Kaupokonui Stream (p
114<br />
FRESH WATER<br />
Figure 4.22. Statistically significant trends in water quantity in rivers and<br />
streams (p
Table 4.19: <strong>Taranaki</strong> surface water allocation by use category.<br />
Use Category<br />
What is water used for?<br />
2003 Volume allocated<br />
(m 3/day)<br />
Water is used for a number of consumptive uses. Much of the permitted<br />
take is for agriculture such as for farm dairies. The volume consented for<br />
the top 10 categories is illustrated in Figure 4.24. This shows that the<br />
single largest category is for municipal and rural water supply schemes.<br />
This category includes town water supplies, which in turn supply small<br />
industrial and domestic users. The municipal and rural water supply<br />
schemes have a total allocation of 152,333 m 3 per day (1,763 litres per<br />
second) or 32% of all allocated water use (Table 4.19). This is the same<br />
percentage of total surface water allocation as reported in the 2003<br />
State of the Environment Report.<br />
2003 Percentage of<br />
total allocation<br />
2008 Volume allocated<br />
(m 3/day)<br />
The category of water use with the greatest increase since 2003 has<br />
been for thermal power generation, which is used for gas processing<br />
and steam supply. Water allocation for this use has increased from<br />
13,399 m 3 to 23,940 m 3 per day, a 79% increase. The amount of water<br />
allocated for dairy processing/manufacturing has decreased since 2003<br />
from 49,500 m 3 per day to 30,000 m 3 per day, a decrease of 19,500 m 3<br />
per day or 40%.<br />
Irrigation is not new in <strong>Taranaki</strong> and it is generally needed only during<br />
the summer months. Some areas, particularly the sandy soils bordering<br />
Figure 4.24: Volume of water allocated through consents.<br />
2008 Percentage of<br />
total allocation<br />
Water Supply or Treatment 143,432 32% 152,333 32%<br />
Agriculture - pasture irrigation 92,758 21% 99,022 21%<br />
Petrochemical Processing 65,538 15% 62,239 13%<br />
Dairy Processing/Manufacturing 49,500 11% 30,000 6%<br />
Power Generation - thermal 10,541 2% 23,940 5%<br />
Drystock Farm 1,232
116<br />
FRESH WATER<br />
Figure 4.25: Location of consents held for pasture irrigation.<br />
coastal areas and in the south of the region, can experience signifi cant<br />
dry periods. Interest in irrigation has increased in recent years,<br />
particularly after relatively dry summers in 2000, 2001, 2003 and 2008.<br />
The location of these irrigation sites is shown in Figure 4.25. The volume<br />
of water allocated for pasture irrigation has increased by more than<br />
6,000 m3/day, a 7 % increase.<br />
In a sense, hydroelectric power generation can be considered a nonconsumptive<br />
use, as water is returned to the river, although there can be<br />
signifi cant environmental effects on the river reach between the point<br />
where the water is abstracted and where the water is returned to the<br />
river. The fl ow regime can also be impacted below the abstraction site.<br />
<strong>Taranaki</strong> has four signifi cant hydroelectric power generation schemes:<br />
P _ atea, which uses water from Lake Rotorangi; Opunake, which diverts<br />
water from the Waiaua Stream; Mangorei, which diverts water from<br />
Figure 4.26: <strong>Taranaki</strong> surface water allocation by catchment.<br />
TARANAKI – WHERE WE STAND<br />
the Waiwhakaiho River; and Motukawa, which diverts water from the<br />
Manganui and returns it to the Waitara River.<br />
The combined throughput of these hydroelectric power schemes is<br />
in the order of 10,000,000 m 3 per day or 116,000 litres per second.<br />
However, this is a maximum and can only occur when suffi cient water<br />
is available. Nevertheless, this is a much greater volume than all the<br />
other consumptive water surface water uses combined, which account<br />
for just 4% of the total water use when hydrogeneration is included.<br />
Residual fl ows are required below each of the hydropower abstractions<br />
and monitoring is carried out by the <strong>Council</strong> to ensure compliance with<br />
these requirements.<br />
Water allocation by catchment<br />
<strong>Taranaki</strong> receives frequent and plentiful rainfall. This, together with the<br />
generally stable nature of river fl ows during drier periods (described<br />
earlier in this chapter), mean that for most of the time, there are no<br />
signifi cant water use pressures on <strong>Taranaki</strong>’s many rivers and streams.<br />
A useful measure of water use pressure is to compare the amount of<br />
water allocated for use with either the median fl ow or average or mean<br />
annual low fl ow (MALF).<br />
The majority of the water used in <strong>Taranaki</strong> is taken from several of the<br />
larger catchments. Figure 4.26 shows the 11 top catchments with the<br />
highest levels of water allocation. The fi ve catchments with the largest<br />
volume use, Waitara, Waiwhakaiho, T _ angahoe, P _ atea and Kaupokonui,<br />
account for 55% of the entire consented surface water allocation. Five<br />
percent of the total amount of water allocated is from other smaller<br />
catchments. This proportion has increased from that reported in 2003<br />
Figure 4.27: Proportion of MALF allocated from <strong>Taranaki</strong> rivers and streams.
due to increased demand for water from small streams that were formerly<br />
not abstracted from.<br />
Over most of the region (i.e. the largest 25 catchments) water allocation<br />
is only a small proportion – one or 2% of median fl ows. Some smaller<br />
catchments have higher allocations but these represent a relatively<br />
small proportion of the total surface water resources of the region. Taken<br />
overall, water allocation in <strong>Taranaki</strong> is only 4.6% of the total median fl ow.<br />
The proportion is higher when compared with MALF, but overall, total<br />
water allocation is still reasonably low at 12.9% of MALF.<br />
Some catchments however have a higher proportion of their summer<br />
low fl ow allocated in accordance with the <strong>Regional</strong> Fresh Water Plan.<br />
Figure 4.27 illustrates the proportion of the MALF allocated from all the<br />
catchments in <strong>Taranaki</strong>. This shows that 24 catchments, or 10% have<br />
more than 20% of their MALF allocated (also see Table 4.20). Recent<br />
national guidelines for water allocation have proposed water allocation<br />
limits of 30% of MALF in rivers and streams where limits have not been<br />
set by regional plans 50 . In <strong>Taranaki</strong>, 19 catchments, or 8%, have more than<br />
30% of MALF allocated.<br />
Table 4.20: Consented surface water allocation compared with mean annual low fl ows at selected sites (l/s).<br />
River site<br />
Natural<br />
median<br />
fl ow 1<br />
Natural<br />
MALF 2<br />
50 Ministry for the Environment. 2008. Proposed National Environmental Standard on Ecological Flows and Water Levels Discussion Document.<br />
An arguably more relevant indicator of the impact of water allocation is the<br />
fl ow at which abstraction must cease in order to protect ecological values.<br />
Table 4.20 show the levels of water allocation compared to the median<br />
fl ow and MALF, the fl ow that abstraction must cease at, and whether this<br />
complies with the 2/3 habitat guideline set in the <strong>Regional</strong> Freshwater<br />
Plan. The table includes catchments with the highest level of water<br />
allocation. This shows that the Wairoa Stream, the Manganui River (a<br />
tributary of the Waitara River) and the Tawhiti Stream (a tributary of the<br />
T _ angahoe River) have the highest proportions of their median and mean<br />
annual low fl ows allocated, and do not meet the guideline.<br />
Consented<br />
water<br />
allocation<br />
above<br />
recorder<br />
sites (No. of<br />
consents)<br />
The Tawhiti Stream and Manganui River both have longstanding water<br />
abstractions, for the Fonterra Whareroa’s milk processing site and for the<br />
generation of electricity by Trust Power respectively. These abstractions<br />
provide other benefi ts to the community and have been assessed against<br />
other criteria in the <strong>Regional</strong> Freshwater Plan. Through decisions involving<br />
the community, restrictions on use or other mitigation measures have<br />
been put in place to enable environmental effects to be minimised.<br />
% of median<br />
fl ow<br />
allocated<br />
% of MALF<br />
allocated<br />
Flow at<br />
which<br />
abstraction<br />
must cease<br />
(l/s)<br />
Complies<br />
with 2/3<br />
habitat<br />
guideline 3<br />
Wairoa at Coast 150 128 2654 (2) 176.7 207.0 50 No<br />
Manganui at Everett Park 11513 3956 58015 (10) 50.4 146.6 400 No<br />
Tawhiti at Duffy’s Farm 784 380 4266 (4) 54.3 112.1 50 No<br />
Inaha at Coast 1220 240 1307 K<br />
(4) 10.7 54.2 200 Yes<br />
_ apuni at SH45<br />
P<br />
1507 525 228 (5) 15.1 43.4 - Yes<br />
_ atea at Skinner Rd 3200 851 331 (8) 10.3 38.9 - Yes<br />
Waiokura at Coast 487 175 65 (3) 13.3 37.1 122 Yes<br />
Punehu at SH45<br />
Ng<br />
663 269 79 (2) 11.9 29.4 230 Yes<br />
_ atoro at SH3 691 339 76 (3) 11.0 22.4 - Yes<br />
Waingongoro at SH45 5037 1528 252 (9) 5.0 16.5 - Yes<br />
Kapoaiaia at Lighthouse 706 298 46 (2) 6.5 15.4 285 Yes<br />
Waingongoro at Eltham Rd 1792 516 77 (3) 4.3 14.9 - Yes<br />
Mangatoki at Hastings Rd 801 237 29 (2) 3.6 12.2 - Yes<br />
Waitara at Bertrand Rd 29995 7504 611 (13) 2.0 8.1 4600 Yes<br />
Whenuakura at Nicholson Rd 5285 1898 151 (4) 2.9 8.0 1945 Yes<br />
Waiongana at SH3a 1443 418 6 (2) 0.4 1.4 - Yes<br />
Kaupokonui at Glenn Rd 2001 749 0 (1) 8 0.0 0.0 - Yes<br />
Waiwhakaiho at Egmont Village 3910 2104 0 (0) 0.0 0.0 - Yes<br />
Notes:<br />
1 Corrected to include consented water allocation.<br />
2 Corrected to include consented water allocation.<br />
3 A rate of abstraction that retains at least two-thirds of the aquatic habitat in the river at the mean annual low fl ow (MALF) of the river.<br />
4 Fully allocated at the coast, however a residual fl ow of 50 l/s has to be provided downstream of take.<br />
5 Includes water diverted to the Motukawa Power Scheme as this water is not returned to the Manganui River.<br />
6 Fully allocated, however a residual fl ow of 50 l/s has to be provided downstream of Fonterra’s take.<br />
7 Fully allocated, however residual fl ow requirements have been provided to reduce or cease abstracting when fl ows in the stream fall.<br />
8 Only one consent and that is an in and out system at Fonterra’s Lactose Plant, so no water actually taken.<br />
State of the Environment Report 2009<br />
117
118<br />
FRESH WATER<br />
The small Wairoa and Inaha streams are also under some heavy<br />
pressures for water abstraction for pasture irrigation. Residual fl ows, i.e.<br />
fl ows at which water abstraction must cease, have been set for each of<br />
these catchments in order to safeguard environmental values.<br />
Water demand has decreased in a number of catchments. This includes<br />
the Kaupokonui above its confl uence with the Mangawhero, the<br />
Waiwhakaiho above Mangorei Power Scheme, Ng _ atoro, Waiongana,<br />
the lower Waingongoro at Eltham and the Waitara. However, water<br />
allocations have increased in the Whenuakura, Kapoaiaia, Waingongoro,<br />
Inaha, Punehu, Wairoa and Waiokura catchments, largely through<br />
increased abstractions for pasture irrigation. The <strong>Council</strong> has identifi ed a<br />
number of catchments which are now fully allocated 51 , but overall water<br />
allocation is not a major issue in the region.<br />
4.2.2 HOW IS WATER QUANTITY<br />
MANAGED?<br />
(A) REGIONAL FRESH WATER PLAN<br />
The <strong>Regional</strong> Fresh Water Plan for <strong>Taranaki</strong>, made operative in 2001,<br />
establishes a policy framework for managing water use and allocation.<br />
The key elements of the policy framework are:<br />
• the taking and use of up to 50 m 3 of water per day is permitted<br />
without a resource consent provided certain conditions to safeguard<br />
the environment can be met. This is to allow for reasonable farm and<br />
domestic water uses;<br />
• the taking and use of water from all of the Stony (Hangatahua)<br />
River catchment and parts of the Maketawa and Manganui rivers is<br />
prohibited except for minor takes for stock watering and domestic<br />
uses. These provisions aim to protect high value rivers in the region;<br />
• the taking and use of water above existing levels from the K _ apuni,<br />
Kaupokonui, Mangorei, P _ atea, Waiongana, Waingongoro and<br />
Waiwhakaiho rivers, is to be strictly limited as far as possible, and<br />
assessed on a case-by-case basis according to policies in the plan. This<br />
recognises the high natural and recreational values of these rivers;<br />
• a guideline for assessing proposals for the taking and use of surface<br />
water that seeks to retain at least two-thirds of the habitat of the<br />
river at its mean (average) annual low fl ow;<br />
• criteria for the assessment of resource consent applications for<br />
the taking and use of water that allow variations of the guideline<br />
according the natural, ecological and amenity values of the<br />
waterbody, the relationship of tangata whenua with the waterbody,<br />
hydrological characteristics and the reasonably foreseeable future<br />
needs for water; and<br />
• policies to guide decision making to take into account the likely<br />
benefi ts of the water use, mitigation measures including minimum<br />
fl ows or fl ow regimes, maintenance of fi sh passage and riparian<br />
planting and the degree of community or regional benefi t, as distinct<br />
from individual or private benefi t.<br />
(B) RESOURCE CONSENT MANAGEMENT<br />
The <strong>Taranaki</strong> <strong>Regional</strong> <strong>Council</strong> is responsible for granting resource<br />
consents for the taking and use of water. These consents are generally<br />
required before surface water may be abstracted for irrigation, drinking<br />
51 <strong>Taranaki</strong> <strong>Regional</strong> <strong>Council</strong>.2005. A Guide to Surface Water Availability and Allocation in <strong>Taranaki</strong>.<br />
52 <strong>Taranaki</strong> <strong>Regional</strong> <strong>Council</strong>. 2008. Pasture Irrigation Compliance Monitoring Annual Report 2006-07. Technical Report 2007-55.<br />
53 <strong>Taranaki</strong> <strong>Regional</strong> <strong>Council</strong>, 2000. Flood Event Standard Operating Procedure.<br />
54 <strong>Taranaki</strong> <strong>Regional</strong> <strong>Council</strong>, 2000. Water Shortage Event Standard Operating Procedure.<br />
TARANAKI – WHERE WE STAND<br />
water supply, industrial and manufacturing works and other activities.<br />
Consents are assessed on a case-by-case basis according to the<br />
policies, guidelines and criteria in the <strong>Regional</strong> Fresh Water Plan. There<br />
are 150 current surface water take consents and 52 consents to divert<br />
and use surface water. Smaller volumes of water can be allocated<br />
through permitted activity rules provided certain conditions are met.<br />
Conditions on consents may specify the volumes of water that can<br />
be abstracted, the rate at which it can be abstracted, minimum<br />
fl ow requirements beyond which abstraction must cease and other<br />
circumstances under which water can be abstracted. Consent<br />
monitoring (regular inspections and abstraction data collection) ensures<br />
ongoing compliance with these measures.<br />
In the 2006-07 monitoring period, the <strong>Council</strong> had 59 tailored monitoring<br />
programmes for water takes. These were associated with municipal<br />
and rural water supply schemes, pasture irrigation, stock and domestic<br />
takes, horticultural, golf clubs and power generation schemes.<br />
The total number of resource consents held for pasture irrigation has<br />
been steadily increasing since 1995 as shown in Figure 4.28. Monitoring<br />
of these consents showed a good level of compliance with allocated<br />
abstractions, maintenance of minimum residual fl ows and provision of<br />
abstraction records. During the 2006-07 monitoring year for example, six<br />
out of 40 consent holders exceeded their consented water allocations,<br />
but these were isolated events and did not result in any signifi cant<br />
adverse effects 52 .<br />
Figure 4.28: Cumulative number of pasture irrigation consents held.<br />
(C) STANDARD OPERATING PROCEDURES<br />
In 2000, the <strong>Council</strong> adopted standard operating procedures for fl oods 53<br />
and water shortages 54 . The <strong>Council</strong>’s hydrological monitoring is a critical<br />
part of both fl ood, and water shortage management procedures. The<br />
standard operating procedure for fl oods sets out the procedures the<br />
<strong>Council</strong> is to follow to avoid or reduce the risk to life and property. The<br />
standard operating procedure for water shortages allows the <strong>Council</strong><br />
to take steps to reduce environmental and other effects during water<br />
shortages or droughts. In extreme situations, the <strong>Council</strong> may issue a<br />
water shortage direction under section 329 of the RMA to restrict water<br />
use. The <strong>Council</strong> has been close to issuing a water shortage direction on<br />
two occasions, during the 2002-03 and 2007-08 summers.
Ella Burrows saving water.<br />
MP’S SPOUSE FINDS LEAKS IN<br />
THE HOUSE<br />
Every single drop of water is important during times of drought – and<br />
if you don’t believe it, just ask H _ awera woman Ella Borrows.<br />
It was all buckets to the taps for Ella, wife of local MP Chester<br />
Borrows, as she joined many residents heeding the South <strong>Taranaki</strong><br />
District <strong>Council</strong>’s call for water conservation during the summer<br />
drought of 2007-08.<br />
She had buckets in the shower, in the laundry tub and under every tap<br />
in the house, catching grey water for re-use in the garden or on the<br />
car. And she took a good, hard look at her household’s water habits.<br />
“I was absolutely stunned by how much water I wasted,” Ella said.<br />
“A leaky tap here, an extra minute or two in the shower, rinsing the<br />
dishes before putting them in the dishwasher – not to mention all<br />
that water going out from a full machine load of washing.<br />
“I found I saved an average of 35 litres a week – and considering<br />
I’m at home alone most of the time, that was a shock for me. I did a<br />
project with a school class and we worked out average savings if my<br />
(D) INFORMATION, EDUCATION AND ADVICE<br />
The <strong>Council</strong> operates a network of 35 monitoring stations that<br />
continuously record rainfall, wind, water level, water temperature and<br />
soil moisture and temperature. Much of this data is available for the<br />
public on the <strong>Council</strong>’s website, www.trc.govt.nz. The data is updated<br />
at 30-minute intervals, so the public can fi nd out the current state of the<br />
rivers and the weather situation in and around the region easily.<br />
<strong>Taranaki</strong> Daily News<br />
street had 80 houses, with an average of three people per house who<br />
saved on average 70 litres a week – 5,600 litres a week.<br />
“Suddenly it did matter and ‘every little bit’ did help.”<br />
Although the water conservation effort could be tiresome, Ella said<br />
she was also spurred on by thoughts of people across the Tasman<br />
facing years of drought.<br />
Although the drought here was nothing like those proportions, it did<br />
force restrictions on water use throughout the region, most notably in<br />
southern areas.<br />
Partial water restrictions were introduced in November but in<br />
January, the South <strong>Taranaki</strong> District <strong>Council</strong> banned the use of all<br />
hoses, sprinklers and irrigation systems – urban, rural, commercial<br />
and industrial. The bans continued until early April.<br />
The <strong>Taranaki</strong> <strong>Regional</strong> <strong>Council</strong> also had to take action, issuing<br />
infringement notices when the Mangawheroiti Stream ran dry below<br />
the intake weir.<br />
Elsewhere, the Stratford District <strong>Council</strong> also imposed water<br />
restrictions and hired two local plumbing companies to fi x residents’<br />
leaking taps.<br />
Because of low fl ows in the P _ atea River, the Stratford District <strong>Council</strong><br />
was also forced to draw water from Konini Stream, a contingency<br />
permitted under its resource consent issued by the <strong>Taranaki</strong> <strong>Regional</strong><br />
<strong>Council</strong>.<br />
New Plymouth District also felt the drought’s bite, though restrictions<br />
were limited to the _ Okato area, while a water conservation notice<br />
was issued for Inglewood. There were no restrictions in the New<br />
Plymouth urban area.<br />
Supplies to the _ Okato Water Treatment Plant were restricted due to<br />
low fl ows in the Mangatete Stream. Under its resource consent, the<br />
New Plymouth District <strong>Council</strong> limited the volume of the water take<br />
to the minimum amount necessary to maintain the health of people<br />
and animals.<br />
Region-wide, and as Ella’s response of indicates, the restrictions<br />
brought out the best in many people.<br />
Announcing the lifting of restrictions in April, South <strong>Taranaki</strong> District<br />
<strong>Council</strong> group manager of engineering services Neil McCann noted<br />
the fantastic response of some residents.<br />
“I know a lot of people have changed the way they’ve used water this<br />
summer because of the drought and water restrictions,” he said.<br />
“I hope some of these behaviours will become common practice.<br />
Water is a precious resource, with demand rising every year it is<br />
vital we manage our resources in a positive way without impacting<br />
negatively on our environment.”<br />
The <strong>Council</strong> provides water users and applicants for resource consents<br />
with information and advice on water allocation and the effects of water<br />
use. The <strong>Council</strong> may also give advice on water conservation, water<br />
harvesting and the effi cient use of water to avoid or minimise adverse<br />
environmental effects.<br />
In 2005, the <strong>Council</strong> published guidelines to inform water users or those<br />
planning to take and/or use water about how much and where in the<br />
region water is available51 .<br />
State of the Environment Report 2009<br />
119
120<br />
FRESH WATER<br />
Table 4.21 Summary of progress: implementing regional objectives and policies on water allocation and use.<br />
Issue What do we want to achieve? What are we doing about it? Where are we at?<br />
• Adverse effects of the taking, use,<br />
damming and diversion of water.<br />
(E) RESOURCE INVESTIGATIONS<br />
Although the <strong>Council</strong> has developed a guide to surface water availability<br />
and allocation, this information needs to be updated constantly as new<br />
consents are granted or better monitoring data is obtained. Therefore,<br />
the <strong>Council</strong> anticipates undertaking further resource investigation<br />
work in this area, to better refi ne the water balance/budgeting used in<br />
order to better understand the surface water resource and to be able<br />
to provide up-to-date water availability information. This will involve a<br />
mixture of obtaining better information on river fl ows.<br />
The <strong>Council</strong> has undertaken an evaluation of surface water availability<br />
for pasture irrigation purposes 55 . This complemented work to investigate<br />
current and potential irrigation development and to provide information<br />
relevant to the management of water resources in the region 56 . That<br />
report highlighted potential demand for water resources, particularly<br />
in southern and coastal areas of <strong>Taranaki</strong>, and provided information<br />
on irrigation methods and effi ciencies. It also recognised areas where<br />
pressures for water for irrigation were likely to come from.<br />
(F) SUMMARY OF PROGRESS<br />
Progress implementing regional objectives and policies on surface water<br />
allocation and use is reported in Table 4.21.<br />
4.2.3 HOW DOES OUR WATER<br />
QUANTITY COMPARE TO OTHER<br />
REGIONS?<br />
If all the water consents were added together, the total allocation of<br />
water in New Zealand (in 2006) was 676 m 3 per second 57 . Canterbury<br />
and Otago regions account for almost three-quarters of the total<br />
allocation, with the amount of water allocated in <strong>Taranaki</strong> contributing<br />
just 0.08% of this. In New Zealand over 60% of all water allocated is<br />
from surface water, whereas in <strong>Taranaki</strong> 95% of total water allocated is<br />
from surface water.<br />
55 <strong>Taranaki</strong> <strong>Regional</strong> <strong>Council</strong>, July 2003. A Preliminary Evaluation of Surface Water Availability and Demand for Pasture Irrigation Purposes in <strong>Taranaki</strong>.<br />
56 Rout, R, April 2003. Optimisation of Farm Irrigation. Report prepared for <strong>Taranaki</strong> <strong>Regional</strong> <strong>Council</strong> by Lincoln Environmental.<br />
57 Ministry for the Environment. 2007. Environment 2007.<br />
58 Aqualinc Research Limited, 2006. Snapshot of Water Allocation in New Zealand. Prepared for the Ministry for the Environment.<br />
TARANAKI – WHERE WE STAND<br />
• Sustainable management of<br />
quantities, levels and fl ows of<br />
surface water.<br />
• Avoidance or mitigation of adverse<br />
effects of the taking, use, damming<br />
and diversion of surface water.<br />
• Implementing the <strong>Regional</strong> Fresh<br />
Water Plan.<br />
• Adopting a habitat-based guideline<br />
to guide decisions on sustainable<br />
management and avoidance of the<br />
adverse effects of water use.<br />
• Issuing and monitoring resource<br />
consents for water abstraction and<br />
use.<br />
• Maintaining hydrological<br />
monitoring systems.<br />
• Providing information and advice<br />
on sustainable and effi cient water<br />
use.<br />
• Establishing procedure for water<br />
shortage events.<br />
• <strong>Regional</strong> Fresh Water Plan<br />
operative in October 2001.<br />
• Flow guideline of two-thirds<br />
habitat at MALF applied having<br />
regard to policies in the <strong>Regional</strong><br />
Fresh Water Plan.<br />
• 202 resource consents for water<br />
use issued and monitored.<br />
• 35 hydrological sites maintained.<br />
• Standard operating procedures for<br />
fl ood fl ows and water shortage<br />
events adopted.<br />
• Information and advice provided.<br />
• A guide to surface water<br />
availability and allocation in<br />
<strong>Taranaki</strong> published in 2005.<br />
The use of water resources in <strong>Taranaki</strong> differs signifi cantly from the<br />
pattern of water use for New Zealand as a whole (Figure 4.29), with a<br />
much greater proportion of <strong>Taranaki</strong>’s allocated water going to water<br />
supply and industrial uses than in New Zealand generally, but a smaller<br />
proportion going to irrigation.<br />
Figure 4.29: Comparison of water allocation –New Zealand and <strong>Taranaki</strong>.<br />
The major pressures on surface water throughout New Zealand are<br />
for pasture irrigation, which accounts for 77% of all surface water<br />
allocated 58 . In <strong>Taranaki</strong>, pasture irrigation accounts for 21% of all water<br />
use. Irrigation is particularly signifi cant in the Nelson/Marlborough and<br />
in east coast regions of Hawke’s Bay, Canterbury and Otago, where<br />
prolonged dry periods occur regularly.<br />
Figure 4.30 shows the allocation of the catchments as a percentage of<br />
the MALF throughout New Zealand 58 .
Figure 4.30: Allocation of surface water as a percentage of mean annual low fl ow.<br />
4.3 GROUNDWATER<br />
4.3.1 WHAT IS THE STATE OF<br />
GROUNDWATER IN TARANAKI ?<br />
Groundwater is an important water resource in <strong>Taranaki</strong> as it is used<br />
for a variety of purposes including domestic, industrial, agricultural,<br />
and water supply for private and municipal use, particularly in South<br />
<strong>Taranaki</strong>. Groundwater is also the major component of streamfl ow<br />
during dry weather for most streams.<br />
Groundwater aquifers vary according to their geology and depth, and<br />
tend to be named after the geological formations where they are<br />
encountered. They are classifi ed as shallow or deep. There<br />
are fi ve principal groundwater systems in the <strong>Taranaki</strong> region: the<br />
Matemate _ aonga Formation aquifers, the Whenuakura Formation<br />
aquifers, the Marine Terrace aquifers, the T _ angahoe Formation aquifers<br />
and the <strong>Taranaki</strong> Volcanics aquifers. The true size and capacity of<br />
the region’s aquifers are highly complex, although the geology and<br />
characteristics of the formations they are encountered in has been<br />
extensively studied. The yields of the aquifers in the region are relatively<br />
low compared with other regions of the country due to the nature of<br />
geological formations.<br />
Aquifers are recharged or ‘re-fi lled’ by rain percolating through the soil<br />
and into the groundwater. The amount of rain available to recharge<br />
aquifers is the total rainfall less the amount that evaporates, is<br />
consumed by plants, stored in the soil or runs off into surface water.<br />
Drilling a water bore, Eltham.<br />
(A) GROUNDWATER QUANTITY<br />
Abstraction of groundwater has the potential to lower levels in nearby<br />
wells, reduce fl ow in spring-fed streams, and induce seawater intrusion<br />
into the aquifer in coastal areas, even when groundwater resources are<br />
abundant. These effects are even more likely with several abstractions<br />
from the same aquifer.<br />
Figure 4.31: Location of groundwater level and groundwater quality monitoring sites.<br />
<strong>Taranaki</strong> <strong>Regional</strong> <strong>Council</strong><br />
State of the Environment Report 2009<br />
121
122<br />
FRESH WATER<br />
Figure 4.32: Example of water levels in a shallow aquifer, <strong>Taranaki</strong> Volcanics<br />
aquifer at Eltham.<br />
The <strong>Taranaki</strong> <strong>Regional</strong> <strong>Council</strong> monitors groundwater levels at seven<br />
sites across the region to assess recharge levels into the region’s<br />
aquifers (Figure 4.31). Groundwater levels in wells indicate the status of<br />
the groundwater resource and are also used to assess the interaction<br />
between surface water and groundwater. They need to be measured<br />
regularly to provide an indication of the response of groundwater to<br />
climatic conditions and to the impact of groundwater abstraction.<br />
Groundwater levels in the shallower Volcanic and Marine Terrace<br />
aquifers, generally show seasonal variation, with higher levels in late<br />
winter and lower levels in late summer. Seasonal variations up to four<br />
metres have been recorded. This is illustrated in Figure 4.32, an example<br />
of water levels in a shallow aquifer.<br />
In contrast, deeper aquifers such as the Matemate _ aonga and<br />
Whenuakura aquifers usually do not show noticeable seasonal<br />
fl uctuations. This is illustrated in Figure 4.33.<br />
(B) GROUNDWATER ALLOCATION<br />
Groundwater is a good and secure water supply for domestic and farm<br />
supplies. As a water supply, it has many advantages over surface water<br />
for water supply. It is more reliable in dry seasons or droughts, it is more<br />
economical to develop as less treatment is often required and it can<br />
be tapped where it is needed avoiding transport issues, depending on<br />
the depth of available water. Increasingly, more people in <strong>Taranaki</strong> are<br />
supplying their own drinking water from domestic wells.<br />
There are currently 1,550 water bores listed on the <strong>Council</strong>’s database<br />
(2008) illustrated in Figure 4.34. <strong>Council</strong>’s records show that 85 new<br />
bores (5.5%) have been drilled since the 2003 State of the Environment<br />
Report. An average of 15 new reported water bores are drilled in<br />
<strong>Taranaki</strong> annually, most for farm and domestic water supply.<br />
The <strong>Regional</strong> Fresh Water Plan for <strong>Taranaki</strong> allows for groundwater<br />
abstractions up to 50 m 3 a day and up to 1.5 litres per second, provided<br />
certain conditions are met. The great majority of groundwater takes<br />
in <strong>Taranaki</strong> are for stock and domestic supplies and fall within this<br />
permitted category. It is estimated that about 15% of the water<br />
abstracted on the ring plain comes from groundwater, which would<br />
amount to approximately 8,000 m 3 a day.<br />
59 <strong>Taranaki</strong> <strong>Regional</strong> <strong>Council</strong>, 2003. <strong>Taranaki</strong> – Our Place, Our Future. Report on the State of the Environment of the <strong>Taranaki</strong> Region – 2003.<br />
TARANAKI – WHERE WE STAND<br />
Figure 4.33: Example of water levels in a deep aquifer, Matemateaonga aquifer, in<br />
New Plymouth.<br />
There are currently 81 resource consents to abstract groundwater in<br />
the <strong>Taranaki</strong> region. The total consented allocation of groundwater<br />
is 44,022 m 3 day, up from 22,299 m 3 per day reported in 2003 59 . The<br />
South <strong>Taranaki</strong> District <strong>Council</strong> holds eight consents for groundwater<br />
abstraction amounting to 7,100 cubic metres per day for community<br />
water supplies for P _ atea, Waverley, Waiinu Beach, H _ awera, and<br />
Waverley Beach townships. Resource consents for the abstraction<br />
of groundwater by use category are summarised in Figure 4.35 and<br />
compared with the levels of abstraction in 2003 in Table 4.22. This<br />
shows that the greatest proportion of groundwater is for water supply<br />
(27%) which has increased by 938 m 3 per day since 2003.<br />
The amount of groundwater allocated, while providing a useful indicator<br />
of the pressure on this resource, is not necessarily equivalent to the<br />
Figure 4.34: Location of groundwater bores.
Figure 4.35: Groundwater allocation by use category.<br />
amount actually used. Table 4.22 does not include temporary takes, such<br />
as those for hydrocarbon exploration activities that may abstract (and<br />
then discharge) groundwater for a short period. Between 2003 and 2004<br />
more than 30 consents were granted to abstract groundwater during<br />
hydrocarbon exploration. Due to the temporary nature of these projects,<br />
rates and volumes to be extracted are not included in Table 4.22.<br />
Groundwater resources in <strong>Taranaki</strong> are slowly coming under increasing<br />
pressure from a rapidly growing demand for irrigation, and water supply<br />
to towns. There are 58 more resource consents for groundwater takes<br />
than in 2003 which represent an increase of 300% in the past fi ve years.<br />
Consented groundwater takes for pasture irrigation are mainly to<br />
supplement water abstracted from other resources, as the relative<br />
low production from <strong>Taranaki</strong>’s aquifers is insuffi cient to run an entire<br />
irrigation system.<br />
It has been estimated that less than 2% of the total annual recharge,<br />
i.e. the amount of water going back into the aquifers is abstracted<br />
from aquifers in <strong>Taranaki</strong>. By way of comparison, national limits for<br />
groundwater abstraction have been proposed at levels of 15% of the<br />
average annual recharge for shallow coastal groundwater abstractions<br />
Table 4.22: Groundwater allocation by use category in 2003 compared to 2008.<br />
Use classifi cation<br />
Total consented<br />
allocation (m 3/day)<br />
2003<br />
Ground water monitoring.<br />
60 Ministry for the Environment. 2008. Proposed National Environmental Standard for Ecological Flows and Water Levels. Discussion Document.<br />
and 35% of the average annual recharge for other types of aquifers 60 .<br />
Thus current levels of groundwater abstraction in <strong>Taranaki</strong> do not pose a<br />
signifi cant pressure on this resource.<br />
(C) GROUNDWATER QUALITY<br />
Contamination of groundwater occurs when pollutants percolate<br />
through the soil and into the underlying aquifers. Potential sources<br />
of contamination are from intense land use, septic tanks, pesticides<br />
and fertilisers, areas of chemical storage, unsealed effl uent treatment<br />
ponds and landfi lls, and intrusion of salt water. Activities that have the<br />
potential to cause adverse effects on groundwater quality include the<br />
discharge of contaminants onto land and water from point sources,<br />
poorly constructed water bores which allow contaminants to enter<br />
groundwater and diffuse source discharges such as farm run-off or<br />
effl uent irrigation.<br />
% Total<br />
Total consented<br />
abstraction (m 3/day)<br />
2008<br />
Estimated permitted groundwater use 7,000 31 8,000 18<br />
Petrochemical processing 5,384 24 5,734 13<br />
Pasture irrigation 4,068 18 5,010 11<br />
Water supply or treatment 2,571 12 11,752 27<br />
Meat and by-product processing 1,300 6 4,300 10<br />
Dairy processing/manufacturing 700 3 700 2<br />
Hydrocarbon exploration 550 2 7,750 18<br />
Horticulture 480 2 401
124<br />
FRESH WATER<br />
Historically, the principal groundwater issues in <strong>Taranaki</strong> have been<br />
the presence of high concentrations of dissolved iron in the <strong>Taranaki</strong><br />
Volcanics aquifers, a natural phenomenon, and the concentration of<br />
nitrates in shallow aquifers from intensive pastoral agriculture.<br />
Current groundwater quality<br />
The geological properties of an aquifer play a large part in determining<br />
whether contaminants discharged onto or into land will reach<br />
groundwater. The risk of groundwater contamination is usually greater<br />
for the shallowest unconfi ned aquifers than for deeper confi ned aquifers<br />
as the former lack an overlying impervious rock layer to stop the entry of<br />
contaminants.<br />
Naturally occurring contaminants are present in soil, rocks and<br />
sediments. As groundwater fl ows through the soils, metals such as<br />
iron and manganese are dissolved and may later be found in high<br />
concentrations in the groundwater. While arsenic minerals are common<br />
in many volcanic rocks, no arsenic has been detected in Tarankai<br />
groundwater.<br />
Groundwater quality from the region’s three major freshwater aquifers<br />
has been monitored on a quarterly frequency since 1994 at fi ve sites 61<br />
(Figure 4.31). Health-related maximum allowable values and aesthetic<br />
61 <strong>Taranaki</strong> <strong>Regional</strong> <strong>Council</strong>. 2008. State of the Environment Groundwater Chemical Quality 1994-2007. Technical Report 2008-58<br />
62 Ministry of Health. 2005. Drinking Water Standards for New Zealand 2005.<br />
63 Stenger, R; Barkle, G; Burgess, C; Wall, A; Clague, J. 2008. Low nitrate contamination of shallow groundwater in spite of intensive dairying: the effect of reducting conditions in the vadose<br />
zone-aquifer continuum. Journal of Hydrology (NZ) 47:1-24.<br />
TARANAKI – WHERE WE STAND<br />
guideline values related to taste, odour or colour have been developed 62 .<br />
Monitoring has found that water quality standards and health-related<br />
guidelines are not exceeded at any of the sites (Table 4.23).<br />
Nitrates<br />
Nitrates in groundwater are monitored for health and environmental<br />
reasons. Excessive levels of nitrate in drinking water have been<br />
linked with blood disease in infants (commonly known as ‘blue baby<br />
syndrome’). From an environmental perspective, nitrates are essential<br />
nutrients for pasture growth. However, excess nitrates can be leached<br />
from the soil and enter the groundwater which can then cause problems<br />
when that groundwater enters surface water through springs. Elevated<br />
nitrate levels can also indicate the presence of other pollutants such as<br />
faecal contamination.<br />
High levels of nitrates and bacteria are particularly common in shallow,<br />
unconfi ned aquifers. These aquifers are the most vulnerable to pollution<br />
from land-use activities, such as farming, although recent research<br />
suggests that soils of a volcanic origin are better able to bind nitrates<br />
and thus ultimately reduce the levels that enter the groundwater 63 .<br />
However, this will have to be further researched given <strong>Taranaki</strong>’s soils<br />
unique characteristics. The complex nature of groundwater systems<br />
Table 4.23: Average values for groundwater quality for state of the environment monitoring sites 1999-2007.<br />
Location:<br />
Aquifer:<br />
Normanby<br />
Whenuakura<br />
_<br />
Ohawe<br />
Whenuakura<br />
New Plymouth<br />
Volcanics<br />
Toko<br />
Matemate<br />
_<br />
Ohawe<br />
_ aonga Volcanics<br />
Estimated age (years): 144 152 2 167 2<br />
Variable Maximum<br />
allowable value<br />
Ammoniacal nitrogen 1.5 mg/m3 0.27 1.20 0.01 0.56 0.01<br />
Bicarbonate 180 mg/m3 169.39 138.91 37.25 180.97 55.85<br />
Bromide 0.08 0.10 0.08 0.06 0.27<br />
Calcium 30.25 17.52 7.42 28.49 17.19<br />
Chloride 250 mg/m3 23.87 26.95 9.19 9.62 81.50<br />
Conductivity @ 20’C 47.96 44.24 16.55 42.07 49.98<br />
Fluoride 1.5mg/m3 0.07 0.30 0.03 0.13 0.10<br />
Iron 0.2 mg/m3 0.02 3.15 0.16 0.14 0.03<br />
Magnesium 11.98 7.19 3.13 9.42 11.31<br />
Hardness 200 mg/m3 42.23 24.71 10.55 37.91 28.49<br />
Manganese 0.04 mg/m3 0.01 0.73 0.01 0.01 0.01<br />
Nitrate nitrogen 11.3 mg/m3 0.23 0.04 1.75 0.03 2.33<br />
pH 7.0 – 8.5 8.00 7.49 6.32 7.85 6.68<br />
Potassium 2.60 7.48 2.70 1.81 5.52<br />
Silica 26.47 53.89 21.85 19.27 52.06<br />
Sodium 200 mg/m3 22.92 30.49 9.19 21.07 52.61<br />
Sulphate 250 mg/ m3 5.23 2.00 6.42 0.12 41.64<br />
Temperature 14.34 14.58 16.14 13.78 14.46<br />
Note: Groundwater is aged by analysing the quantities of tritium, chlorofl uorocarbons and sulphur fl uoride, and comparing them with the quantities that would have<br />
been in the rainfall when it fi rst entered the groundwater system.
also means that the groundwater quality measured from a well may not<br />
necessarily refl ect the land use immediately surrounding that well, as<br />
the groundwater quality may have been infl uenced by activities from<br />
much further afi eld.<br />
The <strong>Council</strong> currently undertakes monitoring of nitrates in groundwater<br />
through two state of the environment monitoring programmes and<br />
through specifi c compliance monitoring programmes associated<br />
with industrial activities. Monitoring results conclude that <strong>Taranaki</strong>’s<br />
groundwater is suitable for most uses, including human, stock or dairy<br />
use. Figure 4.36 illustrates the sites sampled and sites that have had<br />
any samples with nitrate levels that have exceeded the New Zealand<br />
drinking water standard of 11.3 mg/l. These tend to occur mainly in<br />
South <strong>Taranaki</strong> and to be intermittent in nature for the most part.<br />
From the most recent report on nitrates in shallow groundwaters in<br />
<strong>Taranaki</strong> 64 it was observed that nitrate concentrations in shallow<br />
groundwater have continued to decrease in the region with 90.5%<br />
of the 550 samples analysed lying below the 11.3 mg/l guideline for<br />
drinking water. Trend analysis performed on all the data from 2002-2007<br />
indicate that two thirds of the sampled sites showed an improvement<br />
in water quality.<br />
Figure 4.36 Results of nitrate sampling.<br />
Iron, manganese and hardness<br />
Iron and manganese occur naturally. In <strong>Taranaki</strong> it is not uncommon to<br />
encounter higher than normal levels of dissolved iron and manganese<br />
in groundwater in shallow aquifers around the ring plain. This is chiefl y<br />
due to the geological volcanic origin of the aquifers, which dissolve<br />
away small particles of their compounds over time. On the other hand,<br />
groundwater chemical composition of the deeper aquifers is generally<br />
much better than that of the shallower aquifers although it has a higher<br />
degree of hardness.<br />
Hardness is a common problem associated with groundwater from the<br />
Matemate _ aonga and Whenuakura aquifers which contain limestone and<br />
gypsum and is generally associated with the abundance of magnesium<br />
dissolved in the water. Although hard water does not pose a health risk<br />
it can be a trouble as it may cause clogging of pipes, incrustation of<br />
screens and other plumbing fi xtures.<br />
Iron bacteria or biofouling may also affect wells drilled through earth<br />
layers associated with old swamp and marsh deposits as in the Eltham<br />
area. Iron bacteria can clog wells with a gel-like slime that is natural and<br />
usually harmless but can be a nuisance as it can cause sulphide odours<br />
and corrosion of steel and iron.<br />
Pesticides<br />
Improper use of certain pesticides can result in inadvertent<br />
contamination of groundwater. In general, there is little reason for<br />
concern about pesticide residues in <strong>Taranaki</strong>’s groundwaters because<br />
there is relatively little pesticide use associated with dairy farming,<br />
the dominant land use. In some minor land uses, such as horticulture,<br />
pesticide use is likely to be higher and hence there is a greater potential<br />
for pesticide contamination of groundwater.<br />
In December 2006 the <strong>Council</strong> sampled groundwater in six selected<br />
shallow wells distributed throughout the region for pesticide residues 65 .<br />
Five out of the six wells sampled were located on properties used for<br />
commercial horticulture, while one well was located on a dairy farm. No<br />
pesticides of environmental concern were detected at any of the sites<br />
sampled.<br />
Seawater intrusion<br />
There is the potential for intrusion of saltwater into groundwater in<br />
coastal areas where rates of groundwater pumping are high enough to<br />
cause sea water to invade freshwater aquifers. However, groundwater<br />
abstraction rates in the coastal belt of <strong>Taranaki</strong> are normally low and so<br />
seawater intrusion has not been a problem yet. In the future, if demands<br />
for groundwater increase in the coastal areas, the balance between the<br />
amount of water abstracted and the rate of aquifer recharge will need to<br />
be closely monitored.<br />
How has groundwater quality<br />
changed over time?<br />
Data gathered from the state of the environment groundwater<br />
monitoring programme from 1995 to 2006 were analysed for any<br />
statistically signifi cant trends 66 . A wide range of variables are monitored.<br />
Table 4.24 illustrates that for each of the fi ve wells sampled which<br />
variables showed trends. This shows that 94% of the trends performed<br />
on the data showed either no change or measurable improvements.<br />
Only 6% of all the trends performed on the 17 parameters for the six<br />
<strong>Taranaki</strong> wells are deteriorating. This suggests that there is no indication<br />
that human activities on the land are negatively affecting the general<br />
groundwater quality of the region.<br />
64 <strong>Taranaki</strong> <strong>Regional</strong> <strong>Council</strong>. 2008. Nitrates in Shallow Groundwater in <strong>Taranaki</strong>, State of the Environment Monitoring 2002-2007. Technical Report– 2008-78.<br />
65 <strong>Taranaki</strong> <strong>Regional</strong> <strong>Council</strong>. 2008. Pesticides in Shallow Groundwater in <strong>Taranaki</strong>. Technical Report– 2007-113.<br />
66 <strong>Taranaki</strong> <strong>Regional</strong> <strong>Council</strong>. 2008. Groundwater Chemical Quality, State of the Environment Monitoring 1994-2007. Technical Report 2008-58.<br />
State of the Environment Report 2009<br />
125
126<br />
FRESH WATER<br />
Table 4.24. Statistically signifi cant trends in groundwater variables between 1995-2006.<br />
_<br />
Location: Eltham Normanby Ohawe New Plymouth Toko<br />
(D) DISCHARGES TO GROUNDWATER<br />
The <strong>Taranaki</strong> Basin has always been the main focus for hydrocarbon<br />
exploration and production in New Zealand. A great number of<br />
hydrocarbon exploration activities are undertaken within the region. Oil<br />
and gas wells are drilled up to 5,000 m into the ground. At these depths<br />
groundwater encountered is extremely saline and some of this water<br />
is brought to the surface when hydrocarbons are extracted. This saline<br />
water needs to be safely disposed of. Normally, this is accomplished by<br />
re-injecting the saline groundwater back into deep saline groundwater<br />
aquifers, a process called deep well injection. This process uses<br />
specially designed injection wells to discharge treated or untreated<br />
liquid waste into geologic formations or confi ned saline aquifers that<br />
seal contaminants off from freshwater aquifers. The receiving aquifers<br />
are themselves saline and separated from the shallower aquifers used<br />
for water supplies by thick impermeable rock layers.<br />
In <strong>Taranaki</strong>, the contaminants disposed of via deep well injection are<br />
limited to produced waters, water–based drilling fl uid waste, and<br />
contaminated well-site stormwater. The <strong>Council</strong> has approved, on<br />
special occasions, the discharge of small volumes of other specifi ed<br />
contaminants by deep well injection.<br />
TARANAKI – WHERE WE STAND<br />
4.3.2 HOW IS GROUNDWATER<br />
MANAGED?<br />
(A) REGIONAL FRESH WATER PLAN<br />
_<br />
Ohawe<br />
Aquifer: Matemate _ aonga Whenuakura Whenuakura Volcanics Matemate _ aonga Volcanics<br />
Bromide ☺ � � � � ☺<br />
Calcium ☺ ☺ ☺ � � �<br />
Chloride ☺ ☺ ☺ � � ☺<br />
Conductivity � � � � � ☺<br />
Fluoride � � � � �<br />
Iron � � � � �<br />
Bicarbonate � � � � � �<br />
Potassium ☺ ☺ � � � �<br />
Magnesium ☺ � ☺ � ☺ �<br />
Manganese ☺ � ☺ � �<br />
Sodium � � � � � ☺<br />
Ammoniacal nitrogen � � � �<br />
Nitrate � � ☺ � ☺ �<br />
pH � ☺ � � � ☺<br />
Phosphate � � � � �<br />
Silicon oxide � � � � � �<br />
Sulphate � � � � � �<br />
☺ statistically signifi cant improvement P
<strong>Council</strong> staff meeting with drillers.<br />
volume is to allow for reasonable farm and domestic water needs.<br />
The plan also sets conditions and standards for bore construction,<br />
bore location and separation. The <strong>Council</strong> maintains a database of<br />
the bores and wells in the <strong>Taranaki</strong> region. It is a requirement when<br />
drilling a well or bore that a driller’s log and bore details are forwarded<br />
to the <strong>Council</strong> so that the bore can be registered in the databases and<br />
the well can be accounted for and protected. However, getting bore<br />
completion logs from those drilling wells or bores has proven diffi cult<br />
to enforce under this permitted rule and will need amending in a future<br />
review of the plan.<br />
(B) RESOURCE CONSENT MANAGEMENT<br />
Applications for a resource consent for taking groundwater are<br />
evaluated according to <strong>Regional</strong> Fresh Water Plan policies and rules.<br />
At June 2008, there were 81 resource consents for the taking of<br />
groundwater in <strong>Taranaki</strong>.<br />
Conditions attached to a resource consent normally stipulate the<br />
volumes and rates permitted. These ensure the resource is allocated in a<br />
sound and suitable manner. Provisions for water metering are also being<br />
made in the past fi ve years for all water takes in the region.<br />
For activities such as intensive spray irrigation of effl uent waters at high<br />
loading rates, resource consents have attached more strict conditions<br />
which are closely monitored for effects on groundwater. The results of<br />
these site-specifi c monitoring programmes are reported in the <strong>Council</strong>’s<br />
annual compliance monitoring programmes.<br />
Forty two resource consents are currently held for the discharge of<br />
wastewater to groundwater by deep well injection. Resource consent<br />
conditions for deepwell injection require, amongst other technical<br />
requirements, that records of the quantities and composition of fl uids<br />
injected are kept and that they are made available to the <strong>Council</strong>.<br />
(C) GROUNDWATER MONITORING<br />
The <strong>Taranaki</strong> <strong>Regional</strong> <strong>Council</strong> has been regularly monitoring<br />
groundwater levels and groundwater quality since 1995. Groundwater<br />
quality and quantity are monitored in the province through four different<br />
<strong>Taranaki</strong> <strong>Regional</strong> <strong>Council</strong><br />
Bore drilling.<br />
programmes. These programmes vary in terms of the number of sites<br />
sampled, the sampling frequency, the sampling methods, and the<br />
parameters measured.<br />
Groundwater quality is monitored in the <strong>Taranaki</strong> region through the<br />
state of the environment programme. This includes regular monitoring of<br />
pressures on the groundwater resource, groundwater chemical quality<br />
and nitrates, herbicides and pesticides in shallow groundwater.<br />
The <strong>Council</strong> also participates in the National Groundwater Monitoring<br />
Programme which is run by the Institute of Geological and Nuclear<br />
Sciences. This programme records changes in groundwater chemistry in<br />
fi ve key indicator wells in the region. Quarterly sampling of these sites<br />
forms the basis of the <strong>Council</strong>’s groundwater state of the environment<br />
monitoring.<br />
In addition, the <strong>Council</strong> closely monitors groundwater quality at the<br />
sites where industrial effl uents are applied to land such as those from<br />
the NZMP K _ apuni lactose factory, <strong>Taranaki</strong> by-products, Riverlands<br />
meat processing-Eltham, Silver Fern Farms, and the Ballance Agri-<br />
Nutrients ammonia urea plant. The <strong>Council</strong> has established compliance<br />
programmes to monitor these activities and the potential effects that<br />
they may have on groundwater quality.<br />
In <strong>Taranaki</strong>, reliance on groundwater is likely to increase in the near<br />
future because surface water is becoming fully allocated in many<br />
catchments. The drought of 2007-08 enabled the <strong>Council</strong> to start looking<br />
at how the groundwater systems behave and respond to extreme<br />
climatic events, but more research is needed to address climatic<br />
extremes and changes.<br />
(D) INFORMATION, EDUCATION AND ADVICE<br />
<strong>Taranaki</strong> <strong>Regional</strong> <strong>Council</strong> provides information and advice for<br />
groundwater investigations and siting of bores in the region. The <strong>Council</strong><br />
has updated the groundwater database and has acquired more tools for<br />
the interpretation and mapping of data generated during groundwater<br />
exploration activities. Guidelines for drilling and for location of bores<br />
have been made available to drillers and landowners alike and to<br />
consulting companies undertaking groundwater investigations in<br />
<strong>Taranaki</strong> <strong>Regional</strong> <strong>Council</strong><br />
State of the Environment Report 2009<br />
127
128<br />
FRESH WATER<br />
K _ apuni Ammonia-Urea Plant and irrigation area.<br />
MONITORING GETS TO THE<br />
BOTTOM OF THE STORY<br />
Groundwater monitoring is the bottom line, literally and fi guratively,<br />
that helps to prevent the K _ apuni Ammonia-Urea Plant having adverse<br />
effects on the environment around it.<br />
It’s a far cry from the plant’s early days, when environmental problems<br />
became evident even as it was being commissioned in 1982. Effl uent<br />
was to be disposed of by spray irrigation on to surrounding paddocks.<br />
But the effl uent proved to be too concentrated, the irrigation area too<br />
small and, in an unforeseen consequence of the disposal process, the<br />
soil became too impervious.<br />
After one series of events, effl uent escaped and burnt surrounding<br />
grassland while also making its way into the K _ apuni Stream and<br />
killing fi sh in the 16 km stretch between the plant and the sea.<br />
As a result, the irrigation area was increased from the initial area<br />
where grass was harvested and removed, to also encompass nearby<br />
grazing land. Concurrently the soil was broken up and treated.<br />
Measures were taken to reduce the amount of ammonia and urea in<br />
the region. The <strong>Council</strong> provides advice on the importance of proper<br />
maintenance of water wells and the importance of appropriate<br />
construction of bores. These matters are important both from the<br />
perspective of investments made in such infrastructure as well as<br />
environmental consequences of poorly maintained wells.<br />
In a joint programme, the <strong>Council</strong> and the <strong>Taranaki</strong> Health Board, offer<br />
a free service to pregnant women to test domestic groundwater water<br />
supplies for nitrate contamination. Whenever the <strong>Council</strong> collects<br />
groundwater samples that exceed the drinking water standards, the<br />
owner of the well is informed and advised to engage a drinking water<br />
assessor or a Health Offi cer from the district council for advice.<br />
(E) SUMMARY OF PROGRESS<br />
Table 4.25 summarises the progress with implementing regional<br />
objectives and policies on groundwater quantity and quality.<br />
67 Aqualinc Research Limited, 2006. Snapshot of Water Allocation in New Zealand. Prepared for the Ministry for the Environment.<br />
68 Ministry for the Environment, 2007. Groundwater Quality in New Zealand State and Trends 1995–2006. Prepared by GNS Science for the Ministry for the Environment.<br />
TARANAKI – WHERE WE STAND<br />
<strong>Taranaki</strong> <strong>Regional</strong> <strong>Council</strong><br />
the effl uent produced by the plant both by recycling and air stripping.<br />
To help alleviate the problem of soil becoming impervious, disposal of<br />
the effl uent from one intermittent process was altered.<br />
Over a number of years and after a range of adjustments across the<br />
entire operation, the plant’s environmental performance was improved<br />
and it now enjoys a consistently good record.<br />
And to get to the bottom of the story, groundwater monitoring has<br />
been stepped up and there are now 42 bores on and around the site.<br />
This ensures that the <strong>Taranaki</strong> <strong>Regional</strong> <strong>Council</strong> and Ballance Agri-<br />
Nutrients, which now runs the plant, have reliable information on the<br />
legacy of those early problems, primarily the two plumes of ammonia<br />
in groundwater under the site.<br />
The more recent introduction of new technology – electro-magnetic<br />
conductivity monitoring – has offered an even more accurate picture,<br />
and also confi rmed that earlier conclusions and suggested remedial<br />
work were correct.<br />
To minimise the environmental impact, pump and treatment operations<br />
run for both ammonia plumes, with the contaminated groundwater<br />
pumped back through the plant and its waste treatment systems.<br />
Neither plume extends beyond the extent of Ballance-owned land. There<br />
is a chance that one is likely to eventually fi nd its way to tributaries of<br />
the K _ apuni Stream, but it will be considerably diluted by then.<br />
So although the groundwater’s nitrate levels remain elevated, they are<br />
not having an impact on the surrounding environment.<br />
Most of the compliance and environmental monitoring is done by<br />
Ballance, with checks by the <strong>Taranaki</strong> <strong>Regional</strong> <strong>Council</strong>. Over the<br />
course of a year the <strong>Council</strong>’s monitoring programme typically includes<br />
four site inspections and the collection of nine water samples. Ng _ a<br />
Ruahine Iwi are given regular updates.<br />
It’s been a long-running saga but one with a happier outcome than<br />
may have been expected at the height of the problems in the 1980s.<br />
4.3.3 HOW DO WE COMPARE ?<br />
Compared with other parts of New Zealand, groundwater use in <strong>Taranaki</strong><br />
is a relatively small proportion of overall water use. Table 4.26 shows the<br />
number of consented water takes from groundwater sources in <strong>Taranaki</strong><br />
compared with other regions. This shows that compared to other regions,<br />
the number of groundwater consents in <strong>Taranaki</strong> is very small. Nationally,<br />
the number of groundwater consents increased by 80% between<br />
1999 and 2006 67 . However, in <strong>Taranaki</strong>, the percentage of consented<br />
groundwater takes increased between 2003 and 2008 by 300%.<br />
Groundwater quality data from around the country has been analysed<br />
for the Ministry for the Environment 68 . This report provided an<br />
assessment of the current state and trends in groundwater quality<br />
at a national scale. Data was sourced from state of the environment<br />
monitoring undertaken by 15 regional authorities, and from the National<br />
Groundwater Monitoring Programme run by GNS Science. It was<br />
concluded that there are issues with contamination of groundwater with
Table 4.25: Summary of progress with groundwater objectives.<br />
Issue What do we want to achieve ? What are we doing about it ? Where are we at ?<br />
Adverse effects on groundwater<br />
levels and quality.<br />
• Sustainable use, development and<br />
protection of groundwater.<br />
• Maintain and enhance<br />
groundwater quality.<br />
nitrates and or microbial contamination, especially for shallow wells in<br />
unconfi ned aquifers. The health guidelines for bacterial contamination<br />
were exceeded at 20% of sites, and nitrate concentrations exceeded<br />
drinking water standards at 5% of sites. About a third of the groundwater<br />
monitoring sites samples showed some level of human impact with<br />
high nitrate concentrations. There was little or no evidence of human<br />
infl uence for 30% of sites.<br />
In the same report, trends in groundwater quality were examined.<br />
Trends were categorised according to specifi c characteristics (Table<br />
4.27). This showed that in <strong>Taranaki</strong>, and elsewhere around the country,<br />
the majority of sites fell into the category where only slow changes in<br />
variables were occurring and this was likely due to natural interactions<br />
between groundwater and rocks. Nationally, one third of sites showed<br />
rapid changes in groundwater quality and all likely to be the effect of<br />
human infl uence.<br />
Table 4.27: Percentage of monitoring sites assigned to a trend category.<br />
<strong>Council</strong> Diluting.<br />
Less salt water intrusion<br />
occurring.<br />
Degrading.<br />
Increases in minerals and<br />
nutrients probably from<br />
agricultural impact.<br />
• Implementing the <strong>Regional</strong> Fresh<br />
Water Plan.<br />
• Controlling groundwater<br />
abstraction and drilling.<br />
• Controlling discharges to land.<br />
• Monitoring groundwater levels and<br />
quality.<br />
• Providing nformation and advice<br />
on groundwater resources and<br />
drilling.<br />
• <strong>Regional</strong> Fresh Water Plan made<br />
operative in 2001.<br />
• 81 resource consents issued for<br />
groundwater use and monitored<br />
(27 in 2003).<br />
• Three-monthly monitoring of<br />
groundwater quality at six sites.<br />
• 69 sites monitored every fi ve years<br />
for nitrate concentrations .<br />
• No signifi cant pesticides or<br />
microbial contamination of<br />
groundwater or saltwater intrusion<br />
issues.<br />
• 1,550 borelogs listed (639 in 2003).<br />
Table 4.26: Number of consented ground water takes in different regions in New<br />
Zealand as at June 2008. Data from regional councils.<br />
Region Number of groundwater<br />
abstraction consents<br />
Northland 275<br />
Bay of Plenty 814<br />
Tasman 920<br />
Manawatu–Wanganui 334<br />
Marlborough 844<br />
Canterbury 2,845<br />
Otago 820<br />
Southland 705<br />
Auckland 1,422<br />
Greater Wellington 479<br />
<strong>Taranaki</strong> 81<br />
Improving.<br />
Decreases in minerals and<br />
nutrients from decreasing<br />
human impact.<br />
Water-rock interaction.<br />
No or only slow changes in<br />
most variables over time.<br />
Auckland 4.2 0 4.2 91.7<br />
Bay of Plenty* 12.3 7 15.8 63.2<br />
Southland 0 28.9 40 22.2<br />
Waikato 8.2 17.5 19.6 53.6<br />
Wellington 2.8 7 23.9 64.8<br />
Hawke’s Bay 4.0 8.0 4.0 84.0<br />
Manawatu-Wanganui 3.2 9.7 15.6 33.3<br />
Northland* 17.8 15.6 15.6 33.3<br />
<strong>Taranaki</strong> 0 14.3 0 71.4<br />
West Coast 0 12.5 0 87.5<br />
Otago 7.8 14.4 5.6 65.6<br />
Tasman* 6.3 25 6.3 62.5<br />
Gisborne 14.3 13 3.9 51.9<br />
* Regions in which trends may be biased by groundwater under marine infl uence.<br />
Data from Ministry for the Environment, 2007.<br />
State of the Environment Report 2009<br />
129
130<br />
FRESH WATER<br />
4.4 FRESHWATER<br />
<strong>BIODIVERSITY</strong><br />
4.4.1 WHAT IS THE CURRENT<br />
STATE OF FRESHWATER<br />
<strong>BIODIVERSITY</strong>?<br />
Freshwater biodiversity describes the variety of all biological life<br />
dependent on fresh water. It includes the diversity of freshwater<br />
ecosystems - streams, rivers, small wet gullies, lakes, mountain top<br />
tarns, lowland wetlands and freshwater life - micro-organisms, algae,<br />
invertebrates, fi sh and birds.<br />
Freshwater ecosystems are infl uenced by the source of the water and<br />
the underlying geology - mountain-fed rivers, spring-fed streams, hill<br />
country streams and river catchments, such as the P _ atea or the Waitara<br />
fed from both hill country and ring plain rivers. Each of these river types<br />
has a distinct biodiversity assemblage associated with them. Most<br />
catchments are relatively small (Figure 4.37).<br />
(A) INDICATORS OF FRESHWATER<br />
<strong>BIODIVERSITY</strong><br />
Indicators used for measuring and reporting on freshwater biodiversity<br />
include the extent and condition of wetlands, the number of wetlands<br />
identifi ed as regionally signifi cant, and pressures on small streams<br />
through modifi cations (such as culverting or straightening). Many<br />
native fi sh need to migrate between fresh water and the coast so the<br />
Figure 4.37 Map of parent catchments in <strong>Taranaki</strong>.<br />
69 Johnson, P, Gerbeaux, P. 2004. Wetland Types in New Zealand. Department of Conservation, Wellington, New Zealand.<br />
70 Ausseil, A; Gerbeaux, P; Chadderton, L; Stephens, T; Brown, D and Leathwick, J. 2008. Wetland Ecosystems of National Importance for Biodiversity: Criteria, methods and candidate list of nationally<br />
important inland wetlands. Prepared by Landcare Research for the Department of Conservation.<br />
71 <strong>Taranaki</strong> <strong>Regional</strong> <strong>Council</strong>. 1992. Land Drainage in <strong>Taranaki</strong>.<br />
72 <strong>Taranaki</strong> <strong>Regional</strong> <strong>Council</strong>. 1996. Wetlands in the <strong>Taranaki</strong> Region.<br />
TARANAKI – WHERE WE STAND<br />
number of structures that impede or allow fi sh passage can be used as<br />
an indicator for native fi sh biodiversity. The distribution of threatened<br />
fi sh species is an important component of freshwater biodiversity, as<br />
are trends in their population status, although this is more diffi cult to<br />
quantify. Freshwater stream invertebrates, already used earlier in this<br />
chapter to measure water quality, can also be examined in relation to<br />
biodiversity.<br />
(B) WET<strong>LAND</strong>S<br />
Wetlands, such as lagoons, estuaries, bogs, swamps, shallow lakes and<br />
farm dams, have a vital role in maintaining the health of the region’s<br />
natural environment. Wetlands are essentially wet lands – places<br />
of poor drainage, where water accumulates, sites where seepage<br />
or fl ooding is frequent, and sites at the interface between land and<br />
streams, rivers, lakes and estuaries 69 .<br />
All forms of life need water, but wetland plants and animals are adapted<br />
to cope with an oversupply of wetness, and its consequences, such<br />
as nutrient shortages and the need to ensure a supply of oxygen to<br />
underwater parts. Wetlands support a variety of biodiversity, including<br />
wildlife such as gold-striped geckos, fernbirds, spotless crake, brown<br />
mudfi sh and bittern. There is also a wide diversity of wetland types, as<br />
wetlands vary according to a whole range of variables – from the depth<br />
of water, the degree of salinity, the substrate, water regime, nutrient<br />
status and what vegetation is dominant.<br />
Tapuae wetland.<br />
Extent of wetlands in <strong>Taranaki</strong><br />
Today, wetlands in <strong>Taranaki</strong> are relatively scarce and under-represented.<br />
According to a recent national survey, it is estimated that 7.6% of<br />
<strong>Taranaki</strong>’s original wetland area remains 70 . This is more than earlier<br />
estimates, which suggested only 1.5% of the original wetland area<br />
remained with only about 0.2% outside of the Egmont National Park 71 .<br />
In 1996, the <strong>Taranaki</strong> <strong>Regional</strong> <strong>Council</strong> carried out a survey of aerial<br />
photos and identifi ed some 717 naturally formed wetlands of varying<br />
sizes, types and conditions within the region 72 . Most of these wetlands,<br />
particularly those outside public conservation areas, were small with<br />
79% of the wetlands estimated to be less than 6 ha. Furthermore, most<br />
remaining wetlands had been modifi ed, suffering some form of loss of<br />
value and condition from land use and development.<br />
<strong>Taranaki</strong> <strong>Regional</strong> <strong>Council</strong>
Table 4.28: Wetland numbers.<br />
In 2008, aerial photos taken in 2007 were used to evaluate changes<br />
in the extent of wetland coverage in the region from 1996. The grid<br />
references listed in the 1996 inventory were examined on the 2007<br />
aerial photos and the area of each wetland was calculated. Table 4.28<br />
sets out the number of wetlands found through the 1996 survey, the<br />
number that were found to have disappeared and the number found in<br />
2008, according to ecological district. The number of wetlands found<br />
in 2008 differed from that found in 1996 because: some had clearly<br />
disappeared (and this was verifi ed by checking aerial photos taken in<br />
2001), some areas originally classifi ed as estuaries were not counted<br />
(as they were not really estuaries), some errors in grid references<br />
were found, some areas had been double-counted in 1996 and some<br />
additional wetlands were located.<br />
Table 4.28 shows that of the original 717 natural wetlands identifi ed in<br />
the 1996 inventory 63 (8.8%) were confi rmed to have disappeared. The<br />
majority of wetlands that had disappeared were from the Egmont and<br />
Foxton ecological districts, areas where there is greatest pressure for<br />
land development from agriculture. The majority of these wetlands were<br />
estimated as being less than 5 ha.<br />
Ecological District TOTAL<br />
Egmont Nth <strong>Taranaki</strong> Matemate _ aonga Manawatu Plains Foxton<br />
Number of wetlands reported in the 1996 survey 289 125 187 56 50 717<br />
Number found to have disappeared by 2008 23 16 1 8 15 63<br />
Total number of wetlands found in 2008 272 107 174 45 41 639<br />
Area of wetlands found in 2008 (ha) 1,762.5 659.3 977.3 275.7 372.9 4,048<br />
Figure 4.38. Wetland extent and regionally signifi cant wetlands.<br />
The total number of wetlands, as identifi ed through aerial photographs,<br />
now sits at 639, covering an area of 4,048 ha. This estimation of the<br />
total area of wetlands in <strong>Taranaki</strong> differs from that estimated through a<br />
national analysis of satellite imagery, which concluded that 3,045 ha of<br />
wetland remains 70 . It is likely that the analysis of the aerial photographs<br />
is more accurate. The extent of wetlands, as well as those identifi ed as<br />
regionally signifi cant, is illustrated in Figure 4.38.<br />
A systematic study is proposed to compare the area of wetland between<br />
aerial photos fl own in 2001 with those fl own in 2007. This will produce<br />
a more comprehensive baseline from which to evaluate future wetland<br />
monitoring and a better assessment of the extent (in terms of area) of<br />
wetland loss.<br />
Small gully wetland (red dot) in South <strong>Taranaki</strong>, 2001.<br />
Wetland replaced by contoured paddock, 2007.<br />
<strong>Taranaki</strong> <strong>Regional</strong> <strong>Council</strong><br />
<strong>Taranaki</strong> <strong>Regional</strong> <strong>Council</strong><br />
State of the Environment Report 2009<br />
131
132<br />
FRESH WATER<br />
Table 4.29: Status of protection of regionally signifi cant wetlands identifi ed in the Fresh Water Plan.<br />
<strong>Regional</strong>ly<br />
signifi cant<br />
protected<br />
wetlands<br />
<strong>Regional</strong>ly<br />
signifi cant<br />
other<br />
wetlands<br />
Wetlands<br />
over 5 ha<br />
Wetlands<br />
with rare or<br />
uncommon<br />
species<br />
Number identifi ed in<br />
Fresh Water Plan<br />
Status and condition of regionally<br />
significant wetlands<br />
The <strong>Council</strong> has identifi ed 77 signifi cant wetlands - 48 regionally<br />
signifi cant wetlands, 18 that are signifi cant because they are over 5 ha,<br />
and 11 wetlands with rare or uncommon indigenous species. Together<br />
these wetlands cover an area of 2,811.8 ha. The change in legal status<br />
and fencing status of these wetlands is an indicator of the level of the<br />
legal and practical protection provided to these sites.<br />
TARANAKI – WHERE WE STAND<br />
Legal status in 2001 Legal status in 2007 Fencing status<br />
28 • 28 legally protected (DOC or QEII). • 28 legally protected (DOC or QEII). • 18 adequately protected from<br />
stock access with fences or<br />
natural barriers.<br />
• 10 only partially fenced or<br />
unfenced.<br />
20 • All protected from drainage<br />
through rules in plan but none<br />
with additional legal protection.<br />
18 • All protected from drainage<br />
through rules in plan but none<br />
with additional legal protection.<br />
11 • All protected through rules in plan<br />
but none with additional legal<br />
protection.<br />
Table 4.30: Wetland condition monitoring of six regionally signifi cant wetlands.<br />
• All protected from drainage<br />
through rules in plan.<br />
• 1 destroyed (owners prosecuted).<br />
• 8 fully or partially protected by<br />
QEII covenants.<br />
• 2 fully or partially protected<br />
by council memorandum of<br />
encumberance.<br />
• All protected from drainage<br />
through rules in plan.<br />
• 3 fully or partially protected by<br />
QEII covenant.<br />
• All protected through rules in<br />
plan.<br />
• 4 fully or partially legally<br />
protected by memorandum of<br />
encumberance or covenant.<br />
• 10 fully fenced.<br />
• 6 partially fenced.<br />
• 3 unfenced.<br />
• 7 adequately protected from<br />
stock access by fences or natural<br />
barriers.<br />
• 5 partially fenced.<br />
• 6 unfenced.<br />
• 5 fully fenced.<br />
• 1 partially fenced.<br />
• 5 unfenced.<br />
Thus on the whole, regionally signifi cant wetlands have been adequately<br />
protected through formal mechanisms and proactive protection works<br />
such as fencing. Additional planting has been added to some wetlands<br />
to better protect wetland values from adjacent land uses.<br />
Six <strong>Taranaki</strong> wetlands have been surveyed as part of a national wetland<br />
monitoring programme. A number of indicators are used in order to<br />
quantify the level of impact on the hydrology, on nutrient levels or soil<br />
compaction, on extent of the wetland and levels of damage from animal<br />
or plant pests. The results for those six sites are set out in Table 4.30.<br />
Indicator Indicator components Score (average of indicator components, out of total of 5)<br />
Change in hydrological<br />
integrity<br />
Change in physicochemical<br />
parameters<br />
Change in ecosystem<br />
intactness<br />
Change in browsing,<br />
predation and harvesting<br />
Change in dominance<br />
of native plants<br />
Impact of manmade<br />
structures, water table depth,<br />
dryland plant invasion.<br />
Fire damage, degree of<br />
sedimentation, nutrient<br />
levels, peat compaction.<br />
Loss in area of original<br />
wetland, connectivity.<br />
Damage by animals, predator<br />
impacts, harvesting levels.<br />
Introduced plants in canopy<br />
and understory.<br />
Barretts<br />
Lagoon<br />
Corbett<br />
Lake<br />
Lake<br />
Rotokare<br />
Mohakatino<br />
Wetland<br />
Potaema<br />
(ENP)<br />
Umutekai<br />
3.83 4 4.5 3.5 5 3<br />
4.16 4.66 4.83 4.16 5 4.33<br />
4 3.5 4.75 3.5 5 1.5<br />
4.5 4.66 5 4.5 4.83 4.16<br />
3.5 4 4 3 5 3.5<br />
TOTAL (out of 25)<br />
Data provided by Landcare Research.<br />
19.99 20.82 23.08 18.66 24.83 16.49
Daryl Gibson and Maitahi wetland.<br />
REGENERATION AND<br />
NEW GENERATION<br />
Regeneration is becoming a generation game at the Maitahi wetland<br />
near _ Okato.<br />
The wetland spans the dairy farms of Merv Hooker and Bernard<br />
and Pauline Gibson who, over a number of years, have achieved a<br />
transformation by fencing indigenous vegetation, establishing new<br />
plantings and carrying out willow control.<br />
And now the Gibson farm is passing on to the next generation – but<br />
the environmental commitment endures.<br />
“It’s been a good project to be involved in and our son, who’s taking<br />
over the farm, is keen to carry it on,” said Pauline.<br />
Merv Hooker agreed, saying it’s been gratifying to see the re-growth<br />
of the plant life along with increasing numbers of birds.<br />
The <strong>Taranaki</strong> wetlands included one surrounded by the Egmont National<br />
Park (Potaema) and one surrounded by native vegetation (Lake Rotokare).<br />
Neither of these sites showed much evidence of impacts from human<br />
activities, introduced plants or animals and so consequently obtained<br />
high overall scores. Two other sites, Barretts Lagoon and Umutekai<br />
wetland are located in rural settings, and consequently show some<br />
evidence of changes in hydrology through the invasion of some dry land<br />
plants, and impacts of weeds. These results establish a baseline from<br />
which future monitoring can be undertaken.<br />
(C) STREAMS<br />
The natural character of <strong>Taranaki</strong> ring plain streams and rivers as<br />
they fl ow from the mountain to the sea is that they meander often in<br />
deeply incised channels. This is a result of centuries of erosion, which<br />
has resulted in a stable river channel. A meandering stream includes<br />
a diverse range of habitat types – deep pools, shallow riffl e areas,<br />
areas of faster running water. Different species of fi sh have different<br />
preferences for these habitat types.<br />
73 Unpublished data.<br />
Rob Tucker<br />
“This area on our farm was regarded as waste land, and to have<br />
it fenced off to protect the plant and bird life has given myself and<br />
others great pleasure,” he said.<br />
Both properties are also protected with a Memorandum of<br />
Encumbrance on their titles, to ensure the environmental<br />
enhancement is protected long into the future.<br />
Although comparatively small at just 7.5 ha and no more than 10 m<br />
across at any one point, the Maitahi wetland is a regionally signifi cant<br />
wetland.<br />
It makes a dramatic appearance in countryside dominated by pasture<br />
lands, and contains a large variety of wetland vegetation and habitat.<br />
Plant varieties include m _ ahoe, cabbage trees, raupo, sedges and fl ax<br />
and among the birdlife are the rarely seen Australasian bittern and the<br />
spotless crake.<br />
The vegetation acts as a natural riparian fi lter for the Maitahi Stream<br />
at an important location close to the coast, where water quality is<br />
generally lower than at higher altitudes.<br />
The restoration project began in 2002 and has been assisted by a<br />
<strong>Taranaki</strong> <strong>Regional</strong> <strong>Council</strong> grant of $24,400 to help meet the costs of<br />
fencing and willow control.<br />
In 2004, young people from the Conservation Corps carried out<br />
fencing, planting and spraying work at the wetlands. “Our programme<br />
relies on projects like this to teach young people work skills,” said<br />
John Bowie of the New Plymouth YMCA, which co-ordinates the<br />
Conservation Corps.<br />
For the Gibsons and Hookers, that just adds to the positive nature of<br />
the project.<br />
Small streams can provide habitat for rare invertebrate and fi sh species,<br />
and can also play an important ecological role, such as providing<br />
spawning sites for lamprey, and refuge from large fl oods in the main<br />
stem rivers. For example, a fi sh survey undertaken in an unnamed<br />
tributary of the Waiwhakaiho River, immediately after a large fl ood,<br />
found over 50 redfi n bullies taking refuge in a 70 m reach 73 . Also<br />
recorded were three adult eels that sought shelter while migrating<br />
downstream to spawn at sea. A later survey undertaken during normal<br />
fl ows recorded a much lower fi sh abundance.<br />
Increasing intensifi cation of land use on the <strong>Taranaki</strong> ring plain continues<br />
to see pressures being placed on the natural character of small streams<br />
and rivers. Landowners, particularly in South <strong>Taranaki</strong>, are increasingly<br />
undertaking land development by realigning or straightening sections of<br />
streams, or undertaking land reclamation through piping small streams.<br />
Recontouring these areas into land for grazing increases effective<br />
production hectares.<br />
The amount of piping of small streams or stream modifi cation that<br />
has been consented over the past fi ve years is set out in Table 4.31.<br />
State of the Environment Report 2009<br />
133
134<br />
FRESH WATER<br />
Table 4.31. Number of consents issued for stream modifi cation, and extent of stream affected, over the past fi ve years.<br />
Year:<br />
(1 Nov to 30 Oct)<br />
This shows that there have been a total of 59 consents issued for the<br />
culverting of a total of 25 km of stream, and 28 consents issued for the<br />
realignment of almost 7 km of stream. Certain catchments have been<br />
particularly affected such as the recontouring of 350 m of swampy<br />
headwaters at the top of the Rawa Stream and the piping of over<br />
5,000 m of tributaries in the Taikatu catchment. This is likely to represent<br />
a small fraction of work being undertaken in the region as some land<br />
development work is a permitted activity. The <strong>Taranaki</strong> <strong>Regional</strong> <strong>Council</strong><br />
has commenced a research investigation to examine the extent and<br />
likely environmental effects of this type of activity.<br />
(D) FRESHWATER FISH<br />
<strong>Taranaki</strong> rivers and streams support a diverse range of native fi sh<br />
species as well as some introduced species such as brown trout. The<br />
most well known native fi sh are two species of eels, fi ve species of<br />
bullies, and six species of the whitebait (galaxiid) family. Other species<br />
include torrentfi sh, lamprey, common smelt, mullet and mudfi sh.<br />
A special feature of <strong>Taranaki</strong>’s native freshwater fi sh is that 15 of the<br />
18 known species are diadromous – in other words, they have a marine<br />
or estuarine stage in their lifecycle and migrate to and from the sea.<br />
While the greatest variety of native fi sh is generally found in the lowest<br />
reaches of rivers and streams, the entire stream length provides habitat<br />
for different species’ important habitats. For example, fi sh species such<br />
74 <strong>Taranaki</strong> <strong>Regional</strong> <strong>Council</strong>, 2001. Dams, Weirs and Other Barriers to Fish Passage in <strong>Taranaki</strong>.<br />
75 Leathwick, J. Julian, K. Elith, J. Rowe, D. 2008. Predicting the Distributions of Freshwater Fish Species for all New Zealand’s Rivers and Streams. Prepared by NIWA for the Department of Conservation.<br />
76 Department of Conservation, unpublished data.<br />
TARANAKI – WHERE WE STAND<br />
Culverting/piping<br />
of streams<br />
Stream realignment<br />
No. of consents Length of stream (m) No. of consents Length of stream (m)<br />
2003-04 7 1,270 1 10<br />
2004-05 8 2,618 3 480<br />
2005-06 11 4,250 5 1,080<br />
2006-07 16 10,970 4 1,440<br />
2007-08 17 6,420 15 3,807<br />
TOTAL 59 25,528 28 6,817<br />
Giant k _ okopu (Galaxias argenteus).<br />
<strong>Taranaki</strong> <strong>Regional</strong> <strong>Council</strong><br />
as inanga are more likely to be found in lowland streams that provide<br />
gentle fl owing and well-vegetated habitats (see Figure 4.39a which<br />
shows where they are predicted to be found and where they have<br />
actually been found). K _ oaro, on the other hand, prefer the cascading<br />
rocky habitats found further up the catchment and the forested cover<br />
provided by the Egmont National Park (illustrated in Figure 4.39b) 75 .<br />
Structures in waterways have the potential to impact on fi sh migration<br />
but can be modifi ed or designed in such a way as to allow fi sh to<br />
navigate over, or through them (via fi sh passes). The <strong>Taranaki</strong> <strong>Regional</strong><br />
<strong>Council</strong> created an inventory of all known structures that may affect fi sh<br />
passage and recorded information such as current use, resource consent<br />
status, ownership, effects on fi sh passage and historical values. One<br />
hundred and eight major dams, weirs and other barriers fi sh passage<br />
were identifi ed 74 .<br />
This inventory has been reviewed and changes since 2001 are set<br />
out in Table 4.32. Thirty nine structures (36%) have resource consents<br />
and either an adequate fi sh pass or do not impede fi sh passage, so<br />
no further action is required. Of the 26 consented structures requiring<br />
further action, two have been removed and eight have had fi sh passes<br />
installed or had fi sh passage improved, but still need monitoring. Of<br />
the 30 unconsented structures requiring further action, six have gained<br />
consent and four of these have had fi sh passage improved, but still need<br />
monitoring. There remain fi ve structures without resource consents<br />
that are ‘orphaned’ and have no current use and no party willing to take<br />
ownership and may therefore be removed.<br />
In total, 12 structures have had works undertaken to improve fi sh passage.<br />
Table 4.32: Dams, weirs and other barriers to fi sh passage in <strong>Taranaki</strong>.<br />
2001 2008<br />
Consented structures requiring no action 37 39<br />
Consented structures that require further action/monitoring 26 30<br />
Unconsented structures – no further action required 10 10<br />
Unconsented structures that require further action/monitoring 30 24<br />
Unconsented structures that have no owner 5 5
A storm event in the Stony (Hangatahua) and Katikara catchments at<br />
the end of April 2008 has lead to streambed changes and potentially the<br />
displacement of native fi sh from the catchments. These catchments are<br />
known to contain good populations of shortjaw k _ okopu and there is good<br />
baseline information about fi sh numbers and fi sh movements. Further<br />
monitoring of these catchments will provide valuable information on the<br />
rate at which native fi sh species are able to recolonise sites impacted by<br />
storm events.<br />
The Department of Conservation currently monitors fi ve sites within the<br />
<strong>Taranaki</strong> region for the endemic brown mudfi sh (Neochanna apoda).<br />
These fi sh are known for their ability to survive their wetlands drying<br />
up when water levels drop during the summer months, then becoming<br />
active and breeding when the water returns. Three sites have been<br />
Inanga (Galaxias maculatus).<br />
monitored since 1994 and another two since 2002. Juveniles are<br />
frequently caught at four of the sites that are monitored indicating that<br />
recruitment is occurring and therefore the populations are healthy 76 .<br />
(E) FRESHWATER INVERTEBRATES<br />
The <strong>Council</strong> uses the diversity of freshwater invertebrates to monitor<br />
water quality. This is reported on in detail in Chapter 4. The total number<br />
of species found in that monitoring also indicates where the greatest<br />
richness of freshwater invertebrates occur. The <strong>Council</strong>’s sampling<br />
methodology, being designed for water quality monitoring, does not<br />
classify all invertebrates down to the species level, so for the purposes<br />
of this discussion, the number of taxa are being used as a surrogate for<br />
species biodiversity.<br />
Figure 4.39(a): Predicted and actual distributions of inanga. Figure 4.39(b): Predicted and actual distributions of koaro.<br />
<strong>Taranaki</strong> <strong>Regional</strong> <strong>Council</strong><br />
K _ oaro (Galaxias brevipinnis).<br />
<strong>Taranaki</strong> <strong>Regional</strong> <strong>Council</strong><br />
State of the Environment Report 2009<br />
SOURCE: Leathwich et al. 2008.<br />
135
136<br />
FRESH WATER<br />
Table 4.33 shows the number of invertebrate species that have been<br />
recorded from different types of stream. For example, 137 taxa have<br />
been recorded from ring plain streams arising out of the national park,<br />
with a maximum of 40 taxa recorded from a site. The maximum number<br />
of taxa recorded from a lowland coastal stream is 28. This suggests<br />
that ring plain streams draining the National Park tend to have higher<br />
species diversity than those from lowland coastal streams, and also hill<br />
country streams, but have a similar diversity to those ring plain streams<br />
rising outside of the National Park.<br />
The number of taxa found in each of the major invertebrate groups<br />
is set out in Table 4.34. This illustrates that the most diverse<br />
Fish pass on the Waiwhakaiho weir.<br />
SOMEONE MAY NEED TO TELL<br />
THE FISH<br />
When you provide something for fi sh to use, how do they know that<br />
it’s there?<br />
The question’s not as silly as it seems and may be the nub of<br />
a puzzling absence of torrentfi sh and banded k _ okopu from the<br />
Waiwhakaiho River above the Mangorei power scheme.<br />
This is despite considerable efforts by the scheme operator and the<br />
<strong>Taranaki</strong> <strong>Regional</strong> <strong>Council</strong> to ease the passage of fi sh life over the<br />
power scheme’s weir, including improving the residual fl ow for 6 km<br />
TARANAKI – WHERE WE STAND<br />
<strong>Taranaki</strong> <strong>Regional</strong> <strong>Council</strong><br />
invertebrate class is the true fl ies (diptera) with 30 different taxa,<br />
followed by the caddisfl ies (with 27 different taxa). Whilst these<br />
results will be infl uenced in part by the number of samples collected<br />
from each habitat type, it appears that streams arising from the<br />
National Park contain the greatest diversity in terms of the number of<br />
different types of caddisfl ies, crustaceans, stone fl ies and mayfl ies.<br />
For example, there have been 37 caddisfl y taxa taxa found in <strong>Taranaki</strong>,<br />
26 of those taxa have been found at sites in streams arising from the<br />
National Park, whereas only 16 caddisfl y taxa have been found from<br />
sites in lowland coastal streams. This refl ects the different habitat<br />
types found in such streams.<br />
immediately below the weir, and the construction of an elaborate fi sh<br />
pass 10 years ago.<br />
The absence of torrentfi sh and banded k _ okopu above the weir was<br />
noted in a major survey conducted by <strong>Council</strong> staff in the summer of<br />
2006/07.<br />
The project involved night spotting and electric fi shing surveys, in<br />
which fi sh are momentarily stunned by an electrical charge applied in<br />
the waterway.<br />
The nearby Mangorei Stream, which has no weirs, was also surveyed<br />
to provide a comparison.<br />
As well as torrentfi sh and banded k _ okopu, the fi sh surveyors kept<br />
a special eye out for redfi n bully and k _ oaro. All four species require<br />
passage to and from the sea to complete their life cycle, and all thrive<br />
in habitats such as those upstream of the weir.<br />
Only redfi n bully and k _ oaro were found upstream of the weir. Longfi n<br />
eels and a solitary shortjaw k _ okopu were the other migratory species<br />
recorded.<br />
The absence of torrentfi sh was a particular concern, as they live<br />
commonly in the Mangorei Stream at an altitude higher than the<br />
Waiwhakaiho weir.<br />
The next step was to trap fi sh moving through the pass, by netting<br />
the outlet at the top. The result: redfi n bullies, one longfi n eel and one<br />
juvenile fi sh tentatively identifi ed as a k _ oaro.<br />
More monitoring will be carried out in a bid to solve this fi shy mystery.<br />
One explanation may be that due to the lack of adult fi sh and their<br />
attractant odours upstream of the weir, the species are not aware the<br />
habitat exists – despite it now being accessible via the new fi sh pass<br />
and the residual fl ow between the Meeting of the Waters and the<br />
weir intake.<br />
Whatever the problem turns out to be, efforts will continue to<br />
facilitate fi sh migration in the Waiwhakaiho and thus protect and<br />
enhance biodiversity.
Table 4.33: Number of freshwater invertebrate taxa recorded from <strong>Taranaki</strong> rivers (from reference sites only).<br />
Number of taxa<br />
recorded<br />
Maximum no. of<br />
taxa per site<br />
Median of no. of<br />
taxa per site<br />
Large east<br />
hill country<br />
Lowland<br />
coastal stream<br />
Ring plain rising<br />
in national park<br />
Ring plain rising<br />
outside national park<br />
Small (lowland)<br />
hill country<br />
111 100 138 123 118<br />
35 28 40 37 35<br />
15 16 22 22 18<br />
Table 4.34: Number of taxa found in each of the major invertebrate classes by habitat type.<br />
Large east<br />
hill country<br />
Lowland<br />
coastal stream<br />
Ring plain rising<br />
in national park<br />
Ring plain rising<br />
outside national park<br />
Small (lowland)<br />
hill country<br />
Flatworms 3 3 4 4 4 4<br />
Worms 4 3 3 2 2 4<br />
Molluscs 7 9 9 9 11 11<br />
Crustaceans 15 10 16 11 11 17<br />
Mayfl ies 13 7 15 13 10 15<br />
Stonefl ies 6 3 10 7 7 10<br />
Damsel/dragon fl ies 2 6 5 5 7 7<br />
Beetles 7 6 7 7 7 7<br />
Bugs 3 4 4 4 4 4<br />
Neuroptera 0 0 1 1 0 1<br />
Caddisfl ies 22 16 26 24 21 27<br />
True fl ies 22 25 29 27 26 30<br />
Interestingly, the largest freshwater invertebrate found, the freshwater<br />
crayfi sh or k _ oura, is more frequently found in lowland ring plain rivers<br />
that do not tend to rise in the national park, i.e. they tend to be in<br />
smaller streams. Table 4.35 shows the number of times that k _ oura have<br />
been found during the <strong>Council</strong>’s biomonitoring programmes.<br />
Table 4.35: Frequency of reference sites that koura have been recorded in <strong>Taranaki</strong>.<br />
Total number of<br />
samples<br />
Number of samples<br />
with k _ oura<br />
% of samples<br />
with k _ oura<br />
Large east<br />
hill country<br />
Lowland<br />
coastal stream<br />
Ring plain rising<br />
in national park<br />
Ring plain rising<br />
outside national park<br />
<strong>Regional</strong><br />
Total<br />
K _ oura populations are decreasing in some areas as they are affected<br />
by stream modifi cation. Predation by introduced species has also<br />
played a role, as has harvest for human consumption in some places.<br />
K _ oura are listed as a threatened species and their populations are in<br />
gradual decline.<br />
Small (lowland)<br />
hill country<br />
247 231 1,832 572 436<br />
5 23 49 143 88<br />
2 10 3 25 20<br />
State of the Environment Report 2009<br />
137
138<br />
FRESH WATER<br />
4.4.2 HOW IS FRESHWATER<br />
<strong>BIODIVERSITY</strong> MANAGED?<br />
(A) PLANS<br />
The <strong>Regional</strong> Fresh Water Plan for <strong>Taranaki</strong> contains objectives, policies<br />
and methods, including rules to address issues that relate to biodiversity<br />
such as the uses of river and lake beds, water quality and wetlands.<br />
For example, policies are included that require resource users to avoid,<br />
remedy or mitigate the adverse effects on aquatic life and habitat, other<br />
policies address issues such as regionally signifi cant wetlands.<br />
Specifi c policies require instream structures to provide for the<br />
unrestricted passage of fi sh or the installation of suitable fi sh pass<br />
facilities. When conditions of the rules cannot be met, resource consents<br />
are required and mitigation measures considered. The removal or<br />
decommissioning of unused structures is promoted unless for ecological,<br />
historical or other reasons the structure should remain.<br />
<strong>Regional</strong>ly signifi cant wetlands, those over fi ve ha and those with rare<br />
or uncommon indigenous species are protected from drainage through<br />
rules in the <strong>Regional</strong> Fresh Water Plan for <strong>Taranaki</strong>.<br />
The Department of Conservation has prepared threatened species<br />
recovery plans for mudfi sh and large galaxiids. These plans set out<br />
advocacy and management actions.<br />
(B) RESOURCE CONSENTS<br />
All resource consents for uses of river and lake beds, or for activities<br />
in regionally signifi cant wetlands, are assessed against policies in the<br />
<strong>Regional</strong> Fresh Water Plan for <strong>Taranaki</strong>. This includes an assessment of<br />
natural, ecological and amenity values, and the relationship of tangata<br />
whenua to the water body. Also considered are the costs and benefi ts of<br />
the use to the community and possible mitigation measures – including<br />
appropriate timing of the works and provision of fi sh passage.<br />
The <strong>Council</strong> is also proposing to develop guidelines for both applicants<br />
and consenting offi cers in terms of information that needs to be<br />
gathered for stream modifi cation applications (stream straightening,<br />
culverting etc.). This could include information on the amount of stream<br />
modifi cation that has already occurred in the catchment using tools such<br />
as GIS and aerial photography.<br />
(C) ENVIRONMENTAL ENHANCEMENT GRANTS<br />
Environmental enhancement grants are used by the <strong>Taranaki</strong> <strong>Regional</strong><br />
<strong>Council</strong> to promote the protection and enhancement of regionally<br />
signifi cant wetlands (and more recently other sites with regional<br />
signifi cance). The amount of money allocated from this fund over the<br />
past fi ve years is set out in Table 3.2 in Chapter 3.4 (Biodiversity on land).<br />
TARANAKI – WHERE WE STAND<br />
(D) INFORMATION, EDUCATION AND ADVICE<br />
The <strong>Council</strong> provides information, education and advice to landowners<br />
and schools through its sustainable land management and education in<br />
schools programmes. The <strong>Council</strong> has prepared guidelines on resource<br />
consent requirements regarding the construction of culverts, bridges and<br />
road culvert maintenance.<br />
Through the <strong>Council</strong>’s sustainable land management programme,<br />
landowners are provided with advice and support on riparian planting<br />
and wetland protection.<br />
The <strong>Council</strong> advocates for the protection of regionally signifi cant<br />
wetlands from threats with a particular focus on fencing, supplementary<br />
planting and covenanting of the wetlands for their long-term protection.<br />
Grants are made to land occupiers to cover the costs of enhancement<br />
and protection. There are two legal protection mechanisms available<br />
– a covenant (with either the QEII National Trust or the Department of<br />
Conservation) or a memorandum of encumbrance with the <strong>Council</strong>.<br />
(E) RESOURCE INVESTIGATIONS<br />
While stream modifi cation (stream realignment and culvert installation)<br />
carried out in small tributaries is not a new issue, the effect of these<br />
works on instream ecology has not been documented to any signifi cant<br />
extent in the rural community in <strong>Taranaki</strong>. The <strong>Council</strong> is currently<br />
undertaking a resource investigation in order to:<br />
• determine the ecological values in small tributaries in <strong>Taranaki</strong>;<br />
• assess the effects of culverting various lengths of stream on these<br />
ecological and hydrological (particularly during low fl ow) values;<br />
• determine the extent to which loss of small streams is occurring in<br />
<strong>Taranaki</strong>;<br />
• assess the effects of clearing vegetation from small streams on<br />
ecological values;<br />
• establish a method for assessing the cumulative effects of piping and<br />
realignment in a catchment and an approach to deal with this in the<br />
consenting process (i.e., a database or GIS map detailing total loss of<br />
stream reach); and<br />
• investigate and recommend appropriate mitigation measures to<br />
mitigate the loss of instream habitat.<br />
Field day on riparian planting and wetland protection.<br />
<strong>Taranaki</strong> <strong>Regional</strong> <strong>Council</strong>
(F) RESTORATION OF WET<strong>LAND</strong>S AND RIPARIAN VEGETATION<br />
Wetland and riparian planting on the Caskey property.<br />
NOT THE LAST TANGO IN TOKO<br />
They’re elusive, they’re threatened and they have elaborate courtship<br />
dances – whoever invented the tango must have taken something<br />
from their displays, says one commentator.<br />
And now New Zealand dabchicks have made their way to new<br />
wetlands established on a Toko dairy farm. Not only do these ponds<br />
and their surrounds make an excellent dance fl oor, but unwelcome<br />
visitors including stoats, ferrets, weasels and feral cats are kept at<br />
bay with an extensive trapping operation.<br />
Another visitor has been the New Zealand scaup, a diving duck<br />
described by 19th century observer Charles Edward Douglas as “a<br />
happy, chubby little bird troubled with few cares”.<br />
The appearance of these birds has been among the positive spin offs<br />
for farmers Mark and Leigh Caskey since the wetland project began<br />
in 2004.<br />
(G) MONITORING<br />
<strong>Council</strong> staff undertake a signifi cant wetland monitoring programme<br />
which includes site visits for all signifi cant wetlands, liaison with<br />
landowners, the monitoring and recording of information relating to the<br />
protection, maintenance and enhancement of the wetlands, including<br />
following up on protection works initiated. 90% of regionally signifi cant<br />
wetlands were visited in the 2006-07 year.<br />
The Department of Conservation undertakes monitoring of the presence<br />
of mudfi sh populations at fi ve sites in <strong>Taranaki</strong> and also short jaw and<br />
giant k _ okopu populations.<br />
(H) COMMUNITY BASED<br />
INFORMATION GATHERING<br />
The Environmental Monitoring and Action Project is an environmental<br />
education programme funded by the Ministry of Education. The project<br />
involves encouraging students and teachers to undertake environmental<br />
investigations and then to take some form of action for the environment.<br />
77 http://www.emap.rsnz.org/events/marchmon<br />
<strong>Taranaki</strong> <strong>Regional</strong> <strong>Council</strong><br />
Three wetland gully areas have been fenced to exclude stock and<br />
enhanced with thousands of new plants and the creation of fi ve<br />
areas of open water habitat that has attracted the dabchicks, scaups,<br />
spotless crake, pied stilt and gamebirds such as mallard ducks and even<br />
a solitary black swan. The drier sides of the gullies also provide muchneeded<br />
habitat for the threatened striped skink Oligosoma striatum.<br />
The safety of these indigenous species is enhanced by the trapping<br />
operation, which to date yielded 53 stoats, 11 ferrets, six weasels and<br />
a number of feral cats. The property is also part of a new self-help<br />
possum control programme in the Toko area.<br />
A riparian management plan is being implemented to ensure<br />
waterways are protected, and steeper land on the farm has also<br />
been retired from farming and fenced and planted. The owners say<br />
the areas in question were diffi cult, unattractive and in some cases<br />
potential death traps for stock.<br />
So with plenty of help from family and friends, and advice and<br />
assistance from the <strong>Taranaki</strong> <strong>Regional</strong> <strong>Council</strong>, the <strong>Taranaki</strong> Tree Trust,<br />
the NZ Gamebird Habitat Trust (through Fish and Game <strong>Taranaki</strong>),<br />
the Department of Conservation and the QEII National Trust, these<br />
pockets of the property have been transformed.<br />
The owners say a long-running interest in the outdoors has evolved<br />
into a concern for the environment and a commitment to make<br />
improvements. The dabchicks, scaups and other birdlife are the<br />
dividend and the efforts were also recognised with a <strong>Taranaki</strong><br />
<strong>Regional</strong> <strong>Council</strong> Environmental Award in 2007.<br />
The farm hosted an open day in February 2008 to mark World<br />
Wetlands Day.<br />
There is a national schools monitoring programme for k _ oura called<br />
‘K _ oura Kraze’ focused around the March monitoring month facilitated by<br />
the Environmental Monitoring and Action Programme 77 .<br />
K _ oura (Pararenphrops planifrons).<br />
<strong>Taranaki</strong> <strong>Regional</strong> <strong>Council</strong><br />
State of the Environment Report 2009<br />
139
140<br />
FRESH WATER<br />
(I) SUMMARY OF PROGRESS<br />
Progress on implementing regional objectives and policies on freshwater<br />
biodiversity is summarised in Table 4.36<br />
Table 4.36 Summary of Progress with implementing regional objectives and policies on freshwater biodiversity.<br />
Issue What do we want to achieve How is it measured What progress are we making<br />
Reducing threats to freshwater<br />
habitats.<br />
Adverse effects of land use activities<br />
on wetlands.<br />
Adverse effects on the environment<br />
from uses of river and lake beds.<br />
TARANAKI – WHERE WE STAND<br />
• Maintenance of the areal extent of<br />
wetlands.<br />
• An increase in the number<br />
and areal extent of regionally<br />
signifi cant wetlands that are<br />
formally protected or covenanted.<br />
• Reduced loss of natural character<br />
of wetlands and their margins.<br />
• Avoidance of modifi cation of<br />
natural character of regionally<br />
signifi cant wetlands.<br />
• Enhancement and creation of<br />
wetlands.<br />
• Avoidance or mitigation of adverse<br />
effects on the environment from<br />
uses of river and lake beds.<br />
• Provision of fi sh passage past new<br />
and existing structures.<br />
Table 4.37: Current and historic extent of freshwater wetlands per region.<br />
• Extent of wetland areas.<br />
• Number of regionally signifi cant<br />
wetlands formally protected.<br />
• Condition of regionally signifi cant<br />
wetlands.<br />
• Number of newly created or<br />
enhanced wetlands.<br />
• Number of structures that are<br />
consented or providing adequate<br />
fi sh pass provisions.<br />
• 63 small wetlands have been<br />
drained since a survey of aerial<br />
photos in 1996.<br />
• 17 regionally signifi cant wetlands<br />
have an increased level of legal<br />
protection than in 2001.<br />
• An increased number of regionally<br />
signifi cant wetlands have been<br />
fenced with additional planting.<br />
• Baseline monitoring of a selection<br />
of regionally signifi cant wetlands<br />
has been undertaken.<br />
• Some landowners are creating or<br />
enhancing wetlands.<br />
• 49 structures need no further<br />
action regarding the provision of<br />
fi sh passage or monitoring.<br />
• Over the past six years, 12<br />
structures have had works<br />
undertaken to improve fi sh<br />
passage.<br />
Region Current extent (ha) % National extent Historic extent (ha) % left<br />
North Island Northland 14,114 5.7% 258,451 5.5<br />
Auckland 2,639 1.1 57,851 4.6<br />
Waikato 28,226 11.3 356,516 7.9<br />
Bay of Plenty 3,304 1.3 43,089 7.7<br />
Manawatu 6,983 2.8 264,511 2.6<br />
<strong>Taranaki</strong> 3,045 1.2 40,278 7.6<br />
Hawke’s Bay 3,394 1.4 180,371 1.9<br />
Wellington 2, 774 1.1 122,804 2.3<br />
Total North Island 64,479 25.8 1,323,871 4.9<br />
South Island Tasman 5, 224 2.1 27,339 19.1<br />
Marlborough 1,545 0.6 12,785 12.1<br />
West Coast 84,396 33.8 358,182 23.6<br />
Canterbury 19,851 7.9 187,115 10.6<br />
Otago 27,050 10.8 110,804 24.4<br />
Southland 47,231 18.9 450,985 10.8<br />
Total South & Stewart Islands 185,297 74.2 1,147,209 16.3<br />
TOTAL 249,776 100 2,471,080 10.1<br />
Data from Ausseil et al, 2008.
4.4.3 HOW DO WE COMPARE?<br />
The total historic extent of wetlands in New Zealand has recently been<br />
estimated to have been 2.4 million ha with the current extent of wetlands<br />
estimated to be 249,776 ha, or 10% of the former extent 78 . Wetland loss<br />
has been greatest in the North Island, which now retains only 4.9% of<br />
its historic extent, with loss being greatest in the Auckland, Coromandel,<br />
East Cape, Manawatu, Hawke’s Bay, Northland and Wellington<br />
biogeographic regions. Wetland cover has survived best on the West<br />
Coast of the South Island, on Stewart Island and in the Otago region<br />
(Taieri, Clutha and Otago Peninsula). A comparison of wetland loss within<br />
regional council boundaries has been made (Table 4.37).<br />
4.5 PUBLIC ACCESS<br />
TO FRESH WATER<br />
4.5.1 WHAT IS THE STATE OF<br />
PUBLIC ACCESS TO WATERWAYS?<br />
(A) RECREATIONAL USE OF FRESH WATER<br />
There is a wide range of recreational uses of fresh water. These include<br />
traditionally popular forms of water-based recreation such as swimming,<br />
fi shing, boating and aesthetic appreciation from walking, sitting or having<br />
picnics alongside waterways. Recreational use of these resources occurs<br />
alongside, and sometimes competes, with other users for water such as<br />
agriculture and industry, community water supplies, hydroelectric power<br />
generation, the port and other infrastructure development.<br />
A water recreation survey was conducted over the 2007-08 summer<br />
period by the <strong>Taranaki</strong> <strong>Regional</strong> <strong>Council</strong>. The survey was undertaken to<br />
Table 4.38: Main reasons for visiting river or lake sites Dec 2007-Dec 2008.<br />
Trout fi shing.<br />
obtain up-to-date information on the recreational use of rivers, lakes<br />
and the coast in <strong>Taranaki</strong>, and the constraints if any for gaining access 79 .<br />
The last region-wide water recreation survey was conducted by the<br />
<strong>Council</strong>’s predecessor – the <strong>Taranaki</strong> Catchment Commission as part of<br />
the <strong>Taranaki</strong> Ring Plain Water Resources Survey in 1984.<br />
A postal questionnaire was conducted with <strong>Taranaki</strong> residents, to gain<br />
a broad indication of people’s access to, and use of, water resources.<br />
Observation counts were made at selected locations of the total number<br />
of people present at each location and what activities were being<br />
undertaken.<br />
Respondents were asked what activities they undertook while visiting<br />
identifi ed river or lake sites. These are outlined in Table 4.38. Walking,<br />
swimming and relaxing are the most popular activities at beaches and<br />
rivers. Scenic appreciation and having picnics are also popular. At rivers,<br />
fi shing and whitebaiting are popular activities. A higher percentage of<br />
people engage in passive recreation at lakes, but more people in the<br />
region go to lakes to boat and water ski rather than fi sh, jog or kayak.<br />
River activity % of respondents Lake activity % of respondents<br />
walk 47.4 walk 42.8<br />
swim 46.4 relax 38.9<br />
relax 40.3 scenic 28.3<br />
scenic 24.6 swim 25.6<br />
picnic 24.2 picnic 20.0<br />
fi sh 15.6 watch 13.3<br />
whitebait 14.7 drive 12.8<br />
watch 9.5 boat 11.7<br />
boat 8.5 waterski 9.4<br />
camp 8.5 fi sh 8.3<br />
drive 8.1 jog 8.3<br />
jog 5.2 kayak 8.3<br />
hunt 4.3 jetski 8.3<br />
waterski 3.8 camp 7.8<br />
raft 2.8 hunt 1.7<br />
kayak 2.8<br />
78 Ausseil, A; Gerbeaux, P; Chadderton, L; Stephens, T; Brown, D and Leathwick, J. 2008. Wetland Ecosystems of National Importance for Biodiversity: Criteria, methods and candidate list of nationally<br />
important inland wetlands. Prepared by Landcare Research for the Department of Conservation.<br />
79 <strong>Taranaki</strong> <strong>Regional</strong> <strong>Council</strong>, 2008. Recreational Use of Coast, Rivers and Lakes in <strong>Taranaki</strong> 2007-2008.<br />
Rob Tucker<br />
State of the Environment Report 2009<br />
141
142<br />
FRESH WATER<br />
Table 4.39: Main activities observed at 10 freshwater/estuarine locations.<br />
Location<br />
On beach/<br />
river bank<br />
sea<br />
swim<br />
The study also observed recreational use at freshwater (and coastal)<br />
sites around <strong>Taranaki</strong>. Table 4.39 illustrates the different activities<br />
observed at each of these sites, although it needs to be noted that<br />
activities observed at the various lakes were likely to be infl uenced by<br />
the closure of Lake Rotokare for the majority of the summer, as well<br />
as Lake Ratapiko and Lake Rotomanu for periods of time due to high<br />
bacteria counts. Boaters commented there was a noticeable increase in<br />
the number of boats and jetskis on other lakes over the summer period.<br />
Based on fi gures supplied by Fish and Game <strong>Taranaki</strong>, an estimated 1%<br />
of the <strong>Taranaki</strong> population hold whole-season trout fi shing licences. A<br />
2001-02 survey of angling activity carried out by Fish and Game <strong>Taranaki</strong><br />
estimated over 6,300 total angler days for the season, which was likely<br />
to be below average. In the 1994-95 survey the number of angling days<br />
was estimated at over 8,400 visits.<br />
80 Fish and Game and DOC offi cer, pers com.<br />
81 <strong>Taranaki</strong> <strong>Regional</strong> <strong>Council</strong>, 2008. Recreational Use of Coast, Rivers and Lakes in <strong>Taranaki</strong> 2007-08.<br />
82 New Plymouth District <strong>Council</strong>, 2008. New Plymouth District <strong>Council</strong> CommunitrakTM Survey February 2008.<br />
TARANAKI – WHERE WE STAND<br />
river swim fi shing<br />
sail<br />
craft<br />
power<br />
craft<br />
The New Plymouth Canoe and Kayak Club estimated they had<br />
approximately 60 active whitewater kayakers, and 80 active sea<br />
kayakers regularly frequenting the waterways and coast.<br />
Whitebaiting (from 15th August – 30th November) is a popular activity in<br />
<strong>Taranaki</strong> enjoyed by a large cross-section of the community from young<br />
children to the retired. Retired people make up a large proportion of this<br />
group and can be very passionate whitebaiters. During the 2007 season<br />
it was estimated that at peak times there were more than 50 people<br />
on the Waiwhakaiho River alone, and peak counts on one day from the<br />
Mohakatino River estuary down to the Wait _ otara River would have<br />
totalled in excess of 1,000 whitebaiters. Even small streams such as the<br />
Katikara, Timaru, and Te Henui had signifi cant use with peak counts of<br />
somewhere between 5 and 20 people 80 .<br />
The recreational use survey 81 , found 90% of respondents thought<br />
public access to such rivers and lakes was about right refl ecting similar<br />
sentiments in a New Plymouth survey of New Plymouth residents 82 .<br />
(B) PUBLIC WALKWAYS<br />
dogs other<br />
average<br />
total users<br />
Audrey Gale Park 35 17 2 9 52<br />
Burgess Park 48 3 49<br />
Lake Ratapiko<br />
Lake M<br />
28 12 3 7 6 46<br />
_ angam _ ahoe 33 1 7 36<br />
Everett Park 16 13 1 5 25<br />
Te Henui Stream 17 3 4 3 4 23<br />
Meeting of the Waters 14 9 23<br />
Lake Rotomanu 17 2 3 3 20<br />
Waingongoro River 9 3 6 6 8 19<br />
Lake Rotorangi 21 8 6 4 17<br />
Urenui River 14 6 5 2 4 16<br />
Waiwhakaiho Mouth 8 3 7 2 16<br />
Stony River 5 5 10<br />
Lake Opunake<br />
P<br />
4 4 1 1 7<br />
_ atea River, Stratford 7 2 1 2 6<br />
Wai-iti beach 4 5<br />
Lake Rotokare 6 4<br />
Whitebaiting.<br />
Rob Tucker<br />
Public access to and along rivers and lakes is often provided for by way<br />
of public roads, esplanade strips, esplanade reserves and access strips.<br />
The Department of Conservation in the <strong>Taranaki</strong> area is responsible<br />
for 300 km of actively managed track assets, of which a large number<br />
provide access to waterways. The tracks cater predominantly for the<br />
short stop travelers, day visitors and back country adventures. The track<br />
assets comprise 8 km of short walks, 2 km of barrier free short walks,<br />
43 km of walking tracks, 25 km of easy tramping tracks and 222 km of<br />
tramping tracks.
Waingongoro River sign.<br />
NO IDENTITY CRISES AT<br />
THESE STREAMS<br />
Is that bridge spanning the Ngatoroiti Stream, or the Ngatoronui? The<br />
Mangamawhete or the Mangatengehu? With more than 300 named<br />
waterways running off Mount <strong>Taranaki</strong> and scores more fl owing from<br />
the eastern hill country, there’s plenty of scope for confusion.<br />
But the four examples above, all on one rural road near Inglewood,<br />
are among 191 river and stream crossings named with <strong>Taranaki</strong><br />
<strong>Regional</strong> <strong>Council</strong> signage.<br />
The <strong>Council</strong>’s stream signage programme began on the ring plain in<br />
2002 and after its initial success it was expanded to sites further afi eld.<br />
The programme serves a number of purposes beyond identifying<br />
waterways – as important as that can be to the perplexed traveller or<br />
temporarily confused local.<br />
Besides the name of the waterway and the <strong>Taranaki</strong> <strong>Regional</strong> <strong>Council</strong><br />
logo, each sign carries an unambiguous environmental message –<br />
“protect our streams”. Signs at signifi cant trout fi sheries also carry a<br />
silhouette of an angler.<br />
The three district councils in the region are also responsible for a<br />
number of walkways in the region many of which provide public access<br />
to <strong>Taranaki</strong> waterways. The New Plymouth, Stratford and South <strong>Taranaki</strong><br />
district councils are responsible for a total of 23, 2 and 15 walkways<br />
Carrington Walkway, Stratford.<br />
83 <strong>Taranaki</strong> <strong>Regional</strong> <strong>Council</strong>, 2007. <strong>Regional</strong> Walkways and Cycleways Strategy for <strong>Taranaki</strong>.<br />
84 <strong>Taranaki</strong> <strong>Regional</strong> <strong>Council</strong>, 1996. State of the Environment, <strong>Taranaki</strong> Region 1996.<br />
Rob Tucker<br />
Rob Tucker<br />
The latter locations are decided in consultation with Fish and Game<br />
<strong>Taranaki</strong>, whose fi eld offi cer Allen Stancliff sees signifi cant benefi ts<br />
in raising public awareness of not only trout fi sheries but the<br />
environment in general.<br />
“In a place like Wiremu Road, which crosses a lot of streams coming<br />
off the mountain, I don’t think a lot of the landowners had a clear<br />
picture of which stream was which until the signs went in,” he<br />
said. “The signs have done a lot to raise awareness of the different<br />
catchments.”<br />
He says that while local anglers are likely to already be aware of the<br />
good fi shing spots, the signs denoting trout fi sheries are a good guide<br />
for visitors. “And locals who aren’t into fi shing are made aware that<br />
they have a trout fi shery in their area – so they know a little bit more<br />
about the environment they live in.”<br />
For the <strong>Council</strong>, the signs publicly highlight the fact that much of its<br />
core business lies in monitoring, protecting and enhancing freshwater<br />
quality – and the fact that the whole of <strong>Taranaki</strong> needs to play its<br />
part too.<br />
Certain criteria must be met before signs are erected. These include:<br />
• the river or stream is offi cially named (<strong>Taranaki</strong> has a large number<br />
of ‘unnamed tributaries’);<br />
• the road has regional or district strategic importance;<br />
• the river or stream has an important use or high environmental<br />
value; and<br />
• the river or stream is not on a State Highway, where bridged<br />
waterways are generally sign-posted already.<br />
Survey and maintenance of the stream signs were carried out in the<br />
summers of 2005-06 and 2007-08 and continue from time to time<br />
as necessary. The <strong>Council</strong> maintains an internal database for this<br />
purpose.<br />
respectively. Of these walkways, 20 are adjacent to rivers, streams and<br />
lakes in the region 83 (Figure 4.40).<br />
People are encouraged to access fresh water via the Stony (Hangatahua)<br />
River, the Huatoki and the Te Henui walkways, and the Carrington<br />
walkway along the P _ atea River in Stratford.<br />
It is also evident that substantial lengths of the major rivers in the inland<br />
hill country have road reserves adjacent to them 84 .<br />
Of the 10 major lakes (more than 8 ha in size) in the <strong>Taranaki</strong> region, four<br />
are either within reserves or have esplanade reserves along their shores.<br />
The region’s largest lake, Lake Rotorangi, formed by the damming of the<br />
P _ atea River for hydroelectric power generation, has a 200 ha esplanade<br />
reserve around its edge.<br />
There are very few situations where public access to and along streams,<br />
rivers and lakes is restricted because of existing structures or operations<br />
that present a potential risk to public safety. In these cases alternative<br />
access can be provided.<br />
State of the Environment Report 2009<br />
143
144<br />
FRESH WATER<br />
Figure 4.40: District council and Department of Conservation walkways that allow<br />
public access to or along rivers, streams, lakes or wetlands, or the coast.<br />
The recreational use survey 2008 85 , found only 10% of respondents had<br />
not been able to gain access to rivers, lakes or (parts of the coast) in<br />
<strong>Taranaki</strong> that they wanted to in the last year. The main reasons people<br />
could not gain access was because the access or entrance was closed,<br />
too diffi cult or too dangerous. Only 1% of respondents had been denied<br />
access by the landowner or occupier.<br />
Approximately half of the beds of rivers, streams and lakes in <strong>Taranaki</strong><br />
are in private ownership. This means that access to many rivers and<br />
lakes in the region occur largely through the goodwill and cooperation of<br />
landowners and often via the creation of esplanade strips and reserves.<br />
However, information on the number and location of esplanade reserves<br />
and strips that provide public access is limited.<br />
(C) FORMAL PUBLIC ACCESS<br />
Esplanade strips may be required by a rule in a district plan when land<br />
is subdivided or developed. Under the Resource Management Act, all<br />
subdivisions of allotments under 4 ha are required to have esplanade<br />
Table 4.40: Number and area of esplanade reserves and strips created between 2002 and 2007.<br />
85 <strong>Taranaki</strong> <strong>Regional</strong> <strong>Council</strong>, 2008. Recreational Use of Coast, Rivers and Lakes in <strong>Taranaki</strong> 2007-2008.<br />
86 Barrett Fuller and Partners, February 1992. Esplanade Reserves: The implications of the Resource Management Act for the <strong>Taranaki</strong> region. Prepared for <strong>Taranaki</strong> <strong>Regional</strong> <strong>Council</strong>, New Plymouth<br />
District <strong>Council</strong>, Stratford District <strong>Council</strong>, South <strong>Taranaki</strong> District <strong>Council</strong>.<br />
87 <strong>Taranaki</strong> <strong>Regional</strong> <strong>Council</strong>, 1996. State of the Environment, <strong>Taranaki</strong> Region 1996.<br />
88 <strong>Taranaki</strong> <strong>Regional</strong> <strong>Council</strong>, 2003. <strong>Taranaki</strong> – Our Place, Our Future. Report on the State of the Environment of the <strong>Taranaki</strong> Region.<br />
TARANAKI – WHERE WE STAND<br />
reserves of 20 m width created along the edges of any rivers and<br />
lakes or the coast. This requirement may be waived or modifi ed, by<br />
either a rule in a district plan or a resource consent. There is no default<br />
requirement for an esplanade reserve when allotments over 4 ha are<br />
subdivided. However, requirements may result from a rule in a plan.<br />
Esplanade reserves or strips can be used to provide public access to<br />
and along rivers and lakes, and therefore the number and extent of<br />
esplanade reserves and strips provide a useful indicator of the level of<br />
public access to and along rivers and lakes in the region 86 .<br />
The 1996 State of the Environment Report reported that 122 esplanade<br />
reserves and strips were created in the 13-year period between 1978 and<br />
1991 87 . This was an average of 9.4 esplanade reserves for the region each<br />
year. Most were small and concentrated in urban and semi-urban areas.<br />
The 2003 State of the Environment Report reported that in the six-year<br />
period between 1996 and 2002, 113 esplanade reserves and strips were<br />
created in <strong>Taranaki</strong> covering 111.9 ha 88 . This equates to an average of<br />
19 new esplanade reserves or strips each year and an average of 18.6<br />
ha of improved access each year in <strong>Taranaki</strong> over the six-year period.<br />
In the fi ve-year period between 2003 and 2007, an additional 105<br />
esplanade reserves and strips were created in <strong>Taranaki</strong>. This equated<br />
to an average of 21 new esplanade reserves and strips each year in<br />
<strong>Taranaki</strong> over that period.<br />
The number of esplanade reserves and strips established per district in<br />
this period is summarised in Table 4.40.<br />
Most esplanade reserves and strips established in <strong>Taranaki</strong> are adjacent<br />
to the region’s priority rivers indentifi ed by the district councils, including:<br />
the Waiwhakaiho River, Mangorei and Huatoki streams in the New<br />
Plymouth District; the Waingongoro River, P _ atea River and Kahouri<br />
Stream in the Stratford District; and the Tawhiti and Punehu streams in<br />
the South <strong>Taranaki</strong> District.<br />
(D) INFORMAL ACCESS<br />
Informal public access (i.e. where access is over privately-owned land)<br />
is also an important part of providing access to fresh water in <strong>Taranaki</strong>,<br />
although access is reliant upon the goodwill of adjacent landowners.<br />
Generally most private landowners are happy to allow people to cross their<br />
land as long as property rights are respected and permission is sought<br />
fi rst. Fish and Game <strong>Taranaki</strong> has produced a pamphlet showing access<br />
points to popular fi shing spots in the region. This information highlights the<br />
importance of getting landowner permission to cross private land.<br />
District Number of new esplanade strips and reserves created Area of new esplanade strips and reserves (ha) created<br />
New Plymouth District 94 87.2<br />
Stratford District 1 1.2<br />
South <strong>Taranaki</strong> District 10 N/A<br />
Totals 105 N/A<br />
Data: Supplied by the district councils. Information on the area of the esplanade strips and reserves is not readily available from the South <strong>Taranaki</strong> District <strong>Council</strong>.
Planting day, Herekawe Walkway, New Plymouth.<br />
EFFECTIVE PARTNERSHIP<br />
WALKS THE TALK<br />
The Herekawe Walkway project in New Plymouth demonstrates the<br />
value of effective partnerships in improving both amenity values and<br />
environmental wellbeing.<br />
In a combined effort involving the community, corporates and councils,<br />
an all-weather walkway has been formed along the Herekawe<br />
Stream from suburban Spotswood to Back Beach. The stream has<br />
been cleared of willows and weeds and bridged at two points, the<br />
quality of its waters is being protected and enhanced with 10,000<br />
new streamside plants, and 1,500 m of new riparian fencing keeps<br />
stock out.<br />
4.5.2 HOW IS PUBLIC ACCESS<br />
TO FRESH WATER MANAGED?<br />
(A) REGIONAL POLICIES AND PLANS<br />
The maintenance and enhancement of public access to and along<br />
rivers and lakes are matters of national importance under the Resource<br />
Management Act 1991.<br />
The <strong>Regional</strong> <strong>Council</strong> has limited powers to provide public access to<br />
and along streams, rivers and lake beds where the adjoining land and<br />
riverbed are privately-owned. However, the Proposed and Operative<br />
<strong>Regional</strong> Policy Statement for <strong>Taranaki</strong> and the <strong>Regional</strong> Fresh Water<br />
Plan for <strong>Taranaki</strong> contain policies encouraging district councils to<br />
provide for public access in district plans, including the creation of<br />
esplanade reserves and strips. The plans contain objectives, policies and<br />
methods to maintain and enhance public access to streams, rivers and<br />
lakes. The <strong>Regional</strong> Fresh Water Plan also contains a list of rivers and<br />
streams (Appendix IA) for which access arrangements are desirable and<br />
appropriate because of their natural, ecological and amenity values.<br />
Rob Tucker<br />
The project grew out of an initiative in 2003 by major industries<br />
operating in the Herekawe catchment – Dow AgroChemicals,<br />
Methanex and Shell Todd Oil Services – and the partnership has<br />
grown to include contractor AJ Cowley, which has donated land, and<br />
the <strong>Taranaki</strong> <strong>Regional</strong> <strong>Council</strong>, the New Plymouth District <strong>Council</strong>, the<br />
<strong>Taranaki</strong> Tree Trust and other groups.<br />
Breadth is a feature of the partnership – for example, Motorua<br />
Primary School and New Plymouth Prison are among those to have<br />
provided plants for the project, which has also involved Conservation<br />
Corps and Community Service workers.<br />
Most importantly though, enthusiastic public support has been evident<br />
on planting days and the project has the warm blessing of Ng _ ati Te<br />
Whiti hap _ u.<br />
“It’s a perfect example of people coming together with a single goal,”<br />
said the <strong>Taranaki</strong> Tree Trust Chairman, Donald McIntyre.<br />
Environmentally, the streamside planting will do much to enhance<br />
water quality, by fi ltering run-off, moderating peak fl ows, keeping<br />
water temperatures lower and promoting biodiversity.<br />
Besides the amenity benefi t of a clean and healthy stream, the<br />
walkway also offers locals an attractive and health-promoting<br />
“pathway to the sea” and a direct link to a potential future extension<br />
to New Plymouth’s popular coastal walkway.<br />
The project’s amenity value is already recognised by real estate<br />
marketers, with “proximity to the Herekawe Walkway” noted in<br />
advertisements for houses being sold in the nearby area.<br />
(B) DISTRICT COUNCILS<br />
All district plans in <strong>Taranaki</strong> provide for the creation of esplanade<br />
reserves and strips to ensure that public access to and along the<br />
region’s most important streams, rivers and lakes can be maintained and<br />
enhanced. Each district plan also retains discretion for councils to be<br />
able to waiver a requirement.<br />
The New Plymouth District Plan identifi es “preferred esplanade reserves<br />
and strips” and “priority waterbodies”, these are areas of land that<br />
would link existing public access and to which the enhancement of<br />
public access is desirable. These areas require an esplanade reserve or<br />
strip to be set aside at the time of subdivision and development.<br />
The Stratford District Plan provides for the creation of esplanade<br />
reserves (upon subdivision) and esplanade strips (as a condition of any<br />
land use consent) on land adjoining priority ring plain river catchments.<br />
These are in areas of more intensive land use.<br />
The South <strong>Taranaki</strong> District Plan has a schedule of priority rivers for<br />
protection via esplanade reserves and strips at the time of subdivision<br />
and development.<br />
State of the Environment Report 2009<br />
145
146<br />
FRESH WATER<br />
In addition, district councils also maintain roads, tracks, paths, reserves<br />
and walkways that provide public access to and along fresh water, e.g.<br />
Carrington walkway in Stratford, Huatoki and Te Henui walkways in<br />
New Plymouth.<br />
(C) REGIONAL WALKWAYS AND<br />
CYCLEWAYS STRATEGY<br />
A <strong>Regional</strong> Walkways and Cycleways Strategy for <strong>Taranaki</strong> has been<br />
developed to promote walking and cycling activities in the region,<br />
including access to fresh water 89 . The strategy lists current and potential<br />
routes that together would make up a network offering pedestrian and<br />
cycle access to the region’s natural attractions, as well as population<br />
centres. The strategy aims to recognise and promote the leisure,<br />
recreational, commuter and tourism opportunities provided by walking<br />
and cycling.<br />
(D) INFORMATION, EDUCATION AND ADVICE<br />
<strong>Regional</strong> and district councils provide information and technical advice<br />
relating to the provision of public access when requested.<br />
(E) WALKING ACCESS COMMISSION<br />
Central Government is also investigating options for establishing a<br />
New Zealand Walking Access Commission to lead and co-ordinate the<br />
provision of public access to the outdoors especially around the coast,<br />
Table 4.41: Summary of Progress with regional objectives and policies relating to public access.<br />
89 <strong>Taranaki</strong> <strong>Regional</strong> <strong>Council</strong>. 2007. <strong>Regional</strong> Walkways and Cycleways Strategy for <strong>Taranaki</strong>.<br />
TARANAKI – WHERE WE STAND<br />
and lakes, and along rivers. The Commission’s responsibilities would<br />
include the provision of information about the location of existing<br />
public access, the provision of a code of responsible conduct for the<br />
guidance of the public and landholders in respect of recreational<br />
access to the outdoors, and the facilitation and funding of negotiations<br />
for new public access across private land. The implications of these<br />
activities for the <strong>Taranaki</strong> region will be assessed in due course once<br />
the Commission commences operation.<br />
(F) SUMMARY OF PROGRESSS<br />
Progress in implementing regional objectives and policies on public<br />
access to rivers and lakes is summarised in Table 4.41.<br />
4.5.3 HOW DO WE COMPARE?<br />
New Zealanders have traditionally enjoyed good access to and along<br />
rivers and lakes throughout the country. The concept of the ‘Queen’s<br />
Chain’ (introduced to New Zealand in 1841) was designed to protect in<br />
perpetuity, a 100-foot wide strip of public land alongside waterways.<br />
However, the Queen’s Chain does not exist beside all water bodies<br />
because an increasing amount of land since the 1840s has become<br />
privately-owned. While it is often assumed that there is a right of<br />
public access to such areas for recreation and for cultural and spiritual<br />
purposes, this is not always the case, and is an issue encountered<br />
throughout New Zealand.<br />
Issue What do we want to achieve? What are we doing about it? Where are we at?<br />
Maintaining and enhancing public<br />
access to and along rivers and lakes<br />
• Increased formal public access to<br />
and along rivers and lakes.<br />
• Avoidance, remedy or mitigation<br />
of adverse effects that may arise<br />
from public access to and along<br />
rivers and lakes.<br />
• The current and Proposed <strong>Regional</strong><br />
Policy Statement, <strong>Regional</strong><br />
plans and District plans contain<br />
provisions providing for public<br />
access.<br />
• The <strong>Regional</strong> Walkways and<br />
Cycleways Strategy for <strong>Taranaki</strong><br />
was prepared in 2007 -to enhance<br />
public access to and along rivers<br />
and lake margins and to increase<br />
awareness of walkways in the<br />
region.<br />
• Advocating, when appropriate, for<br />
the establishment of public access<br />
to and along rivers, stream and<br />
lakes.<br />
• Providing information and technical<br />
assistance to those wishing to<br />
carry out activities to enhance<br />
public access to and along rivers<br />
and lakes.<br />
• 105 new esplanade reserves and<br />
strips established between 2002-<br />
2007.<br />
• On average 21 new esplanade<br />
reserves and strips established<br />
each year over the fi ve-year period,<br />
2002-2007.<br />
• No major constraints on public<br />
access have been highlighted in<br />
the past fi ve years.
Photo: Rob Tucker<br />
CHAPTER 5<br />
COASTAL AND MARINE<br />
ENVIRONMENT<br />
147
148<br />
AT A GLANCE<br />
COASTAL WATER QUALITY<br />
The high standard of water quality is principally a product of the region’s<br />
exposed coastal environment, although there have been signifi cant<br />
investments in improving discharges to the coast. The <strong>Taranaki</strong> <strong>Regional</strong><br />
<strong>Council</strong> monitors marine ecology, beach bathing water quality and<br />
compliance with resource consent conditions. In summary:<br />
<strong>Taranaki</strong>’s coastal water quality for swimming is excellent, with most<br />
popular bathing beaches complying with national bathing standards;<br />
rocky shore ecological health is reasonably stable at most sites<br />
monitored, sand inundation reduces rocky shore species diversity, but<br />
this returns to normal once the sand moves on;<br />
43 consents are held for discharges to the coast, but there are now<br />
only six major community or industrial treated wastewater discharges<br />
direct to coastal waters, compared to some 25 major discharges 30<br />
years ago;<br />
compliance monitoring shows that signifi cant improvements continue<br />
to be made in terms of waste treatment and disposal systems; and<br />
the main infl uence on coastal water quality is now rivers and streams<br />
discharging to the sea, carrying with them the cumulative effects<br />
of land uses within their catchments. This is most noticeable from<br />
catchments draining the more erodible hill country rivers.<br />
The <strong>Council</strong>’s <strong>Regional</strong> Coastal Plan, (made operative in 1997) contains<br />
policies and methods to protect the high water quality of the <strong>Taranaki</strong><br />
coast.<br />
TARANAKI – WHERE WE STAND<br />
NATURAL CHARACTER<br />
The rugged nature of the <strong>Taranaki</strong> coastal environment means much of<br />
the coastal area has retained its distinct natural character. Features that<br />
contribute to this natural character include natural coastal processes,<br />
marine life and ecosystems, coastal landscapes and seascapes, surf<br />
breaks, areas of natural vegetation, open space and farmland. <strong>Taranaki</strong><br />
has an active, high-energy coastline with natural erosion occurring at<br />
numerous points. In relation to natural character:<br />
since the <strong>Regional</strong> Coastal Plan became operative, 238 coastal<br />
consents have been granted, reviewed or varied for activities in the<br />
coastal marine area; 96 new consents have been granted since 2003;<br />
most coastal permits are for coastal protection works and stormwater<br />
structures, followed by foreshore disturbance and discharges;<br />
an estimated 11.6 km of seawall have been built to protect the region<br />
from coastal erosion; about 2 km of this have been over the last fi ve<br />
years;<br />
activities authorised by resource consent generally have negligible<br />
effects on the natural character of the coast; and<br />
foredune restoration works and sand dumping trials have been<br />
conducted to restore natural character to parts of the coast.<br />
The <strong>Council</strong>’s <strong>Regional</strong> Coastal Plan contains policies and methods to<br />
protect the natural character of the coastal marine area, and district<br />
plans contain policies and methods to protect the natural character of<br />
the landward section of the coastal environment.
<strong>BIODIVERSITY</strong><br />
The steep cliffs, rocky shores, sandy beaches, subtidal reefs, river<br />
mouths and estuaries along the <strong>Taranaki</strong> coast provide a wide range of<br />
ecological habitats for native plant and animal species. Coastal biodiversity<br />
is infl uenced by currents, the high-energy coast and the nature of the<br />
ocean fl oor substrates. Since the last state of the environment report,<br />
3,248 ha have been fully protected in two marine reserves. Monitoring<br />
of coastal and marine biodiversity is undertaken by <strong>Taranaki</strong> <strong>Regional</strong><br />
<strong>Council</strong> (estuaries and rocky shore communities), the Department of<br />
Conservation (marine protected areas and threatened marine mammals),<br />
the Ministry of Fisheries (fi sh stocks) and the Ornithological Society<br />
(birds). In summary:<br />
ecological conditions in both the Tongaporutu and Wait _ otara estuaries<br />
are generally stable although they can be affected by severe fl oods;<br />
more than 70 different bird species use the monitored estuaries;<br />
the legally protected subtidal habitats around the Sugar Loaf Islands<br />
(Ng _ a Motu) provide shelter for a greater diversity and higher numbers<br />
of fi sh and other organisms than neighbouring areas of reef;<br />
extensive reef ledges in North <strong>Taranaki</strong> support a highly diverse<br />
collection of rare and exotic sponges now protected from human<br />
activities under a marine reserve;<br />
there is a range of disparate views on trends in local fi sh stocks, and<br />
quality of recreational fi shing;<br />
a number of threatened marine animals are observed in <strong>Taranaki</strong><br />
waters, including great white sharks, orcas, humpback whales,<br />
southern right whales, and M _ aui’s dolphins; and<br />
reclusive beaked whales have been washed up on <strong>Taranaki</strong> beaches,<br />
enabling scientists to study them.<br />
Coastal and marine biodiversity is managed by a number of agencies<br />
operating under various pieces of legislation. It is safeguarded through<br />
the <strong>Regional</strong> Coastal Plan, the fi sheries quota management system, and<br />
through the setting aside of marine reserves or marine protected areas.<br />
PUBLIC ACCESS<br />
The <strong>Taranaki</strong> coastal environment offers an extensive and important<br />
recreational resource for fi shing, diving, swimming, surfi ng, windsurfing,<br />
walking, and boating. Generally, the public has very good access to<br />
most parts of the coast in <strong>Taranaki</strong>. A recent inventory of sites of local or<br />
regional signifi cance found that:<br />
58% had excellent to good public access;<br />
some sites are physically diffi cult to access due to high tides or<br />
eroding cliffs;<br />
public roads provide the greatest degree of public access to the coast;<br />
subdivision offers opportunity for public access to be increased<br />
through the provision of esplanade reserves of strips; and<br />
the biggest constraint to public access is lack of signs or formed<br />
roads, and the diffi culty of distinguishing between public and private<br />
access.<br />
Public access to the coast is primarily protected through district plans.<br />
A <strong>Regional</strong> Walkways and Cycleways Strategy has been developed<br />
to promote walking and cycling opportunities, including access to the<br />
coast, which are best illustrated by the success of the award-winning<br />
New Plymouth coastal walkway.<br />
State of the Environment Report 2009<br />
149
150<br />
COASTAL AND MARINE ENVIRONMENT<br />
<strong>Taranaki</strong>’s western coastline with Cape Egmont in the distance.<br />
OUR COASTAL AND<br />
MARINE ENVIRONMENT<br />
The <strong>Taranaki</strong> region has a long coastline<br />
with rocky shores and cliffs, sandy beaches,<br />
subtidal reefs, river mouths and estuaries.<br />
<strong>Taranaki</strong> people value the landscape, natural<br />
character and recreational amenity values of<br />
the coast. Protecting coastal water quality, the<br />
TARANAKI – WHERE WE STAND<br />
natural character of the coast and biodiversity<br />
are all considered to be very important 1 .<br />
Fitzroy Beach, Ng _ amotu Beach, Opunake Beach<br />
and the New Plymouth coastal walkway are<br />
the most frequently visited coastal locations<br />
in the region. Also popular for recreation<br />
Figure 5.1: Major point source discharges to the coast in 1975 compared to today, (excluding stormwater and dredging activities).<br />
1 Community Outcomes project Team, 2004. Future <strong>Taranaki</strong>: A report on community outcomes.<br />
2 <strong>Taranaki</strong> <strong>Regional</strong> <strong>Council</strong>, 2008. Recreational Use of Coast, Rivers and Lakes in <strong>Taranaki</strong> 2007-2008.<br />
3 Rush, M. 2006. Netting Coastal Knowledge: A report into what is known about the South <strong>Taranaki</strong>-Whanganui marine area. Published by the Department of Conservation.<br />
Rob Tucker<br />
are East End, Urenui and _ Onaero Beaches.<br />
Walking, swimming and relaxing are the most<br />
popular activities undertaken at the coast 2 .<br />
The South <strong>Taranaki</strong>-Whanganui coastline is<br />
considered by locals there to be a special area<br />
for many reasons, valued for its ruggedness,<br />
remoteness, beauty, peace, unspoilt nature and<br />
the ability to catch a wide range of fi sh 3 .<br />
<strong>Taranaki</strong>’s coast is particularly signifi cant for<br />
local iwi and hap _ u as kaitiaki or guardians of<br />
the coast. Tangata whenua are particularly<br />
concerned that kaimoana (seafood) is protected<br />
and that their cultural and spiritual values<br />
associated with the coast are maintained.<br />
These feelings are captured in the case study<br />
on the Mana Whenua Mana Moana project.<br />
The generally excellent coastal water quality<br />
found in <strong>Taranaki</strong> is the combined result of few<br />
point source discharges to the coastal marine<br />
area, improvements in waste treatment and<br />
disposal options and an exposed coastline with<br />
currents and high-energy waves. The number<br />
of coastal point source discharges in <strong>Taranaki</strong><br />
has decreased over the past 30 years from<br />
some 25 major dairy factory and industrial and<br />
municipal discharges in 1975 to just six major<br />
point source discharges today (Figure 5.1).
Furthermore, improved quality of the few remaining direct discharges is<br />
resulting in less pressure on coastal water quality overall.<br />
The main infl uence now on coastal water quality is rivers and streams<br />
that discharge to the sea, carrying with them the cumulative effects of<br />
activities within their catchments, including natural erosion materials,<br />
urban stormwater run-off, suspended sediments and agricultural and<br />
industrial wastes. Inland hillcountry rivers drain sandstone, siltstone and<br />
mudstone catchments, and discharge a naturally high load of suspended<br />
solids into coastal waters. The effects on coastal water quality are most<br />
noticeable after signifi cant rainfall. The short, steep ring plain rivers,<br />
particularly those draining eroding headwater catchments, transport<br />
considerable amounts of sediment in the form of sand, rocks and<br />
boulders to the coast.<br />
<strong>Taranaki</strong>’s natural character is made up of coastal processes, coastal<br />
landscapes and seascapes including surfbreaks. Most stretches of the<br />
coastline are untouched by signifi cant developments, although there<br />
is increasing pressure on coastal areas from urban development and<br />
subdivision which also have an expectation for protection from coastal<br />
erosion, invariably through protection structures such as sea walls.<br />
Industrial development (particularly oil and gas exploration) has also<br />
increased in the region over recent years.<br />
Figure 5.2: Some of the jurisdictional boundaries in the management of the coastal marine area.<br />
Biodiversity of the coastal and marine environment is an integral part<br />
of the coast’s natural character and is highly dependent on natural<br />
processes (e.g. sand movement is critical for sand dune ecosystems and<br />
the organisms found in them). Water quality and the nature of substrate<br />
play important roles in the maintenance of marine biodiversity. For<br />
example, seaweeds which are important nursery areas for fi sh, grow<br />
best where there is clear water.<br />
Management of the coast is under the jurisdiction of numerous agencies<br />
and legislation. There are 20 agencies with policy and operational<br />
functions relating to the management of the ocean. The key agencies<br />
are the Ministry of Fisheries, the Department of Conservation, the<br />
Ministry for the Environment, the Ministry of Transport, Maritime New<br />
Zealand, regional councils, the National Marine Co-ordination Centre<br />
and the Ministry of Economic Development. The district councils<br />
manage land use on the landward side of the sea, regional councils<br />
prepare coastal plans containing objectives, policies and rules governing<br />
activities from the mean high water spring out to 12 nautical miles, the<br />
Department of Conservation acts under legislation relating to marine<br />
reserves and marine mammals and the Ministry for Fisheries manages<br />
fi sh stocks and fi shing (Figure 5.2).<br />
State of the Environment Report 2009<br />
151
152<br />
COASTAL AND MARINE ENVIRONMENT<br />
The North <strong>Taranaki</strong> coastline has a rich cultural history and is a source of kaimoana.<br />
PEOPLE OF THE SEA 4<br />
Beware the taniwha named Rangitotohu who<br />
protects the <strong>Taranaki</strong> coastline! He snatches<br />
passers-by and draws them into his cave if<br />
they violate r _ ahui (temporary restrictions) or<br />
are disrespectful when fi shing or gathering<br />
kaimoana.<br />
That is just one of the fascinating stories<br />
woven into a recent report prepared by<br />
representatives of tangata whenua of the<br />
New Plymouth District 5 . Mana Whenua<br />
Mana Moana describes issues, opportunities<br />
and history of the relationship of iwi with the<br />
coast as part of the New Plymouth District<br />
<strong>Council</strong>’s Coastal Strategy.<br />
Developed by the Mana Whenua Reference<br />
Group, a group of representatives from<br />
iwi and hap _ u around the New Plymouth<br />
coastline, the report outlines issues and<br />
opportunities within the coastal environment<br />
that impact on the protection, enhancement<br />
and management of mana whenua<br />
aspirations and cultural values. It describes<br />
the history of mana whenua through stories<br />
about specifi c coastal areas.<br />
A cornerstone of the report is a practical<br />
description of the concept of kaitiakitanga.<br />
Kaitiakitanga was traditionally the<br />
obligation and responsibility of tangata<br />
whenua to be protectors and caretakers<br />
of natural resources, including putting in<br />
4 Tom Hunt and Jack Knuckey were kaitiaki involved in this project whose passing is acknowledged.<br />
5 Mana Whenua Reference Group, 2006. Mana Whenua Mana Moana. Position paper prepared by the Mana Whenua Reference Group. Kaitiaki o Ng _ ati Tama, Ng _ ati Mutunga, Te _ Atiawa, Ng _ a<br />
Mahanga-a-Tairi for the New Plymouth Coastal Strategy.<br />
TARANAKI – WHERE WE STAND<br />
Rob Tucker<br />
place such protection methods as r _ ahui.<br />
Today, kaitiakitanga is the responsibility<br />
to advocate and practice sustainable<br />
development. Members of the group believe<br />
that the mistakes of the past pertaining<br />
to environmental management will not be<br />
repeated if the implementation of kaitiakitanga<br />
practices becomes the basis for future<br />
sustainable management alongside existing<br />
management practices.<br />
And there have certainly been some issues in<br />
managing the natural values of the coast in<br />
the past.<br />
In 1881 Port <strong>Taranaki</strong> was constructed close to<br />
the Ng _ a Motu islands. Rock from Parit _ ut _ u was<br />
blasted away and used for the construction of<br />
the port. The shape of Moturoa was altered in<br />
the 1920s when the port authority carried out<br />
major quarrying. Extensive land reclamation<br />
around the port for the construction of the<br />
power station and Ng _ a Motu beach led to the<br />
destruction of mussel and p _ aua reefs and the<br />
original beach was drastically altered.<br />
In the 1980s, the Waitangi Tribunal released<br />
the Motunui-Waitara Report. The claim was<br />
based on the failure of the Crown to properly<br />
control discharge of sewage and industrial<br />
waste into the sea between New Plymouth<br />
and Waitara which adversely affected fi shing<br />
grounds and caused irreversible damage to a<br />
larger area of seabed on which the iwi relied<br />
on for food. As a result of this claim, the land-<br />
based treatment plant we have today was<br />
installed, protecting the coast from pollution.<br />
The coast has always provided an abundance<br />
of kaimoana and this has important cultural<br />
value. Feeding guests, and ensuring that<br />
they don’t go hungry, is one thing, but<br />
impressing visitors with an abundance of<br />
traditional foods is a symbol of tribal mana<br />
and standing.<br />
In North <strong>Taranaki</strong>, an important feature is the<br />
high papa rock cliffs. Several iwi perfected<br />
a risky fi shing technique for catching mak _ o,<br />
snapper and trevally off the ledges hewn out<br />
by nature at the bottom of these cliffs. Other<br />
sites along the coast have signifi cance to<br />
iwi as p _ atiki (fl ounder) and t _ amure (snapper)<br />
breeding grounds, while the reefs have<br />
provided iwi with a consistant supply of food<br />
resources since time immemorial: p _ aua, kina,<br />
mussels, cats eye, crabs, pipi and many other<br />
species.<br />
Coastal sites are not only signifi cant for food<br />
gathering, but also for the rich cultural history<br />
of the area – battle sites, burial sites and<br />
areas that formed part of a complex defence<br />
network for battles both before and after<br />
Europeans arrived in <strong>Taranaki</strong>.<br />
Understanding the importance of coastal<br />
sites is the fi rst step towards achieving the<br />
vision of the report: A cherished environment<br />
which through kaitiakitanga, embraces,<br />
preserves, protects and enhances the<br />
spiritual, cultural and physical values to<br />
retain the natural rhythm of river, sea and<br />
coastland for future generations.<br />
The fi rst step is for the concept of<br />
kaitiakitanga to be understood, valued and<br />
supported by local government and the wider<br />
community.<br />
If we all work in partnership to look after<br />
the coast, we might be able to achieve all of<br />
that, as well as keep the taniwha happy.
Windswept coastal environment.<br />
5.1 COASTAL<br />
WATER QUALITY<br />
5.1.1 WHAT IS THE STATE OF<br />
TARANAKI’S COASTAL WATER?<br />
<strong>Taranaki</strong> coastal water quality is infl uenced by the exposed coast,<br />
high-energy wave environment, numerous discharges from rivers as they<br />
enter the sea, and a few direct discharges from point sources.<br />
(A) INDICATORS<br />
Indicators used to assess the ecological health and water quality<br />
of <strong>Taranaki</strong>’s coastal water include the diversity of rocky shore<br />
invertebrates, levels of bacterial contamination (important for assessing<br />
beach bathing water quality), distribution of kelp (which requires both<br />
the appropriate substrate type and water quality) and levels of bacteria<br />
in shellfi sh tissue.<br />
The diversity of rocky shore invertebrates is an indicator of rocky shore<br />
ecological health, however the composition of these communities is<br />
determined by more than just water quality: the high-energy nature of<br />
the <strong>Taranaki</strong> coast, abrasive and turbulent shoreline conditions, high<br />
water turbidity, suspended silt, sand inundation, nature of the substrate,<br />
and proximity to large rivers, all infl uence the make up of rocky shore<br />
communities.<br />
Nutrients or sediment levels are not monitored in coastal or estuarine<br />
waters.<br />
(B) ROCKY SHORE MARINE<br />
ECOLOGICAL QUALITY<br />
Rocky shore sites around the <strong>Taranaki</strong> coastline are monitored twice a<br />
year for state of the environment monitoring (Figure 5.3). A number of<br />
other reef sites are included in compliance monitoring programmes.<br />
The ecological health indices used are species richness (the number<br />
of species recorded) and the Shannon-Weiner index (a measure of<br />
diversity that incorporates both the number of species and their relative<br />
densities). Results from monitoring of these sites over a number of years<br />
show only minor variations in ecological health over time (Figure 5.4).<br />
Large and sudden dips in species diversity, such as occurred at Waihi in<br />
March 2004, at the Mangati site in 2007 and at Orapa B in 2002 were all<br />
attributed to natural sand inundation. Interestingly, species diversity at<br />
each of these sites was quickly restored when the sand moved on.<br />
The Waihi Reef site in South <strong>Taranaki</strong> has generally had a lower level of<br />
diversity compared with the other control sites along the North <strong>Taranaki</strong><br />
coastline. The South <strong>Taranaki</strong> coastline may have a relatively lower level<br />
of diversity than further north because of higher levels of wave exposure<br />
and possibly higher levels of cliff erosion depositing fi ne sediments on<br />
the reefs. In general, both the Greenwood and Manihi Road sites have<br />
the highest numbers of species and levels of diversity.<br />
Long-term trend analysis was undertaken on data collected at each site<br />
(between 13 and 30 surveys). The results mostly indicated no signifi cant<br />
long-term trends for either species richness or diversity. However,<br />
summer diversity at Turangi Road, and summer and spring diversity at<br />
Orapa B showed signifi cant negative trends, even when the samples<br />
affected by sand inundation were removed from the analysis 6 . Reasons<br />
for these trends are unknown, and may have been largely due to some<br />
higher species numbers recorded in the late 1990s, which may in turn<br />
have been the result of settled weather patterns.<br />
6 <strong>Taranaki</strong> <strong>Regional</strong> <strong>Council</strong>, 2008. State of the Environment Monitoring Hard-shore and Soft-shore Marine Ecological Programmes 2007-2008. Technical Report 08-07.<br />
Rob Tucker<br />
Intertidal survey of Kawaroa reef, New Plymouth.<br />
<strong>Taranaki</strong> <strong>Regional</strong> <strong>Council</strong><br />
State of the Environment Report 2009<br />
153
154<br />
COASTAL AND MARINE ENVIRONMENT<br />
(a) Waihi reef<br />
(b) Mangati Road<br />
Figure 5.3: Rocky shore state of the environment monitoring sites and results.<br />
TARANAKI – WHERE WE STAND<br />
(c) Manihi reef<br />
(d) Orapa B reef<br />
(e) Greenwood Road<br />
(f) Turangi Road
Fitzroy Beach, New Plymouth.<br />
(C) BEACH BATHING WATER QUALITY<br />
Water quality for swimming has been monitored at popular swimming<br />
beaches since 1995. Water quality of bathing beaches is assessed<br />
against the national marine bathing guidelines 7 . The guidelines use the<br />
bacterial concentration of enterococci as a measure of the risk of water<br />
users contracting gastrointestinal and respiratory illnesses. Enterococci<br />
are faecal bacteria which indicate the possible presence of diseasecausing<br />
organisms. Following the monitoring, the water quality at each<br />
beach is categorised into one of three categories: ‘Acceptable’ (safe),<br />
‘Alert’ (potentially unsafe) or ‘Action’ (likely to be unsafe). Results are<br />
posted for the public on the <strong>Taranaki</strong> <strong>Regional</strong> <strong>Council</strong> website (www.<br />
trc.govt.nz) as soon as they become available. Immediate action is taken<br />
when water quality guidelines are exceeded to ascertain the cause and<br />
to notify the appropriate health authority.<br />
Seven popular beaches are monitored every year (Figure 5.5). An<br />
additional 10 beaches are monitored every third year on a rotational<br />
basis 8 . The beaches included in the <strong>Council</strong>’s monitoring programme<br />
featured among the most popular for recreational activities in the recent<br />
survey of recreational use of the coast 9 .<br />
The frequency of samples falling within the guideline categories is<br />
illustrated for each of the seven sites for the past six summers in Figure<br />
5.4. To determine if coastal water meets the national guidelines, at least<br />
20 samples must be collected during the bathing season, in any weather.<br />
The <strong>Council</strong>’s state of the environment programme, on the other hand,<br />
collects only 13 samples per year, and does not sample within three<br />
days of high river fl ows. Therefore the <strong>Council</strong> collects a further seven<br />
all-weather samples at the four most popular bathing sites. The graphs<br />
of these four beaches have a total of 20 samples, while the other three<br />
beaches have only had 13 samples taken each year.<br />
The high quality of <strong>Taranaki</strong>’s coastal water quality can be gauged by the<br />
vast majority of samples for most of the sites tending to fall within the<br />
safe swimming guidelines. Over the past six years, 100% of the samples<br />
collected from Opunake Beach met the safe bathing water guidelines.<br />
The only beach to have ever had samples in the action category was<br />
_<br />
Ohawe. Sites that have on occasions exceeded the safe swimming<br />
guidelines tend to be close to rivers (which carry faecal matter from the<br />
land down to the coast). For example, the site at _ O _ akura Beach at the<br />
surf club exceeds the safe swimming guidelines more often than the<br />
site a few hundred metres south at the campground. This is because the<br />
Waimoku Stream (a stream which frequently exceeds the freshwater<br />
safe swimming guidelines largely due to birdlife) discharges to the south<br />
of the surf club and the prevailing south-west fl ow brings bacteria to this<br />
monitoring site.<br />
Coastal beaches generally have lower background levels of bacteria<br />
than river or lake swimming spots. This is largely due to contaminants<br />
being more rapidly diluted and dispersed by currents and the large<br />
volumes of water at the coast 10 .<br />
Several factors may cause variations in coastal water quality from<br />
year to year. The proportion of all samples taken each summer that<br />
meet beach bathing guidelines is illustrated in Figure 5.6. During wet<br />
summers, more faecal matter is carried from the land into rivers and<br />
streams and out to the coast. The <strong>Council</strong>’s monitoring programme<br />
has been designed to avoid these effects by not sampling within three<br />
days of high river fl ows and so the results are more conservative than if<br />
sampling was random.<br />
7 Ministry for the Environment and Ministry of Health, 2003. Microbiological Water Quality Guidelines for Marine and Freshwater Recreational Areas.<br />
8 <strong>Taranaki</strong> <strong>Regional</strong> <strong>Council</strong>, 1998, 2000, 2007, 2008. Bathing Beach Water Quality State of the Environment Monitoring Report. Technical Reports 90-09, 00-03, 07-13. 07-17, 07-18, 07-19, 07-20,<br />
08-01<br />
9 <strong>Taranaki</strong> <strong>Regional</strong> <strong>Council</strong>, 2008. Recreational Use of Coast, Rivers and Lakes in <strong>Taranaki</strong> 2007-08.<br />
10 Ministry for the Environment. 2007. Environment New Zealand 2007.<br />
Rob Tucker<br />
State of the Environment Report 2009<br />
155
156<br />
COASTAL AND MARINE ENVIRONMENT<br />
(a) _ Onaero<br />
(b) Fitzroy<br />
Figure 5.4: Beaches monitored for bathing water quality and results for the past<br />
six summers.<br />
TARANAKI – WHERE WE STAND<br />
(c) Ng _ amotu<br />
(d) _ Ohawe<br />
(e) _ O _ akura at surfclub<br />
(f) _ O _ akura campground<br />
(g) Opunake
Table 5.1: Annual seasonal medians at the seven most popular <strong>Taranaki</strong> beaches (enterococci/100ml) for the past fi ve years.<br />
Site<br />
_<br />
Onaero Fitzroy Ng _ amotu<br />
_<br />
O _ akura surfclub<br />
_<br />
O _ akura camp Opunake<br />
2003-04 5 3 5 8 3 1 29<br />
2004-05 15 4 14 25 6 1 23<br />
2005-06 4 6 13 12 1 2 13<br />
2006-07 7 3 12 11 3 1 7<br />
2007-08 4 3 4 32 1 1 5<br />
Figure 5.5: Proportion of all samples collected each year meeting guidelines.<br />
While it is the frequency of individual samples that is most important<br />
in terms of measuring compliance with guidelines, the median (or<br />
middle) value provides an indication of the absolute levels of bacterial<br />
contamination. Table 5.1 summarises the results of monitoring bacteria<br />
levels at the seven most popular <strong>Taranaki</strong> beaches using just the 13<br />
samples collected as part of the <strong>Council</strong>’s state of the environment<br />
monitoring programme. This illustrates that the seasonal median<br />
for all seven beaches was very low, particularly for Opunake, _ O _ akura<br />
campground and Fitzroy.<br />
Looking at the data over time, the good news is that no sites show a<br />
measurable deterioration in water quality. Fitzroy Beach, one of the<br />
region’s most popular, showed a statistically signifi cant improvement,<br />
although this trend is not that meaningful as water quality is already high.<br />
Three <strong>Taranaki</strong> beaches, _ O _ akura, East End and Fitzroy, gained and held<br />
Blue Flag accreditation for the summer period. This is an internationally<br />
One of <strong>Taranaki</strong>’s renowned surf breaks.<br />
_<br />
Ohawe<br />
recognised award for beaches that meet the four criteria of high<br />
standards for water quality, environmental education and information,<br />
environmental management and safety and services. These were the<br />
fi rst beaches in Australasia to obtain Blue Flag accreditation.<br />
(D) COASTAL WATER QUALITY<br />
Coastal water quality is highly infl uenced by the nature of water<br />
entering the coastal area through rivers. Rivers towards the north and<br />
south of the region are more sediment-laden as a consequence of<br />
draining more erodible catchments. A recent research project 11 was<br />
undertaken on the ecology of the sea fl oor around North <strong>Taranaki</strong> with a<br />
specifi c focus on the distribution of the brown kelp, Ecklonia radiata (see<br />
case study). The physical environmental factors quantifi ed by the study<br />
included substrate, habitat complexity, wave energy, water turbidity and<br />
depth. These parameters were used to describe geographic trends and<br />
to investigate why Ecklonia was distributed where it was.<br />
The research concluded that water turbidity is the primary factor that<br />
defi nes the Ecklonia distribution in <strong>Taranaki</strong>, although the wave energy<br />
and habitat complexity (such as the nature of the substrate) of the reef<br />
were also infl uential. Ecklonia was more abundant around Cape Egmont,<br />
with density and abundance decreasing along the coast towards<br />
Motunui in the north-east. The research found that wave action has the<br />
potential to limit the size and abundance of Ecklonia in shallow waters,<br />
but that water turbidity, or clarity, reduces the depth range that the kelp<br />
can occupy. The direct effect of fi ne sediments from rivers was thought<br />
to be the main limiting factor for kelp colonisation on the north-eastern<br />
reefs, particularly near the Waitara River.<br />
Timaru Stream estuary.<br />
11 Crofskey, E. 2007. The Distribution of Ecklonia radiata Around the North <strong>Taranaki</strong> Headland and its Relationship with Key Physical Characteristics. University of Auckland, MSc thesis.<br />
Rob Tucker<br />
Rob Tucker<br />
State of the Environment Report 2009<br />
157
158<br />
COASTAL AND MARINE ENVIRONMENT<br />
Surveying the sea fl oor.<br />
EMMA GETS HELP WITH THE KELP<br />
If it takes a village to raise a child, it takes a region to raise a marine<br />
scientist.<br />
When Inglewood-raised, Fitzroy surf lifesaver Emma Crofskey came<br />
to choose a research project in 2006 for her University of Auckland<br />
master’s degree in marine science, there was no question where it<br />
would be – off the coast of <strong>Taranaki</strong>.<br />
“I love the coast and the <strong>Taranaki</strong> coastline is so rugged and beautiful,<br />
it was a great excuse to get out there and explore it in more detail,”<br />
she said.<br />
(E) SHELLFISH TISSUE QUALITY<br />
The <strong>Council</strong> monitors bacteria in shellfi sh collected along the H _ awera<br />
coast in relation to Fonterra and H _ awera waste discharges. There has<br />
been no measurable change in bacteria numbers in shellfi sh tissue at<br />
sites adjacent to the Fonterra outfall, and no increases of bacterial levels<br />
since the H _ awera wastewater discharge was added. Some individual<br />
samples have exceeded the guideline limit, probably due to wet weather<br />
when bacteria numbers in the coastal sea water increase due to the<br />
run-off from many small coastal streams and the nearby T _ angahoe<br />
River catchment 12 . However, median levels have been well within the<br />
acceptable guidelines.<br />
Metals are tested in shellfi sh in compliance monitoring programmes.<br />
For example, shellfi sh are sampled from a few reefs around the New<br />
Plymouth wastewater treatment discharge every second year. Only low<br />
levels of metals around the coast have been found and generally levels<br />
12 <strong>Taranaki</strong> <strong>Regional</strong> <strong>Council</strong>, 2008. South <strong>Taranaki</strong> District <strong>Council</strong> Hawera Municipal Oxidation Ponds System Monitoring Report. Technical Report 2007-93.<br />
13 <strong>Taranaki</strong> <strong>Regional</strong> <strong>Council</strong>, 2008. New Plymouth District <strong>Council</strong> New Plymouth Wastewater Treatment Plant Marine Outfall and Sludge Lagoon Monitoring Programme Annual Report 2007-2008.<br />
Technical Report 2008-11.<br />
14 Rush, M. 2006. Netting Coastal Knowledge: A report into what is known about the South <strong>Taranaki</strong>-Whanganui marine area. Published by the Department of Conservation, Wanganui.<br />
15 <strong>Taranaki</strong> Public Health Offi cer, pers comm.<br />
TARANAKI – WHERE WE STAND<br />
Lindsay Wright<br />
And her home region embraced and supported its daughter. The local<br />
offi ce of the Department of Conservation offered her a summer job,<br />
the use of a boat and skipper and a specially designed camera she<br />
could use for her study of kelp distribution along 60 km of the North<br />
<strong>Taranaki</strong> coastline.<br />
Also weighing in with support were the George Mason Trust, the<br />
<strong>Taranaki</strong> <strong>Regional</strong> <strong>Council</strong> and marine consultancy ASR Limited.<br />
The study involved dropping the 2 kg camera over the side of the boat<br />
almost 1,000 times, with Emma using a video recorder to intensively<br />
study the images she captured. “The project involved many hours<br />
out on the water, which was really enjoyable,” she said. “The only<br />
frustration was having to wait for long periods when the weather<br />
wasn’t suitable.”<br />
Emma said that the kelp is a good indicator of the state of the<br />
undersea reefs along the coast. “The more we know about the sea,<br />
the better the decisions we can make to safeguard it,” she said.<br />
The highest densities of kelp plants were found around Cape Egmont,<br />
although there weren’t the vast kelp beds that she had expected. One<br />
of the study’s conclusions is that kelp distribution is affected by water<br />
clarity, depth and wave velocity. The clearer waters at the Cape allowed<br />
for higher densities of kelp plants to grow, however the more vigorous<br />
wave action was detrimental to kelp growth at shallow depths.<br />
The increase in cloudy water around the coast towards Waitara<br />
obstructed the sunlight reaching the seabed making it less attractive<br />
for kelp, which survives on photosynthesis.<br />
Little is known about the subtidal ecology of North <strong>Taranaki</strong>. Earlier<br />
studies have found the area to be generally species-poor, often<br />
attributed to intensive wave action, high silt load from the region’s<br />
rivers coupled with higher than average rainfall, and eroding<br />
sandstone cliffs.<br />
in sites potentially affected by the discharge are as low as other sites 13 .<br />
Slight increases in zinc concentrations have been detected from both<br />
South and North <strong>Taranaki</strong>, but not at levels of concern.<br />
The New Zealand Food Safety Authority runs a programme to test<br />
shellfi sh and water samples from around the New Zealand coastline<br />
every fortnight to make sure that shellfi sh are not contaminated with<br />
marine biotoxins from toxic algal blooms. Samples of shellfi sh are<br />
collected from three sites around <strong>Taranaki</strong> at _ Ohawe, _ O _ akura and<br />
Mohakatino. Public warnings are issued when shellfi sh are not safe to<br />
eat, and sections of the coast are closed for shellfi sh gathering. Closures<br />
have been put in place over the summer of 2000, 2001, between<br />
September and December 2003 14 , once in 2006-07 and once in 2007-<br />
08 15 . Reasons for algal blooms that led to these closures are unknown –<br />
they could be natural or related to water quality issues within the region<br />
or beyond it.
South <strong>Taranaki</strong> coast from _ Ohawe.<br />
5.1.2 HOW IS COASTAL WATER<br />
QUALITY MANAGED?<br />
(A) REGIONAL PLANS<br />
The <strong>Regional</strong> Coastal Plan for <strong>Taranaki</strong> gives the <strong>Council</strong> statutory<br />
responsibility for maintaining and enhancing the quality of coastal water.<br />
The plan contains policies and methods (including rules) for controlling<br />
waste discharges direct into coastal waters so that:<br />
contact recreation, shellfi sh gathering and fi shing in <strong>Taranaki</strong>’s coastal<br />
waters are not affected;<br />
marine ecosystems, particularly estuarine and intertidal areas, are<br />
maintained;<br />
accidental spills are minimised and clean-up operations are effective<br />
if spills occur; and<br />
the relationship of tangata whenua with the coastal environment,<br />
particularly the importance of the coast for gathering kaimoana and<br />
protecting w _ ahi tapu sites, is recognised.<br />
The plan became operative on 1 October 1997. An interim review of the<br />
plan completed in 2002 found that the plan is effective and is achieving<br />
its purpose. A full review of the plan commenced in 2008.<br />
The <strong>Regional</strong> Fresh Water Plan for <strong>Taranaki</strong> addresses the improvement<br />
of inland water quality, which ultimately affects the quality of water<br />
discharged into coastal waters. Signifi cant parts of the plan deal with<br />
the control of discharges to rivers and streams. It also addresses the<br />
effects of run-off into rivers from agricultural land by promoting activities<br />
such as stream bank riparian planting.<br />
(B) RESOURCE CONSENT MANAGEMENT<br />
Direct discharges to the sea are managed and controlled through the<br />
resource consent process. This constitutes a large component of the<br />
<strong>Council</strong>’s effort to implement the <strong>Regional</strong> Coastal Plan. Processing<br />
Rob Tucker<br />
Ensco offshore drilling rig and supply vessel.<br />
resource consents involves thorough investigations before consent is<br />
granted, consultations with affected parties (including iwi and hap _ u) and<br />
the identifi cation of any special conditions that may need to be attached<br />
to a consent. Where appropriate, the <strong>Council</strong> involves iwi or hap _ u in the<br />
design and/or delivery of monitoring programmes to ensure compliance<br />
with consent conditions. Spill contingency planning is now a compulsory<br />
component of a discharge consent and is intended to reduce the impacts<br />
of an accidental spill into the coastal marine area.<br />
There are currently six major discharges to the coastal marine area: The<br />
New Plymouth wastewater treatment plant discharges highly-treated<br />
effl uent offshore. Effl uent from Waitara is scheduled to be put through<br />
to the New Plymouth plant for a higher level of treatment by 2010. The<br />
H _ awera municipal and Fonterra Whareroa wastes are now combined<br />
and discharged though a long ocean outfall. There are small municipal<br />
discharges from Opunake, Manaia and P _ atea.<br />
There are currently 43 consents for discharges to the coastal marine<br />
area. These include the major discharges described above and<br />
discharges from stormwater or activities like dredging (Figure 5.6).<br />
Figure 5.6: Discharges to the coastal marine area by type.<br />
Rob Tucker<br />
State of the Environment Report 2009<br />
159
160<br />
COASTAL AND MARINE ENVIRONMENT<br />
Figure 5.7: Number of coastal unauthorised incidents compared to the total<br />
number of incidents between 2001-02 and 2007-08.<br />
(C) UNAUTHORISED INCIDENTS<br />
The number of unauthorised incidents on the coast is also low, with<br />
coastal-related incidents making up only a very small proportion of the<br />
total number of unauthorised incidents that the <strong>Council</strong> responds to<br />
(Figure 5.7). In 2007-08, 17 incidents, 3.1% of all unauthorised incidents<br />
reported to the <strong>Council</strong>, were in the coastal marine area. A number of<br />
reported incidents each year, such as foams on beaches, are natural<br />
events. These are generally those classifi ed as ‘unknown’. Whilst the<br />
number of unauthorised incidents on the coast is low, the potential<br />
for a signifi cant impact from a single event, such as an oil spill, can be<br />
signifi cant (see the case study on the _ Okato oil spill incident).<br />
(D) MONITORING<br />
The <strong>Council</strong> has undertaken state of the environment monitoring in the<br />
coastal marine area since 1995. This involves monitoring bathing beach<br />
water quality and ecology of rocky reefs (described above) and ecology<br />
of estuaries (described in section 5.3). The monitoring programmes are<br />
designed to monitor progress against the objectives and desired results<br />
of the <strong>Regional</strong> Coastal Plan.<br />
Ng – ati Ruanui representative assisting with intertidal survey, South <strong>Taranaki</strong>.<br />
TARANAKI – WHERE WE STAND<br />
<strong>Taranaki</strong> <strong>Regional</strong> <strong>Council</strong><br />
The <strong>Council</strong> also undertakes monitoring of resource consents. The<br />
number of monitoring programmes carried out in 2007-08 with a coastal<br />
water quality component is set out in Table 5.2.<br />
Table 5.2: Monitoring programmes with a coastal water quality component in<br />
2007-08<br />
Activity/Industry Number of programmes<br />
Municipal sewage 5<br />
Beach motor camps 4<br />
Petrochemical 1<br />
Dairy processing 1<br />
Coastal structures 2<br />
Recreational 1<br />
General industrial 6<br />
Monitoring of the discharge of wastewater from Fonterra shows<br />
a marked improvement in the marine ecology in the vicinity of the<br />
discharge point since this discharge was discharged offshore through<br />
the long ocean outfall 16 . Monitoring in the vicinity of the New Plymouth<br />
and Waitara wastewater outfalls does not show any signifi cant adverse<br />
environmental effects arising from the discharges 17,18 . Discharges<br />
associated with the Opunake, P _ atea and Manaia wastewater treatment<br />
systems are also monitored, as are discharges from beach camps at<br />
Waiiti, Urenui, _ Onaero and Waiinu, with no signifi cant effects detected.<br />
(E) MARINE POLLUTION REGULATIONS<br />
The Resource Management Act (Marine Pollution) Regulations 1998 are<br />
the responsibility of the Ministry for the Environment and are enforced<br />
by regional councils. These regulations deal with the dumping and<br />
incineration of waste and the discharge of sewage, garbage, ballast<br />
water and other wastes from ships and offshore installations.<br />
(F) OIL SPILL PLANNING AND RESPONSE<br />
Oil spill planning and response operates at two tiers. Tier I contingency<br />
plans are developed by individual companies or operators and set out<br />
the response to small spills, such as one developed by Port <strong>Taranaki</strong>.<br />
Tier II contingency plans, are usually developed by a regional body<br />
such as the <strong>Council</strong>, and set out the response to large spills beyond the<br />
ability of a company or operator to contain. The <strong>Council</strong>’s tier II response<br />
plan, the Marine Oil Spill Response Plan for <strong>Taranaki</strong> 19 , has been<br />
recently reviewed and approved. The objective of the plan is to safely<br />
mitigate the effects of a marine oil spill and, if possible, assist with the<br />
restoration of oil damaged environments.<br />
(G) SUMMARY OF PROGRESS<br />
Progress implementing regional objectives and policies on coastal water<br />
quality is summarised in Table 5.3.<br />
16 <strong>Taranaki</strong> <strong>Regional</strong> <strong>Council</strong>, 2008. Fonterra Whareroa Compliance Monitoring Programme Annual Report 2007-2008. Technical Report 2008-39.<br />
17 <strong>Taranaki</strong> <strong>Regional</strong> <strong>Council</strong>, 2008. New Plymouth District <strong>Council</strong> New Plymouth Wastewater Treatment Plant Marine Outfall and Sludge Lagoon Monitoring Programme Annual Report 2007-2008.<br />
Technical Report 08-11.<br />
18 <strong>Taranaki</strong> <strong>Regional</strong> <strong>Council</strong>, 2008. Waitara Waste Water Treatment Plant Monitoring Programme Annual Report 2007. Technical Report 2008-03.<br />
19 <strong>Taranaki</strong> <strong>Regional</strong> <strong>Council</strong>, 2008. <strong>Taranaki</strong> <strong>Regional</strong> Marine Oil Spill Response Plan: A tier II marine oil spill contingency plan for the <strong>Taranaki</strong> coastal marine area.
COAST WILD BUT ALSO<br />
VULNERABLE<br />
The harshest of environments can also be vulnerable – as was<br />
dramatically illustrated when large amounts of crude oil washed up on<br />
the wild and windswept west coast near _ Okato in October 2007. It was<br />
the largest ever crude oil spill in New Zealand and the second largest<br />
oil spill in New Zealand in recent history.<br />
Residents, iwi and the surfi ng community were alarmed as nearly 15 km<br />
of sand and rocks along the coast were fouled by the waxy oil, mostly in<br />
the form of small tarballs that melted in the sun.<br />
<strong>Taranaki</strong> <strong>Regional</strong> <strong>Council</strong> staff began planning the clean-up operations<br />
under the Marine Oil Spill Response Plan within two hours of the<br />
oil being reported. They were later joined by a team from Australian<br />
Worldwide Exploration (AWE), which admitted responsibility for a 23tonne<br />
spill from processing equipment associated with the T _ u _ ı oilfi eld it<br />
operates 60 km offshore.<br />
While the spill was an unwelcome reminder of the coastline’s<br />
environmental vulnerability, quick action and fortunate timing kept longterm<br />
effects to a minimum.<br />
The oil came ashore on a spring tide, which meant most was deposited<br />
at the highest point possible on the beach – well away from the zone<br />
where marine life is active.<br />
The waxy blobs were quickly scooped off beach surfaces so the fastmelting<br />
oil did not have a chance to penetrate deep into the sand. If it<br />
had, a far more extensive and expensive clean-up operation would have<br />
been needed.<br />
The oil in the rocks was left to weather and break down, as any cleanup<br />
action would have caused more environmental damage. Beaches<br />
Table 5.3 Summary of progress: Implementing regional objectives and policies on coastal water quality.<br />
Issue What do we want to achieve? What are we doing about it? Where are we at?<br />
Maintain and enhance<br />
coastal water quality.<br />
Widespread contact recreation,<br />
shellfi sh gathering and<br />
consumption, and fi shing.<br />
Maintenance of marine<br />
ecosystem.<br />
Minimisation of occurrence of<br />
accidental spills and effective<br />
clean-up if spills occur.<br />
Oil spill cleanup.<br />
were monitored after every spring tide and oil that had dissipated from<br />
the rocks was cleaned up.<br />
Sea water, sediment and kaimoana samples tested by <strong>Council</strong> staff and<br />
by the Cawthron Institute, the latter under contract to AWE, showed no<br />
signifi cant increase in hydrocarbon or metal levels.<br />
A feature of the response to this incident was the close liaison of the<br />
<strong>Council</strong> with other agencies, local residents, iwi and surfers, with all<br />
consulted as the monitoring programme was developed.<br />
Coastal landowners were also very co-operative, despite it being a<br />
busy time of year for farmers. <strong>Council</strong> staff were given free access over<br />
their properties, and the farmers also made equipment available for the<br />
clean-up operation.<br />
Maritime New Zealand has taken legal action over the spill. Both AWE<br />
and Prosafe (the operators of the fl oating offshore production station)<br />
have appeared in court and entered guilty pleas. The decision on<br />
sentencing was yet to come at the time of printing.<br />
Preparing and implementing the <strong>Regional</strong><br />
Coastal Plan.<br />
Preparing and implementing the <strong>Regional</strong><br />
Fresh Water Plan.<br />
Issuing and monitoring resource consents<br />
for coastal activities.<br />
Requiring or encouraging promotion of<br />
contingency plans.<br />
Undertaking state of the environment<br />
beach bathing water quality programmes<br />
and coastal marine ecology monitoring.<br />
Carrying out enforcement.<br />
Preparing tier II oil spill response plan.<br />
Requiring ballast water discharges beyond<br />
Port limits.<br />
Rob Tucker<br />
<strong>Regional</strong> Coastal Plan made operative in<br />
October 1997.<br />
<strong>Regional</strong> Fresh Water Plan made operative<br />
in October 2001.<br />
Reduction in wastewater discharges to<br />
the coastal marine area – now only six<br />
signifi cant discharges, down from 25<br />
major discharges in 1975.<br />
Improvements made in waste treatment<br />
and disposal systems.<br />
Beach bathing bacteriological monitoring<br />
shows very good coastal water quality.<br />
Monitoring of rocky shores indicates that<br />
ecological health is generally stable, it<br />
does get affected with sand inundation<br />
but returns to normal when the sand<br />
moves on.<br />
Contingency plans have been developed at<br />
consent holder level (tier I) and at regional<br />
level (tier II).<br />
State of the Environment Report 2009<br />
161
162<br />
COASTAL AND MARINE ENVIRONMENT<br />
<strong>Taranaki</strong>’s coast is popular for surfi ng.<br />
5.1.3 HOW DO WE COMPARE?<br />
Comparing <strong>Taranaki</strong>’s rocky reef habitats with other regions is diffi cult<br />
as this would require identical, or at least similar, measures of diversity,<br />
sampling areas and sampling design and methodology. In addition,<br />
natural climate, physical and habitat conditions vary greatly from one<br />
region to another. As a result little information exists for comparison<br />
purposes. However, regional recreational water quality comparisons are<br />
possible due to the development of national recreational water quality<br />
Table 5.4 Marine bathing water quality in <strong>Taranaki</strong> compared to other regions 2007-08 20 .<br />
Location No. of sites monitored Range of<br />
enterococci/100ml<br />
TARANAKI – WHERE WE STAND<br />
guidelines and standardised sampling procedures and techniques.<br />
Table 5.4 compares bacteria counts at beach bathing sites in <strong>Taranaki</strong><br />
and other regions for the 2007-08 summer. It should be noted, that<br />
despite standardised sampling procedures, not all councils use the same<br />
methodology to collect and analyse samples, and each council routinely<br />
monitors a signifi cantly different number of sites. In terms of results, the<br />
table shows that the quality of marine bathing water quality in <strong>Taranaki</strong><br />
compares well with other regions.<br />
End of season<br />
enterococci medians<br />
% samples complying<br />
<strong>Taranaki</strong> 10
The spectacular North <strong>Taranaki</strong> coastline and distinctive fragments of eroded cliffs.<br />
5.2 NATURAL<br />
CHARACTER<br />
5.2.1 WHAT IS<br />
THE STATE OF<br />
THE NATURAL<br />
CHARACTER OF<br />
TARANAKI’S COAST?<br />
Protecting the natural character of the coast<br />
is a matter of national importance under the<br />
Resource Management Act 1991. Natural<br />
character is present to some degree in every<br />
coastal environment, even those areas that<br />
are highly modifi ed. The key components<br />
of natural character are natural processes<br />
(ecological processes), natural elements<br />
(geology, landforms, vegetation cover, seabed,<br />
foreshore etc.) and natural patterns, as well<br />
as intrinsic values and aesthetic values 21 .<br />
Small changes in a natural area surrounded by<br />
a highly modifi ed environment may be more<br />
signifi cant in terms of natural character than<br />
where it is surrounded by a largely natural<br />
environment.<br />
Assessing and monitoring changes in the<br />
natural character of the coast are not yet the<br />
subjects of a formal state of the environment<br />
monitoring programme in <strong>Taranaki</strong>. The<br />
following section sets out an overview of<br />
natural coastal features and how these<br />
change around the coast. This is followed by a<br />
discussion of an inventory into regionally and<br />
locally signifi cant sites and then indicators of<br />
pressures on coastal natural character – levels<br />
of coastal subdivision and consented activities.<br />
(A) TARANAKI’S NATURAL<br />
COASTAL CHARACTER<br />
Natural coastal processes in <strong>Taranaki</strong>’s coastal<br />
environment that contribute to its natural<br />
character include currents, coastal erosion,<br />
sand movement, formation of dunes, and such<br />
matters as the combination of seabed shape,<br />
swell direction and wave power that produce<br />
nationally and internationally recognised surf<br />
breaks. Natural features include the black<br />
sands of the west coast, stranded eroding<br />
fragments of cliff now surrounded by sea,<br />
estuaries formed by meandering rivers and<br />
river mouths that spill directly into the sea.<br />
As the <strong>Taranaki</strong> region is exposed to the<br />
west, high-energy wave and wind conditions<br />
dominate the coastal environment.<br />
Consequently there are few areas of sheltered<br />
water beyond estuaries (for example in the<br />
Tongaporutu, Waitara and P _ atea rivers) and<br />
the confi nes of Port <strong>Taranaki</strong>. Almost the<br />
entire <strong>Taranaki</strong> coastline is subject to varying<br />
degrees of erosion from waves and wind.<br />
This has resulted in a predominantly cliffed<br />
coastline, with the western coast characterised<br />
by boulder cliffs and offshore reefs derived<br />
from erosion of volcanic material. In North<br />
and South <strong>Taranaki</strong>, erosion of marine<br />
sediments has resulted in a coastline of almost<br />
continuous papa cliffs and black sand beaches.<br />
Estuaries are signifi cant features along the<br />
coast, creating quite different habitat from<br />
the open coast conditions. In comparison<br />
with estuaries elsewhere around the country,<br />
<strong>Taranaki</strong> estuaries are relatively small, with the<br />
four largest estuaries, Tongaporutu and Mimi<br />
21 Maplesden, R. 2000. Natural Character: Concept Development in New Zealand Law Planning and Policy. Prepared by Boffa Miskell for Environment Waikato.<br />
in the north, and Whenuakura and Wait _ otara in<br />
the south, all less than 500 ha.<br />
(B) NATURAL CHARACTER<br />
AROUND THE COAST<br />
Rob Tucker<br />
The <strong>Taranaki</strong> coastline falls into two large<br />
biogeographic regions (areas that are more<br />
similar to each other in terms of physical<br />
and biological characteristics) - the Western<br />
North Island and the North Cook Strait Coastal<br />
biogeographic regions (Figure 5.8). The<br />
Western North Island Coastal Biogeographic<br />
region extends from north of the Waikato to<br />
Cape Egmont. It is infl uenced by the northward<br />
fl owing Westland current and the southward<br />
fl owing west Auckland current, both of<br />
subtropical origin. The region is characterised<br />
by open, exposed sandy beaches interspersed<br />
by stretches of rocky platforms, bluffs and<br />
outcrops. The fauna has affi nities with both<br />
warm-temperate, cool-temperate and subantarctic<br />
fauna.<br />
The North Cook Strait Coastal Biogeographic<br />
region extends from Cape Egmont around<br />
Wellington and up the eastern Wairarapa<br />
coast. This region lies in a transition area<br />
between northern and southern fl ora and<br />
fauna, and has a high diversity of species.<br />
The tidal regimes each side of the strait are<br />
different and the water temperature is also<br />
very different. The northern side is greatly<br />
infl uenced by the easterly-fl owing warm, saline<br />
D’Urville current and the cooler Southland<br />
current that travels northward through Cook<br />
Strait. The D’Uurville current also fl ows up the<br />
west coast and is defl ected offshore by the<br />
Mount <strong>Taranaki</strong> ring plain, resulting in very<br />
different biota further north of Cape Egmont.<br />
State of the Environment Report 2009<br />
163
164<br />
COASTAL AND MARINE ENVIRONMENT<br />
Figure 5.8: Biogeographic regions and coastal units.<br />
The <strong>Taranaki</strong> coastal region can be further divided into three coastal<br />
units (illustrated Figure 5.8):<br />
North <strong>Taranaki</strong> (from the M _ okau River to Motunui), a section of<br />
narrow sand beaches, highly infl uenced by suspended sediments from<br />
river mouths and areas of rocky foreshore and intertidal reefs such as<br />
Pariokariwa and Epiha reefs;<br />
the Cape Egmont coastal unit (from Motonui around Cape Egmont<br />
to H _ awera), which includes the Sugar Loaf Islands and is highly<br />
infl uenced by the volcanic deposits forming reefs consisting of large<br />
boulders and cobbles; and<br />
the P _ atea coastal unit, extending from H _ awera to just north of the<br />
Whanganui River mouth, a coastline dominated by sandy beaches and<br />
some limestone rock platforms, intertidal reefs and two signifi cant<br />
reefs near P _ atea (the North and South Traps) 22 .<br />
(C) SITES OF REGIONAL AND LOCAL<br />
SIGNIFICANCE<br />
The coastal environment is the land between the mean high water<br />
spring mark and the fi rst dominant ridge 23 . The width of the coastal<br />
environment is therefore infl uenced by the location of the ridgeline, or<br />
the area where there is a clear coastal infl uence.<br />
An inventory has been prepared of sites of regional or local<br />
signifi cance 24 . The inventory was collated by a working party consisting<br />
of representatives from the <strong>Taranaki</strong> <strong>Regional</strong> <strong>Council</strong>, district councils<br />
TARANAKI – WHERE WE STAND<br />
and the Department of Conservation. This identifi ed 69 coastal areas,<br />
representing approximately 33% of the <strong>Taranaki</strong> coastline, as having<br />
features or qualities of local or regional signifi cance.<br />
To be identifi ed as a coastal area of local or regional signifi cance,<br />
an area had to be ranked as ‘high’ in relation to one or more of the<br />
following:<br />
Amenity values. Unique areas with signifi cant natural, scenic,<br />
aesthetic, visual or rural amenity values (landscapes, seascapes,<br />
landforms and associated processes) were included.<br />
Recreational values. Areas included had high passive and/or active<br />
recreational use (eg, swimming, walking, fi shing and boating) or areas<br />
unique and highly-valued for a particular recreational experience (eg,<br />
scuba diving or surfi ng).<br />
Cultural/historical values. This included places, sites and areas of<br />
special cultural or historical signifi cance (eg, archaeological sites and/<br />
or areas or features of special signifi cance to tangata whenua).<br />
Ecological and scientifi c values. This included places, areas<br />
or features of scientifi c interest, important or unique coastal<br />
environment ecosystems and/or spawning, nursery or feeding areas<br />
for marine mammals or birds. Estuaries in particular rated highly for<br />
ecological values.<br />
Of the 69 coastal areas or sites identifi ed as having local or regionally<br />
signifi cant values, 48 sites (or 70%) were identifi ed as being of local or<br />
regional signifi cance based upon high amenity values. Forty-eight sites<br />
(or 70%) were also identifi ed as being of local or regional signifi cance<br />
for their high cultural or historical values and 41 sites (or 59%) were<br />
identifi ed as being of signifi cance based upon high ecological or<br />
scientifi c values. High recreational values were identifi ed at 27 sites (or<br />
39%). Many sites ranked highly in two or more attributes. For example,<br />
the Wait _ otara estuary and dunes was recognised as having high<br />
amenity values, moderate recreational values (for whitebaiting), high<br />
cultural /historic values (with a ferry punt landing from early European<br />
settlement) and high ecological values (an unmodifi ed estuary with sand<br />
dunes and a wetland, providing important habitat for threatened and<br />
migratory birds and sub-fossil t _ otara stumps) 24 .<br />
Kayaking through the surf.<br />
22 Walls, K. 2006. Nearshore Marine Classifi cation and Inventory – a planning tool to help identify marine protected areas for the nearshore of New Zealand. Department of Conservation, Wellington.<br />
23 New Plymouth District <strong>Council</strong>. 2006. Coastal Strategy.<br />
24 <strong>Taranaki</strong> <strong>Regional</strong> <strong>Council</strong>. 2004. Inventory of Coastal Areas of Local or <strong>Regional</strong> Signifi cance in the <strong>Taranaki</strong> Region: Summary and Discussion.<br />
Rob Tucker
Coastal subdivision, Stent Road.<br />
(D) SUBDIVISION IN THE<br />
COASTAL ENVIRONMENT<br />
The increasing popularity of living near the coast has brought increasing<br />
pressure to subdivide, particularly adjacent to low lying areas. This has<br />
the potential to impact on many aspects of the natural character of the<br />
coast, particularly in the more remote areas of <strong>Taranaki</strong>.<br />
In the New Plymouth District, most of the subdivision has occurred around<br />
the New Plymouth periphery, with the rate of subdivisions being fairly<br />
Table 5.5: Subdivision pressures within the New Plymouth District.<br />
Coastal Hazard Zone<br />
(CHZ)<br />
Coastal Hazard Zone<br />
Buffer<br />
Coastal Policy Area<br />
(CPA)<br />
Defi nition Subdivision lots created<br />
between 1998 and 2006<br />
For most areas within New<br />
Plymouth District this is 70 m<br />
wide but there are variations<br />
based on erosion data.<br />
Set as a distance of 250 m<br />
inland of the coastal hazard<br />
zone.<br />
Is defi ned within the New<br />
Plymouth District Plan but<br />
typically is wider in the rural<br />
areas and narrower around<br />
urban centres on the coast.<br />
Four new lots created in 2004,<br />
one new lot created in 2005.<br />
consistent each year. The average lot size for rural coastal subdivision<br />
is around seven hectares. Coastal subdivisions are now occurring along<br />
the New Plymouth coastline at road ends, whereas in 2003 they were<br />
particularly centered in the _ O _ akura and _ Omata areas. Table 5.5 outlines<br />
the subdivision undertaken in the various coastal environment zones in<br />
the New Plymouth District. This highlights the signifi cant and increasing<br />
demand for subdivision within 3 km of the coast.<br />
South <strong>Taranaki</strong> appears to have less pressure to subdivide on the coast.<br />
However, there have been subdivisions near Waverley Beach, _ Oaonui,<br />
Manaia, P _ uniho, Opunake and Waiinu Beach since 1995.<br />
The effects of urban and industrial development on the natural character<br />
of the coast are not felt to be signifi cant at present, with the most<br />
modifi ed parts of the coastline being in and around the city of New<br />
Plymouth.<br />
In the future, however, the effects of urban and industrial development<br />
on the coast may become more signifi cant. Some parts of the coast<br />
are more vulnerable to levels of urban development that may lead to<br />
a gradual loss in the natural, scenic and amenity values that attracted<br />
people to the area in the fi rst place. This particularly applies to smaller<br />
coastal settlements such as _ O _ akura, _ Omata, Urenui and Opunake, which<br />
are becoming increasingly popular.<br />
126 new lots created,<br />
averaging 14 per year. These<br />
peaked in 2003 (39 lots), 2004<br />
(37) and 2005 (23).<br />
88 new lots created: averaging<br />
9.8 per year. These peaked in<br />
2000 (12 lots), 2002 (10), 2003<br />
(13) and 2005 (35).<br />
Coastal Buffer Is set at 3 km from the coast. 1502 new lots created,<br />
averaging 167 per year. These<br />
peaked in 2003 (297 lots), 2004<br />
(476) and 2005 (347)<br />
Data provided by the New Plymouth District <strong>Council</strong>.<br />
Rob Tucker<br />
% of subdivision<br />
within the whole<br />
New Plymouth<br />
District<br />
General observation<br />
0.1% There is not a great pressure<br />
on the CHZ with respect to<br />
subdivision.<br />
3.8 There could be increasing<br />
pressure immediately inland of<br />
the CHZ.<br />
2.6 Subdivision within the CPA<br />
may be an area to monitor in<br />
the future to more accurately<br />
determine the actual ongoing<br />
and cumulative effects of<br />
subdivision on the CPA.<br />
44.8 There appears to be a signifi cant<br />
demand for subdivision within<br />
3 km of the coast.<br />
State of the Environment Report 2009<br />
165
166<br />
COASTAL AND MARINE ENVIRONMENT<br />
(E) ACTIVITIES AND STRUCTURES IN THE<br />
COASTAL MARINE AREA<br />
Most stretches of the <strong>Taranaki</strong> coastline are untouched by signifi cant<br />
developments which might have a detrimental effect on the natural<br />
character of the coast. However, some areas such as Port <strong>Taranaki</strong> have<br />
been substantially modifi ed. Furthermore, some development, such as<br />
ports, reclamation and offshore production platforms for the oil and gas<br />
industry can only be located in the coastal marine area.<br />
Development in the coastal marine area has the potential to adversely<br />
impact on the coastline’s natural character whilst also potentially<br />
providing wider benefi ts to the community such as protecting key assets<br />
or providing public access to the coast. The current number of coastal<br />
permits held for various activities and structures are set out in Table<br />
5.6. There are a total of 252 coastal permits currently held, the majority<br />
(42%) are for coastal erosion protection structures.<br />
Table 5.6: Total number of current coastal permits (including those current that<br />
were issued before the Coastal Plan became operative).<br />
Type of coastal permit Total current<br />
coastal<br />
permits<br />
TARANAKI – WHERE WE STAND<br />
Percentage<br />
of total<br />
Renourishment 0 0<br />
Structure - access 2
Table 5.7: Coastal permits issued, reviewed or varied between October 1997 and June 2008.<br />
Type of coastal permit Coastal management area in the <strong>Regional</strong> Coastal Plan TOTAL issued<br />
A Outstanding<br />
Coastal Value<br />
B<br />
Estuaries<br />
C<br />
Open Coast<br />
D<br />
Port <strong>Taranaki</strong><br />
Renourishment 1 1<br />
Structure - pipeline 3 4 7<br />
Structure - boat ramp 1 4 1 6<br />
Structure - intake 1 1<br />
Structure - protection 22 11 64 97<br />
Structure - outfall 2 4 6<br />
Structure - stormwater outlet 1 4 1 6<br />
Structure - wharf/marina/jetty 1 2 2 5<br />
Structure - bridge 1 1 2<br />
Structure - stream outlet 1 2 3<br />
Structure - other 2 1 10 1 14<br />
Discharge 1 5 16 17 39<br />
Deposit 6 6<br />
Disturb foreshore 1 16 9 25<br />
Extraction 2 1 1 4<br />
Occupy 4 4<br />
Occupy and structure (boat ramp) 2 2<br />
Take, use, divert or dam 8 1 9<br />
TOTAL 27 28 148 35 238<br />
Sea wall and boat ramp, _ Onaero Beach.<br />
The majority of coastal permits issued, reviewed or varied since the plan<br />
became operative (147 or 79%) have been for structures – pipelines,<br />
boat ramps, stormwater outlets, but particularly coastal erosion<br />
protection works.<br />
There is an estimated 11.6 km of seawall protection structures, and<br />
about 2 km of these have been consented over the last fi ve years.<br />
A number of these are subject to consent monitoring programmes.<br />
Historically, erosion protection structures have been established in areas<br />
where development has occurred close to the eroding coast. Protection<br />
works in the open coast area are a response to the erosive nature of<br />
Rob Tucker<br />
the coastline and are undertaken to protect developments that have<br />
historically occurred in the coastal environment.<br />
Sixty-four consents have been issued for protection structures along<br />
the open coast at Urenui, Middleton Bay, _ O _ akura, New Plymouth near<br />
Kawaroa Park, Bayly Road, Bell Block and Waihi Beach. Some consents<br />
issued have been for existing structures and others for renewals. In the<br />
estuary zones, consents for coastal protection structures have been<br />
issued for the Waitara, Urenui, _ O _ akura and P _ atea rivers and the Te Henui<br />
Stream. In areas of outstanding value, 22 consents have been issued for<br />
coastal erosion protection purposes in the Mohakatino and Tongaporutu<br />
estuaries and on Waiiti Beach.<br />
The effects of the protection works on the natural character of the coast<br />
are weighed against the need to protect assets. Wherever possible, the<br />
<strong>Taranaki</strong> <strong>Regional</strong> <strong>Council</strong> and the district councils encourage applicants<br />
wishing to undertake developments to avoid areas subject to erosion<br />
and so reduce the need for future erosion protection works.<br />
Hard engineered structures are not the only answer to coastal erosion,<br />
and there has been considerable success in re-establishing dunes along<br />
Fitzroy Beach.<br />
There are relatively few areas of natural dunes around the <strong>Taranaki</strong><br />
coast. Some, such as at _ O _ akura and Sandy Bay, are subject to<br />
community-driven restoration projects (see case study).<br />
State of the Environment Report 2009<br />
167
168<br />
COASTAL AND MARINE ENVIRONMENT<br />
Peter Johnston at Sandy Bay.<br />
GETTING THE BIRDS BACK<br />
WHERE THEY BELONG<br />
You could call it a project that aids homeless refugees. One of the<br />
visions of the Ng _ ati Tara _ Oaonui Sandy Bay Society is to have seabirds<br />
nesting amidst the dunes instead of on neighbouring farmland – or<br />
worse not nesting at all.<br />
“We had one pair of gulls nesting down in the dunes last summer,<br />
and around 30 up on the farm. We’d like to see them back where<br />
they belong,” said Society President Peter Johnston, one of the<br />
neighbouring landowners.<br />
As the only signifi cant area of dunes along the rocky coastline<br />
between Opunake and _ Omata, Sandy Bay attracts not only blackbacked<br />
gulls and oystercatchers, but also the endangered New<br />
Zealand dotterel.<br />
5.2.2 HOW IS COASTAL<br />
NATURAL CHARACTER<br />
MANAGED?<br />
(A) REGIONAL COASTAL PLAN<br />
The preservation of the natural character of the coastal marine area,<br />
and protection of the areas from inappropriate subdivision, use and<br />
development, is a matter of national importance under the Resource<br />
Management Act 1991. The <strong>Regional</strong> Coastal Plan for <strong>Taranaki</strong> contains<br />
objectives, policies and methods to ensure that the natural character<br />
of, and public access to, the coastal environment are maintained.<br />
Methods include rules giving effect to the policies for each of the four<br />
coastal management areas, and general rules that apply to all coastal<br />
management areas.<br />
TARANAKI – WHERE WE STAND<br />
Rob Tucker<br />
The Bay is also home to the chronically threatened green gecko,<br />
gold-striped gecko and the rare native <strong>Taranaki</strong> moth Notoreas<br />
‘<strong>Taranaki</strong> Coast’.<br />
It’s a special place where for four years the Society has worked to<br />
counter the negative effects of erosion, introduced predators and<br />
unhelpful human activity. This follows earlier planting and pest-control<br />
work initiated by the Community Advisory Group for the nearby M _ aui<br />
production station run by Shell Todd Oil Services Ltd.<br />
The Opunake Lions Club, Opunake Surf Club and students from<br />
Opunake High School have all been involved in planting to help restore<br />
natural dunes. Unfortunately much of the early work has been knocked<br />
out by storms but Peter said valuable lessons were learned and a<br />
new three-year planting and shaping plan will result in a low-forming<br />
spinifex/p _ ingao dune where there is currently a sand blow-out.<br />
This work is being funded through the Department of Conservation’s<br />
Biodiversity Condition Fund, with assistance from the <strong>Taranaki</strong><br />
<strong>Regional</strong> <strong>Council</strong> and community and corporate donations.<br />
Pest control work will also continue, and signs at key locations will<br />
advise visitors how they can best protect the habitat and the life it<br />
supports.<br />
Sandy Bay is just 9 km from Opunake and recent residential<br />
development nearby has highlighted the importance of the Society’s<br />
work to ensure the Bay’s special natural character is protected and<br />
enhanced. Peter says access to biodiversity funding is making a<br />
difference and he’s optimistic he’ll soon see more of those seabirds<br />
setting up home exactly where nature intended.<br />
(B) DISTRICT PLANS AND STRATEGIES<br />
District councils are responsible for protecting the natural character<br />
of the coastal environment from inappropriate subdivision, use and<br />
development. The New Plymouth District Plan and South <strong>Taranaki</strong><br />
District Plan have delineated coastal areas and have mechanisms in<br />
place to protect the coastal natural character.<br />
In terms of land use and subdivision controls around the coast, both<br />
district councils have planning regimes that allow use and development,<br />
subject to specifi ed terms, conditions and standards to address any<br />
environmental effects. District councils, when implementing those<br />
rules, have regard to policies in their district plans that address the<br />
consolidation of existing urban settlements, the protection of the<br />
natural character and the avoidance of inappropriate subdivision, use or<br />
development.
The New Plymouth District <strong>Council</strong> has prepared a Coastal Strategy, a<br />
non-statutory planning document, which sets out a vision for what the<br />
community wants the coastal environment to look like in 20 years 25 .<br />
The vision of the Coastal Strategy is for “A prosperous, growing coastal<br />
community, balancing the needs of people and environment within<br />
our high-energy untamed coast.” The Strategy sets out more than 100<br />
actions that have been prioritised over the next 20 years, and will be<br />
undertaken in partnership with other agencies and groups who also play<br />
a part in how the coast is managed. These actions address appropriate<br />
population growth along the coast; infrastructure compatibility with<br />
coastal values; sustainable economic growth; recreation; understanding<br />
and support of the tangata whenua role as kaitiaki; management<br />
of coastal hazards; and protection and enhancement of the natural<br />
environment and landscape values.<br />
The South <strong>Taranaki</strong> District <strong>Council</strong> is undertaking a landscape<br />
assessment to review its coastal protection area in order to better defi ne<br />
the coastal environment landscape.<br />
(C) RESOURCE CONSENT MANAGEMENT<br />
AND MONITORING<br />
Signifi cant activities in the coastal marine area require a resource<br />
consent. Sixty three new coastal consents were issued between October<br />
1997 and the end of 2002 (an average of 1.0/month), and 96 were issued<br />
between the beginning of 2003 and June 2008 (an average of 1.5/<br />
month). This indicates increased activity on the coast.<br />
Consent conditions avoid or mitigate any adverse effects that may result<br />
from the activity. A monitoring programme is being developed for coastal<br />
structures involving a mixture of checking the integrity of structures and<br />
beach profi ling 26 . In the 2007-08 year, coastal structure monitoring was<br />
Dredging in Port <strong>Taranaki</strong>.<br />
Rob Tucker<br />
commenced for a number of structures including groynes, sea walls,<br />
boat ramps and outlets 27 .<br />
The <strong>Council</strong>, in partnership with the district councils, is looking to<br />
undertake a coastal erosion assessment using changes over time in<br />
aerial photos to calculate rates of coastal erosion around the region.<br />
(D) RESTORATION WORKS<br />
The New Plymouth District <strong>Council</strong> has established Coast Care groups<br />
over the past 12 years to undertake large-scale dune restoration projects<br />
at New Plymouth, Waitara and _ O _ akura. Such projects restore natural<br />
character to a section of beach providing habitat for coastal biodiversity.<br />
Now that these projects have been completed, the emphasis is on<br />
small-scale, community and school dune plantings. Valuable lessons<br />
have been learned about restoring dunes and the role of restored<br />
dunes in managing coastal erosion. One such dune restoration project<br />
has been located at the _ O _ akura campground which has seen planting<br />
trials undertaken by the local Coast Care group and _ O _ akura School in<br />
an attempt to reinstate a resilient natural dune system better able to<br />
withstand the forces of erosion. However, recent storm events have had<br />
an impact on this restoration project.<br />
Another type of restoration project involves the sand dumping trial<br />
offshore from New Plymouth city in an attempt to restore the natural<br />
functioning and character of the coast (see case study). It is expected<br />
that in the long term, Port <strong>Taranaki</strong>’s sand deposition programme<br />
will have a positive effect on restoring the natural character of New<br />
Plymouth beaches where there are no sea walls. The ecological effects<br />
are being monitored through a resource consent monitoring programme<br />
undertaken by the <strong>Taranaki</strong> <strong>Regional</strong> <strong>Council</strong>.<br />
Sand dune restoration, _ O _ akura Beach.<br />
25 New Plymouth District <strong>Council</strong>. 2006. New Plymouth District Coastal Strategy.<br />
26 Tonkin and Taylor. 2001, <strong>Taranaki</strong> <strong>Regional</strong> <strong>Council</strong> Compliance Monitoring for Coastal Structures. Prepared by Tonkin and Taylor and DTEC Consulting Ltd for the <strong>Taranaki</strong> <strong>Regional</strong> <strong>Council</strong>.<br />
27 <strong>Taranaki</strong> <strong>Regional</strong> <strong>Council</strong>. 2008. NPDC Coastal Structures Monitoring Programme Report. 08-44.<br />
Rob Tucker<br />
State of the Environment Report 2009<br />
169
170<br />
COASTAL AND MARINE ENVIRONMENT<br />
SAND ON THE RUN<br />
On the surface it seems a win-win situation: Material that’s been<br />
dredged to maintain navigable channels at Port <strong>Taranaki</strong> is dumped<br />
near to shore so it can feed beaches that are starved of sand because<br />
the Port blocks the natural drift northwards of such material.<br />
But when the idea was fi rst suggested, iwi raised concern about the<br />
effects of such sand-dumping on kaimoana beds and other marine life.<br />
A trial operation was approved in the late 1990s, however, and the<br />
<strong>Taranaki</strong> <strong>Regional</strong> <strong>Council</strong> developed a detailed monitoring programme<br />
in consultation with iwi, who were also involved in implementing it.<br />
The monitoring showed the sand was not moving from the trial site<br />
in a large mass, rather it was being lifted and dispersed gradually. It<br />
also showed the sand was not moving inshore and smothering the<br />
kaimoana beds and other sea life.<br />
In 2002 Port <strong>Taranaki</strong> Ltd (then trading as Westgate Transport) was<br />
issued a permit allowing it to dump up to 400,000 cubic metres of sand<br />
at a time in the specifi ed area near Kawaroa Reef. The permit expires<br />
in 2029 but can be reviewed every four years.<br />
The <strong>Council</strong>’s monitoring programme is continuing, and includes<br />
repeated intertidal and subtidal surveys, kaimoana surveys and<br />
inspections of Arakaitia and Kawaroa reefs. Port <strong>Taranaki</strong> Ltd also<br />
(E) INFORMATION, EDUCATION AND ADVICE<br />
<strong>Regional</strong> and district councils provide information and technical<br />
advice relating to the protection of natural character, resource consent<br />
requirements and effects of structures on the coastal environment.<br />
Under its sustainable land management programme, the <strong>Council</strong><br />
prepares conservation plans for landowners on coastal sand country.<br />
Table 5.8: Summary of progress: Implementing regional objectives and policies on the natural character of the coastal environment.<br />
Issue What do we want to achieve? What are we doing about it? Where are we at?<br />
Natural character of the coast Preservation of the natural<br />
character of the coastal<br />
environment.<br />
Provision for appropriate<br />
subdivision, use and development<br />
of the coastal environment.<br />
Provision made for estuarine and<br />
open coastal natural processes,<br />
differing natural values, and<br />
different levels and types of use<br />
across the coastal marine area.<br />
TARANAKI – WHERE WE STAND<br />
<strong>Council</strong> staff and Ng _ ati Te Whiti carrying out a Kaimoana survey.<br />
carries out surveys involving the use of underwater sonar and<br />
cameras, and aerial photography.<br />
These surveys show that while the sand is defi nitely on the move in<br />
the way intended, the diversity and amount of marine life in the area<br />
have remained stable. Only a small amount of sand gets on to the<br />
reefs, and while there has been some variation in species richness and<br />
diversity, this is common at reef sites monitored by the <strong>Council</strong> around<br />
<strong>Taranaki</strong>. The causes are thought to be unrelated to the sand dumping.<br />
Numbers of p _ aua at the six reef sites surveyed have remained similar<br />
to, or increased when compared with pre-dredging numbers.<br />
These plans can contain methods to address localised erosion problems<br />
through planting and possible re-contouring.<br />
(F) SUMMARY OF PROGRESS<br />
Progress implementing regional objectives and policies on the natural<br />
character of the coastal environment is summarised in Table 5.8.<br />
Reviewing the <strong>Regional</strong> Coastal<br />
Plan in accordance with the<br />
revised New Zealand Coastal<br />
Policy Statement.<br />
District councils to implement<br />
district plans provisions relating<br />
to coastal natural character.<br />
Monitoring district council<br />
subdivision consent applications.<br />
Attaching conditions to coastal<br />
permits to ensure that adverse<br />
affects from activities on the<br />
natural character are avoided,<br />
remedied or mitigated.<br />
Coast Care groups continued.<br />
Planting of native species and<br />
dune stabilisation methods<br />
undertaken at Sandy Bay.<br />
<strong>Taranaki</strong> <strong>Regional</strong> <strong>Council</strong><br />
<strong>Regional</strong> Coastal Plan for <strong>Taranaki</strong><br />
made operative in 1997. The<br />
plan contains policies and rules<br />
to maintain and enhance natural<br />
character.<br />
District plans contain policies and<br />
rules relating to the preservation<br />
and enhancement of the<br />
natural character of the coastal<br />
environment.<br />
A total of 252 coastal permits are<br />
currently held.
5.2.3 HOW DO WE COMPARE?<br />
Most regions have coastal policies and plans and district plans that seek<br />
to protect the natural character of the coast from inappropriate subdivision,<br />
use and development. The <strong>Taranaki</strong> region has fewer development<br />
pressures on its coastline than other regions such as Northland, Auckland,<br />
Waikato, Bay of Plenty, Marlborough and Canterbury. Pressures from<br />
subdivision, urban development, recreation, tourism and aquaculture are<br />
much greater in these regions than in <strong>Taranaki</strong>.<br />
In <strong>Taranaki</strong>, the primary response to coastal erosion threatening existing<br />
development is generally for engineering solutions and erosion protection<br />
structures rather than using alternative solutions such as recreating dunes<br />
as protection mechanisms. Nationally, many councils are now involved<br />
in the Dune Restoration Trust of New Zealand exploring alternative<br />
approaches to coastal erosion.<br />
The New Zealand Coastal Policy Statement Board of Inquiry noted that<br />
the region’s inventory of coastal areas of local or regional signifi cance<br />
was a unique document. This document, prepared by a working party<br />
consisting of representatives from the <strong>Taranaki</strong> <strong>Regional</strong> <strong>Council</strong>, district<br />
councils and Department of Conservation will provide valuable assistance<br />
for implementing the revised New Zealand Coastal Policy Statement<br />
when the <strong>Regional</strong> Coastal Plan for <strong>Taranaki</strong> is reviewed.<br />
5.3 COASTAL AND<br />
MARINE <strong>BIODIVERSITY</strong><br />
5.3.1 WHAT IS THE STATE<br />
OF COASTAL AND MARINE<br />
<strong>BIODIVERSITY</strong>?<br />
The <strong>Taranaki</strong> region has a 295 km coastline, comprising steep cliffs, rocky<br />
shores and sandy beaches, subtidal reefs, rivermouths and estuaries.<br />
These provide a wide range of ecological habitats for native plant and<br />
animal species. This section describes the state of biodiversity of rocky<br />
reefs, estuaries, marine protected areas and threatened marine mammals.<br />
(A) <strong>BIODIVERSITY</strong> OF THE<br />
ROCKY SHORE AND REEFS<br />
<strong>Taranaki</strong>’s intertidal reef systems have generally lower diversity and<br />
abundance of species compared to similar type systems elsewhere<br />
in New Zealand. This is due to the high wave energies typical of the<br />
<strong>Taranaki</strong> coastline, which give rise to abrasive and turbulent shoreline<br />
conditions, high water turbidity, suspended silt, and sand inundation.<br />
Notwithstanding that, associated with reef systems is a large diversity<br />
of marine life, including fi sh species and encrusting animals such as<br />
sponges and anemones.<br />
Higher species diversity is found on rocky shores where larger rocks are<br />
present, as they provide plenty of habitat for rocky shore creatures to<br />
shelter under. This type of environment provides more suitable shelter<br />
and habitat when compared to sites with cobbles or sandy beaches.<br />
<strong>Taranaki</strong> has more intertidal rocky reefs than sandy beaches. Large,<br />
discrete reef systems are present around the Waitara River, New<br />
Plymouth, North <strong>Taranaki</strong> and around Cape Egmont. A smaller reef<br />
system lies south of the Wait _ otara River. Large subtidal reefs called the<br />
Intertidal biodiversity.<br />
North and South Traps are located offshore from P _ atea. A number of<br />
smaller offshore subtidal reefs also occur.<br />
The rocky inshore marine environment provides a wide range of different<br />
habitats for a number of different aquatic species. This includes<br />
species such as starfi sh, sea anemones, crabs, crayfi sh, sea cucumbers,<br />
mussels, p _ aua, sponges, whelks and a number of seaweed species. The<br />
rock borer which bores into soft cliffs around <strong>Taranaki</strong> is a local feature.<br />
Results from the <strong>Council</strong>’s state of the environment monitoring of<br />
intertidal rocky shore sites have been described earlier in this chapter.<br />
The Department of Conservation’s monitoring of subtidal reefs is<br />
described below.<br />
(B) <strong>BIODIVERSITY</strong> OF SOFT SEDIMENTS<br />
AND ESTUARIES<br />
Estuaries and river mouths make up approximately 16% of <strong>Taranaki</strong>’s<br />
295 km coastline. These are shallow, sheltered areas of productive<br />
‘nursery’ habitats for a variety of marine life. <strong>Taranaki</strong> estuaries do<br />
not have a wide range of intertidal and subtidal habitats, and are well<br />
fl ushed with fresh water. This results in a high freshwater input/area<br />
ratio, creating a harsh environment for estuarine aquatic life that prefers<br />
things to be more salty. The low numbers and diversity of fi sh and<br />
shellfi sh found in <strong>Taranaki</strong> estuaries have been attributed to this more<br />
freshwater type estuary environment 28 . The Wait _ otara and Whenuakura<br />
rivers drain mudstone catchments and are highly modifi ed, with large<br />
areas of land cleared for farming, and they frequently fl ood. Both factors<br />
contribute to the high silt load in the rivers, a factor which reduces the<br />
number and diversity of species in the lower estuary. In comparison, the<br />
Tongaporutu and Mimi catchments are not as extensively modifi ed.<br />
The soft substrate of estuaries (consisting of sediment carried down by<br />
rivers mixed with detrital material such as leaves, sticks etc.) supports<br />
a range of burrowing fauna such as worms, cockles and pipis. Most of<br />
these animals feed on detrital material, and bacterial and algal fi lms on<br />
the mud surface. These estuarine areas are ideal refuges for juvenile<br />
fi sh of many species and wading birds in search of fi sh and crustacea 29 .<br />
The <strong>Council</strong> monitors two estuaries in an estuarine monitoring<br />
component of the <strong>Council</strong>’s state of the environment monitoring<br />
programme – Tongaporutu in the north and Wait _ otara in the south.<br />
Some information is held about conservation values of a number of<br />
28 <strong>Taranaki</strong> <strong>Regional</strong> <strong>Council</strong>, 2008. State of the Environment Monitoring Hard-shore and Soft-shore Marine Ecological Programmes 2007-2008. Technical Report 2008-07.<br />
<strong>Taranaki</strong> <strong>Regional</strong> <strong>Council</strong><br />
State of the Environment Report 2009<br />
171
172<br />
COASTAL AND MARINE ENVIRONMENT<br />
Tongaporutu township and estuary.<br />
estuaries 30 but no information had been<br />
collected prior to this programme about the<br />
diversity and abundance of estuarine life in<br />
<strong>Taranaki</strong>. Previous studies by others 31 , 32 were<br />
‘one-off’ providing useful information about the<br />
ecological status of North <strong>Taranaki</strong> estuaries<br />
but contained no information on species<br />
persistence and community stability within the<br />
estuaries over time.<br />
A variety of animal life has been identifi ed<br />
within the sediment at both estuaries.<br />
The most dominant are sand-hoppers<br />
(Paracorophium excavatum), pipi (Paphies<br />
australis), cockles (Austrovenus stutchburyi),<br />
trough shells (Mactra sp.), marine bristle<br />
worms (polychaetes) and mud snails<br />
(Amphibola crenata).<br />
Long-term trend analysis was undertaken<br />
on data collected at both Tongaporutu and<br />
Wait _ otara estuaries. The analyses did not<br />
indicate signifi cant positive or negative trends<br />
– indicating ecological conditions in both<br />
estuaries are generally stable 33 .<br />
In February 2004, extensive fl ooding occurred<br />
in the Wait _ otara River which led to extensive<br />
silt movements in the catchment which were<br />
either largely deposited on fl ooded land, in<br />
the estuary or taken out to the ocean. As a<br />
result, very few animals were present in the<br />
April 2004 survey – with only 16 individuals<br />
found in 12 core samples. The estuary has<br />
29 <strong>Taranaki</strong> <strong>Regional</strong> <strong>Council</strong> , 1991. <strong>Taranaki</strong> Coastal Marine Area. Resource Description and Management Issues.<br />
30 <strong>Taranaki</strong> <strong>Regional</strong> <strong>Council</strong>, 1995. Comparative Assessment of Ecological and General Conservation Values in the Tongaporutu Estuary.<br />
31 B. T. Coffey and Associates, 1991. A Contribution to a Description of Biological Resources in Estuarine, Intertidal and Shallow Subtidal Habitats South of Mokau River to Tongaporutu, February – March 1991.<br />
32 Hayward, B. W., et. al., 1999. Marine biota of the North <strong>Taranaki</strong> coast, New Zealand. Tane, 37:171-199.<br />
33 <strong>Taranaki</strong> <strong>Regional</strong> <strong>Council</strong>, 2008. State of the Environment Monitoring Hard-shore and Soft-shore Marine Ecological Programmes 2007-2008. Technical Report 08-07.<br />
TARANAKI – WHERE WE STAND<br />
slowly recovered over the past few years and<br />
results from the most recent samples collected<br />
in April 2008 contained the highest species<br />
richness to date, and included relatively high<br />
numbers of two common snails that had<br />
been present infrequently, or absent, for the<br />
previous several years.<br />
(C) <strong>BIODIVERSITY</strong> OF THE<br />
OPEN OCEAN<br />
The northward fl owing Westland current<br />
and the southward fl owing west Auckland<br />
current play important roles in determining<br />
the distribution and abundance of fi sh species<br />
in the open coast. The level of plankton<br />
productivity, and therefore food available<br />
for fi sh, is dependent on the availability of<br />
nutrients which can be enhanced by vertical<br />
upwellings of currents and local freshwater<br />
inputs 34. The South <strong>Taranaki</strong> coast for example,<br />
receives nutrients from currents that spiral up<br />
off Farewell Spit 35 .<br />
Localised currents play a major role in the<br />
reproductive success of many kinds of fi sh.<br />
Snapper, fl ounder and trevally spawn off<br />
North <strong>Taranaki</strong>, and after spawning, snapper<br />
and trevally move up the Urenui estuary to<br />
feed. Recognising the importance of this<br />
area for spawning, Urenui Bay is closed for<br />
trawling. Recent research has highlighted the<br />
importance of estuaries beyond the region such<br />
as K _ awhia Estuary, for snapper spawning 36 .<br />
Over the summer months when warmer<br />
currents move down from the north, a number<br />
of ocean-going species visit the <strong>Taranaki</strong><br />
coastline following the abundance of food. The<br />
most common species are sunfi sh, fl ying fi sh,<br />
marlin, albacore, skipjack and yellow-fi n tuna,<br />
mak _ o and blue sharks.<br />
(D) <strong>BIODIVERSITY</strong> OF<br />
MARINE PROTECTED AREAS<br />
Rob Tucker<br />
The marine protected areas of <strong>Taranaki</strong><br />
represent a range of marine habitats including<br />
intertidal and subtidal reefs, boulder fi elds<br />
and sand fl ats. There are two marine reserves<br />
(Parininihi Marine Reserve established in<br />
2006 and Tapuae Marine Reserve established<br />
in 2008) and one marine protected area<br />
established in 1983 (Sugar Loaf Islands (Ng _ a<br />
Motu) Marine Protected Area).<br />
The establishment of no-take marine reserves<br />
on the North <strong>Taranaki</strong> coast has created<br />
opportunities for scientifi c studies to be<br />
undertaken to compare areas impacted from<br />
uses such as fi shing, with areas that are<br />
protected from fi shing. Monitoring in marine<br />
reserves will determine if the sea life is<br />
infl uenced by human activities including fi shing<br />
and development or if other factors such as<br />
the weather or habitat complexity play a more<br />
important role.
THE SECRET LIFE OF A<br />
TARANAKI ESTUARY<br />
Some of them thrive on gardening. Some are hairy but handy<br />
swimmers. Others have an important and long-standing role in<br />
gastronomic tradition. And just about all are fussy about the quality of<br />
their home environment.<br />
They are the shellfi sh, marine snails, worms and other tiny marine<br />
animals that make their homes in and around our estuaries. They may<br />
be out of sight and out of mind for most of us but they are vital as both<br />
maintainers and indicators of the quality of coastal waters.<br />
And they’ve evolved some interesting strategies as they cope with the<br />
challenges of life in the zone where water, earth and air meet.<br />
Titiko, or mud snails, are the gardeners, ploughing the bottom sediment<br />
at low tide, sucking in and excreting twice their body weight in an<br />
hour. In doing so they fi lter the mud, improving its properties to favour<br />
growth of the plants upon which they feed. They have few predators<br />
and live for a dozen years or more. And when mating, any individual<br />
can take the role of either gender. Very effi cient.<br />
What they don’t like is pollutants, especially heavy metals. This is a<br />
sensitivity they share with many of their neighbours, including the well<br />
known and much-loved pipi.<br />
A traditional favourite food of M _ aori (and more than a few non-M _ aori),<br />
the pipi sucks water to its gills to be strained for food. Young larvae<br />
settle at the high tide mark and move down into the estuary as they<br />
grow.<br />
Pipi shells became tools for scaling fi sh and scraping fl ax, and were<br />
also used as rattles.<br />
Other estuary shellfi sh found in <strong>Taranaki</strong> have similar cultural<br />
pedigrees. Wh _ angai karoro, or large trough shells, provided pendants<br />
as well as food. Tuangi (also known as ‘tuangi cockles’, though they<br />
are not a true cockle) saw use as delicate carving tools and rattles<br />
after their meat was consumed.<br />
And the hairy but handy swimmers? They’re the marine bristleworms,<br />
or polychaetes (rhymes with parakeets, though there the similarity<br />
ends), who use their fi ne bristles for swimming as well as holding<br />
themselves in their burrows. Some of these creatures are also the<br />
do-it-yourselfers of the estuary, constructing their own ‘shell’ in the<br />
form of a tube made of sand and shell segments, held together with a<br />
sticky secretion.<br />
So they’re a mixed bunch, these estuary dwellers, and they put the<br />
diversity into biodiversity. And together they make <strong>Taranaki</strong>’s estuaries<br />
very much greater than the sum of their parts.<br />
Tongaporutu estuary.<br />
Titiko or mud snail (Amphibola crenata).<br />
Pipi (Paphies australis).<br />
34 Ministry of Fisheries, May 2008. Fisheries Plan North West Finfi sh Fishery. Version 4.1<br />
35 Rush, M. 2006. Netting Coastal Knowledge: A report into what is known about the South <strong>Taranaki</strong>-Whanganui marine area. Published by the Department of Conservation, Wanganui Conservancy.<br />
36 Morrison, M. 2008. Presentation to the Coastal Planners Group.<br />
<strong>Taranaki</strong> <strong>Regional</strong> <strong>Council</strong><br />
Andrew Spurgeon<br />
Andrew Spurgeon<br />
State of the Environment Report 2009<br />
173
174<br />
COASTAL AND MARINE ENVIRONMENT<br />
LOOKING FOR PATTERNS<br />
IN NATURE<br />
Although he might be embarrassed at the comparison, Barry<br />
Hartley has a similar outlook on biodiversity that Darwin and his<br />
contemporaries would have had – everything in nature is fascinating,<br />
worthy of study and intrinsically connected.<br />
Barry claims to have retired in 1993, but really that just meant<br />
being able to spend more time on his passion – gathering data and<br />
observations about the biodiversity, particularly of birds, and pondering<br />
the trends and patterns.<br />
Barry is more than just a bird watcher. He also gathers data on when<br />
different plant species are fl owering or fruiting, recognising that<br />
patterns of bird diversity will refl ect the availability of food for them.<br />
Since 1996, Barry has monitored bird visitors to nearby estuaries.<br />
M _ okau is the most fascinating and diverse. Others he watches include<br />
Urenui, Tongaporutu, Mohakatino and Awakino (technically both the<br />
M _ okau and the Awakino estuaries are in the Waikato region).<br />
In 20 years he has observed more than 70 different types of birds using<br />
these estuaries. He has detected seasonal patterns – pied stilts that<br />
return each year to the South Island to breed, royal spoonbills that<br />
have looked at one stage like they might set up a nest, and dozens<br />
of other shore birds, some of which include Siberia or Alaska in their<br />
annual travels.<br />
The dead birds that wash up on the South <strong>Taranaki</strong> coast also tell a<br />
_story.<br />
Each month Barry surveys a 12.5 km stretch of coast between<br />
Okato and Opunake, gathering a lot of information about birds that<br />
make the wide oceans their home. The short-tailed sooty shearwaters<br />
migrate to the North Pacifi c to breed. When they get washed up on the<br />
South <strong>Taranaki</strong> coast, it could be due to storm conditions out at sea, or<br />
a lack of food.<br />
Sooty shearwaters, or the muttonbirds, migrate past our coast<br />
twice a year, and again, the numbers turning up on the beach reveal<br />
information about the ocean conditions. Barry believes the data he<br />
collects could also provide information about changes in climate.<br />
A few years ago, Barry collected 1,600 dead prions (small ocean-going<br />
birds), an unusual event compared to the one or two he would normally<br />
TARANAKI – WHERE WE STAND<br />
Barry Hartley monitoring seabirds.<br />
fi nd. He attributes the deaths to starvation, maybe due to storms,<br />
maybe due to change in climate affecting food supply.<br />
Every so often, Barry picks up a dead bird that has been banded. This<br />
is like fi nding treasure, as tracing the bird’s origins provides new<br />
information on its behaviour. A few years ago, he found a yellow-eyed<br />
penguin 700 km from where it had been banded. Fiordland penguins<br />
have also been found, rather a long way from home.<br />
Barry’s regular surveys reveal seasonal trends in several species. Little<br />
shags are known to breed in only two locations in <strong>Taranaki</strong>, but there<br />
are more of them around than these could account for. Where else do<br />
they go to breed? Kingfi shers turn up in their numbers in the estuaries<br />
during winter targeting mudcrabs, maybe they need something salty<br />
in their diet. Black-fronted dotterels are normally rare north of the<br />
Turakina River, but one year, they were seen in reasonable numbers,<br />
for no apparent reason. Barry suspects it might have had something to<br />
do with feeding or breeding.<br />
Red-billed gulls are another coastal bird with an interesting pattern.<br />
They breed on the Sugar Loaf Islands and are observed on the coast<br />
and around Lake Rotomanu. There is a real absence of them around<br />
the South <strong>Taranaki</strong> coast during the summer but in winter they can be<br />
there in fl ocks of up to 400.<br />
Barry suspects there are two distinct populations – the North <strong>Taranaki</strong><br />
birds and a southern population that returns to Kaikoura to breed (as<br />
evidenced by banded birds), only venturing up to South <strong>Taranaki</strong> for<br />
the winter.<br />
Rob Tucker
Volcanic material has formed features on the land and under the sea.<br />
Sugar Loaf Islands (Ng – a Motu) Marine Protected<br />
Area (SLIMPA) and Tapuae Marine Reserve<br />
The Ng _ a Motu/Sugar Loaf Islands, just offshore from New Plymouth, are<br />
eroded remnants of volcanic domes, forming a group of low sea stacks<br />
and seven islands that provide a unique semi-sheltered environment<br />
along a coastline that is generally very exposed. The subtidal marine<br />
habitats around the Sugar Loaf Islands include spectacular canyons,<br />
caves, rock faces with crevices and overhangs, large pinnacles, boulder<br />
fi elds and extensive sand fl ats. Distinct from the rest of the Cape Egmont<br />
coastal unit, these low sea stacks and islands provide the fi rmest and<br />
most stable substrate on the open <strong>Taranaki</strong> coast.<br />
The Sugar Loaf Islands (Ng _ a Motu) Marine Protected Area and the<br />
recently gazetted Tapuae Marine Reserve take in these diverse range of<br />
habitats and sheltered areas for marine life around the Seal Rocks, and<br />
also intertidal and subtidal habitats typical of the Cape Egmont coastal<br />
unit (Figure 5.10).<br />
The Sugar Loaf Islands are important for 19 species of seabirds, with<br />
approximately 17,000 seabirds nesting here. Prominent species include<br />
diving and grey-faced petrels, red-bill and black backed gulls, and whitefronted<br />
tern. The islands also have a small breeding colony of New<br />
Zealand fur seal. Reasonably static seal numbers have been recorded<br />
around the islands from 1990 to 2001 37 .<br />
The Sugar Loaf Islands (Ng _ a Motu) Marine Protected Area.<br />
Rob Tucker<br />
Waters surrounding the islands are extremely rich in species diversity<br />
with at least 89 species of fi sh, 33 species of encrusting sponges, 28<br />
species of bryozoans (small coral like organisms) and nine types of<br />
nudibranchs (small sea slugs). The northernmost records of some cooler<br />
water species as well as the southernmost records of some warmer<br />
water species are found in this area, refl ecting the dynamic currents that<br />
infl uence this coast. Triplefi ns, and other reef associated fi sh (e.g., red<br />
moki, leatherjackets, butterfl y perch, scarlet wrasse, spotty, blue cod)<br />
and short-tailed stingray reside here. Ocean species such as John Dory,<br />
kingfi sh, kahawai, gurnard, snapper, trevally and mullet are other fi sh<br />
species commonly seen. The area is also home to many rock lobster.<br />
Fish, rock lobster and invertebrates have been monitored each summer<br />
since 1999 during the summer months (apart from 2003-04 due to<br />
unfavourable weather conditions). Information on the distribution of the<br />
kelp Ecklonia radiata has also been collected.<br />
Results from the fi rst three years of monitoring suggested that there were<br />
signifi cantly more fi sh, and more types of fi sh within the marine protected<br />
area than outside it 38 . This was attributed to there being better habitat<br />
for fi sh within the marine protected area rather than to the various fi shing<br />
restrictions. However, there did appear to be a greater abundance of<br />
snapper, blue cod and rock lobster, all of which are targeted by fi shers,<br />
within the largely ‘no-take’ conservation area compared to the rest of the<br />
marine protected area and to the sites beyond it.<br />
Red moki and encrusting sponges.<br />
37 Miller, R, Williams, B 2002. New Zealand Fur Seal (Arctocephalus forsteri) Numbers at the Sugar Loaf Islands (Ng _ a Motu) Marine Protected Area, New Plymouth. Published by Department of<br />
Conservation, Wanganui Conservancy.<br />
38 Miller, R. Williams, B, Duffy, D 2005. Reef Fish of the Sugar Loaf Islands (Ng _ a Motu) Marine Protected Area. Department of Conservation Research and Development Series no. 226.<br />
Rob Tucker<br />
Department of Conservation<br />
State of the Environment Report 2009<br />
175
176<br />
COASTAL AND MARINE ENVIRONMENT<br />
Parininihi Marine Reserve<br />
The Parininihi Marine Reserve (Figure 5.11) includes a section of the<br />
wild high-energy North <strong>Taranaki</strong> coast. Along this part of the coast, sand<br />
is constantly on the move and the environment is forever changing.<br />
The expansive reef and surrounding sand and mud areas are home to a<br />
variety of fi sh species (such as blue cod, blue moki, red moki, gurnard,<br />
John Dory, leatherjackets, kahawai, red cod, tarakihi, trevally and<br />
snapper) and rock lobster populations.<br />
However, what makes the area particularly special is its collection of<br />
rare and exotic sponges which spread in a vividly coloured carpet across<br />
reef ledges in the area. These dense assemblages cover about 75%<br />
of available reef surface and are among the densest and most diverse<br />
communities in New Zealand. One report has suggested that sites<br />
on the Pariokariwa Reef are important on a national and global level,<br />
comparable to sites in Antarctica 39 .<br />
Baseline surveys of both fi sh and rock lobsters in the Parininihi Marine<br />
Reserve area and on the adjacent Waikiekie reef were conducted in<br />
the 2006-07 and 2007-08 monitoring seasons, although they were<br />
somewhat limited due to the weather.<br />
(E) THREATENED MARINE SPECIES.<br />
New Zealand has 368 threatened marine species 40 . This includes<br />
4.5% of the seaweeds, 2.4% of the invertebrates, 4.2% of the fi sh and<br />
62.3% of New Zealand’s 122 species of seabird (excluding waders and<br />
shorebirds). An estimated 16.7% of New Zealand’s 48 species of marine<br />
mammals are threatened.<br />
Great white sharks and basking sharks are the most at risk of extinction<br />
and are classifi ed as gradual decline. Great white sharks occur<br />
throughout <strong>Taranaki</strong> and are fully protected in New Zealand waters<br />
under the Wildlife Act 1953. It is illegal to hunt, kill or harm them within<br />
the 200 nautical miles limit.<br />
Figure 5.10: Sugar Loaf Islands (Ng _ a Motu) Marine Protected Area and Tapuae<br />
Marine Reserve.<br />
TARANAKI – WHERE WE STAND<br />
Encrusting sponges, Paraninihi Marine Reserve.<br />
Threatened marine mammals observed in <strong>Taranaki</strong> waters include<br />
orca/killer whales (Orcinus orca), humpback whales (Megaptera<br />
novaeangliae), southern right whales (Eubalaena australis) and M _ aui’s<br />
dolphins (Cephalorhynchus hectori maui). M _ aui’s dolphin and orca are<br />
listed as nationally critical i.e. they have a very high risk of extinction,<br />
and southern right whales are listed as nationally endangered 40 .<br />
The M _ aui’s dolphin is the world’s smallest dolphin at 1.7 m long and with<br />
an overall population size of about 111 animals is the rarest. This small<br />
population size, together with biological factors including late maturity,<br />
slow reproductive rate, and longevity make the population particularly<br />
susceptible to premature deaths of individual animals. M _ aui’s dolphins<br />
are found only along the west coast of the North Island of New Zealand<br />
and so have a limited habitat range. Fishing is the primary cause of<br />
human-induced mortality (set netting in particular) where the cause of<br />
mortality is known. However, other causes of mortality probably include<br />
pollution, plastic debris, and vessel strike.<br />
Figure 5.11: Parininihi Marine Reserve.<br />
39 Battershill, C.N. and Page, M.J. 1996. Preliminary Survey of Pariokariwa Reef North <strong>Taranaki</strong>. Prepared by NIWA for the Department of Conservation.<br />
40 Hitchmough, R; Bull, L; Cromarty, P. (Comps) 2005. New Zealand Threat Classifi cation System Lists. 2005. Science & Technical Publishing, Department of Conservation, Wellington.<br />
Department of Conservation
LATTER-DAY WHALE HUNTERS<br />
ON RIGHT TRACK<br />
They’re hunting southern right whales in <strong>Taranaki</strong> waters but it’s nothing<br />
like the bad old days when an onslaught of hunters cleaned out what<br />
had been an important breeding ground.<br />
Rather than deadly harpoons, darts are the weapon of choice these<br />
days as small tissue samples are collected from visiting southern right<br />
whales as part of a Department of Conservation / University of Auckland<br />
research project.<br />
The aim is to fi nd out whether the whales cruising local waters are<br />
genetically distinct from the 1,000-strong population that breeds near<br />
the remote Auckland Islands, nearly 500 km south of the South Island.<br />
Evidence so far suggests the locals are a separate but desperately tiny<br />
group with as few as 11 breeding females.<br />
It’s a far cry from early colonial days when the South <strong>Taranaki</strong> Bight was<br />
known as Mothering Bay for the number of whales breeding in the area,<br />
and settlers complained about the noise of the large mammals. Adults<br />
average 14.5 m long and newborn calves are between 4.5 m and 6 m.<br />
Southern rights, or tohor _ a, were hunted commercially from 1791 to the<br />
mid 1900s and have been protected by international agreement since<br />
1935. Two whaling stations were established in New Plymouth, one<br />
near the Huatoki Stream and one at Ng _ amotu.<br />
The species’ English name refl ects its history: To whalers, they were<br />
the ‘right’ ones to kill – large, slow-moving, buoyant when dead and<br />
providing good quantities of bone and oil.<br />
While the tohor _ a population around the Auckland Islands appears to be<br />
recovering well from the decades of mass slaughter, those closer to our<br />
home are evidently struggling.<br />
Since 1990 there have been 30 reported sightings of southern right<br />
whales in <strong>Taranaki</strong> waters, seven of them cow-calf pairs. This indicates<br />
that local waters are an important breeding area for tohor _ a, who<br />
generally return to the same breeding grounds every three years 41 .<br />
Tohor _ a are mainly black, with no dorsal fi n. Spray from their blowhole<br />
is V-shaped. Anyone spotting one off the coast should call DOC on<br />
0800 362 468.<br />
41 Patenaude, N. 2003. Sightings of Southern Right Whales Around ‘Mainland’ New Zealand. Science for Conservation 225.<br />
Southern right whale cruising along the Whanganui-<strong>Taranaki</strong> coast.<br />
Figure 5.12: Sightings of southern right whales around the <strong>Taranaki</strong> coastline.<br />
Callum Lilly, Department of Conservation<br />
State of the Environment Report 2009<br />
177
178<br />
COASTAL AND MARINE ENVIRONMENT<br />
Much of what we know about marine mammals has been determined<br />
from stranded animals. Scientists take measurements, determine<br />
their ages and diet and, from genetics, draw conclusions about the<br />
distribution and size of marine mammal populations. Thus stranded<br />
marine mammals are an important source of information about marine<br />
mammal diversity.<br />
Since 1913 there have been 117 strandings of marine mammals<br />
recorded in the <strong>Taranaki</strong> region (Figure 5.13). These were individual<br />
animals in all but six incidents. <strong>Taranaki</strong> does not have mass stranding<br />
events like those that occur in places such as Golden Bay and Stewart<br />
Island. Three is the most animals that have stranded at any one time.<br />
Most are found dead and of those few found alive only one animal<br />
was refl oated, a pygmy sperm whale, but it later re-stranded. The most<br />
frequently stranded species is the common dolphin (19 incidents).<br />
Beaked whales are the least known of all the marine mammals. They<br />
are reclusive creatures that are not often seen at sea and new species<br />
have been discovered only in the past decade. Of interest is the fact that<br />
seven different species of beaked whales have stranded on <strong>Taranaki</strong><br />
beaches in 31 individual stranding incidents (Figure 5.13).<br />
Figure 5.13: Stranded marine mammals recorded since 1913 around <strong>Taranaki</strong>.<br />
42 Ministry of Fisheries, 2008. Fisheries Plan North West Finfi sh Fishery. Version 4.1.<br />
TARANAKI – WHERE WE STAND<br />
Sperm whales have stranded on <strong>Taranaki</strong> shores 12 times with three<br />
whales stranding at P _ ihama in 1988 and two at Waverley Beach in<br />
December 2007. Single sperm whales have stranded 10 times. There<br />
is a process in place to ensure precious customary materials are made<br />
available for iwi. It is illegal to remove any part of a stranded marine<br />
mammal unless the animal has been there for a long time, and decayed,<br />
and the bone has naturally separated.<br />
5.3.2 HOW IS MARINE AND<br />
COASTAL <strong>BIODIVERSITY</strong><br />
MANAGED IN TARANAKI?<br />
(A) PLANS<br />
The Proposed <strong>Regional</strong> Policy Statement identifi es the importance<br />
of indigenous biodiversity, including that in the coastal and marine<br />
environment. The <strong>Regional</strong> Coastal Plan for <strong>Taranaki</strong> recognises the<br />
importance of safeguarding the coastal and marine biodiversity,<br />
particularly in the areas of signifi cant conservation values. The New<br />
Zealand Coastal Policy Statement is currently in the process of being<br />
reviewed, and may have important implications for the review of the<br />
<strong>Regional</strong> Coastal Plan for <strong>Taranaki</strong>. Initial indicators are that the New<br />
Zealand Coastal Policy Statement will require coastal plans to give<br />
greater recognition to the protection of indigenous biodiversity in the<br />
coastal marine area.<br />
The <strong>Taranaki</strong> region will be covered by two specifi c fi sheries plans<br />
developed by the Ministry of Fisheries in collaboration with tangata<br />
whenua and relevant stakeholder interests: Fisheries Plan North West<br />
Finfi sh Fishery 42 and Fisheries Plan North West Shellfi sh. It is expected<br />
these plans will be implemented within the next two-three years. The<br />
fi nfi sh plan covers the inshore fi sheries along the entire length of the<br />
North Island’s west coast. Key species included in the plan are snapper,<br />
tarakihi, red gurnard, grey mullet, fl atfi sh, trevally, school shark, rig,<br />
h _ apuku (groper), kahawai and leatherjacket.<br />
(B) COMMERCIAL FISHING MANAGEMENT<br />
The Ministry of Fisheries primarily manages fi shing through the quota<br />
management system (QMS). Under the QMS, a total allowable catch<br />
(TAC) is set for each fi sh stock to constrain overall catches. TACs are set<br />
at levels to ensure the long-term sustainable use of fi sheries resources.<br />
When total allowable commercial catch levels are set, M _ aori customary<br />
fi shing interests, recreational fi shing interests in the fi sh stock concerned<br />
and all other mortality to that stock caused by fi shing are considered.<br />
The <strong>Taranaki</strong> region is a part of the generic Fisheries Management Area<br />
8 that extends between Tirua Point in the north and Pukerua Bay in the<br />
south. Each management area is covered by statistical areas which are<br />
areas where the Ministry of Fisheries requires commercial fi shers to<br />
report where they have caught fi sh.
The total allowable commercial catch (TACC) for the North Island west<br />
coast snapper fi shery was reviewed and reduced in 2005 in an effort<br />
to bring about rebuilding rate for the snapper stock within a projected<br />
timeframe. Some <strong>Taranaki</strong> commercial fi shers are experiencing<br />
problems with this measure as they are having diffi culty in constraining<br />
their catches against the lower TACC due to high snapper abundance<br />
in the region. Total allowable catches for some other key species are<br />
listed in Table 5.9.<br />
Table 5.9: North Island West Coast Total Allowable Catches (TAC)s, Total Allocable Commercial Catches (TACCs) and customary and recreational allowances for some<br />
fi nfi sh species(tonnes).<br />
Stock TAC TACC Customary<br />
allowance<br />
Recreational<br />
allowance<br />
Other fi shing-related<br />
mortality allowance<br />
Snapper (SNA8) 1785 1300 43 312 130<br />
Tarakihi (TAR8) - 225 1 - - -<br />
Gurnard (GUR8) - 543 - - -<br />
Rig (SPO8) 401 310 - - -<br />
Kahawai (KAH8) 1040 520 115 385 20<br />
Data: Ministry of Fisheries. 2008.<br />
Note 1: TAC not yet set, so the only allocation is to the commercial sector, non-commercial fi shers are still entitled to fi sh for this species.<br />
a) Snapper c) Red gurnard<br />
b) Tarakihi d) Rig<br />
Figure 5.14: Commercial landings (tonnes) and Total Allocable Catches (TACC) (tonnes) of key fi sh stocks.<br />
Figure 5.14 illustrates the commercial landings of fi ve key fi sh species<br />
found off the <strong>Taranaki</strong> coast of greatest interest for both recreation<br />
and commercial fi shers (snapper, tarakihi, gurnard and rig). Each graph<br />
illustrates the TACC and total landings. The maps beside each graph<br />
illustrate the quota management area for each fi sh stock.<br />
Some of the fi shing methods used on the North Island West coast,<br />
trawling in particular, involve the use of equipment that comes into<br />
contact with the seabed, and can therefore impact on the animals<br />
State of the Environment Report 2009<br />
SOURCE: Ministry of Fisheries 2008.<br />
179
180<br />
COASTAL AND MARINE ENVIRONMENT<br />
and plants living on or attached to the bottom of the sea. Some of this<br />
equipment is heavy enough to leave furrows through soft sediment and<br />
dislodge harder material. Figure 5.15 shows the distribution of bottom<br />
trawl, bottom pair trawl and mid-water trawl fi shing activity on the<br />
North Island west coast. The map shows indicative fi shing effort of<br />
bottom and mid-water trawl.<br />
Commercial and recreational fi shers are represented on the <strong>Taranaki</strong><br />
Fisheries Liaison Committee. This is a long-standing multi-stakeholder<br />
fi sheries forum which includes stakeholder representatives from all<br />
sectors within the region as well as the Department of Conservation and<br />
the <strong>Council</strong>. This committee is consulted by the Ministry of Fisheries on<br />
a number of fi sheries management issues.<br />
(C) MANAGING RECREATIONAL USE<br />
Recreational fi shing takes place for fun and for food to feed family and<br />
friends. Recreational fi shing is primarily managed by daily bag limits,<br />
minimum legal sizes, method controls and area limits.<br />
Unlike commercial fi shers, recreational fi shers are not required to report<br />
the quantities of fi sh that they catch. However, survey techniques are<br />
used to estimate recreational catch, which in turn provides an indication<br />
of recreational use. Table 5.10 shows estimates of recreational catches<br />
of some species. The estimates are derived from information obtained<br />
in diary surveys where a randomly identifi ed group of fi shers kept a<br />
diary for 12 months recording what they caught. Nationwide surveys<br />
were undertaken in 1996 and 2000. Accuracies for both surveys have<br />
been questioned – the 1996 estimates may be lower than the actual<br />
amounts and the 2000 fi gures are probably over-estimates. However,<br />
the point estimates and ranges do indicate the likely magnitude of<br />
the recreational catch particularly when compared with the actual<br />
commercial catch.<br />
A recent study gathered information about the South <strong>Taranaki</strong> coast<br />
through a literature review, running workshops with local organisations,<br />
carrying out face-to-face interviews with people who were familiar with<br />
the coast and undertaking a postal survey 43 . Eighty-fi ve people took part<br />
in face to face interviews, 55 people returned written questionnaires<br />
and seven groups took part in workshops. 68% of people responding to<br />
the requests for information 49 had more than 20 years experience of the<br />
area and many had lived, fi shed and enjoyed the coast for more than 40<br />
years. The observations of change over that time, although anecdotal,<br />
are therefore based on many years. The majority of respondents (70%)<br />
used the coast for recreational fi shing as the project approach targeted<br />
individuals with knowledge and experience of the coast.<br />
Fishing has been important to the local p _ akeh _ a and tangata whenua in<br />
South <strong>Taranaki</strong> since it was fi rst settled. In recent years, improvements<br />
TARANAKI – WHERE WE STAND<br />
Figure 5.15: Trawl activity within the West Coast North Island.<br />
in technology and the advent of more affordable boats have seen<br />
increased numbers of people enjoying this pastime. Participants were<br />
asked to identify what changes they had noticed in the area. More<br />
than 50% of survey respondents believed that fi shing had got harder<br />
Diving for crayfi sh.<br />
43 Rush, 2006. Netting Coastal Knowledge: A report into what is known about the South <strong>Taranaki</strong>-Whanganui marine area. Published by the Department of Conservation, Wanganui Conservancy.<br />
Rob Tucker
Table 5.10: Recreational catch estimates for key North Island West Coast stocks with commercial catch as a comparison.<br />
Fish stock Range (tonnes)<br />
1996<br />
in recent years. This they attributed to improved technology (e.g. fi sh<br />
fi nders, better boats etc.), the management of fi shing through the quota<br />
management system, the number of trawlers – past and present – the<br />
increased number of fi shers, and sand covering reefs. Twenty fi ve<br />
percent of respondents considered that fi shing was getting easier. This<br />
they attributed to improved technology, the management of fi sh through<br />
the quota management system and the voluntary trawl agreement. The<br />
remaining 25% of respondents felt that fi shing was as good as it had<br />
ever been. They attributed this to the weather limiting access and so<br />
preventing over-fi shing and to improved technology such as better boats<br />
so that they could travel further to fi sh.<br />
Those respondents that felt that fi shing had changed made one or<br />
several of the following observations:<br />
a decrease in the shoreline fi sh stocks;<br />
a change in the amount of shellfi sh such as tuatua, mussels and p _ aua;<br />
an increase in the number and size of paddlecrabs;<br />
a decline in the kahawai;<br />
an increase in the number of spiky dogfi sh;<br />
a decrease in the number and size of groper or h _ apuku; and<br />
that to catch blue cod you had to go further off shore.<br />
The Ministry of Fisheries notes that there has been no evidence of a<br />
decrease in shoreline stocks, in fact, snapper have become extremely<br />
abundant in <strong>Taranaki</strong>. There is also no data to support a decline in<br />
kahawai abundance nor the need to travel further offshore to catch blue<br />
cod. However, the Ministry of Fisheries collects information at a larger<br />
scale (such as at the level of the quota management areas) than at the<br />
scale of this study.<br />
(D) CUSTOMARY FISHING<br />
Estimate (tonnes)<br />
1996<br />
Fishing and the gathering of other kaimoana was, and remains today,<br />
a fundamental part of being M _ aori and living on the <strong>Taranaki</strong> coast<br />
with tangata whenua holding a very strong relationship with the sea.<br />
Traditional management entails a whole body of knowledge about<br />
the resource and how and when to access it. The report into the<br />
South <strong>Taranaki</strong> coastal area referred to above noted that customary<br />
management has had to adapt to new circumstances, and while there<br />
may have been some loss of adherence to traditional management<br />
Range (tonnes) Estimate<br />
2000<br />
practices in the past, there is evidence that this may well return with<br />
the efforts of local iwi. Customary knowledge is held sacred by tangata<br />
whenua and only passed on to those who will look after that knowledge.<br />
Traditional management governing fi shing practices within an area of<br />
signifi cance to tangata whenua can be undertaken using the Fisheries<br />
(Kaimoana Customary Fishing) Regulations 1998. Customary rights<br />
provided for under these regulations allow tangata whenua to establish<br />
management areas (m _ ataitai reserves) where they can create bylaws<br />
to oversee fi shing within these designated reserves and to create<br />
management plans for their overall area of interest. The kaimoana<br />
customary fi shing regulations take effect in an area after tangata<br />
whenua successfully notify tangata kaitiaki and boundaries of their rohe<br />
moana and awa. If tangata whenua choose not to utilise the kaimoana<br />
customary fi shing regulations they can still exercise their customary right<br />
through issue of a customary fi shing permit under the Fisheries (Amateur<br />
Fishing) Regulations 1986. The identifi cation and notifi cation of tangata<br />
kaitiaki and rohe moana requires considerable consultation and to date<br />
no appointments have been made within the <strong>Taranaki</strong> region.<br />
Ministry of Fisheries-led fi sheries plans, including the North West Finfi sh<br />
Fishery, North West Shellfi sh, and North Island Eel (tuna) fi sheries plans<br />
recognise important taonga species, including h _ apuku, kahawai, p _ atiki,<br />
toheroa, kina, green-lipped mussel, pipi and tuna. These and other<br />
species are listed in deeds of settlement reached with various iwi and<br />
hap _ u within the <strong>Taranaki</strong> region.<br />
(E) MARINE PROTECTION<br />
Actual commercial<br />
catch - 2000<br />
Snapper (SNA 8) 215-255 240 215-255 661 1500<br />
Tarakihi (TAR8) 25-35 28 25-35 30 225<br />
Gurnard (GUR8) 23-35 28 25-35 40 534<br />
Kahawai (KAH8) no data 204 no data 441 272<br />
SOURCE: Ministry of fi sheries. 2008.<br />
Marine reserves are the highest level of protection. Two marine reserves<br />
have been established in <strong>Taranaki</strong>: Parininihi Marine Reserve (1,844 ha)<br />
and Tapuae Marine Reserve (1,404.3 ha). Together they cover an area<br />
of 3,248.3 ha. Marine parks represent another level of protection. The<br />
Sugar Loaf Islands (Ng _ a Motu) Marine Protected Area covers 489.7 ha.<br />
Other forms of protection include cable and pipeline zones where certain<br />
types of fi shing are restricted. They stop netting and prohibit anchoring.<br />
The different types of areas around the <strong>Taranaki</strong> coast with some form<br />
of protection from fi shing activities are set out in Table 5.11. However,<br />
fi shing restrictions tend not to be enforced in all areas.<br />
State of the Environment Report 2009<br />
181
182<br />
COASTAL AND MARINE ENVIRONMENT<br />
Table 5.11: Area-based fi shing restrictions in <strong>Taranaki</strong>.<br />
Area restriction Area Length of coastline affected<br />
between Patea and Awakino<br />
TARANAKI – WHERE WE STAND<br />
Fishing sector effected<br />
Parininihi Marine Reserve 1,844 ha 5.6 km All fi shing prohibited.<br />
Shape of marine reserve still allows<br />
surfcasting along 3km of coastline.<br />
Tapuae Marine Reserve 1,404.3 ha 5km All fi shing prohibited.<br />
Sugar Loaf Islands (Ng _ a Motu)<br />
Marine Protected Area<br />
489.7 ha 2 km Commercial fi shing (except trolling for<br />
kingfi sh and kahawai) prohibited.<br />
Recreational set netting and longlining<br />
prohibited.<br />
i.e. recreational fi shing, diving and potting<br />
for rock lobster permitted.<br />
Pohokura pipelines and platforms 872 ha 1 km All vessels greater than 9 m in length<br />
prohibited from anchoring.<br />
Trawling prohibited.<br />
No restrictions on any other fi shing.<br />
M _ aui pipeline – _ Oaonui 14,100 ha 8 km No fi shing or anchoring except for fi shing<br />
vessels being used to set or lift nets or<br />
rock lobster pots, or paua or kina fi shing<br />
as long as these activities are carried<br />
out in daylight hours and do not involve<br />
attachments to the seabed and are within<br />
2 miles of low watermark.<br />
Note this restricts commercial set nets as<br />
they leave gear out overnight.<br />
M _ aui A and B pipelines Not calculated NA Restricted area for all New Zealand ships.<br />
Urenui no trawl zone 15,340 ha 45 km Prohibits trawling (Fisheries (Central Area<br />
Commercial Fishing) regulations 1986.<br />
Does not impact any other fi shing sector.<br />
New Plymouth to Awakino no trawl zone 9,100 ha 25 km Voluntary no trawl zone.<br />
Does not impact any other fi shing sector.<br />
Cape Egmont to Rangitikei river<br />
no trawl zone<br />
Set net ban – Pariokariwa Point to<br />
Maunganui Bluff.<br />
36,000 ha 99 km Voluntary no trawl zone.<br />
Does not impact any other fi shing sector.<br />
not calculated 37 km Recreational set netting prohibited to<br />
7 nautical miles.<br />
Commercial set netting prohibited out<br />
to 4 nautical miles, with some limited<br />
commercial netting beyond that.
M _ aui’s dolphin (Cephalorhynchus hectori maui).<br />
(F) THREATENED SPECIES MANAGEMENT<br />
To protect Maui’s dolphins, fi sheries regulations are in place that ban<br />
set netting within seven nautical miles of the coast from Maunganui<br />
Bluff (north of Dargaville) to Pariokariwa Point (north of New Plymouth)<br />
(Figure 5.16). Some limited commercial netting can still continue outside<br />
four nautical miles. A threat management plan is being prepared<br />
setting out strategies to reduce those threats to Maui’s dolphins which<br />
are human-induced. The plan introduces proposals to manage threats<br />
including fi shing related options, a marine mammal sanctuary, research<br />
and monitoring. The <strong>Taranaki</strong> region is at the southern end of their<br />
distribution and although there are not large numbers of dolphins seen<br />
here, small numbers of deaths can have drastic implications for the<br />
survival of the population. A West Coast North Island Marine Mammal<br />
Sanctuary has recently been gazetted for the area from Manganui Bluff<br />
(north of Kaipara Harbour) to _ O _ akura Beach out to 12 nautical miles. This<br />
contains restrictions on the use of acoustic devices and mining (other<br />
than for petroleum) within two nautical miles.<br />
Figure 5.16: Map of M _ aui’s dolphin sightings and set net ban.<br />
Silvia Scali, Department of Conservation<br />
The invasive Undaria pinnatifi da.<br />
(G) EXOTIC PEST MANAGEMENT<br />
The discharge of ship ballast water and ship hull cleaning have been<br />
identifi ed as the two signifi cant potential causes of the introduction<br />
of exotic marine organisms into New Zealand waters. <strong>Taranaki</strong> is<br />
vulnerable to the introduction of organisms from overseas through the<br />
port. The majority of port trade involves the movement of international<br />
ships. Ships are required to discharge ballast water outside of the<br />
coastal marine area (12 nautical miles) prior to entering Port <strong>Taranaki</strong>.<br />
Undaria pinnatifi da, well known to miso soup lovers everywhere as<br />
‘wakame’, has been found in Port <strong>Taranaki</strong>, and is now identifi ed as an<br />
eradication pest plant in the Pest Management Strategy for <strong>Taranaki</strong>:<br />
Plants. The plants have been found concentrated mainly around the<br />
public boat ramp and jetty areas in the eastern corner of the port.<br />
Undaria is an invasive seaweed species that can reach an overall length<br />
of 1-3 metres. The plant matures in 40-60 days and produces millions of<br />
spores. Undaria spreads by fouling ship hulls and can rapidly colonise<br />
many different substrate, ranging from rocky reefs, mobile cobble<br />
habitats, soft sediments, other seaweeds, ropes, buoys, wharf piles and<br />
on ship hulls.<br />
Given that Undaria is very fast growing, no New Zealand native<br />
seaweeds can compete with it, giving Undaria a free reign to invade<br />
gaps in the substrate, grow on other organisms and change the natural<br />
character of the area. The seaweed can form dense forests resulting<br />
in competition for light and space which may lead to the exclusion or<br />
displacement of native plant and animal species.<br />
An initial trial was undertaken where Undaria was removed and jetty<br />
piles were cleared and wrapped with black plastic in order to prevent<br />
anything growing back on them. The trial was partially successful,<br />
but did not eradicate Undaria completely. A programme of on-going<br />
monitoring and removal has been implemented and is undertaken by<br />
the <strong>Taranaki</strong> <strong>Regional</strong> <strong>Council</strong>, the Department of Conservation and Port<br />
<strong>Taranaki</strong> Ltd.<br />
<strong>Taranaki</strong> <strong>Regional</strong> <strong>Council</strong><br />
State of the Environment Report 2009<br />
183
184<br />
COASTAL AND MARINE ENVIRONMENT<br />
P _ ihama, South <strong>Taranaki</strong>.<br />
(H) INFORMATION GATHERING AND<br />
MONITORING<br />
Since the 2003 State of the Environment Report, a working party<br />
consisting of the regional and district councils and Department of<br />
Conservation, completed an inventory of coastal areas of local or<br />
regional signifi cance in the <strong>Taranaki</strong> region. This inventory, primarily<br />
prepared to look at public access, also collated existing information on<br />
ecological values of a number of sites 44 .<br />
In 2004, in a joint project between the <strong>Taranaki</strong> <strong>Regional</strong> <strong>Council</strong> and<br />
the Department of Conservation, an inventory was developed of all<br />
reports, scientifi c research and information relating to the <strong>Taranaki</strong><br />
coastline 45 . All stakeholders and consultants who work or have worked<br />
within the coastal area were contacted for a list of all research they<br />
had either commissioned or conducted. 275 reports were recorded<br />
onto a database which is searchable via the <strong>Council</strong>’s website. This<br />
showed that a large amount of information exists on the <strong>Taranaki</strong> marine<br />
environment that was not previously well known, with some research<br />
dating back to the early 1900s. Information was greatest about intertidal<br />
ecological monitoring, beaches, erosion, sea fl oor life, sediment, water<br />
quality, the petrochemical industry and ocean outfalls. A gap analysis<br />
of the information gathered revealed that there was little information<br />
on various aspects of biology – fi sh tagging, seabird nesting, crayfi sh,<br />
shellfi sh – and little on aspects of marine weather, marine historical<br />
areas, and beyond the 12 nautical mile zone.<br />
In 2006, a community-based project team was formed to research<br />
more about the marine environment along the South <strong>Taranaki</strong> coast.<br />
This was facilitated by the Department of Conservation and included<br />
representatives from <strong>Taranaki</strong> <strong>Regional</strong> <strong>Council</strong>, Ng _ a Rauru, Ng _ ati<br />
Ruanui, the Ministry of Fisheries and a number of recreational boating<br />
and diving clubs. The team conducted research into what was recorded<br />
about the coast and what local people knew about their coastal and<br />
marine area 46 .<br />
The <strong>Taranaki</strong> <strong>Regional</strong> <strong>Council</strong> carries out state of the environment<br />
monitoring in estuaries and at rocky shore sites recording the diversity<br />
TARANAKI – WHERE WE STAND<br />
of invertebrates. The Department of Conservation carries out monitoring<br />
in the marine reserves and marine protected area. Results from these<br />
programmes are described earlier in this chapter.<br />
The Ministry of Fisheries gathers information from commercial fi shers,<br />
as well as carrying out research into recreational fi shing.<br />
(I) COMPLIANCE AND LAW ENFORCEMENT<br />
The Ministry of Fisheries enforces the regulations around the taking<br />
of fi sh, shell fi sh and aquatic life. The Ministry of Fisheries and the<br />
Department of Conservation undertake joint compliance work in the<br />
Sugar Loaf Islands (Ng _ a Motu) Marine Protected Area. This work is<br />
assisted by members of the public who keep an eye out for those fi shing<br />
in the wrong areas.<br />
Although there have been reports of illegal fi shers in the Parininihi<br />
Marine Reserve, the level of compliance has generally been good. Local<br />
fi shers have been active in discouraging poachers from the reserve and<br />
as yet there have not been any prosecutions.<br />
(J) INFORMATION, ADVICE AND EDUCATION<br />
As part of its environmental education programme, the <strong>Council</strong> works<br />
with teachers and school children to raise awareness of rocky shore<br />
issues and encourage wise and sustainable use of the coast. The<br />
<strong>Council</strong> provides a unit of work and a teaching resource kit to teachers<br />
that link water studies to the New Zealand curriculum. The <strong>Council</strong> also<br />
offers support and equipment for rocky shore fi eld trips where children<br />
participate in monitoring or beach clean-up or monitoring activities.<br />
Seaweek, held annually in March, provides a focus for raising<br />
awareness in the community on coastal and marine biodiversity issues.<br />
The week is facilitated by the Department of Conservation and includes<br />
the New Plymouth and South <strong>Taranaki</strong> district councils, the Ng _ a Motu<br />
Marine Reserve Society, Forest and Bird and corporate sponsors such as<br />
McDonald’s and local book stores. Public talks, walks, beach clean-ups,<br />
competitions and events are held to raise public awareness.<br />
44 <strong>Taranaki</strong> <strong>Regional</strong> <strong>Council</strong>, 2004. Inventory of Coastal Areas of Local or <strong>Regional</strong> Signifi cance in <strong>Taranaki</strong>.<br />
45 <strong>Taranaki</strong> <strong>Regional</strong> <strong>Council</strong>, 2004. Coastal Information Inventory for the <strong>Taranaki</strong> Coast.<br />
46 Rush, 2006. Netting Coastal Knowledge: South <strong>Taranaki</strong>-Whanganui Marine Area. Published by the Department of Conservation, Wanganui Conservancy.<br />
Rob Tucker<br />
Midhirst School students learn about the coastal environment.<br />
<strong>Taranaki</strong> <strong>Regional</strong> <strong>Council</strong>
Students getting a hands-on experience of the rocky shore.<br />
The Ministry of Fisheries undertakes a number of activities aimed at<br />
increasing and improving fi shers’ knowledge about fi shing legislation<br />
and the consequences that may arise from breaching the regulations.<br />
Improving fi shers’ knowledge and understanding of these regulations<br />
will help maximise voluntary compliance across the sectors (commercial,<br />
recreational and customary).<br />
(K) COMMUNITY INVOLVEMENT<br />
The Ng _ a Motu Marine Reserve Society Incorporated is a diverse<br />
community group representing scientifi c, educational and recreational<br />
Table 5.12: Summary of progress with objectives and policies on coastal and marine biodiversity.<br />
Issue What do we want to achieve How is it measured What progress are we making<br />
Reducing threats to marine habitats,<br />
fl ora and fauna.<br />
47 Ministry for the Environment, 2007. Environment NZ, 2007.<br />
<strong>Taranaki</strong> <strong>Regional</strong> <strong>Council</strong><br />
An increase in the number and<br />
areal extent of ecosystems,<br />
habitats and areas with regionally<br />
signifi cant indigenous biodiversity<br />
values in the <strong>Taranaki</strong> region, and<br />
which are formally protected.<br />
Maintenance and enhancement<br />
of the ecological condition<br />
of ecosystems, habitats and<br />
areas with regionally signifi cant<br />
indigenous biodiversity values.<br />
interests. Their objectives are to establish a network of marine reserves<br />
in the <strong>Taranaki</strong> region, to ensure the marine life and other natural<br />
resources within the region are protected, to encourage the scientifi c<br />
study of marine life on the <strong>Taranaki</strong> coast and to foster community<br />
awareness of the coastal environment by education. The Society was<br />
the applicant for the Tapuae Marine Reserve established in 2008.<br />
Forest and Bird advocates the importance of looking after little blue<br />
penguins along the coast by promoting the importance of keeping dogs<br />
under control and building penguin boxes.<br />
Community coast care groups work with district councils on sand dune<br />
restoration programmes.<br />
(L) SUMMARY OF PROGRESS<br />
A summary of progress in implementing regional objectives and policies<br />
on coastal and marine biodiversity is set out in Table 5.12 below.<br />
5.3.3 HOW DO WE COMPARE?<br />
The Ministry for the Environment has recently reported on the proportion<br />
of mainland coastal biogeographic regions protected through marine<br />
reserves 47 . This highlights that no mainland region has more than 0.4%<br />
of its total area in marine reserve. The Western North Island region and<br />
the North Cook Strait regions have just over 0.1% and just over 0.15% of<br />
their areas in marine reserve respectively.<br />
Extent of the territorial sea<br />
(ha) protected through marine<br />
reserves or marine protected<br />
areas.<br />
Levels of consented activities in<br />
areas of signifi cant conservation<br />
values.<br />
Biosecurity monitoring and<br />
surveillance undertaken.<br />
The Sugar Loaf Islands (Ng _ a Motu)<br />
Marine Park was established in<br />
1983 and the protection status of<br />
the area was upgraded in 1991<br />
to SLIMPA. Parininihi Marine<br />
Reserve came into effect October<br />
2006, followed by the Tapuae<br />
Marine Reserve in 2008.<br />
Levels of compliance in the<br />
reserves have been good and<br />
they are generally self-policing.<br />
As yet there have not been any<br />
prosecutions.<br />
27 coastal permits have been<br />
granted, reviewed or varied<br />
in coastal area A (areas of<br />
outstanding coastal value) since<br />
the <strong>Regional</strong> Coastal Plan was<br />
made operative.<br />
Port surveillance programme and<br />
Undaria control programme.<br />
State of the Environment Report 2009<br />
185
186<br />
COASTAL AND MARINE ENVIRONMENT<br />
Paragliding, Back Beach New Plymouth.<br />
5.4 PUBLIC ACCESS<br />
5.4.1 WHAT IS THE STATE<br />
OF PUBLIC ACCESS TO<br />
TARANAKI’S COAST?<br />
(A) RECREATIONAL USE OF THE COAST<br />
The <strong>Taranaki</strong> coastal environment offers an extensive and important<br />
recreational resource for fi shing, diving, swimming, surfi ng, windsurfi ng,<br />
walking and boating.<br />
Due to <strong>Taranaki</strong>’s high-energy coastline most swimming activities occur<br />
at major recreational beaches where surf-lifesaving patrols operate<br />
(e.g. Fitzroy, East End, _ O _ akura, Opunake and _ Ohawe). Other swimming<br />
locations include Waiiti, Mimi, Urenui, _ Onaero, Waitara, Ng _ amotu, Back<br />
Beach, Greenwood Road, Komene, Kaupokonui, Waverley and P _ atea.<br />
Public access to these major recreational beaches is easy, access to<br />
other beaches can be over private land which requires the permission of<br />
the landowner.<br />
Boating on the coast relies on the access provided by boat ramps. Public<br />
boat ramps are situated at Tongaporutu Estuary, Urenui Estuary, Waitara<br />
Estuary, Port <strong>Taranaki</strong>, _ Ohawe and P _ atea Estuary. Boat ramps where<br />
access is restricted through permits to occupy the coastal marine area,<br />
are situated at Middleton Bay, Bayly Road and Warea.<br />
Waverley Beach.<br />
TARANAKI – WHERE WE STAND<br />
Fishing is also a very popular past-time with a lot of anglers utilising<br />
boats to access the deep-sea fi shing opportunities that <strong>Taranaki</strong> has<br />
to offer. Alternatively, surfcasting off beaches and fi shing off jetties or<br />
wharfs are also popular.<br />
Surfi ng is also a favourite activity for many <strong>Taranaki</strong> locals and<br />
visitors alike. Surfi ng can occur at many locations in <strong>Taranaki</strong>, with<br />
the number of surfers increasing in the region through growing<br />
awareness of <strong>Taranaki</strong>’s unique surfi ng environment and international<br />
surfi ng competitions now being held in the region. This has resulted in<br />
increased pressure for facilities and infrastructure at popular surfbreaks<br />
(e.g. K _ umara Patch, P _ uniho Road, Paora Road, Arawhata Road,<br />
Mangahume and Stent Road). In many cases, access to these areas<br />
requires landowner permission. An artifi cial surf reef is being developed<br />
at Opunake, refl ecting strong community interest and the tourist<br />
potential of surfi ng within the <strong>Taranaki</strong> region.<br />
Walking and cycling have become increasingly popular activities along<br />
<strong>Taranaki</strong>’s coastline, especially with the development of the coastal<br />
walkway in New Plymouth. Access to the coast has therefore been<br />
an important element in encouraging more people to walk and cycle<br />
as both a means of getting to/from work, as well as an important<br />
recreational activity.<br />
Diving is another recreational use of the coast. A study into the coastal<br />
marine values of the South <strong>Taranaki</strong>-Whanganui coast noted that dive<br />
spots in South <strong>Taranaki</strong> were rated anecdotally as amongst some of the<br />
best in New Zealand 55 .<br />
Survey results of sport and physical activities undertaken by <strong>Taranaki</strong><br />
residents showed that activities such as walking for enjoyment or<br />
exercise, swimming and fi shing were in the top 25% of activities listed<br />
by <strong>Taranaki</strong> residents 56 . Surfi ng and bodyboarding appeared in the<br />
second quartile of most popular activities. Walking for enjoyment or<br />
exercise, which was listed by almost 60% of respondents, will often<br />
involve walking along or near the waterways.<br />
A postal survey carried out by the <strong>Taranaki</strong> <strong>Regional</strong> <strong>Council</strong> over the<br />
summer of 2007-08 found that Fitzroy, Ng _ amotu and Opunake beaches<br />
were the locations most people have visited, with nearly one-third of<br />
all respondents having visited each of these beaches 57 (see case study).<br />
55 Rush, 2006. Netting Coastal Knowledge: A report into what is known about the South <strong>Taranaki</strong>-Wanganui marine area. Published by the Department of Conservation.<br />
56 Sport <strong>Taranaki</strong>. 2006. The <strong>Regional</strong> Sport and Physical Activity Strategy.<br />
Rob Tucker<br />
<strong>Taranaki</strong> <strong>Regional</strong> <strong>Council</strong><br />
Proud fi sherman.<br />
Rob Tucker
This was a change from when a similar survey was undertaken in 1984<br />
which found that _ O _ akura Beach was the location most visited.<br />
This study also asked people the main activity they undertook at individual<br />
beach sites. The most popular reasons for visiting a beach were to<br />
walk (61% of respondents), swim (50% of respondents), relax (44% of<br />
respondents), fi sh (25%), picnic (24%) and to admire the scenery (20%).<br />
Observations were also made at a number of <strong>Taranaki</strong> coastal sites over<br />
the 2007-08 summer to see what activities were the most popular. Table<br />
5.13 illustrates the range of activities observed at <strong>Taranaki</strong> beach and<br />
estuary sites, and the relative popularity of certain beaches.<br />
Table 5.13: Main activities observed at coastal locations over the 2007-08 summer recreation survey.<br />
Location<br />
On beach/<br />
river bank<br />
sea<br />
swim<br />
river<br />
swim<br />
surfi ng fi shing<br />
sail<br />
craft<br />
power<br />
craft<br />
walking<br />
dogs<br />
other<br />
average<br />
total users<br />
Fitzroy Beach 69 56 9 2 2 3 122<br />
Ng _ amotu Beach 60 20 3 5 8 2 1 6 86<br />
East End Beach 48 30 5 5 3 83<br />
Opunake Beach<br />
_<br />
O<br />
31 16 9 2 2 19 63<br />
_ akura Beach 30 21 9 1 1 4 5 62<br />
Back Beach 19 7 2 19 2 1 4 2 43<br />
Timaru Stream 14 5 8 6 2 7 2 2 33<br />
Corbett Park, Oakura<br />
_<br />
Onaero Beach camp<br />
20<br />
14<br />
3<br />
6<br />
17<br />
12 4<br />
2 3<br />
3<br />
32<br />
29<br />
P _ atea Beach 13 8 1 10 26<br />
Everett Park 16 13 1 5 25<br />
Kaupokonui Mouth<br />
_<br />
Oaonui beach, Kina Rd<br />
_<br />
Ohawe Beach<br />
11<br />
4<br />
6<br />
3<br />
2<br />
5 3<br />
4<br />
2<br />
6<br />
1<br />
3 2<br />
4<br />
5<br />
24<br />
10<br />
10<br />
Waverley Beach 6 3 1 10<br />
Waiiti beach 4 5<br />
Opunake beach and motor camp.<br />
57 <strong>Taranaki</strong> <strong>Regional</strong> <strong>Council</strong>, 2008. Recreational Use of Coast, Rivers and Lakes in <strong>Taranaki</strong> 2007-2008.<br />
<strong>Taranaki</strong> <strong>Regional</strong> <strong>Council</strong><br />
The survey found only 10% of respondents had not been able to gain<br />
access to rivers, lakes or parts of the coast in <strong>Taranaki</strong> that they wanted<br />
to in the last year. The main reasons people could not gain access was<br />
because the access or entrance was closed, access was too diffi cult<br />
or too dangerous. Only 1% of respondents had been denied access by<br />
the landowner or occupier. It appears that road access has not changed<br />
signifi cantly from when the last survey was undertaken in 1984.<br />
However, substantial car parking, facility upgrades and development of<br />
walkways have occurred.<br />
Swimming in the _ O _ akura River at Corbett Park.<br />
<strong>Taranaki</strong> <strong>Regional</strong> <strong>Council</strong><br />
State of the Environment Report 2009<br />
187
188<br />
COASTAL AND MARINE ENVIRONMENT<br />
WE SHALL COUNT THEM<br />
ON THE BEACHES<br />
The people’s verdict is in: The level of public access to the <strong>Taranaki</strong><br />
coastline is about right. That’s one of the conclusions of an<br />
investigation into the recreational use of coast, rivers and lakes in the<br />
region 58 .<br />
The investigation was carried out in the summer of 2007-08 and<br />
involved analysis of more than 400 responses to a postal questionnaire,<br />
and a series of observation counts at popular recreational sites. It was<br />
the fi rst such survey for more than two decades.<br />
The postal survey’s 15 questions included several on the issue of<br />
access. Most signifi cantly, 90% of respondents indicated the level<br />
of public access to coast, lakes and rivers is “about right”, with 8%<br />
saying it is inadequate and 2% believing it is too great. A similar<br />
satisfaction rating was found in a New Plymouth District <strong>Council</strong>commissioned<br />
survey of 402 residents by the National Research<br />
Bureau in February 2008 59 .<br />
Asked about the level of access to the natural environment (including<br />
rivers, lakes, the mountain and the coast), 58% of respondents were<br />
“very satisfi ed” and 37% “fairly satisfi ed”, giving a total satisfaction<br />
rating of 95%.<br />
This investigation also touched on the number of visits and factors<br />
that discourage visits. Public access is not a major issue in the latter:<br />
Recreational use at particular parts of the coast depends upon a number<br />
of factors such as an area’s physical characteristics, its uniqueness, its<br />
recreational values and qualities, its proximity to urban areas or rural<br />
communities, and the quality of public access. For some areas demand<br />
and expectation are that facilities and infrastructure will be provided<br />
to enhance use and access to the area (e.g. seating, walkways, shelter,<br />
boat ramps and car parking) or safeguard the area from the effects of<br />
that use (e.g. toilet and rubbish collection facilities). Any development<br />
of the coast may adversely affect other recreational experiences (e.g.<br />
walkers preferring solitude or the wilderness aspect) and, in some cases,<br />
may lead to a gradual loss of the scenic, amenity and natural character<br />
of that part of the coast.<br />
(B) COASTAL AREAS OF LOCAL OR REGIONAL<br />
SIGNIFICANCE<br />
Access to the coast in <strong>Taranaki</strong> relies upon both formal access (via<br />
public lands and roads) and informal access (via private land where<br />
there is no public right of access). An inventory of coastal areas of local<br />
or regional signifi cance was prepared in order to see if there was a<br />
need to discourage public access (from sites vulnerable to disturbance<br />
for example), identify any safety issues and gain an understanding of<br />
58 <strong>Taranaki</strong> <strong>Regional</strong> <strong>Council</strong>, 2008. Recreational Use of Coast, Rivers and Lakes in <strong>Taranaki</strong> 2007-2008.<br />
59 New Plymouth District <strong>Council</strong>, 2008. New Plymouth District <strong>Council</strong> Communitrak Survey February 2008.<br />
60 <strong>Taranaki</strong> <strong>Regional</strong> <strong>Council</strong>. 2004. Inventory of Coastal Areas of Local or <strong>Regional</strong> Signifi cance in the <strong>Taranaki</strong> Region.<br />
TARANAKI – WHERE WE STAND<br />
Road ends provide access to remote surfi ng spots.<br />
People say the main reasons they don’t get out are work commitments,<br />
lack of time, family commitments and cost, but ill health, mobility<br />
issues and lack of transport were also cited.<br />
Some 90% of respondents reported having been to a beach, river or<br />
lake in the preceding 12 months. This was down from 99% in the<br />
<strong>Taranaki</strong> <strong>Regional</strong> <strong>Council</strong>’s previous survey in 1984. Despite this fact,<br />
the earlier survey had only around half the number of respondents,<br />
while the 2007-08 investigation had a greater representation of older<br />
age groups.<br />
Overall, results from the survey indicate that public access is not a<br />
major limitation to public usage of the coast.<br />
people’s knowledge of access points 60 . The relative ease of access to<br />
each of the 69 sites identifi ed was assessed.<br />
Twenty-nine of these sites (or 42%) were evaluated as having excellent<br />
public access. Most of the main recreational beaches in <strong>Taranaki</strong>,<br />
or _ areas close to New Plymouth and other coastal settlements (e.g.<br />
O _ akura and Opunake) were identifi ed as having excellent public access.<br />
For public access to be ranked as ‘excellent’ these sites had to be a<br />
short distance from a formed public road, easily accessible at high<br />
and low tide, and with reserves and public access clearly defi ned and<br />
identifi able.<br />
A further 11 (16%) coastal areas were identifi ed as having good public<br />
access. These sites had to be a short walk from a formed public road,<br />
along a clearly defi ned and traversable track (this is important as access<br />
is sometimes constrained by tides), and connected by reserves or clear<br />
public access points.<br />
The remaining 29 coastal areas (or 42%) were rated as having poor<br />
public access. Access to these sites usually involved a long walk<br />
from the nearest formed road, pathways were generally unclear,<br />
involved rough or diffi cult topography, or involved the need to obtain a<br />
landowner’s permission to cross land.<br />
Rob Tucker
Access to remote areas is often restricted by cliffs and tides.<br />
(C) PHYSICAL CONSTRAINTS TO PUBLIC<br />
ACCESS ALONG THE COAST<br />
Access along the coast can be physically constrained where there is a<br />
signifi cant natural impediment to public access to an area (or part of an<br />
area) such as to areas offshore (e.g. reefs, islands and the Alexandra<br />
shipwreck) or to areas surrounded by high cliffs or accessible only at<br />
low tide. For example, the Tongaporutu coast is accessible only via the<br />
estuary two hours either side of low tide.<br />
Almost the entire <strong>Taranaki</strong> coastline is subject to varying rates of erosion<br />
from waves and wind. This has resulted in a predominantly cliffed<br />
coastline derived from the erosion of lahar and other volcanic material.<br />
In North and South <strong>Taranaki</strong>, the erosion of marine sediments has<br />
resulted in a coastline of almost continuous papa cliffs.<br />
In such areas, the provision of public access may not be practicable<br />
or appropriate. Indeed, the relevant agencies may wish to discourage<br />
public access because of health and safety considerations.<br />
In some localities, an area or site is designated as a reserve for the<br />
purpose of protecting from human interference the values associated<br />
with that area. In such areas restrictions on public access are<br />
appropriate. For example, the Sugar Loaf Islands is a conservation<br />
area with diverse and abundant marine and bird life, and underwater<br />
habitats. They also include several archaeological sites. Public access<br />
therefore needs to be prevented or minimised to restrict the level of<br />
disturbance and resultant diminished values.<br />
In addition to these islands, which are formally protected, there are other<br />
areas or sites that are ecologically or culturally sensitive, but which<br />
are either not protected or there is good to excellent public access. For<br />
example, the _ Oeo cliffs contain unprotected coastal herbfi elds, which<br />
are the habitat of a threatened moth. Private and public land within the<br />
coastal environment may also contain unprotected areas or sites that<br />
are important to M _ aori for cultural or spiritual reasons (e.g. w _ ahi tapu<br />
sites), or which contain other taonga (treasures). For such areas, public<br />
access needs to be managed and, in some cases, restricted.<br />
Rob Tucker<br />
Picnic at Bell Block Beach.<br />
(D) FORMAL ACCESS ALONG THE COAST<br />
Public roads offer the greatest degree of public access to the coast.<br />
Roads, along with the creation of reserves and strips, provide formal<br />
access options to the coast.<br />
There is a perception that subdivisions and other types of use and<br />
development have ‘alienated’ large stretches of the coastline – reducing<br />
the quality of public access to the coast. However, New Plymouth and<br />
South <strong>Taranaki</strong> district councils both have policies and methods to set<br />
aside land for public access purposes or to negotiate public access<br />
arrangements with developers or coastal land occupiers. In most<br />
circumstances, district councils, at the time of subdivision, consider the<br />
creation of esplanade reserves and esplanade strips to ensure continued<br />
public access to the coast. Accordingly, public access through the<br />
provision of esplanade reserves or esplanade strips is believed to have<br />
increased over time.<br />
Subdivisions have been created on the coast since 2002. In the New<br />
Plymouth District these coastal subdivisions are occurring all along the<br />
coast. In South <strong>Taranaki</strong> these are located near Waverley Beach, _ Oaonui,<br />
Manaia, P _ uniho, Opunake and Waiinu Beach. There are some 47 coastal<br />
esplanade reserves or strips in the New Plymouth District and a number<br />
in the South <strong>Taranaki</strong> District. Esplanade reserves and strips tend to be<br />
unevenly distributed in the region. In the New Plymouth District, coastal<br />
esplanade reserves or strips are concentrated along the coast north of<br />
the Stony (Hangatahua) River, at _ O _ akura, Otaraoa and Turangi Roads and<br />
at _ Onaero and Urenui. In the South <strong>Taranaki</strong> District, coastal esplanade<br />
reserves or strips are concentrated in the areas of Opunake, Rahot _ u<br />
and P _ uniho.<br />
There are also many local purpose reserves, recreational reserves,<br />
existing esplanade reserves and Department of Conservation reserves,<br />
situated along the coast, which provide formal access.<br />
The patchwork of public roads and reserves providing public access to<br />
the coast is therefore a historical accumulation rather than a logical<br />
network. There has never been a strategy or agency responsible for<br />
Rob Tucker<br />
State of the Environment Report 2009<br />
189
190<br />
COASTAL AND MARINE ENVIRONMENT<br />
overseeing the implementation of the various mechanisms available for<br />
enhancing coastal public access. As a consequence, the right of access<br />
to the coast is often discontinuous.<br />
The single most signifi cant factor constraining public access to coastal<br />
areas of local or regional signifi cance in <strong>Taranaki</strong> is that formal public<br />
access routes are often not clearly defi ned or diffi cult to identify (e.g. there<br />
are no signs or formed roads), making it diffi cult to distinguish public from<br />
private access. While some of the larger reserves are signposted, smaller<br />
reserves (such as esplanade strips) which could give access to the coast<br />
are often unmarked and their existence not well known.<br />
Unformed roads (land set aside and owned by the relevant district<br />
council for roading purposes, but not maintained by the council) have the<br />
Te Rewa Rewa Pa site, Waiwhakaiho River, Lake Rotomanu and New Plymouth.<br />
PARTNERSHIP ENSURES<br />
TREASURES ENDURE<br />
North <strong>Taranaki</strong> coastal treasures, ancient and modern, are being<br />
preserved and enhanced under a ground-breaking management<br />
agreement that has won national acclaim.<br />
The ancient treasure is Te Rewa Rewa P _ a, for generations a focal<br />
point for Ng _ ati Tawhirikura hap _ u before its site and surrounds near the<br />
mouth of the Waiwhakaiho River were taken over for defence purposes,<br />
eventually becoming a New Plymouth District <strong>Council</strong> reserve.<br />
The modern jewel is the New Plymouth coastal walkway, which has<br />
quickly become a popular attraction for locals and visitors alike.<br />
Under the Rewa Rewa Agreement signed in June 2007, the hap _ u and<br />
New Plymouth District <strong>Council</strong> are jointly managing the 26 ha reserve.<br />
This arrangement allows Ng _ ati Tawhirikura to plan developments for<br />
the cultural benefi t of the hap _ u as well as the wider community, while<br />
the <strong>Council</strong> can use a coastal strip to extend the coastal walkway<br />
towards Bell Block.<br />
TARANAKI – WHERE WE STAND<br />
Rob Tucker<br />
potential to provide public access to the coast. However, these unformed<br />
roads, commonly known as ‘paper roads’ are usually identifi ed only on<br />
survey maps and their existence is often not well known and the actual<br />
pathway can be diffi cult to ascertain from the adjacent privately-owned<br />
land. For example, the Stony (Hangatahua) River mouth has unformed<br />
roads providing for public access along both the left and right banks but<br />
the actual location of these roads is unclear.<br />
There are also cases where legitimate public access using unformed<br />
paper roads is impeded by the landowner – sometimes deliberately,<br />
sometimes through a lack of awareness. Both formed and unformed<br />
roads have the same legal status – that is, the public has the right to<br />
pass along the road without hindrance.<br />
Rangi Kipa, who chairs both the hap _ u and the Joint Management<br />
Committee, said the arrangement was working well and the<br />
Committee had been intensely involved with planning for the coastal<br />
walkway extensions and the construction of a new pedestrian bridge<br />
over the Waiwhakaiho River.<br />
“We were really happy to return to this land and to be welcomed back<br />
to it holding hands with the <strong>Council</strong>,” he said.<br />
At the signing ceremony in 2007, Ng _ ati Tawhirikura Trustee and Te<br />
Tai Tonga MP Mahara Okeroa called the agreement a 21st century<br />
solution to an issue. “It’s not a compromise. It’s more than just the<br />
shadow of the land – it’s more substantive than that, and we will<br />
work on it together,” he said.<br />
On the <strong>Council</strong> side, New Plymouth District Mayor Peter Tennent is<br />
also enthusiastic. “When we signed this management agreement,<br />
we knew we were showing the country a new way for mana whenua<br />
and local government to work together for the interests of the wider<br />
community,” he said.<br />
“By taking a new approach to ancestral land, Ng _ ati Tawhirikura and<br />
New Plymouth District <strong>Council</strong> have established an enduring gift for<br />
the enjoyment of many generations to come.”<br />
The Rewa Rewa Agreement won a 2008 Institute of Public<br />
Administration Sector Excellence Award, in the Crown-M _ aori<br />
relationships category. It has also been commended in the New<br />
Zealand Post Management Excellence Awards.<br />
The New Plymouth District <strong>Council</strong>’s Iwi Relationships Co-ordinator,<br />
Aroha Chamberlain, said the awards acknowledge the leadership and<br />
vision of both the <strong>Council</strong> and the hap _ u, and are also important for<br />
recognising and sharing best-practice. “This may result in benefi ts for<br />
other local government and mana whenua groups.”
(E) INFORMAL ACCESS TO THE COAST<br />
Informal public access (i.e. where access is over privately-owned land)<br />
is also an important part of providing access to the coast in <strong>Taranaki</strong>,<br />
although access relies on the goodwill of adjacent landowners.<br />
Generally most private landowners are happy to allow people to<br />
cross their land. However, changing social conventions, increased<br />
responsibilities on landholders in relation to occupational health and<br />
safety, as well as changes in land uses and recreational patterns, often<br />
mean that informal public access to previously accessible beaches,<br />
COASTAL ROUTE IN<br />
CLASS OF ITS OWN<br />
When Diana Reid says the South <strong>Taranaki</strong> coastline has enormous<br />
potential as a visitor attraction, you can be assured she’s walked<br />
the talk.<br />
The H _ awera High School geography teacher won a research<br />
fellowship that enabled her to take a year away from the classroom<br />
in 2006 to walk more than 160 km from Wait _ otara to the Stony<br />
River, assessing the potential for a coastal walkway or network of<br />
walkways.<br />
Her conclusion: This could be one of New Zealand’s great walks, but<br />
bringing it into reality will require much work.<br />
The research fellowship was awarded by the Royal Society of<br />
New Zealand and funded by the Ministry of Research, Science and<br />
Technology. Armed with a GPS device and taking photos, notes<br />
and recordings as she went, Diana stayed as close to the coast as<br />
possible and walked some sections twice. She says the highlights<br />
of her many journeys were beautiful beaches and coves, the wildlife<br />
ranging from seals to crabs, and shipwreck remnants.<br />
And with an offi ce and support provided by the South <strong>Taranaki</strong><br />
District <strong>Council</strong>, she also consulted many community groups and<br />
reviewed information on w _ ahi tapu and historic sites, coastal<br />
ecology, land ownership, hazards, access points and facilities along<br />
the route.<br />
Her feasibility study includes a database of information about the<br />
proposed walkway, with the most suitable routes shown on maps<br />
prepared with the help of the <strong>Taranaki</strong> <strong>Regional</strong> <strong>Council</strong>.<br />
She also points to statistics highlighting the popularity of walking<br />
and high public opinion of walkways and cycleways. She believes<br />
a series of linked walkways spanning the South <strong>Taranaki</strong> coastline<br />
would be a hit with locals and visitors alike.<br />
surfi ng or fi shing spots is becoming increasingly restricted. Problems<br />
can also occur when the landowners’ property rights are not respected<br />
(e.g. failure to obtain the permission of the landowner, close gates<br />
or disturbance of livestock). Reasonable and responsible access is<br />
desirable. There is a need to respect private rights – if this is done fully<br />
and properly, informal access can remain an important part of continuing<br />
public access to the coast where other methods might not be practicable<br />
or cost effective. Increased public awareness for both landowners and<br />
the general public is the key.<br />
Diana Reid plotting her course.<br />
“South <strong>Taranaki</strong>’s coastal history, geology and geography are all very<br />
interesting, and the landscape is varied and beautiful,” Diana said.<br />
“The coastline is walkable and it would appeal to a wide range of<br />
people. There would be economic benefi ts for all the communities<br />
along the way, and a walkway would also be something that locals<br />
could be proud of.”<br />
The concept, which has been accepted in principle by the South<br />
<strong>Taranaki</strong> District <strong>Council</strong>, involves 24 sections or stages, each of which<br />
would require its own level of development. Some parts, notably<br />
around Cape Egmont, are already mostly in place. But others would<br />
have to be started from scratch.<br />
Diana said much work still needs to be done, especially around issues<br />
such as land ownership and w _ ahi tapu sites. “I ran out of time to cover<br />
this in any depth.”<br />
Because of land ownership and w _ ahi tapu issues, the South <strong>Taranaki</strong><br />
District <strong>Council</strong> will work closely with iwi and landowners as it<br />
considers the best methods to advance the project stage by stage.<br />
The idea is to encourage involvement by community groups and<br />
businesses. If the walkway proposal were to progress, the cost is<br />
estimated to be around $3 million spread over fi ve to 10 years.<br />
<strong>Taranaki</strong> Daily News<br />
State of the Environment Report 2009<br />
191
192<br />
COASTAL AND MARINE ENVIRONMENT<br />
Surfcasters head for the beach.<br />
5.4.2 HOW IS PUBLIC ACCESS<br />
TO THE COAST MANAGED?<br />
(A) REGIONAL PLANS<br />
The <strong>Regional</strong> Coastal Plan for <strong>Taranaki</strong> recognises that the maintenance<br />
and enhancement of public access within the coastal marine area are<br />
important issues. The plan therefore contains objectives, policies and<br />
methods to ensure that public access to the coastal environment is<br />
maintained. Methods include rules which give effect to the policies for<br />
each of the four coastal management areas (as outlined earlier in this<br />
chapter), and general rules that apply to all coastal management areas.<br />
Such methods may include putting conditions on coastal permits to<br />
maintain or provide for public access, advocacy to improve public access<br />
to the coast (including advocacy to district councils for the continued<br />
implementation of esplanade strips and reserves) and the provision of<br />
information on where the location of public access points are.<br />
(B) REGIONAL WALKWAYS AND<br />
CYCLEWAYS STRATEGY<br />
A <strong>Regional</strong> Walkways and Cycleways Strategy for <strong>Taranaki</strong> has been<br />
developed to promote the leisure, recreational, commuter and tourism<br />
opportunities provided by walking and cycling, including access to the<br />
coast 61 . Current and potential routes are identifi ed that together would<br />
make up a network offering pedestrian and cycle access to the region’s<br />
natural attractions, as well as population centres. Some of the new<br />
routes foreseen in the strategy that might increase access to the coast<br />
include extensions to the New Plymouth coastal walkway and a possible<br />
coastal pathway and cycling route in South <strong>Taranaki</strong>.<br />
(C) DISTRICT COUNCILS<br />
Both the New Plymouth District Plan and the South <strong>Taranaki</strong> District Plan<br />
contain objectives, policies and methods to safeguard public access to<br />
the coast. These include such matters as maintaining access through<br />
esplanade reserves or strips set aside at the time of subdivision, or by<br />
other means.<br />
61 <strong>Taranaki</strong> <strong>Regional</strong> <strong>Council</strong>, 2007. <strong>Regional</strong> Walkways and Cycleways Strategy for <strong>Taranaki</strong>.<br />
TARANAKI – WHERE WE STAND<br />
Rob Tucker<br />
Clifftop walkway, Waverley Beach.<br />
District councils also maintain roads, tracks, paths, reserves and<br />
walkways that provide public access to, and along, the coast. In New<br />
Plymouth and other parts of the region there have been ongoing<br />
maintenance and upgrades of walkways and other facilities.<br />
For example, the 7 km New Plymouth coastal walkway has been<br />
developed over an eight-year period from 1995-2003 and extends from<br />
the Waiwakaiho River mouth in the east to Port <strong>Taranaki</strong> in the west<br />
(Figure 5.17). The whole project included development of an extensive<br />
walkway, a main pier, fi nger piers, and a Len Lye sculpture, at an<br />
approximate cost of $24 million. The project is ongoing with a planned<br />
extension to Bell Block. The project has been awarded the Gold Design<br />
Award 2002 (New Zealand Institute of Landscape Architects National<br />
Awards), Outstanding Project Award 2003 (New Zealand Recreation<br />
Association), George Malcolm Award 2006 (New Zealand Institute of<br />
Landscape Architects) and Eastern Region Awards 2005 (International<br />
Federation of Landscape Architects).<br />
Figure 5.17: Map of New Plymouth coastal walkway.<br />
<strong>Taranaki</strong> <strong>Regional</strong> <strong>Council</strong>
Spectators on the New Plymouth walkway.<br />
The New Plymouth District <strong>Council</strong> has recently prepared a coastal<br />
strategy, with the central purpose of guiding future development and<br />
change in the district 62 . One of the actions in the strategy is to prepare<br />
a coastal access action plan to guide investment, protection and<br />
development for providing public access to the coast. One other action<br />
identifi es the need to make information available to the public about<br />
where all existing reserves (including esplanade reserves) are in the<br />
coastal area.<br />
The South <strong>Taranaki</strong> District <strong>Council</strong> has accepted in principle a proposal<br />
to explore options for enhancing public access and walking opportunities<br />
around the South <strong>Taranaki</strong> coastline (see case study).<br />
(D) NAVIGATION SAFETY BYLAWS<br />
The <strong>Taranaki</strong> <strong>Regional</strong> <strong>Council</strong> has prepared navigation bylaws for Port<br />
<strong>Taranaki</strong> and its approaches. These bylaws apply only to Port <strong>Taranaki</strong><br />
and the immediate environment and have been made for the purpose of<br />
regulating navigation and safety in this high-use area.<br />
As Port <strong>Taranaki</strong> is the single largest facility on the <strong>Taranaki</strong> coast, which<br />
raises navigation safety issues, it is important that appropriate speed<br />
Sunrise over Sugar Loaf Islands.<br />
62 New Plymouth District <strong>Council</strong>, 2006. New Plymouth Coastal Strategy 2006.<br />
<strong>Taranaki</strong> <strong>Regional</strong> <strong>Council</strong><br />
Yachts leave Port <strong>Taranaki</strong> on the Solo Trans-Tasman Yacht Race to Mooloolaba.<br />
regulations and access are provided for both recreation and commercial<br />
users alike. The current volume of shipping and mix of commercial and<br />
recreational uses in the Port therefore justify the need for this level of<br />
regulation and control. Future port development will also lead to an<br />
increase in shipping volumes as a result of dairy, forestry and container<br />
shipping in the next 10 years.<br />
(E) WALKING ACCESS COMMISSION<br />
Central Government is investigating options for establishing a New Zealand<br />
Walking Access Commission to lead and co-ordinate the provision of<br />
public access to the outdoors, especially around the coast, lakes, and along<br />
rivers. The Commission’s responsibilities would include the provision of<br />
information about the location of existing public access, the provision of a<br />
code of responsible conduct for the guidance of the public and landholders<br />
in respect of recreational access to the outdoors, and the facilitation and<br />
funding of negotiations for new public access across private land. The<br />
implications of these activities for the <strong>Taranaki</strong> region will be assessed in<br />
due course once the Commission commences operations.<br />
<strong>Taranaki</strong> <strong>Regional</strong> <strong>Council</strong><br />
Rob Tucker<br />
State of the Environment Report 2009<br />
193
194<br />
COASTAL AND MARINE ENVIRONMENT<br />
(F) SUMMARY OF PROGRESS<br />
Progress implementing regional objectives and policies on public access to the coast is summarised in Table 5.14.<br />
Table 5.14: Summary of progress: Implementing regional objectives and policies on the maintenance and enhancement of public access.<br />
Issue What do we want to achieve? What are we doing about it? Where are we at?<br />
Maintenance and enhancement of<br />
public access<br />
TARANAKI – WHERE WE STAND<br />
Increased formal public access<br />
to and along the coastal marine<br />
area.<br />
Maintenance and enhancement<br />
of public access along the coastal<br />
marine area, where this is<br />
practicable.<br />
5.4.3 HOW DO WE COMPARE?<br />
Esplanade strips and reserves<br />
established in the coastal<br />
environment as part of the<br />
subdivision process.<br />
Review navigation bylaws for Port<br />
<strong>Taranaki</strong> and its approaches.<br />
Providing information and advice<br />
when appropriate and necessary<br />
on access points to the coastal<br />
marine area.<br />
<strong>Regional</strong> Coastal Plan for <strong>Taranaki</strong><br />
made operative in 1997. The<br />
plan contains policies and rules<br />
to maintain and enhance public<br />
access within the coastal marine<br />
area.<br />
District plans in place which<br />
recognise public access to the<br />
coast as an important matter to<br />
be considered.<br />
Navigation bylaws in place to<br />
regulate navigation and safety<br />
within Port <strong>Taranaki</strong>.<br />
Most regions have coastal policies and plans, as well as district plans, that seek to protect public access to the coast from inappropriate subdivision,<br />
use and development. The <strong>Taranaki</strong> region has fewer development pressures on its coastline than other regions such as Northland, Auckland,<br />
Waikato, Bay of Plenty, Marlborough and Canterbury. Coastal development and subdivision pressures have increased in <strong>Taranaki</strong>, as they have<br />
elsewhere, and may continue to do so into the future. The issue of public access to the coast is one that will require ongoing monitoring.
Photo: Rob Tucker<br />
CHAPTER 6<br />
ATMOSPHERE<br />
195
196<br />
AT A GLANCE<br />
AIR QUALITY<br />
<strong>Taranaki</strong> people enjoy clean fresh air and this is an important and valued<br />
part of our quality of life. In summary:<br />
on the basis of national guidelines, air quality in <strong>Taranaki</strong> is rated<br />
as excellent, enabling the <strong>Taranaki</strong> community to enjoy one of the<br />
healthiest regions in New Zealand in terms of air quality;<br />
there are no signifi cant widespread pressures on air quality in the<br />
region so levels of monitoring of general air quality have been<br />
reduced, although the <strong>Council</strong> still carries out comprehensive<br />
monitoring of consented activities;<br />
306 air discharge permits are held in <strong>Taranaki</strong> (compared with 230 in<br />
2003);<br />
consent conditions are generally more stringent, refl ecting better<br />
control options and heightened community expectations;<br />
major air discharge permit holders continue to make signifi cant<br />
investments in emission controls and production technology; and<br />
a few concerns exist about specifi c discharges to air, primarily<br />
involving odours, but these are managed to reduce effects on<br />
neigh-bours as far as possible.<br />
The <strong>Council</strong>’s <strong>Regional</strong> Air Quality Plan, made operative in 1997,<br />
contains policies, methods and controls to maintain and enhance air<br />
quality in <strong>Taranaki</strong>. It is in the process of being formally reviewed.<br />
TARANAKI – WHERE WE STAND<br />
CLIMATE<br />
Gases such as carbon dioxide, methane and nitrous oxide have the<br />
ability to trap infra-red energy that would otherwise be radiated off the<br />
earth’s surface. The accumulation of these greenhouse gases in the<br />
upper atmosphere is leading to global warming and global climate<br />
change. Average New Zealand temperatures have increased by<br />
0.3-0.7ºC since 1950. In <strong>Taranaki</strong>:<br />
the signifi cant sources of greenhouse gases are agriculture, energy<br />
and petrochemical industries;<br />
industry is the largest source of carbon dioxide emissions and<br />
agriculture is the largest source of methane;<br />
emissions from industry and livestock are decreasing but emissions<br />
from soil and fuel use are increasing;<br />
climate in <strong>Taranaki</strong> is expected to become marginally wetter overall,<br />
with increased frequency of extreme weather events; and<br />
climate change is expected to result in an increase in pasture<br />
productivity and an increase in cropping in the region.<br />
The Government and members of the international community are<br />
addressing climate change through a range of initiatives including those<br />
to implement the Kyoto Protocol. Initiatives at the regional level include<br />
management of point source emissions through the <strong>Regional</strong> Air Quality<br />
Plan, and advocacy for sustainable land management which may lead to<br />
increased tree planting which will mitigate greenhouse gas emissions,<br />
and better management of fertiliser (which will reduce greenhouse gas<br />
emissions).
State of the Environment Report 2009<br />
197
198<br />
ATMOSPHERE<br />
<strong>Taranaki</strong> has excellent air quality.<br />
OUR ATMOSPHERE<br />
Clean fresh air is an important and valued part<br />
of <strong>Taranaki</strong>’s environment and quality of life. To<br />
M _ aori, the air is a taonga and odours and other<br />
contaminants can affect w _ ahi tapu sites.<br />
Overall, <strong>Taranaki</strong> has excellent air quality. This<br />
is because of <strong>Taranaki</strong>’s windy and exposed<br />
nature, together with its dispersed and low<br />
population, absence of heavy industry and its<br />
low number of vehicles. However, air quality<br />
in some locations is reduced through point<br />
source discharges or diffuse discharges of<br />
contaminants to air.<br />
Diffuse sources of emissions are the biggest<br />
contributors of emissions to air. These include<br />
natural sources (sea spray, vegetation,<br />
landcover and farm animals) and human<br />
sources such as industries, homes or motor<br />
vehicles. Natural sources emit far greater<br />
quantities than human sources.<br />
Point source emissions such as from industry<br />
are more obvious than diffuse source<br />
discharges. Point source discharges in <strong>Taranaki</strong><br />
come from a range of sources such as the<br />
petroleum industry, pig and poultry farming<br />
and abrasive blasting. Many point source<br />
emissions are located in the industrial parts<br />
of the region’s urban centres, particularly New<br />
Plymouth and H _ awera. Increased levels of<br />
hydrocarbon exploration and production have<br />
led to increased consents for air discharges.<br />
Emissions to air, in the form of odours, smoke,<br />
dusts or toxic contaminants, may affect air<br />
quality. The effects of such emissions range<br />
from visual effects and offensive odours to<br />
1 <strong>Taranaki</strong> <strong>Regional</strong> <strong>Council</strong>, 2003. <strong>Taranaki</strong> – Our Place, Our Future. Report on the State of the Environment of the <strong>Taranaki</strong> Region.<br />
TARANAKI – WHERE WE STAND<br />
actual or potential effects on human and<br />
ecosystem health.<br />
Greenhouse gases are gases such as carbon<br />
dioxide, methane and nitrous oxide, which have<br />
the ability to trap infra-red energy that would<br />
otherwise be radiated off the earth’s surface.<br />
There is now a very strong consensus of<br />
scientifi c opinion that the accumulation of<br />
greenhouse gases in the upper atmosphere<br />
is warming the lower atmosphere. Over time<br />
this will result in rising sea temperatures and<br />
sea levels, the melting of glaciers and ice caps<br />
(which will also increase sea level) and greater<br />
extremes in weather patterns such as storms<br />
of greater intensity and longer droughts.<br />
Paradoxically, some parts of the planet may in<br />
fact become cooler, as wind patterns and sea<br />
currents shift their distribution. Temperatures<br />
in New Zealand have increased by 0.3-0.7ºC<br />
since 1950.<br />
Monitoring air quality in Stratford.<br />
Rob Tucker<br />
6.1 AIR QUALITY<br />
6.1.1 WHAT IS THE<br />
STATE OF AIR QUALITY<br />
IN TARANAKI?<br />
The relatively windy and exposed nature of<br />
<strong>Taranaki</strong>, together with its dispersed population<br />
and the absence of heavy industry and high<br />
motor vehicle densities, means that the<br />
region enjoys naturally high standards of air<br />
quality. The main infl uence on regional air<br />
quality is natural – sea spray drift from our<br />
energetic coastline and volatile emissions from<br />
vegetation.<br />
In the past the <strong>Council</strong> monitored key indicators<br />
of ambient, or overall, air quality in the region<br />
at up to 30 representative sites, including urban<br />
areas, rural and coastal areas and pristine<br />
areas. The indicators refl ected emission<br />
sources of particular interest in those areas.<br />
These included: sulphur oxides, nitrogen oxides,<br />
carbon monoxide, formaldehyde, suspended<br />
particulates and inhalable particulates.<br />
Monitoring was reported on in detail in the<br />
2003 State of the Environment Report 1 .<br />
The results, indicating high air quality, have<br />
reduced the need for extensive air quality<br />
monitoring, and therefore over the past fi ve<br />
years the <strong>Council</strong> has scaled down the state<br />
of the environment monitoring programme<br />
and concentrated instead on compliance<br />
monitoring. Information below on the current<br />
state of air quality in the region is therefore<br />
largely summarised from the 2003 report<br />
with additional comments from compliance<br />
monitoring undertaken since then. The<br />
categories used to describe air quality, and<br />
recommended actions for each category, are<br />
set out in Table 6.1.<br />
<strong>Taranaki</strong> <strong>Regional</strong> <strong>Council</strong>
Table 6.1: Categories of regional air quality 2 .<br />
(A) CURRENT STATE OF AIR QUALITY<br />
Particles<br />
Fine particles may come from smoke, mining and abrasive blasting,<br />
volcanic activity, wind-blown dust, and sea spray. Fine particles are<br />
called inhalable particulate materials (PM10) and can adversely affect<br />
human health. These particles are too small to see (about 10 microns<br />
in diameter (microns are micrometres or one millionth of a metre). Five<br />
would fi t across the width of a human hair. These fi ne particles can<br />
penetrate the body’s natural defences against dust, and enter the lungs.<br />
There they are associated with loss of lung function, respiratory distress<br />
and disease.<br />
As part of a national state of the environment monitoring programme<br />
established by the Ministry for the Environment, the <strong>Council</strong> undertook<br />
monitoring of inhalable particulates over the winter of 2003 3 .<br />
The monitoring showed that all results met the acceptable category,<br />
and 80% of samples met the good/excellent category (refer Table 6.1).<br />
One cluster of results showed higher than expected results – potentially<br />
infl uenced by nearby roading works. Removing these samples from<br />
consideration, the average concentration (over 24 hours) measured in<br />
New Plymouth across all measurements was 20% of the Ministry’s<br />
guideline and so was rated as good (as per criteria in Table 6.1).<br />
There was a strong infl uence from sea salt. The average levels of PM10<br />
were 66% higher during on-shore winds than during off-shore winds.<br />
These results were consistent with earlier monitoring reported on in the<br />
2003 State of the Environment Report that concluded that <strong>Taranaki</strong> air<br />
quality in relation to ambient levels of fi ne particulates is rated as good/<br />
excellent.<br />
Sulphur dioxide<br />
Action Alert Acceptable Good/Excellent<br />
Defi nition Above the guideline 66-100% of the guideline 33-66% of the guideline Good: 10-33% of the guideline<br />
Action<br />
required<br />
Achieve guideline value within<br />
shortest possible timeframe;<br />
investigate and monitor<br />
comprehensively<br />
Reduce further, where<br />
practicable, and monitor<br />
Sulphur dioxide is primarily generated from the combustion of fossil<br />
fuels containing sulphur (e.g. coal, diesel). It also occurs naturally during<br />
volcanic and geothermal activity. Sulphur dioxide can cause throat and<br />
eye irritation and trigger asthma attacks and bronchitis. Its acidity can<br />
also affect paint, building materials and vehicles.<br />
Previous monitoring of sulphur dioxide, reported on in the 2003 State<br />
of the Environment Report, rated ambient levels of sulphur dioxide in<br />
<strong>Taranaki</strong> as excellent. Subsequent consent monitoring undertaken by the<br />
<strong>Council</strong> has confi rmed these fi ndings.<br />
Nitrogen oxides<br />
2 Ministry for the Environment. 2002. Ambient Air Quality Guidelines.<br />
3 <strong>Taranaki</strong> <strong>Regional</strong> <strong>Council</strong>. 2004. Inhalable Particulate (PM1 toring Programme Report 2003 Technical Report 2003–99.<br />
Maintain, reduce where<br />
practicable and monitor<br />
periodically<br />
Nitrogen oxides are products of fossil fuel combustion. In humans they<br />
can reduce the body’s resistance to infections and can affect breathing.<br />
Nitrogen oxides are also toxic to plants and contribute to brown haze<br />
and photochemical smog.<br />
Previous monitoring of ambient levels of nitrogen oxide, described in<br />
the 2003 State of the Environment Report, rated levels in <strong>Taranaki</strong> as<br />
generally excellent. Subsequent consent monitoring undertaken by the<br />
<strong>Council</strong> has confi rmed these fi ndings. The highest emission levels of<br />
nitrogen oxide were recorded in the middle of the K _ apuni petrochemical<br />
complex, but air quality there still met the good category.<br />
Formaldehyde<br />
Formaldehyde is a product of fossil fuel combustion (e.g. from motor<br />
vehicles). A suspected carcinogen, it is known to irritate the eyes, skin<br />
and mucous membranes of the upper respiratory tract.<br />
Again, previous monitoring of ambient levels of formaldehyde, rated<br />
levels in <strong>Taranaki</strong> in the areas of highest traffi c fl ows as excellent.<br />
Carbon monoxide<br />
Excellent: 0-10% of the<br />
guideline<br />
Maintain and monitor<br />
occasionally<br />
Carbon monoxide is a product of incomplete fossil fuel combustion, for<br />
example, in motor vehicles or home heating. Carbon monoxide can affect<br />
concentration and physical performance. Higher concentrations cause<br />
dizziness, aggravate heart conditions and can be fatal. The Ministry for<br />
the Environment guidelines are based on the need to protect sensitive or<br />
vulnerable people.<br />
Screens enclose St Andrews Church spire in New Plymouth during restoration work.<br />
Rob Tucker<br />
State of the Environment Report 2009<br />
199
200<br />
ATMOSPHERE<br />
Previous monitoring of ambient levels of carbon monoxide, reported<br />
on in 2003, rated levels in <strong>Taranaki</strong> as excellent. Subsequent consent<br />
monitoring undertaken by the <strong>Council</strong> has confi rmed these fi ndings.<br />
Dioxins and other organochlorines<br />
Dioxins and other similar organochlorine substances (e.g.<br />
polychlorinated biphenyls (PCB), the pesticides DDT, aldrin, dieldrin,<br />
chlordane and lindane, and chlorophenols) are products or by-products<br />
of organic chemical synthesis, use, and combustion. Such substances<br />
pose a risk to human health due to their toxicity, carcinogenic risk and<br />
potential effects on reproduction and immunological systems.<br />
National studies on dioxins and other organochlorines confi rm that<br />
concentrations from these chemicals are not a signifi cant issue in<br />
<strong>Taranaki</strong> and that the risks to the environment and human health are<br />
negligible. Levels in <strong>Taranaki</strong> are generally much lower than many other<br />
places in New Zealand 4 . Median levels in rural <strong>Taranaki</strong> (Te Wera) were<br />
about one-quarter of those in urban areas and less than one-twentieth<br />
of those in major industrial areas.<br />
Levels of organochlorine pesticides, and the wood preservative PCP, in<br />
rural <strong>Taranaki</strong> were similar to other pristine and rural sites around New<br />
Zealand, and up to eight times lower than the country’s main urban<br />
centres.<br />
(B) EMISSION SOURCES<br />
Point source discharges<br />
The number of air discharge consents held in <strong>Taranaki</strong> has increased<br />
from 230, reported on in 2003, to 306. Applications for new consents to<br />
cover emissions during hydrocarbon exploration activities continue to be<br />
signifi cant in number (Figure 6.1). The number of consents for emissions<br />
from hydrocarbon exploration has increased over the past fi ve years<br />
from 76 to 145. Only a few of these are exercised at any one time, and<br />
most companies continue to hold consents for exploration sites after the<br />
Figure 6.1: Air discharge permits held by industry type.<br />
4 Ministry for the Environment, 1999. Ambient Concentrations of Selected Organochlorines in Air.<br />
5 Resource Management (National Environmental Standards relating to certain air pollutants, dioxins and other toxics) Regulations 2004.<br />
TARANAKI – WHERE WE STAND<br />
initial drilling, in case they wish to return and drill further exploration<br />
wells. The main potential effect of exploration emissions is from fl aring<br />
(smoke, odour, soiling).<br />
The past fi ve years has seen a reduction in the number of consents for<br />
emissions from landfi lls (dust, odour, landfi ll gas) and from piggeries<br />
(odour). This follows closure of a number of municipal landfi lls and<br />
piggeries in the region.<br />
Thermal power stations require air discharge consents. Nitrogen oxides<br />
are the main concern with thermal power emissions. Over the past fi ve<br />
years consents have been granted for a second combined cycle station<br />
at Stratford, for emissions from a cooling tower at a ‘peaking’ station<br />
at Stratford (the main emissions from this station are covered by an<br />
existing consent), and a possible energy centre at Whareroa. The New<br />
Plymouth power station was closed in 2007, but partly reactivated in<br />
2008. The air consent remains in force while an application for a second<br />
consent for this station for emergency fi ring of oil has been withdrawn.<br />
Poultry farming continues to be a growth industry with a small increase<br />
in the number of consented emissions – odour and dust are the main<br />
concerns for these farms.<br />
The National Environmental Standards for air quality 5 have forbidden the<br />
use of school incinerators unless a resource consent is held. Emissions<br />
from the incinerators give rise to concerns over products of incomplete<br />
combustion, smoke, and odour. Consequently, all schools in <strong>Taranaki</strong><br />
(around 80) have ceased use of their incinerators having found better<br />
ways of managing their waste.<br />
Unauthorised incidents<br />
Air quality complaints recorded, and followed up, by the <strong>Council</strong> are<br />
another useful indicator of the state of air quality. The number of<br />
air incidents compared with the total number of other complaints<br />
is illustrated in Figure 6.2. It shows that the number of air pollution<br />
incidents has been relatively stable.<br />
Figure 6.2: Number of air incidents over time compared to the number of<br />
incidents reported each year.
Table 6.2: Total number and top eight sources of air incidents from 2003-04 to 2007-08.<br />
2003-04 2004-05 2005-06 2006-07 2007-08 % of all air<br />
Total air incidents 162 176 199 182 222<br />
incidents<br />
2003-04 to<br />
% of all incidents 29.0 31.9 32.2 31.5 41.1<br />
2007-08<br />
Abrasive blasting<br />
dust<br />
Fertiliser storage/use<br />
dust, odour<br />
Rendering<br />
odour<br />
Piggeries<br />
odour<br />
Poultry farming<br />
odour<br />
Dairy Farm<br />
dust, odour<br />
Vermiculture/composting<br />
odour<br />
Table 6.2 sets out the total number of air incidents over the past fi ve<br />
years and shows the top eight sources of air incidents, which accounted<br />
for 56% or all air emission incidents over the period. The majority of air<br />
quality incidents relate to offensive odours. Other causes of complaint<br />
include suspended and deposited dust, smoke, and concern over toxicity<br />
or the type of smell.<br />
Since the 2003 State of the Environment Report landfi lls have ceased<br />
to be a source of emission complaints, with the extension of the New<br />
Plymouth landfi ll at Colson Road and the closure of the Stratford landfi ll.<br />
Complaints relating to specifi c meatworks and fertiliser works have also<br />
reduced, as have the number of complaints relating to poultry farming<br />
and composting. However, there has been a signifi cant increase in the<br />
proportion of complaints generated by a rendering plant and an increase<br />
in the proportion of piggery-related complaints. Most sources of air quality<br />
complaints generate only one or two complaints in any one year. This<br />
suggests that the cause was just a one-off incident, or that follow-up<br />
action by the operator and <strong>Council</strong> resolved the cause of the complaint.<br />
Diffuse sources<br />
Diffuse sources are those that individually may not be signifi cant in<br />
their immediate locality, but in combination with other identical sources<br />
or cumulatively across the region may impact upon air quality. Such<br />
sources include ‘natural’ sources such as the sea (suspended particulate<br />
and various chemical compounds), pasture (carbon dioxide and volatile<br />
organic compounds), the soil (dust, nitrous oxide), ruminant animals<br />
especially cows (methane), and bush (carbon dioxide and volatile organic<br />
compounds). Other sources include domestic heating by combustion<br />
(wood fi res, gas heaters), the burning of vegetation on production land<br />
7 8 10 10 7 4.5%<br />
6 4 2 5 6 2.6%<br />
26 48 43 34 56 20.0%<br />
8 5 14 16 17 5.5%<br />
2 11 2 6 15 5.3%<br />
5 3 29 13 9 5.7%<br />
13 20 1 2 3 4.8%<br />
Private housing 15 9 22 19 21 7.9%<br />
6 Kuschel, G and Petersen, J, 2000. Air Emissions for the <strong>Taranaki</strong> Region in 1998. Prepared by NIWA for the <strong>Taranaki</strong> <strong>Regional</strong> <strong>Council</strong>.<br />
7 LIC New Zealand Dairy Statistics.<br />
8 Statistics NZ.<br />
9 Statistics NZ.<br />
(carbon dioxide, organic compounds), and vehicles (nitrogen oxides,<br />
formaldehyde, carbon dioxide and other organic compounds).<br />
By their nature it is extremely diffi cult to quantify the volumes of<br />
emissions from these sources. However, a study reported on in the<br />
2003 State of the Environment Report showed that diffuse sources far<br />
outweighed point sources in regard to emissions of contaminants in<br />
<strong>Taranaki</strong> 6 . Soil is the largest emitter of nitrous oxide (93% of the region’s<br />
inventory), while plants emit signifi cant quantities of non-methane<br />
hydrocarbons (97%) and other nitrogen oxides (27%). Animals are<br />
responsible for 99% of the region’s methane emissions, while motor<br />
vehicles account for 71% of the carbon monoxide and 29% of the<br />
inhalable particulate. Home heating accounts for 56% of the inhalable<br />
particulate and 85% of the region’s hydrocarbons.<br />
Livestock emissions<br />
In terms of trends in emissions from farm animals in <strong>Taranaki</strong>, the number<br />
of dairy cattle from 1996-2006 has decreased by 10%, from 531,953<br />
to 479,238 7 . The number of beef cattle has decreased from 180,000 to<br />
129,000 - a decrease of 28%, and sheep numbers fell from 874,000 to<br />
688,000, or 21% 8 . Thus overall, emissions from animals have fallen.<br />
Vehicle emissions<br />
The number of vehicles that each <strong>Taranaki</strong> household has access to has<br />
substantially increased from 51,300 in 1996 to 60,900 vehicles in 2006,<br />
a 19% increase 9 . The number of households with access to one vehicle<br />
has fallen by more than 2,000 households, but the number of households<br />
with access to two vehicles has increased by 2,500 and the number with<br />
access to three or more vehicles has risen by 2,200.<br />
State of the Environment Report 2009<br />
201
202<br />
ATMOSPHERE<br />
Figure 6.3: Annual volumes of petrol and diesel used in <strong>Taranaki</strong>.<br />
Over the past decade petrol use in the region has remained constant,<br />
with an average of 77.9 million litres used annually in the two-year<br />
period 1997-99 and an average of 74.6 million litres used annually over<br />
the 2005-07 period (Figure 6.3).<br />
However, diesel use has increased 25% in the same period, from an<br />
average of 56.4 million litres used a year in 1997-99, to an average of<br />
70.1 million litres used annually in 2005-07. In the 2006-07 year, the<br />
highest volume of diesel was used to date (73.2 million litres). Diesel<br />
fuel is associated with emissions of sulphur dioxide and particulate<br />
matter. While the sulphur content of New Zealand fuel diesel has been<br />
reduced recently, it is still higher than for petrol.<br />
Household heating emissions<br />
The method used for household heating can cause different levels of<br />
air emissions. The use of solar energy, electricity, or gas is better for<br />
local air quality than coal or wood. Changes in methods used to heat<br />
households within the <strong>Taranaki</strong> region from 1996 to 2006 are shown in<br />
Table 6.3.<br />
Almost all of the shift from electricity to wood for heating purposes has<br />
occurred within the past fi ve years. To comply with the 2004 National<br />
Environmental Standards for air quality, almost all wood burners on<br />
the market now comply with the certifi cation standard for effi ciency<br />
and reduced air emissions, thus reducing the adverse air quality effects<br />
(when compared with gas or electricity) of burning wood.<br />
While there has been a fall in the number of households using mains<br />
gas, the number of households using bottled gas has risen sharply (more<br />
than matching the decline in use of electricity and mains gas combined).<br />
Table 6.3: Trends in methods of home heating 1996-2006.<br />
Method Elect Gas<br />
Mains<br />
% change<br />
from 1996<br />
Number<br />
change<br />
from 1996<br />
TARANAKI – WHERE WE STAND<br />
Gas<br />
Bottled<br />
This suggests that the connection costs of mains gas are acting as a<br />
disincentive to its continued use. Indoor air quality can suffer with the<br />
use of bottled gas unless it is properly exhausted to the outside.<br />
The use of coal in the region has declined sharply (the biggest fall in<br />
percentage terms of any method of household heating), and the use of<br />
solar heating has increased sharply (the biggest uptake in percentage<br />
terms of any method of heating). From the perspective of local air<br />
quality, both these trends are to be welcomed. However, in both cases<br />
the number of households concerned is small in absolute terms.<br />
6.1.2 HOW IS AIR QUALITY<br />
MANAGED IN TARANAKI?<br />
(A) THE REGIONAL AIR QUALITY PLAN<br />
The <strong>Regional</strong> Air Quality Plan for <strong>Taranaki</strong> was made operative in 1997.<br />
The plan has a 10-year life and is therefore now undergoing a process<br />
of review. The existing plan contains policies, methods and rules for<br />
addressing air quality management, with the objective of maintaining<br />
and enhancing air quality in the region.<br />
The plan contains rules setting out environmental standards and<br />
conditions for all industrial and trade premises (including intensive pig<br />
and poultry farming and waste management processes), agrichemical<br />
spraying on farmland and public amenity areas, and burning. The<br />
plan also contains codes of practice for piggeries and poultry farming,<br />
agrichemical spraying, vegetation burn-off and industrial process<br />
chimney heights.<br />
Rules in the plan provide for special consideration to be given to protect<br />
areas particularly sensitive to discharges to air (e.g. residential areas,<br />
parks and reserves or w _ ahi tapu sites). Some activities such as the<br />
burning of waste oil and tyres and burning at landfi lls – activities that<br />
are potentially signifi cant source of dioxins – are prohibited.<br />
The new plan is likely to refl ect advances in technology and improved<br />
industry practice, the 2004 National Environmental Standard for air<br />
quality, and increasing knowledge and awareness of the implications<br />
for human health of air pollution from various sources. For example,<br />
it is now considered that no ‘absolutely safe’ concentrations exist<br />
for contaminants such as inhalable particulate matter and dioxins.<br />
Therefore future air quality management will focus on reducing levels<br />
of these to the lowest practicable level, even if existing air quality is<br />
otherwise already generally good.<br />
Wood Coal Solar None Total<br />
households<br />
-5.7% -7.4% +43% +6.5% -22% +51% +31% 1996<br />
38769<br />
-1254 -1131 +2781 +1092 -309 +124 +138 2006<br />
40281<br />
(+3.9%)
(B) NATIONAL ENVIRONMENTAL STANDARD<br />
National environmental standards for air quality were established<br />
in 2004 10 . These regulations apply across the whole of New Zealand<br />
and set receiving environment limits for several toxic gases. They ban<br />
outright the burning of tyres, landfi lled wastes, bitumen, and coated<br />
wire, and oil in open air. They ban the use of incinerators at schools<br />
unless resource consent has been granted, and they ban the operation<br />
of high-temperature incinerators (other than crematoria and the<br />
incinerator used by Dow AgroSciences in New Plymouth). Wood-burner<br />
heaters on residential sections and small lifestyle blocks are allowed<br />
only if certifi ed as meeting a particular standard.<br />
(C) RESOURCE CONSENT MANAGEMENT<br />
As described above, 306 air discharge consents are currently held in<br />
<strong>Taranaki</strong>. Figure 6.4 illustrates the number of air consents granted since<br />
1997. The large numbers of consents granted in 1997-98 were due to<br />
consents being required for certain industries once the <strong>Regional</strong> Air<br />
Quality Plan for <strong>Taranaki</strong> became operative (largely for piggeries and<br />
poultry farms). 2004-05 was an especially busy year for air discharge<br />
consents from the hydrocarbon exploration industry.<br />
The <strong>Council</strong> assesses the effects of air discharges and places conditions<br />
on consents to control effects on the environment. Applicants are<br />
advised to consult with affected parties, including tangata whenua, and<br />
these parties are involved in the consent process and in discussions on<br />
consent conditions.<br />
The resource consent process has enabled the <strong>Council</strong> to promote<br />
signifi cant upgrades in emission controls or production technologies<br />
used by major air discharge permit holders. These improvements have<br />
involved signifi cant investments in emission controls or production<br />
technology. Over the past fi ve years, region-wide capital investment in<br />
air quality control almost doubled from $14 million (1997-2002) to $27.5<br />
million (2002-07) 11 . Such investment has included the installation of<br />
biofi lters and new driers at rendering plants in <strong>Taranaki</strong> to reduce odour<br />
emissions, the installation of wet scrubber systems at dairy processing/<br />
manufacturing plants and engineering sites to reduce odour and dust<br />
emissions and the upgrade of a gas turbine for electricity generation to<br />
reduce CO2 emissions.<br />
There has been a signifi cant increase in the poultry industry in <strong>Taranaki</strong>.<br />
Rob Tucker<br />
Figure 6.4: Number of air discharge permits granted over the past 10 years.<br />
(D) MONITORING<br />
When the <strong>Council</strong> grants a consent for a signifi cant activity, it<br />
implements an annual compliance monitoring programme to ensure<br />
the consent holder meets the conditions set out on the consent. These<br />
conditions usually relate to the manner of operation, the quality of<br />
the discharge, and the permitted extent of effects in the receiving<br />
environment. In the 2007-08 year, the <strong>Council</strong> undertook 51 individual<br />
monitoring programmes that had an air quality component. Sites<br />
included sewage plants, petrochemical and petroleum production<br />
facilities, landfi lls, composting and vermiculture sites, milk factories,<br />
metal smelting and galvanizing plants, meatworks, rendering plants,<br />
wood and coal-fi red boilers, fertiliser storage and distribution centres,<br />
asphalt plants, feedmills, abrasive blasters, quarries, crematoria,<br />
agrichemical formulation facilities, piggeries, poultry farms, and gasfi<br />
red power generation stations. In some cases a monitoring programme<br />
will incorporate multiple sites within a single catchment programme for<br />
effi ciency.<br />
The <strong>Council</strong> employs a variety of techniques for air quality monitoring,<br />
including inspections of process and operational records, odour surveys,<br />
public odour diaries, stack (discharge) sampling for suspended dust<br />
and chemical constituents, deposition monitoring, ambient (downwind)<br />
gases and particulate monitoring, and video recording (e.g. of smoke<br />
and dust sources and cooling tower plumes). In the 2006-07 year the<br />
The Vector K _ apuni gas treatment plant.<br />
10 Resource Management (National Environmental Standards relating to certain air pollutants, dioxins and other toxics) Regulations 2004.<br />
11 Wu, J; Sanderson, K. 2008. Community Investment in Environmental Improvements in <strong>Taranaki</strong>. Prepared by Business and Economic Research Limited for <strong>Taranaki</strong> <strong>Regional</strong> <strong>Council</strong>.<br />
Rob Tucker<br />
State of the Environment Report 2009<br />
203
204<br />
ATMOSPHERE<br />
Calibrating nose sensitivity.<br />
THESE NOSES KNOW<br />
WHAT A BAD SMELL IS<br />
If you complain about an offensive odour in <strong>Taranaki</strong>, not just any old<br />
nose is likely to investigate.<br />
<strong>Taranaki</strong> <strong>Regional</strong> <strong>Council</strong> inspectorate and technical staff have had<br />
their noses calibrated to allow them to make objective assessments of<br />
odour complaints.<br />
The noses thus measured include that of Compliance Manager, Bruce<br />
Pope, who was found to be in the mid-range rather than having a<br />
highly sensitive nose or a ‘dead’ one.<br />
“The calibration involves a two-hour test in which the nose is exposed<br />
to gradually increasing amounts of n-butynol gas,” Bruce said. “The<br />
odour laboratory staff at Lincoln Ventures Limited, based at Lincoln<br />
<strong>Council</strong> undertook approximately 170 analyses of air in conjunction<br />
with site-specifi c compliance monitoring. 42% of all sites monitored<br />
under a site-specifi c programme achieved a high level of environmental<br />
performance and consent compliance, while another 51% showed a<br />
good level i.e. 93% of all sites had, at worst, a minor (short-term and<br />
inconsequential) environmental effect, and a positive and co-operative<br />
attitude towards compliance.<br />
In the 2003 State of the Environment Report it was noted that 80%<br />
of all sites were achieving a ‘good’ or ‘high’ level of environmental<br />
performance. Despite increasingly stringent consent conditions, the<br />
overall compliance and environmental performance of consent holders<br />
has improved in the past few years. Nineteen out of 20 consent holders<br />
operate their activities well in any year.<br />
(E) RESOURCE INVESTIGATIONS<br />
In April 2005 and again in April 2006, <strong>Council</strong> staff conducted visual<br />
surveys of the eastern ring plain to determine the environmental<br />
signifi cance of the burning of vegetation on production land. In particular,<br />
farmers may burn stubble from forage crops and trimmings from shelter<br />
TARANAKI – WHERE WE STAND<br />
Lincoln Ventures Limited<br />
University in Canterbury, can assess and calibrate nose sensitivity from<br />
the sniffer’s reaction.”<br />
Odour panellists can generally detect the n-butanyl at between 20 and<br />
80 parts per billion. With nose calibration certifi ed, <strong>Council</strong> staff are<br />
able to offer odour-intensity evidence of a standard acceptable in a<br />
court of law.<br />
Geoff Warren, of Lincoln Ventures, said it could be useful to have a<br />
range of nose sensitivity among a group of environmental inspectors.<br />
“Line up several calibrated individuals around an odour nuisance site<br />
and while Bruce may represent the ‘average’ individual, it may be that<br />
even the less sensitive nose can detect the odour, or that it appears<br />
very strong even to the more sensitive person.”<br />
Of the 540 environmental incidents investigated by <strong>Taranaki</strong> <strong>Regional</strong><br />
<strong>Council</strong> offi cers in 2007-08, a total of 222, or 41%, related to air<br />
quality. A quarter of these centred on meat and by-product processing<br />
operations and around 10% related to activities at private houses.<br />
Other complaints involved piggeries, poultry farming and building<br />
construction.<br />
“When we get a complaint about odour, we look at its source and do a<br />
360-degree check around the site to get an idea of the characteristics,”<br />
said Bruce. “We also look at how people nearby are reacting to it.”<br />
He said it was a good idea to keep an ‘odour diary’ if you were<br />
experiencing repeated problems from the same source.<br />
Bruce said most incidents were resolved without the need for<br />
enforcement action. “Very often, we fi nd that people become so<br />
de-sensitised to the odour at their workplace that they are completely<br />
unaware of how offensive it is to others.”<br />
belt pruning and tree clearance. While on most surveys one or two fi res<br />
could be observed, the practice was not so widespread or offensive that<br />
regulatory intervention was required.<br />
(F) UNAUTHORISED INCIDENTS<br />
When consent holders advise the <strong>Council</strong> of unauthorised emissions,<br />
or complaints are received from the public, or inspections show that<br />
consent conditions or rules in the <strong>Regional</strong> Air Quality Plan are breached,<br />
<strong>Council</strong> staff assess the incident and seek to resolve the situation in<br />
conjunction with the responsible party involved. Enforcement action is<br />
taken where appropriate. Enforcement action may involve the issuing of<br />
abatement notices, infringement notices and/or prosecution. Incidents<br />
are recorded on the <strong>Council</strong>’s register.<br />
(G) INFORMATION, EDUCATION AND ADVICE<br />
Information and advice are intended to raise awareness of issues and<br />
problems and provide simple cost-effective solutions enabling resource<br />
users to make well-informed decisions that prevent or minimise the<br />
effects of emissions that impact on air quality.
Table 6.4: Summary of progress implementing objectives and policies on air quality.<br />
Issue What do we want to achieve? What are we doing about it? Where are we at?<br />
Loss of air quality<br />
when contaminants<br />
are discharged<br />
Emissions from<br />
industrial and trade<br />
premises<br />
Unwanted effects of<br />
using agrichemicals<br />
Unwanted effects of<br />
burning vegetation<br />
Emissions from<br />
domestic sources<br />
Emissions from<br />
vehicles<br />
The <strong>Council</strong> has produced:<br />
a guide to the requirements of the <strong>Regional</strong> Air Quality Plan for <strong>Taranaki</strong><br />
for all farmers in the region. The guide covers effl uent disposal,<br />
burning, spraying, fertiliser applications and pig and poultry farming;<br />
information on air quality included in its Environmental Management<br />
Guide for businesses and industries;<br />
guidelines for spray painters, commercial kitchens, and the design and<br />
operation of small domestic and school incinerators;<br />
guides for small industry and the oil and gas industry on plan<br />
requirements; and<br />
information on its web pages.<br />
The public notifi cation of the Proposed <strong>Regional</strong> Air Quality Plan will be<br />
accompanied by a publicity campaign.<br />
(H) SUMMARY OF PROGRESS<br />
Maintenance and enhancement of<br />
<strong>Taranaki</strong>’s existing high air quality.<br />
Dealing with effects involving health<br />
risk, offensiveness, and other effects.<br />
Provision of special protection to<br />
human health, enjoyment, sensitive<br />
ecosystems, sensitive areas, crops and<br />
animals, and other important places.<br />
Management of use of agrichemicals.<br />
Reduction in the possibility of smoke<br />
affecting people and soiling property.<br />
Reduction in effects on people and<br />
property.<br />
A summary of progress, assessed against the issues and desired<br />
outcomes set out in the <strong>Regional</strong> Air Quality Plan, is provided in Table 6.4.<br />
6.1.3 HOW DOES TARANAKI<br />
AIR QUALITY COMPARE?<br />
In the national study on levels of particulate material described above,<br />
the air in New Plymouth (taken as representative of the air across the<br />
ring plain of <strong>Taranaki</strong>) was shown to be excellent to good according to<br />
the categories used by the Ministry for the Environment.<br />
In terms of the effects of air quality upon human health, a study released<br />
in 2007 has established that <strong>Taranaki</strong> is one of the healthiest regions in<br />
New Zealand 12 . The study assessed and quantifi ed the health risks due<br />
to exposure to air pollution in 67 urban areas of New Zealand, covering<br />
Implementing the <strong>Regional</strong> Air Quality<br />
Plan 1997<br />
Issuing and monitoring resource<br />
consents for discharges to air.<br />
Requiring improvements in process<br />
and abatement technologies through<br />
resource consent processes.<br />
Monitoring the general air quality in<br />
<strong>Taranaki</strong> including in pristine, rural and<br />
urban areas and high traffi c movement<br />
areas.<br />
Monitoring air pollution events in<br />
<strong>Taranaki</strong> and their causes.<br />
Providing information and advice.<br />
Monitoring the number of air<br />
discharge permits for agrichemical<br />
application and complaints caused by<br />
their misuse.<br />
Advocating improvements in vehicle<br />
emissions.<br />
Clear sky over New Plymouth.<br />
73% of the country’s population. New Plymouth and H _ awera were two<br />
of the areas investigated.<br />
The study found that air pollution-related deaths varied from a rate of<br />
0.18 per 1,000 people per year in New Plymouth (low pollution levels<br />
12 Ministry for the Environment, and Ministry of Transport. 2007. Health and Air Pollution in New Zealand, Joint report for Health Research <strong>Council</strong> of New Zealand.<br />
Preparing for review of <strong>Regional</strong> Air<br />
Quality Plan in 2008<br />
<strong>Taranaki</strong>’s air quality is rated ‘excellent’<br />
according to MfE categories.<br />
Signifi cant improvement made in<br />
process and pollution abatement<br />
technologies.<br />
Resource consents monitored. 93 % of<br />
air permit holders routinely achieve a<br />
‘good’ or ‘excellent’ performance (up<br />
from 80% in 2003).<br />
Air pollution events monitored, causes<br />
investigated and actions taken.<br />
Information and advice provided and<br />
guidelines prepared.<br />
Advocacy undertaken on air quality<br />
issues.<br />
Few problems experienced with<br />
agrichemical use over the past six<br />
years.<br />
Fuel usage monitored.<br />
Rob Tucker<br />
State of the Environment Report 2009<br />
205
206<br />
ATMOSPHERE<br />
due to its very exposed location) to a rate of 0.74 per 1,000 people in<br />
central Christchurch (due to its sheltered meteorology and high rate of<br />
wood burner use). Nationally, one in 20 people (4.8%) die earlier than<br />
they would have because of air pollution compared to one in 30 people<br />
(2.9%) in New Plymouth or one in 9 people (11.8 %) in Christchurch.<br />
Of the 67 urban centres studied, H _ awera also made the top 10 in terms<br />
of low air pollution-related mortality, behind New Plymouth with the<br />
lowest.<br />
Nationally, the greatest single cause of premature mortality is fi ne<br />
particulate levels (sourced from combustion). It is estimated that each<br />
year an average of 1,100 people die prematurely due to exposure to air<br />
pollution across New Zealand.<br />
Under the national environmental standards, regional councils are<br />
obliged to establish air management areas or airsheds for areas that<br />
do not meet the ambient air quality criteria stipulated in the standards.<br />
Forty-two such airsheds have been created around New Zealand. Along<br />
with Gisborne, the <strong>Taranaki</strong> region is one of only two in New Zealand<br />
that have not had to gazette an airshed. The region is in this position<br />
because of its high air quality.<br />
Nationally, about 53% of New Zealanders live in areas that from time<br />
to time do not meet ambient air quality standards, primarily because<br />
of emissions from vehicles and from coal and wood used for home<br />
heating 13 . Main centres such as Auckland, Hamilton, Christchurch and<br />
Dunedin all have poor air quality. The main pollutant of concern is<br />
inhalable particulate materials. As noted above, in <strong>Taranaki</strong> the main<br />
source of such particles is sea spray, and <strong>Taranaki</strong>’s air is rated good to<br />
excellent with respect to this pollutant.<br />
Nationwide, 44% of homes burn solid fuels (wood and coal) for home<br />
heating. This is the same level as in <strong>Taranaki</strong>.<br />
6.2 GREENHOUSE GASES<br />
AND CLIMATE CHANGE<br />
6.2.1 WHAT IS THE STATE<br />
OF GREENHOUSE GASES IN<br />
TARANAKI?<br />
Greenhouse gases include carbon dioxide, methane and nitrous oxide,<br />
which have the ability to trap infra-red energy that would otherwise<br />
be radiated off the Earth’s surface into the atmosphere. These gases<br />
originate from industry, wastes, farming and fuel.<br />
(A) CHANGES IN EMISSIONS<br />
Industry<br />
The level of emissions from industry varies year by year, especially in<br />
the energy sector in those years when gas-fi red power stations are used<br />
to make up the shortfall in generation from other generators, such as<br />
hydropower stations.<br />
13 Ministry for the Environment, 2007. Environment 2007.<br />
TARANAKI – WHERE WE STAND<br />
The New Plymouth power station was a 600 MW capacity station<br />
operating on gas. When operating at a capacity of 75-80%, the station<br />
would have emitted 2.4 million tonnes of carbon dioxide annually.<br />
In 2007, Contact Energy announced the permanent closure of the<br />
station, although in 2008 parts of the station were temporarily used for<br />
emergency electricity generation.<br />
A 200 MW gas turbine station at Stratford was closed in August 2001<br />
and subsequently dismantled. In 2007 Contact Energy announced that<br />
it would build a new high effi ciency open cycle gas turbine peaking<br />
station of 200 MW generation capacity on the site. Peaking stations<br />
are not generally intended for continuous operation but rather only for<br />
short-duration operation to satisfy demand at peak periods or to provide<br />
cover for the country’s hydropower stations during periods of low hydro<br />
storage. Assuming a 40% load factor for the 200 MW power stations<br />
(i.e. recognising that they were/are not baseload stations), the old power<br />
station would have emitted 560,000 tonnes of carbon dioxide per year,<br />
and for the same load factor, the new station will emit 350,000 tonnes<br />
per year, a reduction of 210,000 tonnes per year (38%).<br />
Methanex owns two methanol plants in <strong>Taranaki</strong>, located in the Waitara<br />
Valley and at Motunui. The two sites would have emitted 0.5 and 1.6<br />
million tonnes of carbon dioxide per year, respectively. The Motunui<br />
site was closed in 2004, with limited production continuing at Waitara<br />
Valley. In 2007 Methanex announced its intention to refurbish and reopen<br />
half the capacity of the Motunui site during 2008. The intention is<br />
that the Waitara Valley site will be closed. The net change in combined<br />
maximum annual emissions will be a reduction from 2.1 million tonnes<br />
to 0.64 million tonnes.<br />
Hydrocarbon production stations use natural gas as a fuel for on-site<br />
energy requirements, and as a purge gas burnt from fl ares as a plant<br />
safety procedure. Gas may also be discharged during plant trip-outs or<br />
if unsaleable (e.g. LPG from time to time). Over the past 15 years, the<br />
hydrocarbon production and treatment plants in <strong>Taranaki</strong> have reduced<br />
carbon dioxide emissions by reducing everyday fl aring, recovering more<br />
hydrocarbon fractions as sales stock, and improving plant stability. For<br />
example, at one production station annual CO2 emissions have been<br />
reduced 85% since 1996, and at another, 55% since 2001.<br />
Methanex methanol plant and the Pohokura production station in foreground, Motunui.<br />
Rob Tucker
Wastes<br />
The decomposition of organic wastes in landfi ll releases methane, a<br />
potent greenhouse gas. While composting leads to some release of<br />
carbon dioxide, the volume of gas and its warming potential are far less<br />
than if the material is landfi lled. The volumes of waste being disposed of<br />
to landfi ll in the region has risen over the past six years (refer to Chapter<br />
9: Waste). Increasingly, green and other organic wastes are composted<br />
instead of going to a landfi ll.<br />
Farming<br />
Methane, a potent greenhouse gas, is produced by animals such as<br />
cows, sheep, deer and possums through their digestive processes. The<br />
highest rate of methane generation is from dairy cows, and animals are<br />
responsible for about 87% of all New Zealand’s methane emissions.<br />
Animals also produce urea in their urine which turns into ammonia, nitrous<br />
oxide and nitrates. While the actual volumes of nitrous oxide are quite<br />
small, it is a very potent gas (over 300 times as potent as carbon dioxide).<br />
In terms of trends in emissions from farm animals over the past 10 years,<br />
the number of dairy cattle, beef cattle and sheep numbers has decreased<br />
(see section on livestock emissions earlier in this chapter). Thus it can be<br />
reasonably assumed that the overall greenhouse emissions from animals<br />
will also have decreased.<br />
Fonterra has advised the <strong>Council</strong> that milk production in <strong>Taranaki</strong> fell to<br />
1,576 million litres in 2007-08 from 1,696 million litres the previous year,<br />
due in part to the drought of summer-autumn 2008. The Ministry for the<br />
Environment 14 considers that in the period 1990-2005, methane emissions<br />
per head of dairy cattle rose 11%, per beef 12%, and per sheep 19%.<br />
Thus overall, methane and nitrous oxide emissions from animals may<br />
have fallen in <strong>Taranaki</strong> (based on the numbers of animals) but more<br />
robust measurement and monitoring techniques are required for<br />
calculating regional greenhouse gas inventories (given possible changes<br />
in methane emissions per animal).<br />
Nitrogenous fertiliser such as urea also decomposes to ammonia,<br />
releasing nitrous oxide. While the quantity of nitrogen applied to pasture<br />
from urine is much higher on intensively grazed pasture than the quantity<br />
The highest rate of methane generation is from dairy cows.<br />
14 Ministry for the Environment, 2007. Projected Balance of Emissions Units During the First Commitment Period of the Kyoto Protocol.<br />
15 Ministry of Agriculture and Forestry, 2003. Abatement of Agricultural Non-Carbon Dioxide Greenhouse Gas Emissions.<br />
Rob Tucker<br />
from fertiliser, the latter is generally applied in two single applications<br />
rather than all year round, and so can result in proportionally greater<br />
amounts of nitrous oxide gas.<br />
The Ministry for Agriculture and Forestry 15 suggests that the ratio<br />
of animal wastes to fertiliser as comparative sources is 6:1. Data<br />
obtained from MAF and Statistics New Zealand show that quantities<br />
of nitrogenous fertiliser applied in the region have risen substantially<br />
over the past two decades and are still increasing. Twenty-six times<br />
more urea was applied than in the mid-1980s, and fi ve times more diammonium<br />
phosphate (after peaking at 10 times more in the mid-1990s)<br />
(refer Table 6.5 ).<br />
Table 6.5: Trends in nitrogenous fertiliser use in <strong>Taranaki</strong> (units: tonnes annually).<br />
Di-ammonium<br />
phosphate<br />
Urea<br />
Ammonium<br />
sulphate<br />
Mid 1980s 1,700 900 2,250<br />
Mid 1990s 17,000 12,100 3,600<br />
2004 8,830 26,400 1,000<br />
Research is showing that the rate of methane generation per animal<br />
and of nitrous oxide per hectare of soil is hugely variable, both for the<br />
same animal day by day and comparing one animal with another (and<br />
similarly for land use). Research is underway into measuring differences<br />
and understanding the reasons behind variability. The Government’s<br />
intention is that by 2011 the emissions from individual farms will be able<br />
to be calculated accurately.<br />
Motor vehicles emissions<br />
The burning of petrol, diesel, and natural gas (CNG and LPG) as fuel in<br />
vehicles releases carbon dioxide. Over the past 10 years, the number of<br />
motor vehicles used on the road in the region has increased from 51,300<br />
to 60,900. Over the same period, the volume of petrol used annually in<br />
the region has remained constant, at around 77 million litres resulting<br />
in 177,000 tonnes of carbon dioxide. However, the volume of diesel<br />
The number of vehicles in New Plymouth continues to increase.<br />
<strong>Taranaki</strong> <strong>Regional</strong> <strong>Council</strong><br />
State of the Environment Report 2009<br />
207
208<br />
ATMOSPHERE<br />
fuel used has increased 25% in the same period, from an average of<br />
56.4 million litres to 73.2 million litres used in the 2006-07 period, now<br />
resulting in 191,583 tonnes of carbon dioxide. Thus, over the past 10<br />
years, emissions of carbon dioxide from transport fuels have increased<br />
by 48,000 tonnes annually in the region, due exclusively to increased use<br />
of diesel fuel.<br />
Summary<br />
Table 6.6 summarises the general trends in greenhouse gas emissions<br />
by sector based on the above discussion.<br />
Table 6.6: Summary of overall trends in greenhouse gas emissions by sector,<br />
1998-2008.<br />
Industry Wastes Livestock Soil Fuel<br />
☺ � ☺ � �<br />
(B) CONSEQUENCES OF CLIMATE CHANGE<br />
The international picture<br />
The Intergovernmental Panel on Climate Change has released its Fourth<br />
Assessment Report, covering the scientifi c evidence for climate change<br />
manifestation, impacts, vulnerability and adaptation, mitigation options,<br />
and a synthesis report 16 . The report states that scientists consider ‘with<br />
<strong>Taranaki</strong> may become windier with climate change.<br />
16 IPCC. 2007. Fourth Assessment Report on Climate Change.<br />
17 NIWA. 2007. Climate change IPCC Fourth Assessment Report. Leafl et produced by the NIWA National Climate Centre, in collaboration with the Royal Society of New Zealand.<br />
TARANAKI – WHERE WE STAND<br />
Rob Tucker<br />
high confi dence’ (i.e. certainty) that impacts of climate change are now<br />
being seen around the world, in phenomena such as changes to natural<br />
ecosystems, increasing stresses upon water supply, reduced seasonal<br />
snow cover, and glacier shrinkage.<br />
The national picture<br />
Across New Zealand as a whole since 1950 there has been a warming<br />
of 0.3-0.7º C with more frequent heat waves, fewer frosts (10-20 fewer<br />
per year), more rain in the south-west and less in the north-east of<br />
the country, and a rise in sea level of about 70 mm. One quarter of the<br />
alpine ice mass has vanished, and beech forests are showing increased<br />
seed production. NIWA state that it is virtually certain (more than<br />
99% probability) that New Zealand will continue warming, with heat<br />
waves and fi re risk increasing in intensity and frequency, more frequent<br />
and intense fl oods, landslides, droughts, and sea storm surges, and<br />
increasing rain in western regions and increasingly dry in the east 17 .<br />
Over the next few decades, climate change may benefi t New Zealand<br />
in some ways – enhanced pastoral production due to higher carbon<br />
dioxide in the atmosphere, longer growing seasons, and less frost risk,<br />
opportunities for horticultural diversifi cation, reduced energy demand<br />
and better public health in winter, and greater water fl ows benefi tting<br />
hydro-electricity and irrigation supply. However, even by 2020, natural<br />
ecosystems are likely to become stressed, with more invasive species,<br />
habitat change and loss, and species extinctions (e.g. in alpine areas), as<br />
the rate of climate change will outstrip the rates at which ecosystems<br />
can adapt. Sea level rise and coastal storm surges will affect coastal<br />
development and infrastructure.<br />
The regional picture<br />
A single drought or extreme weather event (such as the summer drought<br />
of 2008 or the tornado swarm of July 2007) do not of themselves ‘prove’<br />
or necessarily arise from climate change (nor would a severe cold spell<br />
‘disprove’ it). It is the overall pattern observed over several years or<br />
decades that is signifi cant. The NIWA report found that climate change<br />
is predicted to lead to a number of changes in <strong>Taranaki</strong>.<br />
Storm surges may be more frequent as <strong>Taranaki</strong>’s climate changes.<br />
Rob Tucker
A temperature increase will push species south. The bush-clad eastern<br />
hill country allows easy migration of fl ora and fauna along corridors<br />
north to south, while riparian planting will do likewise. Alpine species<br />
on Mount <strong>Taranaki</strong> will come under pressure, but given that there is no<br />
permanent snow cover in any case, they may well have some degree of<br />
robustness already. Freshwater wetlands might well be enhanced.<br />
In terms of weather and climate, <strong>Taranaki</strong> is expected to become<br />
marginally wetter overall. The greatest pressure may come from an<br />
increasing frequency of extreme weather events. Westerly winds will<br />
increase in frequency and possibly strength.<br />
A study into the region’s rainfall between 1930 and 2004 found that<br />
there has indeed been an increase in westerly winds over this period,<br />
as predicted 18 . In the eastern hill country, the number of rain days, the<br />
number of days when heavy rain fell, the total amount of rain falling<br />
on those days, and the amount of rain falling on the days of heaviest<br />
rain, have all increased. The only decrease noted was in the number<br />
of consecutive dry days each year. For northern <strong>Taranaki</strong> the same,<br />
although weaker, pattern emerges with an increase in the number of<br />
days of heavy rainfall at New Plymouth, and an increase in the amount<br />
of rain falling on the days of heaviest rain. The number of consecutive<br />
dry days each year has decreased (i.e. the dry spells are generally<br />
becoming shorter).<br />
South of the mountain, there is no evidence of a trend in any index that<br />
is statistically strong enough to be deemed signifi cant, but all indications<br />
are moving towards dryness, with reductions in the number of wet days<br />
and the amount of rain falling on those days. While the number of days<br />
experiencing heavy rain is not changing, the amount of rain falling on<br />
these days appears to be reducing.<br />
In terms of pastoral farming, productivity is expected to increase by<br />
10-20% over the next two decades due to warmer weather, a longer<br />
growing season, and increased CO2 in the atmosphere. However,<br />
warmer and wetter weather may mean an increase in fungal diseases,<br />
and pastoral species such as paspalum and kikuyu may become a bigger<br />
problem in pasture. In horticulture, increased vegetative growth may<br />
18 Griffi ths, G.M. 2007. Changes in New Zealand daily rainfall extremes 1930-2004. Weather and Climate 27:47-66. Published by the NZ Meterological Society.<br />
Rob Tucker<br />
Wind Wand, New Plymouth. Cropping may increase in <strong>Taranaki</strong> as the weather becomes warmer.<br />
adversely affect fruit quality and yield. Warmer weather may allow an<br />
increase in cropping in the region.<br />
On the coast, more regular and more vigorous swells are expected. With<br />
few low-lying centres of population and development, <strong>Taranaki</strong> is not<br />
highly vulnerable in this regard. Coastal erosion rates will increase.<br />
In terms of the infrastructure and the built environment, oil and gas<br />
production and electricity transmission utilities will have to take into<br />
account the possibility of more severe weather. The increased westerly<br />
winds will very likely enhance wind generation potential and local hydro<br />
generation, especially in winter. Increased storm severity and frequency<br />
may lead to increased insurance premiums and increased storm damage<br />
being more widespread and severe. This <strong>Council</strong> may need to review the<br />
degree of protection afforded by its fl ood protection works. Increased<br />
natural erosion could lead to more sediment and sand movement<br />
deposited into the coast (including into the Port).<br />
Plantation forestry productivity is expected to increase (warmer and<br />
wetter, and increased CO2 in the atmosphere).<br />
<strong>Taranaki</strong> is not expected to be an area where tropical and sub-tropical<br />
diseases or disease vectors might become established. Diseases (human<br />
and animal) spread by bacteria may increase due to warmer, wetter<br />
weather. On the other hand, warmer winters are expected to lead to a<br />
reduction in mortality rates.<br />
6.2.2 WHAT STEPS ARE WE<br />
TAKING TOWARDS MANAGING<br />
CLIMATE CHANGE?<br />
Climate change is being addressed by the Government and other<br />
members of the international community through the Kyoto Protocol,<br />
which sets targets for the reduction of greenhouse gas emissions. The<br />
target for New Zealand is that greenhouse gas emissions during the<br />
years 2008-2012 should on average be the same as they were in 1990.<br />
Rob Tucker<br />
State of the Environment Report 2009<br />
209
210<br />
ATMOSPHERE<br />
(A) REGIONAL POLICY<br />
STATEMENT AND PLANS<br />
The Proposed <strong>Regional</strong> Policy Statement for <strong>Taranaki</strong> includes<br />
recognition of the effects of climate change as a signifi cant issue for<br />
the region, and has policies relating to adaptation and mitigation of the<br />
effects of climate change and methods for both the regional council and<br />
district councils to implement.<br />
The <strong>Regional</strong> Air Quality Plan is also in the process of being reviewed.<br />
The plan could include measures that produce overall reduction of<br />
emissions from various sources of products of combustion since these<br />
measures have air quality benefi ts in any case, other than solely<br />
reductions of greenhouse gas emissions. This will also provide some<br />
incentive to reduce greenhouse gases. The plan could include provisions<br />
to improve energy effi ciency, favour processes that emit fewer<br />
greenhouse gases, the promotion of vehicle effi ciency, restrictions on<br />
activities such as fl aring at hydrocarbon exploration and production sites,<br />
and controls on emissions from landfi lls.<br />
The <strong>Council</strong> is a signatory to the Communities for Climate Protection<br />
Programme. This voluntary programme aims to empower local<br />
government to reduce greenhouse gas emissions from councils’<br />
operations and from their communities. The programme has fi ve<br />
The petrochemical industry is a signifi cant activity in <strong>Taranaki</strong>.<br />
19 Resource Management (Energy and Climate Change) Amendment Act 2004<br />
TARANAKI – WHERE WE STAND<br />
Rob Tucker<br />
milestones to achieve. The fi rst two of these milestones (an inventory of<br />
greenhouse gas emissions and setting a reduction target and timeframe)<br />
have been adopted. The <strong>Council</strong> is currently in the process of preparing a<br />
local action plan towards the third milestone which will outline specifi c<br />
measures to meet greenhouse gas reduction targets.<br />
(B) RESOURCE CONSENT MANAGEMENT<br />
Over the years there has been uncertainty in some quarters about the<br />
role of regional councils with regard to greenhouse gas emissions.<br />
However, the Government has confi rmed that because climate change is<br />
an international issue, it should be dealt with at a national level. In 2004<br />
the Government amended the Resource Management Act to essentially<br />
remove consideration of greenhouse gases and climate change effects<br />
from resource consent assessments 19 , other than when considering<br />
applications relating to activities involving renewable energy.<br />
That said, consent holders of air discharge consents for industrial sites<br />
are required to report on emission reduction and energy effi ciency<br />
options they have investigated and implemented.<br />
(C) SUSTAINABLE <strong>LAND</strong> MANAGEMENT<br />
The <strong>Council</strong> works with farmers to encourage the provision of<br />
riparian vegetation along stream banks, and on hill country to identify<br />
sustainable land use practices. On steeper or more unstable country<br />
this means plantation forestry or allowing reversion to native bush. The<br />
<strong>Council</strong>’s sustainable land management programme outlined in Chapter<br />
3 will, over time, mean more trees in the ground which will ultimately<br />
help absorb carbon dioxide emissions.<br />
(D) INFORMATION, ADVOCACY, EDUCATION,<br />
RESEARCH, AND ADVICE PROGRAMMES<br />
In terms of emissions from soils, nitrous oxide emissions can be reduced<br />
by measures such as nutrient modelling and budgeting, the use of<br />
nitrifi cation inhibitors, better herd management especially when soils<br />
are saturated and appropriate choice of supplementary feeds with low<br />
nitrogen content. These are measures the <strong>Council</strong> is investigating and<br />
supporting through channels such as the Clean Streams Accord with<br />
the dairy industry, and trials on research farms. The <strong>Council</strong> is also<br />
supporting research into control of the clover root weevil, a pest that<br />
reduces nitrogen fi xation by clover, and hence forces farmers to use<br />
nitrogen fertiliser as an alternative (see case study in Chapter 3 on the<br />
clover root weevil). It is also anticipated that purchases of nitrogenous<br />
fertilisers will reduce given that prices are rising sharply.<br />
During the past six years, the <strong>Council</strong> has advocated on eight occasions<br />
for what it considers to be regionally effective and effi cient statutory,<br />
policy, and economic measures in connection with options for emissions<br />
trading schemes or other economic measures such as carbon taxes,
amendments to the RMA, the role of forestry, and emissions reduction<br />
options. It has also submitted in relation to renewable energy policies<br />
and options.<br />
(E) REGIONAL TRANSPORT<br />
The <strong>Council</strong> contracts a public passenger transport service in the wider<br />
North _ <strong>Taranaki</strong> urban areas (New Plymouth, Waitara, Bell Block and<br />
O _ akura). In the 2006-07 year, over 320,000 trips were made. Patronage<br />
on almost all services for almost all types of passenger category has<br />
increased over previous levels. Once-a-week bus services have been<br />
established between Waverley and H _ awera, Opunake and H _ awera,<br />
Opunake and New Plymouth and Inglewood and New Plymouth.<br />
(F) SUMMARY OF PROGRESS<br />
Table 6.7 summarises the progress with measures to mitigate<br />
greenhouse gases and adopt to climate change as a region.<br />
Table 6.7: Summary of progress: implementing regional objectives and policies on greenhouse gases.<br />
Issue What do we want to achieve? What are we doing about it? Where are we at?<br />
Greenhouse<br />
gas emissions<br />
Reduction or minimisation of emissions<br />
of greenhouse gases, in a manner<br />
consistent with national policies and<br />
statutes<br />
Minimisation of adverse effects of<br />
greenhouse gases<br />
6.2.3 HOW DOES<br />
TARANAKI COMPARE?<br />
On a per capita basis, <strong>Taranaki</strong> emits about four to four and a half<br />
times the national average of methane, and three to fi ve times the<br />
national average of carbon dioxide. This is because of <strong>Taranaki</strong>’s<br />
relatively small population, signifi cant pastoral industry, and the<br />
location of national/international energy and petrochemical facilities<br />
within the region. Compared with other regions, <strong>Taranaki</strong>’s contribution<br />
from the transport sector is very small but its contribution from its<br />
farming sector is very large.<br />
Climate change may have implications for wildlife.<br />
Preparing and implementing the <strong>Regional</strong><br />
Air Quality Plan for <strong>Taranaki</strong> (1997)<br />
Preparing and implementing a new Air<br />
Plan (2008-09)<br />
Addressing climate change in the new<br />
Proposed <strong>Regional</strong> Policy Statement<br />
Advocating actions on climate change,<br />
with a particular focus on encouraging<br />
central government to prepare and<br />
implement national strategies and/or<br />
policies to manage emissions.<br />
Providing advice and information.<br />
Encouraging reforestation.<br />
20 Ministry for the Environment, 2007. Projected Balance of Emissions Units During the First Commitment Period of the Kyoto Protocol.<br />
<strong>Regional</strong> Air Quality Plan currently being<br />
reviewed.<br />
Decrease in regional greenhouse gas<br />
emission potential over the past fi ve<br />
years.<br />
Central Government ratifi ed the Kyoto<br />
Protocol. Economy-wide Emissions<br />
Trading Scheme, other government<br />
initiatives (Sustainable Land Use,<br />
Afforestation Grants Scheme, Permanent<br />
Forests Scheme) in effect from 2008<br />
All major emitters in the region hold<br />
consents requiring reporting of energy<br />
effi ciency measures, and emission<br />
reduction investigations.<br />
No local effects of greenhouse gas<br />
emissions in vicinity of major sources.<br />
<strong>Council</strong> promotion and regional uptake of<br />
riparian and hillcountry farm plans.<br />
Over the past fi ve years, the regional greenhouse gas emissions<br />
inventory has probably reduced overall, because of the closure of some<br />
large energy and industrial sources and the declining or static size of<br />
livestock herds.<br />
Nationally, emissions from the transport and energy sectors continue to<br />
grow rapidly, and the Government expects that by 2012 the country will<br />
be emitting 70% more than in 1990 20 . From 1990 to 2005, nationwide<br />
agricultural emissions rose 15%, energy and transport 42%, and industry<br />
32%, for a net overall increase of 25%, with a 10% increase in the fi ve<br />
years 2000-2005.<br />
Rob Tucker<br />
State of the Environment Report 2009<br />
211
212<br />
ATMOSPHERE<br />
Hill country farmers gather at the Douglas seminar.<br />
SOMETHING NEW IN THE AIR<br />
Greenhouse gases may be the ultimate ill wind, but they are resulting<br />
in remedial actions that promise to be good for earth and water as<br />
well as air. And even good for the wallets of landowners.<br />
New environmental and economic opportunities are presented by<br />
climate change initiatives – and they have been explored at seminars<br />
organised by the <strong>Taranaki</strong> <strong>Regional</strong> <strong>Council</strong>.<br />
The carbon farming seminars were held in all four corners of the<br />
region between November 2007 and March 2008. _Hillcountry farmers<br />
were the main target, with turn-outs of 60 at Uruti,<br />
80 at Douglas and<br />
40 at Waverley.<br />
Some background: trees play a big role in new climate change<br />
initiatives. Simply put, forests reduce the level of greenhouse gases<br />
by removing carbon from the atmosphere and turning it into wood.<br />
A major aim of the new approach is to keep land in trees and to<br />
promote the growth of new trees. So harvesting incurs a new cost<br />
TARANAKI – WHERE WE STAND<br />
<strong>Taranaki</strong> <strong>Regional</strong> <strong>Council</strong><br />
(the surrender or repayment of the new carbon credits) unless the<br />
felled trees are replaced.<br />
Speakers from the <strong>Taranaki</strong> <strong>Regional</strong> <strong>Council</strong>, MAF, the forestry<br />
industry and carbon brokers took part in the carbon farming seminars,<br />
and their major emphasis was on the business opportunities that<br />
exist for landowners in climate change initiatives such as the Forestry<br />
Emissions Trading Scheme, the Permanent Forest Sink Initiative and<br />
the Afforestation Grants Scheme.<br />
The Permanent Forest Sink Initiative in particular offers hillcountry<br />
landowners new scope for developing useful new income streams<br />
off steep, highly erosion-prone, infertile land – while at the same<br />
time meeting the sorts of soil conservation objectives pursued by the<br />
<strong>Council</strong>. There is fl exibility, too, so the landowner can decide which<br />
land pockets might be best for reversion to scrub and which would be<br />
best for planting trees.<br />
No matter what the option, such vegetation in this steep country will<br />
help to prevent sediment run-off into streams and so enhance water<br />
quality throughout the entire catchment.<br />
The <strong>Council</strong> may be able to assist in a variety of ways – for example<br />
by supplying historical photos that may be needed by those thinking<br />
of taking up one of the climate change initiatives and who need to<br />
prove that their forest did not exist prior to 1990, which is the nominal<br />
starting point for these initiatives.<br />
Private companies are positioning themselves to work with<br />
landowners to take advantage of the new initiatives, and<br />
representatives of some of them were among speakers at the<br />
<strong>Council</strong>’s carbon farming seminars, although this did not imply <strong>Council</strong><br />
endorsement of any particular company, and landowners were<br />
encouraged to seek independent advice.
Photo: Rob Tucker<br />
CHAPTER 7<br />
<strong>LAND</strong>SCAPE,<br />
HERITAGE AND<br />
AMENITY VALUES<br />
213
214<br />
AT A GLANCE<br />
<strong>LAND</strong>SCAPE<br />
<strong>Taranaki</strong> has a number of outstanding and regionally signifi cant<br />
landscapes. Mount <strong>Taranaki</strong> dominates the landscape and together<br />
with the Kaitake and Pou _ akai ranges is of national and international<br />
signifi cance. Outstanding landscapes are identifi ed in each district<br />
plan. For most areas identifi ed in the New Plymouth District, there have<br />
been no signifi cant changes, since 1995, that have adversely affected<br />
landscape qualities. Although landscape values on the ring plain on the<br />
northern slopes of the Kaitake and Pou _ akai ranges have been affected<br />
to some degree by increased building density. While there have been<br />
some developments along State Highway 3 in the past fi ve years, these<br />
have not had signifi cant adverse effects overall on landscape qualities<br />
identifi ed for the Stratford District. South <strong>Taranaki</strong> District <strong>Council</strong> is to<br />
undertake a landscape assessment of the district.<br />
TARANAKI – WHERE WE STAND<br />
HERITAGE<br />
The <strong>Taranaki</strong> region has signifi cant historic heritage resources that<br />
provide important links with the past. Historic buildings, structures,<br />
places, w _ ahi tapu or other sites have archaeological, historic,<br />
architectural, cultural, scientifi c and technological value or signifi cance.<br />
In summary:<br />
• a total of 1,345 heritage buildings or structures and 1,774<br />
archaeological sites have been identifi ed;<br />
• 193 historic heritage sites are protected by the three district councils<br />
through their district plans;<br />
• the New Plymouth District <strong>Council</strong> has identifi ed 80 Category A<br />
heritage buildings which have not been damaged over this period,<br />
although a number of category B and C heritage buildings have been<br />
destroyed;<br />
• archaeological sites in <strong>Taranaki</strong> are susceptible to damage from<br />
land uses and development and a number have suffered damage<br />
from stock, erosion, bulldozing for farm tracks, or in some cases by<br />
earthworks for buildings, roads and quarries.
AMENITY VALUES<br />
Amenity values are those natural and physical qualities and<br />
characteristics that contribute to people’s appreciation and enjoyment<br />
of the environment. <strong>Taranaki</strong> residents place high value on the region’s<br />
clean and quiet environment, the scenic, aesthetic and recreational<br />
opportunities provided by parks, reserves, farmland, waterways, coastal<br />
areas, bush and walkways, a pleasant environment free of nuisance<br />
from excessive noise and odour, and attractive development of the built<br />
environment. Community facilities such as sporting and entertainment<br />
venues, libraries and museums also contribute to attractive towns and<br />
urban areas and their cultural and recreational attributes.<br />
Over the past fi ve years there has been continued provision,<br />
development or upgrading of a number of community recreational and<br />
cultural facilities such as events centres, the coastal walkway, public<br />
gardens and upgrades of most business districts in the region.<br />
State of the Environment Report 2009<br />
215
216<br />
<strong>LAND</strong>SCAPE, HERITAGE & AMENITY VALUES<br />
From every angle Mount <strong>Taranaki</strong> dominates the landscape.<br />
OUR <strong>LAND</strong>SCAPE,<br />
HERITAGE AND<br />
AMENITY VALUES<br />
<strong>Taranaki</strong>’s landscapes, historic heritage and amenity values are<br />
important aspects of the environment because they contribute to our<br />
quality and enjoyment of life. These features or values hold important<br />
social, emotional, historical or cultural signifi cance to people living<br />
within and outside the region – and they make <strong>Taranaki</strong> unique. They are<br />
also important economically, attracting many domestic and international<br />
visitors to the region.<br />
Mount <strong>Taranaki</strong>, a landscape of national and international signifi cance,<br />
dominates the <strong>Taranaki</strong> landscape and is the subject of many pictures<br />
and postcards. <strong>Taranaki</strong>’s rural hill country landscapes, coastal and<br />
marine natural features and rivers and lakes are also distinctive and<br />
highly valued. They form an integral part of the region’s identity, natural<br />
character and appeal. Many have cultural signifi cance for M _ aori.<br />
The <strong>Taranaki</strong> region has signifi cant historic heritage resources that<br />
provide important links with the past and contribute to an understanding<br />
of our history. Historic buildings, structures, places, w _ ahi tapu and other<br />
sites have archaeological, historic, architectural and cultural value. For<br />
example, many pre-European archaeological sites include middens,<br />
ovens, village or p _ a sites and urup _ a (burial grounds). Remnants of early<br />
European history include features associated with timber extraction,<br />
railway construction, land wars and dairying.<br />
Various use and development activities can impact on landscape,<br />
heritage and amenity values. For example, increasing levels of<br />
subdivision and building development can impact on landscape values.<br />
Site-specifi c developments may affect w _ ahi tapu, archaeological sites,<br />
heritage buildings and neighbourhood amenity values. Activities such<br />
as building, quarrying, logging, grazing and roading development can<br />
have varying effects depending on the scale and location of the activity<br />
and the degree of sensitivity of the surrounding environment in which<br />
1 Ministry for the Environment, 2000. The Impact of Development on Rural Landscape Values.<br />
2 Pigeon Bay Aquaculture Ltd v Canterbury <strong>Regional</strong> <strong>Council</strong> 1999 NZRMA 209, Environment Court.<br />
3 Department of Conservation, 2002. Egmont National Park Management Plan 2002-2012<br />
TARANAKI – WHERE WE STAND<br />
Rob Tucker<br />
the development takes place. Some development activities can also<br />
enhance historic and amenity values by protecting or improving those<br />
values.<br />
One of the challenges of effectively managing landscape, heritage and<br />
amenity values is that it is often hard to defi ne these values. There may<br />
also be a lack of information and awareness of important sites or values.<br />
For example, archaeological sites may show indistinct surface features not<br />
easily recognised by landowners or may not be visible under vegetation.<br />
Good information is necessary to defi ne sites, areas or values, and<br />
advice and assistance to landowners and owners of heritage buildings or<br />
structures are required to assist in the protection of these values.<br />
7.1 WHAT IS THE STATE OF<br />
NATURAL FEATURES AND<br />
<strong>LAND</strong>SCAPES?<br />
The term ‘landscape’ refers generally to a combination of traits that<br />
distinguish a particular area. These include landform (which refl ects<br />
topography, geology etc.), land cover (including vegetation and water<br />
bodies) and land use (such as farming). Spiritual and cultural associations<br />
that give added meaning to places are also components of landscape 1 .<br />
The protection of outstanding natural features and landscapes from<br />
inappropriate subdivision, use and development is a matter of national<br />
importance under the Resource Management Act. However, there is<br />
no universally accepted defi nition of outstanding natural features and<br />
landscapes. What is outstanding is a subjective judgement which<br />
depends on social and cultural perceptions. Landscape is an aspect<br />
of the environment that includes natural and physical features as<br />
well as social and cultural factors. Important criteria for assessing the<br />
signifi cance of natural features and landscapes include:<br />
• natural science factors such as geology and topography and<br />
ecological and dynamic components;<br />
• aesthetic values, including memorability and naturalness;<br />
• expressiveness – how obviously the landscape demonstrates the<br />
formative processes leading to it;<br />
• transient values such as the occasional presence of wildlife or its<br />
values at certain times of the day or year;<br />
• value to tangata whenua; and<br />
• historical associations 2 .<br />
Because landscape assessment involves subjective judgements, it is<br />
not possible to apply strictly quantitative measures to describe the<br />
current state or condition of natural features and landscapes in <strong>Taranaki</strong>.<br />
However, there are recognised techniques of assessment and evaluation<br />
used by landscape architects and other experts in the fi eld. We do know<br />
through various studies, public surveys and consultation processes that<br />
many natural features and landscapes in <strong>Taranaki</strong> are highly valued for<br />
their scenic, visual or aesthetic appeal or for their social, cultural and<br />
historical associations. We know that Mount <strong>Taranaki</strong> is a landscape<br />
of national and international signifi cance 3 and that many other features<br />
and landscapes maintain a quality and condition that make them of<br />
regional signifi cance.
District councils in <strong>Taranaki</strong> play a primary role in managing and<br />
protecting landscapes, historic heritage and amenity values.<br />
(A) SIGNIFICANT <strong>LAND</strong>SCAPES IN THE<br />
NEW PLYMOUTH DISTRICT<br />
Mount <strong>Taranaki</strong> and the Kaitake and Pou _ akai ranges within the Egmont<br />
National Park are identifi ed in the New Plymouth District Plan as<br />
outstanding landscapes within the district. The plan considers that these<br />
landscapes are not under threat from current activities although larger<br />
scale developments within the park could have adverse visual effects.<br />
The plan also identifi es the following regionally signifi cant landscapes:<br />
• Coastal terrace between Mohakatino and Whitecliffs;<br />
• Whitecliffs and associated conservation forest;<br />
• Sugar Loaf Islands and Parit _ ut _ u; and<br />
• eight river mouths: Mohakatino, Tongaporutu, Mimi, Urenui, _ Onaero,<br />
Waiongana, Tapuae and Stony (Hangatahua).<br />
The plan notes that while threats to these landscapes are low, there<br />
is the possibility of development activities, such as the construction of<br />
buildings, that would have high visual impacts on these landscapes.<br />
In 2006, the New Plymouth District <strong>Council</strong> undertook a review of<br />
changes in rural landscape character in the district since 1995 4 to<br />
contribute to an upcoming review of provisions in the district plan<br />
relating to the rural area. The review concluded that generally landscape<br />
qualities and values had not signifi cantly changed (Table 7.1). However,<br />
landscape values of the ring plain, particularly on the northern slopes of<br />
Mount <strong>Taranaki</strong> and the Pou _ akai and Kaitake Ranges had been affected<br />
to some degree by increased building density, and whilst this area had<br />
not lost all its rural character it was an area in transition from a purely<br />
rural area to something else.<br />
Mimi River mouth.<br />
4 LA4 Landscape Architects, 2006. Review of the New Plymouth District Landscape Assessment. Report to the New Plymouth District <strong>Council</strong>.<br />
Rob Tucker<br />
Table 7.1 Changes in rural landscape character in New Plymouth District since 1995 4 .<br />
Landscape unit Observed changes<br />
Mount <strong>Taranaki</strong> No noticeable change to landscape<br />
qualities or values<br />
Pou _ akai and Kaitake Ranges No noticeable changes<br />
Sugar Loaf Islands and Parit _ ut _ u No changes observed in the past<br />
11 years<br />
Coastal terraces and hills:<br />
Whitecliffs north to Mohakatino<br />
No signifi cant changes identifi ed<br />
Whitecliffs: cliffs and coastal hills No noticeable changes<br />
River mouths north of<br />
New Plymouth<br />
Very little change has occurred. In<br />
one or two places an additional<br />
bach has been added but<br />
otherwise these landscapes remain<br />
unchanged<br />
Eastern hill country–bush No noticeable changes except for<br />
some new landslips<br />
Eastern hill country–mixed uses Some new buildings have been<br />
introduced but have not adversely<br />
affected landscape qualities and<br />
values<br />
Frontal hill country and Waiiti<br />
coastal hills<br />
Some additional buildings on the<br />
slopes above the Mimi River mouth<br />
but pastoral farming activities<br />
prevail<br />
Ring plain Landscape change has occurred<br />
which has affected landscape<br />
character and values. New<br />
development and scattered<br />
buildings have occurred up to the<br />
bush line of Mount <strong>Taranaki</strong> and<br />
the northern slopes of the Pou _ akai<br />
and Kaitake Ranges. Building<br />
density has increased since<br />
1995 and is beginning to affect<br />
the area’s rural and landscape<br />
character. The area is showing<br />
signs of becoming a ‘threshold<br />
area’ - an area in transition from a<br />
rural character<br />
Waiiti coastal fl at Small amount of new development<br />
to the east of the Mimi River mouth<br />
around Urenui and at Waitoetoe<br />
and Waiiti Stream mouth<br />
Waitara coastal plain Retains a mixed use character<br />
– Motunui plant, settlements,<br />
railways, factories and airport as<br />
well as pasture, rivers and streams.<br />
Highly visible by residents and<br />
state highway traffi c<br />
State of the Environment Report 2009<br />
217
218<br />
<strong>LAND</strong>SCAPE, HERITAGE & AMENITY VALUES<br />
Mount <strong>Taranaki</strong> and rural landscape, Stratford District.<br />
(B) SIGNIFICANT <strong>LAND</strong>SCAPES IN THE<br />
STRATFORD DISTRICT<br />
Mount <strong>Taranaki</strong> and the Egmont National Park dominate the landscape<br />
in the Stratford District. The hill country in the eastern portion of the<br />
district also possesses signifi cant scenic natural features and landscape<br />
qualities. Scenic landscape qualities of particular signifi cance include<br />
views of Mount <strong>Taranaki</strong> from State Highway 3, Pembroke Road,<br />
Monmouth Road, Opunake Road and Manaia Road north of Opunake<br />
Road and the views of both the mountain and the hill country from<br />
Sangsters Hill and from the Strathmore, Pohokura, Whangamomona and<br />
T _ ahora Saddles along State Highway 43.<br />
There have been some developments along State Highway 3 in the past<br />
fi ve years but these have not had signifi cant adverse effects overall on<br />
landscape qualities.<br />
(C) SIGNIFICANT <strong>LAND</strong>SCAPES IN THE<br />
SOUTH TARANAKI DISTRICT<br />
Mount <strong>Taranaki</strong> is visible from many parts of the South <strong>Taranaki</strong> District<br />
and so, not surprisingly is regarded as a signifi cant landscape feature.<br />
Other key landscape features in the district include:<br />
Mount <strong>Taranaki</strong> and lahar mounds, coastal South <strong>Taranaki</strong>.<br />
5 Hastings, A and N. Newman, 2008. <strong>Taranaki</strong> Community Survey. Report to the Future <strong>Taranaki</strong> Facilitation Group by the Nielsen Company.<br />
6 <strong>Taranaki</strong> <strong>Regional</strong> <strong>Council</strong>, 2003. <strong>Taranaki</strong>-Our Place, Our Future. Report on the State of the <strong>Taranaki</strong> Environment - 2003<br />
TARANAKI – WHERE WE STAND<br />
Rob Tucker<br />
• the Egmont National park noted for its signifi cant indigenous forest<br />
and associated habitat;<br />
• the volcanic ring plain surrounding the mountain including the<br />
distinctive lahar mounds in the northern part of the district;<br />
• the coastal strip which runs the entire length of the western and<br />
southern boundaries of the district and includes dunelands and<br />
uplifted marine terraces;<br />
• the rivers fl owing from the mountain in a distinctive radial pattern;<br />
and<br />
• the rugged eastern hill country comprising strongly rolling to steeply<br />
dissected hills.<br />
These natural features and landscapes contribute to the high quality of<br />
the environment in the South <strong>Taranaki</strong> District and feature prominently in<br />
what residents like most about living in South <strong>Taranaki</strong> 5 .<br />
The South <strong>Taranaki</strong> District <strong>Council</strong> is to undertake a landscape<br />
assessment of the district to enable it to protect and enhance<br />
outstanding landscapes from the adverse environmental effects of<br />
activities in the future.<br />
7.2 WHAT IS THE STATE OF<br />
HISTORIC HERITAGE?<br />
The protection of historic heritage from inappropriate subdivision, use<br />
and development is a matter of national importance under the Resource<br />
Management Act. The relationship of M _ aori and their culture and<br />
traditions with their ancestral lands, water, sites, w _ ahi tapu and other<br />
taonga is also a matter of national importance that must be recognised<br />
and provided for.<br />
A total of 1,345 heritage buildings, structures or items have been<br />
identifi ed by the three district councils (Table 7.2), a reduction from the<br />
1,405 sites identifi ed in the 2003 State of the Environment Report 6 .<br />
Heritage buildings include houses, churches, towers, memorials and<br />
commercial buildings. Historic heritage items identifi ed include a wide<br />
range of elements important to the district’s historic heritage and which<br />
may be architectural, cultural, historic, scientifi c or technological in nature.<br />
Rob Tucker
Manaia Memorial Band Rotunda and old Post Offi ce building, South <strong>Taranaki</strong> District.<br />
Heritage buildings, structures or items are not limited to those listed<br />
on the New Zealand Historic Places Trust Register. Of all the identifi ed<br />
heritage sites in <strong>Taranaki</strong> only 150 are listed on this register. This is<br />
because the New Zealand Historic Places Trust targets heritage at<br />
a national level and has limited funds to maintain the register and<br />
to purchase heritage items. A total of 193 historic heritage sites are<br />
protected by the three district councils through their district plans.<br />
Archaeological sites are historical sites that pre-date 1900. They<br />
include sites from early M _ aori settlement such as middens, pits, ovens,<br />
horticultural sites, defensive p _ a sites and burial grounds as well as<br />
sites from early European settlement such as fl our milling, historic<br />
settlements and shipwrecks.<br />
The New Zealand Archaeological Association Site Recording Scheme<br />
was established in 1957 and is an important database of information<br />
for planning and legal decision-making. A total of 1,774 archaeological<br />
sites are now identifi ed in <strong>Taranaki</strong> on this database (Table 7.3), an<br />
Table 7.2 Number of historic heritage and archaeological sites in <strong>Taranaki</strong>.<br />
7 Greig, K, 2006. NZAA Site Recording Scheme Upgrade Project. New Plymouth District <strong>Council</strong> Stage 4 Final Report.<br />
increase from the number recorded in the 2003 State of the Environment<br />
Report which identifi ed 1,651 sites. This increase has come about due<br />
to an increasing amount of archaeological work being undertaken for<br />
resource management purposes and also from a project to update the<br />
data undertaken by the New Zealand Archaeological Association in<br />
conjunction with the three district councils, the <strong>Taranaki</strong> <strong>Regional</strong> <strong>Council</strong>,<br />
iwi, h _ apu and landowners 7 . Sites discovered through roadworks or other<br />
excavations will continue to be added to the database which can never<br />
claim to be a complete list of all archaeological sites within the region.<br />
The greatest number of archaeological sites occur in the South <strong>Taranaki</strong><br />
District (Table 7.3), with 920 sites and in the New Plymouth District<br />
(727 sites). The most common type of archaeological site in <strong>Taranaki</strong> is<br />
defensive p _ a (745 sites) and pits or terraces (461 sites).<br />
District Historic heritage buildings, structures or items Archaeological sites<br />
Number identifi ed 1 Listed in district<br />
plans<br />
Listed in NZHPT<br />
Register 2<br />
Number identifi ed 3 Listed in district<br />
plans<br />
New Plymouth 805 80 75 727 694<br />
Stratford 284 30 11 127 127<br />
South <strong>Taranaki</strong> 256 83 64 920 *<br />
Totals 1,345 193 150 1,774 821*<br />
1 By district councils<br />
2 Includes historic places, historic areas, wahi tapu and wahi tapu areas<br />
3 By the New Zealand Archaeological Association in its Site Recording Scheme<br />
* None currently listed in South <strong>Taranaki</strong> District Plan<br />
<strong>Taranaki</strong> <strong>Regional</strong> <strong>Council</strong><br />
Archaeological excavation of Elizabeth Jury’s farmhouse at _ Omata near the site of<br />
the Battle of Waireka during the fi rst Land Wars in March, 1860.<br />
Rob Tucker<br />
State of the Environment Report 2009<br />
219
220<br />
<strong>LAND</strong>SCAPE, HERITAGE & AMENITY VALUES<br />
Table 7.3 Types of archaeological sites in each district area.<br />
Site type New Plymouth District Stratford District South <strong>Taranaki</strong> District Total<br />
Agricultural/Pastoral 3 2 5<br />
Art 3 7 10<br />
Artefact fi nd 10 22 17 49<br />
Botanical evidence 1 2 1 4<br />
Burial/cemetery 9 1 7 17<br />
Cave/rock shelter 1 1 2<br />
Defensive – military<br />
Defensive – p<br />
58 28 86<br />
_ a<br />
Defensive – Island/swamp p<br />
405 17 323 745<br />
_ a 4 4<br />
Fishing 2 2<br />
Flax milling 5 5<br />
Flour milling 7 11 18<br />
Forestry 1 1<br />
Gold mining 1 1<br />
Historic – domestic 16 1 17<br />
Historic – settlement/township 1 6 8 15<br />
Industrial (unspecifi ed)<br />
M<br />
5 1 6<br />
_ aori horticulture 10 60 70<br />
Marae 1 3 4<br />
Midden/oven 51 53 59 163<br />
Mission station 1 1<br />
Pit/terrace 86 8 367 461<br />
Shipwreck 9 3 12<br />
Source site 4 1 5<br />
Traditional site 5 5<br />
Transport/communication 5 1 6<br />
Unclassifi ed 38 38<br />
Whaling station 1 1<br />
Working area 1 17 3 21<br />
Total 727 127 920 1774<br />
(A) HISTORIC FEATURES OF THE<br />
NEW PLYMOUTH DISTRICT<br />
Heritage sites within the New Plymouth District include those from early<br />
European settlement, the 1860s land wars and the dairy and energy<br />
industries. Heritage sites are categorised into 3 categories A, B and<br />
C – with A being the ‘best of the best’ and afforded protection under the<br />
New Plymouth District Plan.<br />
Eighty Category A sites are recognised in the district plan, an increase from<br />
the 68 recorded in 2003. These sites include early colonial houses and<br />
commercial buildings, the Bertrand Road Suspension Bridge, Inglewood<br />
Railway Station and Town Hall and St Mary’s Church and grounds.<br />
A total of 75 sites in the New Plymouth District are registered by the<br />
New Zealand Historic Places Trust (up from 66 such registrations in<br />
2003) with 10 buildings including St Mary’s Pro Cathedral and grounds,<br />
8 A Category 1 historic place is the highest classifi cation given to historic places in New Zealand by the New Zealand Historic Places Trust<br />
TARANAKI – WHERE WE STAND<br />
The historic wooden Bertrand Road Bridge over the Waitara River.<br />
Hurworth cottage, Pridham Hall at New Plymouth Boys’ High School,<br />
and the Gables, registered as Category 1 historic places 8 .<br />
<strong>Taranaki</strong> <strong>Regional</strong> <strong>Council</strong>
Apart from its 80 Category A heritage buildings and items, the New<br />
Plymouth District <strong>Council</strong> has identifi ed 621 Category B heritage<br />
buildings and items and 104 Category C buildings and items. Category<br />
B and C buildings and items are not regulated under the district plan.<br />
The New Plymouth District <strong>Council</strong> has advised that 30 Category B and<br />
8 Category C heritage buildings and items have been destroyed since<br />
November 1998 but that no Category A heritage buildings or sites have<br />
been demolished over this period.<br />
When the New Zealand Archaeological Association upgraded its site<br />
recording scheme in the New Plymouth District in 2006 it was noted<br />
that the condition of the sites visited was variable9 . Most recorded<br />
sites in the district are located in rural areas, with the land used<br />
St Mary’s stone church and churchyard, New Plymouth.<br />
HI-TECH MEETS HERITAGE<br />
Hi-tech has met heritage in central New Plymouth as part of efforts to<br />
protect and enhance New Zealand’s oldest stone church.<br />
Ground-penetrating radar has been used to search for unmarked<br />
graves in the grounds of the 162-year-old St Mary’s Pro Cathedral,<br />
which has a Category 1 Historic Places Trust listing and Category A<br />
heritage status in the New Plymouth District Plan.<br />
St Mary’s remains the focal point for New Plymouth’s Anglican<br />
congregation today as it has been since the 1840s, when it was built<br />
Malone Memorial Gate, King Edward Park, Stratford.<br />
(B) HISTORIC FEATURES OF<br />
STRATFORD DISTRICT<br />
Key features of historic heritage values in the Stratford District relate<br />
to early attempts at coal mining and farming, war memorials and<br />
community or commercial buildings. These sites include the Douglas<br />
9 Greig, K, 2006. NZAA Site Recording Scheme Upgrade Project. New Plymouth District <strong>Council</strong> Stage 4 Final Report.<br />
10 Grieg, K and Molloy, N, 2005. NZAA Site Recording Scheme Upgrade Project. Stratford District <strong>Council</strong> District Summary.<br />
Rob Tucker<br />
Rob Tucker<br />
mainly for grazing. Although many of the rural sites remained relatively<br />
unchanged except for slow natural infi lling, a signifi cant number had<br />
been damaged, predominantly by bulldozing for farm tracks or had<br />
surface features smoothed to varying degrees by repeated cultivation.<br />
In extreme cases, sites had been destroyed by bulldozing as part of<br />
farming activities or by earthworks for building platforms, roads and<br />
quarries.<br />
It was also noted that sites along the coast were subject to ongoing<br />
coastal erosion and that residential subdivision in coastal areas is an<br />
increasing threat to site survival. Other works in coastal areas such as<br />
erosion management and escarpment enhancement can also affect<br />
archaeological sites.<br />
on land acquired by Bishop Selwyn and subsequently overseen for<br />
decades by the Rev. Henry Govett. Features of the church and its<br />
grounds are tombstones and memorials refl ecting the turbulent times<br />
of the Land Wars.<br />
Although St Mary’s has been considerably enlarged and modifi ed over<br />
the years, the various sections blend into a harmonious whole in the<br />
Gothic Revival style.<br />
Protecting and enhancing its heritage value have been high on<br />
civic and ecclesiastical agendas this decade, especially since the<br />
preparation of a conservation plan that, according to Vicar David<br />
Hollingsworth, is “an inch thick”.<br />
The church has already been granted nearly $25,000 in New Plymouth<br />
District <strong>Council</strong> heritage funding to cover the ground-penetrating radar<br />
survey, repair of gravestones and repair of the front wall and railings.<br />
Its heritage protection in the district plan has also been extended from<br />
the exterior to interior features that pre-date World War I. This gives<br />
the <strong>Council</strong> the ability to ensure any alterations are consistent with<br />
the building’s historic status.<br />
The Rev. Hollingsworth said that implementing the conservation<br />
plan was a long-term project but one being tackled with enthusiasm,<br />
especially as St Mary’s moves towards full cathedral status in 2009.<br />
brickworks downdraught kiln (which has a New Zealand Historic Places<br />
Trust Category I registration), the Municipal Chambers (including the Hall<br />
of Remembrance) and Kings Theatre in Stratford and memorial gates<br />
at Victoria and King Edward Parks. Since 2005, seven sites have been<br />
added to the list of known heritage resources of signifi cance identifi ed<br />
for protection in the Stratford District Plan. The total number of identifi ed<br />
sites has not changed since 2003.<br />
Most recorded archaeological sites in the Stratford District are in rural<br />
areas on land used for grazing or forestry or within areas of regenerating<br />
native bush. The condition of sites visited in 2005 as part of the New<br />
Zealand Archaeological Association Site Recording Scheme upgrade<br />
was noted as variable with most suffering from stock damage and<br />
erosion to some degree 10 .<br />
The Stratford District has very few recorded archaeological sites that<br />
relate to European settlement, but it is highly likely that sites from this<br />
period (for example the remains of extractive industries and early farm<br />
settlements) still exist 10 .<br />
State of the Environment Report 2009<br />
221
222<br />
<strong>LAND</strong>SCAPE, HERITAGE & AMENITY VALUES<br />
The refurbished St Peter’s Church, P _ urangi.<br />
ENDURING LINK WITH TIMES PAST<br />
It’s high-profi le urban locations that generally make the heritage<br />
headlines but a lot of quiet work also takes place to protect and<br />
enhance the historic value of sites out in the backblocks.<br />
One example is at P _ urangi in <strong>Taranaki</strong>’s east, closer to<br />
Whangamomona than to Stratford as the crow fl ies.<br />
On a hill overlooking the village is 102-year-old St Peter’s Church,<br />
steeped in history beyond its years and listed in the Stratford District<br />
Plan as a signifi cant heritage building.<br />
St Peter’s was built to replace a church established in nearby<br />
Pukamahoe by M _ aori missioner the Rev. Henry Govett in the 1850s.<br />
(C) HISTORIC FEATURES IN THE<br />
SOUTH TARANAKI DISTRICT<br />
A range of heritage sites can be found throughout South <strong>Taranaki</strong>, with<br />
many dating from early European settlement. The South <strong>Taranaki</strong> District<br />
Plan identifi es 83 heritage items for protection, up from 78 in 2003. The<br />
number of heritage items identifi ed in heritage schedules held by the<br />
South <strong>Taranaki</strong> District <strong>Council</strong> totals 256 (258 in 2003).<br />
Heritage items in the South <strong>Taranaki</strong> District include private dwellings,<br />
banks, town halls, churches, courthouses, the Cape Egmont lighthouse,<br />
the World War I Memorial Band Rotunda in Manaia and the old library<br />
in Kaponga. Three buildings have a New Zealand Historic Places Trust<br />
Turuturu Mokai near H _ awera was the site of a group of three p _ a.<br />
11 Molloy, N, and Grieg, K, 2007. NZAA Site Recordi pgrade Project. South <strong>Taranaki</strong> District <strong>Council</strong> Stage 4 Final Report.<br />
TARANAKI – WHERE WE STAND<br />
Rob Tucker<br />
Rob Tucker<br />
This had fallen into disuse during the land wars and was destroyed in<br />
a bushfi re in the 1890s.<br />
The original church’s bell, however, hangs outside the front door of<br />
St Peter’s, whose altar cross is made from the old Pukamahoe centre<br />
pole.<br />
St Peter’s was well looked after by its parishioners over the decades.<br />
That parish, however, has now dwindled so resourcing for the latest<br />
maintenance work had to come from further afi eld.<br />
The work involved lifting and repiling the church, replacing rotten<br />
weatherboards and painting the exterior. The entry porch decking and<br />
steps were also replaced.<br />
Hawera architect Clive Cullen – no stranger to heritage projects –<br />
drew up the plans and Stratford District <strong>Council</strong> expedited the consent<br />
process, satisfying itself that the outcome would be in keeping with<br />
the building’s historic status.<br />
The project’s cost of $21,000 was funded largely by a <strong>Taranaki</strong><br />
Electricity Trust grant of $20,000 and donations from the families of<br />
former settlers and others.<br />
The church is in the Stratford Anglican parish, which is responsible for<br />
its upkeep. Ian and Laurel Aitken whose farm surrounds the site, are<br />
unoffi cial custodians and keep an eye on it for the parish.<br />
All these efforts have ensured an enduring future for a material link<br />
with a sometimes turbulent past.<br />
Category 1 registration - the H _ awera Water Tower, St George’s Anglican<br />
Church in P _ atea and the Waverley Railway Station.<br />
The South <strong>Taranaki</strong> District contains more than half of all archaeological<br />
sites identifi ed in <strong>Taranaki</strong> on the New Zealand Archaeological<br />
Association’s site recording scheme, with defensive p _ a and pits and<br />
terraces making up 75% of all sites (Table 7.3). The majority of sites<br />
are located on private land. The condition of those sites visited in late<br />
2005 and 2006 as part of the New Zealand Archaeological Association’s<br />
upgrade project was noted as variable 11 . While a number of p _ a sites<br />
checked during the project exhibited robust features, many had suffered<br />
some degree of damage from bulldozing for farm tracks. There were also<br />
cases where p _ a had been quarried for gravel or levelled to make way for<br />
more productive grazing areas. A number of storage or borrow pits had<br />
been infi lled or ‘smoothed’ to varying degrees by repeated cultivation.<br />
Erosion is a signifi cant threat to archaeological sites in South <strong>Taranaki</strong>.<br />
During the upgrade project, long-time residents indicated that up to<br />
50 m of land had been lost from coastal margins over the past 20<br />
years 11 . A number of coastal p _ a are subsequently showing signs of<br />
damage or have completely eroded away. Ridge sites in the district are<br />
also vulnerable as a result of slips or slumps caused by extreme<br />
weather conditions.<br />
Flooding in recent years, particularly around Wait _ otara, has impacted on<br />
sites in low-lying areas.
H _ awera water tower.<br />
TOWER POWER<br />
HAS H – AWERA<br />
STANDING TALL<br />
The people have voted with their feet:<br />
Refurbishing the H _ awera Water Tower<br />
was a fi ne idea.<br />
The tower was reinforced, re-clad and reopened<br />
to the public in 2004 and by August<br />
7.3 WHAT IS<br />
THE STATE OF<br />
TARANAKI’S<br />
AMENITY VALUES?<br />
Amenity values are those natural and physical<br />
qualities and characteristics that contribute<br />
to people’s appreciation and enjoyment of the<br />
environment.<br />
<strong>Taranaki</strong> residents and visitors enjoy very<br />
high levels of amenity values. Amenity values<br />
are characterised by the region’s pleasant<br />
environment and the relative absence of noise,<br />
odours and dust. With well maintained and<br />
accessible parks and reserves, walkways,<br />
outstanding landscape features and community<br />
and recreational facilities, the region has an<br />
uncluttered rural feel.<br />
People have different ideas about what<br />
constitutes a pleasant and enjoyable<br />
environment. This variation makes the<br />
management of amenity values challenging.<br />
South <strong>Taranaki</strong> District <strong>Council</strong><br />
2008 there had been nearly 20,500 visits by<br />
people keen to have a look.<br />
The tower had been closed in 2000 because<br />
of safety concerns over falling concrete.<br />
The South <strong>Taranaki</strong> District <strong>Council</strong><br />
commissioned a conservation plan and<br />
refurbishment began in March 2004.<br />
Some 3,000 townsfolk turned out to<br />
celebrate its reopening in October 2004, an<br />
occasion that culminated in a spectacular<br />
laser light show.<br />
The $1.1 million refurbishment project was<br />
funded by the South <strong>Taranaki</strong> District <strong>Council</strong><br />
with support from the TSB Community<br />
Trust ($263,000), the Lottery Grants Board<br />
($250,000) and Telecom and Vodafone<br />
($100,000 each).<br />
The tower has Historic Places Trust Category<br />
I rating. It has national historic importance<br />
for the technical skill in design and<br />
construction, for both the way the structure<br />
is exposed with columns, brackets and tank<br />
readily visible, and the raw, off-the-boxing<br />
concrete.<br />
Construction started in 1912 with the<br />
aim of improving water supply after two<br />
A survey of <strong>Taranaki</strong> residents carried out in<br />
July 2008 provided useful information about<br />
amenity values by asking what residents liked<br />
and disliked most about where they lived 12 .<br />
(Table 7.4).<br />
When asked what they liked most about the<br />
area they live in, New Plymouth residents cited<br />
the close proximity to sea and beaches (32%).<br />
A quiet, secluded black sand beach.<br />
12 Hastings, A, and Newman, N 2008. <strong>Taranaki</strong> Community Survey 2008. Report to the Future <strong>Taranaki</strong> Facilitation Group by the Nielsen Company.<br />
devastating fi res in H _ awera. Ironically, the<br />
advent of the Inaha water scheme meant<br />
the tower was never used for the purpose<br />
intended.<br />
But it’s become an enduring landmark for the<br />
district, surviving a number of calls for its<br />
demolition. After the 2004 project its future<br />
seems secure.<br />
Among those happy about that is Miranda<br />
Cullen, who has lived within the shadow<br />
of the tower for most of her life. “It’s an<br />
important link with those who’ve gone<br />
before us,” she said. That’s particularly<br />
important for Miranda, whose father Dr.<br />
Alastair Buist was a noted South <strong>Taranaki</strong><br />
historian.<br />
Like many in South <strong>Taranaki</strong>, she sees the<br />
tower as part of her identity.<br />
It’s also looking to be a signifi cant visitor<br />
attraction. Of those 20,500 visits to the<br />
end of July 2008, nearly 3,000 were by<br />
overseas people and the rest were evenly<br />
split between locals and those from other<br />
parts of New Zealand. Never underestimate<br />
tower power.<br />
In comparison, Stratford and South <strong>Taranaki</strong><br />
residents like the quiet, peaceful and relaxing<br />
environment, and the fact that they do not<br />
live in an overcrowded area (27% and 28%<br />
respectively). For all districts, the proximity<br />
to Mount <strong>Taranaki</strong> was one of the top three<br />
aspects residents liked most about the area<br />
they live in.<br />
Rob Tucker<br />
State of the Environment Report 2009<br />
223
224<br />
<strong>LAND</strong>SCAPE, HERITAGE & AMENITY VALUES<br />
Table 7.4: What people like or dislike most about where they live 13<br />
What people like most about the area they live in What people dislike about the area they live in<br />
• Close to sea/beaches<br />
• Quiet/peaceful/relaxing/not overcrowded<br />
• Close to mountain<br />
• Friendly/helpful people/know everybody<br />
• Close to town /city<br />
• Nice place to live/good area/like <strong>Taranaki</strong><br />
• Weather/climate/good summers<br />
• Size of community (small, not too large)<br />
• Always lived here/born here/lived here a long time<br />
• Everything we need is here/have all facilities/amenities/services<br />
• Friends and family are here<br />
On a positive note, around a third of residents in each district said there<br />
was nothing they disliked about the area they live in. Aside from the<br />
weather and climate, the most disliked aspect in New Plymouth District<br />
is traffi c issues and the state of roads and footpaths (8% dislike these<br />
aspects the most). The shopping environment (lack of shops and/or late<br />
closing hours) is the most disliked aspect of the Stratford and South<br />
<strong>Taranaki</strong> districts (8% and 10% respectively).<br />
A survey of the recreational use of the coast, rivers and lakes in <strong>Taranaki</strong><br />
carried out by the <strong>Council</strong> in the summer of 2007-08 showed that 90%<br />
of respondents had visited a beach, river or lake in the preceding 12<br />
months 14 . Common activities undertaken were walking, swimming,<br />
relaxing, scenic appreciation and picnicking. The main reasons for<br />
visiting these areas (after ‘close to home’) was the natural character<br />
of the area, the peace and quiet and suitability of the site for specifi c<br />
activities such as surfi ng.<br />
(A) AMENITY VALUES OF THE<br />
NEW PLYMOUTH DISTRICT<br />
The New Plymouth District Plan mentions a number of potential adverse<br />
effects on amenity values that it aims to avoid, remedy or mitigate.<br />
These include light overspill and glare, noise, dust, traffi c effects and<br />
anti-social effects associated with liquor.<br />
Table 7.5 Levels of public satisfaction with New Plymouth District <strong>Council</strong> services and facilities.<br />
Service or facility<br />
13 Hastings, A, and Newman, N, 2008. <strong>Taranaki</strong> Community Survey 2008. Report to the Future <strong>Taranaki</strong> Facilitation Group by the Nielsen Company.<br />
14 <strong>Taranaki</strong> <strong>Regional</strong> <strong>Council</strong>, 2008. Recreational use of Coast, Rivers and Lakes in <strong>Taranaki</strong>, 2007-08.<br />
TARANAKI – WHERE WE STAND<br />
• Nothing (over 30% of respondents)<br />
• Weather/climate<br />
• Traffi c issues (congestion, heavy transport, speeding, boy racers)<br />
• Roads/footpaths (poor condition, potholes)/road access<br />
• Concerns with council (unnecessary spending, poor decisions, infi ghting,<br />
lack of consultation)<br />
• Isolated/distance to travel to other places.<br />
Pukekura Park and Poet’s Bridge.<br />
The community has identifi ed the spacious, low-density character of<br />
rural areas, pleasant urban environments, the natural character of the<br />
coastal environment, vegetation and trees, landscapes (mountain,<br />
sea and bush) parks, reserves, walkways and other open spaces and<br />
recreational areas, traffi c and pedestrian issues and public views as<br />
being important amenity values within the New Plymouth District.<br />
The total number of trees recorded in the New Plymouth District Plan<br />
as ‘notable trees’ for protection exceeds 1,800. Many of these trees are<br />
% satisfi ed % not very<br />
satisfi ed<br />
The ability to drive around the district quickly, easily and safely 78 19 3<br />
The quality and safety of footpaths 78 18 4<br />
The quality of parks and reserves including the Coastal Walkway and Pukekura Park 93 5 2<br />
The quality of sportsgrounds and playgrounds 90 2 8<br />
The quality of the New Plymouth living environment is being maintained 87 9 4<br />
The quality of entertainment, cultural and sporting events in the district and the venues they are held in 94 2 4<br />
The maintenance and presentation of urban landscapes and streets 92 7 1<br />
% don’t<br />
know<br />
Rob Tucker
good examples of their type, have visual or landscape value or heritage<br />
or botanical values that add to the amenity values of the district.<br />
A survey of residents of the New Plymouth District carried out in<br />
2008 15 showed high levels of satisfaction with facilities or amenities as<br />
shown in Table 7.5.<br />
VISTAS COME WITH<br />
HISTORY ATTACHED<br />
A major refurbishment at a historic <strong>Taranaki</strong> property has extended its<br />
appeal beyond the attractive gardens and beautiful vistas it has long<br />
been known for.<br />
T _ upare, on Mangorei Road at New Plymouth’s outskirts, now offers<br />
an authentic taste of life in the mid 20th Century heyday of the two<br />
prominent and strong-willed men who shaped the property’s original<br />
development.<br />
James Chapman-Taylor, the renowned ‘arts and crafts’ architect,<br />
designed T _ upare’s stylish house for businessman Sir Russell<br />
Matthews in 1932. Unusually for the architect, though, he<br />
relinquished control of its construction to Matthews, who had fi rm<br />
ideas about what he wanted.<br />
The result was a unique stately home with the unmistakeable<br />
Chapman-Taylor stamp but also refl ecting the dreams and aspirations<br />
of the innovative Matthews, whose accomplishments included laying<br />
the fi rst bitumen road in New Zealand.<br />
Changes crept in over the ensuing years and now the property is<br />
owned and administered by the <strong>Taranaki</strong> <strong>Regional</strong> <strong>Council</strong>, which<br />
launched a renovation project in 2007 as it implemented a new<br />
management plan.<br />
“We’ve taken out some of the later infl uences that have impacted<br />
on the house over the years,” said the <strong>Council</strong>’s <strong>Regional</strong> Gardens<br />
Manager, Greg Rine.<br />
“Visitors can now get an authentic insight into the work of James<br />
Chapman-Taylor, the vision of Sir Russell Matthews, and the lifestyles<br />
of their era. It really cements T _ upare as a cultural and historical<br />
attraction.<br />
“Experiencing what life was like for the Matthews family back in the<br />
1950s certainly adds depth and character to the functions that the<br />
house is hired for.”<br />
The work on the house was part of a wider project at T _ upare, which<br />
also included major restoration work on the hillside property’s<br />
landscaped garden containing majestic trees, a water feature and<br />
extensive plantings in different settings.<br />
The cottage is now the interpretation centre for the property and a<br />
gathering point for garden workshops.<br />
The project also included a new car park and gatehouse, new paths<br />
and lookouts and a new glasshouse.<br />
In 2008, New Plymouth was judged the country’s top town by North<br />
and South magazine, and the best place to ‘live, love, work and raise<br />
a family 16 . New Plymouth went on to win the ‘best and most liveable<br />
community in the world (population 20,001-75,000) at the 2008<br />
International Awards for Liveable Communities. Awards were also won<br />
for the coastal walkway, and community sustainability 17 .<br />
Visitors explore the splendour of the gardens.<br />
The fi sh pond is an original feature of T _ upare.<br />
T _ upare has been restored to the original Matthews’ style.<br />
15 National Research Bureau Ltd, 2008. Communitrak Survey: Public Perceptions and Interpretations of <strong>Council</strong> Services and Representation. Report to the New Plymouth District <strong>Council</strong><br />
16 North and South, October 2008, ACP Magazines<br />
17 New Plymouth District <strong>Council</strong> website: www.newplymouthnz.com<br />
Rob Tucker<br />
Rob Tucker<br />
Rob Tucker<br />
State of the Environment Report 2009<br />
225
226<br />
<strong>LAND</strong>SCAPE, HERITAGE & AMENITY VALUES<br />
(B) AMENITY VALUES OF THE<br />
STRATFORD DISTRICT<br />
The Stratford District Plan identifi es a number of important amenity<br />
values in the district. The residential areas within the district have a<br />
high standard of amenity in relation to such things as spaciousness and<br />
access to daylight and sunlight, private outdoor space and off-street<br />
parking. The low-density development and ‘country feel’ of rural areas is<br />
an important aspect of existing rural amenity. Rural/residential areas are<br />
also characterised by a low density of development which contributes to<br />
a generally open landscape and an important buffer between residential<br />
and rural areas.<br />
Within the commercial centre, the visual and physical linkages created<br />
by the pedestrian areas are important amenity features of Stratford.<br />
The Stratford District <strong>Council</strong> has identifi ed 223 notable trees for<br />
protection under the Stratford District Plan. They have signifi cant historic<br />
value or are particularly good, unusual or rare examples of their type in<br />
the district. Such trees contribute to the overall amenity values of the<br />
district.<br />
Lake Rotokare, South <strong>Taranaki</strong> District.<br />
(C) AMENITY VALUES OF THE SOUTH<br />
TARANAKI DISTRICT<br />
The South <strong>Taranaki</strong> District <strong>Council</strong> District Plan notes that the<br />
community places considerable value on the character and quality of<br />
the residential and recreational environments in the district. Reserves<br />
are seen as important for the enhancement of amenity values, and<br />
protection of natural values, ecology, landscapes and the margins of<br />
lakes and rivers. Other important amenity issues in the district are the<br />
control of the adverse effects of signs and the control of noise emissions<br />
and industrial development both of which refl ect the amenity values of<br />
surrounding environments.<br />
Seventy one notable trees are identifi ed for protection under the South<br />
<strong>Taranaki</strong> District Plan. Equal numbers of native and introduced species<br />
are identifi ed, selected for protection on the basis of their condition<br />
(health), amenity (community benefi t) and notability (distinction).<br />
A survey of residents of the South <strong>Taranaki</strong> District carried out in 2007<br />
showed that 85% of residents were satisfi ed with the district’s parks<br />
and reserves, 81% were satisfi ed with local roads and 67% were<br />
satisfi ed with footpaths in the district 18 .<br />
18 National Research Bureau, 2007. Communitrak Survey: Public Perceptions and Interpretations of <strong>Council</strong> Services and Representation. Report to the South <strong>Taranaki</strong> District <strong>Council</strong>.<br />
TARANAKI – WHERE WE STAND<br />
Rob Tucker<br />
7.4 HOW ARE <strong>LAND</strong>SCAPE,<br />
HERITAGE AND AMENITY VALUES<br />
MANAGED IN TARANAKI?<br />
(A) REGIONAL POLICIES AND PLANS<br />
The <strong>Regional</strong> Policy Statement for <strong>Taranaki</strong> contains objectives, policies<br />
and methods relating to the management of landscape, historic<br />
heritage and amenity values. The objective in relation to landscape is to<br />
“protect the outstanding and regionally signifi cant natural features and<br />
landscapes of <strong>Taranaki</strong>” and identifi es some of these important areas.<br />
The Policy Statement also has as objectives to maintain and enhance<br />
the amenity values of the <strong>Taranaki</strong> environment and to protect the<br />
heritage values of the region. The <strong>Council</strong>’s regional plans and resource<br />
consent processes also recognise and provide for landscape protection<br />
and for protection of heritage and amenity values in relation to the<br />
<strong>Council</strong>’s functions and responsibilities.<br />
The <strong>Council</strong>’s <strong>Regional</strong> Fresh Water Plan, <strong>Regional</strong> Coastal Plan and<br />
<strong>Regional</strong> Air Quality Plan all provide for the protection of outstanding<br />
natural features and landscapes and heritages and amenity values.<br />
(B) DISTRICT POLICIES AND PLANS<br />
The New Plymouth, Stratford and South <strong>Taranaki</strong> district councils are<br />
responsible for managing land use. They therefore play an important<br />
role in the protection of <strong>Taranaki</strong>’s natural features and its landscape,<br />
heritage and amenity values through provisions in district plans and<br />
related land use and subdivision consents. The district councils also<br />
provide information and are engaged in environmental education<br />
initiatives to raise awareness of these issues.<br />
New Plymouth District <strong>Council</strong><br />
The New Plymouth District Plan identifi es and lists outstanding and<br />
regionally signifi cant landscapes in the district, heritage buildings and<br />
items (Category A), w _ ahi tapu and archaeological sites and notable<br />
trees. The plan provides criteria for or explanation of their selection<br />
and contains rules relating to structures, earthworks, outdoor storage<br />
of materials, vegetation and subdivision of land to provide for the<br />
protection of landscape, historic heritage and amenity values.<br />
Bowl of Brooklands, New Plymouth, a spectacular outdoor venue.<br />
Rob Tucker
The ‘low density’ character of the region is an important amenity value.<br />
The New Plymouth District <strong>Council</strong> has<br />
established a heritage inventory and a heritage<br />
fund to provide fi nancial assistance for the<br />
protection and maintenance of heritage<br />
buildings and items and notable trees. Between<br />
1996-97 and 2006-07 the New Plymouth<br />
District <strong>Council</strong> approved 62 applications and<br />
more than $430,000 in expenditure from the<br />
Heritage Protection Fund for work on buildings<br />
and other heritage items. This has included<br />
funding for maintenance work on St Mary’s<br />
Pro Cathedral (see case study), the Combined<br />
<strong>Taranaki</strong> Club and the Bertrand Road Bridge.<br />
In addition, between 2003 and 2007, the New<br />
Plymouth District <strong>Council</strong> issued building<br />
consents valued at more than $4 million for<br />
private landowners to undertake maintenance<br />
or upgrade work on historic buildings.<br />
The New Plymouth District <strong>Council</strong> will also<br />
consider rates relief for protection initiatives.<br />
Other non-statutory provisions include<br />
education, provision of information and advice,<br />
and advocacy.<br />
In relation to broad amenity values, the New<br />
Plymouth District <strong>Council</strong> has identifi ed areas<br />
(e.g. industrial, open space environment areas)<br />
within their district plan and established<br />
standards for each area specifying requirements<br />
in relation to building height and coverage,<br />
light and noise, signage, landscaping, hours of<br />
operation, traffi c generation and parking.<br />
A coastal policy area has been defi ned to<br />
protect the natural character and amenity<br />
values of the coast.<br />
Stratford District <strong>Council</strong><br />
Rob Tucker<br />
The Stratford District <strong>Council</strong> District Plan<br />
seeks to control adverse effects on landscape,<br />
heritage and amenity values through rules and<br />
standards, and conditions on resource consents<br />
relating to structures, excavation, fi lling<br />
planting, noise, lighting and glare, vegetation<br />
clearance close to important heritage sites,<br />
and subdivision.<br />
Other methods include a heritage fund to<br />
provide assistance for heritage protection,<br />
requiring fi nancial contributions in the form of<br />
land for reserves, walkways, play areas and<br />
buffer strips, or cash for future acquisition<br />
of reserve land to enhance amenity values<br />
and rates relief for the voluntary protection<br />
of historic heritage resources. The <strong>Council</strong><br />
also promotes awareness and encourages<br />
landowners and developers to take into<br />
account landscape, heritage and amenity<br />
values in the planning and design phases of<br />
proposals.<br />
Over the past fi ve years the Stratford District<br />
<strong>Council</strong> has issued building consents to<br />
the value of $15,000 for work on heritage<br />
buildings, all in relation to restoration work on<br />
St Peter’s Church, P _ urangi (see case study).<br />
South <strong>Taranaki</strong> District <strong>Council</strong><br />
In relation to landscape and heritage<br />
resources, the South <strong>Taranaki</strong> District <strong>Council</strong><br />
has adopted policies and methods, including<br />
rules, voluntary methods and rates relief for<br />
voluntary protection, to protect and enhance<br />
outstanding natural features and landscapes.<br />
Heritage inventories have been compiled<br />
covering the urban settlements and rural areas<br />
of the district. The South <strong>Taranaki</strong> District<br />
Plan includes a schedule of heritage items<br />
(buildings, objects and areas and notable<br />
trees) for protection and includes a range of<br />
regulatory and non-regulatory methods to<br />
protect the district’s heritage resources. These<br />
include rules in the district plan, education and<br />
information, rates relief and the consideration<br />
of the waiving of fees for heritage order<br />
requirements that are lodged on the basis of<br />
community benefi t.<br />
Methods have been adopted for maintaining<br />
and enhancing amenity values. These include<br />
the use of district plan performance standards<br />
and requirements for landscaping, provision<br />
of yards and controls on noise, lighting and<br />
signage. The district plan also identifi es a<br />
defi ned pedestrian area where standards<br />
encourage the development and retention of<br />
retail and business activities. The coastline<br />
and Lake Rotorangi have been identifi ed as<br />
areas where signifi cant amenity values exist<br />
and their protection has been addressed in<br />
the plan.<br />
The restoration of the H _ awera Water Tower<br />
was completed in 2004 at a total cost of $1.1<br />
million with 40% of the funding coming from<br />
the South <strong>Taranaki</strong> District <strong>Council</strong> and the<br />
remainder from corporate and other sources.<br />
In the past fi ve years there has also been<br />
considerable refurbishment work done on the<br />
Eltham Town Hall at a cost of approximately<br />
$250,000, again with funding coming from<br />
various sources (see case studies). In June<br />
2008 the steeple of St George’s Church in P _ atea<br />
was put back in place after the community had<br />
raised $230,000 to have it restored.<br />
Over the past fi ve years the South <strong>Taranaki</strong><br />
District <strong>Council</strong> and community boards have<br />
approved another $70,000 for the protection of<br />
the district’s heritage.<br />
State of the Environment Report 2009<br />
227
228<br />
<strong>LAND</strong>SCAPE, HERITAGE & AMENITY VALUES<br />
Eltham Town Hall.<br />
ELTHAM ELEGANCE<br />
CAPTURES HEARTS<br />
Nearing the grand old age of 100, she still<br />
captivates people – and there’s still plenty of<br />
life left in her.<br />
‘She’ is the Eltham Town Hall. “Everybody<br />
refers to this building as ‘her’, and she’s a<br />
very elegant lady,” said Karen Christian. So<br />
elegant and captivating that Karen has not<br />
only written a book about her, but joined<br />
Don Drabble and other Friends of the Eltham<br />
Town Hall in putting countless hours into an<br />
ongoing restoration project for which about<br />
half a million dollars has been raised.<br />
Even after nearly a decade on the project,<br />
they marvel at the workmanship that’s<br />
gone into the building, designed in 1910<br />
by H _ awera architect John Alfred Duffi ll and<br />
built in only six months by Manaia fi rm John<br />
A Ryan and Sons.<br />
“She was built soundly and there’s got to<br />
be at least another 100 years in her yet,”<br />
said Don. “It’s amazing when you think the<br />
builders had none of the modern power<br />
tools. And they did it in such a short time.”<br />
Karen points to the attractively curved<br />
proscenium arch that frames the big stage.<br />
“That was created using small widths of<br />
timber and shaped with plaster. And it’s<br />
still in original condition – it didn’t need<br />
renovating.”<br />
Other features of the hall include a fl y tower<br />
(so named because it allows curtains and<br />
scenery to ‘fl y in’ from above) soaring more<br />
TARANAKI – WHERE WE STAND<br />
than 12 m above the stage, and a fi ne<br />
dress circle. A grand t _ otara facade fronts<br />
corrugated iron sidewalls and the fl oors are<br />
constructed of matai.<br />
Besides being a venue for live drama, music<br />
and dance, the hall has served time as a<br />
movie theatre (Don was a projectionist),<br />
as a temporary hospital during the fl u<br />
epidemic of 1918-19, and as the place<br />
where townsfolk gathered to hear big<br />
announcements about wars or elections –<br />
delivered from a balcony at the front.<br />
The renovation effort began in earnest<br />
after a conservation plan was drawn up by<br />
Auckland conservation architects Salmond<br />
Reed in 2001, with Don contributing the<br />
historical introduction. The foyer has been<br />
renovated and rebuilt to Duffi ll’s original<br />
design, many of the original seats have<br />
been refurbished and re-covered, and<br />
storage areas and the manager’s offi ce have<br />
been turned into display spaces and a home<br />
for the Friends’ group.<br />
Friends of Eltham Town Hall Les Parish, Karen Christian and Don Drabble.<br />
Rob Tucker<br />
Now the Friends have their eyes on the<br />
stage area itself, and would also like to pay<br />
some attention to the frontage.<br />
Big donors over the years have included the<br />
<strong>Taranaki</strong> Electricity Trust and the Lottery<br />
Grants Board. To the delight of the Friends,<br />
TSB Community Trust recently funded the<br />
purchase of a new waterfall curtain for the<br />
stage.<br />
South <strong>Taranaki</strong> District <strong>Council</strong> has also<br />
supported the restoration efforts. And<br />
most importantly, so has the community.<br />
“At some stage, every community group in<br />
Eltham has been involved in this project,”<br />
said Karen. “That’s very signifi cant.”<br />
Supporters have included former movie<br />
patrons who have funded the restoration of<br />
their favourite seats in the dress circle.<br />
The building has a New Zealand Historic<br />
Places Trust Category 2 listing. But it is no<br />
museum piece. The fl at auditorium fl oor<br />
gives it versatility and it remains the venue<br />
for a wide range of activities including<br />
art exhibitions, performances, corporate<br />
meetings, even dinners. NZ Ballet and NZ<br />
Opera have performed there. Dave Dobbyn<br />
played there in 2007 and it was on the<br />
touring itinerary of Gary McCormick and Tim<br />
Shadbolt in 2008.<br />
“What we’ve found since the renovations<br />
started is that users respect the building<br />
more now,” said Don.<br />
There’s sure to be a big hooley when the<br />
Eltham Town Hall turns 100 in 2011 – with<br />
lots of love evident, as well as respect.<br />
<strong>Taranaki</strong> <strong>Regional</strong> <strong>Council</strong>
Parihaka International Peace Festival.<br />
Other agencies<br />
The Department of Conservation plays an important role in managing<br />
landscape, historic heritage and amenity values through its management<br />
of national parks and other conservation land in <strong>Taranaki</strong>. DOC manages<br />
146,973 hectares of public conservation land in <strong>Taranaki</strong> (21% of the<br />
total land area of the region) under the Conservation Act, National Parks<br />
Act and Reserves Act. Management plans are prepared for these areas<br />
and activities within them controlled to manage natural and historic<br />
resources for conservation purposes or for purposes consistent with the<br />
National Parks Act or Reserves Act.<br />
The Historic Places Trust, established under the Historic Places Act 1993,<br />
has a number of functions in the area of historic heritage. These include<br />
responsibilities to identify, record, investigate, assess, register, protect<br />
and conserve historic places, historic areas, w _ ahi tapu and w _ ahi tapu<br />
areas, to advocate the conservation and protection of these areas and to<br />
foster public interest and involvement in historic places protection. The<br />
Trust also manages historic places, buildings and other property owned<br />
or controlled by the Trust or vested in it.<br />
All archaeological sites are afforded protection under the Historic<br />
Places Act and it is unlawful for anyone to destroy, damage or modify<br />
an archaeological site without fi rst applying to the Trust for an authority<br />
to do so.<br />
(C) DEVELOPMENT OF COMMUNITY FACILITIES<br />
All district councils have been involved in the provision, development or<br />
upgrading of community amenities and facilities within their districts.<br />
For example there have been continuing upgrades of business districts<br />
or streetscapes in New Plymouth, Stratford, H _ awera, Inglewood, Eltham,<br />
Kaponga, Opunake, P _ atea and Waverley which have all contributed to<br />
improved amenities in these areas.<br />
<strong>Taranaki</strong> <strong>Regional</strong> <strong>Council</strong><br />
Sanford Events Centre, Opunake.<br />
There has also been ongoing community investment in recreational and<br />
cultural facilities over the reporting period including further development<br />
of the coastal walkway in New Plymouth, the Sandford Events Centre<br />
in Opunake, and investment by the <strong>Taranaki</strong> <strong>Regional</strong> <strong>Council</strong> in<br />
development of T _ upare (New Plymouth), Hollard Gardens (Kaponga) and<br />
Pukeiti Gardens.<br />
Work commenced early in 2008 on The Hub, South <strong>Taranaki</strong> District<br />
<strong>Council</strong>’s $22.7 million vision for a multi sports, leisure and events centre<br />
at Hicks Park in H _ awera. These developments have followed signifi cant<br />
community investment in major recreational and cultural facilities in the<br />
previous reporting period, including the Puke Ariki Library and Museum<br />
complex, Yarrow Stadium, and upgrades of the TSB Showplace, and<br />
Bowl of Brooklands in New Plymouth, the TET Stadium at Jubilee Park in<br />
Inglewood and the TET MultiSports Centre in Stratford.<br />
The development of such facilities contributes to the amenities enjoyed<br />
by the people of <strong>Taranaki</strong> and visitors alike, and promotes the economic<br />
and social well-being of the community.<br />
(D) SUMMARY OF PROGRESS<br />
Progress implementing regional objectives and policies on landscape,<br />
heritage and amenity issues is summarised in Table 7.6.<br />
Rob Tucker<br />
State of the Environment Report 2009<br />
229
230<br />
<strong>LAND</strong>SCAPE, HERITAGE & AMENITY VALUES<br />
Table 7.6 Summary of progress: implementing regional objectives and policies on landscape, heritage and amenity values.<br />
Issue What do we want to achieve? What are we doing about it? Where are we at?<br />
Protecting our outstanding<br />
natural features and<br />
landscapes from<br />
inappropriate subdivision,<br />
use and development<br />
Having regard to other<br />
natural features and<br />
landscapes of importance<br />
Identifying and raising<br />
awareness of historic<br />
heritage and promoting its<br />
protection<br />
Managing the adverse<br />
effects of activities on<br />
<strong>Taranaki</strong>’s historic heritage<br />
Promoting active<br />
management of<br />
archaeological sites and<br />
heritage buildings<br />
Maintaining and enhancing<br />
amenity values<br />
Adverse effects of activities<br />
on amenity values<br />
Protection of our outstanding<br />
natural features and landscapes<br />
Promotion of the protection<br />
of other natural features and<br />
landscapes of importance<br />
Increased awareness of<br />
outstanding and regionally<br />
signifi cant natural features and<br />
landscapes<br />
Protection of the region’s historic<br />
heritage values including<br />
buildings, structures features,<br />
places and areas of heritage value<br />
Maintenance and enhancement of<br />
amenity values<br />
TARANAKI – WHERE WE STAND<br />
• Objectives, policies and methods<br />
included in the <strong>Regional</strong> Policy<br />
Statement for <strong>Taranaki</strong>.<br />
• District councils have identifi ed<br />
outstanding or signifi cant features<br />
or landscapes and included<br />
provisions for their protection in<br />
district plans.<br />
• Conditions are imposed on<br />
resource consents.<br />
• Information and advice are<br />
provided.<br />
• Advocacy and promotion to other<br />
agencies and to landowners is<br />
undertaken.<br />
• District councils have compiled<br />
lists of heritage sites.<br />
• Signifi cant sites are included in<br />
district plans and are protected<br />
by rules.<br />
• Resource consents are issued<br />
to upgrade or maintain heritage<br />
sites.<br />
• Conditions are imposed on<br />
activities to protect heritage sites<br />
or values.<br />
• Funding is available to assist<br />
landowners to protect heritage<br />
values.<br />
• Information and technical advice<br />
is provided.<br />
• Investigations are carried out to<br />
identify heritage sites and values<br />
and to update records.<br />
• District plans contain policies and<br />
rules to control bulk and location,<br />
noise, light, traffi c and other<br />
aspects of amenity.<br />
• District plans contain policies and<br />
rules to protect notable trees.<br />
• <strong>Regional</strong> plans contain policies<br />
and rules to maintain amenity<br />
values.<br />
• Information and advice are<br />
provided.<br />
• Enforcement action is undertaken<br />
to maintain amenity values.<br />
• Community facilities are<br />
developed and open spaces are<br />
provided.<br />
• The region has high quality natural features<br />
and landscapes.<br />
• There have been no signifi cant changes<br />
in landscape qualities and values of<br />
outstanding or regionally signifi cant<br />
landscapes over the reporting period.<br />
• Some landscape change has occurred in<br />
the ring plain landscape unit in the New<br />
Plymouth District but it retains much of its<br />
natural character.<br />
• Conditions are imposed on resource<br />
consents to protect landscape values.<br />
• Information and advice are provided.<br />
• 1,345 heritage buildings, structures or items<br />
and 1,774 archaeological sites have been<br />
identifi ed in <strong>Taranaki</strong>.<br />
• 193 heritage buildings and items and 821<br />
archaeological sites have been identifi ed for<br />
protection in district plans.<br />
• 150 heritage items are listed in the New<br />
Zealand Historic Places Trust Register.<br />
• Funding has been made available to assist<br />
landowners to protect heritage values.<br />
• The number of heritage items identifi ed<br />
by district councils has decreased since<br />
2003, and the number of archaeological<br />
sites identifi ed and listed on the NZAA’s<br />
Site Recording Scheme has increased since<br />
2003.<br />
• The condition of archaeological sites in<br />
<strong>Taranaki</strong> is variable and are affected by<br />
development and farming activities.<br />
• Resource consents are issued and conditions<br />
are imposed to protect heritage values.<br />
• Information and advice are provided.<br />
• Amenity values are high in <strong>Taranaki</strong>.<br />
• Public perception surveys show high levels<br />
of public satisfaction with amenity values<br />
and community facilities.<br />
• 2,125 notable trees have been identifi ed for<br />
protection in district plans.<br />
• Information and advice are provided.
Photo: Rob Tucker<br />
CHAPTER 8<br />
NATURAL HAZARDS<br />
231
232<br />
AT A GLANCE<br />
NATURAL HAZARDS<br />
<strong>Taranaki</strong> is subject to a range of natural hazards, the most signifi cant<br />
of which are fl ooding, volcanic activity, earthquakes, high winds and<br />
tornadoes and land instability. The <strong>Taranaki</strong> <strong>Regional</strong> <strong>Council</strong> operates<br />
an extensive river level monitoring and fl ood warning system, as well as<br />
wind and rainfall recorders. In addition, eight seismometers (instruments<br />
used to measure earthquakes) are located around Mount <strong>Taranaki</strong> to<br />
monitor potential seismic and volcanic activity. Over the past fi ve years:<br />
• monitoring has shown no volcanic activity;<br />
• four signifi cant fl ood events and a number of minor events have<br />
occurred in the region;<br />
• 102 special weather warnings were issued by the Meterological<br />
Services;<br />
• 200-300 earthquakes were recorded on average each year in<br />
<strong>Taranaki</strong>, but only a few were felt; and<br />
• the swarm of tornadoes that hit <strong>Taranaki</strong> in July 2007 triggered<br />
a declaration of a state of emergency. The emergency response<br />
systems functioned well.<br />
Both regional and district plans identify natural hazards and contain<br />
controls to reduce hazard risks. Signifi cant hazards and risks to be<br />
managed by the <strong>Taranaki</strong> Civil Defence Emergency Management Group<br />
are identifi ed in the <strong>Taranaki</strong> Civil Defence Emergency Management<br />
Plan. A volcanic strategy has also been prepared and updated. The<br />
<strong>Taranaki</strong> <strong>Regional</strong> <strong>Council</strong> has prepared and updated a fl ood event<br />
standard operating procedure. In addition community awareness<br />
promotion and education on natural hazards, risk reduction measures<br />
and responses are carried out on an ongoing basis.<br />
TARANAKI – WHERE WE STAND
State of the Environment Report 2009<br />
233
234<br />
NATURAL HAZARDS<br />
Many natural hazards are weather related.<br />
OUR HAZARDOUS ENVIRONMENT<br />
A natural hazard can be defi ned as any<br />
atmospheric, earth or water-related occurrence<br />
including earthquake, tsunami, erosion,<br />
volcanic and geothermal activity, landslip,<br />
subsidence, sedimentation, wind, drought,<br />
fi re or fl ooding that adversely affects or may<br />
adversely affect human life, property or<br />
other aspects of the environment 1 . Natural<br />
hazards are environmental events that happen<br />
independently of human infl uence. Natural<br />
events become hazards only when they have<br />
the potential to affect people and property and<br />
other valued aspects of the environment.<br />
New Zealanders live on the active Pacifi c-<br />
Australian Plate boundary, which passes<br />
through New Zealand, producing earthquakes<br />
and volcanoes, and shaping the landscape.<br />
New Zealand has not suffered major social<br />
disruption or serious economic setback due<br />
to geological hazards since the 1930s and<br />
early 1940s, a period in which large shallow<br />
earthquakes repeatedly struck the country.<br />
The historical evidence and scientifi c research<br />
show that risk to the population and economy<br />
from geological hazards is signifi cantly greater<br />
than experience from more recent years would<br />
indicate.<br />
New Zealand also has a varied climate and is<br />
subject to a large number of meteorological<br />
hazards. These are weather-related events,<br />
such as fl oods, droughts, landslides, winds,<br />
1 Resource Management Act 1991.<br />
2 Thompson, C; Salinger, J; Burgess, S; Mullan, B. 2006. Climate Hazards and Extremes – New Plymouth District, Storms and High Intensity Rainfall, Extreme Rainfall Statistics.<br />
Report prepared by NIWA for New Plymouth District <strong>Council</strong>.<br />
3 Baldi, M; Salinger, S. 2008. Climate Trends, Hazards and Extremes – <strong>Taranaki</strong>. Synthesis Report. Prepared by NIWA for NPDC, TRC and STDC.<br />
4 Community Outcomes Project Team. 2004. Future <strong>Taranaki</strong>: A report on Community Outcomes.<br />
TARANAKI – WHERE WE STAND<br />
frost, extreme temperature, hail, lightning<br />
and fi re.<br />
Rob Tucker<br />
Potential increases in the severity and<br />
frequency of natural hazards such as fl ooding<br />
and rising sea levels are expected as a result<br />
of climate change. Global warming effects<br />
are expected to accumulate during the 21st<br />
century, and enhance already observed<br />
changes in regional climate. Projections out<br />
to 2100 for New Zealand include: increases<br />
in westerly winds, increases in temperature<br />
of between 0.5 and 3.5°C, decreases in frost<br />
risk, wetter in the west and drier in the east,<br />
and increases in the frequency of extreme daily<br />
rainfalls 2 . The increased rainfall is likely to lead<br />
to more severe fl oods, landslides and erosion.<br />
The higher temperatures are likely to lead to<br />
droughts and wildfi res.<br />
Predictions for likely changes to <strong>Taranaki</strong>’s<br />
climate have been made 3 . Rainfall in <strong>Taranaki</strong><br />
is predicted to decrease in summer and<br />
increase in winter with a likely increase in<br />
extreme rainfalls through the 21st century as<br />
the temperature increases. South <strong>Taranaki</strong> is<br />
likely to become drier on average, in terms of<br />
the moisture available for pasture growth, with<br />
more frequent droughts. Gale and storm force<br />
winds from the west are likely to increase.<br />
A major event almost anywhere in the country<br />
would affect the whole of society and economy<br />
because of the small size of the country and the<br />
interdependencies of infrastructure, logistics<br />
and business. Preparing for and responding<br />
to natural hazards in terms of reduction,<br />
readiness, response and recovery are key<br />
components in a ‘secure and healthy <strong>Taranaki</strong>’,<br />
one of the seven community outcomes<br />
identifi ed by the <strong>Taranaki</strong> community 4 .<br />
8.1 WHAT IS THE<br />
CURRENT STATE OF<br />
NATURAL HAZARDS<br />
IN TARANAKI?<br />
The <strong>Taranaki</strong> region is susceptible to signifi cant<br />
adverse effects from natural hazards. Natural<br />
disasters can result in heavy losses of property<br />
and a threat to lives, forcing communities to<br />
learn to live with these hazards. While it is<br />
not possible to reduce the incidence of natural<br />
hazards, steps can be taken to reduce the<br />
vulnerability of the community to their impacts.<br />
<strong>Taranaki</strong> is subject to a wide range of<br />
natural hazards, all of which have potentially<br />
signifi cant consequences for public safety<br />
and physical, social and economic wellbeing.<br />
The most signifi cant of which are fl ooding,<br />
earthquakes, volcanic activity, high winds, and<br />
land instability and erosion (including coastal<br />
erosion). Other potential hazards include<br />
tsunami, drought, fi re and lightning.<br />
Natural hazards are a constant threat to the<br />
<strong>Taranaki</strong> region because it has many areas<br />
of coastline exposed to erosion and fl ooding,<br />
steep erodible slopes in river catchments in<br />
the eastern hill country and a potentially active<br />
volcanic area. The region is also exposed to<br />
prevailing westerly winds and can experience<br />
some of the highest wind speeds in the country<br />
along its southern coast.<br />
(A) FLOODING<br />
Frequent heavy rain and the steep gradients<br />
of many <strong>Taranaki</strong> river catchments in the<br />
eastern hill country can result in signifi cant<br />
risks arising from fl ooding. Flood risk on the<br />
ring plain and coastal terraces along the<br />
northern and southern coasts is relatively low<br />
as high-velocity fl ood fl ows are contained<br />
largely within deeply incised stream channels.<br />
However, urban development can constrict<br />
fl ow and cause fl ooding risks in some areas.
One kilometre of forest was destroyed when a lahar breached the Maero Stream<br />
on Mount <strong>Taranaki</strong>. April 2008.<br />
Several major fl oods and a number of minor events have occurred since<br />
1980. The more signifi cant of these occurred in 1986 (Mangamingi),<br />
1987 (Wait _ otara), March 1990 (Cyclone Hilda – north, east and southeast<br />
<strong>Taranaki</strong>), April 1995 (New Plymouth, the ‘Big Wet’) 5 , and July-<br />
October 1998 (the ‘Long Wet’) 6 .<br />
Four signifi cant fl ood events and a number of minor events have<br />
occurred since the 2003 State of the Environment Report. The most<br />
signifi cant of these occurred in 2004 (Wait _ otara), 2006 (Wait _ otara) (see<br />
case study), May 2007 (New Plymouth and _ O _ akura) 7 , and April 2008<br />
( _ O _ akura to Opunake).<br />
The <strong>Taranaki</strong> <strong>Regional</strong> <strong>Council</strong> maintains a fl ood warning log for<br />
monitoring fl ood events. Alarms are triggered when fl ows in rivers<br />
reach critical levels. Table 8.1 shows the number of special weather<br />
warnings issued by the Meterological Service (102) and the number of<br />
fl ood warning events logged (12) during the period 2002-03 to 2007-08.<br />
The issuing of special weather warnings does not necessarily result in<br />
fl ood alarms, and equally, fl ood warning alarms can be triggered without<br />
special weather warnings being issued.<br />
Table 8.1: Flood warning events 2002-03 – 2007-08 8 .<br />
Year<br />
Special<br />
02-03 03-04 04-05 05-06 06-07 07-08<br />
weather<br />
warning<br />
15 25 19 12 17 14<br />
Flood<br />
warning<br />
alarms<br />
1 0 2 1 1 7<br />
Data from <strong>Taranaki</strong> <strong>Regional</strong> <strong>Council</strong> fl ood warning log.<br />
There is likely to be an increase in extreme rainfall events in the New<br />
Plymouth district in the future as a consequence of climate change. What<br />
is an extreme rainfall in the current climate might occur about twice<br />
Department of Conservation<br />
Figure 8.1: Rainfall event of April 2008.<br />
as often by the end of the 21st century under a mid-range temperature<br />
change scenario, and up to four times as often under a high temperature<br />
change scenario 8 .<br />
An example of an extreme rainfall event and its consequences was<br />
felt in April 2008. The event occurred during 29-30 April 2008 and was<br />
centred on the ranges and western and southern fl anks of the Egmont<br />
National Park, between _ O _ akura and Opunake (Figure 8.1). Rainfall of 55<br />
mm in one hour was recorded at the monitoring site at the Mangatete<br />
Bridge over the Stony (Hangatahua) River (the highest one-hour rainfall<br />
intensity on record). High rainfall was also recorded at Dawson Falls (45<br />
mm in one hour), North Egmont (45 mm in one hour) and Kahui Hut at<br />
the top of the Kapoaiaia catchment (46.5 mm). Other sites in the area<br />
recorded rainfall in the range of 30-50 mm per hour. The highest ever<br />
peak fl ow in the Stony (Hangatahua) River (530 cubic metres per second<br />
was recorded during this event.<br />
The short duration, high intensity rainfall resulted in a number of<br />
watercourses suffering considerable damage from high fl ows. The<br />
Stony River burst its banks at two places upstream of _ Okato village. In<br />
the same area, the Mangatete Stream also fl ooded, causing property<br />
damage. Further south, the _ Oaonui Stream burst its banks in its upper<br />
reaches in Egmont National Park, sending water into the Waiau River.<br />
The high fl ows caused erosion and deposition within and adjacent to<br />
watercourses. High fl ows collected and transported trees and debris.<br />
The debris caused blockages to structures and resulted in surge<br />
fl ows and over topping, resulting in damage to a number of structures<br />
including bridges, culverts, fords and fences.<br />
5 <strong>Taranaki</strong> <strong>Regional</strong> <strong>Council</strong>, 1996. State of the Environment, <strong>Taranaki</strong> Region, 1996.<br />
6 <strong>Taranaki</strong> <strong>Regional</strong> <strong>Council</strong>, 2003. <strong>Taranaki</strong> – Our Place, Our Future. Report on the State of the Environment of the <strong>Taranaki</strong> Region – 2003.<br />
7 G & E Williams Consultants Ltd, 2008. Oakura River, Lower Reaches – Hall Terrace, Flood Hazard.<br />
8 Thompson, C; Salinger, J; Burgess, S; Mullan, B. 2006. Climate hazards and Extremes – New Plymouth District, Storms and High Intensity Rainfall, Extreme Rainfall Statistics. Report prepared by<br />
NIWA for New Plymouth District <strong>Council</strong>.<br />
State of the Environment Report 2009<br />
235
236<br />
NATURAL HAZARDS<br />
Flood damage, Wait _ otara Township, 2004. Willow clearing, Waitotara River.<br />
LESSONS LEARNED FOR THE<br />
NEXT DELUGE<br />
The heavens opened in 2004 as Wait _ otara Valley suffered its worst<br />
fl ood in living memory – and the responses ranged literally from the<br />
valley fl oor to the sky above.<br />
All farms in the valley were affected, with severe damage throughout<br />
the valley fl oors and hill country. Forty-one of the 47 houses in<br />
Wait _ otara township were hit, with 14 later condemned. Little<br />
escaped the fl oodwaters – marae, the store, the hotel, school, town<br />
hall, church and Plunket rooms were all damaged, along with vital<br />
infrastructure such as roads, power and telecommunications links.<br />
Emergency management staff took to the air in a chopper in the<br />
fl ood’s immediate aftermath, checking on the welfare of stranded<br />
residents and ferrying in food and other supplies.<br />
This immediate response stretched out to more than a month as fl oodhit<br />
residents were assisted through issues and complications arising<br />
from evacuation, fl ood damage to homes and businesses, trauma and<br />
loss of income.<br />
Meanwhile, there was a long, hard look taken at the river itself and<br />
what happened to it in the fl ood. It was obvious, for example, that<br />
the obstruction caused by willows blocking the channel added to the<br />
turbulence of the fl ow and the severity of the fl ooding.<br />
The <strong>Taranaki</strong> <strong>Regional</strong> <strong>Council</strong> drew up a long-term channel clearance<br />
programme for the catchment which, with shared funding assistance<br />
Silt covers the Wait _ otara River fl ats after the 2004 fl ood.<br />
TARANAKI – WHERE WE STAND<br />
<strong>Taranaki</strong> Daily News<br />
from the South <strong>Taranaki</strong> District <strong>Council</strong>, saw work start immediately<br />
on clearing willows from priority areas, downstream and upstream of<br />
the township.<br />
The <strong>Taranaki</strong> <strong>Regional</strong> <strong>Council</strong> also installed two more rainfall<br />
recorders in the catchment, taking the total to four.<br />
The <strong>Council</strong>’s land management programme in the catchment was<br />
also expanded, with farmers encouraged to take action to prevent<br />
slips and erosion and thus reduce silt in river channels.<br />
Fast forward two years: the heavens opened again in July 2006,<br />
and while rainfall patterns in the main catchment and various subcatchments<br />
differed from those in 2004, overall there was even more<br />
rain, and more water in the river.<br />
However, Wait _ otara township was spared signifi cant fl ooding. The<br />
main reason for this, said <strong>Taranaki</strong> <strong>Regional</strong> <strong>Council</strong> Special Projects<br />
Manager Dex Knowles, was the removal of willows from the river<br />
channel resulting in greater channel capacity.<br />
“Observations and photographs clearly show a consistent river crosssection<br />
fl ow at Wait _ otara and not the turbulent fl ow associated with<br />
willow obstructions,” he said. “Certainly, informal feedback shows the<br />
community appreciated the value of the willow clearance.“<br />
The <strong>Council</strong>’s fl ood warning system also worked well enabling<br />
notifi cation of the fl ood to affected parties.<br />
Catchment clearance work is continuing so that damage and trauma<br />
can be kept to a minimum the next time the heavens open.<br />
<strong>Taranaki</strong> <strong>Regional</strong> <strong>Council</strong><br />
<strong>Taranaki</strong> <strong>Regional</strong> <strong>Council</strong>
Mount <strong>Taranaki</strong>, a volcanic cone.<br />
(B) VOLCANIC ACTIVITY<br />
The Egmont Volcanic Centre is one of eight volcanic districts in the North<br />
Island. Mount <strong>Taranaki</strong> last erupted in about 1755 after eight eruptions<br />
in the previous 300 years. Deposits around the base of the volcano<br />
record intermittent volcanic activity for the past 130,000 years. Moderate<br />
or major eruptions have occurred on average every 340 years, while<br />
numerous smaller events have taken place at more frequent intervals.<br />
On three occasions, twice within a very short period of geological time,<br />
former cones have collapsed to the north-east, south-east and the west.<br />
In each instance extremely large volumes of material fl owed more than<br />
40 km across the landscape and reached the present coastline. These<br />
fl ows created the distinctive mounds or hummocks on the lowlands<br />
surrounding the volcano.<br />
Figure 8.2: Location of earthquake monitoring sites.<br />
There is no evidence to suggest that Mount <strong>Taranaki</strong> has become<br />
extinct. Rather it must be regarded as an active volcano in a state of<br />
dormancy 9 .<br />
The approximately 100,000 people who live within an 80 km radius of<br />
Mount <strong>Taranaki</strong> have made a considerable investment in farms, forests<br />
and urban and industrial infrastructure. Consequently, the potential<br />
effect of volcanic activity in <strong>Taranaki</strong>, particularly from airborne ash,<br />
lahars and fl oods, represents a major threat to the community.<br />
The Institute of Geological and Nuclear Sciences, with support from the<br />
<strong>Council</strong>, operates a network of seismometers (instruments to measure<br />
earthquake and volcano activity) in and around the volcano (Figure 8.2).<br />
This network provides an early warning system. The network is funded<br />
by the Earthquake Commission. A continuous GPS site is operated by<br />
GNS to measure ground deformation (the change in the shape of the<br />
ground prior to, during, or after an eruption).<br />
No volcanic activity was recorded over the past fi ve years.<br />
(C) EARTHQUAKES<br />
Although not located in the most seismically active part of New Zealand,<br />
<strong>Taranaki</strong> has felt the effects of a number of moderate earthquakes over<br />
the past few decades 10 .<br />
There are least fi ve known active onshore surface faults in the region<br />
(Inglewood, Norfolk, _ Oaonui, Waverly and Ararata), along with a<br />
number of offshore faults. These active faults are the likely source of<br />
large, shallow earthquakes that originate in the region. High intensity<br />
earthquakes do not occur frequently.<br />
Since the installation of the earthquake monitoring network in 1992,<br />
between 200 and 300 earthquakes a year in <strong>Taranaki</strong> have been<br />
recorded. Only a small fraction of these were felt. In the 12-month<br />
period to June 2008, 191 earthquakes were recorded 11 . This accounted<br />
for 1-2% of the earthquakes located in New Zealand in an average year.<br />
Most of the earthquakes occurred along the coastline west of Mount<br />
<strong>Taranaki</strong>, between New Plymouth and Opunake, and east of Stratford.<br />
The distribution is similar to that recorded in recent years. Only four of<br />
these earthquakes were felt - two deep earthquakes off H _ awera and<br />
P _ atea and two shallow earthquakes, one near Cape Egmont and one<br />
near New Plymouth.<br />
Figure 8.3: The number of earthquakes recorded in <strong>Taranaki</strong> from January 1994<br />
to June 2007. All detected earthquakes are shown in the lower graph, those of<br />
magnitude 3 and above (centre) and those of magnitude 4 and above (top).<br />
9 <strong>Taranaki</strong> <strong>Regional</strong> <strong>Council</strong>, 2000. <strong>Taranaki</strong> <strong>Regional</strong> Volcanic Contingency Plan 2000.<br />
10 <strong>Taranaki</strong> <strong>Regional</strong> <strong>Council</strong>, 1996. State of the Environment, <strong>Taranaki</strong> Region, 1996.<br />
11 Sherburn, S; Scott, B; Miller, C. 2007. Data from the <strong>Taranaki</strong> Volcano-Seismic Network: July 2006 to June 2007. Prepared by GNS for <strong>Taranaki</strong> <strong>Regional</strong> <strong>Council</strong>.<br />
Rob Tucker<br />
State of the Environment Report 2009<br />
SOURCE: GNS<br />
237
238<br />
NATURAL HAZARDS<br />
Apart from periods of above average activity in early 2000 (a sequence<br />
of earthquakes about 20 km north-east of Stratford), and May 2005 to<br />
March 2006 (widespread activity west of Mount <strong>Taranaki</strong>), the rate of<br />
earthquake activity in <strong>Taranaki</strong> is relatively low and has remained fairly<br />
constant since detailed monitoring began. Figure 8.3 shows the number<br />
of earthquakes recorded in <strong>Taranaki</strong> from January 1994 at different<br />
magnitudes. Most earthquakes recorded were small (under magnitude<br />
3) 12 . Figure 8.4 shows the distribution of earthquakes with a magnitude<br />
of 2.7 and larger. Shallow earthquakes tend to be to the west of Mount<br />
<strong>Taranaki</strong> whereas deeper earthquakes follow the Waverley fault-line.<br />
Figure 8.4: Earthquakes of magnitude 2.7 and larger in <strong>Taranaki</strong> between<br />
January 1994 to June 2007. Closed circles indicate earthquakes less than 50 km<br />
deep and open circles are those more than 50 km deep. The larger the circle the<br />
greater the magnitude.<br />
(D) HIGH WINDS AND TORNADOES<br />
High winds and tornadoes in the <strong>Taranaki</strong> region are determined by its<br />
position in relation to the large-scale weather patterns affecting New<br />
Zealand. Furthermore, the region is dominated by Mount <strong>Taranaki</strong> and<br />
is often infl uenced by wind effects related to air fl ows over and around<br />
Mount <strong>Taranaki</strong>.<br />
High winds occur over <strong>Taranaki</strong> when vigorous fronts, troughs, deep<br />
depressions or cyclones cause strong northerly to westerly airfl ows, or<br />
southeasterly airfl ows over the region. In the former case the region<br />
is exposed to winds coming in from the Tasman Sea. In the latter<br />
case winds from the central North Island can be very strong, causing<br />
substantial damage.<br />
The highest wind speeds in <strong>Taranaki</strong> tend to occur in spring or autumn.<br />
Occasional cyclonic storms (such as that associated with Cyclone Bola in<br />
1988) may cause serious and widespread damage.<br />
12 Magnitude: A measure of the energy released by an earthquake at its source. Magnitude is commonly determined from the shaking recorded on a seismograph. Each unit of magnitude on the<br />
scale represents a substantial increase in energy, for example a magnitude 5 releases 30 times more energy than a magnitude 4.<br />
13 Burgess, S; Salinger, J; Gray, W; Mullan, B. 2006. Climate Hazards and Extremes – New Plymouth District, Cyclones of Tropical Origin. Prepared by NIWA for New Plymouth District <strong>Council</strong>.<br />
14 Salinger, J; Burgess, S; Turner, R; Moore, S. 2007. Climate Hazards and Extremes in <strong>Taranaki</strong> – Tornado Update. Prepared by NIWA for New Plymouth District <strong>Council</strong>.<br />
15 Burgess, S; Salinger, J; Turner, R; Reid, S. 2007. Climate Hazards and Extremes – <strong>Taranaki</strong> Region, High winds and tornadoes. Prepared by NIWA for New Plymouth District <strong>Council</strong>.<br />
TARANAKI – WHERE WE STAND<br />
SOURCE: GNS<br />
The roof from Placemakers landed across the street after the 4 July tornado.<br />
Approximately 30 cyclones of tropical origin passed near (within<br />
approximately 550 km) or over New Plymouth between December 1968<br />
and April 2005 13 . The peak period for cyclone type weather systems<br />
is usually during February and March due to warmer sea surface<br />
conditions in these months.<br />
Periods of high winds experienced in <strong>Taranaki</strong> over the past fi ve years<br />
have caused only minor or localised damage.<br />
With climate change the frequency of tropical cyclones is uncertain. The<br />
strongest cyclones in the tropics are predicted to increase in intensity,<br />
with stronger winds and more intense rainfall. It is unknown how these<br />
cyclones, or accompanying weather patterns, will affect New Zealand<br />
but it is likely that there will be some higher intensity ex-tropical cyclones<br />
producing larger storm impacts as the 21st century progresses 13 .<br />
A tornado is a violently rotating column of air called a vortex, extending<br />
from the base of a thunderstorm cloud to the ground, and on a local<br />
scale, it is the most intense of all atmospheric circulations. Tornadoes<br />
are amongst the most intense and destructive winds. In New Zealand,<br />
a tornado will typically last for a few minutes, track across the land for<br />
2-5 km, have a diameter of 20-100 m, and have spinning wind speeds of<br />
32-50 m/s (116-180 km/h).<br />
From 1951 to 2006 (56 years) 57 tornado events were reported in<br />
<strong>Taranaki</strong> with 81% causing damage and 21% causing major structural<br />
damage 14 . On average about one tornado will occur annually in the<br />
region, with severe tornadoes occurring about once in four years 15 . A<br />
swarm of tornadoes struck <strong>Taranaki</strong> in July 2007 causing widespread<br />
damage across the region (see case study). The majority of the<br />
tornadoes recorded in <strong>Taranaki</strong> had maximum wind speeds in excess<br />
of 180 km/h. Typical weather conditions indicate the presence of low<br />
pressure and associated frontal activity to the west or over <strong>Taranaki</strong> with<br />
winds from the north and west.<br />
<strong>Taranaki</strong> is susceptible to signifi cant adverse effects from tornadoes.<br />
New Plymouth District may be more affected by tornadoes than other<br />
parts of the region as the area is exposed to thunderstorms and unstable<br />
northwest air masses that originate over the Tasman sea. Damaging<br />
tornadoes have also occurred in many towns and rural areas throughout<br />
<strong>Taranaki</strong>. Tornadoes can result in losses of property and be a threat to<br />
lives, forcing communities to learn to prepare for them.<br />
<strong>Taranaki</strong> <strong>Regional</strong> <strong>Council</strong>
A resident surveys damage from the 5 July tornado, _ O _ akura.<br />
TARANAKI COMMUNITY<br />
TACKLES TORNADOES<br />
Nature threw a tantrum in July 2007 – and <strong>Taranaki</strong> mobilised to clean<br />
up the mess left in its wake.<br />
Besides the severity and randomness of the damage and the miraculous<br />
lack of death or serious injury, a notable feature of the tornado swarm<br />
that struck <strong>Taranaki</strong> in July 2007 was the community response.<br />
<strong>Taranaki</strong> people may shrug that off but outsiders were impressed.<br />
After visiting the badly damaged _ O _ akura Kindergarten, the then Civil<br />
Defence Minister Rick Barker told a media briefi ng that “there were<br />
quite a number of people who were from out of the area helping the<br />
kindergarten because they had kindergartens themselves and said ‘if my<br />
kindergarten was damaged like this, I would want other people to come<br />
and help me too’.”<br />
An unknown number of tornadoes struck the region on 5 July 2007,<br />
a day after one had devastated a building in the New Plymouth CBD.<br />
Region-wide, some 73 properties were damaged across a wide area<br />
including Motunui, Stratford, H _ awera, Kaponga, Okaiawa, Normanby<br />
and Rahot _ u. But it was _ O _ akura that bore the brunt of the damage.<br />
Like Rick Barker, Fire Chief Pat Fitzell was impressed with the way the<br />
community rallied around in the aftermath. “Not only the community<br />
out at _ O _ akura but the community in greater <strong>Taranaki</strong>. We’ve had people<br />
arriving with hammers, with nails, saying ‘I’m here to help’ from Urenui,<br />
from Stratford, from all over <strong>Taranaki</strong>. So it’s been fantastic,” he said the<br />
day after the swarm.<br />
Clean-up operations after the 5 July tornado hit _ O _ akura.<br />
Rob Tucker<br />
<strong>Taranaki</strong> <strong>Regional</strong> <strong>Council</strong><br />
The mess was devastating, enough to awe even those experienced and<br />
trained to cope with disasters.<br />
“We saw trampolines up trees,” <strong>Taranaki</strong> Civil Defence Emergency<br />
Management Group Controller David Lean said after visiting _ O _ akura.<br />
“We saw glass embedded in steel. Literally embedded in steel.”<br />
“We saw a 40 ft container – a fully loaded container – blown some<br />
60 ft down into a swamp. We saw a garage that had been moved<br />
100 m over the neighbour’s fence and into a paddock, and the<br />
lawnmower was still sitting in the place where somebody parked it …<br />
how nobody got hurt beats me.”<br />
A state of emergency was declared by the <strong>Taranaki</strong> Civil Defence<br />
Emergency Management Group at 8pm on Thursday, 5 July 2007 and<br />
terminated at 10am on Saturday, 7 July 2007.<br />
Insured losses from the tornadoes were put at more than $8 million.<br />
The event was the fi rst major test for a new regional Civil Defence<br />
Emergency Management structure in <strong>Taranaki</strong> and all those involved<br />
agreed it worked well. But it was the community as a whole that<br />
earned the most credit.<br />
“I just have to say the people of <strong>Taranaki</strong> have rallied around<br />
magnifi cently,” said Rick Barker. “I think they should all take a bow. As<br />
a community they have performed just outstandingly. Couldn’t have<br />
asked for anything better.”<br />
Figure 8.5 Location and path of tornadoes across the <strong>Taranaki</strong> region.<br />
State of the Environment Report 2009<br />
239
240<br />
NATURAL HAZARDS<br />
Coastal farmer Peter Johnson surveys his dry pasture. Summer 2007-08.<br />
(E) DROUGHT<br />
Drought is a very real climatic hazard, imposing signifi cant effects.<br />
Unlike natural hazards such as earthquakes and high winds which<br />
can strike quickly, droughts do not usually have a sudden beginning or<br />
end. They are an insidious hazard caused by a period of abnormally dry<br />
weather, persisting long enough to produce serious adverse effects.<br />
A prolonged dry spell over the summer of 2007-08 saw rivers in some<br />
parts of <strong>Taranaki</strong> reach historically low levels. A feature of the dry spell<br />
was its early beginning, with rainfall tapering off in November. Areas<br />
south and east of the mountain and on the coast were particularly hard<br />
hit. A drought was declared over a large part of the region – the area<br />
of coastal <strong>Taranaki</strong> extending south from _ Okato, through all of South<br />
Figure 8.6: Map of rainfall between Nov 07 – Feb 2008 .<br />
16 <strong>Taranaki</strong> <strong>Regional</strong> <strong>Council</strong>, October 2000. Water Shortage Event Standard Operating Procedure.<br />
17 Baldi, M; Salinger, S. 2008. Climate Trends, Hazards and Extremes – <strong>Taranaki</strong>. Synthesis Report. Prepared by NIWA for NPDC, TRC and STDC.<br />
TARANAKI – WHERE WE STAND<br />
<strong>Taranaki</strong> <strong>Regional</strong> <strong>Council</strong><br />
<strong>Taranaki</strong> District to the region’s southern boundary, and southern and<br />
eastern parts of the Stratford District.<br />
All three district councils in the region were forced to impose water<br />
restrictions, although in the case of New Plymouth District these were<br />
confi ned to _ Okato, and a water conservation notice issued in Inglewood.<br />
In the four months from 1 November 2007 to 29 February 2008, Stratford<br />
received 243 mm of rainfall, or just 42% of average (Figure 8.6). Rainfall<br />
gauges at Huinga, Rimunui and P _ atea also measured less than 50%<br />
of the usual average. The coastal strip from H _ awera to Cape Egmont<br />
received not much more than half the average rainfall for the period.<br />
North of the mountain, the defi cit was in the range of 60% to 75%.<br />
Toko had its lowest February rainfall since records began in 1997. The<br />
February rainfall at Cape Egmont at 22.5 mm, was 23% of normal.<br />
Interestingly, January and February 2008 were actually wetter than the<br />
corresponding months in 2007. However, the summer’s rainfall was<br />
still below average and the effect was worse because the previous<br />
two months of 2007 had been considerably drier than November and<br />
December in 2006.<br />
Among rivers to reach their lowest February levels since records began<br />
30 years ago were the Waingongoro River at Eltham Road and the<br />
Waiwhakaiho River at Egmont Village.<br />
Across the region, average river fl ows were up to four times lower than<br />
their normal monthly fl ows. The fl ow in the Manganui River at Everett<br />
Park during February 2008 averaged 4,974 litres a second, compared<br />
with its average February fl ow of 19,882 litres a second.<br />
River temperatures were also above normal, with the Waiwhakaiho at<br />
Egmont Village recording a new high of 25ºC.<br />
As a result of the low summer rainfall and river fl ows, the <strong>Council</strong><br />
invoked three of the four steps in its water shortage management<br />
procedure 16 , effectively ending the taking of water for pasture irrigation<br />
in most areas. The <strong>Council</strong> closely monitored the situation to determine<br />
if there was a need to take the fi nal step of the procedure, the issuing<br />
of a water shortage direction under the Resource Management Act, but<br />
fortunately this was not necessary.<br />
The estimated loss of farm gate income of this drought event for the<br />
entire North Island was estimated at $1.24 billion in March 2008 17 .<br />
(F) COASTAL EROSION<br />
Waves, currents and tides can contribute to signifi cant changes in land<br />
form over a relatively short time. Increased wave heights during storms<br />
contribute to increased erosion and in some cases extensive fl ooding.<br />
The generally eroding nature of the <strong>Taranaki</strong> coast is a result of the<br />
natural process that the community must live with and adapt to.<br />
Protection structures are situated in areas where development has<br />
historically occurred close to the eroding coast.<br />
Seventy three consents have been issued, renewed or varied for<br />
structure protection walls in <strong>Taranaki</strong> between 2003 and 2007. In total,<br />
135 consents have been issued in <strong>Taranaki</strong> for structure protection walls<br />
covering an estimated 11.6 km of coast.
Coastal walkway and sea wall, New Plymouth.<br />
(G) <strong>LAND</strong> INSTABILITY<br />
Land instability can occur on a spectrum from<br />
very suddenly to slowly, and may be triggered<br />
by both natural and human-induced changes in<br />
the environment, most commonly slope loading<br />
or excavation, land use change, such as<br />
deforestation, and hydrological changes, such<br />
as increased seepage. These factors, when<br />
combined with the forces of gravity, can cause<br />
instability. If areas vulnerable to landslides<br />
or slope instability can be identifi ed, land use<br />
planning can be an effective part of managing<br />
the risk of such events occurring.<br />
The landslide hazard has recently been<br />
assessed for the New Plymouth District 18 . The<br />
study concluded that only 9% of the district<br />
(about 183 km 2) is likely to be affected by<br />
landslides.<br />
Climate change is likely to increase extreme<br />
rainfall events in the region. With increasing<br />
landslide-inducing rainfall events, the<br />
probability of landslides is likely to at least<br />
double during the 21st century, with more<br />
areas affected.<br />
8.2 HOW ARE<br />
NATURAL HAZARDS<br />
MANAGED IN<br />
TARANAKI?<br />
A sustainable management approach is taken<br />
to hazards and risks in <strong>Taranaki</strong>. This involves<br />
enabling communities to achieve acceptable<br />
levels of risk, as well as planning and preparing<br />
for emergency response and recovery.<br />
Predictions of increased hazards arising from<br />
climate change have important implications for<br />
agricultural industries (in terms of anticipating<br />
increased droughts) and planning for<br />
stormwater systems, fl ood management and<br />
infrastructure (in light of likely increased high<br />
intensity rainfall events) 17 .<br />
(A) REGIONAL PLANS<br />
from coastal erosion, and criteria and rules<br />
regarding coastal hazard protection works.<br />
The <strong>Regional</strong> Fresh Water Plan for <strong>Taranaki</strong><br />
contains policies and rules to address river<br />
bank and river bed erosion and fl ooding. Rules<br />
set out requirements relating to discharges<br />
to land and water, the building of structures<br />
or carrying out of works in riverbeds and<br />
land drainage activities, to avoid or minimise<br />
natural hazards. The plan also emphasises the<br />
avoidance of hazard-prone areas, the provision<br />
of information and advice on known or likely<br />
fl ood hazards and the retention or planting of<br />
forest cover in upper catchments and riparian<br />
margins as a component of fl ood and erosion<br />
management.<br />
The <strong>Regional</strong> Soil Plan for <strong>Taranaki</strong> deals<br />
with soil erosion issues, particularly in the<br />
more erosion-prone areas of the inland hill<br />
country. Emphasis in the plan is placed on the<br />
<strong>Council</strong>’s property planning services under its<br />
Sustainable Land Management Programme<br />
(refer to Chapter 3 of this report).<br />
(B) DISTRICT PLANS<br />
The Resource Management Act tasks district<br />
councils with the responsibility of developing<br />
objectives, policies and methods for controlling<br />
the use of land to avoid or mitigate natural<br />
hazards. The three district plans all deal with<br />
natural hazards.<br />
A wide range of natural hazards have the<br />
potential to adversely affect the New Plymouth<br />
district. The New Plymouth District Plan<br />
identifi es natural hazards in the district. The<br />
planning maps in the plan identify ponding<br />
areas, fl ood detention areas, spillways, fault<br />
lines, and coastal and volcanic hazard areas.<br />
Rules specify standards to control buildings<br />
and other structures, subdivisions and<br />
excavations and soil fi lling within or close to<br />
hazard areas.<br />
The Stratford District Plan and Proposed<br />
District Plan contain rules, standards<br />
and conditions to control subdivision and<br />
development in areas identifi ed as being at<br />
risk from natural hazards. Hazards identifi ed<br />
as being signifi cant in the district include<br />
areas or sites susceptible to fl ooding, erosion,<br />
subsidence, slope instability and volcanic or<br />
seismic activity.<br />
18 Schmidt, J; Salinger, J; Woods, R. 2007. Climate Hazards and Extremes – New Plymouth District, Landslide Hazard Assessment. Prepared by NIWA for New Plymouth District <strong>Council</strong>.<br />
Rob Tucker<br />
Under the Resource Management Act the<br />
<strong>Taranaki</strong> <strong>Regional</strong> <strong>Council</strong> has responsibility<br />
for managing hazard risks through the resource<br />
consent and regional planning processes, and<br />
for ensuring risk assessments are undertaken<br />
if further site-specifi c research is required<br />
to clarify the level of risk. Part of managing<br />
hazard risks involves the preparation and<br />
implementing of risk mitigation plans for<br />
specifi c sites. This has seen the development<br />
of fl ood plans for the Waitara and Wait _ otara<br />
rivers and a volcanic strategy.<br />
The <strong>Council</strong>’s responsibilities for avoiding<br />
or mitigating natural hazards are addressed<br />
through objectives and policies in the Proposed<br />
<strong>Regional</strong> Policy Statement, and through its<br />
regional plans.<br />
The <strong>Regional</strong> Coastal Plan for <strong>Taranaki</strong><br />
contains policies and methods in relation to<br />
natural hazards in the coastal marine area,<br />
notably coastal erosion and fl ooding or erosion<br />
of riverbanks in estuaries with adjacent<br />
residential areas or utilities. The plan promotes<br />
the avoidance of natural hazards, reduced risk<br />
State of the Environment Report 2009<br />
241
242<br />
NATURAL HAZARDS<br />
The South <strong>Taranaki</strong> District Plan contains rules<br />
and performance standards concerning the<br />
location and erection of buildings in areas of<br />
known or anticipated natural hazards, and site<br />
works on erosion-prone land identifi ed in the<br />
district. Natural hazards of particular concern<br />
include erosion, land instability, subsidence,<br />
fl ooding and earthquakes.<br />
In addition to district plans, district councils<br />
apply the Building Act 2004 and the Building<br />
Code in relation to the construction of buildings<br />
within identifi ed hazard areas. District councils<br />
also make hazard information available in<br />
Project Information Memorandums (PIM)<br />
prepared under the Building Act 2004 and Land<br />
Information Memorandums (LIM) under the<br />
Local Government Act 1974.<br />
(C) CIVIL DEFENCE<br />
EMERGENCY MANAGEMENT<br />
Civil defence emergency management involves<br />
the application of knowledge, measures and<br />
practices to ensure the safety and wellbeing of<br />
the public and protection of property. It includes<br />
planning and preparation for emergencies, as<br />
well as response and recovery in the event of<br />
an emergency. The Civil Defence Emergency<br />
Management Act 2002 requires an ‘all<br />
hazards’ approach to emergency management,<br />
rather than a previous focus on geophysical<br />
and meterological hazards alone. Under this<br />
Act, the <strong>Taranaki</strong> <strong>Regional</strong> Civil Defence<br />
Public seminar on the impacts and recovery from volcanic activity.<br />
19 <strong>Taranaki</strong> <strong>Regional</strong> <strong>Council</strong>, 2000. Report on Civil Defence Public Awareness and Preparedness.<br />
20 <strong>Taranaki</strong> <strong>Regional</strong> <strong>Council</strong>, 2005. Civil Defence Emergency Management Public Awareness/Preparedness Survey Report 2005. Prepared by a working group of the district councils, the <strong>Regional</strong><br />
<strong>Council</strong> and Fire Services.<br />
TARANAKI – WHERE WE STAND<br />
Emergency Management Group (CDEM Group)<br />
was established. This group is made up of<br />
representatives from the <strong>Taranaki</strong> <strong>Regional</strong><br />
<strong>Council</strong> and the three district councils. The<br />
CDEM Group must undertake a number of<br />
functions, including:<br />
• identifying, assessing and managing hazards<br />
and risks;<br />
• consulting and communicating about risks;<br />
• identifying and implementing cost effective<br />
risk reduction; and<br />
• responding to and managing the adverse<br />
effects of emergencies in its area.<br />
The goals of the <strong>Taranaki</strong> CDEM Group are to<br />
increase community awareness, understanding<br />
and participation in civil defence emergency<br />
management; to reduce the risks from hazards<br />
in <strong>Taranaki</strong>; and to enhance the region’s<br />
capabilities to manage and then to recover<br />
from disasters.<br />
In addition, every CDEM Group must prepare<br />
and approve a Civil Defence Emergency<br />
Management Group Plan in order to provide<br />
for an “all hazards” approach to emergency<br />
management planning and activities within<br />
their regions. The Group Plan identifi es the<br />
signifi cant hazards and risks to be managed by<br />
the CDEM Group in <strong>Taranaki</strong>; the emergency<br />
management functions necessary to manage<br />
the hazards and risks; and the reduction,<br />
readiness, response and recovery actions to be<br />
<strong>Taranaki</strong> <strong>Regional</strong> <strong>Council</strong><br />
undertaken by the individuals, organisations<br />
and agencies involved in civil defence<br />
emergency management.<br />
Early identifi cation of hazards by the <strong>Taranaki</strong><br />
CDEM Group combined with public education<br />
will help the <strong>Taranaki</strong> region to make informed<br />
decisions on land development options that<br />
avoid the risk from hazards.<br />
Other initiatives of the CDEM Group include:<br />
• commissioning research into hazards in the<br />
region;<br />
• running regional exercises;<br />
• participating in national exercises; and<br />
• supporting a study into the vulnerability of<br />
utility networks (such as gas pipelines).<br />
(D) COMMUNITY AWARENESS<br />
AND EDUCATION<br />
In 1995 a community survey on civil defence<br />
public awareness and preparedness indicated<br />
that only 37% of the community perceived<br />
a threat from volcanic eruption in <strong>Taranaki</strong>.<br />
After this survey a comprehensive awareness<br />
campaign was carried out and the volcanic<br />
hazards map of <strong>Taranaki</strong> was completed and<br />
published.<br />
A further community survey in 2000 revealed<br />
that 79% of the <strong>Taranaki</strong> community perceived<br />
an earthquake as a hazard that could result<br />
in a civil defence emergency, followed by<br />
volcanic eruption at 68%, fl ooding 57% and<br />
storms 28% 19 . This indicated that the public<br />
awareness work had led to an increase in<br />
community understanding of the likely threat of<br />
a natural disaster. Furthermore, 88% of those<br />
polled had the necessary survival items in their<br />
homes, and 48% said they would contact the<br />
“<strong>Council</strong>” with any civil defence enquires. Only<br />
13% indicated they did not know what to do in<br />
a major disaster.<br />
Five years later in 2005, a further community<br />
survey of the state of public awareness<br />
of natural hazards and preparedness for<br />
emergency situations was carried out 20 . The<br />
survey revealed that 79.1% of the <strong>Taranaki</strong><br />
community perceive a volcanic eruption as<br />
a hazard that could result in a signifi cant<br />
emergency, followed by an earthquake at
59.7%, fl ooding 37% and tsunami at 25.2%. A high proportion of those<br />
polled (86.80%) had the necessary survival items in their homes, however<br />
only 30% had these items in one place, i.e. a ‘survival kit’. Of those<br />
interviewed 63.9% said they would contact the “council” with any civil<br />
defence enquiries. Only 8.9% indicated that they did not know what to<br />
do in a major disaster.<br />
The <strong>Taranaki</strong> Civil Defence Emergency Management Public Education<br />
Strategy was developed in 2004 to provide a strategic direction for the<br />
Civil Defence Emergency Management Group public education activities.<br />
The Strategy outlines the vision, goals and objectives of the public<br />
education programme, and strategies to achieve those objectives. A<br />
public education plan has been developed to implement the strategy.<br />
It focuses on increasing community awareness, understanding and<br />
participation in civil defence management in <strong>Taranaki</strong>. In particular,<br />
the plan concentrates on increasing preparedness and understanding<br />
of the signifi cant hazards in <strong>Taranaki</strong> and making sure that individuals<br />
know what to do and where to fi nd guidance before, during and after<br />
an emergency. A further key message is the need for the public to<br />
participate in rebuilding and restoring communities after the emergency<br />
event has passed.<br />
The <strong>Taranaki</strong> CDEM Group identifi es and provides information to<br />
agencies that manage emergencies, and to the community, to reduce<br />
the risk to people. Examples of initiatives undertaken recently by the<br />
<strong>Taranaki</strong> CDEM Group include:<br />
• workshops and public seminars providing information and advice on<br />
hazards in the region, e.g. the public seminar ‘Will it bang, bubble or<br />
fi zz?’ – a seminar on the nature and consequences of an eruption of<br />
Mount <strong>Taranaki</strong>;<br />
• a mass public texting system that broadcasts free text alerts from<br />
the <strong>Taranaki</strong> CDEM Group to all those who subscribe to the service.<br />
As of 30 June 2008, there were over 2,700 subscribers to this<br />
regional service;<br />
• community awareness programmes (e.g. civil defence emergency<br />
management open days); and<br />
• developing and maintaining a web page.<br />
A civil defence open day promoted the need to be prepared.<br />
21 <strong>Taranaki</strong> <strong>Regional</strong> <strong>Council</strong>, 2004. <strong>Taranaki</strong> <strong>Regional</strong> Volcanic Strategy.<br />
<strong>Taranaki</strong> <strong>Regional</strong> <strong>Council</strong><br />
(E) REGIONAL VOLCANIC STRATEGY<br />
The <strong>Regional</strong> Volcanic Strategy 21 sets out the overall philosophy<br />
and approach towards the volcanic hazard in the region. It describes<br />
principles for response, an analysis of potential risk, monitoring systems<br />
and protocols and mechanisms for integrating the emergency plans of<br />
other agencies. The strategy is updated every four years, and is currently<br />
under review.<br />
(F) RIVER CONTROL AND FLOOD PROTECTION<br />
Three major fl ood protection schemes have been established in <strong>Taranaki</strong>.<br />
The New Plymouth scheme involved the construction of detention dams<br />
on the Waimea, Huatoki and Mangaotuku Streams, the construction<br />
of a diversion tunnel on the Mangaotuku Stream and other works. The<br />
scheme was completed in 1990.<br />
The Waitara Flood Control Scheme was initially constructed in 1970-71.<br />
The scheme was the subject of a comprehensive review in 1990-91.<br />
A major upgrade of the scheme was completed in 1995. This involved<br />
realignment of the river and the construction of seven large rock groynes<br />
to hold the river in its new course downstream of SH3.<br />
Flood protection works on the lower Waiwhakaiho River.<br />
Signifi cant fl ood protection works on the lower Waiwhakaiho River<br />
and Mangaone Stream in New Plymouth were completed by 1998.<br />
These works offer fl ood protection to the lower Waiwhakaiho retail and<br />
industrial area.<br />
In 2006, following consultation with the South <strong>Taranaki</strong> District <strong>Council</strong>,<br />
local land occupiers and the local community, the <strong>Council</strong> adopted<br />
the document Reducing the Risk – Proposed River Clearance and<br />
Maintenance Programme for the Wait _ otara. This document sets out an<br />
agreed programme of channel clearance and maintenance works in the<br />
Wait _ otara River, including funding arrangements.<br />
Forty-two structures for fl ood protection/erosion control have been<br />
issued over the past fi ve year period. A total of 152 consents are in place<br />
for fl ood protection/erosion control in <strong>Taranaki</strong>.<br />
Rob Tucker<br />
State of the Environment Report 2009<br />
243
244<br />
NATURAL HAZARDS<br />
(G) SUSTAINABLE <strong>LAND</strong> MANAGEMENT<br />
PROGRAMME<br />
Through the <strong>Council</strong>’s sustainable land management programme, the<br />
<strong>Council</strong> is working with land holders to adopt land use practices and<br />
techniques that avoid or minimise soil erosion (land instability) in the<br />
hill country and which maintain and improve water quality in ring plain<br />
streams. As at 30 June 2008, the <strong>Council</strong> had prepared a total of 269<br />
comprehensive farm plans and 24 agroforestry plans, which together<br />
cover 178,580 ha of privately-owned hill country land.<br />
(H) HAZARD MONITORING<br />
The <strong>Council</strong> operates 35 hydrological stations (two are shared<br />
with NIWA) that continuously record water level and fl ows, water<br />
temperature, rainfall, wind direction, speed and maximum wind gusts,<br />
soil moisture and temperature. From this network of monitoring sites,<br />
and the earthquake monitoring network (described above), the <strong>Council</strong><br />
has good information to enable monitoring of potential natural hazards.<br />
Hydrological information is provided on the <strong>Council</strong>’s website,<br />
www.trc.govt.nz and on the GNS website for earthquake information,<br />
www.geonet.org.nz.<br />
(I) SUMMARY OF PROGRESS<br />
Issue What do we want to achieve? What are we doing about it? Where are we at?<br />
Reducing the risks to the community<br />
from natural hazards<br />
TARANAKI – WHERE WE STAND<br />
• Increased public awareness of and<br />
planning for natural hazards.<br />
• Reduction in the costs of natural<br />
hazard events, emergencies or<br />
disasters.<br />
8.3 HOW DO WE COMPARE?<br />
All regions have a civil defence emergency management plan in place<br />
and most district plans have rules in place that deal with natural<br />
hazards. All CDEM group plans are coming up for review in the<br />
next couple of years. The Ministry of Civil Defence and Emergency<br />
Management is in the process of developing a guideline for secondgeneration<br />
CDEM group planning. These guidelines are being developed<br />
consultatively with end-users.<br />
The Omahine rainfall recorder at Moana Trig helps provide fl ood warning for the<br />
Wait _ otara Catchment.<br />
• Providing education, information<br />
and advice to reduce hazard risk.<br />
• Establishing hazard mitigation<br />
works.<br />
• Advocating, when appropriate for<br />
new development to be located<br />
away from hazard zones.<br />
• Carrying out investigations and<br />
monitoring.<br />
• <strong>Regional</strong> Coastal, Fresh Water and<br />
Soils plans made operative.<br />
• District plans prepared and<br />
notifi ed.<br />
• Public information programmes<br />
established.<br />
• Three signifi cant river and<br />
fl ood control schemes, 35 river,<br />
rainfall and wind stations, eight<br />
seismometers and one continuous<br />
GPS site operated.<br />
• Volcanic strategy reviewed and<br />
updated.<br />
• Flood event standard operating<br />
procedure reviewed and updated.<br />
Second-generation CDEM group plans will have a strong focus on<br />
reducing the likelihood of severe adverse effects from natural hazards.<br />
This will aim to enhance the link between planning work undertaken by<br />
district councils and regional councils, their long term council community<br />
plans and the work programmes of CDEM groups.<br />
<strong>Taranaki</strong> <strong>Regional</strong> <strong>Council</strong>
Photo: Rob Tucker<br />
CHAPTER 9<br />
WASTE<br />
245
246<br />
AT A GLANCE<br />
WASTE<br />
The term ‘waste’ describes materials or substances that are no longer<br />
needed or have lost their economic value and require disposal. In our<br />
increasingly consumer driven society, with its throwaway philosophy,<br />
the management of waste is a major issue, with the challenge being to<br />
fi nd new uses for materials no longer required (i.e. recycling) or to fi nd<br />
ways of cutting down on the quantity of materials that end up being<br />
discarded (i.e. minimising the amount of waste generated). There is also<br />
a need to ensure that large volumes of waste can be safely disposed of.<br />
In <strong>Taranaki</strong>:<br />
the whole region is now serviced by just one landfi ll, at Colson Road<br />
in New Plymouth, maintained to ‘best practice’ standards, with a<br />
future site secured;<br />
this compares with the situation 15 years ago when the region was<br />
serviced by about 20 sites, some of them just ‘dumps’;<br />
the quantity of waste discharged to the landfi ll has increased by 20%,<br />
between 1996 and 2008;<br />
suitable wastes are increasingly discharged to cleanfi lls, which have<br />
grown in number from 13 (in 2003) to 23;<br />
approximately 70,000 used tyres are produced per year, but demand<br />
for uses such as silage pit covers and culverts, is matching supply;<br />
council kerbside recycling collections have expanded in the region<br />
with a kerbside green waste collection now being offered in South<br />
<strong>Taranaki</strong>;<br />
since 1991, the <strong>Taranaki</strong> <strong>Regional</strong> <strong>Council</strong> has collected and disposed<br />
of more than 40 tonnes of redundant, unknown or hazardous wastes;<br />
and<br />
waste minimisation and recycling is being promoted in the region and<br />
increasingly businesses are taking up the challenge.<br />
The <strong>Regional</strong> Waste Strategy has been prepared and adopted by all four<br />
councils in the region. The strategy provides specifi c waste minimisation<br />
and management goals for local authorities, industry and the community<br />
on matters relating to waste minimisation, hazardous wastes and waste<br />
disposal.<br />
TARANAKI – WHERE WE STAND
State of the Environment Report 2009<br />
247
248<br />
WASTE<br />
The regional landfi ll at Colson Road, New Plymouth.<br />
OUR WASTE<br />
Waste can be defi ned as any material – solid, liquid or gas – that is<br />
unwanted and/or unvalued, and has been discarded or discharged by its<br />
owner 1 .<br />
Solid waste is more than just post-consumer rubbish. It may also include<br />
substances that are a by-product of one manufacturing process that can<br />
be reused in the same process, or recovered and used as raw material<br />
for another process. It can also include materials that do not currently<br />
have an alternative end use.<br />
In past years, the focus was on addressing the adverse environmental<br />
effects of solid waste disposal in dumps (e.g. odour, seagulls, pollution<br />
leaching to groundwater). However, over the past two decades, most<br />
environmental issues associated with solid waste disposal have been<br />
addressed through measures such as the closure of almost all small<br />
municipal landfi lls, and through improved landfi ll engineering and<br />
management practices at remaining or new sites. Fifteen years ago the<br />
<strong>Taranaki</strong> region was serviced by about 20 sites, some of them were just<br />
‘dumps’. The focus has shifted from better waste disposal, to reducing the<br />
amount of waste disposed of. Reducing the volume of waste generated in<br />
the fi rst place, or reusing materials that might otherwise be discarded, is<br />
far more effi cient than trying to manage the waste once generated.<br />
To manage wastes, the principles of minimisation, recovery, and<br />
recycling have been adopted, in order to both minimise environmental<br />
problems associated with solid waste disposal, and also avoid<br />
the depletion of critical resources. This means all sectors of our<br />
community must be engaged in waste management awareness and<br />
implementation. It is no longer a case of leaving it to the local council<br />
rubbish truck crew.<br />
9.1 WHAT IS THE CURRENT STATE<br />
OF WASTE IN TARANAKI?<br />
(A) GENERATION AND DISPOSAL<br />
While other regions are fi nding it diffi cult to provide security of access<br />
to landfi ll capacity for municipal wastes in the medium term, in <strong>Taranaki</strong><br />
the Colson Road landfi ll in New Plymouth serves as the regional landfi ll<br />
1 Ministry for the Environment, 2000. The New Zealand Waste Strategy.<br />
2 Ministry for the Environment, March 2003. The 2002 Landfi ll Review and Audit.<br />
TARANAKI – WHERE WE STAND<br />
Rob Tucker<br />
and has an estimated seven years capacity left at current fi lling rates<br />
(as of January 2008). It is classifi ed as a Class A landfi ll, one of 11 in the<br />
country (as of 2002) that are considered to meet good current practice in<br />
its design and management 2 .<br />
The quantity of wastes generated annually in the New Plymouth District,<br />
both total tonnages and amounts per person is illustrated in Figure 9.1.<br />
Reliable fi gures are not available for this period for the region as a whole.<br />
Figure 9.1: Trends of waste to landfi ll from New Plymouth District.<br />
The majority of these wastes was disposed of in the Colson Road landfi ll.<br />
The signifi cant drop in the 2001-02 year was due to the opening of the<br />
New Plymouth Transfer Station, associated price increases for disposal,<br />
and restrictions on access to the Colson Road landfi ll. Quantities<br />
gradually increased after this, taking approximately fi ve years to return to<br />
the 2000-01 level of 45,300 tonnes. The largest volume to date has been<br />
during the past year for which there was complete data, 2007-08, with<br />
53,200 tonnes discharged to the landfi ll. This was a 20% increase over<br />
the 12 years since 1995-96 (using the moving three-year average).<br />
On a per person basis, waste to landfi ll has increased 17% over the<br />
same 12 years (again using the moving three-year average), with per<br />
person quantities following the same trend as overall waste to landfi ll<br />
(also illustrated in Figure 9.1).<br />
Analysis of the data indicates that the change over the entire 12-year<br />
period was not statistically signifi cant, but there was a statistically<br />
signifi cant trend over the past seven years from 2001-02 to 2007-08.<br />
Economic activity in the New Plymouth District over this period increased<br />
35% (National Bank regional economic activity index). It is generally<br />
considered that refuse volumes refl ect economic activity. This is because<br />
more economic activity means more manufacturing with more waste<br />
produced, and more consumption so more products discarded at the<br />
end of their life. In <strong>Taranaki</strong> the amount of waste disposed has not<br />
increased by the same amount as has economic activity. Reasons for<br />
this have not been analysed, and could include limited manufacturing<br />
industry in <strong>Taranaki</strong>, the introduction of kerbside recycling collections in<br />
the New Plymouth District in 1992, diversion of compostable wastes to<br />
other facilities, the proliferation of cleanfi lls to receive inert wastes such<br />
as soil, gravel, and concrete, and more effi cient use of raw materials in<br />
manufacturing processes.
An analysis of the nature, source and type of waste disposed of to the<br />
Colson Road landfi ll was carried out in April 2005. Five primary waste<br />
categories were separated and measured: organic, cardboard/paper,<br />
timber, construction and demolition, and residual waste.<br />
Results showed the waste from the municipal kerbside collection<br />
was 38% organic, 19% cardboard, and only 4% construction and<br />
demolition and timber waste. Waste collected from the transfer<br />
station was 32% timber and 15% construction and demolition<br />
materials, and only 9% organic.<br />
The results show that there is considerable scope to reduce the quantity<br />
of materials currently being discharged to landfi ll, through recovery and<br />
recycling of materials such as the composting of organic wastes.<br />
(B) CLEANFILLS<br />
Engineering and managing landfi lls comes at some considerable cost.<br />
Cleanfi lls are sites where inert material can be disposed of in a way<br />
that will not affect the environment or people when left unmanaged.<br />
Materials appropriate to dispose to cleanfi ll include natural materials<br />
such as clay, soil and rock as well as other inert materials such as<br />
concrete or brick. With increasing costs of landfi lls, cleanfi lls are being<br />
used as an alternative for these ‘inert’ or stable waste types. This then<br />
frees up space in engineered sanitary landfi ll for materials more likely to<br />
affect the environment.<br />
A cleanfi ll is not simply a cheap or second-class version of a landfi ll or a<br />
small old-fashioned rubbish dump. As cleanfi lls provide no engineered<br />
barriers or safeguards for the environment it is critical that the types of<br />
wastes discharged are carefully controlled.<br />
There are currently 23 consented cleanfi lls in the region. The <strong>Regional</strong><br />
Fresh Water Plan for <strong>Taranaki</strong> also allows some cleanfi lling activities to<br />
proceed without a consent, as long as they meet stringent restrictions<br />
on the types of wastes that are accepted.<br />
Cleanfi lls operate under less comprehensive controls than landfi lls<br />
because of the restricted types of waste they can receive. Therefore<br />
less information is available on volumes of wastes diverted to them.<br />
In some cases cleanfi ll operators may be receiving only wastes they<br />
themselves generate (e.g. earthmoving contractors). In other cases they<br />
may also receive wastes from others. Sites used for cleanfi lling may<br />
include the rehabilitation of former quarries and the conversion of<br />
gullies into pasture.<br />
Most cleanfi lls in the region operate to a good to high standard. Others,<br />
however, have been found, through monitoring, to accept prohibited<br />
wastes. The <strong>Council</strong> instigates enforcement action in these cases,<br />
including successful prosecutions and requirements for closure.<br />
3 <strong>Taranaki</strong> <strong>Regional</strong> <strong>Council</strong>. 2004. Memorandum to Policy and Planning Committee. 4 February 2004.<br />
Sorting waste for analysis at Colson Road landfi ll, 2005.<br />
(C) SPECIAL WASTES<br />
The <strong>Taranaki</strong> <strong>Regional</strong> <strong>Council</strong> undertook a study into the management<br />
of used tyres in <strong>Taranaki</strong> 3 . It found that each year the region produces<br />
approximately 70,000 used tyres. With the closure of retreading services<br />
in New Zealand, the high number of used imported cars, and the import<br />
of partially worn tyres for resale, disposal of tyres elsewhere in New<br />
Zealand has become a major issue. However, the survey showed that<br />
generally this has not occurred in <strong>Taranaki</strong>. Demand still matches the<br />
supply of old tyres, for uses such as silage pit covers and culverts. No<br />
tyre dealer identifi ed disposal as an issue.<br />
The capacity to re-process glass collected for recycling into bottles in<br />
New Zealand is strictly limited, due to large volumes of glass being<br />
imported and high rates of recycling, so that there is effectively an oversupply<br />
of recovered glass. Local councils are exploring alternative enduses<br />
for glass in the region, such as sand blasting or incorporation into<br />
roading materials. Issues include long-term liability, health and safety<br />
concerns, and added handling expense. Experiments with a mobile<br />
crusher at <strong>Taranaki</strong>’s largest recycling depot, and feasibility evaluations<br />
are being pursued.<br />
The use of used tyres on farms means their disposal is not yet an issue in <strong>Taranaki</strong>.<br />
<strong>Taranaki</strong> <strong>Regional</strong> Coun cil<br />
Rob Tucker<br />
State of the Environment Report 2009<br />
249
250<br />
WASTE<br />
Simone, Janet and Geoff Genner and their car powered by used vegetable oil.<br />
AFTER THE FRIES, THIS CAR FLIES<br />
When it comes to individual environmental initiatives, never under<br />
estimate the value of a well-publicised trail-blazing exercise.<br />
In 2006, alternative fuels enthusiast James MacDonald drove from<br />
Bluff to Cape Reinga in a car powered by used vegetable oil – and<br />
New Plymouth woman Janet Genner followed the media coverage<br />
with growing interest and excitement.<br />
“What a cool idea. We could easily run a car on used vege oil,” she<br />
told husband Geoff and daughter Simone.<br />
Indeed they could. As New Plymouth franchisees for McDonald’s, the<br />
Genners have plenty of used cooking oil literally on tap.<br />
(D) AGRICULTURAL WASTES<br />
The <strong>Council</strong> surveyed the rural sector in 2004 to determine waste<br />
management practices and issues 4 . The survey showed that most<br />
farmers used a mix of burning and burying wastes for disposal on<br />
farm, while a surprising number (23%) used off-farm options such as<br />
occasional or regular use of waste management contractors to remove<br />
rubbish. There was considerable waste re-use (e.g. of empty plastic<br />
containers or building materials). On-farm inspections and conversations<br />
indicated that those surveyed had only small amounts of agrichemicals,<br />
and little or no quantities of unwanted or redundant agrichemicals. All<br />
participants knew of the regional hazardous waste collections carried<br />
out previously. There was a high level of willingness for a farm plastics<br />
collection service if provided, even if it required some small levy.<br />
Over three quarters of all farms surveyed were using bale silage. The<br />
discarded plastic wrap was burned (70%), buried (14%), or disposed of<br />
to landfi ll (16%). Burning was also the main method of managing empty<br />
agrichemical containers (56% of all farmers).<br />
4 <strong>Taranaki</strong> <strong>Regional</strong> <strong>Council</strong>. 2005. Memorandum to Planning and Policy Committee 17 March 2005.<br />
TARANAKI – WHERE WE STAND<br />
<strong>Taranaki</strong> <strong>Regional</strong> Coun cil<br />
First they had to fi nd a suitable vehicle – a diesel motor is needed but<br />
Janet didn’t fancy anything too big and certainly didn’t want an SUV.<br />
Finally they settled on a 2001 Peugeot 307 hatchback.<br />
Bluff-to-Cape driver James MacDonald, who lives in Palmerston<br />
North, did the fuel conversion job for $2,500, though Geoff Genner<br />
says off-the-shelf conversion kits are now available for around $2,000.<br />
Then it was simply a case of ‘fi ll ‘er up’. In 18-plus months of running,<br />
the Genners are delighted with the car and have had no major<br />
problems. “Performance is no different from a normal car.”<br />
Diesel is used to start the car and warm the engine up before<br />
switching to vegetable oil, stored in a 20-litre tank at the back. They’re<br />
getting around 250 km per tank, with the car used mainly by Janet.<br />
Geoff is so pleased that when his own car is due for replacement in<br />
2009, he’s likely to go the vege oil way. “We’re just thinking about<br />
what we will do.”<br />
A couple of other <strong>Taranaki</strong> motorists are fuelling vehicles with used<br />
oil from the busy McDonald’s restaurant, the rest is recycled through<br />
a tallow operator.<br />
The ‘McVege car’ is decorated with bright sunfl ower decals drawing<br />
attention to its motive power – though Geoff says the best fuel has<br />
proved to be cottonseed oil. “But pictures of fl uffy cotton plants<br />
wouldn’t get the same idea across.”<br />
The Genners concede that not everyone has such easy access to<br />
used vegetable oil. But all the same, their initiative is seen as a<br />
good example of a family seeing and acting upon a sustainability<br />
opportunity within their own particular lifestyle circumstances.<br />
The <strong>Council</strong> has supported (both fi nancially and through staff time and<br />
advice) the development of a national agrichemical container recovery<br />
programme (AgRecovery). Progress toward its commencement has<br />
been slower and less comprehensive than anticipated, but by mid-2008,<br />
two sites were in operation, at a Transfer Station in Waitara and at<br />
a private waste and recycling business in H _ awera. An agricultural<br />
spray contractor in Stratford is also acting as a depot for contractors’<br />
containers.<br />
A New Zealand pilot programme has been run for Agpac by the Central<br />
<strong>Taranaki</strong> Employment Trust in Stratford which collected 10.5 tonnes<br />
of plastic wrap by late 2007, over the fi rst two years of operating.<br />
Following this programme, the collection of used silage wrap is<br />
now being offered commercially throughout <strong>Taranaki</strong> via four rural<br />
contractors and a private enterprise recycling centre, with 47 bins<br />
deployed in the region. These initiatives address an issue identifi ed as a<br />
priority in the rural wastes survey.
Sharemilker Greg Topless stores plastic wrap to be recycled.<br />
RAPT OVER WRAP SOLUTION<br />
When the question is disposing of silage wrap, the answer for<br />
sharemilker Greg Topless is not blowing in the wind – and he couldn’t<br />
be more pleased.<br />
Greg’s on a Toko property that’s been signed up for the Agpac scheme,<br />
under which a large bin and liners are supplied to contain the plastic<br />
wrap until it is picked up for recycling.<br />
“The whole thing is great. It means you don’t have all this plastic<br />
blowing around the farm, getting dirty, being buried or burned, or<br />
worse,” he said.<br />
(E) HAZARDOUS WASTE MANAGEMENT<br />
The <strong>Council</strong> has organised hazardous wastes collection for the rural<br />
sector driven by concern to safeguard public health and the environment<br />
from contaminants. Previous collections in 1991, 1995-1997, and 2001<br />
had been well supported, and showed a trend of a considerable reduction<br />
in the quantities of intractable wastes (such as DDT, arsenic treatments,<br />
and lindane) gathered in each subsequent collection.<br />
In the 1991-92 collection, <strong>Council</strong> staff visited each of the 84 farms that<br />
had advised they had wastes to collect. Nine tonnes of waste were<br />
collected with a high proportion (about 55%) of hazardous wastes such<br />
as DDT.<br />
In 2001, farmers were invited to bring wastes to collection centres set<br />
up in the main towns of the region. While more than 13 tonnes were<br />
collected (from almost 1,000 participants from both urban and rural<br />
sectors), the proportion of hazardous wastes was much lower.<br />
The 2004 collection used a mobile unit that visited 10 small rural centres<br />
around the region, to maximise convenience of access for farmers. Over<br />
16 tonnes of waste were collected. The greatest quantities collected<br />
were paints, waste oil, dairyshed cleansers, and animal treatments,<br />
with smaller volumes of various agrichemicals such as weedkillers. The<br />
proportion of the most hazardous wastes was very low (500 kg, or about<br />
5 <strong>Taranaki</strong> <strong>Regional</strong> <strong>Council</strong>/Ministry for the Environment. 2004. Cleaning Up the Leftovers- Hazardous Waste Collections in <strong>Taranaki</strong>.<br />
Rob Tucker<br />
Burning or burying have been the traditional methods of disposing of<br />
silage wrap but both cause environmental damage.<br />
Under the Agpac system, farmers are urged to bin their plastic<br />
immediately after it comes off the bale instead of leaving it to lie<br />
around and become excessively contaminated with manure, dirt and<br />
other material.<br />
The bin liner is made of the same material as the silage wrap, so the<br />
whole unit needs no further processing before being presented at a<br />
recycling plant.<br />
The scheme operates two streams. The fi rst includes baleage wrap,<br />
silage pit covers, small feed and fertiliser bags, plastic packaging and<br />
shrink wrap. The second includes bulk feed or fertiliser bags that have<br />
woven PP outer bags and LDPE inner bags.<br />
Bins have gone on to around 50 properties in <strong>Taranaki</strong> since 2005<br />
and upwards of fi ve tonnes of wrap a year has been collected for<br />
recycling.<br />
Farmers can buy a bin ($480 + GST) and liners ($10 + GST), then either<br />
drop off the full liner ($20 + GST) or arrange to have it collected ($40<br />
+ GST).<br />
The scheme operates nationally and in <strong>Taranaki</strong> it is delivered through<br />
four contractors: Ken Moratti in Inglewood,<br />
Mark Hinton or Barry Taunt in Stratford,<br />
and Michael Silson in Kaponga.<br />
3%), indicating these have now largely been removed from the region.<br />
This was confi rmed during the survey into farm wastes discussed above.<br />
In total, the <strong>Council</strong> has collected and disposed of more than 40 tonnes<br />
of redundant, unknown, or hazardous wastes since 1991 (from both rural<br />
and urban collections) 5 . It is estimated there could be about two tonnes<br />
of residual wastes left (across 4,000 farms), meaning that future specifi c<br />
collections would not be cost effective or effi cient. The district councils<br />
continue to offer a drop-off service for hazardous wastes through<br />
selected transfer stations. A charge applies for commercial quantities.<br />
<strong>Council</strong> staff collect hazardous waste for recycling or safe disposal. Douglas, April 2004.<br />
<strong>Taranaki</strong> <strong>Regional</strong> Coun cil<br />
State of the Environment Report 2009<br />
251
252<br />
WASTE<br />
Kerbside recycling, New Plymouth.<br />
(F) MUNICIPAL WASTES<br />
All three districts now provide a kerbside recycling service for urban<br />
households, in some cases extending into nearby rural areas. Each<br />
district has a different level of service, which is refl ected in the quantities<br />
collected.<br />
In 1993-94, the New Plymouth District <strong>Council</strong> began a district-wide<br />
kerbside collection service for recyclables, as part of its municipal refuse<br />
service. Householders place recyclables out in supermarket bags for a<br />
weekly collection. In the fi rst year, 6.76% of the total kerbside quantity<br />
collected was recovered for recycling. In 2007-08, the recyclables<br />
collected as a percentage of the total volume of materials (recyclables<br />
plus wastes) collected in the New Plymouth <strong>Council</strong> kerbside collections<br />
had risen to 17.1% – more than double.<br />
South <strong>Taranaki</strong> District <strong>Council</strong> started kerbside recycling in 2001 on a<br />
fortnightly basis using 120-litre bins. This was expanded in 2006-07 to<br />
give households the option of a green waste collection using 240-litre<br />
wheelie bins. In mid-2007 the recycling collection doubled in frequency,<br />
Figure 9.2: Amount of waste, recycled material and green waste disposed per<br />
household in council kerbside collections from October 06 to June 08.<br />
TARANAKI – WHERE WE STAND<br />
<strong>Taranaki</strong> <strong>Regional</strong> Coun cil<br />
Cardboard sorted for recycling.<br />
from fortnightly to weekly. Taking green waste into account, 39% of all<br />
material collected within South <strong>Taranaki</strong> through the kerbside collection<br />
service is recovered for recycling, with the remaining being discharged<br />
to landfi ll.<br />
Stratford District <strong>Council</strong> began kerbside recycling in 2002. The<br />
collection is monthly using 240-litre wheelie bins.<br />
Quantities of waste, recycling and green waste collected per household<br />
in council kerbside collections in each district are illustrated in Figure<br />
9.2. The recycling fi gures for South <strong>Taranaki</strong> District <strong>Council</strong> also include<br />
school recycling. Figure 9.2 does not include recycling or waste collected<br />
at the kerbside in New Plymouth from private contractors as this data<br />
was not available. It is estimated that privately contracted waste<br />
collections may amount to about 28% of households in New Plymouth.<br />
Figure 9.3 shows the quantities and types of recyclable materials<br />
collected from domestic kerbside recycling in the region from July 2007<br />
to June 2008. This highlights that the greatest amount of recyclable<br />
materials is paper.<br />
Figure 9.3: Domestic kerbside recyclable materials recovered between July 07<br />
and June 08 for <strong>Taranaki</strong>.<br />
<strong>Taranaki</strong> <strong>Regional</strong> Coun cil
Students manage the recycling system at St Joseph’s Primary School, H _ awera.<br />
RECYCLING MORE THAN JUST<br />
THE FOURTH ‘R’<br />
An environmental imperative … an educational project …<br />
a fi nancial strategy ...<br />
For St Joseph’s Primary School in H _ awera, recycling is all of the above.<br />
The school has an award-winning recycling system that grew out of<br />
concern at the cost of waste disposal and the level of student apathy<br />
about the problem.<br />
9.2 HOW IS WASTE<br />
MANAGED IN TARANAKI?<br />
(A) PLANNING<br />
The Proposed <strong>Regional</strong> Policy Statement for <strong>Taranaki</strong> identifi es the<br />
minimising of waste and the managing of its disposal as issues, for the<br />
region. It includes an objective and policy targeted at encouraging waste<br />
minimisation practices and measures to safely manage the adverse<br />
environmental effects of waste disposal.<br />
The councils of the region work together through the <strong>Regional</strong> Solid<br />
Wastes Working Party that includes senior executive staff and<br />
political representation from the four councils, and a forum made up of<br />
operational staff. The forum meets regularly to progress the development<br />
and implementation of the <strong>Regional</strong> Waste Strategy and district waste<br />
plans.<br />
The <strong>Regional</strong> Waste Strategy was prepared in 2003 and adopted by<br />
all four councils in the region. While it was based on the goals and<br />
objectives of the New Zealand Waste Strategy, the <strong>Regional</strong> Waste<br />
Strategy is specifi c to <strong>Taranaki</strong>. The strategy provides specifi c waste<br />
minimisation and management goals for local authorities, industry and<br />
the community. It includes targets derived from the New Zealand Waste<br />
Strategy for waste minimisation (particularly for organic wastes, special<br />
wastes and construction and demolition waste), hazardous wastes<br />
St Joseph’s<br />
A waste audit in 2005, carried out with the help of <strong>Taranaki</strong> <strong>Regional</strong><br />
<strong>Council</strong> staff, revealed it would be possible to recycle much of the<br />
material the school was sending to landfi ll.<br />
Deputy Principal Rik Allen realised that it was time to bring the<br />
students on board and he had his class survey the rest of the school to<br />
discover the best ways to encourage more students to recycle.<br />
The result: a system that is essentially run and owned by the students.<br />
Each class has access to brightly labelled containers for nonrecyclable<br />
waste, recyclable waste and food waste. And each month,<br />
a different class takes responsibility for collection and sorting, with<br />
the food scraps made into compost on site.<br />
The children also visited all classes and the school offi ce with advice<br />
on reducing waste, such as reusing single-sided paper, turning<br />
off lights and computers, effi cient use of cardboard, and reusing<br />
resources for other purposes.<br />
Rik Allen said that the system was functioning well and the children<br />
were even using the compost when planting shrubs and fl owers. As<br />
well as being enormously educational, the new system has drastically<br />
reduced the cost of waste disposal.<br />
The school incorporates environmental education into other teaching<br />
programmes and its successes earned it a <strong>Taranaki</strong> <strong>Regional</strong> <strong>Council</strong><br />
Environmental Award for 2008.<br />
(particularly for contaminated sites, organochlorines and trade wastes)<br />
and waste disposal.<br />
In 2005 the district councils collaboratively developed district waste<br />
management plans, refl ecting the <strong>Regional</strong> Waste Strategy. These set<br />
out the services and funding provisions for waste management in each<br />
district. Developing them through a collaborative approach has been<br />
more effi cient and addressed consistency issues between the districts.<br />
(B) WASTE AND RECYCLING SERVICES<br />
Commercial service providers now play a major role in waste management<br />
in the region. The kerbside collection of recyclables and residual wastes is<br />
by contract to the district councils, as is the operation of transfer stations<br />
and the Colson Road landfi ll. The recovered recyclables are processed by<br />
another company. There are a number of waste contractors offering private<br />
collection and recycling services for materials such as cardboard, shrink<br />
wrap, vehicle batteries, and scrap metal. In some cases contractors will<br />
pay for materials delivered to them (scrap metals were in high demand<br />
worldwide before the recession hit), while in other cases they may take<br />
materials free of charge (e.g. paper and cardboard), or may charge to<br />
recover handling and processing costs (e.g. rechargeable batteries).<br />
While involvement of commercial operators puts waste management<br />
activities on an economically sustainable footing, it can cause problems<br />
with access to reliable data on recycling, as councils then have access to<br />
only some of the data on recycling within the private sector.<br />
State of the Environment Report 2009<br />
253
254<br />
WASTE<br />
Large volumes of paint have been recovered from within the region for<br />
recycling via the Placemakers/ Enviropaints scheme, promoted by the<br />
<strong>Council</strong>. As noted above, the <strong>Council</strong> has collected (and subsequently<br />
recycled) considerable volumes of paint through its hazardous wastes<br />
collections. Useable paint is also put aside at some transfer stations for<br />
the public to access. Electronic wastes (computers and cellphones) are<br />
recycled within <strong>Taranaki</strong> through such events as the national e-waste<br />
collection programme held in 2008.<br />
(C) INFORMATION, ADVICE AND EDUCATION<br />
The <strong>Regional</strong> Waste Minimisation Offi cer position was established in<br />
2003 in order to promote waste minimisation and recycling throughout<br />
the region. It is jointly funded by the four councils.<br />
Waste minimisation assessments have been conducted in a number of<br />
sites throughout the region: publishing, medical, hospitality (training and<br />
retail, especially cafes and restaurants), marae, sports clubs, boat making<br />
and joinery, petrochemical, large public events, electricity generation,<br />
sporting, retail, and education (primary, tertiary, and outdoor pursuits).<br />
Recycling options have been explored including tallow/cooking oils for<br />
re-processing, food wastes for stock feed, paper, cardboard, and glass. A<br />
total of 52 assessments were prepared over 2006-08.<br />
Adoption of waste minimisation practices by businesses can be slow<br />
and variable, due to lack of awareness or willingness, little appreciation<br />
of the opportunities to reduce costs, lack of knowledge of resources<br />
available or just the day-to-day pressures of running a business.<br />
However, responses to the waste minimisation assessments have been<br />
positive. Of the 45 followed up to June 2008, nearly half had reduced<br />
Festival patrons sorting waste for recycling at one of the many recycling<br />
stations. March 2008.<br />
WORLD OF MUSIC, ARTS AND<br />
DANCE – AND RECYCLING<br />
It’s quickly become an event that defi nes <strong>Taranaki</strong> almost as much as<br />
the mountain does. And now WOMAD is adding status and standards<br />
to the zero waste campaign.<br />
Thanks to a year of planning and the efforts of 40 volunteers, threequarters<br />
of the almost 15 tonnes of waste material generated in the<br />
three-day festival in 2008 was diverted from landfi ll for recycling or<br />
composting.<br />
TARANAKI – WHERE WE STAND<br />
<strong>Taranaki</strong> <strong>Regional</strong> Coun cil<br />
Volunteers sort some of the 39 tonnes of e-waste during the <strong>Taranaki</strong> eDay<br />
collection. New Plymouth, October 2008.<br />
their waste as a result of either the visit or the follow-up phone calls,<br />
mainly by starting recycling or increasing the range of materials recycled.<br />
<strong>Council</strong>s, too, are getting on board with in-house waste minimisation<br />
programmes, such as paper re-use and recycling, recovery of canteen<br />
wastes for composting, and mulching of vegetation/landscape wastes.<br />
The National Environment Standards for Air Quality (2004) now bans the<br />
use of un-consented school incinerators. The <strong>Taranaki</strong> <strong>Regional</strong> <strong>Council</strong><br />
assisted a Ministry for Education review of waste disposal practices<br />
carried out by schools in the region, and identifi ed alternative waste<br />
disposal options for schools. In the light of this work, all schools in the<br />
New Plymouth and South <strong>Taranaki</strong> districts now have recycling bins and<br />
free kerbside recyclable collection services, and schools in Stratford<br />
District are provided with recycling bins on request. All schools in<br />
Festival food sellers were required to use recyclable or biodegradable<br />
packaging and utensils, recycling centres were set up around the<br />
Bowl of Brooklands site and the volunteers were busy both behind<br />
the scenes and also out the front, helping festival patrons sort their<br />
rubbish.<br />
As befi tting a festival that promotes harmony, patrons were happy to<br />
co-operate and impressed by the resulting cleanliness of the site.<br />
The <strong>Taranaki</strong> Arts Festival Trust Chief Executive, Suzanne Porter, said<br />
the effort was hard work but very worthwhile.<br />
“We were really impressed with the volunteer support. Their<br />
enthusiasm was contagious and the concept caught on among<br />
everyone at the festival – patrons, artists, traders and staff.<br />
“We’re also conscious we’ve set a benchmark for other large events,<br />
locally and nationally. People who were at WOMAD will be expecting<br />
to see this elsewhere, so event organisers need to take notice.”<br />
The operation was supported by the Ministry for the Environment<br />
Sustainable Management Fund, and the success of the Trust and<br />
the volunteers was marked with a <strong>Taranaki</strong> <strong>Regional</strong> <strong>Council</strong><br />
Environmental Award.<br />
<strong>Taranaki</strong> <strong>Regional</strong> Coun cil
BENCHTOP COMPOSTING<br />
NOT A LOT OF ROT<br />
You’ve heard of desktop publishing, but how about benchtop<br />
composting?<br />
It’s an idea whose time may have come, if the results of a South<br />
<strong>Taranaki</strong> District <strong>Council</strong> trial are anything to go by.<br />
Solid Waste Supervisor Clive Margetts found enthusiastic support<br />
during the trial in early 2008, when 40 of his <strong>Council</strong> colleagues used<br />
specially designed benchtop composting units at home for 10 weeks.<br />
The compact “Biobins” are well ventilated and have breathable,<br />
biodegradable liners which reduce odour and allow the content to<br />
dehydrate, and thus shrink and become less heavy. The bag and its<br />
contents can be put straight into the garden compost.<br />
“The trial was a big success,” said Clive. “They all liked using the bins<br />
and they all wanted to keep on using them.”<br />
The ‘guinea pigs’ included the <strong>Council</strong>’s Environment and Information<br />
Services Group Manager, Graham Young, who said the Biobin proved<br />
fantastic.<br />
“The capacity of the bin was excellent and the fact that there was no<br />
smell whatsoever was also excellent,” he said.<br />
<strong>Taranaki</strong> have ceased use of their incinerators. <strong>Council</strong>s have presented<br />
workshops and guidelines on waste management to teachers, students<br />
and property managers.<br />
(D) RESOURCE CONSENT MANAGEMENT<br />
The past 15 years have seen a staged reduction in the number of<br />
operational municipal landfi lls in the region, so that the days of the<br />
local rubbish tip are now well past. In 1992 there were 19 operational<br />
municipal wastes disposal sites in the region. By 1998 the number had<br />
reduced to eight. In 2008 there are three – one regional facility, and two<br />
others with consents allowing only restricted or emergency use (in case<br />
of forced temporary closure of the Colson Road landfi ll facility).<br />
Closed landfi lls have been rehabilitated, with minimal (and reducing)<br />
residual adverse effects on either public health or the environment.<br />
Consenting and monitoring at closed sites continue until it is established<br />
that any effects are, and will be, negligible. There are currently 18<br />
consented closed sites in the region.<br />
The Colson Road landfi ll is expected to reach capacity around 2015,<br />
although this depends on the success of measures such as diversion of<br />
organic waste to composting which will extend its life. To secure access<br />
to landfi ll capacity in the future, all consents are in place for a site at<br />
A compact ‘Biobin’.<br />
Clive is now working on ways to bring the Biobins into wider use,<br />
perhaps starting with those who already pay for a fortnightly green<br />
waste collection by the <strong>Council</strong> contractor.<br />
“It would cost us virtually nothing and for each household using them,<br />
it would get three to six kilograms out of the waste stream each week,”<br />
he said. “That’s a good return.”<br />
Possible future development of a commercial composting facility may<br />
allow Biobin bags to be disposed of in greenwaste wheelie bins.<br />
Eltham to be opened and operated as a regional facility. This has been<br />
achieved since the 2003 State of the Environment Report. The facility is<br />
estimated to have a lifetime capacity of 25 years at current (2007) fi lling<br />
rates for the Colson Road landfi ll. Before this landfi ll is committed, a<br />
further review will determine whether a regional landfi ll within <strong>Taranaki</strong><br />
remains the best option for disposal. By maintaining local authority<br />
ownership of landfi ll facilities now and into the future for the region, the<br />
councils have avoided a commercial monopoly control of landfi ll access<br />
in the region.<br />
In the 2003 State of the Environment Report, the <strong>Taranaki</strong> <strong>Regional</strong><br />
<strong>Council</strong> noted its intention that by 2005 all cleanfi lls in <strong>Taranaki</strong> would<br />
comply with cleanfi ll disposal guidelines. This has subsequently been<br />
achieved, and there has been a further refi nement of best cleanfi ll<br />
consenting and operational practice in 2007. Cleanfi ll operators<br />
are expected to meet best current national practice. In some cases<br />
cleanfi lling serves also to rehabilitate and landscape old quarries.<br />
Through its regional planning documents, the <strong>Council</strong> pursues regionwide<br />
consistency in siting, management practices, consent conditions<br />
and environmental performance for all existing and future landfi ll<br />
and cleanfi ll facilities. Annual monitoring of consent conditions at all<br />
municipal and privately-owned landfi lls and cleanfi lls is carried out to<br />
assess their environmental effects.<br />
Rob Tucker<br />
State of the Environment Report 2009<br />
255
256<br />
WASTE<br />
Collette Holgate and her brother Jock Holgate sort waste for recycling.<br />
THE LIFE OF A ‘GARBOLOGIST’<br />
By Collette Holgate<br />
My role involves sorting all the waste delivered to the Stratford Waste<br />
Transfer Station.<br />
When people think of rubbish dumps or waste transfer stations, they<br />
tend to think of big burly men, machines, mud and gross things like<br />
rats. Well, I’m female and 5 foot nothing. My shed is clean and tidy<br />
and my yard looks like a park. I conduct school tours and give the<br />
children puzzles, games and certifi cates for being helpful.<br />
This is more than ‘just a job’ to me. I believe that putting a bit of thought<br />
into what could be done with ‘rubbish’ is good for the environment, as<br />
well as benefi ting the community – particularly people in need.<br />
(E) SUMMARY OF PROGRESS<br />
Progress implementing regional objectives and policies on solid waste<br />
management is summarised in Table 9.1. The material in this table is<br />
based on the targets set out in the <strong>Regional</strong> Waste Strategy.<br />
9.3 HOW DO WE COMPARE?<br />
The New Zealand Waste Strategy was released in 2002 by the Ministry<br />
for the Environment. It set out 30 targets intended to provide improved<br />
waste management, minimisation, and resource effi ciency. Progress on<br />
implementing the New Zealand Waste Strategy has been evaluated 6 .<br />
The regional progress towards the targets in both the national and<br />
regional waste strategy documents was reviewed, and compared with<br />
the national report 7 .<br />
The review showed a considerable range of waste management activities<br />
being undertaken across the region, with good progress towards a better<br />
and more effective level of service. It showed that the region is generally<br />
doing as well as, if not better than other regions.<br />
The management of ‘contaminated land’, of cleanfi lls and landfi lls,<br />
and of waste water treatment in the region, looks to be well ahead of<br />
the national scene. <strong>Taranaki</strong> appears to be at the forefront of certain<br />
initiatives such as the completion of several regional hazardous waste<br />
collections (particularly emphasising organochlorines such as DDT and<br />
6 Ministry for the Environment, 2006. Targets in the New Zealand Waste Strategy. 2006 Review of Progress<br />
7 <strong>Taranaki</strong> <strong>Regional</strong> <strong>Council</strong>, 2007. Agenda Item presented to the Policy and Planning committee meeting on 30 August 2007.<br />
TARANAKI – WHERE WE STAND<br />
Rob Tucker<br />
There are three Rs in my job – reduce, recycle and re-use.<br />
I reduce by separating out material which could be used in other ways –<br />
for example, wood which could be used in domestic fi res or for building<br />
and other purposes.<br />
A lot of the material left at the Station can be recycled – plastic, glass,<br />
cardboard and paper. After sorting, this is collected by a commercial<br />
waste management company.<br />
I also receive lots of things which can be re-used. I send blankets,<br />
clothing, toys and furniture to a variety of charities.<br />
I believe my three Rs are the future. Over the past few years, people<br />
coming to the Transfer Station have become much more aware and<br />
supportive of what we are doing here.<br />
I have a sign on my desk which says, “Don’t be a tosser if it’s recyclable.”<br />
Which are you?<br />
An employee of Waste Management Ltd, Collette has sole charge of<br />
the Stratford Transfer Station which is notable for the absence of litter<br />
and odour and for its fl owers, shrubs and sculptures – all of the latter<br />
retrieved from material brought to the station for disposal.<br />
Passionate about her work and about the wider environmental issues it<br />
involves, Collette demonstrates how the actions of one person can make<br />
a dramatic difference.<br />
She wrote this article for a corporate publication.<br />
Mulching green waste.<br />
dieldrin), the trialing of agricultural plastics recovery, and the established<br />
vermiculture industry and application of chicken litter and drilling wastes<br />
to land for soil enhancement in the region. Waste tyre disposal is<br />
problematic elsewhere but in <strong>Taranaki</strong> there continues to be a high rate<br />
of utilisation on farms and a tyre granulation process recovering crumbed<br />
rubber for re-processing is about to become operational. Increased<br />
diversion and recovery of organic wastes appear to be viable options to<br />
pursue further in <strong>Taranaki</strong>. There is a high level of co-ordination and joint<br />
programming between the four councils of the region.<br />
Rob Tucker
Table 9.1: Summary of progress: implementing regional objectives and policies for solid waste.<br />
Issue What do we want to achieve? What are we doing about it ? Where are we at ?<br />
Quantities of solid waste Reduction of the relative quantities<br />
of residual waste for disposal, and<br />
enhance waste minimisation and<br />
resource recovery for the region<br />
Adverse effects of disposal of solid<br />
waste<br />
Management of hazardous and<br />
special wastes<br />
Availability and utilisation of<br />
environmentally appropriate<br />
disposal options for each type of<br />
waste<br />
Reduction in volume and<br />
improvement in management<br />
By December 2003 a <strong>Regional</strong><br />
Waste Minimisation Offi cer will<br />
be appointed to facilitate reaching<br />
the targets of the <strong>Regional</strong> Waste<br />
Strategy.<br />
Developing waste minimisation<br />
and management initiatives with<br />
industry in <strong>Taranaki</strong> including the<br />
dairy and petrochemical industries.<br />
District councils will continue to<br />
make provision for transfer stations<br />
throughout <strong>Taranaki</strong> that provide<br />
cost incentives for the diversion of<br />
recyclables and green waste from<br />
landfi ll.<br />
Working with the commercial<br />
sector to reduce organic waste<br />
going to landfi ll by 50% of 2002<br />
levels by December 2007.<br />
All councils will develop and<br />
implement in-house waste<br />
minimisation programmes for the<br />
facilities they manage to show<br />
lead initiatives toward achieving<br />
the targets of the <strong>Regional</strong> Waste<br />
Strategy.<br />
By December 2005 it is anticipated<br />
that there will only be one<br />
operational landfi ll in <strong>Taranaki</strong> at<br />
Colson Road that will:<br />
- continue to meet industry best<br />
practice standards;<br />
- continue to enforce the policy<br />
of non-acceptance of hazardous<br />
waste at landfi lls; and<br />
- continue to divert inert material<br />
where possible.<br />
District <strong>Council</strong>s will review their<br />
cost pricing policy from time to time<br />
By January 2004 all cleanfi ll<br />
consents will be amended to<br />
comply with cleanfi ll disposal<br />
guidelines.<br />
District councils will provide at<br />
least one dedicated hazardous<br />
waste collection facility per district.<br />
<strong>Regional</strong> Waste Minimisation<br />
Offi cer (RWMO) position fi lled<br />
since July 2003.<br />
RWMO engages with at least<br />
six sectors each year. Dairy and<br />
petrochemical initiatives include<br />
landfarming and composting of<br />
oily wastes, and advocacy for<br />
silage wrap and agrichemical<br />
container recycling schemes.<br />
Transfer stations provide free or<br />
reduced charges for recyclables<br />
and green waste.<br />
Commercial schemes for recycling<br />
organic wastes in place. Joint<br />
STDC-Waste Management<br />
proposal for all green waste<br />
in South <strong>Taranaki</strong> under<br />
consideration.<br />
All councils have in-house<br />
programmes.<br />
The Colson Road landfi ll a<br />
regional facility that achieves a<br />
‘high’ environmental performance<br />
rating from the <strong>Council</strong> in respect<br />
of consent compliance, it does not<br />
accept hazardous wastes.<br />
District council kerbside<br />
collections promote diversion<br />
of recyclables. Landfi ll pricing<br />
provides incentive for diversion of<br />
inert material.<br />
District council waste services<br />
refl ect actual costs.<br />
Cleanfi ll consents reviewed in<br />
2003-04 to refl ect MfE guidelines,<br />
and again in 2007 to refl ect best<br />
practice.<br />
<strong>Regional</strong> hazardous waste<br />
collections since 1991, current<br />
drop-off facilities in each<br />
district. Over 40 tonnes removed<br />
from region to date (farms,<br />
households), estimates of two<br />
tonnes left. Electronic waste<br />
collection undertaken in 2008.<br />
The <strong>Council</strong> delivers both RMA<br />
and HSNO advice, controls and<br />
monitoring.<br />
State of the Environment Report 2009<br />
257
258<br />
WASTE<br />
In other matters such as waste oil, glass, old paint recovery, construction<br />
and demolition wastes, and electrical and electronic wastes, the region’s<br />
dispersed population, small population base, and distance from major<br />
processors and markets, impede the development of a sustainable<br />
waste recovery industry. However, several smaller businesses operating<br />
transfer stations, or otherwise dealing with waste, are extracting<br />
increasing amounts of recyclable or reusable materials such as timber.<br />
With increased commercial involvement in waste management, local<br />
authorities have less direct control of what happens, and have to rely<br />
on advocacy, education, and promotion. Uptake of cleaner production<br />
principles by commerce and industry remains just as problematic in<br />
<strong>Taranaki</strong> as elsewhere.<br />
Table 9.2: National Landfi ll Cenus and the Colson Road information.<br />
National data<br />
<strong>Taranaki</strong> data<br />
Total number of operating sites<br />
<strong>Taranaki</strong><br />
Sites with consent to operate<br />
<strong>Taranaki</strong><br />
Leachate management system<br />
Engineered liner<br />
Colson Rd<br />
Leachate collection system<br />
Colson Rd<br />
Stormwater management system<br />
Stormwater diversion<br />
Colson Rd<br />
Stormwater monitoring<br />
Colson Rd<br />
Stormwater treatment<br />
Colson Rd<br />
Landfi ll gas management system<br />
Landfi ll gas monitoring<br />
Colson Rd<br />
Landfi ll gas collection (fl aring or benefi cial use)<br />
Colson Rd<br />
Landfi ll fi res<br />
Colson Rd<br />
Hazardous waste management<br />
Hazardous waste accepted<br />
Colson Rd<br />
Quantifying waste; disposal charges<br />
Measuring the quantity of waste<br />
Colson Rd<br />
Disposal charges<br />
Colson Rd<br />
8 Ministry for the Environment, 2007. The 2006-07 National Landfi ll Census.<br />
9 Ministry for the Environment, 2007. Environment New Zealand.<br />
TARANAKI – WHERE WE STAND<br />
1995 1998-99 2002 2006-07<br />
327<br />
8<br />
-<br />
8<br />
-<br />
no<br />
13%<br />
yes<br />
41%<br />
yes<br />
-<br />
yes<br />
9%<br />
no<br />
3%<br />
yes<br />
-<br />
vented (2)<br />
52%<br />
no<br />
33%<br />
No (must be rendered<br />
non-hazardous)<br />
39%<br />
yes<br />
-<br />
yes<br />
Notes: – information not requested<br />
(1) one regional landfi ll, two others with minimal use/emergency use only<br />
(2) re-use considered – not economically viable<br />
Information has been gathered nationally on the siting, design,<br />
monitoring and operation of landfi lls 8 . Data from the census is reported<br />
in Table 9.2. The relevant information for <strong>Taranaki</strong> or specifi cally for the<br />
Colson Road Landfi ll has been inserted for purposes of comparison.<br />
Some regional comparisons can be made with the national state of<br />
waste management 9 . <strong>Regional</strong>ly the amount of wastes landfi lled from<br />
all sources is equivalent to about 604 kg per person per year. This is 23%<br />
lower than the national average of 790 kg per person per year. This could<br />
potentially be explained by limited manufacturing industry in the region,<br />
lower generation of construction and demolition wastes than some<br />
other regions, and the proliferation of cleanfi lls.<br />
209<br />
8<br />
157<br />
8<br />
115<br />
-<br />
104<br />
1<br />
60<br />
1 (1)<br />
60<br />
3<br />
4% 20% 54%<br />
yes<br />
35% 47% 77%<br />
yes<br />
67% 74% -<br />
yes<br />
23% 50% -<br />
yes<br />
27% 36% -<br />
yes<br />
11% 27% -<br />
yes<br />
5% 10% 22%<br />
vented (2)<br />
24% 17% 0%<br />
no<br />
20% - 50%<br />
No (must be rendered<br />
non-hazardous)<br />
63% 83% 93%<br />
yes<br />
45% 82% 93%<br />
yes
Photo: Rob Tucker<br />
CHAPTER 10<br />
ENERGY<br />
259
260<br />
AT A GLANCE<br />
ENERGY<br />
<strong>Taranaki</strong>, the energy province, produces energy, from both nonrenewable<br />
fossil fuels (oil, gas, coal) and from renewable sources<br />
such as water (hydro-electricity), wind, solar or biomass. The following<br />
summarises the key facts about <strong>Taranaki</strong>’s production and use of energy:<br />
all of the oil and gas produced in New Zealand is from <strong>Taranaki</strong>;<br />
<strong>Taranaki</strong> uses 3.2% of the total energy used in New Zealand;<br />
477 resource consents have been issued by the <strong>Taranaki</strong> <strong>Regional</strong><br />
<strong>Council</strong> relating to petroleum exploration activities over the past fi ve<br />
years and 48 relate to production stations;<br />
four hydroelectric power generation schemes in <strong>Taranaki</strong> can produce<br />
up to 47 megawatts;<br />
<strong>Taranaki</strong> has currently no wind farms, although one has been<br />
proposed in South <strong>Taranaki</strong>;<br />
industry uses 38% of all energy used in <strong>Taranaki</strong>, with households<br />
using the next greatest proportion (28%);<br />
petrol use in <strong>Taranaki</strong> has remained relatively stable over the past six<br />
years but use of diesel has increased;<br />
signifi cantly more use is made of mains gas in <strong>Taranaki</strong> for home<br />
heating (35%) than across New Zealand as a whole (13%); and<br />
little is known of the state of energy effi ciency in <strong>Taranaki</strong> compared<br />
to the rest of New Zealand as no regional data is collected.<br />
Energy production and use are primarily managed by Central<br />
Government (e.g. the Ministry of Economic Development). Two national<br />
level strategies guide energy development, transmission and use: The<br />
New Zealand Energy Strategy to 2050 and the Energy Effi ciency and<br />
Conservation Strategy. At the local level, energy, and effects associated<br />
with the production of energy, are managed under the Proposed<br />
<strong>Regional</strong> Policy Statement, and regional and district plans.<br />
TARANAKI – WHERE WE STAND
State of the Environment Report 2009<br />
261
262<br />
ENERGY<br />
Maui A production platform and supply vessel, offshore from Opunake.<br />
TARANAKI<br />
THE ENERGY PROVINCE<br />
Energy in the scientifi c sense of the term, is the capacity of something to<br />
do work and overcome resistance. In everyday usage the word energy is<br />
usually taken to mean a source of power, such as electricity for industrial<br />
processes and home heating or petrol and diesel for our cars. Energy<br />
is derived from other natural and physical resources such as nonrenewable<br />
fossil fuels (oil, gas, coal) or from renewable sources such<br />
as water (hydroelectricity), wind, solar or biomass.<br />
The <strong>Taranaki</strong> <strong>Regional</strong> <strong>Council</strong> and the region’s three district councils<br />
have responsibilities under the Resource Management Act 1991 to<br />
promote the sustainable management of natural and physical resources<br />
(which includes energy) when carrying out their environmental<br />
management functions. Recent amendments to the Act require<br />
greater consideration of the benefi ts to be derived from the use and<br />
development of renewable energy. Wider issues concerning the security<br />
of energy supplies and ensuring competitive and effi cient pricing<br />
of energy production, distribution and supply are the responsibility<br />
of Central Government agencies such as the Ministry of Economic<br />
Development, the Electricity Commission, the Energy Effi ciency and<br />
Conservation Authority and Transpower (NZ) Ltd.<br />
Total primary energy supply is the amount of energy available for<br />
energy transformation (e.g. natural gas to electricity) and end use. New<br />
Zealand’s total primary energy supply in 2006 was 741 petajoules (PJ) 1 .<br />
A petajoule is a unit of energy roughly equivalent to what a coastal<br />
oil tanker carries – about 20,000 tonnes of oil. This was a drop in the<br />
primary energy supply of 0.8% from 2005, and was largely a result of a<br />
decrease in the supply of oil and coal from New Zealand. Most of New<br />
Zealand’s primary energy supply is provided by non-renewable fossil fuels<br />
namely oil and oil products (37%) (most of which is imported), gas (21%)<br />
and coal (12.5%). A further 12% is supplied by geothermal, and by hydro<br />
(11%), and other renewables such as wind, biogas and wood (6.3%).<br />
1 Ministry of Economic Development, New Zealand Energy Data File 2007.<br />
2 Ministry of Economic Development, 2006. New Zealand’s Energy Outlook to 2030.<br />
3 New Zealand Government, 2007. New Zealand Energy Strategy to 2050. Powering Our Future.<br />
TARANAKI – WHERE WE STAND<br />
Rob Tucker<br />
Consumer energy is that used by fi nal consumers. It excludes energy<br />
used or lost in transforming the energy and in bringing the energy to<br />
consumers. Total consumer energy demand in New Zealand in 2006 was<br />
499 PJ, an increase of 1.5% from 2005 1 . Oil and oil products make up<br />
51% of consumer energy demand and most of this (93%) is imported.<br />
Transport accounted for the largest share of consumer energy in 2006 –<br />
about 44% of the total, and accounted for the largest increase – up 4%<br />
from 2005. The next largest consumer in 2006 was the industrial sector<br />
which used 30% of the total consumer energy followed by residential<br />
(12.6%), commercial (9.1%) and agriculture (4.3%).<br />
Demand for energy will inevitably increase over time. Under businessas-usual<br />
assumptions with no major changes in policy, New Zealand’s<br />
energy use is projected to increase by 35% by 2030 with demands for<br />
transport predicted to increase the most. Under these assumptions,<br />
oil use would grow by about 35%, geothermal energy supply by about<br />
75% and wind energy by about 1000% 2 . However this scenario is not<br />
the Government’s desired outcome. Under the New Zealand Energy<br />
Strategy 3 the Government proposes to increase the proportion of<br />
renewable energy used in electricity generation and transport, reduce<br />
reliance on imported fossil fuels, increase energy effi ciency and reduce<br />
emissions of greenhouse gases from the energy sector.<br />
The challenges for <strong>Taranaki</strong> in the years ahead are to produce energy<br />
effi ciently and environmentally sustainably from a variety of sources, and<br />
then use that energy wisely.<br />
10.1 WHAT IS THE CURRENT<br />
STATE OF ENERGY IN TARANAKI?<br />
(A) NON-RENEWABLE ENERGY IN TARANAKI<br />
Oil and gas<br />
All of New Zealand’s producing oil and gas fi elds are located in the<br />
<strong>Taranaki</strong> basin – an area of about 100,000 square kilometres. Most of the<br />
basin is offshore although the majority of producing fi elds are onshore.<br />
Figure 10.1 Oil production by fi eld for 2006.<br />
SOURCE: Ministry of Economic Development, 2007
Vector K _ apuni gas treatment plant (foreground) and Ballance ammonia-urea plant, K _ apuni.<br />
Most fi elds, including the large M _ aui and K _ apuni fi elds, contain mainly<br />
gas but nearly all fi elds produce a proportion of oil and condensate.<br />
The main offshore fi elds are the M _ aui, Pohokura, Kupe, Maari and T _ u _ ı<br />
fi elds while onshore fi elds include K _ apuni, McKee, Kaimiro, Ng _ atoro,<br />
Tariki/Ahuroa, Waihapa/Ngaere, Stratford, Mangahewa and Rimu/Kauri<br />
fi elds (see Figure 2.8 in Chapter 2: <strong>Taranaki</strong> People and Place). Recent<br />
discoveries include the onshore Surrey and Kahili fi elds (2002) and the<br />
offshore T _ u _ ı oil fi eld (2003).<br />
Oil production is dominated by the offshore M _ aui fi eld which began<br />
producing oil in 1979 and supplied 56% of New Zealand’s total oil<br />
production in 2006. The K _ apuni fi eld provides 9% of total oil production,<br />
while the McKee fi eld provides 6%. The remaining 29% is produced by a<br />
number of smaller fi elds (Figure 10.1).<br />
In 2006, total New Zealand production of crude oil and condensate (and<br />
naphtha) was 38.9 PJ, a decrease of 2.4% from 2005. New Zealand’s oil<br />
production from the <strong>Taranaki</strong> fi elds continued to decline from the peak in<br />
1997 mainly as a result of declining production in the M _ aui fi eld<br />
(Figure 10.2).<br />
Figure 10.2 Annual crude oil, condensate and naphtha production by Field.<br />
4 www.crownminerals.govt.nz/cms/petroleum/overview<br />
Rob Tucker<br />
SOURCE: Ministry of Economic Development, 2007<br />
In 2006, 86% of all our crude oil, condensate and naphtha was<br />
exported, much of it to Australia, Japan and Korea, because <strong>Taranaki</strong>’s<br />
higher quality oil and condensate can be sold at higher prices on the<br />
international market. The remaining 14% was used for feedstock at<br />
Marsden Point refi nery to produce refi ned products such as petrol, diesel<br />
and fuel oil.<br />
Estimated reserves of 55 million barrels of oil remain in existing<br />
producing fi elds and an estimated 147 million barrels in known nonproducing<br />
fi elds 4 . Oil production is set to increase signifi cantly in 2008-09<br />
as new developments such as Maari and Kupe come on line.<br />
As with oil production, all gas produced in New Zealand comes from the<br />
<strong>Taranaki</strong> region. The M _ aui fi eld produced 57.1% of all gas produced in<br />
2006. Other major producers were the K _ apuni fi eld (17.3%) and Pohokura<br />
(8.6%) which commenced production in 2006 (Figure 10.3).<br />
Total gas produced in <strong>Taranaki</strong> in 2006 was 163 PJ, an increase of 2%<br />
over 2005. Total annual gas production by fi eld is shown in Figure 10.4.<br />
Figure10.3 Gas production by fi eld for 2006.<br />
Figure10.4 Annual total gas production by fi eld.<br />
State of the Environment Report 2009<br />
SOURCE: Ministry of Economic Deavelopment, 2007 SOURCE: Ministry of Economic Development, 2007<br />
263
264<br />
ENERGY<br />
Figure 10.5 Gas consumption by sector for 2006.<br />
About 56% of New Zealand’s natural gas produced during 2006 was<br />
used for electricity generation (Figure 10.5). Contact Energy Ltd (Otahuhu<br />
B, <strong>Taranaki</strong> Combined Cycle at Stratford and New Plymouth Power<br />
Station) and Genesis Power Ltd (Huntly Power Station) were the main<br />
thermal electricity generators in New Zealand using natural gas. The<br />
amount of gas used for electricity generation increased by 12% from<br />
2005 to 2006.<br />
In December 2007 Contact Energy Ltd decided to permanently close the<br />
New Plymouth Power Station because of asbestos-related health and<br />
safety issues but the station was partly reopened in mid-2008 to meet<br />
electricity demand. Final decisions on the decommissioning of the station<br />
are still to be made. It was commissioned in 1976 and because of its<br />
age and relative ineffi ciency operated largely when other plants were<br />
not operating or when demand for electricity was high. By contrast, the<br />
newer combined cycle power station at Stratford completed in 1998, at<br />
55.5%, has one of the best fuel effi ciencies of New Zealand’s thermal<br />
power stations 5 .<br />
Industrial users throughout the North Island used 20.2% of gas produced<br />
in 2006, and the petrochemical sector another 15%. The petrochemical<br />
sector use of gas included Methanex’s methanol plants at Motunui and<br />
the Waitara Valley and the Ballance Agri-Nutrients ammonia/urea plant<br />
at K _ apuni. Methanex New Zealand produced about 400,000 tonnes of<br />
methanol during 2006, up from 340,000 tonnes in the previous year.<br />
This was despite the Motunui Plant having shut down in November<br />
2004 because of a lack of natural gas supply at a competitive price, and<br />
the temporary closure of the Waitara Valley Plant in July 2006 (which<br />
re-opened in September 2006). Methanex New Zealand has since reopened<br />
its Motunui Plant.<br />
The residential sector accounted for about 5% of all gas used in 2006,<br />
with the number of residential consumers throughout the North Island<br />
totalling about 229,000. The remaining 3% of gas was used by about<br />
8,000 commercial users (including transport) spread throughout the<br />
North Island.<br />
Estimated gas reserves remaining in currently producing fi elds are of the<br />
order of 1,048 billion cubic feet with a further 1,144 billion cubic feet of<br />
estimated reserves in non-producing fi elds 6 . Gas yields from the maturing<br />
M _ aui fi eld have been declining from the peak recorded in 2001.<br />
5 www.contactenergy.co.nz<br />
6 www.crownminerals.govt.nz/cms/petroleum/overview<br />
TARANAKI – WHERE WE STAND<br />
SOURCE: Ministry of Economic Development, 2007<br />
The <strong>Taranaki</strong> Basin is under explored by international standards and<br />
exploration interest in the region for both oil and gas remains high.<br />
Responsibility for issuing permits to undertake prospecting and<br />
exploration of petroleum minerals, such as oil and gas, and for issuing<br />
permits and licences to mine oil and gas resources, lies with the Ministry<br />
of Economic Development. The various permits and licences to explore<br />
for and extract petroleum resources are processed by the Ministry<br />
under the Crown Minerals Act 1991. Table 10.1 shows the number of<br />
petroleum prospecting, exploration and mining permits and licences, and<br />
the number of wells drilled between 2002 and 2006.<br />
Table 10.1 National summary of petroleum exploration and mining activity 2002-06.<br />
Number (national<br />
totals)<br />
2002 2003 2004 2005 2006<br />
Wells drilled<br />
Petroleum prospecting<br />
21 16 33 34 30<br />
and exploration<br />
permits<br />
82 86 105 104 79<br />
Petroleum mining<br />
permits and licences<br />
SOURCE: Ministry of Economic Development, 2007.<br />
12 12 14 19 21<br />
Almost all wells drilled and petroleum permits issued were in the<br />
<strong>Taranaki</strong> Basin, although in the past fi ve years an exploration well<br />
was drilled in the offshore Canterbury Basin and some prospecting or<br />
exploration activities have been undertaken in the Great South Basin<br />
offshore from Southland and South Otago and in the Ruakumara Basin<br />
off the North Island’s East Coast.<br />
Another indicator of the state and pressures on oil and gas resources<br />
in the region is the number of resource consents issued under the<br />
Resource Management Act 1991. Table 10.2 shows the number of<br />
resource consents issued by the <strong>Taranaki</strong> <strong>Regional</strong> <strong>Council</strong> for oil and<br />
gas exploration activities, and oil and gas production stations over the<br />
past fi ve years. These resource consents deal with the environmental<br />
effects of oil and gas exploration and production activities (for example,<br />
effects on water and air quality) and do not deal with managing the oil<br />
and gas resources themselves which is the responsibility of the Ministry<br />
of Economic Development.<br />
Table 10.2 Number of resource consents issued by the <strong>Taranaki</strong> <strong>Regional</strong> <strong>Council</strong><br />
for oil and gas exploration activities and production stations 2002-03 to 2006-07.<br />
Number of<br />
resource<br />
consents issued 1<br />
2002-03 2003-04 2004-05 2005-06 2006-07<br />
Petroleum<br />
exploration<br />
75 112 9022 138 62<br />
Production stations 16 8 8 9 7<br />
1 Includes water permits, discharge permits, land use consents and coastal permits.<br />
2 Excludes 68 changes to resource consents to refl ect changes to the Resource<br />
Management Act regarding greenhouse gas emissions reporting.<br />
In 2002-03 consents were issued to Swift Energy New Zealand Ltd for<br />
exploration sites associated with the onshore Kauri oil and gas fi eld
and 17 consents were issued to Shell Todd Oil Services Ltd for the<br />
offshore Pohokura gas fi eld development. Forty two consents were<br />
issued to Swift Energy NZ Ltd for exploration activities associated with<br />
the Manutahi exploration sites in South <strong>Taranaki</strong> in 2003-04, and six<br />
consents were issued for the Natural Gas Corporation New Zealand<br />
Kahili Production Station. Resource consents for a number of new<br />
onshore exploration wellsites across the region were issued in 2004-05<br />
and in 2005-2006. In 2004-05, 17 consents were issued to Origin Energy<br />
Resource (Kupe) Ltd for development of the offshore Kupe fi eld and<br />
associated onshore production station.<br />
Compliance by the oil and gas industry with the conditions of resource<br />
consents is generally very high. In 2006-2007 the <strong>Council</strong> carried out 135<br />
inspections of exploration wells, 80 inspections of producing wellsites<br />
and 72 inspections of production stations. In all cases activities were in<br />
compliance with resource consent conditions at the time of inspection<br />
and no re-inspections were required 7 .<br />
Coal<br />
The <strong>Taranaki</strong> Coal Region comprises fi ve coalfi elds mainly between<br />
Taumarunui and M _ okau on the west coast - M _ okau, Aria, Waitewhena,<br />
_ Ohura-Tangarakau and Retaruke. Only part of the M _ okau fi eld lies<br />
within the boundaries of the <strong>Taranaki</strong> local government region. Coal-inground<br />
resources in these fi elds total 380 million tonnes (2.4% of New<br />
Zealand’s total coal-in-ground resource) of which 173 million tonnes are<br />
estimated to be recoverable 9 . Most of the resources are in the M _ okau<br />
coalfi eld where there is potential for opencast and underground mining.<br />
Various exploration and mining feasibility assessments of the <strong>Taranaki</strong><br />
Coal Region took place in the early to mid-1980s. However, the relatively<br />
remote location of the coalfi elds and consequently high transport costs<br />
have limited development. A preliminary mining feasibility study of<br />
the M _ okau coalfi eld in 1985 for a 1,000 MW power station defi ned<br />
saleable reserves at 36 million tonnes opencast and 71 million tonnes<br />
underground 8 .<br />
(B) RENEWABLE ENERGY IN TARANAKI<br />
<strong>Taranaki</strong>’s climate, topography and other physical features mean that the<br />
region has a number of potential sources of renewable energy. The main<br />
sources are hydro, wind, solar, biomass, geothermal and marine.<br />
A number of barriers slow the uptake of renewable energy, particularly<br />
the high capital cost as projects must include the cost of fuel gathering<br />
as well as energy conversion. Some technologies are new and have not<br />
reached a stage of commercial application or do not yet have economies<br />
of scale in plant construction compared with conventional energy<br />
sources. Other potential constraining factors are long development<br />
times, competition with other users for the same resource and<br />
environmental impacts.<br />
Hydropower<br />
<strong>Taranaki</strong> currently has four hydroelectric power generation schemes in<br />
<strong>Taranaki</strong> with a total installed capacity of 47 megawatts (MW) (Table<br />
10.3). In addition, a small scheme in Normanby on the Waingongoro<br />
River is in the process of being recommissioned with a potential capacity<br />
to generate an additional 2 MW.<br />
Table 10.3 Developed hydro-electric schemes in <strong>Taranaki</strong>.<br />
Scheme Catchment area Scheme rating (MW)<br />
P _ atea P _ atea 30.7<br />
Opunake Waiaua 7.0<br />
Motukawa Manganui, Waitara 4.8<br />
Mangorei Waiwhakaiho 4.5<br />
Total 47.0<br />
SOURCE: Sinclair Knight Merz, 2006.<br />
A large number of rivers and streams fl ow off Mount <strong>Taranaki</strong> and out<br />
of the inland <strong>Taranaki</strong> hill country. However, development of large-scale<br />
hydroelectric power schemes is constrained by the relatively small<br />
river fl ows in the region’s waterways and the lack of topographical<br />
features where substantial head can be gained or sites that would<br />
allow diversion of fl ows to neighbouring catchments. Constraints are<br />
also imposed because large areas of the region are located in public<br />
conservation land which has signifi cant biodiversity values.<br />
There are opportunities for micro and mini schemes and hydrogeneration<br />
in the lower reaches of rivers at locations with steep river<br />
reaches or local drops.<br />
There have been a number of assessments of hydroelectric power<br />
generation potential in <strong>Taranaki</strong> over the years. One report concluded<br />
that the remaining hydro potential in <strong>Taranaki</strong> from schemes outside<br />
public conservation land was almost 60 MW in mini, small and medium<br />
scale projects 9 .<br />
Wind<br />
Wind power generation has become a signifi cant contributor to<br />
electricity generation in many parts of the world, especially Europe and<br />
the USA. There has been substantial growth in electricity generated<br />
by wind power in New Zealand in the past 10 years but the installed<br />
wind power capacity of 170 MW (in 2006) nationwide is still relatively<br />
low and provides only about 2% of New Zealand’s electricity needs.<br />
Predictions estimate that there is potential for 2000 MW of additional<br />
capacity from wind power in the next 10 years providing about 17% of<br />
New Zealand’s installed capacity 10 .<br />
There are currently no wind farms in the <strong>Taranaki</strong> region but some wind<br />
farm developers have shown interest in <strong>Taranaki</strong> as a possible area for<br />
Wind turbine.<br />
7 <strong>Taranaki</strong> <strong>Regional</strong> <strong>Council</strong>, 2007. Annual report: Compliance monitoring 2006-07.<br />
8 www.crownminerals.govt.nz/cms/coal<br />
9 Sinclair Knight Merz, 2006. Renewable Energy Assessment: <strong>Taranaki</strong> Region. Report to the Energy Effi ciency and Conservation Authority<br />
10 Electricity Commission quoted in Parliamentary Commissioner for the Environment, 2006.Wind Power, People and Place.<br />
Rob Tucker<br />
State of the Environment Report 2009<br />
265
266<br />
ENERGY<br />
development. In 2007, Waverley Wind Farm Ltd applied to the South<br />
<strong>Taranaki</strong> District <strong>Council</strong> to establish a 45-turbine wind farm (135 MW)<br />
on a coastal site on Stewart Road, Waverley. The application has yet to<br />
be heard by the South <strong>Taranaki</strong> District <strong>Council</strong>.<br />
Wind speeds in <strong>Taranaki</strong> are not among the highest in the country,<br />
which are generally found in the southern parts of the North Island.<br />
However, some areas of <strong>Taranaki</strong> are likely to have average wind<br />
speeds of above 8 metres/second which is currently the approximate<br />
minimum wind speed required for economic wind farms. The <strong>Taranaki</strong><br />
coastline is an area with suffi cient wind speeds, with generally more<br />
wind on the region’s western and southern coast.<br />
However, a range of other factors, such as the location of important<br />
natural features and landscapes, proximity to population and<br />
site availability, determine what areas are suitable for wind farm<br />
developments. It is unlikely that very large wind farms (greater than 300<br />
MW) will be developed in <strong>Taranaki</strong> due to the region’s even distribution<br />
of population and dwellings. However, it has been suggested that if<br />
carefully planned, approximately 300 MW of wind capacity could be<br />
installed over a number of years with environmental impacts that were<br />
broadly acceptable to local communities, focused along the South<br />
<strong>Taranaki</strong> coastline. The report also noted that the technically available<br />
wind potential in <strong>Taranaki</strong> is much great than 300 MW and that smallscale<br />
wind turbines (less than 10 KW) could be operated successfully in<br />
areas with lower wind speeds than those required for larger turbines.<br />
Solar<br />
Solar radiation (energy from the sun), in <strong>Taranaki</strong> is amongst the highest<br />
in New Zealand and higher than most areas in Europe (Table 10.4).<br />
Solar radiation for New Plymouth is approximately 1,500 Kilowatt-hours<br />
(kWh) per square metre per year. There are no large variations in solar<br />
radiation across the region. However, solar radiation varies greatly over<br />
the year, being highest in January and lowest in June.<br />
A standard solar thermal system can produce about 55% of a<br />
household’s water heating, and households account for 32% of<br />
electricity demand in the <strong>Taranaki</strong> region 11 . The installation of solar<br />
thermal technologies, therefore, has the potential to contribute to the<br />
region’s overall energy supply.<br />
Solar energy.<br />
TARANAKI – WHERE WE STAND<br />
Table 10.4 Typical values for total solar radiation for several sites.<br />
Site Solar radiation (kwh/m2/yr) Gisborne 1,497<br />
New Plymouth 1,485<br />
Kaitaia 1,469<br />
Paraparaumu 1,403<br />
Christchurch 1,360<br />
Invercargill 1,292<br />
Sydney 1,708<br />
Melbourne 1,473<br />
Germany 1,003<br />
SOURCE: Sinclair Knight Merz, 2006.<br />
Solar thermal systems are most economic when installed in new<br />
buildings. The number of occupied dwellings in <strong>Taranaki</strong> increased by<br />
more than 1,300 between 2001 and 2006. There is therefore potential to<br />
increase the uptake of solar thermal use in the <strong>Taranaki</strong> region.<br />
Given <strong>Taranaki</strong>’s high levels of solar radiation there is also potential to<br />
make increased use of passive solar heating through building orientation<br />
and design (both commercial and residential) to maximise the absorption<br />
of solar energy.<br />
Biomass<br />
The resources for the production and use of biomass as a renewable<br />
energy resource include agricultural crops, dairy and livestock farming,<br />
forestry and the wastes associated with production and processing.<br />
An assessment of renewable energy in <strong>Taranaki</strong> in 2006 concluded that<br />
while <strong>Taranaki</strong> does not have a particularly suitable climate for intensive<br />
cropping and is not therefore likely to be a major source of crop-derived<br />
biomass, there is potential for the production of ethanol or electrical<br />
energy from woody biomass derived from lower-grade forestry 11 . That<br />
report also noted potential biomass energy from the region’s dairy<br />
processing residues, meat processing by-products (e.g. tallow), municipal<br />
solid waste, and sewage biogas and sludge.<br />
One Lepperton piggery operator is in the process of developing a system<br />
to harness the biogas generated from piggery waste to enable electricity<br />
generation for use in the piggery. Biogas is a term that refers to gases<br />
extracted off anaerobic ponds which are made up of methane, CO2 and<br />
hydrogen sulphide.<br />
Geothermal<br />
11 Sinclair Knight Merz, 2006. Renewable Energy Assessment: <strong>Taranaki</strong> Region. Report to Energy Effi ciency and Conservation Authority.<br />
Rob Tucker<br />
<strong>Taranaki</strong> does not contain high temperature geothermal fi elds of the<br />
sort found in the Taup _ o Volcanic Zone. However, because of the region’s<br />
volcanic history, higher than average heat fl ows are found in parts of the<br />
region. Temperatures of over 150°C can occur in some deep oil and gas<br />
exploration wells. It is more likely however that the temperatures and<br />
fl ow rates obtained from geothermal sources in <strong>Taranaki</strong> would be too<br />
low for power generation but could be used for direct heat applications<br />
such as horticulture (greenhouse) heating, aquaculture, timber drying<br />
and space heating 11 .
Marine<br />
Various studies have been carried out throughout New Zealand on tidal<br />
energy and wave energy. Given weather patterns, water depths and wave<br />
energies in <strong>Taranaki</strong>, it has been estimated that the capacity potential<br />
from wave energy in <strong>Taranaki</strong> (ignoring environmental constraints and<br />
confl icts with other maritime users) is in the 1000 MW range 11 .<br />
Information available regarding tidal fl ow patterns in the region is<br />
limited but indicates that the tidal fl ows seen within the region are<br />
insuffi cient for power generation.<br />
Teacher Warwick Foy and student Abbie Fowler with the environmental award<br />
presented by <strong>Council</strong> Chairman David MacLeod (right).<br />
STUDENTS SWITCH ON TO<br />
ENERGY EFFICIENCY<br />
Inglewood High School has been supplementing the three Rs with<br />
CGE – conservation, generation and education – in the cause of<br />
energy effi ciency and sustainability.<br />
They were the three strands of a $100,000 Enviropower pilot<br />
programme at the 380-student school funded by Venture <strong>Taranaki</strong><br />
and the Ministry for the Environment supported by EcoInnovation<br />
and Enviroschools. It was believed to be the fi rst of its kind in New<br />
Zealand and it earned a <strong>Taranaki</strong> <strong>Regional</strong> <strong>Council</strong> Environmental<br />
Award in 2008.<br />
The most obvious sign of the project is a 10 m wind turbine in the<br />
school grounds, a renewable source for electricity that is used on<br />
site. The school also has two sets of solar panels – one to generate<br />
electricity and one for water heating.<br />
<strong>Taranaki</strong> <strong>Regional</strong> Coun cil<br />
Marine energy.<br />
According to teacher Warwick Foy, the turbine generates about 800<br />
watts on the average breezy day in Inglewood, while the photovoltaic<br />
solar panels can produce 300 to 1,000 watts and the hot water panels<br />
can supply the needs of the administration block.<br />
On the conservation side, the school has eliminated unnecessary<br />
hot water heating by wrapping, timing and in some cases turning off<br />
cylinders. More energy-effi cient lighting and computer systems have<br />
been introduced and power consumption is constantly monitored,<br />
allowing students and staff to see immediately the result of effi ciency<br />
measures.<br />
Tangible benefi ts of the year-long project included a 17% reduction in<br />
power consumption, exceeding the target of 15%. Biggest gains were<br />
made in daytime consumption, especially at weekends. Energy use is<br />
down 22% on weekdays and 57% in weekend daytime.<br />
But it’s the third strand of the project, education, that was probably<br />
the most important, said Warwick.<br />
Students have been involved in many aspects of the project –<br />
wrapping the cylinders, digging the turbine foundations and so on –<br />
and they have taken real ownership of the project.<br />
That zeal has been taken back to their homes, where they have been<br />
monitoring the family power consumption and generally raising<br />
awareness and promoting effi ciency. This will have real long-term<br />
benefi ts.<br />
The school also incorporated Enviropower aspects in geography,<br />
social studies, maths, science and art lessons, with a four-week social<br />
studies unit covering issues such as peak oil and gas, global warming,<br />
renewable and non-renewable energy and sustainability issues.<br />
The Enviropower project was a great learning experience for all<br />
involved, said Warwick. “As we enter into a future of energy and<br />
environmental uncertainty, it’s good to know that our students will be<br />
better prepared.”<br />
The programme was designed to support the Government’s Energy<br />
Strategy, and Venture <strong>Taranaki</strong> was delighted with the enthusiasm<br />
demonstrated by teachers, pupils and the wider school community<br />
in the project. Venture <strong>Taranaki</strong> is considering what the next stage<br />
will be.<br />
Rob Tucker<br />
State of the Environment Report 2009<br />
267
268<br />
ENERGY<br />
(C) ENERGY TRANSMISSION AND<br />
DISTRIBUTION IN TARANAKI<br />
The <strong>Taranaki</strong> region contains a highly developed energy transmission and<br />
distribution network associated particularly with its oil and gas resources<br />
and electricity generation.<br />
Pipelines link oil and gas fi elds to production stations such as those<br />
at _ Oaonui, Waihapa, Rimu and McKee and from there to Port <strong>Taranaki</strong>.<br />
High pressure gas pipelines distribute natural gas to major gas users in<br />
<strong>Taranaki</strong> and from <strong>Taranaki</strong> throughout the North Island. In total there<br />
Bar Manager Michelle Trainor in the chiller. Furlong Manager Margaret Bailey<br />
shows the length of the chiller before the area was reduced.<br />
ENERGY EFFICIENCY<br />
A COSY IDEA<br />
The Furlong Motor Inn in H _ awera has become a cosier place and it’s<br />
all in the name of energy effi ciency.<br />
In the past year, measures to cut electricity and gas consumption have<br />
included reducing the space in regular public use by a third – achieved<br />
by closing one bar, using another only for functions and moving the<br />
house restaurant into a smaller area.<br />
(D) ENERGY USE<br />
12 Energy Effi ciency and Conservation Authority. Energy End Use Database. www.eeca.govt.nz.<br />
TARANAKI – WHERE WE STAND<br />
are more than 3,400 km of high pressure gas transmission pipelines in<br />
New Zealand and more than 2,800 km of intermediate, medium and<br />
low pressure gas distribution pipelines connected to the high pressure<br />
transmission system.<br />
Transpower (NZ) Ltd, operates the national electricity transmission<br />
network (the national grid). In <strong>Taranaki</strong> this includes high voltage 220<br />
kV transmission lines from New Plymouth to Stratford, inland from<br />
Stratford, and south to Waverley. 110 kV lines link New Plymouth,<br />
Motunui, Stratford, H _ awera, Opunake and Waverley south.<br />
<strong>Taranaki</strong> consumes about 15.36 petajoules of energy per year, 3.2% of New Zealand’s total energy use (487.07 PJ) 12 . Table 10.5 shows energy<br />
use by sector and compares <strong>Taranaki</strong>’s energy use with the national totals.<br />
Table 10.5 <strong>Taranaki</strong> and New Zealand end use energy consumption (PJ)<br />
Sector<br />
<strong>Taranaki</strong> end use energy<br />
consumption<br />
Rob Tucker<br />
%<br />
<strong>Taranaki</strong> total<br />
The impact was almost immediate when heating, lighting, and bar<br />
fridges and bowsers were turned off in the redundant areas.<br />
The same idea was applied to two large walk-in chillers at the<br />
Furlong. A considerable amount of this space was previously underused<br />
but internal walls have now been installed, reducing by about<br />
two-thirds the area that needs to be kept refrigerated.<br />
These were big steps for the business to take but manager Margaret<br />
Bailey says they have paid off, with a 40% reduction in electricity<br />
costs over the past year.<br />
Other measures to reduce energy consumption have included<br />
insulating hot water pipes and raising staff awareness of the need to<br />
turn off lights and other electrical equipment when not in use.<br />
The Furlong has also cut by around half the amount of waste it sends<br />
to landfi ll, by paying greater attention to recycling possibilities and<br />
fi nding new users or uses for food scraps, used cooking oil and green<br />
waste.<br />
The establishment’s successes in energy effi ciency and waste<br />
minimisation were marked by a <strong>Taranaki</strong> <strong>Regional</strong> <strong>Council</strong><br />
Environmental Award this year.<br />
New Zealand end use<br />
energy consumption<br />
%<br />
New Zealand total<br />
Agriculture 2.28 14.8 35.31 7.3<br />
Commerce 1.11 7.2 54.55 11.2<br />
Household 4.31 28.1 157.99 32.4<br />
Industry 5.89 38.3 166.24 34.1<br />
Transport and storage 1.77 11.5 72.99 15.0<br />
Total 15.36 100.00 487.07 100.00<br />
Note: Data sourced from the Energy End Use Database maintained by the Energy Effi ciency and Conservation Authority. This database includes residential household<br />
transport energy consumption in the Household category. The Energy Data File maintained by the Ministry of Economic Development referred to at the beginning of this<br />
chapter includes residential household transport in the national transport category.
Table 10.5 shows that in <strong>Taranaki</strong> the greatest amount of energy is<br />
used in the industry and household categories. The amount used in the<br />
agricultural sector is twice the percentage used nationally and refl ects<br />
the strong agricultural base to the region’s economy. Energy use by<br />
industry in <strong>Taranaki</strong> is also higher than the national average refl ecting<br />
<strong>Taranaki</strong>’s petrochemical and related engineering industries. Energy use<br />
by households and commerce is proportionately lower.<br />
<strong>Taranaki</strong>’s use of fossil fuels for non-transport activities such as<br />
agricultural production is 35% of all energy used, signifi cantly higher<br />
than the national average of 25%. Our use of fossil fuels for transport is<br />
similar to the national average.<br />
Petrol sales in <strong>Taranaki</strong> have been relatively stable over the past six<br />
years with a total of 77.3 million litres used in 2006-07. Diesel sales<br />
have increased by about 12% from 65.1 to 73.2 million litres between<br />
2001-02 and 2006-07 (refer Figure 6.3 in Chapter 6: Atmosphere). In<br />
addition, the number of households that have access to two or more<br />
vehicles has increased over the past ten years contributing to an overall<br />
increase in petrol and diesel sales.<br />
National energy use fi gures show that household use annually is about<br />
13% of all energy used (excluding household transport). More than<br />
one-third (34%) of this is used to heat dwellings 13 . The fuel types used<br />
to heat dwellings are therefore an important indicator of energy use<br />
in <strong>Taranaki</strong>. Figure 10.6 shows the types of fuels to heat dwellings in<br />
<strong>Taranaki</strong> compared with New Zealand as a whole.<br />
Figure 10.6 shows that electricity is used to heat a little over half (51%)<br />
of dwellings in <strong>Taranaki</strong> compared to almost three quarters (71%) of<br />
private dwellings nationwide. Signifi cantly more use is made of mains<br />
gas in <strong>Taranaki</strong> (35%) than across New Zealand as a whole (13%).<br />
<strong>Taranaki</strong> residents also make more use of wood to heat their homes but<br />
use less bottled gas and coal. Over the past 10 years there has been<br />
Figure 10.6 Percentage of fuel types used to heat private occupied dwellings.<br />
13 New Zealand Government, 2007. New Zealand Energy Effi ciency and Conservation Strategy.<br />
DATA: Statistics NZ<br />
a decrease in the use of electricity and mains gas to heat homes in<br />
<strong>Taranaki</strong> and an increase in the use of bottled gas. There has also been<br />
an increase in use of solar heating in <strong>Taranaki</strong> in the past 10 years but<br />
the number of households concerned remains small (see also Chapter 6<br />
Air Quality).<br />
Transport (including household transport) uses 44% of energy used<br />
nationally. Over half of all transport energy is used by passenger<br />
transport modes (as opposed to freight transport).<br />
Figure 10.7 shows the most common means of travel to work for people<br />
in <strong>Taranaki</strong> compared to New Zealand as a whole. This shows that in<br />
<strong>Taranaki</strong>, as well as nationally, the main means of travelling to work is<br />
either the private car or company vehicle. The use of public transport<br />
in <strong>Taranaki</strong> is lower than for New Zealand generally refl ecting better<br />
public passenger transport services in large metropolitan centres where<br />
population numbers and densities make them a more viable transport<br />
option. <strong>Taranaki</strong> workers made greater use of motor cycles or walking<br />
and jogging to work than New Zealanders as a whole.<br />
(E) ENERGY EFFICIENCY<br />
Little is known of the state of energy effi ciency in <strong>Taranaki</strong> or whether<br />
<strong>Taranaki</strong> is any more or less energy effi cient than other parts of the<br />
country, as no regional level data is collected.<br />
One of the important energy effi ciency programmes run by the Energy<br />
Effi ciency and Conservation Authority (EECA), is the Energywise Home<br />
Grants Scheme. This programme gives grants for energy effi ciency<br />
improvements to low income families and landlords of properties with<br />
low income tenants. These improvements include underfl oor insulation,<br />
sealing, cylinder wraps and pipe lagging. Over 40,000 pre 1977 homes<br />
throughout New Zealand have been retrofi tted under the scheme. To date<br />
some 2,500 homes in <strong>Taranaki</strong> have been retrofi tted (see case study).<br />
Figure 10.7 Main means of travel to work as percentage of totals for <strong>Taranaki</strong><br />
and New Zealand.<br />
State of the Environment Report 2009<br />
DATA: Statistics NZ<br />
269
270<br />
ENERGY<br />
Harley Meston of Better Homes installing ceiling insulation.<br />
ENERGY-SAVER<br />
ON MORE THAN<br />
ONE LEVEL<br />
An ambitious, multi-agency project is under<br />
way to cut energy consumption in thousands<br />
of <strong>Taranaki</strong> homes, and at the same time<br />
reducing the energy expended by staff at<br />
hospitals and doctors’ clinics.<br />
The Healthy Homes <strong>Taranaki</strong> project,<br />
launched in January 2007, aims to have all<br />
the region’s houses insulated by 2014. That’s<br />
a big retrofi tting job as an estimated 29,000<br />
of <strong>Taranaki</strong> homes were built before 1977<br />
and therefore are without insulation.<br />
Besides reducing energy consumption and<br />
costs, the project’s aims include reducing<br />
respiratory illnesses and other serious health<br />
10.2 HOW IS<br />
ENERGY MANAGED<br />
IN TARANAKI?<br />
(A) CENTRAL GOVERNMENT<br />
Energy production, transmission, distribution<br />
and retail are undertaken by a range of<br />
private sector and state-owned enterprises<br />
working within commercial markets and a<br />
regulatory framework established by Central<br />
Government. Rights to Crown-owned minerals<br />
– oil, gas, minerals and coal – are managed<br />
under the Crown Mineral Act 1991, by the<br />
Crown Minerals Group within the Ministry<br />
of Economic Development. The Electricity<br />
Commission is a Crown entity established<br />
under the Electricity Act, to oversee New<br />
Zealand’s electricity industry.<br />
14 New Zealand Government, 2007. New Zealand Energy Strategy to 2050. Powering Our Future.<br />
15 New Zealand Government, 2007. New Zealand Energy Effi ciency and Conservation strategy.<br />
TARANAKI – WHERE WE STAND<br />
problems brought on by cold and damp living<br />
conditions, and making houses safer for children<br />
and the elderly.<br />
The project is being delivered by Waitara-based<br />
community charitable trust Better Homes and<br />
follows an earlier pilot project which saw 100<br />
cold and draughty Waitara homes improved<br />
with insulation.<br />
“The pilot project showed there were defi nite<br />
benefi ts to be had from improving the internal<br />
ambient temperatures in these Waitara homes,<br />
such as fewer respiratory issues,” said Better<br />
Homes General Manager Steve Wharehoka.<br />
“We now want to bring these benefi ts to all<br />
homes in <strong>Taranaki</strong>”.<br />
He said that the work depended on the needs<br />
of the dwelling and occupants, but could<br />
The Ministry of Economic Development<br />
develops and implements policy for the<br />
energy sector overall, and monitors market<br />
performance, including competition issues<br />
and gas and electricity prices. The Ministry<br />
also carries out energy supply and demand<br />
modelling which supports the development<br />
of energy and environmental policies and<br />
develops policy for the oil and alternative fuels<br />
markets.<br />
The Energy Effi ciency and Conservation<br />
Authority (EECA) was established under the<br />
Energy Effi ciency and Conservation Act 2000<br />
and is responsible for promoting energy<br />
effi ciency throughout New Zealand across all<br />
sectors of the economy.<br />
There are two national level strategies<br />
prepared by Central Government to guide<br />
Better Homes<br />
include the installation of roof and underfl oor<br />
insulation and moisture barrier, draughtproof<br />
doors and windows, cylinder wraps,<br />
energy-saving light bulbs, pipe lagging, fi re<br />
alarms, safety latches and security stays<br />
for houses with young children, and grab<br />
rails and barriers for elderly and less mobile<br />
occupants.<br />
Occupants can also be referred to other<br />
appropriate programmes run by the funding<br />
agencies.<br />
The project got off to a fl ying start in its fi rst<br />
year, when 476 houses across the region<br />
were retrofi tted. Of these, less than a third<br />
were spending under $150 a month on<br />
heating and nearly a quarter were paying<br />
$200 or more.<br />
Uninsulated homes lose 42% of their heat<br />
through roofs, 24% through walls, 12%<br />
through windows and 10% through the fl oor.<br />
<strong>Taranaki</strong>’s yearly energy spend totals $260<br />
million, of which $34 million is for domestic<br />
energy.<br />
Strategic partners in the project are the<br />
Energy Effi ciency and Conservation Authority<br />
(EECA), Peak Health <strong>Taranaki</strong>, the New<br />
Plymouth District <strong>Council</strong>, Work and Income,<br />
Housing NZ, the ACC and the <strong>Taranaki</strong><br />
District Health Board. Major funders include<br />
the TSB and TET community trusts and EECA.<br />
energy development, transmission, distribution<br />
and use throughout New Zealand – the New<br />
Zealand Energy Strategy to 2050 14 and the<br />
Energy Effi ciency and Conservation Strategy 15 .<br />
The New Zealand Energy Strategy aims to<br />
establish “a reliable and resilient system<br />
delivering New Zealand sustainable, low<br />
emissions energy services”. Key features of<br />
the strategy are targets of 90% renewable<br />
energy generation by 2025, and that all new<br />
generation should be renewable except<br />
to the extent needed to ensure security of<br />
energy supply. Actions are proposed in the<br />
strategy to increase energy effi ciency in the<br />
transport sector, encourage public transport<br />
and alternative fuels, use energy more<br />
effi ciently and explore sustainable energy and<br />
innovation.
The Government adopted a new Energy Effi ciency and Conservation<br />
Strategy in an effort to boost energy effi ciency and conservation<br />
and to promote the uptake of renewable electricity. A review of<br />
the earlier 2001 strategy had shown that its objective of improving<br />
energy effi ciency across the economy had not been achieved. The<br />
strategy identifi es targets and actions to improve energy effi ciency and<br />
conservation throughout New Zealand. Targets and actions are set out<br />
for energywise homes (improving the performance of existing and new<br />
homes), energywise business (energy effi ciency and renewable energy<br />
programmes in industry and commerce and in agriculture, horticulture,<br />
forestry and fi shing), energywise transport (managing travel demand,<br />
reducing car and fuel use, improving transport effi ciency, increasing the<br />
use of public transport and developing renewable fuels) and an effi cient<br />
and renewable electricity system. Key targets under the strategy include<br />
70,000 low-interest loans by 2015 for insulation, energy effi ciency<br />
or clean heat in homes, up to 20,000 solar water heating systems by<br />
2010, reducing vehicle kilometres travelled, encouraging use of public<br />
transport, halving per capita transport greenhouse gas emissions by<br />
2040 and having 80% of vehicles capable of using 10% biofuel blends or<br />
electric powered by 2015.<br />
The Government has also adopted a strategy to promote walking and<br />
cycling as alternative modes of transport 16 .<br />
(B) REGIONAL POLICIES AND PLANS<br />
A recent amendment to the Resource Management Act 1991 requires<br />
Local Government to have particular regard to the benefi ts to be derived<br />
from the use and development of renewable energy. The Proposed<br />
<strong>Regional</strong> Policy Statement for <strong>Taranaki</strong> prepared by the <strong>Taranaki</strong><br />
<strong>Regional</strong> <strong>Council</strong> identifi es energy effi ciency and development of<br />
renewable energy as issues for the region.<br />
<strong>Regional</strong> plans prepared by the <strong>Taranaki</strong> <strong>Regional</strong> <strong>Council</strong> and district<br />
plans prepared by the New Plymouth, Stratford and South <strong>Taranaki</strong><br />
district councils, provide for and regulate energy developments while<br />
ensuring that the environment effects of such developments are<br />
avoided, remedied or mitigated.<br />
The <strong>Regional</strong> Air Quality Plan for <strong>Taranaki</strong> contains rules regulating<br />
discharges to air from petroleum exploration activities and from<br />
production stations. The <strong>Regional</strong> Fresh Water Plan for <strong>Taranaki</strong> allows<br />
and regulates the taking or diversion of water (for example for hydroelectric<br />
power generation) and for discharges of contaminants to land or<br />
water and use of riverbeds associated with energy industry exploration<br />
and development such as the laying of pipelines. The <strong>Regional</strong> Coastal<br />
Plan for <strong>Taranaki</strong> contains similar provisions in relation to the coastal<br />
marine area.<br />
(C) DISTRICT PLANS<br />
The New Plymouth District Plan contains objectives, policies and<br />
rules for activities such as building structures, earthworks and use of<br />
hazardous substances etc. Energy exploration, development and use are<br />
16 Ministry of Transport, 2005. Getting There - On Foot, By Cycle.<br />
Pohokura production station.<br />
able to take place within the policy and rules framework set out in the<br />
district plan, which notes that the established activities of the petroleum<br />
exploration and production industry form part of the elements associated<br />
with the rural environment that have developed as a result of traditional<br />
rural practices.<br />
The Stratford District Plan contains objectives, policies and methods<br />
covering issues such as amenity values, outstanding natural features<br />
and landscapes, rural and residential use, protected areas, mineral<br />
extraction and network utilities (among others) all of which may be<br />
of relevance to energy use and development. Rules in the plan permit<br />
certain underground pipeline operations for the distribution of natural<br />
gas, petroleum or geothermal energy, existing electricity lines and<br />
mineral prospecting and pre-drilling petroleum exploration activities in<br />
the rural zone. Other aspects of mineral exploration are dealt with as<br />
controlled or discretionary activities requiring resource consent. Solar<br />
heating devices are exempt from the height in relation to boundary<br />
requirements for buildings.<br />
The South <strong>Taranaki</strong> District Plan has objectives, policies and methods<br />
on a range of issues including the coastal environment, environmental<br />
quality, infrastructure, natural hazards, landscape, and historical and<br />
cultural heritage among others. Rules in the rural zone permit petroleum<br />
Rob Tucker<br />
State of the Environment Report 2009<br />
271
272<br />
ENERGY<br />
prospecting, including seismic exploration while petroleum exploration<br />
and production testing require resource consent as controlled activities.<br />
Energy generation activities associated with the manufacturing,<br />
processing and/or treatment process are permitted activities in rural and<br />
industrial zones.<br />
All district plans contain provisions that ensure access to natural light<br />
and sunlight and avoid shading of neighbouring properties in the built<br />
environment.<br />
(D) BUILDING ACT<br />
In addition, under the Building Act 2004 and in granting building<br />
consents, district councils must ensure that all building work complies<br />
with the Building Code. This requires among other things that buildings<br />
are constructed to provide adequately controlled interior temperature,<br />
adequate natural light and facilitate the effi cient use of energy.<br />
(E) TRANSPORT<br />
The <strong>Regional</strong> Land Transport Strategy prepared by the <strong>Taranaki</strong> <strong>Regional</strong><br />
<strong>Council</strong> contains policies and actions to reduce vehicle traffi c demand,<br />
fuel consumption and greenhouse gas emissions through the increased<br />
use of alternative modes of transport such as rail, public passenger<br />
transport and walking and cycling. The strategy also recognises the<br />
need to integrate land use with land transport to minimise the total<br />
demand for travel. The <strong>Council</strong>’s <strong>Regional</strong> Passenger Transport Plan<br />
which forms part of the strategy sets out a programme for providing and<br />
supporting public passenger transport in <strong>Taranaki</strong>. The plan recognises<br />
the benefi ts of public transport in reducing private vehicle use and use<br />
of fuel energy.<br />
In 2006-07, over 320,000 trips were made on urban bus services in<br />
New Plymouth 17 . In July 2007 the council introduced once-a-week<br />
bus services between Waverley and H _ awera, Opunake and H _ awera,<br />
and Opunake and New Plymouth. A once-a-week service between<br />
Inglewood and New Plymouth was introduced in November 2007.<br />
The <strong>Taranaki</strong> <strong>Regional</strong> <strong>Council</strong> has also adopted a <strong>Regional</strong> Walkways<br />
and Cycleways Strategy for <strong>Taranaki</strong> to promote walking and cycling<br />
throughout the region. One of the key benefi ts of walking and cycling<br />
Mountain biking.<br />
17 <strong>Taranaki</strong> <strong>Regional</strong> <strong>Council</strong>, 2007. Annual report: <strong>Regional</strong> land transport planning and passenger transport. 2006-07.<br />
TARANAKI – WHERE WE STAND<br />
Rob Tucker<br />
Passengers board a City Link bus, New Plymouth.<br />
noted in the strategy is reduced consumption of fossil fuels and reduced<br />
emissions of greenhouse gases. The strategy records a number of<br />
initiatives already under way in <strong>Taranaki</strong> to promote walking and cycling.<br />
(F) ENERGY EFFICIENCY<br />
The <strong>Council</strong> employs a <strong>Regional</strong> Waste Minimisation Offi cer (partly<br />
funded by the district councils) to promote waste minimisation and<br />
energy effi ciency throughout the region. Over 50 organisations have<br />
been visited between early 2007 and mid 2008 – mainly restaurants<br />
and cafes, hotels and service clubs, a major shopping centre, offi ces and<br />
marae. A walk-through assessment is made of current energy practices<br />
and the potential for improving energy effi ciency identifi ed (see case<br />
study on Furlong Motor Inn).<br />
The four local authorities in <strong>Taranaki</strong> all apply in-house energy effi ciency<br />
programmes. The <strong>Taranaki</strong> <strong>Regional</strong> <strong>Council</strong> is a member of the<br />
Communities for Climate Protection (New Zealand) which has seen the<br />
<strong>Council</strong> develop an action plan to increase energy effi ciency within its<br />
own operations.<br />
(G) SUMMARY OF PROGRESS<br />
Progress in implementing regional objectives and policies on energy is<br />
summarised in Table 10.6.<br />
New Plymouth coastal walkway.<br />
<strong>Taranaki</strong> <strong>Regional</strong> <strong>Council</strong><br />
Rob Tucker
Table 10.6 Summary of progress: implementing regional objectives and policies on energy.<br />
Issue What do we want to<br />
achieve?<br />
Sustainability<br />
managing energy<br />
Effi ciency in the use,<br />
production and transmission<br />
of energy<br />
Promotion of renewable<br />
sources of energy<br />
Enabling of people and<br />
communities to use and<br />
develop energy to meet their<br />
needs<br />
10.3 HOW DO WE COMPARE?<br />
Energy production and transmission are managed at a national level.<br />
<strong>Taranaki</strong> is New Zealand’s only producing oil and gas region and is<br />
the hub for the processing and distribution of natural gas to industrial,<br />
commercial and residential consumers throughout the North Island.<br />
However, regional differences occur in energy use. Table 10.7 shows the<br />
way in which energy is used in each region and what percentage of that<br />
energy is used by the agriculture, commerce, household, industry and<br />
transport and storage sectors.<br />
<strong>Regional</strong> differences in energy end use refl ect the overall make up of<br />
the economy in each region, the dominance (or otherwise) of particular<br />
industries, climate and population size (which will infl uence household<br />
energy use) and location and distance from main centres and markets<br />
(which will infl uence transport energy use). For example, industrial<br />
energy use in Southland accounts for 68.6% of all energy use in<br />
Southland, the highest proportion by far of all regions, and is likely to be<br />
the result of one large energy user (the Tiwai Point aluminium smelter) in<br />
that region. This reduces the relative proportions of energy use in other<br />
sectors even though in absolute terms, and on a per capita basis, the<br />
energy used in other sectors may be similar to other regions.<br />
<strong>Taranaki</strong>’s energy use of 15.36 PJ is 3.2% of New Zealand’s total energy<br />
use and is above <strong>Taranaki</strong>’s share of the national population at 2.8%.<br />
<strong>Taranaki</strong>’s energy use in agriculture as a proportion of total energy use in<br />
the region (14.9%) is twice the national average and is sixth highest of<br />
all 16 regions refl ecting the level of activity of this sector in the region.<br />
However, the highest absolute energy use in agriculture is found in the<br />
Waikato region (at 6.64 PJ or 14% of the region’s total energy use) and<br />
is almost three times that used in <strong>Taranaki</strong>. The Marlborough region has<br />
What are we doing about it? Where are we at?<br />
Implementing regional plans and<br />
district plans and process resource<br />
consents to regulate and allow<br />
energy production, transmission and<br />
use, including renewable energy.<br />
Implementing the Building Code to<br />
facilitate the effi cient use of energy<br />
in buildings.<br />
Promoting alternative modes<br />
of transport to private vehicles,<br />
urban design and travel demand<br />
management that reduce<br />
consumption of fossil fuels.<br />
Advocating actions at Central<br />
Government level to ensure reliable<br />
and affordable energy supplies,<br />
research into energy effi ciency and<br />
renewable energy technologies and<br />
strategies to enable New Zealand to<br />
continue to meet its energy needs.<br />
All regional and district plans in the region<br />
are operative. Resource consents for energy<br />
developments or projects are monitored.<br />
The Building Code is implemented.<br />
Alternative modes of transport and travel demand<br />
management are promoted.<br />
Central Government has adopted an Energy Strategy<br />
to 2050 and an Energy Effi ciency and Conservation<br />
Strategy.<br />
the highest proportional consumption in agriculture of all regions at 23%<br />
of total energy used in the region.<br />
<strong>Taranaki</strong> has a relatively high proportion of energy use in industry at<br />
38.3%, the third highest proportion in New Zealand after Southland and<br />
Bay of Plenty, refl ecting the presence of the oil and gas, petrochemical<br />
processing and supporting engineering industries.<br />
Pohokura offshore well-head platform.<br />
Rob Tucker<br />
State of the Environment Report 2009<br />
273
274<br />
ENERGY<br />
Table 10.7 Energy used by region in different sectors of the economy.<br />
Region Energy used (PJ) % energy used by sector<br />
Agriculture Commerce Household Industry Transport &<br />
storage<br />
Auckland 149.45 2.5 12.5 32.4 37.0 15.6<br />
Bay of Plenty 35.36 7.4 8.4 29.0 42.6 12.6<br />
Canterbury 57.87 5.8 11.6 35.3 29.3 18.0<br />
Gisborne 4.77 14.7 9.4 38.8 21.2 15.9<br />
Hawke’s Bay 16.34 10.2 9.7 37.3 28.0 14.8<br />
Manawatu-Wanganui 25.03 7.2 15.6 37.2 24.8 15.0<br />
Marlborough 5.71 23.3 10.0 29.9 24.2 12.6<br />
Nelson 8.28 18.4 8.0 21.5 17.6 34.5<br />
Northland 15.69 16.1 9.1 37.2 24.5 13.0<br />
Otago 22.01 8.0 13.0 36.0 27.0 15.9<br />
Southland 30.02 6.3 3.7 13.0 68.6 8.4<br />
<strong>Taranaki</strong> 15.36 14.9 7.2 28.0 38.3 11.5<br />
Tasman 5.18 20.8 6.4 34.7 28.0 10.0<br />
Waikato 47.47 14.0 9.1 32.0 30.1 14.9<br />
Wellington 43.32 2.6 16.9 41.3 25.6 13.6<br />
West Coast 5.18 24.5 9.3 25.7 22.8 17.6<br />
New Zealand 487.07 7.2 11.2 32.4 34.1 15.0<br />
Note: Household includes household transport. Data sourced from the Energy End Use Database, EECA.<br />
TARANAKI – WHERE WE STAND
Photo: Rob Tucker<br />
CHAPTER 11<br />
TOWARDS<br />
SUSTAINABLE<br />
DEVELOPMENT<br />
275
276<br />
TOWARDS SUSTAINABLE DEVELOPMENT<br />
WORKING WITH<br />
PEOPLE, CARING FOR<br />
THE ENVIRONMENT<br />
The purpose of this document is to report to<br />
the community on the state of the environment<br />
in the <strong>Taranaki</strong> region and to record<br />
changes since the <strong>Council</strong>’s last state of the<br />
environment report in 2003 1 .<br />
The majority of the environmental indicators<br />
reported on here demonstrate that<br />
environmental quality and overall sustainability<br />
in the <strong>Taranaki</strong> region remain high. Signifi cant<br />
progress has been made on a number of issues<br />
since the last report. Some issues continue to<br />
require priority attention and strategic action<br />
from the <strong>Council</strong> into the foreseeable future,<br />
but these are considered to be manageable<br />
with continued targeting of appropriate<br />
resources to the task.<br />
Over 92% of the region’s land and soil<br />
resources are sustainably managed, with<br />
87.4% of the hill country now used sustainably<br />
with no signifi cant soil erosion problems. The<br />
<strong>Council</strong> continues to make good progress in<br />
promoting, in partnership with landowners,<br />
sustainable land management in the hill<br />
country. At the time of the last report, the<br />
<strong>Council</strong> had prepared farm plans covering 28%<br />
of the privately-owned hillcountry land. That<br />
fi gure now stands at 58%.<br />
The <strong>Regional</strong> Soil Plan, made operative in<br />
2001, addresses soil erosion issues in <strong>Taranaki</strong><br />
with the sustainable land management<br />
<strong>Council</strong> staff discuss possum control with a farmer.<br />
1 <strong>Taranaki</strong> <strong>Regional</strong> <strong>Council</strong>, 2003. <strong>Taranaki</strong> – Our Place, Our Future. Report on the State of the Environment of the <strong>Taranaki</strong> Region – 2003.<br />
TARANAKI – WHERE WE STAND<br />
programme supporting hillcountry farmers to<br />
farm in a sustainable way. The <strong>Council</strong> will<br />
continue to monitor soil erosion in <strong>Taranaki</strong>.<br />
<strong>Taranaki</strong> is fortunate in having soils that have<br />
very low to moderate vulnerability to soil<br />
compaction, so problems of soil compaction<br />
only occur under wet winter conditions and<br />
are generally reversible with appropriate<br />
pasture and stock management. The <strong>Regional</strong><br />
Soil Plan, includes policies and methods to<br />
address soil health issues in <strong>Taranaki</strong>. Actions<br />
include working directly with landowners on<br />
sustainability issues.<br />
The <strong>Council</strong>’s database shows there are few<br />
confi rmed contaminated sites in <strong>Taranaki</strong>. The<br />
<strong>Council</strong> has investigated 757 sites in order of<br />
priority and 16 sites have been remediated or<br />
are currently managed so that any levels of<br />
contamination no longer pose an unacceptable<br />
environmental risk. Hazardous substances are<br />
managed under the Hazardous Substances<br />
and New Organisms Act 1996, and discharges<br />
under the Resource Management Act 1991.<br />
<strong>Council</strong> inspects industries and businesses<br />
to assess compliance with regulations under<br />
these acts.<br />
About 20% of the region is set aside as<br />
public conservation land and managed by the<br />
Department of Conservation to safeguard<br />
biodiversity values. Programmes are targeted<br />
by a range of agencies and community groups<br />
at maintaining or enhancing the biodiversity<br />
of the region. These include protecting areas<br />
of indigenous vegetation remaining on private<br />
<strong>Taranaki</strong> <strong>Regional</strong> Coun cil<br />
land through QEII covenants; undertaking<br />
predator control programmes, aimed at<br />
protecting threatened fauna; planting both<br />
native and exotic fl owering and fruiting trees<br />
in the city to attract birds; weeding coastal<br />
cliffs to protect threatened plants; maintaining<br />
low possum levels through the <strong>Council</strong>’s selfhelp<br />
possum control programme on the ring<br />
plain and by the Department of Conservation<br />
programmes in conservation areas; and<br />
restoring areas of riparian or wetland<br />
vegetation.<br />
<strong>Taranaki</strong> is also fortunate to have rivers and<br />
streams that are short and fast so water<br />
quality is better than might be predicted given<br />
the highly intensive land uses of the region.<br />
The quality of <strong>Taranaki</strong>’s fresh water has been<br />
monitored by the <strong>Council</strong> through a state of<br />
the environment monitoring programme. This<br />
has shown that measures of ecological health,<br />
such as the communities of invertebrates living<br />
in streams, are good to excellent in the upper<br />
catchments where there is more stream bank<br />
vegetation cover but only fair further down the<br />
catchment where land use is more intense.<br />
Over the past 12 years, ecological health has<br />
demonstrably improved, including a number<br />
of sites in the middle and lower reaches<br />
of catchments, and has not demonstrably<br />
deteriorated at any sites. The region’s fresh<br />
water usually meets the bacteriological<br />
guidelines for swimming, although at certain<br />
times of the summer (immediately after a fl ood<br />
event) or in certain catchments (such as the<br />
small intensively farmed catchments) water<br />
quality may not meet national guidelines.<br />
Measures of levels of organic pollution (BOD),<br />
bacteriological pollution (faecal coliforms and<br />
enterococci) and toxicity (ammonia) are now<br />
stable regionally, after past improvements.<br />
The region’s water quality comfortably meets<br />
guidelines for dissolved oxygen and clarity.<br />
<strong>Taranaki</strong> rivers are naturally high in phosphorus<br />
and so do not meet national guidelines,<br />
furthermore levels of phosphorus are generally<br />
deteriorating. Nitrogen levels meet guidelines<br />
in the upper reaches of catchments, but not<br />
further down, where impacts of agriculture are<br />
more intense.<br />
The <strong>Regional</strong> Fresh Water Plan, made<br />
operative in 2001, contains policies, methods<br />
and rules to maintain and enhance water
quality in <strong>Taranaki</strong>. <strong>Council</strong> offi cers regularly monitor for compliance with<br />
the plan and resource consents, undertaking enforcement action where<br />
necessary. Management highlights over the past fi ve years include a<br />
decline in the number of point source discharges to surface wastewater<br />
from 1,612 in 2003 to 1,413 in 2008, signifi cant investments made<br />
by agriculture, industry and the community in waste water treatment<br />
and disposal systems, and the high rate of compliance with consent<br />
conditions with rates averaging 96% over the past fi ve years.<br />
There has been a signifi cant growth in the <strong>Council</strong>’s riparian<br />
management programme – 2,009 riparian plans have now been<br />
prepared (treble the number of plans that had been prepared by 2003)<br />
covering a total of 10,818 km of stream bank, and 1.3 million riparian<br />
plants have been provided at low cost to riparian plan holders since<br />
1997. However, implementing riparian plans by landowners has been<br />
slow with only an additional 504 km of stream bank having been fenced,<br />
and 426 km of stream bank planted. Taking into account existing fencing,<br />
however, it does mean that 60% of <strong>Taranaki</strong>’s stream bank on the ring<br />
plain is fenced, and 43% is vegetated.<br />
<strong>Taranaki</strong> is well-endowed with water with over 530 named rivers and<br />
streams. The equivalent of 194 Olympic-sized swimming pools of water<br />
per day is allocated for abstraction from <strong>Taranaki</strong> rivers and streams.<br />
Most of this is used for municipal and rural water supply schemes but<br />
interest in pasture irrigation is increasing, particularly in the coastal and<br />
southern areas of the region. More than 20% of the average low fl ow<br />
is allocated for use in nine rivers, but fl ows at which abstraction must<br />
cease are set to safeguard ecological values.<br />
The <strong>Regional</strong> Fresh Water Plan contains provisions to manage water<br />
use to protect aquatic life and other values. The <strong>Council</strong> consults with<br />
the community and affected parties on this. Measures are required to<br />
mitigate or reduce the environmental effects of water use and these are<br />
closely monitored by the <strong>Council</strong>.<br />
Groundwater quality and quantity in <strong>Taranaki</strong> is generally very good.<br />
Relatively low levels of groundwater use mean that the system is<br />
not over-allocated or stressed, although groundwater abstraction is<br />
increasing. Of the 68 groundwater wells monitored, 94% had nitrate<br />
levels that met national drinking water standards. Nitrate levels have<br />
been found above the guidelines in a few wells tapping into shallow<br />
aquifers in South <strong>Taranaki</strong>, but overall groundwater quality in terms of<br />
nitrate levels is generally improving.<br />
Over the past fi ve years regionally signifi cant wetlands have on the<br />
whole been adequately protected through formal mechanisms and<br />
proactive protection works such as fencing and planting. However, small<br />
wetlands and streams are under threat from land development. Of 108<br />
structures that have the potential to impede fi sh passage, 49 provide<br />
adequate fi sh passage, two have been removed and the others need<br />
remedial work. Since 2001 fi sh passage has been improved over 12<br />
structures.<br />
Freshwater biodiversity is managed through provisions in the <strong>Regional</strong><br />
Fresh Water Plan for land drainage, protection of regionally signifi cant<br />
wetlands and provision of fi sh passage past structures.<br />
Working with tangata whenua is an essential part of managing our environment.<br />
<strong>Taranaki</strong> is also fortunate to have an exposed coastline which ensures<br />
excellent bathing water quality. Forty-three consents are held for<br />
discharges to the coast, but of these there are now only six major<br />
community or industrial treated wastewater discharges direct to coastal<br />
waters, and signifi cant improvements continue to be made in terms of<br />
waste treatment and disposal systems. Now, the greater infl uences<br />
on coastal water quality are the rivers and streams discharging to the<br />
sea, carrying with them the cumulative effects of land use within their<br />
catchments. This is most noticeable from catchments draining the more<br />
erodible hillcountry rivers.<br />
<strong>Taranaki</strong> has an active, high-energy coastline with natural erosion<br />
occurring at numerous points. Since the <strong>Regional</strong> Coastal Plan became<br />
operative, 238 coastal permits have been issued, reviewed or varied for<br />
activities in the coastal marine area and 96 new consents have been<br />
granted since 2003. Most coastal permits are for coastal protection<br />
works and stormwater structures with an estimated 11.6 km of seawall<br />
built to protect the region from coastal erosion (about 2 km of this has<br />
been over the past fi ve years).<br />
The <strong>Regional</strong> Coastal Plan, contains policies and methods to protect the<br />
high water quality and natural character of the <strong>Taranaki</strong> coast. Again,<br />
the <strong>Council</strong> works with resource users, affected parties and the wider<br />
community to help achieve this.<br />
Coastal biodiversity is monitored by the <strong>Taranaki</strong> <strong>Regional</strong> <strong>Council</strong><br />
(estuaries and rocky shore communities), the Department of<br />
Conservation (marine protected areas and threatened marine mammals),<br />
the Ministry of Fisheries (fi sh stocks) and the Ornithological Society<br />
(birds). These programmes have found that ecological conditions in both<br />
the Tongaporutu and Wait _ otara estuaries, and along rocky shore reefs,<br />
are generally stable and more than 70 different species of birds use the<br />
monitored estuaries (which include two Waikato region estuaries). The<br />
legally protected subtidal habitats around the Sugar Loaf (Ng _ a Motu)<br />
Islands provide shelter for a greater diversity, and higher numbers, of<br />
fi sh and other organisms than neighbouring areas of reef. Extensive reef<br />
ledges in North <strong>Taranaki</strong>, now protected under a marine reserve, support<br />
a highly diverse collection of rare and exotic sponges.<br />
Coastal and marine biodiversity is managed by a number of agencies<br />
operating under various pieces of legislation. Coastal biodiversity<br />
<strong>Taranaki</strong> <strong>Regional</strong> Coun cil<br />
State of the Environment Report 2009<br />
277
278<br />
TOWARDS SUSTAINABLE DEVELOPMENT<br />
protection has been enhanced recently with<br />
the establishement of two new marine<br />
reserves. It is safeguarded through the<br />
<strong>Regional</strong> Coastal Plan, the fi sheries quota<br />
management system, and through the setting<br />
aside of marine reserves or marine protected<br />
areas.<br />
In the previous state of the environment report<br />
it was noted that on the basis of national<br />
guidelines, air quality in <strong>Taranaki</strong> is rated as<br />
excellent. Given that there are no signifi cant<br />
widespread pressures on air quality, levels of<br />
monitoring of general air quality have been<br />
reduced, although the <strong>Council</strong> still carries<br />
out comprehensive monitoring of consented<br />
activities. Consent conditions are generally<br />
more stringent, refl ecting better control options<br />
and heightened community expectations, and<br />
so major air discharge permit holders continue<br />
to make signifi cant investments in emission<br />
controls and production technology.<br />
The <strong>Regional</strong> Air Quality Plan, made operative<br />
in 1997, contains policies, methods and<br />
controls to maintain and enhance air quality in<br />
<strong>Taranaki</strong> and is in the process of being formally<br />
reviewed, in consultation with the community.<br />
The Government and other members of the<br />
international community are addressing<br />
climate change through a range of initiatives,<br />
including actions to implement the Kyoto<br />
Protocol. Initiatives at the regional level<br />
include management of point source emissions<br />
through the <strong>Regional</strong> Air Quality Plan, and<br />
TARANAKI – WHERE WE STAND<br />
advocacy for sustainable land management<br />
which may lead to increased numbers of trees<br />
which will mitigate greenhouse gas emissions.<br />
Issues in this report concerning natural<br />
features and landscapes, and amenity and<br />
heritage values, are largely the domain of<br />
the district councils. This report shows such<br />
features to be of a high quality in <strong>Taranaki</strong> and<br />
recognised and provided for in both district and<br />
regional plans.<br />
<strong>Taranaki</strong> is subject to a range of natural<br />
hazards, the most signifi cant of which are<br />
fl ooding, volcanic activity, earthquakes, high<br />
winds and land instability. The <strong>Council</strong> operates<br />
an extensive water level monitoring and fl ood<br />
warning system, as well as wind and rainfall<br />
recorders. In addition, eight seismometers<br />
(instruments used to measure earthquakes)<br />
are located around Mount <strong>Taranaki</strong> to monitor<br />
potential volcanic activity. Over the past fi ve<br />
years monitoring has shown no volcanic<br />
activity, four signifi cant fl ood events and a<br />
number of minor events. Each year in <strong>Taranaki</strong>,<br />
on average, 200-300 minor earthquakes were<br />
recorded. The swarm of tornadoes that hit<br />
<strong>Taranaki</strong> in July 2007 triggered a declaration of<br />
a state of emergency. The emergency response<br />
systems functioned well and the <strong>Taranaki</strong><br />
community rallied around to help.<br />
Both regional and district plans identify<br />
natural hazards and contain controls to reduce<br />
hazard risks. Signifi cant hazards and risks to<br />
be managed by the <strong>Taranaki</strong> Civil Defence<br />
Riparian planting. <strong>Taranaki</strong> <strong>Regional</strong> <strong>Council</strong> Chairman David MacLeod, Fonterra Shareholders Chairman<br />
Blue Read and Shareholders <strong>Council</strong> member Shona Glentworth.<br />
Rob Tucker<br />
Emergency Management Group are identifi ed<br />
in the <strong>Taranaki</strong> Civil Defence Emergency<br />
Management Plan. A volcanic strategy has<br />
also been prepared and updated. The <strong>Taranaki</strong><br />
<strong>Regional</strong> <strong>Council</strong> has prepared and updated<br />
a fl ood event standard operating procedure.<br />
Community awareness and education of<br />
natural hazards and responses are carried out.<br />
In our increasingly consumer-driven<br />
society, with its throwaway philosophy, the<br />
management of waste is a major issue, with<br />
the challenge being to fi nd new uses for<br />
materials no longer required (i.e. recycling) or<br />
to fi nd ways of cutting down on the quantity<br />
of materials that end up being discarded (i.e.<br />
minimising the amount of waste generated).<br />
There is also a need to ensure that large<br />
volumes of waste can be safely disposed of.<br />
The whole <strong>Taranaki</strong> region is now serviced<br />
by just one well managed landfi ll, at Colson<br />
Road in New Plymouth, but the quantity of<br />
waste discharged to the landfi ll has increased<br />
by 20%. Increasingly wastes are discharged<br />
to cleanfi lls, which have increased in number<br />
from 13 (in 2003) to 23, and council kerbside<br />
recycling collections have expanded in the<br />
region with a kerbside green waste collection<br />
now being offered in South <strong>Taranaki</strong>. Since<br />
1991 the <strong>Council</strong> has collected and disposed of<br />
more than 40 tonnes of redundant, unknown or<br />
hazardous wastes.<br />
The <strong>Regional</strong> Waste Strategy has been<br />
prepared and adopted by all four councils in<br />
the region. The Strategy provides specifi c<br />
waste minimisation and management goals for<br />
local authorities, industry and the community<br />
on matters relating to waste minimisation,<br />
hazardous wastes and waste disposal.<br />
Finally, in relation to energy, <strong>Taranaki</strong> produces<br />
energy from both non-renewable fossil fuels<br />
(oil, gas, coal) and from renewable sources<br />
such as water (hydroelectricity), wind, solar<br />
or biomass. <strong>Taranaki</strong> uses 3.2% of the total<br />
energy consumed in New Zealand with<br />
industry using 38% of all energy consumed in<br />
<strong>Taranaki</strong> and with households consuming the<br />
next greatest proportion (28%). 477 resource<br />
consents have been issued by the <strong>Council</strong><br />
relating to petroleum exploration activities over<br />
the past fi ve years and 48 relate to production<br />
stations. Four hydroelectric power generation
schemes in <strong>Taranaki</strong> can produce up to 47 megawatts. <strong>Taranaki</strong> has<br />
currently no wind farms, although one is proposed in South <strong>Taranaki</strong>.<br />
Energy production and use are primarily managed by Central<br />
Government (e.g. the Ministry of Economic Development). Two<br />
national-level strategies guide energy development, transmission<br />
and use: The New Zealand Energy Strategy to 2050 and the Energy<br />
Effi ciency and Conservation Strategy. At the local level, energy, and<br />
effects associated with the production of energy, are managed under the<br />
Proposed <strong>Regional</strong> Policy Statement, and regional and district plans.<br />
Many of the programmes described in this report have relied on a<br />
combination of methods. The <strong>Council</strong> has continued to implement<br />
its suite of regional plans prepared in the late 1990s. These contain<br />
formal policies and rules to manage the adverse environmental effects<br />
of activities. Resource consents issued in accordance with the plans<br />
are monitored and enforced. This is a necessary part of effective<br />
environmental management and the <strong>Council</strong> places considerable<br />
emphasis on compliance with the conditions of resource consents to<br />
ensure that acceptable environmental standards are maintained in the<br />
use and development of our natural and physical resources.<br />
The overall approach of the <strong>Council</strong> to all of its environmental work,<br />
however, is encapsulated in its slogan “working with people, caring for<br />
our environment”. The <strong>Council</strong> has continued to give effect to this slogan<br />
and to strengthen it further in the past fi ve years by getting alongside<br />
farmers, landowners, industries and individuals and taking practical<br />
actions to protect and improve the environment. This can be seen not<br />
only in the sort of actions taken to continuously improve environmental<br />
performance through the resource consent process, but also in the<br />
efforts of the <strong>Council</strong> and the community in the very signifi cant voluntary<br />
programmes run by the <strong>Council</strong> such as its riparian and sustainable<br />
land management programmes. The <strong>Council</strong> is set to expand its<br />
voluntary programmes further in the area of biodiversity protection and<br />
enhancement following a review of biodiversity policy and adoption of a<br />
Biodiversity Operational Strategy in 2008.<br />
The ability to successfully develop effective programmes that involve<br />
partnerships, facilitation and advice, instead of a major reliance on<br />
rules to force change, has been due to a continuation of positive shifts<br />
in environmental awareness and responsibility over the past decade<br />
or more, and which was noted in the <strong>Council</strong>’s 2003 State of the<br />
Environment Report.<br />
SUSTAINABLE DEVELOPMENT:<br />
THE PATH TO A SUSTAINABLE FUTURE<br />
Another way of looking at our level of sustainability is to examine the<br />
ecological footprint of the region which is the total amount of productive<br />
land required to support a given population. Using this defi nition,<br />
<strong>Taranaki</strong> was included among the best performing regions, and was<br />
below the New Zealand average, in a recent study on the ecological<br />
footprint of regions throughout the country. This suggests that the<br />
region’s population is living within the carrying capacity of the land and<br />
not in an ecological defi cit situation 2 .<br />
Sustainable development means looking after the environment for future generations.<br />
The combined effect of all the actions noted in the preceding<br />
sections of this report represents a signifi cant step along the path to<br />
sustainable development, which meets the needs of the present without<br />
compromising the ability of future generations to meet their own needs 3 .<br />
The New Zealand Government has endorsed the concept of sustainable<br />
development for New Zealand as the foundation for enhancing the<br />
well-being of people and the environment 4 . Sustainable development<br />
involves looking after people, taking a long-term view so that each<br />
generation plans for the next generation and takes into account social,<br />
cultural, economic and environmental dimensions. In short, sustainable<br />
development is best understood as a balanced, integrated approach to<br />
development that ensures we look after people and the environment<br />
now and in the long term.<br />
The international community has agreed that governments cannot<br />
achieve sustainable development on their own. Any progress depends<br />
on the efforts of primary producers and industry, Local Government,<br />
communities and other sectors of society – each has its strengths and<br />
particular contributions to make. Local Government is seen as playing<br />
a pivotal role in educating, mobilising and responding to the public to<br />
promote sustainable development because it is the level of governance<br />
closest to people. This is refl ected in New Zealand’s own Local<br />
Government Act 2002 which has an expectation that local authorities<br />
will play a broad role in promoting the social, economic, environmental<br />
and cultural well-beings of their communities by taking a sustainable<br />
development approach 5 .<br />
Local authorities are required to include in their long term council<br />
community plans an outline of how they will work with other local and<br />
regional organisations, M _ aori, Central Government, non-Government<br />
organisations and the private sector, to further the community outcomes<br />
desired for the future of the region or district.<br />
This refl ects international approaches where practical actions based<br />
on participation and commitment from all parties at the local level are<br />
essential for building sustainable economies and communities. It also<br />
recognises that working in partnership with people is more conducive<br />
2 McDonald G, & Patterson M, 2003. Ecological Footprints of New Zealand and its Regions. Ministry for the Environment, Environmental Reporting Technical Paper.<br />
3 World Commission on Environment and Development, 1987. Our Common Future. The Commission’s defi nition of sustainable development is widely used internationally.<br />
4 New Zealand Government, 2002. The Government’s Approach to Sustainable Development.<br />
5 Local Government Act 2002 Section 3<br />
Rob Tucker<br />
State of the Environment Report 2009<br />
279
280<br />
TOWARDS SUSTAINABLE DEVELOPMENT<br />
Table 11.1: Community investment in the environment in <strong>Taranaki</strong> 2002-2007 6 .<br />
<strong>Taranaki</strong> Region<br />
($ Million)<br />
Surface Water<br />
6 Business & Economic Research Ltd has indicated that the investments fi gures provided are conservative.<br />
TARANAKI – WHERE WE STAND<br />
Capital Cost Annual Operating Cost<br />
1997-2002 2002-2007 1997-2002 2002-2007<br />
Community $16.1 $83.4 $10.0 $21.7<br />
Agriculture $5.1 $7.2 $0.9 $1.5<br />
Industry $26.7 $16.3 $1.7 $1.3<br />
Sub-Total Surface Water $47.9 $106.8 $ 12.7 $24.5<br />
Air<br />
Community - $0.0 - $0.0<br />
Agriculture - - - -<br />
Industry $18.2 $48.7 $1.6 $0.8<br />
Sub-Total Air $18.2 $48.7 $1.6 $0.8<br />
Land<br />
Community $7.9 $4.7 $4.2 $8.7<br />
Agriculture - $12.3 - -<br />
Industry $14.0 $32.0 $1.5 $1.5<br />
Sub-Total Land $21.9 $49.1 $5.7 $10.2<br />
Energy<br />
Community - - - -<br />
Agriculture - - - -<br />
Industry - $7.1 - $0.8<br />
Sub-total Energy $0.0 $7.1 $0.0 $0.8<br />
Environment Services<br />
Community - - $5.9 $4.2<br />
Agriculture - - - -<br />
Industry $3.2 $4.9 $3.0 $1.3<br />
Sub-Total Environment Services $3.2 $4.9 $8.9 $5.5<br />
Total Community $24.0 $88.0 $20.1 $34.6<br />
Total Agriculture $5.1 $19.5 $0.9 $1.5<br />
Total Industry $62.0 $109.1 $7.8 $5.7<br />
Total $91.1 $216.7 $28.8 $41.8
to building co-operation and commitment than working in isolation. This<br />
is why many of the policies and programmes described in this report<br />
represent a step along the path to sustainable development in <strong>Taranaki</strong>.<br />
They represent an attitude of ‘doing’ – of taking action on practical<br />
initiatives for the environment. This is a signifi cant shift in approach from<br />
the 1970s when increasing levels of regulation were applied to address<br />
the pressures being placed on the region’s natural resources. The <strong>Council</strong><br />
still applies rules and regulations as these provide certainty and clarity<br />
for everyone as to the environmental standards required. However, with<br />
increasing understanding and goodwill, the <strong>Taranaki</strong> community has<br />
continued to embrace environmental stewardship. Successive councils<br />
have taken up the challenge to work with the community to achieve<br />
outcomes that are sustainable in the long term.<br />
<strong>Taranaki</strong>’s generally high-quality environment has been maintained, and<br />
in many instances enhanced, through these efforts, despite continuing<br />
economic development and intensifi cation of resource use. Again, this<br />
Opening a new farm dairy on a PKW farm.<br />
A QUESTION OF BALANCE<br />
How can we maintain and expand agricultural production while at the<br />
same time protect and enhance environmental quality?<br />
That is one of <strong>Taranaki</strong>’s big sustainability questions. And for the<br />
Parininihi Ki Wait _ otara Incorporation (PKW), the answer in today’s<br />
modern business world lies in traditional and timeless kaitiakitanga.<br />
This is more than just words. PKW’s practical brand of kaitiakitanga is<br />
backed with serious money.<br />
For example, its subsidiary PKW Farms Ltd spent $120,000 on a<br />
22 m centre-pier bridge on one of its <strong>Taranaki</strong> dairy farms, as part of<br />
wider efforts under its land management plan to protect waterways.<br />
So committed is PKW to these efforts that it is considering a<br />
Memorandum of Understanding with the <strong>Taranaki</strong> <strong>Regional</strong> <strong>Council</strong><br />
agreeing to meet the Dairy and Clean Stream Accord’s regional<br />
targets for riparian protection early.<br />
Formed in 1976, PKW looks after the interests of the 8,000 owners of<br />
some 20,000 ha of West Coast lease land between Parininihi in the<br />
Rob Tucker<br />
has not been achieved by accident or by good luck but by the combined<br />
efforts of industry and agriculture and the community at large.<br />
The 2003 State of the Environment Report included an independent<br />
economic analysis of the level of spending by the <strong>Taranaki</strong> community on<br />
environmental protection and enhancement over the previous fi ve years<br />
and earlier. The <strong>Council</strong> commissioned a repeat of that work to provide<br />
up-to-date information on the level of investment being made on the<br />
environment in <strong>Taranaki</strong> in the past fi ve years. The results have shown<br />
capital investment by the <strong>Taranaki</strong> community in excess of $216 million<br />
in the period 2002-2007 compared with $91 million in the preceding<br />
fi ve-year period. Annual operating costs are of the order of $41.8 million<br />
($28.8 million in the proceeding four-year period). Total spending on<br />
the environment by the <strong>Taranaki</strong> community has been conservatively<br />
estimated at $85.1 million per annum 7 (Table 11.1). This is an increase of<br />
$28 million per annum from the $57.1 million per annum reported in our<br />
2003 report.<br />
north and Wait _ otara in the south. About 2,400 ha of this is dairy<br />
land, operated as 13 farms with 50:50 sharemilkers milking about<br />
7,000 cows.<br />
Besides riparian fencing and planting, and replacing fords with<br />
bridges, PKW Farms Ltd is fencing native bush remnants and<br />
encouraging regeneration – so successfully at one site that a<br />
former farmhouse has been transformed into a tourist lodge and<br />
corporate retreat.<br />
It is replacing substandard effl uent ponds with spray irrigation<br />
systems that allow aerobic, ultra-violet sterilisation of the effl uent,<br />
with no surface run-off into creeks.<br />
PKW is also installing road underpasses, at about $60,000 each, to<br />
keep the solid waste off public roads and prevent disease transfer by<br />
vehicles.<br />
All this environmental care and stewardship that is the essence of<br />
kaitiaki duties has taken place against a backdrop of increased milk<br />
production. PKW Farms Ltd and its sharemilkers are producing at well<br />
above the region’s average, with the farms expected to overwinter<br />
7,000 cows, and produce 2.3 million kgs of milk solids, an average of<br />
about 1,077 kgs/ms per hectare.<br />
“PKW is committed to be a leader in the fi eld of on-farm<br />
environmental protection and restoration,’ said the Chairman, Spencer<br />
Carr. “The continuation of the land management plan will see PKW<br />
become a state-of-the-art on-farm dairy producer, with a scale that<br />
will make it potentially signifi cant in the international market.<br />
“This scale and commitment to leading technology and environmental<br />
management means that PKW Farms Ltd can create a base for<br />
enlightened processing and innovation in the range of dairy products,<br />
from foods to health and sport supplements and medical remedies.“<br />
7 Wu, J. Sanderson, K. 2008. Community Investment in Environmental Improvements in <strong>Taranaki</strong>. Prepared by Business and Economic Research Limited for the <strong>Taranaki</strong> <strong>Regional</strong> <strong>Council</strong>.<br />
State of the Environment Report 2009<br />
281
282<br />
TOWARDS SUSTAINABLE DEVELOPMENT<br />
Environmental monitoring by schools increases environmental awareness and<br />
understanding.<br />
These levels of investment represent a signifi cant commitment by the<br />
<strong>Taranaki</strong> community to the maintenance of the high-quality environment<br />
that we all enjoy. Much of what has been achieved is the result of<br />
proactive initiatives supported and encouraged by the <strong>Council</strong> and the<br />
wider community.<br />
Harnessing the commitment of all sectors to a sustainable future is the<br />
way forward. The <strong>Council</strong> will continue to work within and alongside the<br />
people of <strong>Taranaki</strong> to this end.<br />
WHERE TO FROM HERE?<br />
This report is the third state of the environment report to be prepared by<br />
the <strong>Council</strong>. It builds on the fi ndings of the 2003 State of Environment<br />
Report and the 1996 State of the Environment Report. It makes extensive<br />
use of information gathered from specifi ed state of the environment<br />
monitoring programmes established in 1995 and earlier, and from<br />
monitoring programmes undertaken by other agencies and community<br />
groups. State of the environment monitoring is a core function of the<br />
<strong>Council</strong>. Accurate trend analysis and early warnings of issues require a<br />
long-term, focused and scientifi cally-designed monitoring programme.<br />
The <strong>Council</strong> has committed resources to have an appropriate programme<br />
in place into the long term as evidenced in its Long Term <strong>Council</strong><br />
Community Plan.<br />
The <strong>Council</strong> will continue to report on the state of the environment,<br />
through various media such as annual reports, reports on special<br />
investigations and research, or on particular aspects of the environment<br />
and through the <strong>Council</strong>’s Recount newsletter and via the <strong>Council</strong>’s<br />
website 8 .<br />
If readers require further information about any of these issues or<br />
information presented in this report, staff of the <strong>Taranaki</strong> <strong>Regional</strong><br />
<strong>Council</strong> are happy to assist.<br />
The <strong>Taranaki</strong> <strong>Regional</strong> <strong>Council</strong> welcomes and encourages feedback<br />
on the issues discussed in this report – phone 06 765 7127,<br />
email: info@trc.govt.nz or visit the <strong>Taranaki</strong> <strong>Regional</strong> <strong>Council</strong> at<br />
47 Cloten Road, Stratford.<br />
8 www.trc.govt.nz<br />
TARANAKI – WHERE WE STAND<br />
<strong>Taranaki</strong> <strong>Regional</strong> Coun cil
State of the Environment Report 2009<br />
283
284<br />
TOWARDS SUSTAINABLE DEVELOPMENT<br />
TARANAKI – WHERE WE STAND
<strong>Taranaki</strong> <strong>Regional</strong> <strong>Council</strong><br />
Working with people, caring for our environment<br />
Private Bag 713<br />
47 Cloten Road<br />
Stratford<br />
New Zealand<br />
www.trc.govt.nz<br />
Phone 06 765 7127<br />
Fax 06 765 5097<br />
Email info@trc.govt.nz
WORKING WITH PEOPLE, CARING FOR OUR ENVIRONMENT