Raman scattering in CaFeO3 and La0.33Sr0.67FeO3 across the ...
Raman scattering in CaFeO3 and La0.33Sr0.67FeO3 across the ...
Raman scattering in CaFeO3 and La0.33Sr0.67FeO3 across the ...

Create successful ePaper yourself
Turn your PDF publications into a flip-book with our unique Google optimized e-Paper software.
<strong>Raman</strong> <strong>scatter<strong>in</strong>g</strong> <strong>in</strong> CaFeO 3 <strong>and</strong> La 0.33Sr 0.67FeO 3 <strong>across</strong> <strong>the</strong> charge-disproportionation<br />
phase transition<br />
Shankar Ghosh, 1 N. Kamaraju, 1 M. Seto, 2 A. Fujimori, 3 Y. Takeda, 4 S. Ishiwata, 5 S. Kawasaki, 5 M. Azuma, 5<br />
M. Takano, 5 <strong>and</strong> A. K. Sood 1, *<br />
1 Department of Physics, Indian Institute of Science, Bangalore 560 012, India<br />
2 Research Reactor Institute, Kyoto University, Kumatori-cho, Osaka 590-0494, Japan<br />
3 Department of Physics <strong>and</strong> Department of Complexity Science <strong>and</strong> Eng<strong>in</strong>eer<strong>in</strong>g, University of Tokyo, Bunkyo-ku,<br />
Tokyo 113-0033, Japan<br />
4 Department of Chemistry, Mie University, Tsu 514-8507, Japan<br />
5 Institute of Chemical Research, Kyoto University, Uji, Kyoto 611-0011, Japan<br />
Temperature-dependent micro-<strong>Raman</strong> studies of orthorhombic CaFeO 3 <strong>and</strong> rhombohedral La 0.33Sr 0.67FeO 3<br />
were carried out with an aim to study <strong>the</strong> role of a lattice <strong>in</strong> <strong>the</strong> formation of <strong>the</strong> charge-disproportioned state<br />
�Fe 4+ →Fe 5+ +Fe 3+ � below <strong>the</strong> transition temperature �T co� of 290 <strong>and</strong> 200 K, respectively. Shell-model latticedynamical<br />
calculations were performed for CaFeO 3 to assign <strong>the</strong> <strong>Raman</strong> modes <strong>and</strong> determ<strong>in</strong>e <strong>the</strong>ir vibrational<br />
pattern. The temperature dependence of <strong>the</strong> peak positions <strong>and</strong> <strong>the</strong> peak widths of various modes for both<br />
systems show dist<strong>in</strong>ct changes <strong>across</strong> <strong>the</strong>ir respective transition temperatures. In CaFeO 3, <strong>the</strong> symmetricstretch<strong>in</strong>g<br />
mode at 707 cm −1 splits <strong>in</strong>to two modes, 707 cm −1 <strong>and</strong> 684 cm −1 , correspond<strong>in</strong>g to <strong>the</strong> breath<strong>in</strong>gtype<br />
distortion of <strong>the</strong> FeO 6 octahedra. In comparison, <strong>the</strong> spectral feature at 704 cm −1 <strong>in</strong> La 0.33Sr 0.67FeO 3,<br />
which has been assigned to <strong>the</strong> <strong>Raman</strong>-forbidden symmetric-stretch<strong>in</strong>g mode, disappears below T co. These<br />
observations <strong>in</strong>dicate <strong>the</strong> presence of f<strong>in</strong>ite Jahn-Teller distortions of <strong>the</strong> FeO 6 octahedra <strong>in</strong> CaFeO 3 <strong>in</strong> <strong>the</strong><br />
entire temperature range, whereas <strong>the</strong>se distortions are present only above T co <strong>in</strong> La 0.33Sr 0.67FeO 3. Two modes<br />
at 307 cm −1 <strong>and</strong> 380 cm −1 <strong>in</strong> La 0.33Sr 0.67FeO 3 approach each o<strong>the</strong>r at T co, <strong>in</strong>dicat<strong>in</strong>g a reduction of rhombohedral<br />
distortions below T co.<br />
I. INTRODUCTION<br />
In recent years, strongly electron correlated threedimensional<br />
�3D� transition-metal oxides have revealed a<br />
rich variety of <strong>in</strong>terest<strong>in</strong>g physical phenomena, such as <strong>the</strong><br />
metal-<strong>in</strong>sulator transition <strong>and</strong> order<strong>in</strong>g of charge, sp<strong>in</strong>, <strong>and</strong><br />
orbital degrees of freedom. 1 In this class, iron pervoskites<br />
conta<strong>in</strong><strong>in</strong>g iron <strong>in</strong> Fe 4+ �d 4 �, namely CaFeO 3 �CFO� <strong>and</strong><br />
La 0.33Sr 0.67FeO 3 �LSFO�, are <strong>in</strong>terest<strong>in</strong>g systems <strong>in</strong> which to<br />
explore <strong>the</strong> role of electron-lattice <strong>in</strong>teractions vis-à-vis <strong>the</strong><br />
electron correlations <strong>in</strong> underst<strong>and</strong><strong>in</strong>g <strong>the</strong> charge-order �CO�<br />
transition associated with charge disproportion. In <strong>the</strong>se systems,<br />
<strong>the</strong> proposed electronic configuration of <strong>the</strong> FeO 6 octahedron<br />
is not Fe 4+ �O 6� 12− , but is close to Fe 3+ �O 6� 11− ,<br />
which is expressed as Fe 3+ L� �L� st<strong>and</strong>s for a hole <strong>in</strong> <strong>the</strong><br />
oxygen 2p orbitals�. S<strong>in</strong>ce <strong>the</strong> ground state of Fe <strong>in</strong> <strong>the</strong>se<br />
systems is predom<strong>in</strong>antly Fe 3+ �3d 5 L� � ra<strong>the</strong>r than Fe 4+ �3d 4 �,<br />
<strong>the</strong> Jahn-Teller �JT� distortions <strong>in</strong> <strong>the</strong>se systems are not<br />
expected to be large. 2 The transition of CFO from an<br />
orthorhombic metal �T�T co� to a charge-ordered monocl<strong>in</strong>ic<br />
semiconductor 3 at T co=290 K is associated with<br />
charge disproportion 2Fe 3+ +L� →Fe 3+ �large octahedra�<br />
+Fe 3+ L� 2 �small octahedra� �nom<strong>in</strong>ally written as 2Fe 4+<br />
→Fe 3+ +Fe 5+ �. As temperature is lowered fur<strong>the</strong>r, <strong>the</strong>re is<br />
ano<strong>the</strong>r transition from <strong>the</strong> paramagnetic <strong>in</strong>sulator to an antiferromagnetic<br />
<strong>in</strong>sulator at T N=115 K. On <strong>the</strong> o<strong>the</strong>r h<strong>and</strong>,<br />
LSFO with a formal value of Fe 3.67 shows a charge-order<strong>in</strong>g<br />
transition 4 at T co=200 K, i.e., 2Fe 3+ L� 2/3 →2Fe 3+ +Fe 3+ L� 2 .<br />
The low-temperature �T�T co� phase exhibits charge dispro-<br />
portion with Fe 3+ :Fe 5+ �2:1 <strong>in</strong> <strong>the</strong> �111� direction. 5 The octahedral<br />
distortion result<strong>in</strong>g from <strong>the</strong> order<strong>in</strong>g of Fe 3+ <strong>and</strong><br />
Fe 5+ states is referred to as a freez<strong>in</strong>g of a breath<strong>in</strong>g phonon<br />
mode. The charge-disproportioned states <strong>in</strong> both systems<br />
have been well established experimentally us<strong>in</strong>g Mössbauer<br />
spectroscopy. 16–18<br />
Recent photoemission <strong>and</strong> unrestricted Hartree-Fock<br />
b<strong>and</strong>-structure calculations 4 have suggested different routes<br />
to charge disproportion <strong>in</strong> CFO <strong>and</strong> LSFO. It has been argued<br />
that both breath<strong>in</strong>g <strong>and</strong> tilt<strong>in</strong>g distortions of FeO 6 are<br />
necessary to <strong>in</strong>duce charge disproportion <strong>in</strong> CFO, whereas<br />
only electron correlations hold <strong>the</strong> key to charge disproportion<br />
<strong>in</strong> LSFO. Neutron-diffraction experiments 6 <strong>in</strong> LSFO<br />
showed that Fe-O bond lengths rema<strong>in</strong> almost <strong>the</strong> same <strong>in</strong><br />
<strong>the</strong> temperature range 300–50 K, whereas <strong>the</strong> Fe-O-Fe bond<br />
angle decreases slightly from 174° to 171°. However, more<br />
recent neutron-<strong>scatter<strong>in</strong>g</strong> experiments 7 show that <strong>the</strong> Fe-O<br />
bond length decreases slightly from 1.939 Å at 300 K to<br />
1.936 Å at 15 K, while <strong>the</strong> Fe-O-Fe bond angle decreases<br />
from 173.29° to 172.89°.<br />
Recent nuclear resonant <strong>scatter<strong>in</strong>g</strong> measurements 8 of CFO<br />
<strong>and</strong> LSFO showed that <strong>the</strong> phonon density of states �DOS�<br />
for both systems changes <strong>in</strong> <strong>the</strong> spectral region of<br />
300–500 cm −1 <strong>across</strong> <strong>the</strong>ir respective T co’s. However, <strong>the</strong><br />
changes <strong>in</strong> <strong>the</strong> DOS were found to be more pronounced for<br />
CFO as compared to LSFO. The objective of <strong>the</strong> present<br />
work is to address <strong>the</strong> role of a lattice <strong>in</strong> <strong>the</strong> CO transition <strong>in</strong><br />
<strong>the</strong>se systems us<strong>in</strong>g <strong>Raman</strong> spectroscopy, which has been<br />
used very effectively <strong>in</strong> recent studies of magnetite 9 <strong>and</strong>
manganites 10–14 <strong>across</strong> <strong>the</strong> metal-<strong>in</strong>sulator <strong>and</strong> chargeorder<strong>in</strong>g<br />
transitions.<br />
II. EXPERIENTIAL DETAILS<br />
Polycrystall<strong>in</strong>e samples of CFO <strong>and</strong> LSFO were prepared<br />
by solid-state reactions <strong>and</strong> a subsequent treatment under<br />
high-pressure oxygen, as described earlier. 15 The phase transitions<br />
as described above were characterized by electrical<br />
measurements <strong>and</strong> Mössbauer spectroscopy. 16 Confocal<br />
micro-<strong>Raman</strong> studies on <strong>the</strong>se polycrystall<strong>in</strong>e CFO <strong>and</strong><br />
LSFO samples were carried out <strong>in</strong> back<strong>scatter<strong>in</strong>g</strong> geometry<br />
us<strong>in</strong>g a DILOR-XY <strong>in</strong>strument equipped with a liquidnitrogen-cooled<br />
CCD detector. <strong>Raman</strong> spectra were recorded<br />
us<strong>in</strong>g 514.5 nm radiation of an argon-ion laser with a power<br />
of 5 mW us<strong>in</strong>g a 50� long work<strong>in</strong>g distance objective. A<br />
temperature range of 330–4.2 K was covered us<strong>in</strong>g a<br />
cont<strong>in</strong>uous-flow helium cryostat from M/s Oxford, UK. The<br />
polycrystall<strong>in</strong>e samples used consisted of irregularly shaped<br />
optically isotropic gra<strong>in</strong>s. It was, <strong>the</strong>refore, possible to obta<strong>in</strong><br />
only two types of polarization spectra: HH �E i �E s� <strong>and</strong> HV<br />
�E i�E s� polarizations of <strong>the</strong> <strong>in</strong>cident �i� <strong>and</strong> scattered �s�<br />
electric fields �E�.<br />
III. RESULTS AND DISCUSSIONS<br />
A. <strong>Raman</strong> spectra at room temperature<br />
CFO is an orthorhombic crystal hav<strong>in</strong>g a GdFeO3 structure<br />
at room temperature belong<strong>in</strong>g to <strong>the</strong> space group<br />
Pnma. It has four formula units per unit cell. The Ca ions<br />
occupy <strong>the</strong> 4c�x,1/4,z� site, <strong>the</strong> planar oxygen �O1� �x,y,z�<br />
ions occupy <strong>the</strong> 8d site, <strong>the</strong> apical oxygen �O2� ions occupy<br />
<strong>the</strong> 4c�x,1/4,z� site, while <strong>the</strong> Fe ions occupy <strong>the</strong><br />
4b�0,0,1/2� site. Accord<strong>in</strong>gly, it has 24 zone-center <strong>Raman</strong>active<br />
modes given by irreducible representations as 7Ag +7B1g+5B2g+5B3g. 12 In all <strong>the</strong>se modes, Fe ions do not<br />
move. Sixteen of <strong>the</strong> 24 <strong>Raman</strong>-active modes <strong>in</strong>volve vibrations<br />
of <strong>the</strong> FeO6 octahedra, while <strong>the</strong> rema<strong>in</strong><strong>in</strong>g eight modes<br />
<strong>in</strong>volve motion of Ca ions. 19 In comparison, LSFO has a<br />
rhombohedral structure <strong>and</strong> belongs to <strong>the</strong> space group R3 ¯c with two formula units per unit cell. The La/Sr ions occupy<br />
<strong>the</strong> 2a�1/4,1/4,1/4�, <strong>the</strong> O ions 6e�x,−x+1/2,1/4�, <strong>and</strong><br />
<strong>the</strong> Fe ions 2b�0,0,0� sites. The 27 optical modes are classified<br />
as A1g�R�+4Eg�R�+3A2u�IR�+5Eu�IR�+2A1u+3A2g. 12<br />
Of <strong>the</strong> five <strong>Raman</strong>-active modes, four �3Eg+1Ag� <strong>in</strong>volve<br />
vibrations associated with <strong>the</strong> FeO6 octahedra while <strong>the</strong> rema<strong>in</strong><strong>in</strong>g<br />
Eg mode <strong>in</strong>volves vibration of La/Sr ions. 11,20<br />
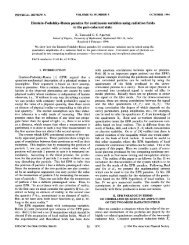
Figure 1 shows <strong>Raman</strong> spectra of CFO �panel �a��<br />
<strong>and</strong> LSFO �panel �b�� at room temperature. It can be<br />
seen that <strong>the</strong> observed <strong>Raman</strong> spectra �shown by filled<br />
circles� can be fitted to a sum of n-Lorentzians �shown<br />
by solid l<strong>in</strong>es, n=8 for CFO <strong>and</strong> n=7 for LSFO�. The <strong>in</strong>dividual<br />
components are shown by dotted l<strong>in</strong>es. The eight<br />
modes of CFO, labeled as W1¯W 8, are 149 cm−1�W1�, 197 cm−1�W2�, 218 cm−1�W3�, 305 cm−1�W4�, 707 cm−1�W5�, 844 cm−1�W6�, 898 cm−1�W7�, <strong>and</strong><br />
922 cm−1�W8�. The <strong>Raman</strong> spectrum of LSFO shows<br />
seven b<strong>and</strong>s labeled as M1¯M 7:251 cm−1�M1�, FIG. 1. Room temperature, i.e., 300 K <strong>Raman</strong> spectra of �a�<br />
CFO <strong>and</strong> �b� LSFO. The dotted l<strong>in</strong>es are Lorentzian fits to <strong>the</strong> data.<br />
The CFO spectrum can be resolved <strong>in</strong>to eight modes while <strong>the</strong><br />
LSFO spectrum can be resolved <strong>in</strong>to seven modes. The correspond<strong>in</strong>g<br />
modes are labeled <strong>in</strong> <strong>the</strong> figure.<br />
307 cm −1 �M 2�, 380 cm −1 �M 3�, 704 cm −1 �M 4�,<br />
843 cm −1 �M 5�, 897 cm −1 �M 6�, <strong>and</strong> 920 cm −1 �M 7�. We note<br />
that both CFO �orthorhombic� <strong>and</strong> LSFO �rhombohedral�<br />
have very similar <strong>Raman</strong> spectra. Such a similarity has also<br />
been seen <strong>in</strong> <strong>the</strong> case of orthorhombic <strong>and</strong> rhombohedral<br />
manganites when Jahn-Teller distortions 11 are small. This is<br />
because <strong>the</strong> bend<strong>in</strong>g <strong>and</strong> <strong>the</strong> tilt modes of <strong>the</strong> MnO 6 octahedra<br />
are very similar <strong>in</strong> both structures �see Figs. 4�a� <strong>and</strong> 6�b�<br />
of Ref. 11�. Before we show <strong>the</strong> temperature dependence of<br />
<strong>the</strong> modes, we will present <strong>the</strong> lattice-dynamical calculations<br />
to assign <strong>the</strong> observed <strong>Raman</strong> b<strong>and</strong>s.<br />
B. Lattice-dynamical calculations <strong>and</strong> mode assignments<br />
The lattice-dynamics calculations �LDC� for <strong>the</strong> phonons<br />
of CFO at <strong>the</strong> Brillou<strong>in</strong>-zone center were carried out us<strong>in</strong>g<br />
<strong>the</strong> shell model. 21 The long-range <strong>in</strong>teractions between each<br />
pair of ions were taken to be of Coulombic form, while <strong>the</strong><br />
short-range <strong>in</strong>teractions between <strong>the</strong> shells were taken to be<br />
of Born-Mayer-Buck<strong>in</strong>ghan form,<br />
Vkk��rij� = Akk� exp�− rij/Rkk�� − Ckk� /r 6<br />
ij,<br />
where rij is <strong>the</strong> distance between <strong>the</strong> two ions i <strong>and</strong> j of<br />
species k <strong>and</strong> k�, respectively. The parameters Akk� , Rkk� , <strong>and</strong><br />
Ckk� are given <strong>in</strong> Table I. In <strong>the</strong> shell model, each ion of<br />
charge Z�e� is represented by a massless shell of charge Y�e�<br />
<strong>and</strong> a core of charge �Z−Y��e�. The shells are elastically<br />
bound to <strong>the</strong> cores with a force constant K whose values are<br />
given <strong>in</strong> Table I. The parameters used for CFO are <strong>the</strong> same<br />
as for CaMnO3, 19 except for <strong>the</strong> value of <strong>the</strong> shell charge<br />
�Y�e�� for Fe <strong>and</strong> O:Y�Fe�=2.5 as compared to Y�Mn�=2.3;<br />
Y�O�=−2.1 <strong>in</strong> CFO; <strong>and</strong> Y�O�=−3.0 <strong>in</strong> CaMnO3. These<br />
changes <strong>in</strong> <strong>the</strong> value of Y were guided to reproduce <strong>the</strong> experimentally<br />
observed symmetric stretch vibration frequency<br />
�W5 mode�. The reduced value of Y�O� <strong>in</strong> CFO is likely due<br />
to <strong>the</strong> localization of <strong>the</strong> hole on <strong>the</strong> oxygen <strong>in</strong> <strong>the</strong>se systems.<br />
Assignment of <strong>the</strong> symmetry for a normal mode vibration<br />
was determ<strong>in</strong>ed by not<strong>in</strong>g that each normal mode transforms<br />
as required by <strong>the</strong> characters of <strong>the</strong> representation to<br />
which it belongs. The character ��� of an eigenvector, EV,of
TABLE I. Parameters of <strong>the</strong> shell model described <strong>in</strong> <strong>the</strong> text. Z, <strong>the</strong> ionic charge; Y, shell charge; K,<br />
core-shell force constant. Akk� , Rkk� , <strong>and</strong> Ckk� are parameters of <strong>the</strong> Born-Mayer-Buck<strong>in</strong>ghan potential.<br />
ion Z�e� Y�e� K �Nm −1 � ionic pair A kk� �eV� R kk� �Å� C kk� �eV Å6 �<br />
Ca 1.91 3.5 1882 Ca-O 840 0.367 0<br />
O −1.91 −2.1 1037 O-O 22764 0.149031 20.37<br />
Fe 3.82 2.5 121881 Fe-O 900 0.374532 0<br />
a mode under a particular symmetry operation is obta<strong>in</strong>ed by<br />
�=E V·E S, where E S is <strong>the</strong> symmetry-transformed E V.We<br />
have repeated our calculations for CaMnO 3 with <strong>the</strong> parameters<br />
as <strong>in</strong> Ref. 19, <strong>and</strong> <strong>the</strong> results for symmetry assignments<br />
�shown <strong>in</strong> Fig. 3 of Ref. 19� agree exactly with ours, thus<br />
putt<strong>in</strong>g confidence <strong>in</strong> our calculations for <strong>the</strong> case of CFO.<br />
The eigenvector analysis of <strong>the</strong> optical modes of CFO gives<br />
24 <strong>Raman</strong>-active modes. The frequencies of <strong>the</strong> five modes<br />
�W 1¯W 5� observed <strong>in</strong> our experiments are very close to <strong>the</strong><br />
calculated <strong>Raman</strong> modes, thus help<strong>in</strong>g us to assign <strong>the</strong> vibrational<br />
patterns of <strong>the</strong>se modes, as given <strong>in</strong> Table I <strong>and</strong> shown<br />
<strong>in</strong> Fig. 2. The low-frequency W 1�149 cm −1 � mode is associated<br />
with <strong>the</strong> A g <strong>in</strong>-phase y rotation �seen at 160 cm −1 <strong>in</strong><br />
CaMnO 3�, <strong>the</strong> W 2�197 cm −1 � mode is associated with <strong>the</strong><br />
B 1g out-of-phase y rotation �seen at 179 cm −1 <strong>in</strong> CaMnO 3�,<br />
<strong>and</strong> <strong>the</strong> W 3�218 cm −1 � mode is associated with <strong>the</strong> A g outof-phase<br />
x rotation �seen at 184 cm −1 <strong>in</strong> CaMnO 3�. The<br />
W 4�305 cm −1 � mode is close to <strong>the</strong> calculated B 1g mode at<br />
301 cm −1 associated with <strong>in</strong>-phase x rotation as well as to <strong>the</strong><br />
B 2g �302 cm −1 � mode <strong>in</strong>volv<strong>in</strong>g <strong>the</strong> mixed motion of Ca <strong>and</strong><br />
O ions. It is also seen that LSFO has a <strong>Raman</strong> b<strong>and</strong> at<br />
307 cm −1 �M 2�. S<strong>in</strong>ce <strong>the</strong> vibrational pattern of W 4 <strong>and</strong> M 2<br />
modes is expected to be similar, <strong>the</strong>y may not <strong>in</strong>volve ions of<br />
very different masses �i.e., Ca vis-à-vis La <strong>and</strong> Sr�. 22 Thus<br />
we associate <strong>the</strong> W 4 mode with <strong>the</strong> B 1g <strong>in</strong>-phase x rotation of<br />
<strong>the</strong> adjacent FeO 6 octahedra, similar to <strong>the</strong> B 1g assignment of<br />
<strong>the</strong> �320 cm −1 mode <strong>in</strong> <strong>the</strong> rare-earth orthoferrites RFeO 3<br />
�R=Y, Tb, Ho, Er, <strong>and</strong> Tm�. 23 The W 5�707 cm −1 � mode is<br />
associated with <strong>the</strong> B 2g symmetric stretch<strong>in</strong>g of <strong>the</strong> FeO 6<br />
octahedra. The correspond<strong>in</strong>g mode is seen at 611 cm −1 <strong>in</strong><br />
LaMnO 3 �predicted by LDC to be at 669 cm −1 �. 24 For isos-<br />
FIG. 2. Vibrational pattern of <strong>the</strong> <strong>Raman</strong> active modes assigned<br />
to W 1, W 2, W 3, W 4, <strong>and</strong> W 5 for CFO.<br />
tructural orthorhombic CaMnO 3, <strong>the</strong> LDC predicts <strong>the</strong> occurrence<br />
of this mode at 749 cm −1 . However, <strong>in</strong> CaMnO 3 this<br />
mode is experimentally not observed. 19 The reason for this<br />
has been attributed to <strong>the</strong> lack of JT distortion <strong>in</strong> CaMnO 3.<br />
Thus <strong>the</strong> presence of <strong>the</strong> W 5 mode <strong>in</strong> <strong>the</strong> <strong>Raman</strong> spectra<br />
implies that some amount of JT-type distortion is present at<br />
room temperature <strong>in</strong> CFO, <strong>in</strong>dicat<strong>in</strong>g <strong>the</strong> existence of a JT<br />
Fe 4+ ionic state along with <strong>the</strong> non-JT, Fe 3+ L� , state. The<br />
LDC of CFO do not yield any phonon modes above<br />
730 cm −1 <strong>and</strong> hence we expect <strong>the</strong> high-frequency modes<br />
W 6�844 cm −1 �, W 7�898 cm −1 �, <strong>and</strong> W 8�922 cm −1 � to be due<br />
to <strong>the</strong> two-phonon <strong>Raman</strong>-<strong>scatter<strong>in</strong>g</strong> process, probably <strong>in</strong>volv<strong>in</strong>g<br />
<strong>the</strong> W 5 phonon along with o<strong>the</strong>r low-frequency<br />
modes. For example, <strong>the</strong> one-phonon density of states of<br />
CFO at room temperature 8 shows prom<strong>in</strong>ent b<strong>and</strong>s at<br />
�137 cm −1 <strong>and</strong> �190 cm −1 . The W 6 mode can be a comb<strong>in</strong>ation<br />
of �707 cm −1 <strong>and</strong> �137 cm −1 phonons; W 7 can be<br />
707 cm −1 <strong>and</strong> 191 cm −1 <strong>and</strong> W 8�707 cm −1 <strong>and</strong> 218 cm −1<br />
modes.<br />
The assignment of <strong>the</strong> <strong>Raman</strong> modes observed <strong>in</strong> LSFO<br />
was guided by <strong>the</strong> experimentally observed <strong>Raman</strong> modes<br />
<strong>and</strong> <strong>the</strong> LDC performed by Abrashev et al. 20 for <strong>the</strong> rhombohedral<br />
r-LaMnO 3. The M 1�251 cm −1 � mode is assigned to<br />
<strong>the</strong> A 1g rotational mode of FeO 6 octahedra. 20 It corresponds<br />
to <strong>the</strong> observed mode at 236 cm −1 �249 cm −1 <strong>in</strong> LDC� <strong>in</strong><br />
r-LaMnO 3. The o<strong>the</strong>r modes M 2,M 3,M 4 are not close to<br />
any of <strong>the</strong> o<strong>the</strong>r four <strong>Raman</strong>-active modes calculated <strong>in</strong><br />
r-LaMnO 3. 20 These four modes for r-LaMnO 3 are calculated<br />
to be at 42, 163, 468, <strong>and</strong> 646 cm −1 . 20 However, <strong>the</strong> frequencies<br />
of M 2 <strong>and</strong> M 3 are close to <strong>the</strong> calculated IR-active<br />
modes <strong>in</strong> r-LaMnO 3. Fur<strong>the</strong>r, <strong>the</strong> temperature dependences<br />
of M 2 <strong>and</strong> M 3 are closely correlated with each o<strong>the</strong>r �to be<br />
discussed later�. Hence we suggest that <strong>the</strong> M 2 <strong>and</strong> M 3<br />
modes are IR-active A 2u <strong>and</strong> E u bend<strong>in</strong>g modes of <strong>the</strong> FeO 6<br />
octahedra. 20 These modes are calculated to be at<br />
310 cm −1 �A 2u�TO�� <strong>and</strong> 357 cm −1 �E u�TO�� <strong>in</strong> r-LaMnO 3. 20<br />
Here TO st<strong>and</strong>s for <strong>the</strong> transverse-optical mode. The<br />
correspond<strong>in</strong>g longitud<strong>in</strong>al-optical �LO� modes calculated<br />
for r-LaMnO 3 are at 465 cm −1 �A 2u�LO�� <strong>and</strong><br />
488 cm −1 �E u�LO��, whose signatures are not found <strong>in</strong> LSFO.<br />
The M 4�704 cm −1 � feature is associated with <strong>the</strong> symmetryforbidden<br />
symmetric-stretch<strong>in</strong>g mode of FeO 6, similar to <strong>the</strong><br />
W 5 mode seen <strong>in</strong> CFO. The M 5�843 cm −1 �, M 6�897 cm −1 �,<br />
<strong>and</strong> M 7�920 cm −1 � modes occur almost at <strong>the</strong> same frequencies<br />
as W 6, W 7, <strong>and</strong> W 8, respectively, <strong>and</strong> hence are assigned<br />
to two-phonon <strong>Raman</strong> <strong>scatter<strong>in</strong>g</strong>.<br />
C. Temperature dependence of modes <strong>in</strong> CaFeO 3<br />
<strong>Raman</strong> spectra of CFO at few selected temperatures are<br />
shown for various spectral ranges: �i� 100–350 cm −1 <strong>in</strong> Fig.
Assignment<br />
3, �ii� 550–800 cm −1 <strong>in</strong> Fig. 4�a�, <strong>and</strong> �iii� 750–1000 cm −1<br />
<strong>in</strong> Fig. 5�a�. It can be noted from Fig. 3 that <strong>the</strong> W 2 mode is<br />
absent <strong>in</strong> <strong>the</strong> spectra below 175 K. The frequencies <strong>and</strong> <strong>the</strong><br />
full width at half maximum �FWHM� of <strong>the</strong> modes<br />
W 1¯W 4 show <strong>the</strong> usual temperature dependence: <strong>the</strong> frequencies<br />
<strong>in</strong>crease by �5 cm −1 <strong>and</strong> <strong>the</strong> FWHM decreases by<br />
�5 cm −1 as temperature is lowered �not shown�. The temperature<br />
behavior of <strong>the</strong> <strong>Raman</strong> b<strong>and</strong> W 5 �centered about<br />
707 cm −1 � as shown <strong>in</strong> Fig. 4�a� is <strong>in</strong>terest<strong>in</strong>g. Above T co, <strong>the</strong><br />
mode appears at <strong>the</strong> same frequency <strong>in</strong> both <strong>the</strong> HH <strong>and</strong> HV<br />
polarizations. Below T co, <strong>in</strong> HH polarization <strong>the</strong> asymmetric<br />
<strong>Raman</strong> l<strong>in</strong>e shape can be fitted to two modes: <strong>the</strong> ma<strong>in</strong><br />
strong mode at �707 cm −1 <strong>and</strong> a very weak mode at<br />
684 cm −1 ; <strong>in</strong> HV polarization, <strong>the</strong> structure is reversed. We<br />
suggest that <strong>the</strong> m<strong>in</strong>or component is due to polarization leakage.<br />
In o<strong>the</strong>r words, below T co <strong>the</strong> frequency of <strong>the</strong> ma<strong>in</strong><br />
mode is �707 cm −1 <strong>in</strong> HH polarization <strong>and</strong> �684 cm −1 <strong>in</strong><br />
HV polarization. The temperature dependence of <strong>the</strong> peak<br />
positions is shown <strong>in</strong> Fig. 4�b�. Interest<strong>in</strong>gly, above T co <strong>the</strong><br />
mode frequency <strong>in</strong>creases with <strong>in</strong>creas<strong>in</strong>g temperature,<br />
which cannot be understood <strong>in</strong> terms of anharmonic <strong>in</strong>teractions.<br />
The frequency of <strong>the</strong> mode <strong>in</strong> HH polarization <strong>in</strong>creases<br />
slightly as <strong>the</strong> temperature is lowered. The activat<strong>in</strong>g<br />
distortion required for <strong>the</strong> observation of <strong>the</strong> symmetricstretch<strong>in</strong>g<br />
mode <strong>in</strong> <strong>Raman</strong> <strong>scatter<strong>in</strong>g</strong> causes <strong>the</strong> deformation<br />
of <strong>the</strong> FeO 6 octahedra so that <strong>the</strong> square formed by <strong>the</strong> pla-<br />
TABLE II. Comparison between <strong>the</strong> experiments <strong>and</strong> LDC calculation.<br />
Expt<br />
cm −1<br />
Calc.<br />
cm −1 Vibrational Pattern<br />
A g 149 �W 1� 171 In-phase y rotation<br />
A g 218 �W 3� 209 Out-of-phase x rotation<br />
A g 280 Movement of Ca ions<br />
A g 316 Movement of Ca ions<br />
A g 347 Movement of Ca ions<br />
A g 522 Out-of-phase bend<strong>in</strong>g<br />
A g 540 In-phase stretch<strong>in</strong>g<br />
B 1g 197 �W 2� 190 Out-of-phase y rotation<br />
B 1g 305 �W 4� 301 In-phase x rotation<br />
B 1g 375 Mixed motion of Ca <strong>and</strong> O ions<br />
B 1g 537 Out-of-phase stretch<strong>in</strong>g<br />
B 1g 670 Out-of-phase stretch<strong>in</strong>g<br />
B 2g 168 Out-of-phase z rotation<br />
B 2g 247 Motion of Ca<br />
B 2g 302 Mixed motion of Ca <strong>and</strong> O ions<br />
B 2g 385 Mixed motion of Ca <strong>and</strong> O ions<br />
B 2g 519 Out-of-phase bend<strong>in</strong>g<br />
B 2g 579 In-phase bend<strong>in</strong>g<br />
B 2g 707 �W 5� 708 In-phase stretch<strong>in</strong>g<br />
B 3g 297 Motion of Ca<br />
B 3g 340 In-phase z rotation<br />
B 3g 518 Out-of-phase bend<strong>in</strong>g<br />
B 3g 536 Out-of-phase stretch<strong>in</strong>g<br />
B 3g 727 Out-of-phase stretch<strong>in</strong>g<br />
FIG. 3. <strong>Raman</strong> spectra of CFO for a few selected temperatures<br />
�shown by <strong>the</strong> side of <strong>the</strong> spectrum� <strong>in</strong> <strong>the</strong> spectral w<strong>in</strong>dow<br />
100–350 cm −1 . The dotted l<strong>in</strong>es show Lorentzian fits to <strong>the</strong> data,<br />
which are resolved <strong>in</strong>to four peaks, i.e., W 1, W 2, W 3, <strong>and</strong> W 4.
FIG. 4. �a� The HH <strong>and</strong> HV polarized spectra of <strong>the</strong> W 5 mode of<br />
CFO at a few temperatures. The solid l<strong>in</strong>es are Lorentzian fits to <strong>the</strong><br />
data. �b� The variation of W 5 mode as a function of temperature.<br />
The mode splits <strong>in</strong>to a high-frequency �HH-polarized� <strong>and</strong> a lowfrequency<br />
mode �HV-polarized� below T co �290 K�.<br />
nar oxygen atoms transforms to a rhombus. 19 Below T co, <strong>the</strong><br />
charge disproportionation causes <strong>the</strong> arrangement of Fe 3+<br />
�large octahedra� <strong>and</strong> Fe 5+ �small octahedra� <strong>in</strong> a rock-salttype<br />
order<strong>in</strong>g of Fe 3+ <strong>and</strong> Fe 5+ ions such that each large<br />
octahedra is surrounded by six small octahedra <strong>in</strong> <strong>the</strong> lowtemperature<br />
monocl<strong>in</strong>ic �P112 1/a� phase of CFO. 3 This<br />
causes <strong>the</strong> distance between Fe <strong>and</strong> <strong>the</strong> two nonequivalent<br />
planar oxygens �O2,O3� to be different. 3 Fe 5+ -O2=1.870 Å,<br />
Fe 5+ -O3=1.894 Å, Fe 3+ -O2=1.971 Å, <strong>and</strong> Fe 3+ -O3<br />
=1.974 Å. This distortion would result <strong>in</strong> <strong>the</strong> observation of<br />
<strong>the</strong> symmetric-stretch mode below T co. It has been experimentally<br />
observed that <strong>the</strong> stretch<strong>in</strong>g mode frequency has a<br />
�d −1.5 � dependence, 11 where d is <strong>the</strong> Fe-O distance. Thus <strong>the</strong><br />
splitt<strong>in</strong>g of <strong>the</strong> 707 cm −1 <strong>in</strong>-phase stretch<strong>in</strong>g mode below T co<br />
FIG. 5. <strong>Raman</strong> spectra of CFO for a few selected temperatures<br />
�shown by <strong>the</strong> side of <strong>the</strong> spectrum� <strong>in</strong> <strong>the</strong> spectral w<strong>in</strong>dow<br />
650–1000 cm −1 . The dotted l<strong>in</strong>es show Lorentzian fits to <strong>the</strong> data,<br />
which were resolved <strong>in</strong>to three peaks, i.e., W 6, W 7, <strong>and</strong> W 8. �b�<br />
The variation of <strong>the</strong> FWHMs with lower<strong>in</strong>g of temperature.<br />
FIG. 6. <strong>Raman</strong> spectra of LSFO for a few selected temperatures<br />
�shown by <strong>the</strong> side of <strong>the</strong> spectrum� <strong>in</strong> <strong>the</strong> spectral w<strong>in</strong>dow<br />
175–450 cm −1 . The dotted l<strong>in</strong>es show Lorentzian fits to <strong>the</strong> data,<br />
which were resolved <strong>in</strong>to three peaks, i.e., M 1, M 2, <strong>and</strong> M 3. �b�<br />
Variation of peak positions <strong>and</strong> �c� FWHM with lower<strong>in</strong>g of<br />
temperature.<br />
can be attributed to <strong>the</strong> occurrence of two average Fe-O<br />
distances associated with <strong>the</strong> formation of <strong>the</strong> small <strong>and</strong><br />
large octahedra <strong>in</strong> <strong>the</strong> charge-disproportioned state. The average<br />
FeuO distance for <strong>the</strong> small octahedra is 1.872 Å <strong>and</strong><br />
for <strong>the</strong> large octahedra 1.974 Å at 15 K <strong>in</strong> comparison to <strong>the</strong><br />
1.922 Å at room temperature. 3 S<strong>in</strong>ce ��/�=−1.5�d/d, <strong>the</strong><br />
707 cm −1 mode will split <strong>in</strong>to two modes at 734 cm −1 <strong>and</strong><br />
680 cm −1 , which are close to <strong>the</strong> observed values seen <strong>in</strong> Fig.<br />
4. However, <strong>the</strong> polarization dependence of <strong>the</strong> W 5 is not<br />
understood.<br />
The peak positions of W 6, W 7, <strong>and</strong> W 8 rema<strong>in</strong> almost<br />
constant with <strong>the</strong> lower<strong>in</strong>g of temperature �not shown�. Figures<br />
5�a� <strong>and</strong> 5�b� show <strong>the</strong> temperature variation of <strong>the</strong><br />
FWHM for <strong>the</strong>se modes. The FWHM’s of W 6 <strong>and</strong> W 7 do not<br />
change much with temperature. However, <strong>the</strong> temperature<br />
dependence of <strong>the</strong> FWHM of <strong>the</strong> W 8 mode is anomalous: it<br />
<strong>in</strong>creases significantly below T co. We do not have a quantitative<br />
underst<strong>and</strong><strong>in</strong>g of this result. It is likely that below T co,<br />
new modes can become <strong>Raman</strong>-active due to lower<strong>in</strong>g of <strong>the</strong><br />
crystal symmetry. 3 The <strong>in</strong>crease <strong>in</strong> <strong>the</strong> FWHM can be due to<br />
<strong>in</strong>homogeneous broaden<strong>in</strong>g aris<strong>in</strong>g from <strong>the</strong> appearance of<br />
new modes below T co.<br />
D. Temperature dependence of modes <strong>in</strong> LSFO<br />
<strong>Raman</strong> spectra of LSFO at few selected temperatures are<br />
shown for various spectral ranges: �i� 175–450 cm−1 <strong>in</strong> Fig.<br />
6�a� <strong>and</strong> �ii� 650–1000 cm−1 <strong>in</strong> Fig. 7�a�. There are no spectral<br />
features between 450 <strong>and</strong> 650 cm−1 . The temperature<br />
dependence of <strong>the</strong> frequencies <strong>and</strong> <strong>the</strong> FWHM for <strong>the</strong> three<br />
modes M1, M2, <strong>and</strong> M3 are shown <strong>in</strong> Figs. 6�b� <strong>and</strong> 6�c�,<br />
respectively. It can be seen that for <strong>the</strong> M1 mode, <strong>the</strong> peak
FIG. 7. <strong>Raman</strong> spectra of LSFO for a few selected temperatures<br />
�shown by <strong>the</strong> side of <strong>the</strong> spectrum� <strong>in</strong> <strong>the</strong> spectral w<strong>in</strong>dow<br />
650–1000 cm −1 . The dotted l<strong>in</strong>es show Lorentzian fits to <strong>the</strong> data,<br />
which were resolved <strong>in</strong>to four peaks, i.e., M 4, M 5, M 6, <strong>and</strong> M 7. �b�<br />
Intensity of <strong>the</strong> M 4 peak normalized to that of <strong>the</strong> M 5 with lower<strong>in</strong>g<br />
of temperature <strong>and</strong> �c� variation of FWHMs with lower<strong>in</strong>g of<br />
temperature.<br />
position <strong>and</strong> <strong>the</strong> FWHM show sharp changes at T co of 200 K.<br />
Most <strong>in</strong>terest<strong>in</strong>gly, <strong>the</strong> FWHM of <strong>the</strong> M 1 mode <strong>in</strong>creases as<br />
temperature is lowered. The peak positions of M 2 <strong>and</strong> M 3<br />
modes also show a discont<strong>in</strong>uous change at T co <strong>in</strong> opposite<br />
directions, i.e., <strong>the</strong> peak position of M 2 <strong>in</strong>creases while that<br />
of M 3 decreases with temperature. As discussed earlier, we<br />
have attributed M 2 <strong>and</strong> M 3 to <strong>the</strong> disorder-activated A 2u <strong>and</strong><br />
E u bend<strong>in</strong>g modes, respectively. It has been shown 20 that <strong>the</strong><br />
A 2u-E u separation for a given pair is a direct measure of <strong>the</strong><br />
rhombohedral distortion <strong>in</strong> <strong>the</strong> structure, i.e., when <strong>the</strong> rhombohedral<br />
distortions are small, <strong>the</strong> A 2u-E u separation is also<br />
small compared to, e.g., LO-TO splitt<strong>in</strong>g. The temperature<br />
dependence of M 2 <strong>and</strong> M 3 mode frequencies seen <strong>in</strong> Fig.<br />
6�b� will imply that <strong>the</strong> rhombohedral distortion has reduced<br />
abruptly at T co. This <strong>in</strong>ference of <strong>the</strong> reduction of <strong>the</strong> rhombohedral<br />
distortions below T co <strong>in</strong> LSFO from <strong>the</strong> <strong>Raman</strong> data<br />
is <strong>in</strong> contrast to <strong>the</strong> neutron-<strong>scatter<strong>in</strong>g</strong> results, which predict<br />
a small <strong>in</strong>crease <strong>in</strong> <strong>the</strong> rhombohedral distortions, 6,7 i.e., an<br />
<strong>in</strong>crease <strong>in</strong> <strong>the</strong> Fe-O-Fe bond angle as well as rotational<br />
distortions. The angle �, a measure of <strong>the</strong> rotational<br />
distortion, is related to <strong>the</strong> x parameter of <strong>the</strong> oxygen 6e<br />
site position <strong>in</strong> R3 ¯ c structure <strong>and</strong> is given by<br />
x=1/2�1±1/�3tan −1 ��. Us<strong>in</strong>g <strong>the</strong> values of x for LSFO, 6<br />
�=3.8° at room temperature <strong>and</strong> �=5.2° at 50 K. However,<br />
it needs to be kept <strong>in</strong> m<strong>in</strong>d that <strong>the</strong> changes <strong>in</strong> <strong>the</strong> value of<br />
<strong>the</strong> Fe-O-Fe bond angle <strong>and</strong> <strong>the</strong> x parameter of <strong>the</strong> oxygen<br />
6e site obta<strong>in</strong>ed from <strong>the</strong> neutron-<strong>scatter<strong>in</strong>g</strong> data were derived<br />
by assum<strong>in</strong>g an R3 ¯ c structure for <strong>the</strong> low-temperature<br />
phase as well. This assumption need not be correct, <strong>and</strong> has<br />
been po<strong>in</strong>ted out by Yang et al. 7<br />
From Fig. 7�a�, we note that <strong>the</strong> <strong>in</strong>tensity of <strong>the</strong> M 4 mode<br />
with respect to <strong>the</strong> <strong>in</strong>tensity of <strong>the</strong> M 5 mode is different from<br />
that shown <strong>in</strong> Fig. 1�b�. This is because <strong>the</strong> sample is polycrystall<strong>in</strong>e<br />
<strong>and</strong> hence gra<strong>in</strong>s with different orientations are<br />
be<strong>in</strong>g recorded <strong>in</strong> experiments outside <strong>the</strong> cryostat �Fig. 1�b��<br />
<strong>and</strong> <strong>in</strong> <strong>the</strong> cryostat �Fig. 7�a��. It can be fur<strong>the</strong>r seen from<br />
Fig. 7�a� that <strong>the</strong> <strong>in</strong>tensity of <strong>the</strong> M 4 mode at 707 cm −1 decreases<br />
as temperature is lowered <strong>and</strong> is not observed below<br />
T co. The variation of <strong>the</strong> <strong>in</strong>tensity of <strong>the</strong> M 4 mode normalized<br />
to <strong>the</strong> <strong>in</strong>tensity of <strong>the</strong> M 5 mode is given <strong>in</strong> Fig. 7�b�.<br />
Recall that <strong>the</strong> M 4 mode associated with <strong>the</strong> symmetristretch<strong>in</strong>g<br />
mode is forbidden <strong>in</strong> <strong>the</strong> R3 ¯ c structure. Above T co<br />
it becomes <strong>Raman</strong>-active, perhaps due to local distortions of<br />
<strong>the</strong> FeO 6 octahedra. Below T co, <strong>the</strong> absence of <strong>the</strong> M 4 mode<br />
implies that such distortions of <strong>the</strong> octahedra are not present<br />
<strong>in</strong> LSFO. 6,7 This is consistent with <strong>the</strong> lower<strong>in</strong>g of <strong>the</strong> rhombohedral<br />
distortion <strong>in</strong>ferred from <strong>the</strong> temperature dependence<br />
of <strong>the</strong> M 2 <strong>and</strong> M 3 mode frequencies. The peak positions<br />
of <strong>the</strong> M 4¯M 7 modes do not change significantly with<br />
temperature �data not shown�. The temperature variation of<br />
<strong>the</strong> FWHM of <strong>the</strong>se modes is shown <strong>in</strong> Fig. 7�c�. The<br />
FWHM’s of M 5, M 6, <strong>and</strong> M 6 <strong>in</strong>crease as temperature is lowered,<br />
show<strong>in</strong>g a dist<strong>in</strong>ct discont<strong>in</strong>uity at T co. This is similar<br />
to <strong>the</strong> temperature dependence of <strong>the</strong> W 8 mode �see Fig.<br />
5�b�� <strong>and</strong> hence <strong>the</strong> <strong>in</strong>crease <strong>in</strong> <strong>the</strong> FWHM’s could possibly<br />
be due to <strong>in</strong>homogeneous broaden<strong>in</strong>g due to <strong>the</strong> appearance<br />
of new modes below T co.<br />
E. Discussion <strong>and</strong> summary<br />
We have studied <strong>the</strong> temperature dependence of <strong>Raman</strong><br />
spectra of CFO <strong>and</strong> LSFO <strong>across</strong> charge order<strong>in</strong>g <strong>and</strong> magnetic<br />
transitions. The spectra show one-phonon <strong>Raman</strong> <strong>scatter<strong>in</strong>g</strong><br />
<strong>in</strong> <strong>the</strong> spectral range 100–750 cm−1 <strong>and</strong> two-phonon<br />
<strong>Raman</strong> <strong>scatter<strong>in</strong>g</strong> between 800 <strong>and</strong> 1000 cm−1 . An <strong>in</strong>terest<strong>in</strong>g<br />
po<strong>in</strong>t to note is that <strong>the</strong> <strong>in</strong>tensity of <strong>the</strong> two-phonon<br />
b<strong>and</strong>s is comparable to <strong>the</strong> first-order <strong>Raman</strong> b<strong>and</strong>s. Such<br />
strong second-order <strong>Raman</strong> <strong>scatter<strong>in</strong>g</strong> has been predicted for<br />
manganites <strong>in</strong>volv<strong>in</strong>g vibrationally excited self-trapped orbitons<br />
from <strong>the</strong> orbitally ordered Jahn-Teller ground state. 25<br />
Recall<strong>in</strong>g that below Tco <strong>the</strong> disappearance of <strong>the</strong> symmetricstretch<strong>in</strong>g<br />
mode �M4� for LSFO suggests a reduction of JT<br />
distortions, it is unlikely that this mechanism is responsible<br />
for observation of <strong>the</strong> strong two-phonon b<strong>and</strong>s.<br />
The observation of <strong>the</strong> bond-stretch<strong>in</strong>g mode <strong>in</strong> <strong>Raman</strong><br />
spectra <strong>in</strong>dicates that <strong>the</strong>re is a JT distortion of <strong>the</strong> FeO6 octahedra due to <strong>the</strong> mixture of <strong>the</strong> Fe4+ �d4�-like configuration<br />
<strong>in</strong>to <strong>the</strong> predom<strong>in</strong>ant d5L� configuration. Because <strong>the</strong> <strong>Raman</strong><br />
spectra of both CFO <strong>and</strong> LSFO show a symmetricstretch<strong>in</strong>g<br />
mode above Tco, <strong>the</strong>ir electronic structures are<br />
similar <strong>in</strong> that temperature range. Below Tco, <strong>the</strong> stretch<strong>in</strong>g<br />
mode is seen only for CFO, mean<strong>in</strong>g that <strong>the</strong> distortion persists<br />
only <strong>in</strong> CFO. A possible reason for this can be that <strong>the</strong><br />
charge disproportionation is <strong>in</strong>complete <strong>in</strong> CFO because it is<br />
enforced by <strong>the</strong> lattice distortion, whereas <strong>in</strong> LSFO, <strong>the</strong><br />
charge disproportionation is ra<strong>the</strong>r complete because <strong>the</strong><br />
electronic system spontaneously charge disproportionates.<br />
The splitt<strong>in</strong>g of <strong>the</strong> symmetric-stretch<strong>in</strong>g �W5� mode below<br />
<strong>the</strong> transition temperature �290 K� is seen due to <strong>the</strong> presence<br />
of small <strong>and</strong> large octahedra �aris<strong>in</strong>g from Fe5+ <strong>and</strong><br />
Fe3+ states, respectively�. In LSFO, <strong>the</strong> symmetric-stretch<strong>in</strong>g
mode M 4, though not <strong>Raman</strong>-active <strong>in</strong> <strong>the</strong> R3 ¯ c, is seen<br />
above T co. This would imply that <strong>the</strong> distance between <strong>the</strong><br />
two pair of planar oxygen atoms is not equal, i.e., JT-type<br />
distortions are present <strong>in</strong> LSFO. The disappearance of this<br />
mode below T co implies <strong>the</strong> absence of this distortion <strong>in</strong> <strong>the</strong><br />
low-temperature phase. This is also corroborated by <strong>the</strong> temperature<br />
dependence of <strong>the</strong> M 2 <strong>and</strong> M 3 modes, which have<br />
been assigned to <strong>the</strong> disorder-activated A u <strong>and</strong> E u IR modes.<br />
The difference <strong>in</strong> M 2 <strong>and</strong> M 3 mode frequencies, which is<br />
related to <strong>the</strong> rhombohedral distortion of <strong>the</strong> adjacent FeO 6<br />
octahedra, decreases abruptly at T co.<br />
Let us compare our <strong>Raman</strong> results to <strong>the</strong> changes <strong>in</strong> <strong>the</strong><br />
phonon density of state �DOS� measured by <strong>the</strong> nuclear resonant<br />
x-ray <strong>in</strong>elastic <strong>scatter<strong>in</strong>g</strong>. 8 The changes <strong>in</strong> <strong>the</strong> DOS between<br />
<strong>the</strong> spectral range of 300–500 cm −1 <strong>across</strong> T co <strong>in</strong> CFO<br />
were much more pronounced than that <strong>in</strong> LSFO. This is <strong>the</strong><br />
region encompass<strong>in</strong>g <strong>the</strong> W 4 mode <strong>in</strong> CFO <strong>and</strong> <strong>the</strong> M 2 <strong>and</strong><br />
M 3 modes <strong>in</strong> LSFO. The mode frequencies of M 2 <strong>and</strong> M 3<br />
show significant changes <strong>across</strong> T co. The large change seen<br />
<strong>in</strong> <strong>Raman</strong> <strong>scatter<strong>in</strong>g</strong> vis-à-vis small changes <strong>in</strong> DOS seen by<br />
<strong>the</strong> nuclear resonant x-ray <strong>in</strong>elastic <strong>scatter<strong>in</strong>g</strong> can be understood<br />
from <strong>the</strong> fact that <strong>the</strong> DOS at a given frequency is a<br />
sum over all <strong>the</strong> phonon states <strong>in</strong> <strong>the</strong> Brillou<strong>in</strong> zone while<br />
first-order <strong>Raman</strong> <strong>scatter<strong>in</strong>g</strong> <strong>in</strong>vestigates <strong>the</strong> behavior of a<br />
*Correspond<strong>in</strong>g author. Email address: asood@physics.lisc.ernet.<strong>in</strong><br />
1 M. Imada, A. Fujimori, <strong>and</strong> Y. Tokura, Rev. Mod. Phys. 70, 1039<br />
�1998�.<br />
2 M. Abbate, G. Zampieri, J. Okamoto, A. Fujimori, S. Kawasaki,<br />
<strong>and</strong> M. Takano, Phys. Rev. B 65, 165120 �2002�.<br />
3 P. M. Woodward, D. E. Cox, E. Moshopoulou, A. W. Sleight, <strong>and</strong><br />
S. Morimoto, Phys. Rev. B 62, 844 �2000�.<br />
4 J. Matsuno, T. Mizokawa, A. Fujimori, Y. Takeda, S. Kawasaki,<br />
<strong>and</strong> M. Takano, Phys. Rev. B 66, 193103 �2002�.<br />
5 J. Q. Li, Y. Matsui, S. K. Park, <strong>and</strong> Y. Tokura, Phys. Rev. Lett.<br />
79, 297 �1997�.<br />
6 P. D. Battle, T. C. Gibb, <strong>and</strong> P. Lightfoot, J. Solid State Chem. 84,<br />
271 �1990�.<br />
7 J. B. Yang et al., J. Phys.: Condens. Matter 15, 5093 �2003�.<br />
8 J. Matsuno, M. Seto, S. Kitao, Y. Kobayashi, Y. T. S. K. R.<br />
Haruki T. Mitsui, A. Fujimori, <strong>and</strong> M. Takano, J. Phys. Soc. Jpn.<br />
73, 2768 �2004�.<br />
9 R. Gupta, A. K. Sood, P. Metcalf, <strong>and</strong> J. M. Honig, Phys. Rev. B<br />
65, 104430 �2002�.<br />
10R. Gupta, G. V. Pai, A. K. Sood, T. V. Ramakrishnan, <strong>and</strong> C. N.<br />
R. Rao, Europhys. Lett. 58, 778 �2002�.<br />
11L. Martín-Carron, A. deAndrés, M. J. Martínez-Lope, M. T. Casais,<br />
<strong>and</strong> J. A. Alonso, Phys. Rev. B 66, 174303 �2002�.<br />
12M. N. Iliev, <strong>and</strong> M. V. Abrashev, J. <strong>Raman</strong> Spectrosc. 32, 805<br />
�2001�.<br />
13S. Yoon, M. Rübhausen, S. L. Cooper, K. H. Kim, <strong>and</strong> S. W.<br />
Cheong, Phys. Rev. Lett. 85, 3297 �2000�.<br />
14E. Granado, N. O. Moreno, A. García, J. A. Sanjurjo, C. Rettori,<br />
I. Torriani, S. B. Oseroff, J. J. Neumeier, K. J. McClellan, S. W.<br />
Cheong, <strong>and</strong> Y. Tokura, Phys. Rev. B 58, 11 435 �1998�.<br />
mode at <strong>the</strong> center of <strong>the</strong> Brillou<strong>in</strong> zone. On <strong>the</strong> o<strong>the</strong>r h<strong>and</strong>,<br />
<strong>in</strong> <strong>the</strong> case of CFO, more pronounced changes are seen <strong>in</strong> <strong>the</strong><br />
DOS �Ref. 8� between 300 <strong>and</strong> 500 cm −1 <strong>across</strong> T co than for<br />
<strong>the</strong> W 4 mode �<strong>the</strong> only observed <strong>Raman</strong> mode <strong>in</strong> that spectral<br />
range�. This implies that <strong>in</strong> CFO, <strong>in</strong> <strong>the</strong> spectral range<br />
from 300 to 500 cm −1 , <strong>the</strong> phonons o<strong>the</strong>r than <strong>the</strong> zonecenter<br />
<strong>Raman</strong>-active ones are affected <strong>across</strong> T co.<br />
To sum up, more <strong>the</strong>oretical underst<strong>and</strong><strong>in</strong>g has yet to<br />
emerge to expla<strong>in</strong> quantitatively <strong>the</strong> observation of <strong>the</strong> strong<br />
second-order <strong>Raman</strong> <strong>scatter<strong>in</strong>g</strong> <strong>in</strong> <strong>the</strong>se systems, <strong>the</strong> polarization<br />
dependence of <strong>the</strong> symmetric stretch<strong>in</strong>g mode �W 5�<br />
<strong>in</strong> CFO, <strong>and</strong> <strong>the</strong> temperature dependence of <strong>the</strong> M 2 <strong>and</strong> M 3<br />
modes <strong>in</strong> LSFO. We hope that our present detailed <strong>Raman</strong><br />
study will motivate this.<br />
ACKNOWLEDGMENTS<br />
A.K.S. thanks <strong>the</strong> Department of Science <strong>and</strong> Technology,<br />
India for f<strong>in</strong>ancial assistance. The authors would like to<br />
thank Professor Umesh Waghmare <strong>and</strong> Dr. J. Matsuno for<br />
useful discussions. M.S., A.F., Y.T., S.I., S.K., M.A., <strong>and</strong><br />
M.T. acknowledge a Grant-<strong>in</strong>-Aid for Scientific Research<br />
from MEXT, Japan.<br />
15S. Kawasaki, M. Takano, R. Kanno, T. Takeda, <strong>and</strong> A. Fujimori,<br />
J. Phys. Soc. Jpn. 67, 1529 �1998�.<br />
16M. Takano, J. Kawachi, N. Nakanishi, <strong>and</strong> Y. Takeda, J. Solid<br />
State Chem. 39, 75�1981�.<br />
17M. Takano, S. Nasu, T. Abe, K. Yamamoto, S. Endo, Y. Takeda,<br />
<strong>and</strong> J. B. Goodenough, Phys. Rev. Lett. 67, 3267 �1991�.<br />
18Sung Hyun Yoon <strong>and</strong> Chul Sung Kim, J. Korean Phys. Soc. 44,<br />
369 �2004�.<br />
19M. V. Abrashev, J. Backstrom, L. Borjesson, V. N. Popov, R. A.<br />
Chakalov, N. Kolev, R. L. Meng, <strong>and</strong> M. N. Iliev, Phys. Rev. B<br />
65, 184301 �2002�.<br />
20M. V. Abrashev, A. P. Litv<strong>in</strong>chuk, M. N. Iliev, R. L. Meng, V. N.<br />
Popov, V. G. Ivanov, R. A. Chakalov, <strong>and</strong> C. Thomsen, Phys.<br />
Rev. B 59, 4146 �1999�.<br />
21A. Mirone, OpenPhononSourceCode, http://www.˜esrf.˜fr.˜/<br />
comput<strong>in</strong>g/scientific.<br />
22The frequency of a mode <strong>in</strong>volv<strong>in</strong>g <strong>the</strong> motion of an element Ca,<br />
La/Sr is expected to scale <strong>in</strong>versely as <strong>the</strong> square root of <strong>the</strong><br />
mass of <strong>the</strong> element. S<strong>in</strong>ce <strong>the</strong> mass of <strong>the</strong> La/Sr ion is much<br />
larger than <strong>the</strong> Ca ion, one would expect that a similar mode<br />
<strong>in</strong>volv<strong>in</strong>g <strong>the</strong> motion of La/Sr <strong>in</strong> <strong>the</strong> case of LSFO would be<br />
shifted to lower frequency as compared to <strong>the</strong> mode <strong>in</strong>volv<strong>in</strong>g<br />
<strong>the</strong> motion of Ca ions <strong>in</strong> CFO, but this is not <strong>the</strong> case here.<br />
23S. Venugopalan, M. Dutta, A. K. Ramdas, <strong>and</strong> J. P. Remeika,<br />
Phys. Rev. B 31, 1490 �1985�.<br />
24M. N. Iliev, M. V. Abrashev, H. G. Lee, V. N. Popov, Y. Y. Sun,<br />
C. Thomsen, R. L. Meng, <strong>and</strong> C. W. Chu, Phys. Rev. B 57, 2872<br />
�1998�.<br />
25P. B. Allen <strong>and</strong> V. Perebe<strong>in</strong>os, Phys. Rev. Lett. 83, 4828 �1999�.