Unmanned Aircraft Systems Roadmap 2005-2030 - Federation of ...
Unmanned Aircraft Systems Roadmap 2005-2030 - Federation of ...
Unmanned Aircraft Systems Roadmap 2005-2030 - Federation of ...

Create successful ePaper yourself
Turn your PDF publications into a flip-book with our unique Google optimized e-Paper software.
UAS ROADMAP <strong>2005</strong><br />
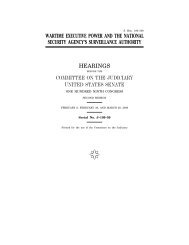
17%<br />
14%<br />
12%<br />
19%<br />
38%<br />
APPENDIX H – RELIABILITY<br />
Page H-5<br />
Power/Prop<br />
Flight Control<br />
Comm<br />
Human/Ground<br />
FIGURE H-2. AVERAGE SOURCES OF SYSTEM FAILURES FOR U.S. MILITARY UA FLEET<br />
(BASED ON 194,000 HRS).<br />
22%<br />
11%<br />
7%<br />
28%<br />
32%<br />
Misc<br />
Power/Prop<br />
Flight Control<br />
Comm<br />
Human/Ground<br />
Misc<br />
FIGURE H-3. AVERAGE SOURCES OF SYSTEM FAILURES FOR IAI UA FLEET<br />
(BASED ON 100,000 HRS).<br />
Israeli Defense Forces have also accumulated over 100,000 hours <strong>of</strong> operational flight experience with<br />
their UA. The manufacturer <strong>of</strong> most <strong>of</strong> these UA, Israeli <strong>Aircraft</strong> Industries (IAI), has documented the<br />
causes <strong>of</strong> failures across the past 25 years <strong>of</strong> this experience and made recommendations for improving<br />
reliability based on this analysis. Of current U.S. UA systems, both the Pioneer and the Hunter<br />
originated as IAI designs, and the Shadow evolved from the Pioneer’s design. For these three reasons,<br />
any examination <strong>of</strong> U.S. UA reliability would be incomplete without examining the reliability <strong>of</strong> their<br />
Israeli counterparts and predecessors.<br />
The data trends derived from the U.S. UA operations summarized in Figure H-2 are remarkably similar<br />
(within 10 percent) to that <strong>of</strong> the Israeli UA fleet for all failure modes. With twice as many flight hours<br />
for the U.S., it is not surprising that the share <strong>of</strong> failures due to flight control is less. Given that the IAI<br />
data is also based on a substantial number <strong>of</strong> flight hours as well, one can argue that the U.S. is facing the<br />
same technical and operational problems <strong>of</strong> other operators. Furthermore, because manufacturing<br />
techniques and supply quality differ from one country to the next, it is interesting to ask the question<br />
“Why are the failures modes still similar?” One answer points to external factors and the operating<br />
environment itself, including weather and the low Reynolds number flight regime.<br />
MQ-1 and MQ-9/Predator<br />
RQ-1A. The Predator experienced low mission completion rates during its initial deployment in the<br />
Balkans in 1995-1997. While the primary causal factor was weather, system failures did account for 12%<br />
<strong>of</strong> the incomplete missions. Mission-level operational data from the system deployed in Hungary was<br />
used to perform a limited assessment <strong>of</strong> system reliability based on data covering missions from March<br />
1996 through April 1997.<br />
Out <strong>of</strong> the 315 Predator missions tasked during that timeframe, weather and system cancellations kept<br />
nearly two-thirds on the ground (60 percent). Of the remaining missions that were launched, slightly<br />
under one half were subsequently aborted. These aborts were due to system (29 percent), weather (65<br />
percent), and operational issues (6 percent) that included airspace conflicts, operator errors, and crew duty<br />
limitations.<br />
Data indicates that 38 missions (12 percent) were scrubbed due to system failures, an additional 18<br />
system aborts (6 percent) that did not result in mission cancellation (due to launch <strong>of</strong> another aircraft or<br />
weather hold), and other issues which kept the Predator on the ground 6 times (2 percent). Out <strong>of</strong> this