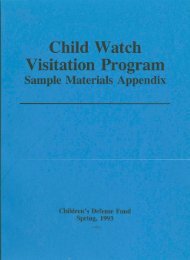
AppendlxE u.s. CENSUS DATA Table I CHILDREN NOT ENROLLED BY STATE (Age 7-17) Institutional School-Age Population Not Enrolled Percent Not State AJ(es Population Enrolled Not Enrolled Not Enrolled (Adjusted) Enrolled Alabama 6 1 7-15 16 & 17 TOTAL 69,892 662,065 139,229 49,462 630,277 120,016 20,430 31,788 19,213 72 611 383 20,358 31,177 18,830 29.1 4.7 13.5 1 801,294 750,293 51,001 994 50,007 6.2 Alaska 7-15 16 & 17 TOTAL 62,595 10,422 73,017 60,541 9,067 69,608 2,054 1,355 3,409 62 32 94 1,992 1,323 3,315 3.2 12.7 4.5 Arizona 7-15 16 & 17 TOTAL 346,617 70,890 417,507 333,613 61,637 395,250 13,004 9,253 22,257 418 334 752 12,586 8,919 21,505 3.6 12.6 5.2 Arkansas 7-15 16 & 17 TOTAL 353,446 76,163 429,609 335,659 64,312 399,971 17,787 11,851 29,638 637 327 964 17,150 11,524 28,674 4.9 15.1 6.7 California 7-15 16 & 17 TOTAL 3,533,523 744,073 4,277,596 3,449,607 682,011 4,131,618 83,916 62,062 145,978 4,393 3,403 7,796 79,523 58,659 138,182 2.3 7.9 3.2 Colorado 6 1 7-15 16 & 17 TOTAL 44,107 420,460 86,905 41,967 410,817 78,951 2,140 9,643 7,954 82 593 313 2,058 9,050 7,641 4.7 2.2 8.8 1 507,365 489,768 17,597 906 16,691 3.3 Connecticut 7-15 16 & 17 TOTAL 544,640 109,660 654,300 535,381 101,893 637,274 9,259 7,767 17,026 796 404 1,200 8,463 7,363 15,826 1.6 6.7 2.4 Delaware 7-15 16 & 17 TOTAL 105,791 21,169 126,960 102,864 19,275 122,139 2,927 1,894 4,821 157 115 272 2,770 1,779 4,549 2.6 8.4 3.6 Wash<strong>in</strong>gton,D.C. 6 1 7-15 16 & 17 TOTAL' 13,024 116,437 23,668 140,105 12,235 112,337 20,611 132,948 789 4,100 3,057 7,157 26 208 121 329 763 3,892 2,936 6,828 5.9 3.3 12.4 4.9 Florida 7-15 16 & 17 TOTAL 1,148,074 235,508 1,383,582 1,107,167 204,079 1,311,246 40,907 31,429 72,336 1,983 1,116 3,099 38,924 30,313 69,237 3.4 12.9 5.0 Georgia 6 1 7-15 16 & 17 TOTAL' 95,915 863,654 180,695 1,044,349 78,123 823,092 147,409 970,501 17,792 40,562 33,286 73,848 153 1,239 642 1,881 17,639 39,323 32,644 71,967 18.4 4.6 18.1 6.9 Hawaii 7-15 16 & 17 TOTAL 143,960 28,978 172,938 139,166 26,362 165,528 4,794 2,616 7,410 83 67 150 4,711 2,549 7,260 3.3 8.8 4.2 Idaho 7-15 16 & 17 TOTAL 141,676 32,187 173,863 136,564 29,062 165,626 5,112 3,125 8,237 130 127 257 4,982 2,998 7,980 3.5 9.3 4.6 Ill<strong>in</strong>ois 7-15 16 & 17 TOTAL 2,032,070 414,167 2,446,237 1,981,256 372,992 2,354,248 50,814 41,175 91,989 2,661 1,470 4,131 48,153 39,705 87,858 2.4 9.6 3.6 Indiana 7-15 16 & 17 TOTAL 980,325 205,181 1,185,506 954,111 180,758 1,134,869 26,214 24,423 50,637 1,286 839 2,125 24,928 23,584 48,512 2.5 1l.5 4.1 Iowa 61 7-15 16 & 17 TOTAL' 55,350 524,869 111,421 636,290 52,666 508,131 102,221 610,352 2,684 16,738 9,200 25,938 55 493 311 804 2,629 16,245 8,889 25,134 4.7 3.1 8.0 4.0 190 'Dala is shown on 6-year-olds for largeI area stales, but it is not counted <strong>in</strong> Slate or grand totals.
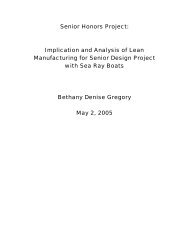
AppendlxE u.s. CENSUS DATA Table I CHILDREN NOT ENROLLED BY STATE (Age 7-17) Institutional School-Age Population Not Enrolled Percent Not State Al1.l's Population Enrolled Not Enrolled Not Enrolled (Adjusted) Enrolled Kansas 7-15 407,065 395,533 11,532 593 10,939 2.7 16 & 17 85,595 77,767 7,828 387 7,441 8.7 TOTAL 492,660 473,300 19,360 980 18,380 3.7 Kentucky 6 1 64,582 49,854 14,728 75 14,653 22.7 7-15 596,470 566,731 29,739 616 29,123 4.9 16 & 17 128,081 101,721 26,360 382 25,978 20.3 TOTAL' 724,551 668,452 56,099 998 55,101 7.6 Louisiana 7-15 738,583 705,003 33,580 1,079 32,501 4.4 16 & 17 153,081 130,006 23,075 595 22,480 14.7 TOTAL 891,664 835,009 56,655 1,674 54,981 6.2 Ma<strong>in</strong>e 6' 7-15 16 & 17 TOTAL 1 20,458 183,485 38,977 222,462 18,733 176,357 35,108 211,465 1,725 7,128 3,869 10,997 22 215 162 377 1,703 6,913 3,707 10,620 8.3 3.8 9.5 4.8 Maryland 7-15 16 & 17 TOTAL 1 735,769 147,587 883,356 717,627 131,685 849,312 18,142 15,902 34,044 1,261 760 2,021 16,881 15,142 32,023 2.3 10.3 3.6 Massachusetts 6 1 7-15 16 & 17 TOTAL 1 108,835 997,936 206,337 1,204,273 100,335 979,603 189,101 1,168,704 8,500 18,333 17,236 35,569 164 1,347 611 1,958 8,336 16,986 16,625 33,611 7.7 1.7 8.1 2.8 Michigan 7-15 16 & 17 TOTAL 1,739,805 360,529 2,100,334 1,700,080 327,708 2,027,788 39,725 32,821 72,546 2,424 1,180 3,604 37,301 31,641 68,942 2.1 8.8 3.3 M<strong>in</strong>nesota 7-15 16 & 17 TOTAL 746,164 156,703 902,867 731,788 147,939 879,727 14,376 8,764 23,140 864 609 1,473 13,512 8,155 21,667 1.8 5.2 2.4 Mississippi 6 1 7-15 16 & 17 TOTAL 1 48,197 451,486 95,335 546,821 39,323 424,568 79,389 503,957 8,874 26,918 15,946 42,864 38 296 171 467 8,836 26,622 15,775 42,397 18.3 5.9 16.5 7.8 Missouri 7-15 16 & 17 TOTAL 841,257 174,870 1,016,127 814,390 152,941 967,331 26,867 21,929 48,796 1,136 673 1,809 25,731 21,256 46,987 3.1 12.2 4.6 Montana 7-15 16 & 17 TOTAL 139,608 30,344 169,952 135,467 27,882 163,349 4,141 2,462 6,603 202 159 361 3,939 2,303 6,242 2.8 7.6 3.7 Nebraska 7-15 16 & 17 TOTAL 273,495 58,206 331,701 266,005 53,856 319,861 7,490 4,350 11,840 547 401 948 6,943 3,949 10,892 2.5 6.8 3.3 Nevada 7-15 90,417 87,341 3,076 145 2,931 3.2 16 & 17 17,096 15,048 2,048 94 1,954 11.4 TOTAL 107,513 102,389 5,124 239 4,885 4.5 New Hampshire 7-15 133,045 128,047 4,998 271 4,727 3.6 16 & 17 26,344 23,083 3,261 83 3,178 12.1 TOTAL 159,389 151,130 8,259 354 7,905 5.0 New Jersey 7-15 1,272,498 1,245,570 26,928 1,153 25,775 2.0 16 & 17 257,848 237,681 20,167 591 19,576 7.6 TOTAL 1,530,346 1,483,251 47,095 1,744 45,351 3.0 New Mexico 7-15 220,994 212,658 8,336 323 8,013 3.6 16 & 17 44,623 39,841 4,782 160 4,622 10.4 TOTAL 265,617 252,499 13,1l8 483 12,635 4.8 I Data is shown on 6-year-olds for target area states, but it is not counted <strong>in</strong> state or grand totals. 191
- Page 1:
CHILDREN OUT OF SCHOOL IN AMERICA A
- Page 4 and 5:
Copyright If.> October 1974 by the
- Page 7 and 8:
People Who Worked Oft This Report .
- Page 9:
Portland, Maine CDF staff Cambridge
- Page 12:
Foreword Introduction Chapter 1 Cha
- Page 16 and 17:
CHAPTER 1 Table I CHAPTER 2 Table I
- Page 21:
community leaders concerned with ed
- Page 24 and 25:
dren were suspended. The next highe
- Page 26 and 27:
described in this report, they can
- Page 28 and 29:
needed to improve and unify state c
- Page 30 and 31:
Bureaucratic Excuses for Inaction Y
- Page 32 and 33:
problems. Are teachers encouraged o
- Page 35 and 36:
Who Are the Children Out of School?
- Page 37:
vary. But while many of them descri
- Page 40 and 41:
Maxine, 14 Maxine Dolan is 14 and h
- Page 42 and 43:
until the new school year. Meanwhil
- Page 45 and 46:
awake until morning when the sounds
- Page 47 and 48:
He's had his chances, foreign or no
- Page 49:
Theresa, 12 Theresa Engler, a 12-ye
- Page 52 and 53:
34 Table I Children Not Enrolled! B
- Page 54 and 55:
Proportion of Minority Children 2 T
- Page 56:
Social and Economic Factors Poor ch
- Page 59:
Limitations of Census Data Our anal
- Page 62 and 63:
We found children out of school in
- Page 64:
.". 0\ Table VIII Chlldren Out of S
- Page 68 and 69:
VI o Table X All Children Out uf Sc
- Page 70 and 71:
Total % of Areas Surveyed Children
- Page 73 and 74:
Chapter 3 Barriers to School Attend
- Page 75 and 76:
TABLE I STATUTORY AND CONSTITUTIONA
- Page 78 and 79:
ter the four months because the cou
- Page 80:
Truancy Laws penalizing children an
- Page 83 and 84:
A Denver school official stated: "Y
- Page 86 and 87:
officers who spoke Spanish, and onl
- Page 88 and 89:
The principal of Lincoln Junior Hig
- Page 91 and 92:
For example, as of October, 1972, i
- Page 93:
think there is enough counseling, e
- Page 97:
fees required to take, for example,
- Page 100 and 101:
did not have books were not much of
- Page 102 and 103:
Consider what this would mean if yo
- Page 104:
no money to feed and care for all o
- Page 107:
Apparently a judgment has been made
- Page 112 and 113:
ecome self-sufficient adults are th
- Page 114 and 115:
In Cambridee, Massachusetts, an att
- Page 116 and 117:
Inadequacy of Special Education Pro
- Page 118 and 119:
over again for four or five years.
- Page 120:
Janice has not been suspended this
- Page 123 and 124:
ased. 56 They are modeled and norme
- Page 125:
chusetts counselor pointed out that
- Page 128 and 129:
that the city does not experiment w
- Page 130 and 131:
1. The use of many kinds of people
- Page 132 and 133:
abuse laws of the state. However, t
- Page 134 and 135:
116
- Page 137:
Many districts still have the power
- Page 140 and 141:
In contrast to the majority of publ
- Page 144 and 145:
The same pattern of secondary suspe
- Page 148:
Racial Discrimination in the Use of
- Page 152:
One southern school official admitt
- Page 158 and 159: tion of the limitation on numbers o
- Page 161 and 162: hold hearings, the reaction was sho
- Page 164: or programs that operate as alterna
- Page 167 and 168: complaints to the federal Office fo
- Page 169: APPENDICES
- Page 172: • most children who are instituti
- Page 175 and 176: as opposed to every second, third,
- Page 177 and 178: . Census Tract 123 Census Tract 123
- Page 179 and 180: newal. Every third household was mo
- Page 181 and 182: -secondary school children by sex a
- Page 184: 10. Are his special problems/needs
- Page 187 and 188: Sheet E-l SCHOOL EXPULSIONS, SUSPEN
- Page 189: Maine Portland Census Tract 11 I 1:
- Page 197 and 198: ALABAMA State Officials Mr. William
- Page 199 and 200: Mr. Milton Ogle, Associate Director
- Page 202 and 203: Sumter County #2 School Officials D
- Page 204 and 205: AppendixD STATE SCHOOL OFFlCIALS' R
- Page 207: Los Angeles Unified School District
- Page 211: State Wisconsin Wyoming GRANO TOTAL
- Page 214 and 215: AppendixE U.s. CENSUS DATA Table II
- Page 217: .... \C 00 AppelldixE U.S. CENSUS D
- Page 221: AppendixE u.s. CENSUS DATA Table II
- Page 242 and 243: Appendix 6 RANK ORDERS OF AREAS IN
- Page 245: AppendbH PERCENT OF HEADS OF HOUSEH
- Page 251 and 252: State Alabama Alaska Arizona Arkans
- Page 253 and 254: State Alabama Alaska Arizona Arkans
- Page 256: AppendixM STUDENTS ENROLLED IN EDUC
- Page 259 and 260:
Lee I 4,925 2,663 2,260 2 83 18 65
- Page 261 and 262:
Walker I 9,671 8,924 745 2 230 164
- Page 265 and 266:
Collins I 35 29 6 (82.4) (17.1 ) Co
- Page 267 and 268:
Junction City 1,003 584 419 (58.2)
- Page 269 and 270:
SI. Charles I 245 149 96 (60.8) (39
- Page 272 and 273:
AppendlxM STUDENTS ENROLLED IN EDUC
- Page 274 and 275:
Appendix M STUDENTS ENROLLED IN EDU
- Page 276:
App@ndblfl STUDENTS ENROLLED IN EDU
- Page 282 and 283:
Appendix M STUDENTS ENROLLED IN EDU
- Page 285 and 286:
South Pike Cons. I 2,575 893 1,677
- Page 287 and 288:
Clarendon #2 I 3,246 784 2,462 54 8
- Page 289 and 290:
Orangeburg #7 1,112 158 954 9 9 (14
- Page 292 and 293:
A. ppendi.'\: N SPECIAL EDUCATION I
- Page 297:
Learning Deaf!Hard Blind! Speech Ph
- Page 306 and 307:
Rhode Island Society for Autistic C
- Page 308 and 309:
Federal Court Consent Agreements; P
- Page 310 and 311:
Mr. Peter E. Holmes Director, Offic
- Page 312 and 313:
census figures and often did not ch
- Page 314 and 315:
pils who dropped out of this school
- Page 316:
SUGGESTED REFINEMENTS IN THE INDIVI
- Page 333:
I. Name of School System _ II. Name
- Page 337:
2 1 1 16 2 14 Cotton Plant 586 72 5
- Page 341:
1 1 5 4 1 Tuckerman 820 711 109 (1)
- Page 352 and 353:
Appelldlx R OCR DATA ON STUDENT SUS
- Page 355 and 356:
APPENDIXR FOOTNOTES I Unless noted
- Page 357 and 358:
36There were 1,763 students, suspen
- Page 361:
Total Students Suspended At Least O
- Page 364:
APPENDIX T TABLES I-II FOOTNOTES IS
- Page 367 and 368:
Kentucky Floyd County Total I 2 0.5
- Page 369 and 370:
AppendixT SUSPENSIONS IN CD" SURVEY
- Page 371 and 372:
Kentucky Floyd County Total Mud Cre
- Page 373:
Appendix T SUSPENSIONS IN CDF SURVE
- Page 378 and 379:
Appenllb V STATUTORY PROVISIONS FOR
- Page 381 and 382:
Massachusetts I Official None -Misc
- Page 384:
itppe",db V STATUTORY PROVISIONS FO
- Page 390 and 391:
Bureau is interested primarily in d
- Page 394:
could be collected centrally at the