Generali - InvestireOggi
Generali - InvestireOggi
Generali - InvestireOggi

Create successful ePaper yourself
Turn your PDF publications into a flip-book with our unique Google optimized e-Paper software.
Alan Bowe<br />
(44-20) 7134-1837<br />
alan.m.bowe@jpmorgan.com<br />
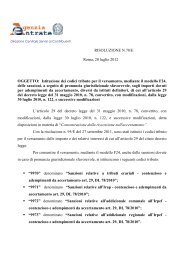
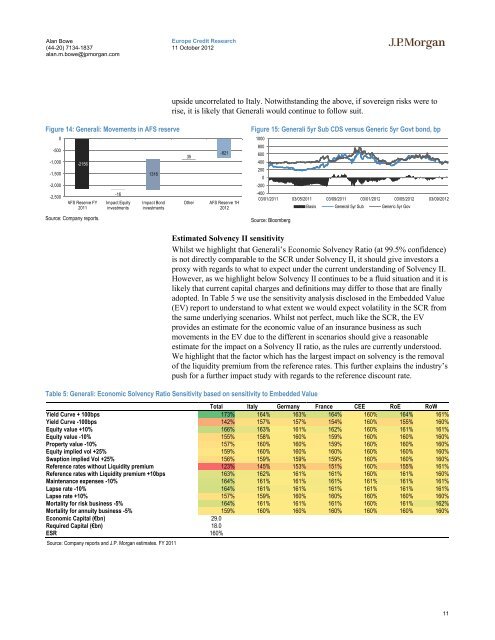
Figure 14: <strong>Generali</strong>: Movements in AFS reserve<br />
0<br />
-500<br />
-1,000<br />
-1,500<br />
-2,000<br />
-2,500<br />
-2156<br />
AFS Reserve FY<br />
2011<br />
Source: Company reports.<br />
Europe Credit Research<br />
11 October 2012<br />
upside uncorrelated to Italy. Notwithstanding the above, if sovereign risks were to<br />
rise, it is likely that <strong>Generali</strong> would continue to follow suit.<br />
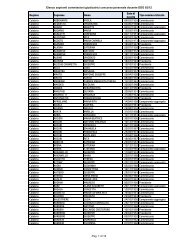
Figure 15: <strong>Generali</strong> 5yr Sub CDS versus Generic 5yr Govt bond, bp<br />
Source: Bloomberg<br />
Estimated Solvency II sensitivity<br />
Whilst we highlight that <strong>Generali</strong>’s Economic Solvency Ratio (at 99.5% confidence)<br />
is not directly comparable to the SCR under Solvency II, it should give investors a<br />
proxy with regards to what to expect under the current understanding of Solvency II.<br />
However, as we highlight below Solvency II continues to be a fluid situation and it is<br />
likely that current capital charges and definitions may differ to those that are finally<br />
adopted. In Table 5 we use the sensitivity analysis disclosed in the Embedded Value<br />
(EV) report to understand to what extent we would expect volatility in the SCR from<br />
the same underlying scenarios. Whilst not perfect, much like the SCR, the EV<br />
provides an estimate for the economic value of an insurance business as such<br />
movements in the EV due to the different in scenarios should give a reasonable<br />
estimate for the impact on a Solvency II ratio, as the rules are currently understood.<br />
We highlight that the factor which has the largest impact on solvency is the removal<br />
of the liquidity premium from the reference rates. This further explains the industry’s<br />
push for a further impact study with regards to the reference discount rate.<br />
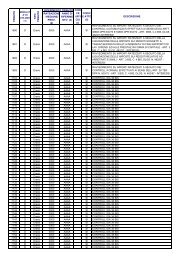
Table 5: <strong>Generali</strong>: Economic Solvency Ratio Sensitivity based on sensitivity to Embedded Value<br />
Total Italy Germany France CEE RoE RoW<br />
Yield Curve + 100bps 173% 164% 163% 164% 160% 164% 161%<br />
Yield Curve -100bps 142% 157% 157% 154% 160% 155% 160%<br />
Equity value +10% 166% 163% 161% 162% 160% 161% 161%<br />
Equity value -10% 155% 158% 160% 159% 160% 160% 160%<br />
Property value -10% 157% 160% 160% 159% 160% 160% 160%<br />
Equity implied vol +25% 159% 160% 160% 160% 160% 160% 160%<br />
Swaption implied Vol +25% 156% 159% 159% 159% 160% 160% 160%<br />
Reference rates without Liquidity premium 123% 145% 153% 151% 160% 155% 161%<br />
Reference rates with Liquidity premium +10bps 163% 162% 161% 161% 160% 161% 160%<br />
Maintenance expenses -10% 164% 161% 161% 161% 161% 161% 161%<br />
Lapse rate -10% 164% 161% 161% 161% 161% 161% 161%<br />
Lapse rate +10% 157% 159% 160% 160% 160% 160% 160%<br />
Mortality for risk business -5% 164% 161% 161% 161% 160% 161% 162%<br />
Mortality for annuity business -5% 159% 160% 160% 160% 160% 160% 160%<br />
Economic Capital (€bn) 29.0<br />
Required Capital (€bn) 18.0<br />
ESR 160%<br />
Source: Company reports and J.P. Morgan estimates. FY 2011<br />
-16<br />
Impact Equity<br />
investments<br />
1316<br />
Impact Bond<br />
investments<br />
35<br />
-821<br />
Other AFS Reserve 1H<br />
2012<br />
1000<br />
800<br />
600<br />
400<br />
200<br />
0<br />
-200<br />
-400<br />
03/01/2011 03/05/2011 03/09/2011 03/01/2012 03/05/2012 03/09/2012<br />
Basis <strong>Generali</strong> 5yr Sub Generic 5yr Gov<br />
11