Natural Hazards: Causes and Effects - Disaster Management Center ...
Natural Hazards: Causes and Effects - Disaster Management Center ... Natural Hazards: Causes and Effects - Disaster Management Center ...
center is about 175 kilometers (110 miles). The probable error appears to be directly related to the forecast period; for example, the average error of a 48-hour forecast is about twice that of a 24-hour forecast. Errors in forecasting the position of the center of a tropical cyclone are, of course, of immense practical importance. It is therefore encouraging that the verification statistics show an improving trend, a sign that additional data and intensive research are beginning to yield dividends. Forecasting Flooding In the forecasting and warning aspects of flood risk, there must be close coordination between the meteorological forecasters and the hydrologists who will be working with the water authorities and local officials. The meteorologist, besides forecasting the intensity, movement and evolution of the tropical cyclone, will also prepare forecasts of rainfall, its time of onset, duration and the amounts expected. Rainfall is nearly always heavy in a tropical cyclone and may amount to a total between 75 and 300 millimeters during a period lasting from 12 to 48 hours. The rainfall varies considerably from one storm to another and is strongly influenced by the time required for the cyclone to pass. In mountainous countries the rainfall can be extremely heavy. For example, Japanese and Chinese weather records frequently show more than 600 millimeters of rain falling during the passage of a typhoon over large areas in the mountains. The assessment of flood risks is based primarily on rainfall forecasts in those areas where the time interval between heavy rain and a flood is apt to be short. Examples of such areas are a city that is within the vicinity of a watershed and a small island that has mountains in the interior. In other areas where the water flows downstream for many hours or several days before doing any damage, flood forecasting is based mainly on an analysis of successive measurements of stream flow at various points along a river. Other important factors include the accumulated total of rain that has already fallen and the actual state of the rivers in relation to flood levels. Forecasting Storm Surges The forecasting of storm surges is at present largely based on empirical methods. Much promising research is now in progress in several countries. The object is to develop dynamic models that will provide numerical predictions to supplement those based on empirical formulae. One important preparatory step in the forecasting of storm surges consists of having available a considerable amount of background information. Among the items required are frequency charts of strong winds, the range of the diurnal tide for the months of the storm season, and the results of surveys of the topography of the continental shelf and of bays along the coast. 11 Warning Systems Warning systems should be viewed as a combination of technical and social arrangements that allow individuals and groups affected by a storm to respond in ways most beneficial to them. On the technical side there needs to be a complex evaluation of meteorological data plus knowledge of coastal factors and engineering works that may modify the effects of the storm. On the social side the conditions for effective operation include organization for action to take place when the warning is received, issuance of the warning, directions for action transmitted as part of the warning, and evacuation where required. Assumptions often made about warning systems are that the message is not changed in transmission, that the recipients will understand it as intended by those who issued it, and that
Storm Surge Source: Cuny, Disasters and Development, Oxford University Press, New York, 1983, page 33 Figure 5.3
- Page 57 and 58: Himalayan zone. Most earthquakes ap
- Page 59 and 60: The different rates of travel betwe
- Page 61 and 62: Modified Mercalli Intensity Scale o
- Page 63 and 64: Frequency of Earthquakes More than
- Page 65 and 66: How an earthquake damages a house F
- Page 67 and 68: Rupture Zones and Epicenters in Cen
- Page 69 and 70: of population from rural to urban a
- Page 71 and 72: In all emergency activities it is o
- Page 73 and 74: Notes 1 Rita Funaro-Curtis, Natural
- Page 75 and 76: foundations by the water buoyancy.
- Page 77 and 78: Impact on Natural and Built Environ
- Page 79 and 80: Disaster Mitigation The most system
- Page 81 and 82: - for tsunamis of local origin, pot
- Page 83 and 84: Chapter 4 Volcanoes Introduction Ov
- Page 85 and 86: production of sugar and cattle. Bec
- Page 87 and 88: lava is a thin fluid (not viscous),
- Page 89 and 90: then cool as thin, gently dipping s
- Page 91 and 92: drains, causing flooding during sub
- Page 93 and 94: then recognized, but today an incre
- Page 95 and 96: Volcanic Zoning and Risk Mapping Wi
- Page 97 and 98: 1. Environmental Effects Volcano Di
- Page 99 and 100: Altogether the combined disaster of
- Page 101 and 102: force caused by the earth’s rotat
- Page 103 and 104: An atmosphere disturbance forces wa
- Page 105 and 106: The Saffir / Simpson Hurricane Scal
- Page 107: measures as have to be devised and
- Page 111 and 112: a set of activities in anticipation
- Page 113 and 114: and buildings will affect the veloc
- Page 115 and 116: How High Winds Damage Buildings Win
- Page 117 and 118: • developing an effective forecas
- Page 119 and 120: Notes 1 INTERTECT, The Potential Co
- Page 121 and 122: 1. Environmental Effects Tropical C
- Page 123 and 124: also by human changes to the surfac
- Page 125 and 126: The most noted floods are associate
- Page 127 and 128: Magmatic Water ATMOSPHERE The Hydro
- Page 129 and 130: Seasonality —Inundation of land d
- Page 131 and 132: • Since Landsat images are taken
- Page 133 and 134: The second step in vulnerability re
- Page 135 and 136: 100-year flood, since this frequenc
- Page 137 and 138: • Publish a master plan report wi
- Page 139 and 140: • Blankets can be useful, but if
- Page 141 and 142: Initial Response By Local Authoriti
- Page 143 and 144: Notes 1 INTERTECT, The Potential Co
- Page 145 and 146: Chapter 7 Drought Introduction Drou
- Page 147 and 148: In addition to the droughts in the
- Page 149 and 150: The Drought Cycle Normal Hydrologic
- Page 151 and 152: • priority be given to developing
- Page 153 and 154: land aware of the issues. Planning
- Page 155 and 156: The importance of responding to the
- Page 157 and 158: Chapter 8 Desertification Introduct
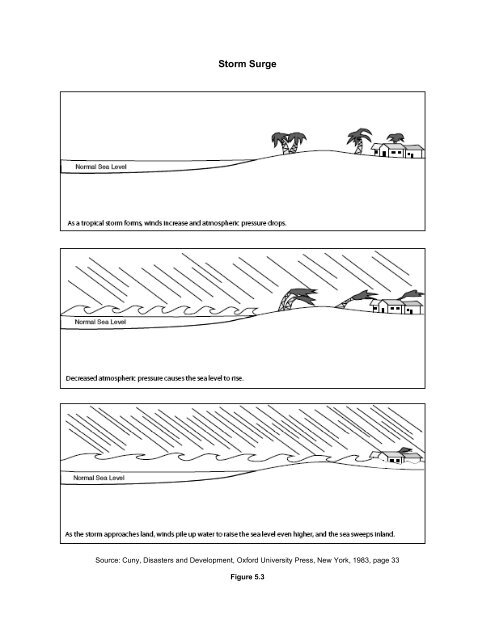
Storm Surge<br />
Source: Cuny, <strong>Disaster</strong>s <strong>and</strong> Development, Oxford University Press, New York, 1983, page 33<br />
Figure 5.3


