- Page 1 and 2: Joint Inte
- Page 3 and 4: CONTENTS INFLUENCE OF CHEMICAL FERT
- Page 5 and 6: THE EFFECT OF NITROGEN SUPPLY, LIMI
- Page 7 and 8: THE INFLUENCE OF CHEMICAL AND BIOFE
- Page 9 and 10: STUDIES REGARDING THE INFLUENCE OF
- Page 11 and 12: PREFACE With the general aims to co
- Page 13 and 14: For a better knowledge of applicati
- Page 15 and 16: pH values pH values 8 6 pH values 6
- Page 17 and 18: In the preluvosoil conditions the m
- Page 19 and 20: REFERENCES Bedo, Z.- Lang, L. (1977
- Page 21 and 22: mean (fixed, i.e. systematic effect
- Page 23 and 24: 29% in the first 15 years of the ex
- Page 25 and 26: Table 2. Variance and regression pa
- Page 27 and 28: The b = 1.7 value recorded for Trea
- Page 29 and 30: THE IMPACT OF PLANT BREEDING ON SEE
- Page 31 and 32: modified pedigree breeding method,
- Page 33 and 34: “Rigel” seed multiplication com
- Page 35 and 36: The benefits of the cultivars bred
- Page 37 and 38: ABSTRACT SOME LESSONS LEARNED FROM
- Page 39 and 40: about 100 m above sea-level with ye
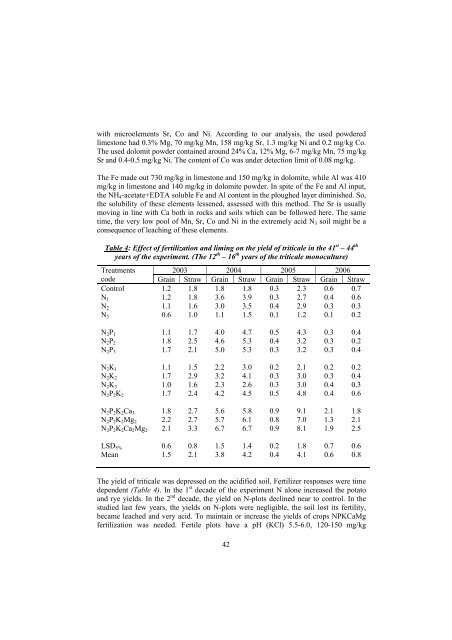
- Page 41: Table 3: Effect of treatments on so
- Page 45 and 46: MODIS NDVI data from the Terra and
- Page 47 and 48: NDVI 0,8 0,75 0,7 0,65 0,6 0,55 0,5
- Page 49 and 50: The a*cos(2π*i/12) periodic compon
- Page 51 and 52: RAINFALL, FERTILIZATION AND LIMING
- Page 53 and 54: 1999 to 2006. The main experiment
- Page 55 and 56: Jolánkai M. (2005): Effect of clim
- Page 57 and 58: classified according to the soil te
- Page 59 and 60: Relatív termés (100 NP/NPK), % 3.
- Page 61 and 62: ACKNOWLEDGEMENT This study was fina
- Page 63 and 64: Table 2. The oldest and most import
- Page 65 and 66: plan of the uniform countrywide fie
- Page 67 and 68: • The effect of climate change ca
- Page 69 and 70: MATERIALS AND METHODS An organic an
- Page 71 and 72: TOC % 1,2 1 0,8 0,6 0,4 0,2 0 bc b
- Page 73 and 74: The much better performance of the
- Page 75 and 76: GREENHOUSE GAS EMISSION IN LONG-TER
- Page 77 and 78: Carbon-dioxide and nitrous-oxide sa
- Page 79 and 80: Nitrous-oxide emission Nitrous-oxid
- Page 81 and 82: CH BC N2O = - 8,839 + 0,6904 * Mois
- Page 83 and 84: INFLUENCES OF AMELIORATIVE FERTILIZ
- Page 85 and 86: samples were measured by the ICP-AE
- Page 87 and 88: Table 3. Influences of ameliorative
- Page 89 and 90: Egner, H., Riehm, H., Domingo, W.R.
- Page 91 and 92: To resolve genetics of grain qualit
- Page 93 and 94:
Table 2. Average values of analyzed
- Page 95 and 96:
CROP ROTATION AND GREEN MANURE INFL
- Page 97 and 98:
Organic Chemical Chemical fertiliza
- Page 99 and 100:
Influence of the crop rotation and
- Page 101 and 102:
REFERENCES 1. Budoi Gh., Penescu A.
- Page 103 and 104:
MATERIALS AND METHODS The experimen
- Page 105 and 106:
average of watered treatments resul
- Page 107 and 108:
Table 4: Changes in soil properties
- Page 109 and 110:
epetitions, where the main treatmen
- Page 111 and 112:
that usually conventional tillage h
- Page 113 and 114:
RESEARCHES REGARDING THE INFLUENCE
- Page 115 and 116:
Crop rotation Water regime Water re
- Page 117 and 118:
conditions. The values, registered
- Page 119 and 120:
CRISANA -THE FIRST ROMANIAN WHEAT V
- Page 121 and 122:
In addition, we used recurent selec
- Page 123 and 124:
Table 2: The root length of some wh
- Page 125 and 126:
Table 5: Productions and quality re
- Page 127 and 128:
EXPERIMENTS WITH PERENNIAL RYE (SEC
- Page 129 and 130:
green mass (6,8-7 t/ha/year dry mas
- Page 131 and 132:
REFERENCES Kotvics G. (1963): A Sec
- Page 133 and 134:
een shown to cause leucoencephaloma
- Page 135 and 136:
Marasas, W.F.O., Kellerman, W.C.A,
- Page 137 and 138:
minerals (Čuvanová et al. 2006).
- Page 139 and 140:
01/2). For the latest periods (fatt
- Page 141 and 142:
1. GENERAL APPROACH TO EUROREGIONAL
- Page 143 and 144:
Association - fig. 2), on the other
- Page 145 and 146:
communication between the two assoc
- Page 147 and 148:
The juridical settlement of the Bih
- Page 149 and 150:
EFFECT OF BORON FERTILIZATION ON AN
- Page 151 and 152:
3. Examinations of fruit quality Fo
- Page 153 and 154:
Fruit density was increased applyin
- Page 155 and 156:
Wills, R. B. H. - Lim, J. S. K. - G
- Page 157 and 158:
Nosticzius, 1992). Among these, soi
- Page 159 and 160:
RESULTS AND DISCUSSIONS The dry mat
- Page 161 and 162:
The amount of nitrogen uptake by th
- Page 163 and 164:
ABSTRACT THE EFFECT OF NITROGEN SUP
- Page 165 and 166:
exactly known due to the size of th
- Page 167 and 168:
Table 3: Dry matter production of p
- Page 169 and 170:
more definite in the non limed trea
- Page 171 and 172:
compare these levels with the Europ
- Page 173 and 174:
Table 3. Natural occurrence of myco
- Page 175 and 176:
CORRELATIONS OF SOCIAL AND ECONOMIC
- Page 177 and 178:
1600 1400 1200 1000 800 600 400 200
- Page 179 and 180:
Table 3: Land use/ha 1960 1970 1980
- Page 181 and 182:
RIDING TOURISM IN THE NORTHERN GREA
- Page 183 and 184:
visitors belonging to all types of
- Page 185 and 186:
Concerning the weather long autumn
- Page 187 and 188:
2000 1800 1600 1400 1200 1000 800 6
- Page 189 and 190:
technical supervision of the Debrec
- Page 191 and 192:
TISSUE CULTURE METHODS FOR SCREENIN
- Page 193 and 194:
symptoms could be observable in the
- Page 195 and 196:
experiments the other clones and we
- Page 197 and 198:
MATERIALS AND METHODS Shoot culture
- Page 199 and 200:
that callus induction and developme
- Page 201 and 202:
COMBINING ABILITY STUDIES IN A SEVE
- Page 203 and 204:
Table 1: Mean squares of GCA and SC
- Page 205 and 206:
combination. We could not obtained
- Page 207 and 208:
SUSTAINABLE LAND-USE BASED ON WESTS
- Page 209 and 210:
green manure treatment, where lupin
- Page 211 and 212:
In Westsik's crop rotation experime
- Page 213 and 214:
Crop rotation breaks the weed and i
- Page 215 and 216:
The reliability of the method was c
- Page 217 and 218:
The increased phosphorus rates incr
- Page 219 and 220:
REFERENCES Basha S.M, Roberts R.M (
- Page 221 and 222:
MATERIALS AND METHODS Sandy soils w
- Page 223 and 224:
AL soluble Ca (mg/kg) 350 300 250 2
- Page 225 and 226:
gradually from soils containing 100
- Page 227 and 228:
agriculture in Hungary, especially
- Page 229 and 230:
according to the treatments. Obtain
- Page 231 and 232:
Table 4: Results of regression anal
- Page 233 and 234:
From obtained data, it can be estab
- Page 235 and 236:
Tops soil (0-30 cm) samples were ta
- Page 237 and 238:
Table 5: Impact fertilizing and lim
- Page 239 and 240:
COMPOSTED SLAUGHTERHOUSE BY-PRODUCT
- Page 241 and 242:
The mature compost became friable,
- Page 243 and 244:
maximal yield could be reached at 5
- Page 245 and 246:
unfavourable years. 100-200 t/ha do
- Page 247 and 248:
THE EFFECT OF BENTONITE ON SPECIFIC
- Page 249 and 250:
RESULTS The effect of treatments on
- Page 251 and 252:
dosages significantly reduced the a
- Page 253 and 254:
DISCUSSION In our experiments, we f
- Page 255 and 256:
INVESTIGATION OF MINERAL CONTENT IN
- Page 257 and 258:
Element Ammonium-nitrate Superphosp
- Page 259 and 260:
According to our results, the effec
- Page 261 and 262:
REFERENCES Debreczeni, B., Debrecze
- Page 263 and 264:
micronutrient soil tests for many y
- Page 265 and 266:
LE and KCl-EDTA extracted similar a
- Page 267 and 268:
Table 4. Correlation coefficient be
- Page 269 and 270:
YIELD OF RYE AS AFFECTED BY THE CRO
- Page 271 and 272:
Table 2: Mean temperature at Nyíre
- Page 273 and 274:
It was found that either way of app
- Page 275 and 276:
2 The main modification properties
- Page 277 and 278:
4 Table 2: Percent of alfalfa and-
- Page 279 and 280:
THE IMPORTANCE OF LONG-TERM FIELD E
- Page 281 and 282:
essential to the determination of t
- Page 283 and 284:
The comparison of the nutrient cont
- Page 285 and 286:
environment for three years, then t
- Page 287 and 288:
PC 2 5 4 3 2 1 0 -1 -2 -3 -4 V2 V5
- Page 289 and 290:
Figure 2: Genetic similarity among
- Page 291 and 292:
Frenot, Y., Aubry, M., Misset, M. T
- Page 293 and 294:
Three foliar fertilizations were do
- Page 295 and 296:
CONCLUSIONS The rigorous experiment
- Page 297 and 298:
some pathogen agents, a chemical an
- Page 299 and 300:
� The pH decrease in the greenhou
- Page 301 and 302:
RESULTS AND DISSCUSSIONS 1. The pro
- Page 303 and 304:
may employ (wheat) flour produced f
- Page 305 and 306:
For the conditions in from Western
- Page 307 and 308:
Yield losses millet hay (%) 80 70 6
- Page 309 and 310:
- 0,6093) and extremely significant
- Page 311 and 312:
CONCLUSIONS The experimental field
- Page 313 and 314:
Evaluation of effect of fertilizati
- Page 315 and 316:
Table 3: Dry matter content of pars
- Page 317 and 318:
On sandy soil, the total N content
- Page 319 and 320:
THE INFLUENCE OF CHEMICAL AND BIOFE
- Page 321 and 322:
Bacillus megatherium soil bacteria,
- Page 323 and 324:
N content of plant: Studying the ni
- Page 325 and 326:
chernozem soil in all pots either.
- Page 327 and 328:
THE INFLUENCE OF USING BIOLOGICAL A
- Page 329 and 330:
2. The influence of using inoculant
- Page 331 and 332:
Table 3: The evolution of weight ga
- Page 333 and 334:
REFERENCES 4. Anon D.L. (1997): - S
- Page 335 and 336:
chernozem represents the dominant s
- Page 337 and 338:
AD% AD% 4 3,5 3 2,5 2 1,5 1 0,5 0 T
- Page 339 and 340:
Negative reaction was recorded in t
- Page 341 and 342:
The Tentant variety positively reac
- Page 343 and 344:
Table 1. The density of harmful pes
- Page 345 and 346:
vegetation period, without affectin
- Page 347 and 348:
THE IMPORTANCE OF CONTROLLING FORMA
- Page 349 and 350:
3:1 to 5:3 . In the following exper
- Page 351 and 352:
REFERENCES 1. Bartzokas, C. A., K.
- Page 353 and 354:
For micro-elements, EDTA+KCl 15 tim
- Page 355 and 356:
Ca CO3(%) = AL − Cax2,5 10000 EDT
- Page 357 and 358:
ABSTRACT BIOLOGICAL INVESTIGATION O
- Page 359 and 360:
profiles were typical for catena po
- Page 361 and 362:
Table 2: Collembola species composi
- Page 363 and 364:
Larsen, T., P. Schjonning, J. Axels
- Page 365 and 366:
The alimentary problem has constitu
- Page 367 and 368:
Table 3. The average annual consump
- Page 369 and 370:
FROM FARM TO FORK - EVALUATION OF C
- Page 371 and 372:
we made a deeper vertical sampling
- Page 373 and 374:
Although the toxic element content
- Page 375 and 376:
ACKNOWLEDGEMENTS This work was supp
- Page 377 and 378:
l/mp 120 100 80 60 40 20 0 Fig. 3 M
- Page 379 and 380:
during this period, though not so s
- Page 381 and 382:
• the pluviometric regime was als
- Page 383 and 384:
1. Specific weight was study accord
- Page 385 and 386:
Table 4. Absolut weight MA g result
- Page 387 and 388:
Very significant decrease are in V4
- Page 389 and 390:
OCEAN DYNAMICS: AIR-SEA INTERFACE G
- Page 391 and 392:
∂ C Φ = - ε (3) ∂z where Φ i
- Page 393 and 394:
n = - 1 ⁄ 2 [1]-[4]. The later mo
- Page 395 and 396:
elucidated yet. We must also imply
- Page 397 and 398:
RESEARCHES ON THE QUICK METHOD OF S
- Page 399 and 400:
SU8 = (Za/QB) - 100; C8 = (Z8/P8) -
- Page 401 and 402:
There are the following calculation
- Page 403 and 404:
- preheaters - towards condensation
- Page 405 and 406:
Circulation speed of the concentrat
- Page 407 and 408:
RESEARCH ON SEEDING AGENTS TO EFFEC
- Page 409 and 410:
• about 160 porcelain balls havin
- Page 411 and 412:
For the crystal mass the following
- Page 413 and 414:
WATER DIFFUSION IN BREAD DURING BAK
- Page 415 and 416:
RESULTS Temperature distribution: W
- Page 417 and 418:
During the chemical changes the por
- Page 419 and 420:
CONCLUSIONS The water content in th
- Page 421 and 422:
those portions that are not, are no
- Page 423 and 424:
Tension: For bread prepared under l
- Page 425 and 426:
obscured. It has been stated that r
- Page 427 and 428:
THE MATHEMATICAL MODELLING OF THE P
- Page 429 and 430:
It was marked with AI the area of t
- Page 431 and 432:
mcb [g] mcb [g] mcb [g] 0,040 0,030
- Page 433 and 434:
The calculation of engines with spa
- Page 435 and 436:
THE VARIATION OF EFFECTIVE POWER AN
- Page 437 and 438:
437
- Page 439 and 440:
ce [g/kW h] 400.019 350.019 300.019
- Page 441 and 442:
THE EFFECT OF THE GENOTYPE AND EXPL
- Page 443 and 444:
) The cultures were incubated at cc
- Page 445 and 446:
% embryogenic inductio 60 50 40 30
- Page 447 and 448:
Table 1 The three way Anova type 3x
- Page 449 and 450:
Table 4 The effect of developmental
- Page 451 and 452:
was the explant type (the developme
- Page 453 and 454:
ABSTRACT COMPARATIVE TESTS FOR SEPA
- Page 455 and 456:
Column extraction (Beck, H. and Mat
- Page 457 and 458:
Fat Percentage Fat percentage 4.4 4
- Page 459 and 460:
HIGHLIGHTING THE STATE OF FRESHNESS
- Page 461 and 462:
REFERENCES 1. Eftimie V.M. Particul
- Page 463 and 464:
In table 1 the results obtained as
- Page 465 and 466:
FORENSIC ASPECTS REGARDING DISASTER
- Page 467 and 468:
• depositing the bodies and the e
- Page 469 and 470:
FORM NO. 3 ITEM IDENTIFICATION Pers
- Page 471 and 472:
- utilised in a biogas processing p
- Page 473 and 474:
Viscosity [◦E] 14 12 10 8 6 4 2 0
- Page 475 and 476:
As in any other cyclic, infectious,
- Page 477 and 478:
usually incompatible with life or c
- Page 479 and 480:
The family doctors must be informed
- Page 481 and 482:
2. botulism of inoculation-through
- Page 483 and 484:
The repartition of the provenience
- Page 485 and 486:
3. The patients hospitalizations mo
- Page 487 and 488:
possibility that, due to the chelat
- Page 489 and 490:
difference of extinction % 120 100
- Page 491 and 492:
Horváth E., Szalai G., Pál m., P
- Page 493 and 494:
chlorophyll contents and the values
- Page 495 and 496:
Table 1.Estimative mean values for
- Page 497 and 498:
TREE GROWTH EQUATIONS IN DIFFERENT
- Page 499 and 500:
Image no.1 ImageTool programme was
- Page 501 and 502:
Following the results obtained, the
- Page 503 and 504:
ms. The placement of the areas was
- Page 505 and 506:
Another possible simulated break in
- Page 507 and 508:
- distribution after break case 2 y
- Page 509 and 510:
THE FREQUENCY OF DAYS WITH DIFFEREN
- Page 511 and 512:
200 190 180 170 160 150 140 130 120
- Page 513 and 514:
October, and at higher altitudes (0
- Page 515 and 516:
5. The frequency of tropical days r
- Page 517 and 518:
At the same time, the genesis of fl
- Page 519 and 520:
winter the floods frequency has sma
- Page 521 and 522:
% 14 12 10 8 6 4 2 0 I II III IV V
- Page 523 and 524:
RESEARCH REGARDING MAIN CHEMICAL RE
- Page 525 and 526:
• Ensuring the juice’ thermal s
- Page 527 and 528:
mud which is evacuated out of the p
- Page 529 and 530:
MATERIALS AND METHOD Apparatus Clea
- Page 531 and 532:
THE IMPORTANCE OF VOLATILE N-NITROS
- Page 533 and 534:
The fat cooked out of some of the b
- Page 535 and 536:
A problem concerning the formation
- Page 537 and 538:
Sample 3, found to contain 343 ppb
- Page 539 and 540:
LUNG CANCER CAUSED BY SMOKING AND C
- Page 541 and 542:
µg/g dry weight). The pulmonary Cd
- Page 543 and 544:
MATERIALS AND METHOD Apparatus and
- Page 545 and 546:
for either TLC or reverse-phase LC
- Page 547 and 548:
trigger still other responses. In t
- Page 549 and 550:
these general patterns appear to be
- Page 551 and 552:
The question of determining a “sa
- Page 553 and 554:
CLINICAL AND EPIDEMIOLOGICAL ASPECT
- Page 555 and 556:
Figure 3.-Life Cycle of Echinococcu
- Page 557 and 558:
that the values are 1 case at 600.0
- Page 559 and 560:
Paraclinical data From the laborato
- Page 561 and 562:
THIN LAYER CHROMATOGRAPHY OF STERIG
- Page 563 and 564:
Column Chromatography Loosely place
- Page 565 and 566:
that spot intensity could be regene
- Page 567 and 568:
its metabolism by oxidative pathway
- Page 569 and 570:
Exposure time weeks 1 2 3 Table 2.
- Page 571 and 572:
attempted accommodation to the diet
- Page 573 and 574:
series, a dose of 0.5 ppm NDMA was
- Page 575 and 576:
At 500 ppb and at all higher doses,
- Page 577 and 578:
supernatants by a modified cadmium
- Page 579 and 580:
adioimmunoassay and by cadmium satu
- Page 581 and 582:
• The intermediary form appears b
- Page 583 and 584:
sex. In fact, there are no data in
- Page 585 and 586:
SOME ASPECTS OF SHELTER REGENERATIO
- Page 587 and 588:
In the following lines it is presen
- Page 589 and 590:
Număr de arbori 160 140 120 100 80
- Page 591 and 592:
Analysing the data presented in the
- Page 593 and 594:
WASTEWATER TREATMENT TEHNOLOGIES OF
- Page 595 and 596:
As a result of the comparisons betw
- Page 597 and 598:
CONCLUSIONS Anaerobe-aerobe treatme
- Page 599 and 600:
REGIONAL DEVELOPMENT USING CONSTRUC
- Page 601 and 602:
characterized by marshy plants like
- Page 603 and 604:
watersurface, but their roots are t
- Page 605 and 606:
• Which of the heavy metals that
- Page 607 and 608:
Figure 2 shows that Cd also is conc