

Intelligent Tutoring Systems for Ill-Defined Domains - Philippe ...
Intelligent Tutoring Systems for Ill-Defined Domains - Philippe ...
Intelligent Tutoring Systems for Ill-Defined Domains - Philippe ...

Create successful ePaper yourself
Turn your PDF publications into a flip-book with our unique Google optimized e-Paper software.
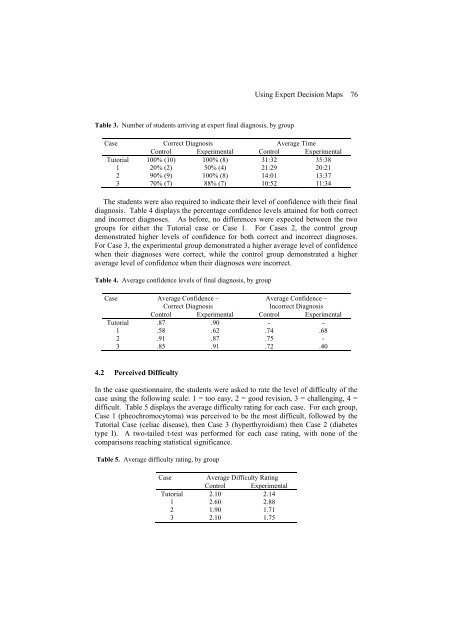
Table 3. Number of students arriving at expert final diagnosis, by group<br />
Case Correct Diagnosis Average Time<br />
Control Experimental Control Experimental<br />
Tutorial 100% (10) 100% (8) 31:32 35:38<br />
1 20% (2) 50% (4) 21:29 20:21<br />
2 90% (9) 100% (8) 14:01 13:37<br />
3 70% (7) 88% (7) 10:52 11:34<br />
The students were also required to indicate their level of confidence with their final<br />
diagnosis. Table 4 displays the percentage confidence levels attained <strong>for</strong> both correct<br />
and incorrect diagnoses. As be<strong>for</strong>e, no differences were expected between the two<br />
groups <strong>for</strong> either the Tutorial case or Case 1. For Cases 2, the control group<br />
demonstrated higher levels of confidence <strong>for</strong> both correct and incorrect diagnoses.<br />
For Case 3, the experimental group demonstrated a higher average level of confidence<br />
when their diagnoses were correct, while the control group demonstrated a higher<br />
average level of confidence when their diagnoses were incorrect.<br />
Table 4. Average confidence levels of final diagnosis, by group<br />
Case Average Confidence –<br />
Average Confidence –<br />
Correct Diagnosis<br />
Incorrect Diagnosis<br />
Control Experimental Control Experimental<br />
Tutorial .87 .90 - -<br />
1 .58 .62 .74 .68<br />
2 .91 .87 .75 -<br />
3 .85 .91 .72 .40<br />
4.2 Perceived Difficulty<br />
In the case questionnaire, the students were asked to rate the level of difficulty of the<br />
case using the following scale: 1 = too easy, 2 = good revision, 3 = challenging, 4 =<br />
difficult. Table 5 displays the average difficulty rating <strong>for</strong> each case. For each group,<br />
Case 1 (pheochromocytoma) was perceived to be the most difficult, followed by the<br />
Tutorial Case (celiac disease), then Case 3 (hyperthyroidism) then Case 2 (diabetes<br />
type I). A two-tailed t-test was per<strong>for</strong>med <strong>for</strong> each case rating, with none of the<br />
comparisons reaching statistical significance.<br />
Table 5. Average difficulty rating, by group<br />
Case Average Difficulty Rating<br />
Control Experimental<br />
Tutorial 2.10 2.14<br />
1 2.60 2.88<br />
2 1.90 1.71<br />
3 2.10 1.75<br />
Using Expert Decision Maps 76