Create successful ePaper yourself
Turn your PDF publications into a flip-book with our unique Google optimized e-Paper software.
<strong>IMS</strong> COM PANY PRO FILES TAKEDA<br />
<strong>IMS</strong> Sales Data<br />
Pharmaceutical Sales by Geographical Region and Leading Countries<br />
Country Share<br />
of Regional<br />
Corporate Sales<br />
%<br />
Percentage<br />
Growth Sep<br />
07/Sep 08<br />
USD USD FIXED<br />
RATE<br />
TOTAL SALES 100.0 10 5<br />
NORTH AMERICA 55.6 5 5<br />
U.S.A. 100.0 5 5<br />
ASIA, AFRICA & AUSTRALASIA 33.7 16 6<br />
JAPAN 96.0 16 5<br />
THAILAND 1.3 33 27<br />
TAIWAN 1.2 13 7<br />
INDONESIA TOT MKT 0.5 17 19<br />
CHINA HOSPITAL 0.3 13 4<br />
EUROPE 10.1 17 5<br />
FRANCE 26.8 3 -9<br />
GERMANY 26.1 21 7<br />
ITALY 19.6 20 6<br />
UNITED KINGDOM 14.8 38 38<br />
AUSTRIA 4.7 23 8<br />
LATIN AMERICA 0.6 18 18<br />
PUERTO RICO 100.0 18 18<br />
DOMINICAN REP RET 0.0 -25 -22<br />
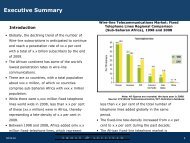
The com pany’s phar ma ceu ti cal sales are an a lyzed in terms of geo graph ical re gion, and within each re -<br />
gion the ma jor coun tries pre sented. Sales data cov ers the twelve months to Sep tem ber 2008. See Ap -<br />
pen dix for coun try universe sourced.<br />
Sales and growth for the au dited Latin Amer i can coun tries are pre sented in US dol lars only. The de ci sion<br />
for con ver sion to US dol lars was due to ex ces sive in fla tion and sub se quent de val u a tions lead ing to both<br />
lo cal cur rency and ex change rates ex ceed ing the field sizes avail able for them on the MIDAS database.<br />
� Takeda Total Sales by Top Five Markets<br />
Source: <strong>IMS</strong> Health<br />
France<br />
3%<br />
Germany<br />
3%<br />
Japan<br />
32%<br />
Italy Others<br />
2% 5%<br />
Sales by Top 5 Markets<br />
USA<br />
55%<br />
© 2009 <strong>IMS</strong> Health In cor po rated or its af fil i ates Page 85