- Page 2 and 3:
Fighter Combat TACTICS AND MANEUVER
- Page 4 and 5:
Preface ix Acknowledgments xv Abbre
- Page 6:
CONTENTS Vll Single-Side Offset 353
- Page 9 and 10:
X PREFACE tactics varied greatly, a
- Page 11 and 12:
Xll PREFACE current void of informa
- Page 14 and 15:
Acknowledgments Much of the credit
- Page 16 and 17:
Abbreviations AAA anti-aircraft art
- Page 18:
Fighter Combat TACTICS AND MANEUVER
- Page 21 and 22:
2 FIGHTER WEAPONS although fixed to
- Page 23 and 24:
4 FIGHTER WEAPONS some firing range
- Page 25 and 26:
Table 1-1. American Aircraft Guns T
- Page 27 and 28:
8 FIGHTER WEAPONS angle is also dep
- Page 29 and 30:
10 FIGHTER WEAPONS the ballistics o
- Page 31 and 32:
12 HGHTER WEAPONS often bars of lig
- Page 33 and 34:
14 FIGHTER WEAPONS This system has
- Page 35 and 36:
16 FIGHTER WEAPONS required firing
- Page 37 and 38:
18 FIGHTER WEAPONS With a disturbed
- Page 39 and 40:
20 FIGHTER WEAPONS We were both fly
- Page 41 and 42:
22 FIGHTER WEAPONS The predictor LC
- Page 43 and 44:
24 FIGHTER WEAPONS The next best th
- Page 45 and 46:
26 FIGHTER WEAPONS tracking G, shor
- Page 47 and 48:
28 FIGHTER WEAPONS defender's inten
- Page 49 and 50:
30 FIGHTER WEAPONS and acrobatic ma
- Page 51 and 52:
32 FIGHTER WEAPONS Missile Propulsi
- Page 53 and 54:
34 FIGHTER WEAPONS Missile Guidance
- Page 55 and 56:
36 FIGHTER WEAPONS straight path. T
- Page 57 and 58:
38 FIGHTER WEAPONS target to correc
- Page 59 and 60:
40 FIGHTER WEAPONS sensor systems,
- Page 61 and 62:
42 FIGHTER WEAPONS Since CW radars
- Page 63 and 64:
44 FIGHTER WEAPONS Missile Fuzes Th
- Page 65 and 66:
46 FIGHTER WEAPONS prised of many i
- Page 67 and 68:
48 FIGHTER WEAPONS The maneuvering
- Page 69 and 70:
50 FIGHTER WEAPONS racy being about
- Page 71 and 72:
52 FIGHTER WEAPONS then slowing the
- Page 73 and 74:
54 FIGHTER WEAPONS Shooter and targ
- Page 75 and 76:
56 FIGHTER WEAPONS will exhibit lar
- Page 77 and 78:
58 FIGHTER WEAPONS (RWR), that an e
- Page 79 and 80:
60 FIGHTER WEAPONS barrel-rolling a
- Page 81 and 82:
2 Basic Fighter Maneuvers I fly clo
- Page 83 and 84:
64 BASIC FIGHTER MANEUVERS the comb
- Page 85 and 86:
66 BASIC FIGHTER MANEUVERS himself
- Page 87 and 88:
68 BASIC FIGHTER MANEUVERS speed ad
- Page 89 and 90:
70 BASIC FIGHTER MANEUVERS pursuit
- Page 91 and 92:
72 BASIC FIGHTER MANEUVERS Figure 2
- Page 93 and 94:
74 Figure 2-7. Low Yo-Yo BASIC FIGH
- Page 95 and 96:
76 BASIC FIGHTER MANEUVERS The pote
- Page 97 and 98:
78 BASIC FIGHTER MANEUVERS Figure 2
- Page 99 and 100:
80 BASIC FIGHTER MANEUVERS In case
- Page 101 and 102:
82 BASIC FIGHTER MANEUVERS capitali
- Page 103 and 104:
84 BASIC FIGHTER MANEUVERS one (the
- Page 105 and 106:
86 BASIC FIGHTER MANEUVERS his exte
- Page 107 and 108:
88 BASIC FIGHTER MANEUVERS Figure 2
- Page 109 and 110:
90 BASIC FIGHTER MANEUVERS the boge
- Page 111 and 112:
92 BASIC FIGHTER MANEUVERS subseque
- Page 113 and 114:
94 Figure 2-22. Defensive Spiral BA
- Page 115 and 116:
96 BASIC FIGHTER MANEUVERS usually
- Page 117 and 118:
3 One-versus-One Maneuvering, Simil
- Page 119 and 120:
100 ONE-VERSUS-ONE MANEUVERING, SIM
- Page 121 and 122:
102 ONE-VERSUS-ONE MANEUVERING, SIM
- Page 123 and 124:
104 ONE-VERSUS-ONE MANEUVERING, SIM
- Page 125 and 126:
106 ONE-VERSUS-ONE MANEUVERING, SIM
- Page 127 and 128:
108 ONE-VERSUS-ONE MANEUVERING, SIM
- Page 129 and 130:
110 ONE-VERSUS-ONE MANEUVERING, SIM
- Page 131 and 132:
112 ONE-VERSUS-ONE MANEUVERING, SIM
- Page 133 and 134:
114 ONE-VERSUS-ONE MANEUVERING, SIM
- Page 135 and 136:
116 ONE-VERSUS-ONE MANEUVERING, SIM
- Page 137 and 138:
118 ONE-VERSUS-ONE MANEUVERING, SIM
- Page 139 and 140:
120 ONE-VERSUS-ONE MANEUVERING, SIM
- Page 141 and 142:
122 ONE-VERSUS-ONE MANEUVERING, SIM
- Page 143 and 144:
124 ONE-VERSUS-ONE MANEUVERING, SIM
- Page 145 and 146:
126 ONE-VERSUS-ONE MANEUVERING, SIM
- Page 147 and 148:
128 ONE-VERSUS-ONE MANEUVERING, SIM
- Page 149 and 150:
130 ONE-VERSUS-ONE MANEUVERING, SIM
- Page 151 and 152:
132 ONE-VERSUS-ONE MANEUVERING, SIM
- Page 153 and 154:
134 ONE-VERSUS-ONE MANEUVERING, SIM
- Page 155 and 156:
136 ONE-VERSUS-ONE MANEUVERING, SIM
- Page 157 and 158:
138 ONE-VERSUS-ONE MANEUVERING, SIM
- Page 159 and 160:
140 ONE-VERSUS-ONE MANEUVERING, DIS
- Page 161 and 162:
142 ONE-VERSUS-ONE MANEUVERING, DIS
- Page 163 and 164:
144 ONE-VERSUS-ONE MANEUVERING, DIS
- Page 165 and 166:
146 ONE-VERSUS-ONE MANEUVERING, DIS
- Page 167 and 168:
148 ONE-VERSUS-ONE MANEUVERING, DIS
- Page 169 and 170:
150 ONE-VERSUS-ONE MANEUVERING, DIS
- Page 171 and 172:
152 ONE-VERSUS-ONE MANEUVERING, DIS
- Page 173 and 174:
154 ONE-VERSUS-ONE MANEUVERING, DIS
- Page 175 and 176:
156 ONE-VERSUS-ONE MANEUVERING, DIS
- Page 177 and 178:
158 ONE-VERSUS-ONE MANEUVERING, DIS
- Page 179 and 180:
160 ONE-VERSUS-ONE MANEUVERING, DIS
- Page 181 and 182:
162 ONE-VERSUS-ONE MANEUVERING, DIS
- Page 183 and 184:
164 ONE-VERSUS-ONE MANEUVERING, DIS
- Page 185 and 186:
166 ONE-VERSUS-ONE MANEUVERING, DIS
- Page 187 and 188:
168 ONE-VERSUS-ONE MANEUVERING, DIS
- Page 189 and 190:
1 70 ONE-VERSUS-ONE MANEUVERING, DI
- Page 191 and 192:
172 ONE-VERSUS-ONE MANEUVERING, DIS
- Page 193 and 194:
1 74 ONE-VERSUS-ONE MANEUVERING, DI
- Page 195 and 196:
1 76 ONE-VERSUS-ONE MANEUVERING, DI
- Page 197 and 198:
1 78 ONE-VERSUS-ONE MANEUVERING, DI
- Page 199 and 200:
180 ONE-VERSUS-ONE MANEUVERING, DIS
- Page 201 and 202:
182 ONE-VERSUS-ONE MANEUVERING, DIS
- Page 203 and 204:
184 ONE-VERSUS-ONE MANEUVERING, DIS
- Page 205 and 206:
186 ONE-VERSUS-ONE MANEUVERING, DIS
- Page 207 and 208:
188 ONE-VERSUS-ONE MANEUVERING, DIS
- Page 209 and 210:
190 ONE-VERSUS-ONE MANEUVERING, DIS
- Page 211 and 212:
192 ONE-VERSUS-ONE MANEUVERING, DIS
- Page 213 and 214:
194 ONE-VERSUS-ONE MANEUVERING, DIS
- Page 215 and 216:
196 SECTION TACTICS, TWOVERSUS-ONE
- Page 217 and 218:
198 SECTION TACTICS, TWOVERSUS-ONE
- Page 219 and 220:
200 SECTION TACTICS, TWOVERSUS-ONE
- Page 221 and 222:
202 SECTION TACTICS, TWOVERSUS-ONE
- Page 223 and 224:
204 SECTION TACTICS, TWOVERSUS-ONE
- Page 225 and 226:
206 SECTION TACTICS. TWOVERSUS-ONE
- Page 227 and 228:
208 SECTION TACTICS, TWOVERSUS-ONE
- Page 229 and 230:
210 SECTION TACTICS, TWO-VERSUS-ONE
- Page 231 and 232:
212 SECTION TACTICS, TWO-VERSUS-ONE
- Page 233 and 234:
214 SECTION TACTICS, TWOVERSUS-ONE
- Page 235 and 236:
216 SECTION TACTICS, TWO-VERSUS-ONE
- Page 237 and 238:
218 SECTION TACTICS, TWO-VERSUS-ONE
- Page 239 and 240:
220 SECTION TACTICS, TWOVERSUS-ONE
- Page 241 and 242:
222 SECTION TACTICS, TWO-VERSUS-ONE
- Page 243 and 244:
224 SECTION TACTICS, TWOVERSUS-ONE
- Page 245 and 246:
226 SECTION TACTICS/ TWOVERSUS-ONE
- Page 247 and 248:
228 SECTION TACTICS, TWOVERSUS-ONE
- Page 249 and 250:
230 SECTION TACTICS, TWO-VERSUS-ONE
- Page 251 and 252:
232 SECTION TACTICS, TWOVERSUS-ONE
- Page 253 and 254:
234 SECTION TACTICS, TWOVERSUS-ONE
- Page 255 and 256:
Section Tactics, Two-versus-Two The
- Page 257 and 258:
238 SECTION TACTICS, TWOVERSUS-TWO
- Page 259 and 260:
240 SECTION TACTICS, TWOVERSUS-TWO
- Page 261 and 262:
242 SECTION TACTICS, TWOVERSUS-TWO
- Page 263 and 264:
244 SECTION TACTICS, TWOVERSUS-TWO
- Page 265 and 266:
246 SECTION TACTICS, TWOVERSUS-TWO
- Page 267 and 268:
248 SECTION TACTICS, TWOVERSUS-TWO
- Page 269 and 270:
250 SECTION TACTICS, TWOVERSUS-TWO
- Page 271 and 272:
252 SECTION TACTICS, TWOVERSUS-TWO
- Page 273 and 274:
254 SECTION TACTICS, TWOVERSUS-TWO
- Page 275 and 276:
256 SECTION TACTICS, TWC-VERSUS-TWO
- Page 277 and 278:
258 SECTION TACTICS, TWOVERSUS-TWO
- Page 279 and 280:
260 SECTION TACTICS, TWOVERSUS-TWO
- Page 281 and 282:
262 SECTION TACTICS, TWOVERSUS-TWO
- Page 283 and 284:
264 SECTION TACTICS, TWOVERSUS-TWO
- Page 285 and 286:
7 Division Tactics The essence of l
- Page 287 and 288:
268 DIVISION TACTICS design began t
- Page 289 and 290:
270 DIVISION TACTICS so called beca
- Page 291 and 292:
272 DIVISION TACTICS "4." At time "
- Page 293 and 294:
274 DIVISION TACTICS Figure 7-8. Se
- Page 295 and 296:
276 DIVISION TACTICS Lieutenant Eug
- Page 297 and 298:
278 DIVISION TACTICS away, the free
- Page 299 and 300:
280 DIVISION TACTICS cloud) is now
- Page 301 and 302:
282 DIVISION TACTICS Figure 7-13. G
- Page 303 and 304:
284 DIVISION TACTICS defensive look
- Page 305 and 306:
286 DIVISION TACTICS In a dog-fight
- Page 307 and 308:
288 DIVISION TACTICS Americans empl
- Page 309 and 310:
8 Unlimited-Aircraft Tactics Of cou
- Page 311 and 312:
292 UNLIMITED-AIRCRAFT TACTICS seve
- Page 313 and 314:
294 UN LIMITED-AIRCRAFT TACTICS the
- Page 315 and 316:
296 UNLIMITED-AIRCRAFT TACTICS beca
- Page 317 and 318:
298 UNLIMITED-AIRCRAFT TACTICS I de
- Page 319 and 320:
300 UNLIMITED-AIRCRAFT TACTICS post
- Page 321 and 322:
302 UNLIMITED-AIRCRAFT TACTICS many
- Page 323 and 324:
304 UNLIMITED-AIRCRAFT TACTICS poss
- Page 325 and 326:
306 UNLIMITED-AIRCRAFT TACTICS posi
- Page 327 and 328:
308 UNLIMITED-AIRCRAFT TACTICS may
- Page 329 and 330:
310 UNLIMITED-AIRCRAFT TACTICS inte
- Page 331 and 332:
312 UNLIMITED-AIRCRAFT TACTICS A go
- Page 333 and 334:
314 UNLIMITED-AIRCRAFT TACTICS doct
- Page 335 and 336:
Fighter Missions To use a fighter a
- Page 337 and 338:
318 FIGHTER MISSIONS Scenarios Sinc
- Page 339 and 340:
320 FIGHTER MISSIONS altitude, deta
- Page 341 and 342:
322 FIGHTER MISSIONS agency and the
- Page 343 and 344:
324 FIGHTER MISSIONS As previously
- Page 345 and 346:
326 FIGHTER MISSIONS cruise missile
- Page 347 and 348:
328 FIGHTER MISSIONS pattern gives
- Page 349 and 350:
330 FIGHTER MISSIONS have to coordi
- Page 351 and 352:
332 FIGHTER MISSIONS can be turned
- Page 353 and 354:
334 FIGHTER MISSIONS the enemy. Suc
- Page 355 and 356:
336 FIGHTER MISSIONS aircraft, and
- Page 357 and 358: 338 FIGHTER MISSIONS point for a di
- Page 359 and 360: 340 FIGHTER MISSIONS become major t
- Page 361 and 362: 342 Figure 9-3. Fighter-Escort Miss
- Page 363 and 364: 344 FIGHTER MISSIONS Figure 9-6. Fi
- Page 365 and 366: 10 Tactical Intercepts Confront the
- Page 367 and 368: 348 TACTICAL INTERCEPTS Figure 10-1
- Page 369 and 370: 350 TACTICAL INTERCEPTS desired alt
- Page 371 and 372: 352 TACTICAL INTERCEPTS If the turn
- Page 373 and 374: 354 TACTICAL INTERCEPTS Figure 10-4
- Page 375 and 376: 356 TACTICAL INTERCEPTS range). If
- Page 377 and 378: 358 TACTICAL INTERCEPTS ment, and t
- Page 379 and 380: 360 TACTICAL INTERCEPTS Advantages
- Page 381 and 382: 362 TACTICAL INTERCEPTS Figure 10-1
- Page 383 and 384: 364 TACTICAL INTERCEPTS leader thro
- Page 385 and 386: 366 TACTICAL INTERCEPTS immediate l
- Page 387 and 388: 368 TACTICAL INTERCEPTS awareness),
- Page 389 and 390: 370 TACTICAL INTERCEPTS and positio
- Page 391 and 392: 372 TACTICAL INTERCEPTS low, traili
- Page 393 and 394: 374 TACTICAL INTERCEPTS Figure 10-1
- Page 395 and 396: 376 TACTICAL INTERCEPTS also have t
- Page 397 and 398: 378 TACTICAL INTERCEPTS Visual Scan
- Page 399 and 400: 380 TACTICAL INTERCEPTS Likely thre
- Page 401 and 402: 382 TACTICAL INTERCEPTS be best for
- Page 403 and 404: 384 TACTICAL INTERCEPTS target on t
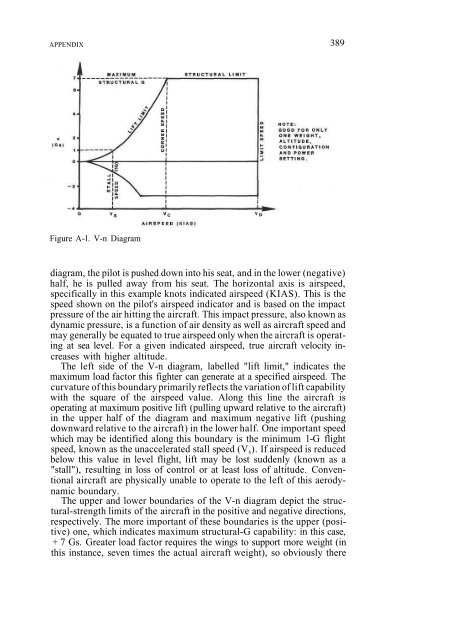
- Page 406 and 407: Appendix Fighter Performance Perfor
- Page 410 and 411: APPENDIX 391 Figure A-2. Aircraft T
- Page 412 and 413: APPENDIX 393 Figure A-4. Instantane
- Page 414 and 415: APPENDIX 395 neuverability may be d
- Page 416 and 417: APPENDIX 397 Figure A-7. Engine Thr
- Page 418 and 419: APPENDIX 399 tends to reduce pressu
- Page 420 and 421: APPENDIX 401 Figure A-11. Typical H
- Page 422 and 423: APPENDIX 403 cause the Ps = 0 line
- Page 424 and 425: APPENDIX 405 In theory the energy t
- Page 426 and 427: APPENDIX 407 aircraft surfaces. In
- Page 428 and 429: APPENDIX 409 Outside the zero-Ps li
- Page 430 and 431: APPENDIX 411 factor," which is the
- Page 432 and 433: APPENDIX 413 this condition occurs,
- Page 434 and 435: APPENDIX 415 speed control. Many of
- Page 436: APPENDIX 417 short or swept wings a
- Page 439 and 440: 420 BIBLIOGRAPHY Johnson, Robert S.
- Page 441 and 442: 422 INDEX Canard controls, 32, 398
- Page 443 and 444: 424 High yo-yo. See Yo-yo, high H-M
- Page 445 and 446: 426 INDEX Pursuit: curves and traje
- Page 447: 428 INDEX Turns (continued] 191, 20