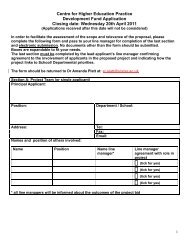
ACTION PLAN - University of Ulster
ACTION PLAN - University of Ulster
ACTION PLAN - University of Ulster

You also want an ePaper? Increase the reach of your titles
YUMPU automatically turns print PDFs into web optimized ePapers that Google loves.
The following was obtained from the January 7, 2003 Retention<br />
Consulting Visit One Report and gives an indication <strong>of</strong> the need for<br />
improvement in the ULM retention and graduation rates as compared<br />
to retention and graduation statistics for similar universities.<br />
Retention and Graduation Rates<br />
According to ACT classification by standardized tests, the <strong>University</strong> <strong>of</strong> Louisiana at<br />
Monroe is a “traditional” institution, though on the low end <strong>of</strong> the range <strong>of</strong><br />
preparedness as measured by standardized national tests. The charts below show<br />
average retention and graduation rates <strong>of</strong> comparable institutions – public colleges<br />
whose highest award granted is a doctoral degree (ACT, 2002).<br />
Selectivity Levels as Defined by Standardized Test Scores<br />
<strong>University</strong> <strong>of</strong> Louisiana at Monroe<br />
January 7, 2003<br />
Selectivity Level ACT Scores SAT Scores<br />
Highly Selective 27-31 1220-1380<br />
Selective 22-27 1030-1220<br />
Traditional 20-23* 950-1070<br />
Liberal 18-21 870-990<br />
Open 17-20 830-950<br />
*ULM’s current ACT requirement <strong>of</strong> 22 places the institution at the traditional level <strong>of</strong><br />
selectivity.<br />
First- to Second-Year Retention<br />
The chart below shows average retention rates <strong>of</strong> first-time, full-time students to the second year<br />
at comparable institutions (ACT, 2002).<br />
National Average Retention Rates by Selectivity <strong>of</strong> Institution<br />
<strong>University</strong> <strong>of</strong> Louisiana at Monroe<br />
January 7, 2003<br />
Admissions Selectivity A.A. B.A. M.A. Ph.D.<br />
Highly Selective 88.6 88.5 91.6<br />
Selective 77.6 78.3 80.2<br />
Traditional 57.7 71.5 71.4 72.0*<br />
Liberal 54.9 67.2 65.4 68.2<br />
Open 51.6 55.3 54.9 63.5<br />
*ULM’s three-year average retention rate is 60.2 percent.