Urine pH - Journal of Analytical Toxicology
Urine pH - Journal of Analytical Toxicology
Urine pH - Journal of Analytical Toxicology

You also want an ePaper? Increase the reach of your titles
YUMPU automatically turns print PDFs into web optimized ePapers that Google loves.
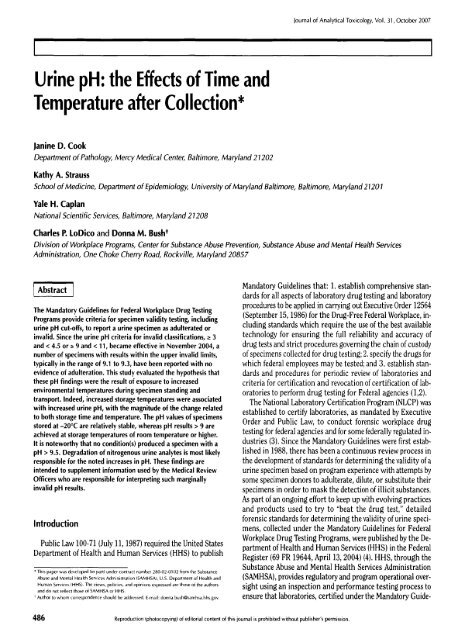
<strong>Urine</strong> <strong>pH</strong>: the Effects <strong>of</strong> Time and<br />
Temperature after Collection*<br />
Janine D. Cook<br />
Department <strong>of</strong> Pathology, Mercy Medical Center, Baltimore, Maryland 21202<br />
<strong>Journal</strong> <strong>of</strong> <strong>Analytical</strong> <strong>Toxicology</strong>, Vol. 31, October 2007<br />
Kathy A. Strauss<br />
School <strong>of</strong> Medicine, Department <strong>of</strong> Epidemiology, University <strong>of</strong> Maryland Baltimore, Baltimore, Maryland21201<br />
Yale H. Caplan<br />
National Scientific Services, Baltimore, Maryland 21208<br />
Charles P. toDico and Donna M. Bush ~<br />
Division <strong>of</strong> Workplace Programs, Center for Substance Abuse Prevention, Substance Abuse and Mental Health Services<br />
Administration, One Choke Cherry Road, Rockville, Maryland 20857<br />
Abstract<br />
The Mandatory Guidelines for Federal Workplace Drug Testing<br />
Programs provide criteria for specimen validity testing, including<br />
urine <strong>pH</strong> cut-<strong>of</strong>fs, to report a urine specimen as adulterated or<br />
invalid. Since the urine <strong>pH</strong> criteria for invalid classifications, ~ 3<br />
and < 4.5 or ~ 9 and < 11, became effective in November 2004, a<br />
number <strong>of</strong> specimens with results within the upper invalid limits,<br />
typically in the range <strong>of</strong> 9.1 to 9.3, have been reported with no<br />
evidence <strong>of</strong> adulteration. This study evaluated the hypothesis that<br />
these <strong>pH</strong> findings were the result <strong>of</strong> exposure to increased<br />
environmental temperatures during specimen standing and<br />
transport. Indeed, increased storage temperatures were associated<br />
with increased urine <strong>pH</strong>, with the magnitude <strong>of</strong> the change related<br />
to both storage time and temperature. The <strong>pH</strong> values <strong>of</strong> specimens<br />
stored at -20~ are relatively stable, whereas <strong>pH</strong> results > 9 are<br />
achieved at storage temperatures <strong>of</strong> room temperature or higher.<br />
It is noteworthy that no condition(s) produced a specimen with a<br />
<strong>pH</strong> > 9.5. Degradation <strong>of</strong> nitrogenous urine analytes is most likely<br />
responsible for the noted increases in <strong>pH</strong>. These findings are<br />
intended to supplement information used by the Medical Review<br />
Officers who are responsible for interpreting such marginally<br />
invalid <strong>pH</strong> results.<br />
Introduction<br />
Public Law 100-71 (July 11, 1987) required the United States<br />
Department <strong>of</strong> Health and Human Services (HHS) to publish<br />
* This paper was developed (in part) under contract number 280-02-0102 from the Substance<br />
Abuse and Mental Health Services Administration (SAMHSA). U.S. Department <strong>of</strong> Health and<br />
Human Services (HHS). ]he views, policies, and opinions expressed are those <strong>of</strong> the authors<br />
and do not reflect those <strong>of</strong> SAMHSA or HHS.<br />
t Author to whom correspondence should be addressed. E-mail: donna.bush@samhsa.hhs.gov.<br />
Mandatory Guidelines that: 1. establish comprehensive stan-<br />
dards for all aspects <strong>of</strong> laboratory drug testing and laboratory<br />
procedures to be applied in carrying out Executive Order 12564<br />
(September 15, 1986) for the Drug-Free Federal Workplace, in-<br />
cluding standards which require the use <strong>of</strong> the best available<br />
technology for ensuring the full reliability and accuracy <strong>of</strong><br />
drug tests and strict procedures governing the chain <strong>of</strong> custody<br />
<strong>of</strong> specimens collected for drug testing; 2. specify the drugs for<br />
which federal employees may be tested; and 3. establish stan-<br />
dards and procedures for periodic review <strong>of</strong> laboratories and<br />
criteria for certification and revocation <strong>of</strong> certification <strong>of</strong> lab-<br />
oratories to perform drug testing for Federal agencies (1,2).<br />
The National Laboratory Certification Program (NLCP) was<br />
established to certify laboratories, as mandated by Executive<br />
Order and Public Law, to conduct forensic workplace drug<br />
testing for federal agencies and for some federally regulated in-<br />
dustries (3). Since the Mandatory Guidelines were first estab-<br />
lished in 1988, there has been a continuous review process in<br />
the development <strong>of</strong> standards for determining the validity <strong>of</strong> a<br />
urine specimen based on program experience with attempts by<br />
some specimen donors to adulterate, dilute, or substitute their<br />
specimens in order to mask the detection <strong>of</strong> illicit substances.<br />
As part <strong>of</strong> an ongoing effort to keep up with evolving practices<br />
and products used to try to "beat the drug test," detailed<br />
forensic standards for determining the validity <strong>of</strong> urine speci-<br />
mens, collected under the Mandatory Guidelines for Federal<br />
Workplace Drug Testing Programs, were published by the De-<br />
partment <strong>of</strong> Health and Human Services (HHS) in the Federal<br />
Register (69 FR 19644, April 13, 2004) (4). HHS, through the<br />
Substance Abuse and Mental Health Services Administration<br />
(SAMHSA), provides regulatory and program operational over-<br />
sight using an inspection and performance testing process to<br />
ensure that laboratories, certified under the Mandatory Guide-<br />
486 Reproduction (photocopying) <strong>of</strong> editorial content <strong>of</strong> this journal is prohibited without publisher's permission.
<strong>Journal</strong> <strong>of</strong> <strong>Analytical</strong> <strong>Toxicology</strong>, Vol. 31, October 2007<br />
lines, adopt and accurately follow the specimen validity testing<br />
and reporting procedures in the Mandatory Guidelines. The<br />
<strong>pH</strong> <strong>of</strong> a specimen collected for workplace drug testing is an<br />
important criterion to measure for two reasons: 1. FDA-cleared<br />
immunoassay kits used to perform the initial tests for<br />
marijuana metabolites, cocaine metabolites, opiate metabo-<br />
lites, phencyclidine, and amphetamines are designed to<br />
perform optimally in a <strong>pH</strong>-dependent fashion, and 2.<br />
products manufactured and sold with the intent to be added<br />
to the donor's specimen to facilitate passing a drug test<br />
sometimes contain components that have a very low <strong>pH</strong><br />
(acidic) or very high <strong>pH</strong> (basic) in order to disrupt the im-<br />
munoassay test or destroy the drugs in the specimen. Current<br />
specimen validity testing criteria for reporting a specimen as<br />
adulterated, substituted, invalid, or dilute are provided for<br />
certified laboratories performing workplace drug testing for<br />
federal agencies and some federally regulated industries (4).<br />
<strong>Urine</strong> <strong>pH</strong> cut<strong>of</strong>fs, < 3 or ~, 11, have been established to classify<br />
a urine specimen as adulterated (4). In addition, a urine spec-<br />
imen is reported as invalid when the urine <strong>pH</strong> is ~. 3 and < 4.5<br />
or ~- 9 and < 11 (4). A colorimetric <strong>pH</strong> test or <strong>pH</strong> meter is<br />
used for the initial test and a <strong>pH</strong> meter is used for the confir-<br />
matory test (4).<br />
Following the publication <strong>of</strong> the April 13, 2004, Mandatory<br />
Guidelines, some urine specimens subject to testing under<br />
the new standards have been reported with <strong>pH</strong> results greater<br />
than 9 and in the range <strong>of</strong> 9.1 to 9.3. No known adulterants<br />
were found as the cause <strong>of</strong> these invalid <strong>pH</strong> results. In addition,<br />
recollection under direct observation in some instances still<br />
produced urine <strong>pH</strong> results greater than 9. Investigations into<br />
these urine specimens, commonly referred as <strong>pH</strong> 9.x urine<br />
specimens, yielded the following observations: nitrite levels in-<br />
dicative <strong>of</strong> possible bacterial infection, greater incidence during<br />
the warm summer months, and a predominance <strong>of</strong> females as<br />
specimen donors. This study was undertaken to clarify the<br />
mechanism <strong>of</strong> urine <strong>pH</strong> 9.x production. The findings provide<br />
valuable new information to all parties in the specimen col-<br />
lection, transportation, testing, and reporting continuum, and<br />
helpful guidance to Medical Review Officers (MROs) in the in-<br />
terpretation <strong>of</strong> <strong>pH</strong> 9.x urine results.<br />
Transportation conditions for urine specimens submitted<br />
under the Mandatory Guidelines for workplace drug testing to<br />
HHS-certified laboratories are not specifically stated in the<br />
regulatory text. l~pically, packaged samples are delivered from<br />
the site <strong>of</strong> collection to the certified testing laboratory by<br />
couriers, express carriers, or the postal service. In some situ-<br />
ations, delivery times may take up to two weeks, especially<br />
when these urine specimens were collected from distant loca-<br />
tions, such as overseas, and shipped to the U.S. with no pre-<br />
cautionary measures taken to avoid the extremes <strong>of</strong><br />
temperature that specimens may experience during transit.<br />
<strong>Urine</strong> specimens tested in accordance with the Mandatory<br />
Guidelines in an HHS-certified laboratory that are reported as<br />
positive, adulterated, substituted, or invalid are stored for up<br />
to one year at -20~ after testing is completed (4).<br />
In contrast to workplace drug testing, a random (untirned)<br />
clinical urine specimen submitted for <strong>pH</strong> testing performed as<br />
part <strong>of</strong> the urinalysis pr<strong>of</strong>ile has specific transportation re-<br />
quirements. Rapid transport to the laboratory is recom-<br />
mended, and testing is ideally performed within 2 h <strong>of</strong> collec-<br />
tion (5). If testing is delayed, refrigeration is suggested (5).<br />
Some reference laboratories, in which the 2-h testing time<br />
constraint is impractical, use specialized collection containers<br />
to maintain urine specimen integrity. For instance, one man-<br />
ufacturer <strong>of</strong> urine collection containers incorporates a pro-<br />
prietary, insoluble, broad-spectrum antimicrobial agent into<br />
the wall <strong>of</strong> the polypmpylene plastic that helps preserve formed<br />
elements and does not interfere with urinalysis test results<br />
such as <strong>pH</strong> and specific gravity (6).<br />
Because <strong>of</strong> the time constraints imposed by clinical labora-<br />
tories on urine <strong>pH</strong> testing, medical literature references on<br />
long-term stability <strong>of</strong> urine <strong>pH</strong> are scarce. This study was<br />
undertaken to evaluate the effects <strong>of</strong> time and temperature<br />
on urine <strong>pH</strong> under various physiologically simulated condi-<br />
tions.<br />
Experimental<br />
The study hypothesis is that a urine specimen will become<br />
alkaline upon long-term standing, especially at high temper-<br />
atures.<br />
In the study design, a freshly collected, random (untimed)<br />
urine specimen pool was aliquotted into working pools; each<br />
pool spiked with certain physiological additives (Table I). From<br />
the working pools, a unique aliquot was prepared for each ad-<br />
ditive condition, at each temperature, and for each time point.<br />
Aliquots were stored at the various temperatures for a max-<br />
imum <strong>of</strong> two weeks. On each specified day, the <strong>pH</strong> <strong>of</strong> each<br />
aliquot was measured in duplicate and recorded. The change in<br />
<strong>pH</strong> with time was compared for each condition and incubation<br />
temperature.<br />
Apparatus<br />
<strong>Urine</strong> <strong>pH</strong> measurements, recorded to two decimal places,<br />
were determined using an Accumet Basic AB15 <strong>pH</strong> meter<br />
(Fisher Scientific, Atlanta, GA), calibrated each day <strong>of</strong> use with<br />
<strong>pH</strong> 4.0, 7.0, and 10.0 calibrators. <strong>Urine</strong> creatinine, urea, and<br />
uric acid concentrations were determined using the Bayer<br />
ADVIA 1650 Chemistry System (Siemens Medical Solutions Di-<br />
agnostics, Tarrytown, NY). <strong>Urine</strong> osmolality was determined<br />
Table I. Conditions Employed in the <strong>Urine</strong> <strong>pH</strong> Study<br />
Incubation Times,<br />
Additives Temperature (~ Days Post Void<br />
None -20 I<br />
Bacteria 4 2<br />
Glucose 25 3<br />
Glucose + bacteria 37 7<br />
Protein 93 8<br />
Protein + bacteria 9<br />
Yeast 10<br />
Yeast + glucose 14<br />
487
using the Advanced model 3220 Micro-osmometer (Advanced<br />
Instruments, Norwood, MA). <strong>Urine</strong> specific gravity was deter-<br />
mined using a TS Meter Refractometer (Reichert <strong>Analytical</strong> In-<br />
struments, Depew, NY) to four decimal places. The 37~<br />
incubation was in the American IC 42 incubator (American<br />
Scientific Products, Columbus, OH), and the 93~ incuba-<br />
tions were in the VWR Standard Heating Blocks (West Chester,<br />
PA) and the Denville Scientific Incublocks (South Plainfield,<br />
N J).<br />
Materials<br />
Pseudomonas aeruginosa ATCC 27853 (gram-negative bac-<br />
teria) and Rhodotonula minuta (yeast) were obtained from<br />
Dr. Amy Horneman, University <strong>of</strong> Maryland, Baltimore. The <strong>pH</strong><br />
buffer solutions (4.0, 7.0, 9.0, and 10.0) and the osmolality<br />
Clinitrol 290 Reference Solution were obtained from Fisher<br />
Scientific (Atlanta, GA). Sabouraud dextrose broth, Luria<br />
broth, and Luria agar plates were obtained from Becton, Dick-<br />
inson and Company (Sparks, MD). Phosphate-buffered saline<br />
(PBS) and the 2.0-mL screw-top micr<strong>of</strong>uge polypropylene<br />
tubes for aliquot incubation were purchased from VWR Inter-<br />
national (Philadelphia, PA). D-(+)-Glucose, human albumin,<br />
and sodium bicarbonate were purchased from Sigma-Aldrich<br />
(St. Louis, MO). Creatinine, urea, and uric acid chemistry<br />
reagents were obtained from Siemens Medical Solutions Di-<br />
agnostics (Tarrytown, NY). The Liquichek urine chemistry<br />
controls were purchased from Bio-Rad Laboratories (Hercules,<br />
CA).<br />
Methods<br />
<strong>Urine</strong> <strong>pH</strong> reference interval verification. The urine <strong>pH</strong> ref-<br />
erence interval was verified by specimens obtained from three<br />
different locations in Baltimore, MD: the Clinical Laboratories<br />
<strong>of</strong> the University <strong>of</strong> Maryland Medical Center, a hospital-based<br />
clinical laboratory; Quest Diagnostics, a large clinical reference<br />
laboratory; and the Office <strong>of</strong> the Chief Medical Examiner, a<br />
forensic postmortem laboratory. For the hospital laboratory,<br />
random urine specimens were analyzed for <strong>pH</strong> within 2 h <strong>of</strong><br />
collection using a urine dipstick method. For the reference lab-<br />
oratory, urine specimens, collected in the proprietary urine<br />
cups described previously, were analyzed for <strong>pH</strong> by a dipstick<br />
method within 24 h <strong>of</strong> collection. The forensic urine samples<br />
were removed by needle aspiration from bladders within 24 h<br />
<strong>of</strong> death and stored frozen until analyzed for urine <strong>pH</strong> using a<br />
<strong>pH</strong> meter at the Armed Forces Institute <strong>of</strong> Pathology, Wash-<br />
ington, D.C.<br />
Subjects. Under a study protocol approved by the Institu-<br />
tional Review Board <strong>of</strong> the University <strong>of</strong> Maryland, Baltimore,<br />
three healthy, ambulatory volunteers each donated a fresh,<br />
random, untimed morning urine sample.<br />
In vitro alkalinization. To determine the extent <strong>of</strong> urine al-<br />
kalinization achievable with sodium bicarbonate addition,<br />
three fresh random urine specimens were spiked with a freshly<br />
prepared 8.4% sodium bicarbonate solution. Additionally,<br />
sodium bicarbonate crystals were added directly to the urine<br />
samples. The urine <strong>pH</strong> was measured both before and after the<br />
addition <strong>of</strong> the sodium bicarbonate.<br />
Bacteria andyeast preparation. Bacterial and yeast strains<br />
488<br />
<strong>Journal</strong> <strong>of</strong> <strong>Analytical</strong> <strong>Toxicology</strong>, Vol. 31, October 2007<br />
were cultured in Luria and Sabouraud dextrose broths, re-<br />
spectively, and grown overnight at 37~ in a shaking incubator.<br />
Fresh broth was inoculated with 100 IJL/10 mL <strong>of</strong> the respec-<br />
tive microorganisms and incubated until the microorganisms<br />
had grown to mid-log phase as determined by the absorbance<br />
at 600 nm. The cells were pelleted by centrifugation and re-<br />
suspended to the appropriate concentration in PBS. The bac-<br />
terial concentration was confirmed by serial dilutions plated on<br />
Luria agar.<br />
Specimen preparation. The three random urine samples<br />
provided by the subjects were promptly pooled, and the <strong>pH</strong> <strong>of</strong><br />
the mixed pool was determined (<strong>pH</strong> 6.93). The pool was further<br />
divided into eight working pools, each with a minimum<br />
volume <strong>of</strong> 45 mL. These eight working pools were used for<br />
each <strong>of</strong> the following study conditions: neat urine, urine + bac-<br />
teria, urine + glucose, urine + glucose + bacteria, urine +<br />
protein, urine + protein + bacteria, urine + yeast, and urine +<br />
yeast + glucose (Table I). For those working pools requiring<br />
glucose and protein, D-glucose and human albumin were each<br />
added to final concentrations <strong>of</strong> 2000 mg/dL. For those<br />
working pools requiring bacteria and yeast, Pseudomonas<br />
aeruginosa and Rhodotonula minuta were each spiked into the<br />
appropriate working pools to final concentrations <strong>of</strong> 49,000<br />
colonies/mL. The <strong>pH</strong> was determined on each completed<br />
working pool. Each working pool was subsequently further di-<br />
vided into 40 individual 1.0 mL portions, one for each incu-<br />
bation temperature (-20, 4, 25, 37, and 93~ and for each <strong>of</strong><br />
the eight analysis days. The portions were aliquotted into ap-<br />
propriately labeled sterile cryovials and securely capped. The<br />
respective aliquots were incubated at their designated tem-<br />
peratures for the indicated periods <strong>of</strong> time. Vials were stored in<br />
the freezer at -20~ in the refrigerator at 4~ on the bench<br />
top at 25~ in an oven at 37~ and in heating blocks at 93~<br />
(Table I). The temperatures <strong>of</strong> the freezer, refrigerator, incu-<br />
bator, and heating blocks were verified and monitored with<br />
NIST-certified thermometers.<br />
<strong>pH</strong> changes by time, temperature, and composition. On in-<br />
cubation days 1, 2, 3, 7, 8, 9, 10, and 14 post-void, the appro-<br />
priate aliquots were removed from incubation and brought to<br />
room temperature (Table I). The vial contents were trans-<br />
ferred to a test tube, mixed, and the <strong>pH</strong> <strong>of</strong> each aliquot was im-<br />
mediately determined in duplicate. All duplicate <strong>pH</strong> results for<br />
each aliquot had to agree within + 0.2 <strong>pH</strong> units or additional<br />
measurements were taken until the desired reproducibility<br />
was achieved. Each batch <strong>of</strong> five specimens was bracketed by<br />
<strong>pH</strong> 7.0, 9.0, and 10.0 quality control materials that had to<br />
read within + 0.2 <strong>pH</strong> units.<br />
Changes in urine creatinine, urea, uric acid, osmolality,<br />
and specific gravity by temperature. Additional aliquots <strong>of</strong><br />
the neat urine were stored at -20, 4, 25, 37, and 93~ for two<br />
weeks and subsequently stored frozen at-20~ until analysis.<br />
The aliquots were thawed, mixed, and immediately analyzed for<br />
urine creatinine, urea, uric acid, osmolality, and specific<br />
gravity. Clinical quality control material tested along with the<br />
urine specimens was within acceptable limits.<br />
Data analysis. The mean was calculated for each aliquot<br />
pair. The means were plotted chronologically for each <strong>of</strong> the<br />
various conditions and incubation temperatures.
<strong>Journal</strong> <strong>of</strong> <strong>Analytical</strong> <strong>Toxicology</strong>, Vol. 31, October 2007<br />
Results<br />
<strong>Urine</strong> <strong>pH</strong> reference interval verification<br />
To verify the clinical reference interval <strong>of</strong> 4.5-8 (average<br />
5-6) for random (untimed) urine <strong>pH</strong>, data statistics were ob-<br />
tained from three different sources: a hospital laboratory, a<br />
clinical reference laboratory, and a medical examiner's <strong>of</strong>fice<br />
Table II. Summary Statistics for Random <strong>Urine</strong> <strong>pH</strong><br />
Reference Interval Verification<br />
Laboratory n Mean Range Median Mode<br />
Hospital 2206 6.1 5.0-8.5* 5.9 5.0<br />
Reference 9122 6.3 5.0-8.5* 6.0 6.0<br />
Forensic 108 6.1 4.6-8.5 5.9 5.8<br />
* The reportable range for the urine dipstick method was 5.0-9.0 with a reportable<br />
interval <strong>of</strong> 0.5 <strong>pH</strong> units.<br />
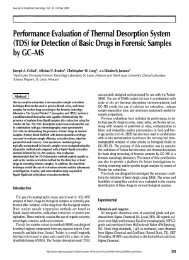
Graphs: Incubation at: A. -20 *C, B 4 ~ C. 25 ~ D. 37 ~ and E. 93 ~<br />
Legend:<br />
Neat urine 9<br />
<strong>Urine</strong> + bacteria A<br />
<strong>Urine</strong> + glucose 9<br />
<strong>Urine</strong> + bacteria + glucose []<br />
<strong>Urine</strong> + protein 9<br />
<strong>Urine</strong> + bacteria + protein<br />
<strong>Urine</strong> + yeast X<br />
<strong>Urine</strong> + yeast + glucose 9<br />
lO 84<br />
9.5<br />
9<br />
8.5<br />
= 8<br />
7<br />
6.5<br />
A <strong>Urine</strong> <strong>pH</strong> change -20~<br />
(7). The summary statistics are presented in Table II. As a<br />
point <strong>of</strong> interest, the data from the hospital laboratory, when<br />
plotted as a histogram (data not shown), did not exhibit the ex-<br />
pected Gaussian distribution. Instead, the 0.5 <strong>pH</strong> unit bin per-<br />
centages gradually declined from the high <strong>of</strong> <strong>pH</strong> 5.0, with the<br />
majority <strong>of</strong> the data clustered in the <strong>pH</strong> 5-6 range. The data<br />
from the reference laboratory, which represented specimens<br />
that had a delay in analysis <strong>of</strong> up to 24 h, did exhibit a Gaussian<br />
distribution with a tail skewed to higher <strong>pH</strong> values. Like the<br />
reference laboratory <strong>pH</strong> data, the postmortem <strong>pH</strong> values,<br />
having a delay in collection from the time <strong>of</strong> death to sampling,<br />
when plotted as a histogram, exhibited a skewed Gaussian dis-<br />
tribution with a peak between <strong>pH</strong> 5.5 and 6.0. Thus, specimens<br />
from the reference laboratory, where the majority <strong>of</strong> the spec-<br />
imen <strong>pH</strong> values fell in the range <strong>of</strong> <strong>pH</strong> 5.5-7.0, and the post-<br />
mortem laboratory where the majority <strong>of</strong> the <strong>pH</strong> values were<br />
clustered between 5.0 and 6.5, exhibited a shift towards in-<br />
creased <strong>pH</strong> values with time when compared to the clinical lab-<br />
oratory data. Whether the urine <strong>pH</strong> statistics were from the<br />
71<br />
10<br />
==':1 7.5<br />
6.5<br />
0 I 2 3 7 8 9 10 14 0 1 2 3 7 8<br />
Days Days<br />
10<br />
9.5<br />
9<br />
8.5<br />
8<br />
7.5<br />
C <strong>Urine</strong> <strong>pH</strong> change 25~<br />
0 1 2 3 7 8 9 10 14<br />
Days<br />
D <strong>Urine</strong> <strong>pH</strong> change 37~<br />
B <strong>Urine</strong> <strong>pH</strong> change 4~ E <strong>Urine</strong> <strong>pH</strong> change 93~<br />
10 10<br />
9.5 9.5<br />
8 ~ ~ ~ 8.58<br />
7.5 ~ 7.5<br />
7 - 7<br />
9 10 14<br />
6.5 , 6.5<br />
0 1 2 3 7 8 9 10 14 0 1 2 3 7 8 9 10 14<br />
Days Days<br />
Figure 1. The change in urine <strong>pH</strong> with time at various temperatures under various conditions.<br />
489
hospital laboratory, the clinical reference laboratory, or the<br />
medical examiner's <strong>of</strong>fice, none <strong>of</strong> the 11,436 specimens tested<br />
had a <strong>pH</strong> > 8.5. In fact, 3 <strong>of</strong> 108 (2.8%) specimens from the<br />
postmortem laboratory, 45 <strong>of</strong> 9122 (0.5%) specimens from the<br />
reference laboratory, and 28 <strong>of</strong> 2206 (1.3%) specimens from the<br />
clinical laboratory were between <strong>pH</strong> 8.0 and 8.5 ]total 76 <strong>of</strong><br />
11,436 (0.7%)]. In the postmortem data where <strong>pH</strong> values < 5.0<br />
were measurable, no values < 4.5 were found. The lowest mea-<br />
sured <strong>pH</strong> was 4.6.<br />
In vitro alkalinization<br />
In the in vitro alkalinization study, the maximum <strong>pH</strong> value<br />
9 reached, whether by the addition <strong>of</strong> sodium bicarbonate solution<br />
or crystals, was 7.9. The maximum <strong>pH</strong> reached was not influenced<br />
by the initial <strong>pH</strong> value <strong>of</strong> the urine specimen.<br />
<strong>pH</strong> changes by time, temperature, and composition<br />
Those urine aliquots stored at -20~ were relatively stable,<br />
exhibiting at most a +0.7 increase in <strong>pH</strong> over the two-week in-<br />
cubation period. As the temperature increased, the <strong>pH</strong> <strong>of</strong> the<br />
urine aliquots also increased. At 4~ the <strong>pH</strong> gradually in-<br />
creased with time to reach a high <strong>of</strong> <strong>pH</strong> 8.1 at 14 days. At<br />
25~ the <strong>pH</strong> jumped dramatically for all conditions by day 1 <strong>of</strong><br />
incubation. By day 2, the <strong>pH</strong> for the 25~ incubation aliquots<br />
had leveled <strong>of</strong>f to a <strong>pH</strong> <strong>of</strong> about 9.2 for the majority <strong>of</strong> the con-<br />
ditions. The <strong>pH</strong> in those samples containing glucose never ex-<br />
ceeded <strong>pH</strong> 9.0, with the highest <strong>pH</strong> values ranging from 8.7 to<br />
9.0 at 25~ At 37~ peak <strong>pH</strong> values > 9.0 were achieved by day<br />
1. Those specimens containing glucose and incubated at 93~<br />
showed an initial increase in <strong>pH</strong> at day 1 (<strong>pH</strong> 7.8-8.4) fol-<br />
lowed by decreasing <strong>pH</strong> values with time. <strong>Urine</strong> spiked with<br />
glucose and incubated at 93~ darkened in color, varying from<br />
honey to black, with some <strong>of</strong> these specimens developing a pre-<br />
cipitate. Specimens in the other conditions incubated at 93~<br />
achieved <strong>pH</strong> values ranging from 8.8 to 9.2 by day 1 and leveled<br />
<strong>of</strong>f for the duration <strong>of</strong> the incubation. Graphical representation<br />
<strong>of</strong> the <strong>pH</strong> changes with time is presented in Figure 1. As a point<br />
<strong>of</strong> interest, the inclusion <strong>of</strong> microorganisms (bacteria and<br />
yeast) and protein and glucose at pathological levels did not<br />
490<br />
Legend<br />
-20 ~<br />
4 "C 9<br />
25 ~ 9<br />
37 "C X<br />
93 "C A<br />
lO<br />
9<br />
75<br />
7<br />
65<br />
Neat urine <strong>pH</strong> changes by time and temperature<br />
0 1 2 3 7 8 9 10 14<br />
Days<br />
Figure 2. The change <strong>of</strong> <strong>pH</strong> with time and temperature for the neat<br />
urine.<br />
<strong>Journal</strong> <strong>of</strong> <strong>Analytical</strong> <strong>Toxicology</strong>, Vol. 31, October 2007<br />
have any significant effect on the changing <strong>pH</strong> values, ex-<br />
cluding the <strong>pH</strong> decreasing effect <strong>of</strong> glucose at 93~ after day 1,<br />
as evident from the graph that depicts the changes in the neat<br />
urine at various temperatures (Figure 2).<br />
Changes in urine creatinine, urea, uric acid, osmolality,<br />
and specific gravity by temperature<br />
<strong>Urine</strong> specific gravity was stable at each incubation temper-<br />
ature. The other analytes showed varying stability by temper-<br />
ature. <strong>Urine</strong> urea was stable only at -20~ uric acid at -20 and<br />
4~ and creatinine at-20, 4, and 25~ <strong>Urine</strong> osmolality values<br />
were stable at -20 and 4~ increased at 25 and 93~ and de-<br />
creased at 37~ (Figure 3).<br />
Discussion<br />
Review<br />
Whole blood <strong>pH</strong> is maintained within an extremely narrow<br />
<strong>pH</strong> range <strong>of</strong> 7.35-7.45 at the expense <strong>of</strong> urinary <strong>pH</strong>. Because<br />
urine is able to achieve a hydrogen ion concentration 1000x<br />
greater than blood, its range <strong>of</strong> <strong>pH</strong> is 4.5-8 (average <strong>pH</strong> 5-6)<br />
(7,8). The lungs and kidneys are primarily responsible for reg-<br />
ulating the body's acid-base content, and thus the blood <strong>pH</strong><br />
range that is compatible with human life. The kidneys, which<br />
produce urine, function in acid-base balance primarily through<br />
the selective regulation <strong>of</strong> plasma bicarbonate by affecting the<br />
equilibrium <strong>of</strong> the following reaction sequence (8):<br />
CO 2 + H20 ~-* H2CO 3 ~ HCO 3- + H + +-, CO3 = + H +<br />
By secreting and excreting hydrogen ions in the form <strong>of</strong><br />
ammonium ions, phosphates, sulfates, and weak organic acids<br />
and reabsorbing bicarbonate, the renal tubules maintain blood<br />
<strong>pH</strong> (8).<br />
Temperature effect on select urine analytes<br />
........ 40<br />
2O<br />
N<br />
-30 -10 10 30 50 70 90<br />
Temperature (~<br />
Legend:<br />
<strong>Urine</strong> urea, mg/dL (divided by 10) 9<br />
<strong>Urine</strong> creatinine, mg/dL []<br />
<strong>Urine</strong> osmolality, mOsm/kg (divided by tO) 0<br />
<strong>Urine</strong> uric acid, mg/dL 9<br />
<strong>Urine</strong> specific gravity (multiplied by lO) 9<br />
Figure 3. Changes in neat urine creatinine, urea, uric acid, osmolality,<br />
and specific gravity by temperature after a two-week incubation at -20,<br />
4, 25, 37, or 93~
<strong>Journal</strong> <strong>of</strong> <strong>Analytical</strong> <strong>Toxicology</strong>, Vol. 31, October 2007<br />
The <strong>pH</strong> <strong>of</strong> urine is dependent on the time <strong>of</strong> day, the prandial<br />
state, diet, health status, and medications (9). Various pre-an-<br />
alytical variables that may affect urine <strong>pH</strong> values are given in<br />
Table III (10). Urinary <strong>pH</strong> exhibits a diurnal variation with de-<br />
creased <strong>pH</strong> values at night and in the early morning (most<br />
acidic towards midnight) followed by increasing <strong>pH</strong> values<br />
upon awakening (11). <strong>Urine</strong> tends to become alkaline imme-<br />
diately after a meal because <strong>of</strong> a phenomenon known as the al-<br />
kaline tide and gradually becomes acidic between meals (12).<br />
A high protein diet is associated with acidic urine, and a vege-<br />
tarian diet typically produces more alkaline urine because <strong>of</strong> bi-<br />
carbonate formation from fruits, especially citrus, and<br />
vegetables.<br />
Often, the urine specimen becomes contaminated preana-<br />
lytically with bacteria during collection. Both the male and fe-<br />
male urethras are colonized with microorganisms; thus, urine<br />
collected by conventional voiding is <strong>of</strong>ten bacterially contam-<br />
inated (11). Midstream random urine collections, whether<br />
Table III. Preanalytical Variables, Disease States, and Drugs that Can Cause Physiological Changes in <strong>Urine</strong> <strong>pH</strong> (10)<br />
Decreased <strong>pH</strong> Increased <strong>pH</strong><br />
Preanalytical variable Disease Drug Preanal)4ical variable Disease Drug<br />
Cadmium exposure Acquired adrenal insensitivity Acetazolamide Aldosterone<br />
Diurnal variaton Acute poststreptococcal Amiloride Bed rest<br />
Heparin glomerulonephritis Aminoglycosides Citrate<br />
Lead exposure Amyloidosis Ammonium chloride Meals<br />
Mercury exposure Carbonic anhydrase II deficiency Ascorbic acid Storage<br />
Methionine Chronic obstructive pulmonary Cholestyramine Toluene<br />
disease Converting enzyme Vanadium<br />
Cystinosis inhibitors<br />
Desmolase deficiency Corticotropin<br />
Diabetes mellitus Coumarin<br />
Methenamine Diazoxide<br />
Diabetic nephropathy Metolazone<br />
Diarrhea Niacin<br />
Distal renal tubular acidosis (type IV) Spironolactone<br />
Familial methyl oxidase deficiency Streptozocin<br />
Galactosemia<br />
Glycogen storage disease I<br />
Gout<br />
Hereditary fructose intolerance<br />
3 -~]-Hydroxydehydrogenase deficiency<br />
21-Hydroxylase deficiency<br />
lactosuria<br />
Light chain multiple myeloma<br />
Lowe's syndrome<br />
Lupus nephritis<br />
Malabsorption<br />
Medullary cystic disease<br />
Metabolic acidosis<br />
Metachromatic leukodystrophy<br />
Multiple myeloma<br />
Nephropathy, obstructive<br />
Pseudohypoaldosteronism<br />
Renal transplant rejection<br />
Renal transplantation<br />
Renal vein thrombosis<br />
Renovascular hypertension<br />
Salt-wasting nephritis<br />
SjOgren's syndrome<br />
Transient mineralocorticoid<br />
deficiency <strong>of</strong> infancy<br />
Tubulointerstitial disease<br />
Tyrosinemia<br />
Vitamin D deficiency<br />
Vitamin D resistance<br />
Wilson's disease<br />
Acute renal failure<br />
Adrenal cortical<br />
hyperfunction<br />
Adrenal cortical<br />
hyp<strong>of</strong>unction<br />
Amyloidosis<br />
Autoimmune<br />
thyroiditis<br />
Balkan nephropathy<br />
Chronic active<br />
hepatitis<br />
Chronic<br />
pyelonephritis<br />
Cryoglobulinemia<br />
Cystinosis<br />
Diabetes mellitus<br />
Distal renal tubular acidosis<br />
Fabry's disease<br />
Fibrosing alveolitis<br />
Hepatolenticular degeneration<br />
(Wilson's disease)<br />
Hereditary fructose intolerance<br />
Hypercalciuria, idiopathic<br />
Hypergammaglobulinemia<br />
Hyperparathyroidism<br />
Maffan's syndrome<br />
Medullary sponge kidney<br />
Metabolic alkalosis<br />
Polyarteritis nodosa<br />
Primary biliary cirrhosis<br />
Proximal renal tubular<br />
acidosis (type II)<br />
Renal transplant rejection<br />
Sickle cell disease<br />
Sj0gren's syndrome<br />
Urinary tract obstruction<br />
Vitamin D intoxication<br />
Voltage-dependent distal renal<br />
tubular acidosis (type I)<br />
Acetaminophen<br />
Acetazolamide<br />
Amiloride<br />
Amphotericin B<br />
Aspirin<br />
Carbenoxolone<br />
Cefdinir<br />
Cimetidine<br />
Dicl<strong>of</strong>enac<br />
Diflunisal<br />
Etodolac<br />
Fenopr<strong>of</strong>en<br />
Flurbipr<strong>of</strong>en<br />
Ibupr<strong>of</strong>en<br />
Ifosfamide<br />
Indomethacin<br />
Ketopr<strong>of</strong>en<br />
lithium<br />
Mafenide<br />
Mefenamic acid<br />
Naproxen<br />
Niacinamide<br />
Ofloxacin<br />
Orthophosphate<br />
Parathyroid<br />
extract<br />
Ranitidine<br />
Triamterene<br />
Sodium<br />
bicarbonate<br />
491
with or without prior cleansing <strong>of</strong> external genitalia, have bac-<br />
terial contamination rates <strong>of</strong> up to 30% (13,14). The problem<br />
can be aggravated in women because <strong>of</strong> further contamination<br />
from intestinal flora if the collection is not done carefully (11).<br />
Left standing, the <strong>pH</strong> <strong>of</strong> a bacterial-contaminated, unpreserved<br />
urine specimen will continue to increase. Bacterial contami-<br />
nation <strong>of</strong> urine with microorganisms that split urea may yield<br />
urinary <strong>pH</strong> values > 8.0 because <strong>of</strong> bacterial decomposition <strong>of</strong><br />
urea to ammonia. <strong>Urine</strong> specimens collected at autopsy by<br />
bladder puncture are considered sterile and free <strong>of</strong> bacterial<br />
contamination unless the bladder itself is harboring bacteria<br />
(11).<br />
The disease states that can affect urine <strong>pH</strong> are listed in Table<br />
III (10). Common causes <strong>of</strong> alkaline urine include respiratory<br />
and metabolic alkalosis, prolonged vomiting, urinary tract in-<br />
fection with urea-splitting bacteria, and meals (15). Common<br />
causes <strong>of</strong> acidic urine include respiratory and metabolic aci-<br />
dosis, dietary cranberries, diabetes mellitus, starvation, and<br />
severe diarrhea (15). In acid-base disorders, the urine <strong>pH</strong> is an<br />
indicator <strong>of</strong> renal compensation in an attempt to return blood<br />
<strong>pH</strong> to normal. An individual with normal renal function and<br />
with either respiratory or metabolic acidosis is expected to ex-<br />
crete acidic urine while a patient with either respiratory or<br />
metabolic alkalosis should produce alkaline urine as a means<br />
<strong>of</strong> compensation (12). Any renal tubular disorder, such as renal<br />
tubular acidosis, that adversely affects secretion and re-ab-<br />
sorption <strong>of</strong> acids and bases will alter urine <strong>pH</strong> (12).<br />
Medications that influence urine <strong>pH</strong> are found in Table III<br />
(10). Commonly, urine <strong>pH</strong> changes are idiopathically caused by<br />
treatments for urinary tract infection and calculi formation<br />
(15). In certain clinical situations, urine is deliberately ma-<br />
nipulated to produce an alkaline <strong>pH</strong> to aid renal clearance <strong>of</strong><br />
certain drugs, especially in cases <strong>of</strong> drug overdose (16).<br />
Care must be taken in interpreting <strong>pH</strong> results determined by<br />
dipsticks because <strong>of</strong> methodological limitations. In the forensic<br />
laboratory, urine dipsticks are used for screening purposes<br />
only, and these screening <strong>pH</strong> results are not reported. In the<br />
clinical laboratory, determination <strong>of</strong> urine <strong>pH</strong> is commonly<br />
done by reagent dipsticks imbedded with indicator dyes. These<br />
reagent strips rely on the urine's hydrogen ion concentration<br />
to cause a color change in the indicator dyes. Because no one<br />
indicator dye will cover the entire random urinary <strong>pH</strong> reference<br />
interval, most reagent strips utilize two indicators, methyl red<br />
and bromthymol blue (BTB) (7). Methyl red responds to <strong>pH</strong><br />
concentrations in the range from 4.2 to 6.2, producing a color<br />
change from red to yellow (7). BTB is responsive in the <strong>pH</strong><br />
range <strong>of</strong> 6 to 7.6, producing a corresponding color change<br />
from yellow to blue (7). When combined into one reagent pad,<br />
the double indicator color changes from orange at <strong>pH</strong> 5 to<br />
yellow then green and finally blue at <strong>pH</strong> 9 (7). These indicator<br />
dyes are usually not very analytically sensitive, providing re-<br />
sults within _+ 0.5-1.0 <strong>pH</strong> unit accuracy, and have a reportable<br />
<strong>pH</strong> range between 5 and 9.0 (15).<br />
There are no known interferences associated with urine dip-<br />
stick <strong>pH</strong> measurements. <strong>Analytical</strong> error can be caused by<br />
reagent bleeding into adjacent pads on the clinical multi-ana-<br />
lyte dipsticks, especially from a very acidic protein reagent<br />
pad (9). In addition, timing <strong>of</strong> the reading <strong>of</strong> the reagent pad<br />
492<br />
<strong>Journal</strong> <strong>of</strong> <strong>Analytical</strong> <strong>Toxicology</strong>, Vol. 31, October 2007<br />
color is important since the color <strong>of</strong> the reagent block changes<br />
with time (17). For dipstick <strong>pH</strong> measurements, there is a ten-<br />
dency for <strong>pH</strong> to increase with time, especially in the <strong>pH</strong> 6-8<br />
range (18). For dipstick measurements that are read manually,<br />
there is a subjective element to the color interpretation, mainly<br />
in the <strong>pH</strong> 5-6 range (18).<br />
Bias has been noted between urine <strong>pH</strong> determined by dip-<br />
stick and the gold standard <strong>pH</strong> meter method (19). Specimens<br />
with a <strong>pH</strong> > 6.5 by the dipstick method <strong>of</strong>tentimes had a lower<br />
<strong>pH</strong> as determined by the <strong>pH</strong> meter, whereas those with a <strong>pH</strong> ,~<br />
5.5 by dipstick had a higher true <strong>pH</strong> (19).<br />
<strong>Urine</strong> <strong>pH</strong> reference interval verification<br />
There are no medical conditions, either normal or abnormal,<br />
that can produce a <strong>pH</strong> > 9 in freshly excreted urine. In a study<br />
<strong>of</strong> 2600 patients screened by routine outpatient urinalysis with<br />
urine <strong>pH</strong> determined by dipstick, 53 patients were determined<br />
to have alkaline urine <strong>pH</strong> results, with only one given a value<br />
<strong>of</strong> <strong>pH</strong> 9.0 by dipstick (20). Random urine specimens from<br />
cannabinoid users (n = 38) yielded initial <strong>pH</strong> values ranging<br />
from 5.1 to 8.8 (21). In our study to verify the clinical reference<br />
interval for random urine specimens, none <strong>of</strong> the 11,436 spec-<br />
imens tested had a <strong>pH</strong> > 8.5, and only 0.7% were <strong>pH</strong> > 8 and <<br />
8.5. The lowest measured <strong>pH</strong> was 4.6. Thus, the clinical refer-<br />
ence interval <strong>of</strong> 4.5-8 for a random urine <strong>pH</strong> was verified and,<br />
conversely, a non-fresh, improperly preserved, or tampered<br />
random urine specimen with a <strong>pH</strong> ~- 9 is suspect (7).<br />
In vivo alkalinization<br />
In vivo alkalinization <strong>of</strong> urine is performed in certain drug<br />
overdose situations (16). In cases <strong>of</strong> salicylate poisoning,<br />
sodium bicarbonate is administered until the urine <strong>pH</strong> is in the<br />
range <strong>of</strong> 7.5-8.5 (16). In a study <strong>of</strong> induced metabolic alkalosis<br />
through sodium bicarbonate administration, in vivo urine <strong>pH</strong><br />
averaged 7.56 _+ 0.03 (22). These recommendations and find-<br />
ings are consistent with our in vitro maximum sodium bicar-<br />
bonate result <strong>of</strong> <strong>pH</strong> 7.9.<br />
<strong>pH</strong> changes by time, temperature, and composition<br />
Temperature and <strong>pH</strong> have important effects on enzymatic<br />
and spontaneous chemical reactions (23). As temperatures de-<br />
crease, both enzymatic and spontaneous chemical reactions are<br />
significantly slowed (23). Changing the <strong>pH</strong> has a tremendous<br />
impact on enzymes, which typically have a narrow <strong>pH</strong> range for<br />
catalytic activity (23). In addition, <strong>pH</strong> determines protein<br />
binding and the stability <strong>of</strong> <strong>pH</strong>-sensitive molecules (23). Thus,<br />
it is important to understand the preanalytical effects <strong>of</strong> post-<br />
void urine temperature and <strong>pH</strong> changes and their relation-<br />
ship to the analyte conditions present at sample collection.<br />
<strong>Urine</strong> contains urea and uric acid, non-protein nitrogenous<br />
waste compounds, which are common constituents <strong>of</strong> urine.<br />
The stability <strong>of</strong> these two molecules is affected by bacterial<br />
contamination. Uric acid is degraded by microbial uricase ac-<br />
tivity to allontoin, hydrogen peroxide, and carbon dioxide while<br />
urea is labile to bacterial urease activity with ammonia and<br />
carbon dioxide produced as products (24,25). To prevent degra-<br />
dation, it is recommended that urine for uric acid and urea de-<br />
terminations be stored at 4~ to inhibit bacterial growth
<strong>Journal</strong> <strong>of</strong> <strong>Analytical</strong> <strong>Toxicology</strong>, Vol. 3], October 2007<br />
(24,25). Optimally, urine for urea analysis is best preserved at<br />
<strong>pH</strong> values < 5.0 (24).<br />
To assess the extent <strong>of</strong> alkalinization caused by a urea-split-<br />
ting bacterium, urine was spiked with the gram-negative Pseu-<br />
domonas aeruginosa. This specific bacterium species was<br />
selected because <strong>of</strong> its ability to produce urease, an enzyme that<br />
converts urea to ammonia, and its identification as a common<br />
pathogen in contaminated urine specimens (26,27). A urea-<br />
splitting microorganism is able to produce alkaline urine<br />
through the following mechanism:<br />
Urea (H2NCONH2) + H20 ~ 2NH3 + C02<br />
2NH3 + H20 ~ 2NH4 + + 2OH- (26)<br />
Rhodotonula minuta is a common pathogen in yeast infec-<br />
tions. Both the bacteria and yeast were spiked in the urine to<br />
a concentration <strong>of</strong> 49,000 colonies/mL, a value considered as<br />
substantial microbiological growth (27). In our study, the ex-<br />
pected increase in <strong>pH</strong> from bacterial urease activity was not ev-<br />
ident. Similarly, a yeast contamination effect on <strong>pH</strong> could not<br />
be discerned in light <strong>of</strong> the predominant temperature effect.<br />
To simulate excessive amounts <strong>of</strong> sugar and protein in urine<br />
and their effects on urine <strong>pH</strong>, D-glucose and human albumin<br />
were each added to a concentration <strong>of</strong> 2000 mg/dL, a concen-<br />
tration equivalent to 4+ on the urine dipstick. Neither protein<br />
nor glucose appeared to affect urine <strong>pH</strong> except for the protec-<br />
tive effect <strong>of</strong> glucose against excessive urine alkalinization at<br />
increased temperatures.<br />
As indicated by the results <strong>of</strong> this study, increased incubation<br />
temperatures were associated with development <strong>of</strong> urine with<br />
<strong>pH</strong> values > 9.0. This study investigated the extremes <strong>of</strong> tem-<br />
perature that may be encountered during specimen trans-<br />
portation, including excessive cold and heat. Internal<br />
temperatures <strong>of</strong> closed vehicles on hot days can exceed 65~<br />
and temperatures on exposed surfaces, such as dashboards,<br />
can reach 93~ (28-31).<br />
In a rat study, fresh urine was collected from two animals<br />
after an overnight fast (9). At void, the <strong>pH</strong> values <strong>of</strong> the two<br />
urines were 6.2 and 7.1 (9). After incubation at 25 and 37~<br />
the <strong>pH</strong> values increased to 8.7 and 8.9 to 9.0, respectively,<br />
after 24 h (9). When these alkaline urine specimens were evap-<br />
orated to dryness and resuspended in water to the initial<br />
volume, the resultant <strong>pH</strong> was less than the fresh urine <strong>pH</strong> (9).<br />
The authors surmised that the increase in <strong>pH</strong> with time was<br />
due to the loss <strong>of</strong> CO2 and the evaporation process resulted in<br />
the loss <strong>of</strong> ammonia, causing the return to acidic <strong>pH</strong> values (9).<br />
In our study design, urine aliquots were tightly capped with<br />
minimal air space within the vial. Though the vial contents<br />
were transferred to test tubes that would accommodate the di-<br />
ameter <strong>of</strong> the <strong>pH</strong> electrode, <strong>pH</strong> measurements were taken im-<br />
mediately upon transfer. Thus, the loss <strong>of</strong> CO2 may not explain<br />
the observed increase in urine <strong>pH</strong>, but production <strong>of</strong> ammonia<br />
does. In conclusion, study findings demonstrate that increased<br />
temperature is directly correlated with increases in <strong>pH</strong>.<br />
Changes in urine creatinine, urea, uric acid, osmolality, and<br />
specific gravity by temperature<br />
The major non-protein nitrogenous urine analytes--creati-<br />
nine, urea, and uric acid--were examined for their stability in<br />
neat urine at various temperatures. Degradations <strong>of</strong> these com-<br />
pounds could result in altered urine <strong>pH</strong> values. Uric acid and<br />
creatinine degraded with increasing temperatures. The pat-<br />
tern seen with urea at first appears illogical since at 93~ urea<br />
is stable, in contrast to its progressive degradation at the lower<br />
temperatures. One explanation for this pattern is that the urine<br />
pool was contaminated by urea-splitting bacteria that are de-<br />
stroyed at 93~<br />
Analytes that are indicative <strong>of</strong> urine concentration, specific<br />
gravity and osmolality, were also examined. While urine spe-<br />
cific gravity is stable, osmolality varies inconsistently with<br />
temperature, mirroring at warmer temperatures the pattern<br />
exhibited by urine urea. This is to be expected because urea is<br />
a major contributor to urine osmolality. The increase in os-<br />
molality at 93~ reflects the urea stability.<br />
In addition, urine creatinine and specific gravity, like <strong>pH</strong>, are<br />
used for specimen validity testing. A urine specimen is classi-<br />
fied as substituted when the creatinine is < 2 mg/dL and the<br />
specific gravity is ~ 1.0010 or ~ 1.0200 (32). A urine specimen<br />
is considered dilute when the creatinine is ~ 2 mg/dL but < 20<br />
mg/dL and the specific gravity is > 1.0010 but < 1.0030 (32).<br />
This study found that specific gravity is relatively stable when<br />
incubated at temperatures that could be encountered during<br />
transport. The range <strong>of</strong> measured specific gravities was 1.005<br />
to 1.008 with a -20~ control specific gravity result <strong>of</strong> 1.006.<br />
<strong>Urine</strong> creatinine was unstable at higher temperatures and<br />
achieved concentrations < 20 mg/dL (lowest: 16.8 mg/dL) at<br />
93~ At none <strong>of</strong> the investigated temperatures were results for<br />
urine creatinine concentration or specific gravity obtained<br />
that met the reporting criteria <strong>of</strong> a substituted or dilute spec-<br />
imen.<br />
Effect <strong>of</strong> <strong>pH</strong> on stability <strong>of</strong> drugs <strong>of</strong> abuse in urine<br />
Previous studies have examined the stability <strong>of</strong> drugs <strong>of</strong><br />
abuse in urine at various temperatures and/or <strong>pH</strong> values. As a<br />
special project task under SAMHSA contract number 277-<br />
2003-00044, 12 forensic laboratories certified by the National<br />
Laboratory Certification Program analyzed aliquots <strong>of</strong> drug-<br />
free human urine spiked with amphetamine, metham-<br />
phetamine, benzoylecgonine, codeine, morphine,<br />
6-acetylmorphine (6-AM), 11-nor-Ag-tetrahydrocannabinol-9-<br />
carboxylic acid (THCA), and phencyclidine (PCP) to concen-<br />
trations 1.5 to 2 times the initial test cut-<strong>of</strong>f (33). These<br />
aliquots <strong>of</strong> spiked urine were adjusted to <strong>pH</strong> ranges <strong>of</strong> 5-5.5<br />
(acidic control urine), 8-9, 9-9.5, and 9.5-10 (33). The manu-<br />
factured urine specimens were shipped by overnight courier<br />
without cold packs on the day <strong>of</strong> preparation, stored at room<br />
temperature upon receipt by the laboratories, and analyzed<br />
on days I and 3 post-preparation for urine <strong>pH</strong> determined by<br />
<strong>pH</strong> meter and confirmatory drug concentrations by gas chro-<br />
matography-mass spectrometry (33). <strong>Urine</strong> <strong>pH</strong> was stable,<br />
showing little to no change between analysis days 1 and 3 (33).<br />
Amphetamine, methamphetamine, codeine, morphine, and<br />
THCA showed no loss in drug concentration in the basic urines<br />
when compared to the acidic urine control over the three-day<br />
study period (33). Benzoylecgonine, PCP, and 6-AM decreased<br />
significantly in concentration when compared to the acidic<br />
493
urine control. These decreases in drug concentration increased<br />
with increasing urine alkalinity and with increasing time (33).<br />
Thus, within the invalid <strong>pH</strong> range, loss <strong>of</strong> drug analytes has<br />
been confirmed, specifically for benzoylecgonine and 6-AM be-<br />
cause <strong>of</strong> hydrolysis and PCP because <strong>of</strong> decreased solubility<br />
(33).<br />
One study looking at workplace drugs found urine spiked<br />
with drugs, including morphine, codeine, cocaine, and am-<br />
phetamine, and incubated for two weeks either frozen, at room<br />
temperature, or at 37~ still yielded acceptable results for<br />
qualitative testing (34). Bacterial growth was evident in some<br />
<strong>of</strong> the urine aliquots incubated at room temperature and 37~<br />
(34). In addition, some <strong>of</strong> the urine aliquots stored at 37~ be-<br />
came alkaline with time (34). In another study <strong>of</strong> drug stability<br />
in 236 physiological urine specimens stored at -20~ for one<br />
year, THCA, amphetamine, methamphetamine, morphine,<br />
codeine, cocaine, benzoylecgonine, and PCP showed minimal<br />
concentration changes except for an average 37% decrease for<br />
cocaine (35).<br />
In a study examining the stability <strong>of</strong> free and glucuronidated<br />
THCA in authentic urine specimens incubated at -20, 4, 20,<br />
and 40~ the glucuronide was unstable at temperatures<br />
4~ resulting in decreased glucuronide and increased free<br />
THCA concentrations (21). Overall, increased temperatures<br />
ultimately caused a loss in the total THCA concentration (21).<br />
In the same study, the stability <strong>of</strong> free and glucuronidated<br />
THCA at various <strong>pH</strong> values, ranging from 5.0 to 8.0, was in-<br />
vestigated in spiked urine (21). Free THCA is most stable at <strong>pH</strong><br />
5.0, with recovery decreasing with increasing <strong>pH</strong> and time<br />
(21). The glucuronidated metabolite deteriorated to free THCA<br />
at all <strong>pH</strong> values tested, with instability increasing with in-<br />
creasing <strong>pH</strong> and time (21).<br />
Amphetamine in urine exhibited a decreased recovery when<br />
stored at either -20 or 4~ for 10 months but degraded dra-<br />
matically when stored at 25-35~ (36). <strong>Urine</strong> specimens con-<br />
taining amphetamine heated at 60, 70, and 100~ at either <strong>pH</strong><br />
5.1 or 7.6 for 1 h had decreased recoveries for all heating con-<br />
ditions (37).<br />
Free and conjugated morphine were stable in urine at -20<br />
and 4~ for 10 days with decreased recoveries at these tem-<br />
peratures after 10 months (36,38). At 18-22 and 37~ free<br />
and conjugated morphine were stable for 10 days but degraded<br />
dramatically when stored at 25-35~ for 10 months (36,38).<br />
The reported stability <strong>of</strong> 6-AM in urine varied by study. In<br />
urine stored at -20~ reported stability was a minimum <strong>of</strong> two<br />
years (39). In another study, the degradation <strong>of</strong> 6-AM was 7 and<br />
9% after 7 and 14 days, respectively, at -20~ (40). At 4 and<br />
18-22~ urine 6-AM was reported stable for 10 days and a<br />
slight degradation occurred at 37~ (38). Another study found<br />
a 10% loss in urine 6-AM at 20~ after 4 h and a 100% loss after<br />
two weeks (40). 6-AM, when exposed to <strong>pH</strong> 9 conditions, ex-<br />
hibited negligible hydrolysis, but hydrolysis was complete when<br />
highly alkaline conditions were combined with increased tem-<br />
peratures (40).<br />
<strong>Urine</strong> acetylcodeine, stored at either -20 or 4~ at either <strong>pH</strong><br />
4.7 or 8.0, was stable for 23 weeks (41). When stored at room<br />
temperature at <strong>pH</strong> 8.0 for 5 weeks, acetylcodeine completely<br />
hydmlyzed (41). When incubated at <strong>pH</strong> 4.7 at room tempera-<br />
494<br />
<strong>Journal</strong> <strong>of</strong> <strong>Analytical</strong> <strong>Toxicology</strong>, Vol. 31, October 2007<br />
ture, only 58% <strong>of</strong> acetylcodeine was recovered (41).<br />
In another study, drug-free urine was spiked with cocaine<br />
HCl and incubated at 25~ for 72 h at various <strong>pH</strong> values (<strong>pH</strong> 5,<br />
7, 8, and 9) (42). At <strong>pH</strong> values <strong>of</strong> 5 and 7, only 0.6-0.7% <strong>of</strong> the<br />
cocaine hydrolyzed (42). Under alkaline conditions (<strong>pH</strong> 8 and<br />
9), cocaine was unstable, undergoing spontaneous hydrolysis<br />
to benzoylecgonine and to the ecgonine methylester (42). After<br />
72 h, the detected concentrations <strong>of</strong> benzoylecgonine and ec-<br />
gonine methylester at <strong>pH</strong> 8 were 34% and 36%, respectively,<br />
and at <strong>pH</strong> 9 were 43% and 43%, respectively, <strong>of</strong> the initial<br />
amount <strong>of</strong> cocaine added (42). <strong>Urine</strong> specimens containing<br />
benzoylecgonine heated at 60, 70, and 100~ at either <strong>pH</strong> 5.1<br />
or 7.6 for I h had decreased recoveries for at all heating con-<br />
ditions (37).<br />
Conclusions<br />
The results <strong>of</strong> this study have important implications for<br />
workplace urine drug testing. <strong>Urine</strong> <strong>pH</strong> and creatinine con-<br />
centration are used as criteria in specimen validity testing.<br />
Both are unstable at higher temperatures, with urine <strong>pH</strong> in-<br />
creasing and creatinine concentrations decreasing. When the<br />
decreasing urine creatinine concentration was combined with<br />
the stable specific gravity measurements, none <strong>of</strong> the incuba-<br />
tion temperatures produced results that would be classified as<br />
either substituted or dilute. This study demonstrated that in-<br />
creased incubation temperatures could produce urine <strong>pH</strong><br />
values > 9, with <strong>pH</strong> 9.5 being the highest <strong>pH</strong> value attained in<br />
the study. We now more clearly understand that the <strong>pH</strong> <strong>of</strong><br />
urine specimens collected for federal workplace drug testing<br />
programs can potentially be affected by the time and temper-<br />
ature <strong>of</strong> transport and storage prior to analysis at the labora-<br />
tory. <strong>Urine</strong> <strong>pH</strong> > 9 may affect the stability <strong>of</strong> some drugs <strong>of</strong><br />
abuse target analytes and decrease their concentration if pre-<br />
sent in the donor's specimen. It is important to note that none<br />
<strong>of</strong> the conditions examined in this study produced a specimen<br />
with a <strong>pH</strong> > 9.5, thus limiting the impact <strong>of</strong> the <strong>pH</strong> elevation<br />
on concentrations <strong>of</strong> drugs <strong>of</strong> abuse.<br />
The final review <strong>of</strong> laboratory-reported results and discussion<br />
<strong>of</strong> the results with the specimen donor by the MRO are essen-<br />
tial because a laboratory result reported as invalid does not au-<br />
tomatically identify specimen tampering. In the Medical Review<br />
Officer (MRO) Manual for Federal Workplace Drug Testing<br />
Programs effective November 2004 (43), the MRO is instructed<br />
to contact the donor to determine if he or she has an explana-<br />
tion for the invalid result. When the donor has no alternative<br />
medical explanation for the elevated <strong>pH</strong> and the specimen has<br />
a value between 9.0 and 9.5, it is important for the MRO to con-<br />
sider the length <strong>of</strong> time between specimen collection and<br />
testing at the laboratory. Extended transport time and in-<br />
creased seasonal or environmental temperatures may affect<br />
the <strong>pH</strong> <strong>of</strong> that donor's urine specimen. Because urine <strong>pH</strong><br />
values > 9 are achievable with increased temperatures in as<br />
little as two days, specimens classified as invalid should be<br />
considered in the context <strong>of</strong> this study.<br />
This paper is intended to supplement information used by
<strong>Journal</strong> <strong>of</strong> <strong>Analytical</strong> <strong>Toxicology</strong>, Vol. 31, October 2007<br />
MROs in evaluating alternative, non-medical explanations for<br />
federal workplace drug test results reported as invalid.<br />
Acknowledgments<br />
The authors wish to thank Dr. Amy Horneman <strong>of</strong> the Uni-<br />
versity <strong>of</strong> Maryland, Baltimore, for providing the microorgan-<br />
isms used in this study, Dr. Jan Powell <strong>of</strong> the University <strong>of</strong><br />
Maryland, Baltimore, for use <strong>of</strong> her laboratory space, Roger<br />
Frye for providing the reference laboratory <strong>pH</strong> data from Quest<br />
Diagnostics--Baltimore, Dr. Barry Levine for providing the<br />
postmortem <strong>pH</strong> data from the Baltimore, MD, Office <strong>of</strong> the<br />
Chief Medical Examiner, and Dr. Show-Hung Duh <strong>of</strong> the Uni-<br />
versity <strong>of</strong> Maryland Medical Center, Baltimore, MD, for pro-<br />
viding the hospital-based urine <strong>pH</strong> data.<br />
This paper was developed under contract number 280-02-<br />
0102 from the Substance Abuse and Mental Health Services Ad-<br />
ministration (SAMHSA), U.S. Department <strong>of</strong> Health and<br />
Human Services (HHS). The views, policies, and opinions ex-<br />
pressed are those <strong>of</strong> the authors and do not reflect those <strong>of</strong><br />
SAMHSA or HHS.<br />
References<br />
1. http://dwp.samhsa.gov/FedPgms/Pages/Model_Plan/Appendix_B.<br />
aspx, March 2007.<br />
2. http://www.archives.gov/federal-register/codification/executive-<br />
order/12564.html, March 2007.<br />
3. http://www.workplace.samhsa.gov/DrugTesting/Natl LabCertPgm/<br />
INDEX.html, March 2007.<br />
4. Drug testing program, http://www.workplace.samhsa.gov/fed-<br />
programs/MandatoryGuidelines/MG04132004.htm, May 2006.<br />
5. A. Rabinovitch, S.J. Sarewitz, S.M. Woodcock, D.B. Allinger, M.<br />
Azar, D.A. Dynek, M. Rabinovitch, and B.A. Stade. Urinalysis and<br />
Collection, Transportation, and Preservation <strong>of</strong> <strong>Urine</strong> Specimens;<br />
Approved Guideline, 2nd ed. Clinical and Laboratory Standards<br />
Institute, Wayne, PA, GP16-A2. Volume 21, Number 19, pp 4, 7,<br />
18, 21-23.<br />
6. Stockwell Scientific. http://www.stockwellscientific.com, May<br />
2006.<br />
7. Tietz Textbook <strong>of</strong> Clinical Chemistry, 3rd ed., C.A. Burtis and E.R.<br />
Ashwood, Eds. W.B. Saunders Company, Philadelphia, PA, 1999,<br />
p 1828.<br />
8. V.R. Stroot, C.A. Lee, C.A. Barrett. Fluids and Electrolytes. A Prac-<br />
tical Approach, 3rd ed. A. Davis, Philadelphia, PA, 1984, pp<br />
93-97.<br />
9. A. Fura, T.W. Harper, H. Zhang, L. Fung, and W.C. Shyu. Shift in<br />
<strong>pH</strong> <strong>of</strong> biological fluids during storage and processing: effect on<br />
bioanalysis. J. Pharm. Biomed. Anal. 32:513-522 (2003).<br />
10. D.S. Young. Young's Effects Online. http://www.fxol.org/aaccweb,<br />
May 2006.<br />
11. C. Lentner, Ed. Geigy Scientific Tables, 8th ed., Vol. 1, Ciba-<br />
Geigy, West Cadwell, N J, 1981, p 95.<br />
12. Pr<strong>of</strong>essional Practice in Clinical Chemistry: A Companion Text,<br />
D.R. Dufour, Ed. AACC, Washington, DC, 1999, p 26-6.<br />
13. E. Lifshitz and L Kramer. Outpatient urine culture: does collection<br />
technique matter? Arch. Intern. Med. 160:2537-2540 (2000).<br />
14. R.H. Christenson, J.A. Tucker, and E. Allen. Results <strong>of</strong> dipstick<br />
tests, visual inspection, microscopic examination <strong>of</strong> urine sedi-<br />
ment, and microbiological cultures <strong>of</strong> urine compared for sire-<br />
plifying urinalysis. Clin. Chem. 31:448-450 (I 985).<br />
15. G.B. Schumann. Examination <strong>of</strong> urine. In Clinical Chemistry:<br />
Theory, Analysis, and Correlation, L.A. Kaplan and A.J. Pesce, Eds.<br />
C.V. Mosby, St. Louis, MO, 1984, p 1004.<br />
16. A.T. Proudfoot, E.P. Krenzelok, and J.A. Vale. Position paper on<br />
urine alkalinization. J. Toxicol. Clin. Toxicol. 42:1-26 (2004).<br />
17. D.J. Newman and C.P. Price. Renal functions and nitrogen<br />
metabolites. In Tietz Textbook <strong>of</strong> Clinical Chemistry, 3rd ed.,<br />
C.A. Burtis and E.R. Ashwoocl, Eds. W.B. Saunders, Philadelphia,<br />
PA, 1999, pp 1240, 1249, 1262.<br />
18. D.M. Brereton, M.E. Sontrop, and C.G. Fraser. Timing <strong>of</strong> urinal-<br />
ysis reactions when reagent strips are used. Clin. Chem. 24:<br />
1420-1421 (1978).<br />
19. G.F. Grinstead, R.E. Scott, B.S. Stevens, V.L. Ward, and D.M.<br />
Wilson. The Ames Clinitek 200/Multistix 9 urinlysis method com-<br />
pared with manual and microscopic methods. Clin. Chem. 33:<br />
1660--I 662 (I 987).<br />
20. C.G. Fraser, B.C. Smith, and M.J. Peake. Effectiveness <strong>of</strong> an out-<br />
patient urine screening program. Clin. Chem. 23:2215-2218<br />
(1977).<br />
21. G. Skopp and L. P6tsch. An investigation <strong>of</strong> the stability <strong>of</strong> free<br />
and glucuronidated 11-nor-Ag-tetrahydrocannabinol-9-carboxylic<br />
acid in authentic urine samples. J. Anal. Toxicol. 28:35-40<br />
(2004).<br />
22. T. Welbourne, M. Weber, and N. Bank. The effect <strong>of</strong> glutamine<br />
administration on urinary ammonium excretion in normal sub-<br />
jects and patients with renal disease. J. Clin. Invest. 51:<br />
1852-I 860 (I 972).<br />
23. J. Chen and Y. Hsieh. Stabilizing drug molecules in biological<br />
samples. Ther. Drug MoniL 27:617-624 (2005).<br />
24. L.A. Kaplan. Urea. In Clinical Chemistry: Theory, Analysis, and<br />
Correlation, L.A. Kaplan and A.J. Pesce, Eds. C.V. Mosby, St.<br />
Louis, MO, 1984, pp 1257-1260.<br />
25. A.L. Schultz. Uric acid. In Clinical Chemistry: Theory, Analysis,<br />
and Correlation, L.A. Kaplan and A.J. Pesce, Eds. C.V. Mosby, St.<br />
Louis, MO, 1984, pp 1261-1267.<br />
26. M. Meng, M.L. Stoller, and T. Minor. eMedicine-struvite and<br />
staghorn calculi, www.emedicine.com/med/topic2834.htm, July<br />
2006.<br />
27. R.H. Christenson, J.A. Tucker, and E. Allen. Results <strong>of</strong> dipstick<br />
tests, visual inspection, microscopic examination <strong>of</strong> urine sedi-<br />
ment, and microbiological cultures <strong>of</strong> urine compared for sim-<br />
plifying urinalysis. Clin. Chem. 31:448-450 (1985).<br />
28. C. McLaren, J. Null, and J. Quinn. Heat stress from enclosed ve-<br />
hicles: moderate ambient temperatures cause significant temper-<br />
ature rise in enclosed vehicles. Pediatrics 116:109-112 (2005).<br />
29. K. King, K. Negus, and J.C. Vance. Heat stress in motor vehicles:<br />
a problem in infancy. Pediatrics 68:579-582 (1981).<br />
30. J.S. Surpure. Heat-related illness and the automobile. Ann. Emerg.<br />
Med. 11:263-265 (1982).<br />
31. R. Vartabedian. Trying to save kids in hot cars. Los Angeles limes,<br />
June 28, 2006.<br />
32. http://dwp.samhsa.gov/DrugTesti ng/Files_Drug_Testi ng/Labs/<br />
Specimen%20Validity%20Testing%20-%20February%<br />
202005.pdf, February 2007.<br />
33. F.M. Esposito, J.M. Mitchell, M.R. Baylor, and D.M. Bush. Influ-<br />
ence <strong>of</strong> basic <strong>pH</strong> on federal regulated drugs in urine at room tem-<br />
perature. Presented as a poster at the SOFT 2006 Annual Meeting,<br />
Austin, TX, October 2-7, 2006.<br />
34. C.S. Frings and C.A. Queen. Stability <strong>of</strong> certain drugs <strong>of</strong> abuse in<br />
urine specimens. Clin. Chem. 18:1442 (1972).<br />
35. S. Dugan, S. Bogema, R.W. Schwartz, and N.T. Lappas. Stability<br />
<strong>of</strong> drugs <strong>of</strong> abuse in urine samples stored at -20~ J. Anal. Tox-<br />
icoL 18:391-396 (1994).<br />
36. W.S. Wu and J.L. Tsai. Investigation <strong>of</strong> the stability <strong>of</strong> drugs <strong>of</strong><br />
abuse in urine sample by capillary zone electrophoresis. Chin.<br />
Pharm. J. (Taiwan) 49:239-248 (1997).<br />
37. K. Wolff, M.A. Shanab, M.J. Sanderson, and A.W. Hay. Screening<br />
for drugs <strong>of</strong> abuse: effect <strong>of</strong> heat-treating urine for safe handling<br />
495
<strong>of</strong> samples. Clin. Chem. 36:908-910 (1990).<br />
38. F. Moriya and Y. Hashimoto. Distribution <strong>of</strong> free and conjugated<br />
morphine in body fluids and tissues in a fatal heroin overdose: is<br />
conjugated morphine stable in postmortem urine? J. Forensic Sci.<br />
42:736-740 (1997).<br />
39. D.C. Fuller. A statistical approach to the prediction <strong>of</strong> verifiable<br />
heroin use from total codeine and total morphine concentrations<br />
in urine. J. Forensic 5ci. 42:685-689 (1997).<br />
40. D.A. Barrett, P.N. Shaw, and S.S. Davis. Determination <strong>of</strong> mor-<br />
phine and 6-acetylmorphine in plasma by high-performance<br />
496<br />
<strong>Journal</strong> <strong>of</strong> <strong>Analytical</strong> <strong>Toxicology</strong>, Vol. 31, October 2007<br />
liquid chromatography. J. Chromatogr. 556:135-138 (1991 ).<br />
41. C.L. O'Neal and A. Poklis. Simultaneous determination <strong>of</strong> acetyl-<br />
codeine, monoacetylmorphine, and other opiates in urine by<br />
GC-MS. J. Anal. Toxicol. 21: 427-432 (1997).<br />
42. K.L. Klette, G.K. Poch, R. Czarny, and C.O. Lau. Simultaneous<br />
GC-MS analysis <strong>of</strong> meta- and para-hydroxybenzoylecgonine and<br />
norbenzoylecogonine: a secondary method to corroborate co-<br />
caime ingestion using nonhydrolytic metabolites. J. Anal. Toxicol.<br />
24:482-488 (2000).<br />
43. http://dwp.samhsa.gov/DrugTesting/DTesting.aspx, March 2007.