

European Journal of Scientific Research - EuroJournals
European Journal of Scientific Research - EuroJournals
European Journal of Scientific Research - EuroJournals

You also want an ePaper? Increase the reach of your titles
YUMPU automatically turns print PDFs into web optimized ePapers that Google loves.
430 Nooritawati Md Tahir, Aini Hussain, Salina Abdul Samad,<br />
Hafizah Husain and Mohd Yus<strong>of</strong> Jamaluddin<br />
KG rule that suggested retaining all eigenvalues > 1 results in thirty-five PCs to be considered as<br />
significant components. The PCs are as tabulated in Table 1.<br />
Table 1: The significant eigenvalues or PCs using the KG rule.<br />
Factor k 1 2 3 4 5<br />
Eigenvalue 44.37 23.64 17.48 12.25 10.32<br />
Factor k 6 7 8 9 10<br />
Eigenvalue 9.37 5.77 5.64 5.21 3.89<br />
Factor k 11 12 13 14 15<br />
Eigenvalue 3.79 3.17 3.07 2.9 2.64<br />
Factor k 16 17 18 19 20<br />
Eigenvalue 2.6 2.48 2.39 2.19 2.02<br />
Factor k 21 22 23 24 25<br />
Eigenvalue 1.97 1.77 1.71 1.67 1.63<br />
Factor k 26 27 28 29 30<br />
Eigenvalue 1.57 1.42 1.35 1.28 1.26<br />
Factor k 31 32 33 34 35<br />
Eigenvalue 1.2 1.14 1.11 1.06 1.01<br />
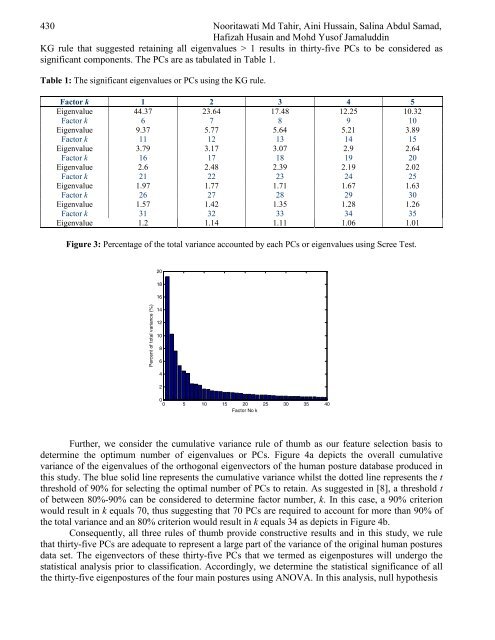
Figure 3: Percentage <strong>of</strong> the total variance accounted by each PCs or eigenvalues using Scree Test.<br />
Percent <strong>of</strong> total variance (%)<br />
20<br />
18<br />
16<br />
14<br />
12<br />
10<br />
8<br />
6<br />
4<br />
2<br />
0<br />
0 5 10 15 20<br />
Factor No k<br />
25 30 35 40<br />
Further, we consider the cumulative variance rule <strong>of</strong> thumb as our feature selection basis to<br />
determine the optimum number <strong>of</strong> eigenvalues or PCs. Figure 4a depicts the overall cumulative<br />
variance <strong>of</strong> the eigenvalues <strong>of</strong> the orthogonal eigenvectors <strong>of</strong> the human posture database produced in<br />
this study. The blue solid line represents the cumulative variance whilst the dotted line represents the t<br />
threshold <strong>of</strong> 90% for selecting the optimal number <strong>of</strong> PCs to retain. As suggested in [8], a threshold t<br />
<strong>of</strong> between 80%-90% can be considered to determine factor number, k. In this case, a 90% criterion<br />
would result in k equals 70, thus suggesting that 70 PCs are required to account for more than 90% <strong>of</strong><br />
the total variance and an 80% criterion would result in k equals 34 as depicts in Figure 4b.<br />
Consequently, all three rules <strong>of</strong> thumb provide constructive results and in this study, we rule<br />
that thirty-five PCs are adequate to represent a large part <strong>of</strong> the variance <strong>of</strong> the original human postures<br />
data set. The eigenvectors <strong>of</strong> these thirty-five PCs that we termed as eigenpostures will undergo the<br />
statistical analysis prior to classification. Accordingly, we determine the statistical significance <strong>of</strong> all<br />
the thirty-five eigenpostures <strong>of</strong> the four main postures using ANOVA. In this analysis, null hypothesis


